Embed Size (px)
Citation preview

The Effects of Individual-level Culture and
Demographic Characteristics on E-learning
Acceptance in Lebanon and England: A
Structural Equation Modeling Approach
A thesis submitted for the degree of Doctor of Philosophy
By
Ali Tarhini
Department of Information Systems and Computing,
Brunel University
July 2013

i
ABSTRACT
Due to the rapid growth of Internet technology, universities and higher
educational institutions around the world are investing heavily in web-based
learning systems to support their traditional teaching and to improve their
students’ learning experience and performance. However, the success of an e-
learning system depends on the understanding of certain antecedent factors that
influence the students’ acceptance and usage of such e-learning systems. Previous
research indicates that technology acceptance models and theories may not be
applicable to all cultures as most of them have been developed in the context of
developed countries and particularly in the U.S. So far little research has
investigated the important role that social, cultural, organizational and individual
factors may play in the use and adoption of the e-learning systems in the context
of developing countries and more specifically there is almost absence of this type
of research in Lebanon.
This study aims to fill this gap by developing and testing an amalgamated
conceptual framework based on Technology Acceptance Model (TAM) and other
models from social psychology, such as Unified Theory of Acceptance and Use of
Technology (UTAUT) and TAM2 that captures the salient factors influencing the
user adoption and acceptance of web-based learning systems. This framework has
been applied to the study of higher educational institutions in the context of
developing as well as developed countries (e.g. Lebanon and UK). Additionally,
the framework investigates the moderating effect of Hofstede’s four cultural
dimensions at the individual level and a set of individual differences on the key
determinants that affect the behavioural intention to use e-learning.
A total of 1197 questionnaires were received from students who were using web-
based learning systems at higher educational institutions in Lebanon and the UK
with opposite scores on cultural dimensions. Confirmatory Factor Analysis (CFA)
was used to perform reliability and validity checks, and Structural Equation
Modeling (SEM) in conjunction with multi-group analysis method was used to
test the hypothesized conceptual model.

ii
As hypothesized, the findings of this study revealed that perceived usefulness
(PU), perceived ease of use (PEOU), subjective norms (SN), perceived quality of
work Life (QWL), self-efficacy (SE) and facilitating conditions (FC) to be
significant determinants of behavioural intentions and usage of e-learning system
for the Lebanese and British students. QWL; the newly added variable; was found
the most important factor in explaining the causal process in the model for both
samples. Our findings proved that there are differences between Lebanese and
British students in terms of PEOU, SE, SN, QWL, FC and AU; however no
differences were detected in terms of PU and BI. The results of the MGA show
that cultural dimensions as well as demographic factors had a partially moderated
effect on user acceptance of e-learning. Overall, the proposed model achieves
acceptable fit and explains for 68% of the British sample and 57% of the
Lebanese sample of its variance which is higher than that of the original TAM.
Our findings suggest that individual, social, cultural and organisational factors are
important to consider in explaining students’ behavioural intention and usage of e-
learning environments. The findings of this research contribute to the literature by
validating and supporting the applicability of our extended TAM in the Lebanese
and British contexts and provide several prominent implications to both theory
and practice on the individual, organizational and societal levels.

iii
DEDICATION
This doctoral research effort would not have been completed without the only
Grace of Al-Mighty Allah (swt), is dedicated to the memory of my beloved father
Hussein Ahmad Tarhini (May your soul rest in heaven) who inoculated me in
discipline, perseverance and strength that forever will be part of my life.
This research is also dedicated to my lovely mum, my five fabulous sisters, my
precious nephews and nieces, and my parents-in-laws who always believed in me
and to whom I am greatly indebted. Without your support and constant
encouragement this would not have been possible.
I am particularly indebted to my beautiful wife who makes my life happy and
complete. Takwa, you are my source of inspiration, I thank you for always
reminding me of what life is always about. I owe you so much, I promise to make
up the long time we spent away from each other. My work is finally finished and
thanks to Alla (swt) it’s time to be together forever.
Thank you all for giving me your moral support and unconditional love; you were
my motivation and constant inspiration during all the process of my PhD and in
my most difficult times. I really appreciate you, even though the value of my
appreciation cannot compare with everything you have done for me. Finally, I
made it.

iv
ACKNOWLEDGEMENTS
In the name of God, the Most Gracious, the Most Merciful. All praise be to Allah,
the Creator and Master of the Universe.
The completion of this research has been assisted by a generous help of many
people of whom I owe a great deal of thanks and appreciation.
First and foremost, my sincere gratitude and deepest thanks go to my supervisor
professor Xiaohui Liu for his patience, sage advice, invaluable guidance, and
continuous support and encouragement at every stage of this dissertation. It is a
complete pleasure to work under your auspicious supervision. Thank you for
always being there for me at time of need.
Equally, I wish to express my appreciation to my second supervisor Dr. Kate
Hone for her constructive feedback, generous time, kind support, and invaluable
advice through this research and the publications associated with it. Thank you
Kate for making my learning experience became less stressful and even more
fascinating!!
My heartfelt thanks and greatest gratitude go to Mahir Arzoky who spent his
valuable time proofreading the thesis. Great thanks go also to Ms Ela Heaney
(PhD Administrator) for her effective administrative assistance, for which I am
especially thankful.
I also wish to express my appreciation to my colleagues, for interesting
discussions and for keeping the office fun and exciting to work in: Valaria, Neda,
Fadra, Cici, Mohsina, Djibril, Stefio, Liang and Miqing.
I am sincerely thankful to my friends and housemates. Their company and
friendship have made the last four years a memorable period of my life. A special
mention goes to Hadi, Bassel, Ghaytih, Bachar, Mahir, Salah, Saeed AbouTrab,
Ghorbani, Mike, Chido and Nalin.
Last but not the least; I am indebted to the ‘Altajir Trust’ for funding my PhD.

v
DECLARATION
The following papers have been published (or submitted for publication) as a
direct result of the research discussed in this thesis:
Tarhini, A., Hone, K., and Liu, X. (2013), User Acceptance Towards Web-based
Learning Systems: Investigating the role of Social, Organizational and Individual
factors in European Higher Education. Procedia Computer Science 17, 189-197
Tarhini, A., Hone, K., and Liu, X. (2013), “Factors Affecting Students’
Acceptance of E-learning Environments in Developing Countries: A Structural
Equation Modelling Approach”, Proceedings of the 6th International Business and
Social Sciences Research Conference, Dubai, UAE, 03-04 January 2013
Tarhini, A., Hone, K., and Liu, X. (2013), Factors Affecting Students’
Acceptance of E-learning Environments in Developing Countries: A Structural
Equation Modelling Approach, (Revised version of the Proceedings of 6th
International Business and Social Sciences Research Conference), International
Journal of Information and Education Technology Vol 13. no. 1, pp. 54-2013
Tarhini, A., Hone, K., and Liu, X. (2013), Extending TAM to Empirically
Investigate the Students’ Behavioural Intention to Use E-Learning in Developing
Countries, Science and Information Conference (IEEE), United Kingdom, 07-09
Oct 2013
Tarhini, A., Hone, K., and Liu, X. (2013), The Effects of Individual-level Culture
on E-learning Acceptance, European Journal of Information Systems (under
review)
Tarhini, A., Hone, K., and Liu, X. (2013), A cross-cultural examination of the
impact of social, organizational and individual factors on Technology Acceptance
between British and Lebanese university students, British Journal of Educational
Technology (under review)

vi
Tarhini, A., Hone, K., and Liu, X. (2013), The Effects of Individual Differences
on e-learning users’ behaviour in Developing Countries: A Structural Equation
Model, Computers & Education (under review)
Tarhini, A., Hone, K., and Liu, X. (2013), Measuring the moderating effect of
gender and age on e-learning acceptance in England: A structural Equation
Modelling Approach of an extended Technology Acceptance Model, Australasian
Journal of Educational Technology (under review)
Papers Presented (Not Published)
Tarhini, A., Liu, X. “Understanding the Behaviour of Students and Lecturers in
web-based learning environments”, Doctoral Consortium, May, British Computer
Society (BCS), London, (2009)
Tarhini, A., Liu, X. “E-learning as innovation: The change of the face of
Education!!”, 1st NewRoute PhD Conference, Brunei Gallery London, (2009)
“Is e-Learning simply a technological solution or a process of Social, Behavioural,
Individual and Cultural factors?”, 3rd NewRoute PhD Conference, Brunei Gallery
London, (2011)
Posters:
Tarhini, A., Liu, X. (2011, March). “To what extent How Cultural Differences
Affects Learners’ perceptions Towards Using E-learning Tools at the UK
universities?” Poster presented at the Research Student Poster Conference, Brunel
University, UK

vii
ABBREVIATIONS
AGFI Adjusted Goodness-of-Fit Index
AMOS Analysis of Moment Structures
AVE Average Variance Extracted
ASV Average Shared Squared Variance
AU Actual usage
BI Behavioural intention
CFA Confirmatory Factor Analysis
CFI Comparative Fit Index
CMS Course management System
CR Composite reliability
Df Degree of Freedom
DTPB Decomposed Theory of Planned Behaviour
D² Mahalanobis Distance
EFA Exploratory Factor Analysis
e-learning electronic learning
FC Facilitating conditions
GFI Goodness-of-Fit Index
HEIs Higher Education Institutions
HCI Human Computer Interaction
ICT Information and Communication Technology
IDT Innovations Diffusion Theory
IFI Incremental Fit Index
IS Information Systems
IC Individualism/collectivism
IT Information Technology
KMO Kaiser-Mayer-Olkin
LMSs Learning management system
MI Modification Index
MF Masculinity/femininity
MSV Maximum Shared Squared Varianec
NNFI Non-Normed Fit Index
NFI Normed Fit Index
PBC Perceived Behaviour Control
PLS Partial least squares
PEOU Perceived ease of use
PD Power distance
PU Perceived usefulness
R2 Coefficient of Determination
RMSEA Root Mean Square Error of Approximation
QWL Quality of work life
SN Subjective norm
SD Standard Deviation
SE Self-efficacy
SEM Structure Equation Modeling

viii
SRMR Standard Root Mean Square Residual
SCT Social Cognitive Theory
SMC Squared Multiple Correlations
SPSS Statistical Package for Social Science
TAM Technology Acceptance Model
TPB Theory of Planned Behaviour
TRA Theory of Reasoned Action
TLI Tucker-Lewis Index
UK United Kingdom
UTAUT Unified Theory of Acceptance and Use of Technology
UA Uncertainty avoidance
VIF Variance Inflation Factor
WebCT Web Course Tools
WWW World Wide Web
X2 Chi Square
X2/df Normed Chi-Square

ix
TABLE OF CONTENTS
Chapter 1: Introduction ....................................................................................... 1 1.1 INTRODUCTION......................................................................................... 1 1.2 THEORETICAL BACKGROUND AND RESEARCH PROBLEM ......................... 1 1.3 RESEARCH AIMS AND OBJECTIVES ........................................................... 6 1.4 RESEARCH SCOPE..................................................................................... 8 1.5 SIGNIFICANCE OF THE STUDY ................................................................... 9
1.6 CONTRIBUTIONS OF THE STUDY ............................................................. 10 1.7 RESEARCH DESIGN AND METHODOLOGY ............................................... 12 1.8 CONTEXT OF THE RESEARCH .................................................................. 14
1.9 DISSERTATION OUTLINE ........................................................................ 15 1.10 SUMMARY .............................................................................................. 17
Chapter 2: E-learning, Technology Acceptance & Cultural Models ............. 18 2.1 INTRODUCTION....................................................................................... 18 2.2 E-LEARNING ........................................................................................... 18
2.2.1 Advantages of Web-based learning ...................................................... 19 2.2.2 Disadvantages of Web-based learning................................................. 20 2.2.3 Factors Affecting E-learning Acceptance ............................................ 21
2.3 TECHNOLOGY ACCEPTANCE THEORIES AND MODELS ............................ 21
2.3.1 Diffusion of Innovation Theory (DOI) ................................................. 22 2.3.2 Social Cognitive Theory (SCT) ............................................................ 24
2.3.3 Theory of Reasoned Action (TRA)........................................................ 24
2.3.4 Theory of Planned Behaviour (TPB).................................................... 26
2.3.5 Decomposed Theory of Planned Behaviour (DTPB) ........................... 28 2.3.6 Technology Acceptance Model (TAM) ................................................. 30
2.3.7 Revised Technology Acceptance Model (TAM2) ................................. 33 2.3.8 Augmented version of TAM (A-TAM) .................................................. 35 2.3.9 Unified Theory of Acceptance and Use of Technology (UTAUT)........ 36
2.3.10 Comparison of Models ....................................................................... 38
2.3.10.1 TAM and TRA………………………………….……....... ....37
2.3.10.2 TAM, TPB and DTPB………………………..………… ….38
2.3.10.3 UTAUT and other models …………….……………. .. 39
2.4 CULTURE ................................................................................................ 40 2.4.1 Definition of Culture ............................................................................ 40 2.4.2 Cultural Models ................................................................................... 41
2.4.3 Schwartz’s Cultural Model .................................................................. 41 2.4.4 Hall’s Cultural Model .......................................................................... 42 2.4.5 Hofstede’s cultural model .................................................................... 43 2.4.6 Cultural dimensions at the Country vs. Individual level ...................... 46
2.5 SUMMARY .............................................................................................. 47
Chapter 3: Theoretical basis and Conceptual Framework ............................. 49 3.1 INTRODUCTION....................................................................................... 49 3.2 THEORETICAL FRAMEWORK ................................................................... 50 3.3 DIRECT DETERMINANTS ......................................................................... 52
3.3.1 Perceived Ease of Use (PEOU) ........................................................... 52 3.3.2 Perceived Usefulness (PU) .................................................................. 53 3.3.3 Subjective Norm (SN) ........................................................................... 54

x
3.3.4 Quality of Work Life (QWL) ................................................................. 56 3.3.5 E-learning Self-Efficacy (SE) ............................................................... 58
3.3.6 Facilitating Conditions (FC)................................................................ 59 3.3.7 Behavioural Intention (BI) ................................................................... 60
3.4 HOFSTEDE’S CULTURAL DIMENSIONS .................................................... 61 3.4.1 Power Distance (PD) ........................................................................... 62 3.4.2 Masculinity/Femininity (MF) ............................................................... 64
3.4.3 Individualism/Collectivism (IC) ........................................................... 67 3.4.4 Uncertainty Avoidance (UA) ................................................................ 70
3.5 INDIVIDUAL CHARACTERISTICS ............................................................. 72 3.5.1 Gender .................................................................................................. 73 3.5.2 Age........................................................................................................ 75
3.5.3 Educational level .................................................................................. 76 3.5.4 Experience ............................................................................................ 78
3.6 CONCLUSION .......................................................................................... 80
Chapter 4: Research Design & Methodology ................................................... 82 4.1 INTRODUCTION....................................................................................... 82 4.2 UNDERLYING RESEARCH ASSUMPTIONS ................................................. 83
4.3 CHOOSING THE POSITIVISM PARADIGM FOR OUR RESEARCH ................. 85 4.4 STRATEGY OF INQUIRY: QUANTITATIVE AND QUALITATIVE .................. 86
4.5 SURVEY RESEARCH APPROACH ............................................................. 89 4.6 RESEARCH DESIGN ................................................................................. 91 4.7 POPULATION AND SAMPLING ................................................................. 93
4.7.1 The Sampling choice ............................................................................ 94
4.7.2 The justifications behind using Convenience sampling in this research
....................................................................................................................... 98 4.7.3 Population ............................................................................................ 99
4.7.4 Sample Size ........................................................................................ 101 4.7.5 Execution of the sampling process ..................................................... 102 4.7.6 Non-response bias .............................................................................. 102
4.8 DATA COLLECTION DEVELOPMENT ...................................................... 103
4.8.1 Questionnaire Design and Development ........................................... 103 4.8.2 Methods to Achieve High Rates of Response ..................................... 107 4.8.3 Pre-testing the questionnaire ............................................................. 108
4.9 INSTRUMENT SCALE MEASUREMENT .................................................... 109 4.10 PILOT STUDY RESULTS ........................................................................ 110
4.11 DATA ANALYSIS .................................................................................. 111 4.11.1 Structural Equation Modelling (SEM) ............................................. 111
4.12 ETHICAL CONSIDERATIONS .................................................................. 115 4.13 CONCLUSION ........................................................................................ 115
Chapter 5: Preliminary Data Analysis ............................................................ 117 5.1 INTRODUCTION..................................................................................... 117 5.2 PILOT STUDY RESULTS ........................................................................ 118
5.3 PRELIMINARY EXAMINATION OF THE MAIN STUDY .............................. 121 5.3.1 Data screening ................................................................................... 122 5.3.2 Missing Data ...................................................................................... 122 5.3.3 Outliers ............................................................................................... 123 5.3.4 Testing the Normality Assumption ..................................................... 124

xi
5.3.5 Homogeneity of Variance in the Dataset ........................................... 125 5.3.6 Multicollinearity ................................................................................. 125
5.4 RELIABILITY ........................................................................................ 126 5.5 PROFILE OF RESPONDENTS ................................................................... 127 5.6 DESCRIPTIVE STATISTICS OF CONSTRUCT ITEMS ................................... 130
5.6.1 Perceived ease of use (PEOU) ........................................................... 130 5.6.2 Perceived Usefulness (PU) ................................................................ 131
5.6.3 Subjective Norm (SN) ......................................................................... 132 5.6.4 Quality of work life (QWL) ................................................................ 132 5.6.5 Computer Self-Efficacy (SE) .............................................................. 133 5.6.6 Facilitating Condition (FC) ............................................................... 133 5.6.7 Behavioural Intention (BI) ................................................................. 134
5.6.8 Actual Usage (AU) ............................................................................. 135 5.7 CULTURE VARIABLES ........................................................................... 135
5.7.1 Power Distance (PD) ......................................................................... 136 5.7.2 Masculinity/Femininity (MF) ............................................................. 136 5.7.3 Individualism/Collectivism (IC) ......................................................... 137 5.7.4 Uncertainty avoidance (UA) .............................................................. 138
5.8 CROSS-CULTURAL DIFFERENCES BETWEEN THE TWO SAMPLES ........... 138 5.9 THE TASKS THE STUDENTS PERFORM USING THE WEB-BASED LEARNING
SYSTEM ............................................................................................................ 141 5.10 SUMMARY AND CONCLUSIONS ............................................................. 144
Chapter 6: Model Testing ................................................................................. 148 6.1 INTRODUCTION..................................................................................... 148
6.2 ANALYSIS OF MEASUREMENT MODEL ................................................... 149
6.2.1 Goodness of fit indices ....................................................................... 150 6.2.2 Construct Validity and reliability....................................................... 154
6.3 ANALYSIS OF THE STRUCTURAL MODEL AND HYPOTHESES TESTING ... 159 6.3.1 Testing the Structural Model for the British sample .......................... 159 6.3.2 Testing the Structural Model for the Lebanese sample ...................... 162
6.4 MODERATING EFFECTS ......................................................................... 166
6.5 MODERATING EFFECTS WITHIN THE BRITISH DATASET ........................ 167 6.5.1 Hofstede’s Cultural Dimensions ........................................................ 167
6.5.1.1 Power Distance………………………………………....... ...167
6.5.1.2 Masculinity\Femininity………………………………..........169
6.5.1.3 Individualism\Collectivism…………………….……….......171
6.5.1.4 Uncertainty Avoidance………………………………..........173
6.5.2 Demographic Characteristics of British sample ................................ 175
6.5.1.1 Gender…………………………….…………......................175
6.5.1.2 Age………………………………..……………..……............177
6.5.1.3 Educational level……………….……………….……..........179
6.5.1.4 Experience……………………………….……………..........181
6.6 MODERATING EFFECTS WITHIN THE LEBANESE SAMPLE ...................... 183
6.6.1 Hofstede’s Cultural Dimensions Lebanese sample ............................ 183
6.6.1.1 Power Distance………………………………………...........183
6.6.1.2 Masculinity\Femininity………………………………..........185
6.6.1.3 Individualism\Collectivism……………………………........187
6.6.1.4 Uncertainty Avoidance………………………………..........188

xii
6.6.2 Demographic Characteristics of Lebanese sample............................ 190
6.6.1.1 Gender………………………………………........................190
6.6.1.2 Age……………………………………………..……..............192
6.6.1.3 Educational level……………………………….……...........194
6.6.1.4 Experience……………………………….…………..............196
6.7 SUMMARY AND CONCLUSIONS ............................................................. 198
Chapter 7: Discussion ....................................................................................... 202 7.1 INTRODUCTION..................................................................................... 202 7.2 VALIDATION OF EXTENDED TAM ACROSS CULTURAL SETTINGS (THE
IMPACT OF DIRECT DETERMINANTS) ................................................................. 203 7.2.1 Behavioural beliefs and Behavioural Intention ................................. 205
7.2.1.1 Perceived ease of use and Behavioural Intention...........205
7.2.1.2 Perceived usefulness and Behavioural Intention……......206
7.7.1.3 Perceived ease of use and Perceived useful……............ 207
7.2.2 Subjective Norm ................................................................................. 208 7.2.3 Quality of work life and Behavioural Intention ................................. 209 7.2.4 Facilitating Technology and Actual Usage ....................................... 210 7.2.5 Self-efficacy and usage behaviour ..................................................... 210
7.2.6 Behavioural Intention and Actual Usage ........................................... 211 7.3 DISCUSSION RELATED TO THE EFFECT OF MODERATORS ..................... 212
7.3.1 Discussion related to cultural variables ............................................ 212
7.3.1.1 Power Distance (PD)…… ….………………………….......212
7.3.1.2Masculinity\Femininity (MF……………………………......216
7.3.1.3Individualism\Collectivism (IC)…………………………....219
7.3.1.4Uncertainty Avoidance (UA)…………………….……….....223
7.3.2 Discussion Related to the Demographic variables ............................ 227
7.3.2.1 Gender……………………………………….......................227
7.3.2.2 Age……………………………………………..…….............230
7.3.2.3 Educational level………………………………..………......234
7.3.2.4 Experience……………………………….……….…….........237
7.4 DISCUSSION RELATED TO THE CROSS CULTURAL DIFFERENCES BETWEEN
LEBANON AND ENGLAND ................................................................................. 240 7.4.1 National culture differences ............................................................... 240 7.4.2 Differences on E-learning Acceptance .............................................. 241 7.4.3 The Differences in the tasks the students perform using the web-based
learning system ........................................................................................... 243
7.5 CONCLUSION ........................................................................................ 244
Chapter 8: Conclusion and Further Research ............................................... 245 8.1 INTRODUCTION..................................................................................... 245 8.2 RESEARCH OVERVIEW ......................................................................... 245 8.3 CONTRIBUTION OF THE RESEARCH ....................................................... 249
8.3.1 Contribution to Theory ....................................................................... 249 8.3.2 Implication to Practice ....................................................................... 253
8.3.3 Contribution to Research Methodology ............................................. 257 8.4 RESEARCH LIMITATIONS ...................................................................... 258 8.5 FUTURE RESEARCH DIRECTIONS ........................................................... 260 8.6 PERSONAL REFLECTION ....................................................................... 262
References .......................................................................................................... 263

xiii
Appendix A ............................................................................................................. I
Appendix B .......................................................................................................... VI Appendix C ........................................................................................................ VII Appendix D .......................................................................................................... XI Appendix E ......................................................................................................... XV Appendix F ..................................................................................................... XVIII
Appendix G ................................................................................................. XXVIII Appendix H ................................................................................................... XXXII

xiv
LIST OF TABLES
Table 1-1: Cultural differences between England and Lebanon on Hofstede’s
cultural dimensions ............................................................................................... 14
Table 4-1: Qualitative versus Quantitative research ............................................. 88
Table 4-2: A Classification of Sampling Technique ............................................. 94
Table 4-3: Advantages and disadvantages of the sampling methods .................... 97
Table 5-1: Cronbach’s Alpha, Inter-item correlation for the pilot study ............ 120
Table 5-2: Grouping Variable: Gender ............................................................... 121
Table 5-3: Test of Homogeneity of Variances .................................................... 125
Table 5-4: Cronbach’s Alpha, Inter-item correlation for both samples .............. 127
Table 5-5: Frequency and percentage of respondents ......................................... 128
Table 5-6: Frequency and percentage of respondents in terms of their gender .. 128
Table 5-7: frequency and percentage of respondents’ Age group ...................... 128
Table 5-8: Frequency and percentage of respondents’ educational level ........... 128
Table 5-9: Frequency and percentage of respondents’ web experience ........... 1299
Table 5-10: Frequency and percentage of respondents’ computer experience ... 129
Table 5-11: Frequency and percentage for number of courses delivered using web-
based learning system ......................................................................................... 130
Table 5-12: Descriptive statistics of PEOU construct......................................... 131
Table 5-13: Descriptive statistics of PU construct .............................................. 131
Table 5-14: Descriptive statistics of SN construct .............................................. 132
Table 5-15: Descriptive statistics of QWL construct .......................................... 133
Table 5-16: Descriptive statistics of SE construct .............................................. 133
Table 5-17: Descriptive statistics of FC construct .............................................. 134
Table 5-18: Descriptive statistics of BI construct ............................................... 134
Table 5-19: Descriptive statistics of AU construct ............................................. 135
Table 5-20: Descriptive statistics of PD construct .............................................. 136
Table 5-21: Descriptive statistics of MF construct ............................................. 137
Table 5-22: Descriptive statistics of IC construct ............................................... 137
Table 5-23: Descriptive statistics of UA construct ............................................. 138
Table 5-24: T-test for all Constructs ................................................................... 139
Table 5-25: British sample actual usage of the system ....................................... 142

xv
Table 5-26: Lebanese sample actual usage of the system ................................... 143
Table 5-27: t-test for the tasks performed using web-based learning system ..... 143
Table 5-28: Summary of results related to the difference in Means for the main
predictors hypotheses .......................................................................................... 146
Table 5-29: Summary of Results related to the difference in Means for the
Cultural dimensions hypotheses .......................................................................... 147
Table 6-1: Model fit summary for the Measurement Model............................... 151
Table 6-2: British sample selected text output .................................................... 152
Table 6-3: Lebanese sample selected text output ................................................ 153
Table 6-4: England and Lebanon final measurement model fit .......................... 153
Table 6-5: Construct reliability, convergent & discriminant validity for the British
sample ................................................................................................................. 156
Table 6-6: Construct reliability, convergent & discriminant validity for the
Lebanese sample ................................................................................................. 156
Table 6-7: The summary of results for the Direct Hypotheses for the British
sample ................................................................................................................. 161
Table 6-8: The summary of Direct, Indirect, and Total Effects in predicting actual
usage for the British sample ................................................................................ 162
Table 6-9: The summary of results for the Direct Hypothesized relationships for
the Lebanese sample ........................................................................................... 164
Table 6-10: Direct, Indirect, and Total Effects in predicting actual usage for the
Lebanese sample ................................................................................................. 165
Table 6-11: Construct reliability, convergent & discriminant validity for PD ... 168
Table 6-12: The summary of the moderating effect of power distance .............. 169
Table 6-13: Construct reliability, convergent & discriminant validity for MF... 170
Table 6-14: The summary of the moderating effect of masculinity\femininity .. 171
Table 6-15: Construct reliability, convergent & discriminant validity for IC .... 172
Table 6-16: The summary of the moderating effect of individualism/collectivism
............................................................................................................................. 173
Table 6-17: Construct reliability, convergent & discriminant validity for UA... 174
Table 6-18: The summary of the moderating effect of Uncertainty Avoidance . 175

xvi
Table 6-19: Construct reliability, convergent & discriminant validity for gender
............................................................................................................................. 176
Table 6-20: The summary of the moderating effect of Gender .......................... 177
Table 6-21: Construct reliability, convergent & discriminant validity for Age .. 178
Table 6-22: The summary of the moderating effect of Age................................ 179
Table 6-23: Construct reliability, convergent & discriminant validity for
educational level.................................................................................................. 180
Table 6-24: The summary of the moderating effect of educational level ........... 181
Table 6-25: Construct reliability, convergent & discriminant validity for
experience…… ................................................................................................... 182
Table 6-26: The summary of the moderating effect of experience ..................... 183
Table 6-27: Construct reliability, convergent & discriminant validity for PD .. 184
Table 6-28: The summary of the moderating effect of power distance .............. 185
Table 6-29: Construct reliability, convergent & discriminant validity for MF... 186
Table 6-30: The summary of the moderating effect of masculinity\femininity .. 186
Table 6-31: Construct reliability, convergent & discriminant validity for IC .... 187
Table 6-32: The summary of the moderating effect of individualism\collectivism
............................................................................................................................. 188
Table 6-33: Construct reliability, convergent & discriminant validity for UA... 189
Table 6-34: The summary of the moderating effect of Uncertainty Avoidance . 190
Table 6-35: Construct reliability, convergent & discriminant validity for gender
............................................................................................................................. 191
Table 6-36: The summary of the moderating effect of gender ........................... 192
Table 6-37: Construct reliability, convergent & discriminant validity for age ... 193
Table 6-38: The summary of the moderating effect of age ................................. 194
Table 6-39: Construct reliability, convergent & discriminant validity for education
level… ................................................................................................................. 195
Table 6-40: The summary of the moderating effect of educational level ........... 196
Table 6-41: Construct reliability, convergent & discriminant validity for
experience……. .................................................................................................. 197
Table 6-42: The summary of the moderating effect of experience ..................... 198
Table 6-43: Summary of results related to the direct hypotheses ....................... 199

xvii
Table 6-44: Summary of results related to the moderating cultural dimensions
hypotheses..200
Table 6-45: Summary of results related to the four demographic variables ....... 201
Table 7-1: The summary of the moderating effect of PD for both samples ....... 214
Table 7-2: The summary of the moderating effect of MF for both samples ....... 217
Table 7-3: The summary of the moderating effect of IC for both samples......... 221
Table 7-4: The summary of the moderating effect of UA for both samples ....... 225
Table 7-5: The summary of the moderating effect of gender for both samples .. 228
Table 7-6: The summary of the moderating effect of Age for both samples ...... 232
Table 7-7: The summary of the moderating effect of educational level for both
samples ................................................................................................................ 235
Table 7-8: The summary of the moderating effect of experience for both samples
............................................................................................................................. 238
LIST OF FIGURES
Figure 2-1: Innovation-Decision Process .............................................................. 23
Figure 2-2: Social Cognitive Theory..................................................................... 24
Figure 2-3: Theory of Reasoned Action (TRA) .................................................... 25
Figure 2-4: Theory of Planned Behaviour (TPB) ................................................. 27
Figure 2-5: Decomposed Theory of Planned Behaviour (Taylor & Todd, 1995a) 30
Figure 2-6: Technology Acceptance Model .......................................................... 30
Figure 2-7: TAM2 ................................................................................................. 34
Figure 2-8: Augmented TAM ............................................................................... 36
Figure 2-9: Unified Theory of Acceptance and Use of Technology (UTAUT) ... 37
Figure 3-1: The proposed Conceptual Model ....................................................... 51
Figure 4-1: Research Design ................................................................................. 93
Figure 4-2: The six-stage process for structural equation modelling used in this
research ............................................................................................................... 114
Figure 6-1: Hypothesised CFA model derived from priliminery Analysis ........ 150
Figure 6-2: The refined measurement model for the British sample .................. 157
Figure 6-3: The refined measurement model for the Lebanese sample .............. 158

xviii
Figure 6-4: the structural model for the British sample. ..................................... 160
Figure 6-5: the structural model for the Lebanese sample .................................. 163
Figure 7-1: Results of hypothesised direct relationships in the structural models in
Lebanon and England .......................................................................................... 203

Chapter 1: Introduction
Ali Tarhini 1
Chapter 1: Introduction
“It’s Not about the Technology, It’s the person behind the Technology who
mattes…” (Charlie Johnston, 2013)
1.1 Introduction
The current chapter introduces the PhD thesis entitled “The Effects of Individual-
level Culture and Demographic Characteristics on E-learning Acceptance in
Lebanon and England: A Structural Equation Modeling Approach”. The following
section provides an overview of the theoretical background and research problem.
Section 1.3 will define the research aim and objectives. Section 1.4 presents the
scope of the research. Sections 1.5 and 1.6, respectively present the significance
and contributions of the study. The research methodology employed to investigate
the research questions are then introduced in Section 1.7. It is followed by the
context of the research in Section 1.8. To familiarise the readers with the
remainder of this dissertation, a brief overview of the contents of each chapter is
provided in Section 1.9. Finally, Section 1.10 concludes this chapter.
1.2 Theoretical Background and Research
Problem
During the last two decades, with the widespread use of the World Wide Web
(WWW), universities and other educational institutions have been investing in
web-based information systems (such as Moodle, Blackboard and WebCT) to
support both face-to-face and remote course delivery (Fletcher, 2005; Ngai et al.,
2007). Information and communication technology (ICT) has the potential to
greatly help students in their education, they reduce the cost of provision and

Chapter 1: Introduction
Ali Tarhini 2
therefore increase revenues for academic institutions (Ho and Dzeng, 2010). They
also afford students with more study flexibility and improve their learning
experience and performance (Christie and Ferdos, 2004).
Despite the enormous growth of e-learning in education and its perceived benefits,
research indicates that failures exist (Sun et al., 2008; Arbaugh and Duray, 2002;
Wu et al., 2006). The efficiency of such tools will not be fully utilised if the users
are inclined to not accept and use the system. Therefore, the successful
implementations of e-learning tools depend on whether or not the students are
willing to adopt and accept the technology. Thus, it has become imperative for
practitioners and policy makers to understand the factors affecting the user
acceptance of web-based learning systems in order to enhance the students’
learning experience (Liaw and Huang, 2011). Within this context, a number of
recent studies have shown that e-learning implementation is not simply a
technological solution, but also a process of many different factors such as social
factors (Schepers and Wetzels, 2007), organizational factors (Sun and Zhang,
2006), individual factors (Liaw, 2008; Venkatesh and Morris, 2000), in addition
to behavioural and cultural factors (Srite and Karahanna, 2006; Straub et al.,
1997).
In the technology acceptance and adoption literature, a considerable number of
models have been applied (e.g., the theory of reasoned action (TRA), the theory of
planned behaviour (TPB) and the technology acceptance model (TAM), unified
theory of acceptance and use of technology (UTAUT)) to investigate and explore
the determinants of user’s behaviour towards adoption and using information
technology. Among these models, the Technology Acceptance Model (TAM)
(Davis, 1989) is the most frequently cited and influential model for explaining
technology acceptance and adoption. Since it has been developed, TAM has been
extensively used, tested, and extended to explain technology adoption and success
in a number of application areas e.g. see (Bagozzi, 2007; Yousafzai et al., 2007a;
Venkatesh and Bala, 2008) including examples in: e-government e.g., (Phang et
al., 2006; Walker and Johnson, 2008), e-health e.g.(Lanseng and Andreassen,

Chapter 1: Introduction
Ali Tarhini 3
2007) and e-learning (Zhang et al., 2008; Park, 2009; Saeed and Abdinnour-
Helm, 2008; Yi-Cheng et al., 2007; Teo, 2011).
However, the explanatory power of TAM is still questionable as it ignores the
effect of social, individual and cultural influence on the acceptance of technology
(Struab et al., 1997; Bagozzi, 2007). More specifically, the focus of the majority
of recent studies has been within the context of developed countries such as North
America (Teo et al., 2008). While the Internet is a global tool, the efficiency of
particular applications should also be measured locally since users usually work in
local/national contexts (Li and Kirkup, 2007).
Developing countries, such as Lebanon, are particularly under-researched in
relation to their acceptance of e-learning applications. Such countries typically
support traditional styles of pedagogy in education, due to a lack of financial
resources and appropriately trained staff (Nasser, 2000; UNDP, 2002; Baroud and
Abouchedid, 2010), so it is especially important to understand the factors that may
encourage take up of e-learning within these developing countries. TAM has been
criticised for its cultural bias especially when tested in non-Western cultures (e.g.
see McCoy et al., 2007). Some support for TAM has been shown in the Arab
world in general (e.g. Rose and Straub, 1998) and for e-learning acceptance in
Jordan (Abbad et al., 2009). However, in relation to e-learning, questions remain
since Abbad et al. (2009) did not seek to define their sample in terms of their
specific cultural characteristics.
It has also been suggested that specific cultural differences may affect the strength
of some relationships within the TAM model and may help to explain some
contradictory findings within the literature e.g. (Sánchez-Franco et al., 2009). This
explanation has been explored explicitly in a limited number of studies through
the examination of the effects of cultural variables as moderators within TAM.
The most widely applied conception of culture used has been that of Hofstede
(1980) which categorises countries along the following dimensions:
Collectivist / individualistic

Chapter 1: Introduction
Ali Tarhini 4
Uncertainty avoidance (high / low)
Masculinity / femininity
Power distance (high / low)
While there is evidence that these cultural differences may explain some
variations in TAM results, much of the work in this tradition is limited, as it uses
nationality as a surrogate for culture which may mean that some of the specific
cultural variables are confounded. Hofstede’s own measurement instruments were
designed to be used at macro (country) level, providing limitations even for
studies which have included direct cultural measures in their methodology. More
recently Srite and Karahanna (2006) have overcome this issue by using measures
for Hofstede’s cultural dimensions that are reliable when used at the individual
level. Within e-learning relatively little attention has been given to the effect of
cultural variables as potential moderators, and studies which explicitly measure
culture at the individual level are particularly scarce. In the current study we
therefore extend TAM to include an examination of individual level cultural
variables as moderators within the model. TAM has also been criticised in some
contexts for lacking explanatory power e.g. (Sánchez-Franco et al., 2009).
Furthermore, while TAM has generally been found to have acceptable explanatory
power, the inclusion of moderators could improve this further (Sun and Zhang,
2006). For example, when including gender and experience in TAM2, the
explanatory power increased from 35 % to 53 % (Venkatesh et al., 2003). Within
this context, a number of researchers have recommended the need to incorporate a
set of moderators which remain largely untested such as Experience e.g.
(Venkatesh and Bala, 2008), age e.g. (Venkatesh et al., 2003) and cultural
background e.g. (Qingfei et al., 2009). Therefore, it is expected that after the
inclusion of moderating variables such as individual differences and culture
within TAM, the predictive validity of the model will be increased and a better
explanation of the inconsistencies in previous studies (Chin et al., 2003;
Venkatesh et al., 2003; Johns et al., 2003; Sørnes et al., 2004).

Chapter 1: Introduction
Ali Tarhini 5
While the inclusion of cultural moderators may address the limitation of TAM to
some extent, a complementary approach to this problem is the inclusion of
additional predictor variables within the model such as social, organisational,
individual and cultural factors. Here we include subjective norms, quality of
working life, facilitating technology and self-efficacy in order to examine whether
the explanatory power of TAM is improved in our research context through the
introduction of these additional predictor variables. Subjective norms have been
examined in a number of previous studies where they have been shown to be an
important determinant of acceptance (e.g. see Venkatesh et al., 2003).
Furthermore, Srite and Karahanna (2006) found that the impact of Subjective
norms was sensitive to cultural differences, providing a key rationale for the
inclusion of this variable here. Quality of Working Life has also been proposed as
a variable that may be a useful, culturally sensitive addition to TAM e.g. (Srite
and Karahanna, 2006; Zakour, 2004b). However, neither its applicability to the e-
learning context, nor the influence that cultural differences have on its effects
have been previously examined.
Clearly there are a number of gaps that this thesis aims to tackle. As mentioned
above, there is a lack of research focusing on the individual, social, organisational
and cultural factors that affect the acceptance and adoption of e-learning
technologies. In addition, although there are many studies that consider the
cultural values at the national level, there are very few studies that consider the
individual-level culture values. The latter is critical due to the fact that although
the national culture is a macro-level, however it is argued that the acceptance and
adoption of technology by end-users is a micro-level concern (Srite and
Karahanna, 2006). Finally, there have been little empirical studies that consider
the individual acceptance of e-learning technologies within the context of
developing and developed countries. This thesis aims to fill this gap.
Therefore, to address the aforementioned issues, this research aims to add new
variables; namely subjective norms (SN), quality of work life (QWL), computer
self-efficacy (SE) and facilitating conditions (FC) as a direct predictors in addition

Chapter 1: Introduction
Ali Tarhini 6
to individual-level cultural and other demographic characteristics as moderators;
to the TAM research model to investigate the extent to which these variables
affect students’ willingness to adopt and use e-learning systems and investigate
whether there are differences among these factors between developing and
developed world, specifically Lebanon as developing world and England as
developed world. Extending the TAM model to include social, organisational and
individual factors in two cultures allows us to explore the generalizability and
applicability of the proposed model in the context of e-learning in two cultures
and also allows exploration of where differences may lie between the cultures
involved. This will also help policy makers and practitioners to gain a deeper
understanding of the students’ acceptance of e-learning technology.
1.3 Research Aims and Objectives
The main aim of this study is to develop and test an amalgamated conceptual
model of technology acceptance that explains how individual, social, cultural and
organisational factors affect the students’ acceptance and usage behaviour of the
e-learning systems in Lebanon and England. This research aims to contribute to
the stream of literature on e-learning, technology acceptance and culture. Further,
it is hoped that this research will help the policy makers to establish a better
understanding of the reasons for accepting or rejecting the e-learning systems
across cultures. Given this context, this research aims to answer the following two
questions:
To what extent do individual, social, organisational and cultural factors
affect the students’ behaviour to adopt and use the web-based learning
system in Lebanon and the UK?
To what extent do individual-level cultural dimensions (power distance,
masculinity/femininity, uncertainty avoidance, and
individualism/collectivism) and other individual differences (age, gender,
experience and educational level) — as two sets of moderatos—impact

Chapter 1: Introduction
Ali Tarhini 7
the relationship between the main predictors and behavioural intention
and usage of e-learning systems?
The meeting of the following objectives will help to meet the overall aim of the
research and answer the above stated research questions:
1) Understand background and current situation
(a) To determine the current usage of Web-based learning systems in Lebanese
and British universities.
(b) To review the literature related to the diffusion of innovations and technology
acceptance models and theories, e-learning, and culture.
2) Develop and test a conceptual framework that captures the salient factors
influencing the user adoption and acceptance of web-based learning system
including:
(a) Behavioural belief
(b) QWL
(c) Social factors
(d) Role of internal and external support
(e) Individual factors
(f) Cultural factors
3) Examine the effect of two sets of moderators in the model
(a) Hofstede’s cultural dimensions at the individual-level (PD, M/F, I/C, UA)
(b) Individual differences (age, gender, educational level, experience)
4) To empirically validate the model in the context of a western/developed (UK’s
perspective) and non-western/developing (i.e., Lebanon’s perspective) countries,
and examine the similarities and differences between the two settings, this will
help in examining the validity of the models that has been developed in western
countries in non-western countries.

Chapter 1: Introduction
Ali Tarhini 8
5) Provide recommendations that emerge from the research for practice and policy
as to how adoption problems could be addressed.
1.4 Research Scope
It is crucial to define the scope of this study while taking into consideration the
main aims and objectives of this research and the availability of resources such as
time and money. This study investigates the most salient factors that affect the
user’s behaviour towards using the e-learning systems in the Lebanese and British
context. The scope of this research can be summarised as follows:
The area of application under investigation is the usage of learning
management systems, particularly Blackboard. However, the results of this
research could be generalised to other e-learning systems that share the
same nature as Blackboard such as WebCT and Moodle.
This study is focused only on students who use e-learning technologies in
their studies in higher educational institutions. Although other end-users
such as instructors, system administrators and university management are
considered to be important in promoting the benefits of such systems,
however the proposed conceptual model (Chapter 3) will only consider
factors and studies that are relevant to the acceptance of e-learning systems
from the students’ perspective.
The investigation for the acceptance behaviour is limited to the
geographical area of Lebanon as a developing country and England as a
developed country, and therefore considered representative to the areas
that only share the same cultural characteristics to those two countries.
Therefore, the applicability and the generalizability of the proposed
conceptual model will become a questionable issue when applied in a
different context or geographical area.

Chapter 1: Introduction
Ali Tarhini 9
This study is also limited by applying only Hofstede’s (1991) cultural
dimensions at the individual level as its main concern is not the cultural
models by itself. However other dimensions and cultural models will be
briefly discussed in the literature review (Chapter 2) but they will not be
part of our research plan.
1.5 Significance of the Study
This study aims to understand the factors that affect the acceptance of web-based
learning systems in different cultural context from the students perceptive.
Understanding these factors can help policy makers, educators and experts to
understand what the students expect from the learning management systems. This
can help the management achieve the most effective deployment of such system
and also helps them improve their strategic decision making about technology in
the future, they can decide on the best approach that fit their students before
implementing any new technology. For system developers, the findings of this
study will help them understand how they could improve their learning
management systems in the concerned cultural contexts. It is hoped that by
understanding the similarities and differences between the Lebanese and British
students, the educators will be better armed with knowledge about the the
potential (negative) effects of cultural differences on student’s behaviour when
using e-learning environments, and hopefully to create productive e-learning tools
that consider different cultures. Similarly, the users (students) can understand
what motivations and factors drive them into accepting the technology, and
exactly know the impact of using technology on their working life and that using
the technology is usually related to their social, attitudinal, cultural and individual
differences.
From the academic prospective, this research developed an integrative model that
combines both technology acceptance theories and cultural theories at the micro-
level (individual level) rather than national level within different cultural contexts
who apparently exhibited unique psychological and personal characteristics. To

Chapter 1: Introduction
Ali Tarhini 10
our knowledge, no other research has measured cultural factors at the individual
level in Lebanon and England. Therefore, this study is considered a useful guide
for other researchers to understand whether the acceptance of technology is
mainly affected by individuals’ cultural background (moderation effect) or
whether the acceptance is mainly based on the key determinants of technology
itself (without an indirect effect of moderation).
1.6 Contributions of the Study
The current research will primarily contribute to the body of literature on
technology acceptance and cross-cultural studies in general, and in the Arab world
and England specifically. This research sets out to make theoretical and practical
contributions to knowledge as follows:
1) It provides a critical analysis of the literature related to the diffusion of
innovations and technology acceptance models and theories, in addition, to
cultural theories in order to enhance knowledge of technology acceptance
and adoption from the student’s perspective.
2) It empirically confirms and validates an extended Technology Acceptance
Model within the context of e-learning in a western (UK’s perspective)
and non-western (i.e., Lebanon’s perspective) countries. To the best of the
author’s knowledge, this research is one of the first studies that empirically
and theoretically develop and test such an integrative theoretical
framework.
3) This study is one of the few studies that combine technology acceptance
theories and cultural theories at the micro-level (individual level) within
different cultural contexts who apparently exhibited unique psychological
and personal characteristics. To our knowledge, no other research has
measured cultural factors at the individual level in Lebanon and England.
Therefore, this study is considered a useful guide for other researchers to

Chapter 1: Introduction
Ali Tarhini 11
understand whether the acceptance of technology is mainly affected by
individuals’ cultural background (moderation effect) or whether the
acceptance is mainly based on the key determinants of technology itself
(without an indirect effect of moderation).
4) It provides an overall picture of the current usage of Web-based learning
systems in Lebanese and British universities.
5) It integrates two sets of moderators namely; Hofstede’s cultural
dimensions and other individual characteristics (age, gender, experience
and educational level); within the extended model and demonstrate their
impact on the relationship between the main predictors and usage
behavioural and behaviour intention of web-based learning tools.
6) The conceptual framework also integrates and examines the social,
individual, organisational and cultural factors that impact the users’ beliefs
and behaviour towards using technology web-based learning system.
7) This research contributes to the trends of studies and literature in social
science and IS that uses Structural Equation Modeling (SEM) technique to
analyse the data. Using SEM enables a better understanding of technology
adoption and acceptance in a cross-cultural context.
8) It investigates to what extent using the Web-based learning systems helps
to improve the users’ quality of working life.
9) It examines and understands the students’ opinions of internal and external
supports on influencing their usage and adoption of web-based learning
systems.

Chapter 1: Introduction
Ali Tarhini 12
10) It develops an inclusive categorisation of the similarities and differences
between British and Lebanese students on the acceptance and usage of
web-based learning systems. This will help in identifying and
understanding any differences between the cultures of these two countries.
1.7 Research Design and Methodology
The nature and context of this research make it most suitable to apply the
positivist approach with a quantitative strategy of analysis to answer the research
questions. This research aims to test hypothesized relationships within the context
of technology acceptance in an objective manner where the researcher is isolated
from the aim of the study. Furthermore, the constructs and their relationships used
within the well-defined conceptual model were developed and validated
thoroughly in the theories and models about the adoption and technology
acceptance (see Chapter 2).Therefore, a cross-sectional survey was found the most
appropriate technique to collect the data. Using the survey approach, the data can
be collected from a large number of participants simultaneously in a quick, easy,
efficient and economical way compared with other methods such as interviews
(Zikmund, 2009; Bryman, 2008; Sekaran and Bougie, 2011). Structural Equation
Modeling (SEM) technique will be used to test hypotheses and moderators and to
perform a number of tests such as group comparisons which require a large
number of participants. Therefore, using the survey as a data collection method is
appropriate from the ontological, epistemological and methodological point of
view. Conversely collecting data from two different countries using other
approaches such as interviews was not feasible in this PhD research in terms of
timing and limited financial resources.
Furthermore, this research employed a self-administrated questionnaire as a data
collection method for the following reasons: it is easily designed and
administrated; higher privacy of respondents because issues such as anonymity
and confidentiality were dealt with in the cover letter; collecting the
questionnaires immediately after being completed will assure a higher response

Chapter 1: Introduction
Ali Tarhini 13
rate; respondents can seek clarity and therefore could understand the concepts on
any question they are answering which in turns minimise the outliers in the study
(Sekaran and Bougie, 2011). A pre-test of the questionnaire with expert in the
fields and a pilot study with potential participants were conducted to ensure
reliability and validity of the questionnaires’ items and scales.
The current study, as the majority of empirical research in technology acceptance
(Venkatesh et al., 2003; Venkatesh and Bala, 2008) and e-learning (Zhang et al.,
2008; Teo et al., 2008), has used a non-probability convenience sampling
technique as it enables the researcher to collect data from the participants based on
their availability. It also helps the researcher to improvise with the resource
available for the research especially when there is lack of time and financial
resources. It is worth noting that a homogeneous large sample of students from
Lebanon and UK was used to allow the generalisation of the results to the student
populations in those two countries. In particular, a total of 2000 questionnaires
were distributed to 1000 students from the UK and 1000 from Lebanon
respectively, of which 1197 were returned indicating a 59.7% response rate. After
screening for missing data and duplicated responses, we retained 1168
questionnaires for data analysis. These included 566 Lebanese participants and
602 British participants.
The descriptive analysis of the collected data were analysed using Statistical
Package for Social Science (SPSS) version 18.0 such as data screening,
frequencies and percentages, reliability analysis and t-test. Analysis of Moment
Structures (AMOS) software version 18.0 was used to perform the Structural
Equation Modeling (SEM) analysis. This research follows Hair’s (2010)
recommendations about evaluating the structural model using a two-steps
approach (first the measurement model and then the structural model).
Additionally, Multiple Group Analysis (MGA) technique is used to measure the
impact of moderators on the conceptual model.

Chapter 1: Introduction
Ali Tarhini 14
1.8 Context of the research
England, as a representative of developed countries, and Lebanon, as a
representative of the developing world, were chosen for this study because they
represent nearly reverse positions on all Hofstede’s (2005) cultural dimensions, as
shown in Table 1.1. England is high on individualism and masculinity, low in
power distance and uncertainty avoidance. On the other hand, Lebanon is low on
individualism, moderate on masculinity, high on power distance and uncertainty
avoidance. Furthermore, Lebanon is largely different from England in terms of
language, religion and customs.
Country Power
Distance Masculinity Individualism
Uncertainty
avoidance
Lebanon (as part of Arab World) 80 53 38 68
England 35 66 89 35
Table 1-1: Cultural differences between England and Lebanon on Hofstede’s
cultural dimensions (values adopted from Hofstede, 2005)
In addition, compared to England, Lebanon remains relatively unexplored in
terms of technology acceptance and the investment in technology in general and
in the educational system in particular is still immature compared to western
countries since universities and higher education institutions support traditional
styles of pedagogy in education due to the lack of financial resources or trained
staff (Nasser, 2000; UNDP, 2002; Baroud and Abouchedid, 2010), which in turn
may affect the acceptance of technology within such countries. Additionally, the
limitations that emerge from TAM especially on holding equally well across
cultures and the inconsistency in previous studies’ results (Gefen and Straub,
1997; McCoy et al., 2005a; Straub et al., 1997; Zakour, 2004b; Srite and
Karahanna, 2006) direct our research to consider these two distinctive cultures.
Therefore, the applicability and thus the validity and robustness of the extended
TAM will be examined in both western and non-western cultural settings.

Chapter 1: Introduction
Ali Tarhini 15
1.9 Dissertation Outline
This section provides a brief overview of the eight main chapters of this thesis and
the steps undertaken to fulfil the research aim and objectives.
Chapter 1: Introduction provides the ‘roadmap’ of the entire thesis. It first
introduces the reader to the research problem along with the motivation behind
conducting this research and its scope. Then it highlights the research aims and
objectives. It is then followed by the research methodology and methods adopted
and then followed by context of the study. Finally, the structure and organisation
of the thesis are outlined.
Chapter 2: E-learning, Technology Acceptance & Cultural Models provides a
comprehensive literature review about the three main research areas that forms the
basis for this research namely; e-learning technologies, technology adoption
theories and models, and culture. This chapter first discusses the different e-
learning tools being used by higher educational institutions. It is then review the
nine most influential theories and models related to technology adoption including
IDT, SCT, TRA, TPB, DTPB, TAM, TAM2, ATAM, and UTAUT, and also
discuss their external factors which directly or indirectly are useful in developing
the conceptual framework for this study. Finally, this chapter will highlight the
importance of cultural dimensions and in particular Hofstede’s dimensions at the
macro and micro level.
Chapter 3: Theoretical Basis and Conceptual Framework aims to discuss the
development of the proposed conceptual model to study e-learning acceptance.
For this purpose, it justifies the use of Technology Acceptance Model as a
theoretical basis. This chapter also provides a further justification for extending
the TAM to include personal, social, and organisational factors as key
determinants, in addition, to the integration of individual characteristics (age,
gender, educational level, experience) and Hofstede’s cultural dimensions (power
distance, individualism\collectivism, masculinity\femininity, uncertainty
avoidance) as moderators within the model to study e-learning adoption and

Chapter 1: Introduction
Ali Tarhini 16
acceptance in Lebanon and England. Moreover, research hypotheses will be
formulated and operational definitions for each constructs will be presented. The
results of this chapter along with the detailed literature review in Chapter 2 help to
achieve the following objective of this research, which is “To develop a
conceptual framework that captures the salient factors influencing the user
adoption and acceptance of web-based learning system”.
Chapter 4: Research Design & Methodology describes the philosophical
approach, strategy of inquiry, methods and techniques used in Information System
and Social Science in general. This chapter also explain the rationale behind the
chosen approach and techniques that is essential in order to empirically test the
proposed conceptual model and thus to achieve the main research objectives and
answer the research questions. This chapter will also discuss the sampling
technique and the design of the survey and the steps taken to collect the data,
instrument scale measurement, explains the data analysis and statistical techniques
and finally the ethical considerations of the research study are provided.
Chapter 5: Preliminary Data Analysis presents the results of the pilot study to
ensure the validity and reliability of the measuring instruments to be used in
testing the hypotheses. It is then present the preliminary data analysis of the data
obtained from the respondents including tests such as normality, linearity,
multicollinearity and detecting outliers. The Statistical Package for the Social
Science (SPSS) version 18.0 will be employed for preliminary data analysis like,
data screening, frequencies and percentages, reliability analysis and t-test. The
results from the data analysis in this chapter will focus on the cross-cultural
differences between Lebanon and England and also investigate the different tasks
that students perform using the e-learning systems.
Chapter 6: Model Testing presents the results of the model testing phase. This
chapter presents an in-depth analysis of the relationships among the constructs
within the proposed research model. A two-step approach will be used during the
data analysis process. The first step will assess the constructs’ validity and test the
model fit. The next step will test the direct relationships among the independent
Chapter 1: Introduction
Ali Tarhini 17
and dependent variables for both models as well as the moderating impact of
individual-level culture and other demographic characteristics.
Chapter 7: Discussion discusses and reflects upon the main findings presented in
Chapter 5 and 6 through an in-depth interpretation of the demonstrated results and
findings. This chapter will help in understanding the important role that
behavioural beliefs, social, organisational, individual and cultural factors plays in
affecting the student’s beliefs towards adoption and acceptance of e-learning
technology in Lebanon and England and will also discuss the similarities and
dissimilarities between the two countries at the national level.
Chapter 8: Conclusion and Further Research is devoted to highlighting and
discussing the major methodological, theoretical and practical implications drawn
from the research study. This chapter also delineates and discusses the potential
limitations and finally propose directions for future research.
1.10 Summary
This chapter presented the foundation for the research by covering and illustrating
its background and purpose. Furthermore, this chapter covered the research aim
and objectives, scope, contributions, significance and context of the study.
Additionally, the research approach and methodology are also presented. Finally,
an outline and brief description of the thesis were discussed.
The following chapter will discuss and review the most used technology
acceptance theories and models, as well as, cultural theories in the IT/IS literature,
which will form the basis of the proposed research model.

Chapter 2: E-learning, Technology Acceptance & Cultural Models
Ali Tarhini 18
Chapter 2: E-learning, Technology
Acceptance & Cultural Models
“We seldom realize, for example that our most private thoughts and emotions are
not actually our own. For we think in terms of languages and images which we
did not invent, but which were given to us by our society.” (Alan Watts, The Book
on the Taboo Against Knowing Who You Are, 1970)
2.1 Introduction
This chapter reviews the literature related to e-learning environments, technology
acceptance theories and models as well as cultural models and theories.
Specifically, the chapter will begin with a brief discussion of the current e-
learning environments including their characteristics, limitations, advantages and
the major factors that affect the acceptance of such technologies. In the second
section, a critical review of the models and theories used in the IS research is
presented. Finally, this chapter provides a review of the different cultural theories
and models with an emphasis on Hofstede’s cultural theory and the importance of
measuring the culture at the individual level.
2.2 E-learning
E-Learning is the use of ICT to deliver information for education where
instructors and learners are separated by distance, time, or both in order to
enhance the learner’s learning experience and performance (Keller et al., 2007;
Horton, 2011). Govindasamy (2002) defines e-learning as a set of instructions
delivered via all electronic media such as the Internet, intranets, and extranets.
Thus, by eliminating the barriers of time and distance, individuals can now take

Chapter 2: E-learning, Technology Acceptance & Cultural Models
Ali Tarhini 19
charge of their own lifelong learning (Bouhnik and Marcus, 2006; Fletcher, 2005).
E-learning environments reduce the cost of provision and therefore increase
revenues for academic institutions (Ho and Dzeng, 2010).
The universities must decide during or before the implementation phase on the
best approach to deliver education, such as online learning, face to face, or apply
blended approach. For the purpose of this study, e-learning with a particular focus
on higher education institutions applies to the use of web-based learning systems
to support face-to-face education. According to Wagner et al. (2008), this
approach is the most successful learning approach compared to solely online and
only face to face contact.
Learning Management Systems (LMSs) refer to the web-based delivery
applications or technologies that are adopted by universities and other higher
education institutions to deliver courses’ contents, provide distance learning and
to manage the education process (Freire et al., 2012). Different web-based
learning systems have been developed for higher education to facilitate learning in
a web-based learning setting; these include Moodle, Web Course Tools (WebCT),
LAMS and SAKAI, Blackboard Learn (BBL). The web-based learning systems
usually integrate communication tools, graphics, video, and audio files. It also
gives academic staff course management tools for grading, tracking student
interaction, and monitoring class progress (Iskander, 2008).
2.2.1 Advantages of Web-based learning
Callan et al. (2010) and Garrison (2011) identified many advantages for web-
based learning systems including:
Less expensive to deliver, affordable and saves time.
Flexibility in terms of availability- anytime anywhere. In other words, it
enables the student to access the materials from anywhere at any time.
Access to global resources and materials that meet students’ level of
knowledge and interest.

Chapter 2: E-learning, Technology Acceptance & Cultural Models
Ali Tarhini 20
E-learning allows more affective interaction between the learners and their
instructors through the use of emails, discussion boards and chat room.
Learners have the ability to track their progress.
It provides the learners a variety of activities that fit different learning
styles.
It helps the learners develop knowledge of using the latest technologies
and the Internet.
The e-learning could improve the quality of learning and teaching as it
supports the face-to-face teaching approaches.
2.2.2 Disadvantages of Web-based learning
As with any application, Web-based courses have some disadvantages. These
might include little or absence of face-to-face contact with faculty member,
difficulty in using the system, problems with the technology, and self-paced
independent study which require a high self-motivation (Holmes and Gardner,
2006). There are also different aspects, especially in the developing countries,
such as providing the required funds to purchase new technology, lack of adequate
strategies, training for staff members and most importantly the student resistance
to use the web-based learning systems (Wagner, 2008).
Bouhnik and Marcus (2006) stated that learners’ dissatisfaction in using web-
based learning system included the following:
Lack of a firm framework to encourage students to learn.
A high level of self-discipline or self-direct is required, learners with low
motivation or bad study habits may fall behind.
Absence of a learning atmosphere in web-based learning systems.
The distance learning format minimizes the level of contact, web-based
learning systems lack interpersonal and direct interaction among students
and teachers.

Chapter 2: E-learning, Technology Acceptance & Cultural Models
Ali Tarhini 21
2.2.3 Factors Affecting E-learning Acceptance
Despite the enormous growth of e-learning in education and its perceived benefits,
the efficiency of such tools will not be fully utilized if the users inclined to not
accept and use the system. Therefore, the successful implementation of e-learning
tools depends on whether or not the students are willing to adopt and accept the
technology. Thus, it has become imperative for practitioners and policy makers to
understand the factors affecting the user acceptance of web-based learning
systems in order to enhance the students’ learning experience (Liaw and Huang,
2011). However, recent studies have shown that the acceptance and adoption of e-
learning tools is not simply a technological solution, but also should consider
many different factors such as social factors (Schepers and Wetzels, 2007), and
individual factors (Liaw, 2008), organizational such as facilitating conditions (Sun
and Zhang, 2006) in addition to behavioural and cultural factors (Masoumi, 2010).
Such major factors play an important role in how an information technology is
developed and used (Kim and Moore, 2005; Jones and Jones, 2005).
Within the Information Systems literature, various theoretical models have been
used (e.g., the theory of reasoned action, the theory of planned behaviour,
innovation diffusion theory, unified theory of acceptance and use technology, the
technology acceptance model) to investigate and explore the determinants of
user’s behaviour towards adoption and using information technology. The next
section will provide a detailed explanation about nine of the most influential
models in literature.
2.3 Technology Acceptance Theories and Models
This section will review nine of the most influential technology acceptance
theories and models that have been used in the area of Information System and
Information Technology research. Based on the critical review, a selection of
different factors will be identified. These factors will provide the basis for the
proposed conceptual model presented in the following chapter.

Chapter 2: E-learning, Technology Acceptance & Cultural Models
Ali Tarhini 22
2.3.1 Diffusion of Innovation Theory (DOI)
Diffusion of Innovation theory (DOI) (Rogers, 1995) is considered as a base to
formalise technology acceptance behaviour on which other technology acceptance
models can rely. The proposal of DOI was based on S-shaped diffusion curve
theory proposed by Gabriel Tarde (1903) by which DOI succeeded to set clear
definitions to ‘diffusion’, ‘innovations’ and the process of ‘communications’. To
begin with, the ‘diffusion’ can be considered as a procedure to enable a set of
innovations to communicate for a certain time within different social systems.
‘Innovations’ as a term refers to any set of new ideas, concepts or applications that
need to be recognised and shared by individuals.
The process of innovations’ diffusion by which technologies can be adopted or
rejected includes five stages: knowledge of an innovation, attitude toward the
innovation, making an adoption decision, implementation of the new idea and
decision confirmation. To begin with, any individual involved in the innovation
adoption decision need to be aware of an innovation’s existence and able to access
all knowledge and information available about it. The next stage involves
obtaining reliable information about the innovation from peers and users, to form
decision border line. The decision to accept or reject the innovation is thus ready
to be made. In spite of having separate stage to make the decision, innovation
rejection decision can be made at any stage of the innovation adoption process. If
a decision to adopt the innovation is made, the innovation has to be practically
used and tested. The innovation implementation stage involves assessing the
innovation complexity, ease of use and learning. Such information will have a
large effect on either confirming or rejecting the decision that has been already
made.
The innovation diffusion process is also dependent on the innovations factors that
are divided into five categories according to Rogers (1995) (see Figure 2.1). First,
Relative Advantage (RA) is known as “degree to which an innovation is perceived
as being better than its precursor” (Moore and Benbasat 1991, p.195). Using RA
relies on the importance of identifying the innovation efficiency and satisfaction.

Chapter 2: E-learning, Technology Acceptance & Cultural Models
Ali Tarhini 23
Second, Compatibility (COMP) is known as ”the degree to which an innovation is
perceived as being consistent with the existing values, needs and past experiences
of potential adopters” (Moore and Benbasat 1991, p.195). Considering COMP in
the innovation adoption process is essential because the adoption decision might
differ from one group to another, according to their beliefs and cultural
backgrounds. Third, Complexity (COLX) is known as “the degree to which an
innovation is perceived as relatively difficult to understand and use” (Thompson
et al., 1991, p.128). Since ease of use and learning has an impact factor on
adopting an innovation or not, COLX cannot be ignored. Fourth, Trialability
(TRI) measures how easy using the innovation in practice is to help making the
right decision about adopting/rejecting the innovation (Rogers, 2003). Finally,
Observability (OBS) relies on inspecting how the innovation under study has been
efficiently used within an organisation (Moore and Benbasat, 1991). In other
words, OBS determines how easily the innovation is understood.
Knowledge (1)
Persuasion (2)
Decision (3)
Implementation (4)
Confirmation (5)
Characteristics of the Decision-Making Unit:1. Socioeconomic Characteristics2. Personality Variables3. Communication Behaviour
Perceived Characteristics of Innovations:1. Relative Advantage2. Compatibility3. Complexity4. Trialability5. Observability
1. Adoption
2. Rejection
Continued Adoption
Later Adoption
DiscontinuanceContinued Rejection
Communication Channels (Process 1-5)Prior Conditions
1. Previous Practice2. Felt Needs/Problems3. Innovativeness4. Norms of the Social Systems
Figure 2-1: Innovation-Decision Process (Rogers 1995)
In spite of all its advantages, DOI suffers from several limitations affecting its
wide applicability. Some attitudes defined within DOI lack sound justifications. In

Chapter 2: E-learning, Technology Acceptance & Cultural Models
Ali Tarhini 24
other words, it is not known why certain attitudes lead to innovation adoption or
rejection decision. Moreover, DOI fails to link between the innovation properties
and a proper expected attitude (Karahanna et al., 1999; Chen et al., 2002). One
solution to remedy such a problem is to propose theories taking into account the
process of developing attitude such as Social Cognitive Theory (SCT).
2.3.2 Social Cognitive Theory (SCT)
Different from DOI, SCT considers actions and reactions of individuals (i.e.,
human agencies) in the process of innovation developments (Bandura, 1986).
Individuals are different in their behaviours. In turn, different behaviour has
different effects on the surrounding environment which affects the following
behaviour. In other words, SCT relies on feedback, vicarious learning and
identification. In terms of reciprocal determinism, SCT comprises three sets of
factors: environmental factors, personal factors and behaviours as depicted in
Figure 2.2 (Bandura, 1986). Considering these factors, the focus of SCT was
successfully changed from social learning to social ‘cognitive’ in order to
highlight the importance of cognition in people understandings and reactions.
Behaviour
Personal Factors (Cognitive, Affective,
and Biological Events)
Environmental Factors
Figure 2-2: Social Cognitive Theory (Bandura 1986)
2.3.3 Theory of Reasoned Action (TRA)
Forming the basis for other theories, the theory of reasoned action (TRA) focuses
more on and gives insightful concepts about behaviour (Fishbein and Ajzen, 1975;
Ajzen and Fishbein, 1980a). TRA principles rely on a hypothesis that humans

Chapter 2: E-learning, Technology Acceptance & Cultural Models
Ali Tarhini 25
usually think about their action implications before making any decision or
behaviour (Ajzen and Fishbein, 1980a).
TRA comprises three main constructs as depicted in Figure 2.3: Behavioural
Intention (BI), Attitude (A) and Subjective Norms (SN). Firstly, BI can be
considered as an immediate precedent part of behaviour. BI is different from
behaviour which is seen as a set of observable actions, BI forms the intention or
plan towards that upcoming behaviour. In other words, BI will be totally
dependent on an individual’s approach in acting or reacting to certain behaviour
(Fishbein and Ajzen, 1975; Ajzen and Fishbein, 1980a; Sheppard et al., 1988).
Secondly, Attitude (A) can be considered as a valid representative to human
actions and can be defined as “individual’s positive or negative evaluation of
performing the behaviour” (Fishbein and Azjen, 1975, p.216). Previous
experience has a paramount impact on A to be positive or negative. For instance,
if the previous experience was not good, A will have a negative influence on BI.
Finally, SN can be considered as “the person’s perception that most people who
are important to him or her think he should or should not perform the behaviour in
question” (Azjen and Fishbein, 1975, p.302). SN highlights the influence of an
individual society in his/her thoughts which soon become a normative behaviour
(Schepers and Wetzels, 2007). TRA can thus be explained based on its constructs
as any individual intentional BI is based on the both SN and A.
Beliefs and Evaluations
Normative Beliefs &
Motivation to Comply
Attitude Toward
Behaviour (A)
Subjective Norm (SN)
Behaviour Intention (BI)
Behaviour (Actual Usage)
Relative Importance of
Attitudinal and Normative
Considerations
Figure 2-3: Theory of Reasoned Action (TRA) (Source: Ajzen & Fishbein 1980)

Chapter 2: E-learning, Technology Acceptance & Cultural Models
Ali Tarhini 26
TRA has received a wide research attention especially in IS area such as (Ajzen,
1985; Bagozzi, 1981). However, TRA suffers from several limitations. For
instance, TRA made an assumption that any individual belief is reliant on his/her
intention on how he/she behaves (Ajzen, 1985). In other words, TRA will not be
able to predict individual behaviour if his/her intention to use it is not known in
the first place.
2.3.4 Theory of Planned Behaviour (TPB)
According to Ajzen (1988), the Theory of Planned Behaviour (TPB) was
developed to overcome the inability of TRA in predicting behaviour in the case of
which people have incomplete volitional controls. Sheppard et al., (1988, p.325)
defined volitional control as “behavioural intention will predict the performance
of any voluntary act, unless intent changes prior to performance or unless the
intention measure does not correspond to the behavioural criterion in terms of
action, target, context, time-frame and/or specificity”.
Considering the volitional control effect, TPB thus extends TRA by adding the
construct of Perceived Behavioural Control (PBC), to accommodate cases where
individuals plan to show some behaviour without any success is due to the
absence of confidence. In general, PBC can be defined as the ‘perceived ease or
difficulty of performing the behaviour’ (Ajzen, 1991, p.188) or the ‘perception of
internal and external constraints on behaviour’ (Taylor and Todd, 1995a, p.149),
in the information system context.
The relations between TPB constructs are similar to those of TRA in which the BI
is determined by Attitude (A), SN and PBC (Ajzen, 1991). For instance, if A
affects BI positively and so does SN, PBC intends to be high and individual BI as
to show behaviour is strong. Moreover, TPB also studies how these constructs can
be affected by human beliefs which have been classified into behavioural beliefs,
normative beliefs and control beliefs (Figure 2.4). To begin with, behavioural
beliefs consider the beliefs about behaviour outcomes which affect the attitude

Chapter 2: E-learning, Technology Acceptance & Cultural Models
Ali Tarhini 27
toward that behaviour. Moreover, normative beliefs can be known as the
consequences of other individuals’ aspects on behaviour. They also present an
expectation on what other individuals might believe in. Lastly, control beliefs
correspond to any type of factor that might influence behaviour either in a
supportive or unsupportive way (Ajzen, 2005).
Behavioral Beliefs
Normative Beliefs
Attitude Toward
Behavior
Subjective Norm (SN) Intention Behavior
Actual Behavioral
Control
Perceived Behavioral
Control
Control Beliefs
Figure 2-4: Theory of Planned Behaviour (TPB) (Source: Ajzen, 1991)
TPB was also adopted in many research areas such as healthcare (Chau and Hu,
2002; Norman and Conner, 1996), and information system (Mathieson, 1991;
Taylor and Todd, 1995b; Yousafzai et al., 2010) . Moreover, TPB has undergone
several modifications to enhance its performance such as the work of (Armitage
and Conner, 2001; Conner and Armitage, 1998; Elliott et al., 2003). Most of them
focus on a suitable modification of PBC construct to provide more generality to
the TPB.
In spite of its generality, TPB also suffers from several limitations. For instance,
there are more factors that might have an impact on behaviour but are not
considered in TPB such as habit, moral obligation and self-identity (Eagly and
Chaiken, 1993). Moreover, the exact prediction relation connecting BI with its
correspondent behaviour has not been clearly specified yet (Foxall, 1997). The
inability of TPB to move beliefs from context-specific to generalised form

Chapter 2: E-learning, Technology Acceptance & Cultural Models
Ali Tarhini 28
requires for measurement amendment every time the context or populations are
different (Ajzen, 1991). Although PBC impacts BI in a sense that it predicts any
individual who can perform behaviour if they think that they are able to do it, TPB
fails to explain the mechanism by which the individual will perform that
behaviour (Taylor and Todd, 1995a). Finally, combining all hidden or
unspecified factors affecting behaviour in PBC construct might affect the
prediction accuracy (Taylor and Todd, 1995c).
2.3.5 Decomposed Theory of Planned Behaviour (DTPB)
Decomposed Theory of Planned Behaviour (DTPB) was proposed by Taylor and
Todd (1995) to enhance the TPB model and solve the shortcomings of the
operationalization of PBC by restructuring TPB in a decomposition model.
Different from TPB which presented beliefs as one dimension, DTPB investigates
and clarifies the multi-dimensional nature of beliefs by which the attitudinal,
normative and control beliefs of TPB are decomposed, as depicted in Figure 2.5
(Taylor & Todd, 1995a).
First, attitudinal beliefs are known as an acquired individual mood toward a
specific behaviour such as ease of use, efficiency or benefits (Fishbein and Ajzen,
1975). TRA and TPB ignored the embedded sub-beliefs when presenting
attitudinal beliefs as one of their model constructs (Berger, 1993). To clarify the
hidden beliefs, DTPB decomposes attitudinal belief into perceived usefulness
(PU), perceived ease of use (PEOU) and compatibility. Such factors were found to
be reliable with respect to IT usage (Taylor and Todd, 1995a).
Second, normative beliefs cover the opinions that have been affected by others
(Fishbein and Ajzen, 1975). The decomposition of normative beliefs into different
groups highlights the difference between belief and its impact on the individual
behaviour itself (Taylor and Todd, 1995a). For instance, to study the impact of
peers on normative beliefs within DTPB, a case study was conducted among
academic referents divided into three groups: peers (i.e., students), superiors (i.e.,

Chapter 2: E-learning, Technology Acceptance & Cultural Models
Ali Tarhini 29
professors), and subordinates. The referents’ opinions are only considered if they
are different and should be ignored in the case of their similarity (Taylor and
Todd, 1995a). Studying the possibilities for adopting Internet services, a similar
case study was conducted based on DPTP to test the decomposition of SN into
two sub-categories interpersonal and external beliefs. Considering the source of
influence, interpersonal beliefs represent the surrounding society effect on an
individual belief where external beliefs denote the impact of non-human (i.e.,
machines) on an individual belief (Bhattacherjee, 2000). The experiment showed
a minimum impact of external beliefs on adopting Internet services (Hsu and
Chiu, 2004).
Third, control beliefs consider the factors that have significant impact on
encouraging (or discouraging) certain behaviour (Ajzen, 1985). In DTPB, control
beliefs are decomposed into Self Efficacy (SE) and Facilitating Conditions (FC)
(Taylor and Todd, 1995a). SE represented the internal beliefs of an individual that
control the decision process of performing a specific action (Bandura and
McClelland, 1977). Achieving high SE would lead to a progressive influence on
usage (Compeau and Higgins, 1995). On the other hand, FC is decomposed into
resource facilitating conditions such as time and money and technology
facilitating conditions that may put some restrictions on usage. The absence of FC
may restrict usage and intention but the existence of FC may not encourage the
usage (Taylor and Todd, 1995a).
In general DTPB adds more insights on belief factors because of its decomposing
process. Moreover, DTPB also contributes to research in IT usage suggesting that
different beliefs can affect managers targeting a specific IT usage for instance.
However, the decomposition process of DTPB could lead to more complex
models (than those of TRA and TPB for instance), which negatively contribute to
its analysis.

Chapter 2: E-learning, Technology Acceptance & Cultural Models
Ali Tarhini 30
Perceived Ease of Use (PEOU)
Compatibility
Perceived Usefulness
(PU)
Attitude Towards Behavior
Behavior Intention (BI)
Actual Behavior
Peer Influence
Superior’s Influence
Self Efficacy
Subjective Norm
Perceived Behavioral
Control
Resource Facilitating Conditions
Technology Facilitating Conditions
Figure 2-5: Decomposed Theory of Planned Behaviour (Taylor & Todd, 1995a)
2.3.6 Technology Acceptance Model (TAM)
Considering the Pros and Cons of TRA, Davis (1989) proposed a widely accepted
theory for representing the technology acceptance behaviour in IT domain. This
theory called Technology Acceptance Model (TAM) is considered as TRA variant
in which A and BI are considered but SN is ignored due to uncertainty in theories
behind it and empirical difficulties in applying it (Fishbein and Ajzen, 1975;
Davis et al., 1989). Moreover, different from TRA, TAM relies on PU and PEOU
for predicting an individual belief and attitude towards accepting certain
technology. In TAM, PU tends to have a direct and an indirect impact on BI as
depicted in Figure 2.6.
External Variables
Perceived Usefulness
(PU)
Perceived Ease of Use
(PEOU)
Attitude Towards Behavior
Behavioral Intention
Actual Behavior
Figure 2-6: Technology Acceptance Model (TAM) (Source: Davis et al., 1989)

Chapter 2: E-learning, Technology Acceptance & Cultural Models
Ali Tarhini 31
In general, TAM comprises the following elements: Attitude (A), Behavioural
Intention (BI), Perceived Usefulness (PU), Perceived Ease of Use (PEOU) and
External variables. First, A (as mentioned in TRA) considers human feelings
towards acting (or not acting) a certain behaviour (Fishbein and Ajzen, 1975).
Second, BI (as mentioned in TRA) measures the strength of intention to do certain
behaviour. Third, PU presents “the degree to which a person believes that using a
particular system would enhance his/her job performance” (Davis et al., 1989).
PU was previously used in DTPB to evaluate the performance of technologies
(Taylor and Todd, 1995a). Fourth, PEOU considers the users’ expectation towards
the ease of using certain technologies (Davis et al., 1989). Compared to
Complexity (COLX) in DOI, which measures the difficulties in using
technologies (Taylor & Todd, 1995a), PEOU can be considered as an opposite
concept.
Finally, external variables represent “the explicitly included factors in the model
that has an expected impact on BI and BU through the meditation of PU and
PEOU” (Davis et al., 1989, p.987). The external variables can comprise training,
documentation, decision-making properties and system design. The external
variables are not limited to certain ones. However, more variables can be
introduced whenever they are necessary such as enjoyment, computing support,
etc. (Koufaris, 2002; Moon and Kim, 2001a; Agarwal and Karahanna, 2000).
In general, TAM can identify whether a technology is to be accepted by an
individual according to three factors: (1) the functionality of the technology
(Davis et al., 1989), (2) its ease of use (Davis et al., 1989) and (3) the benefits that
might come out of using it (Dishaw and Strong, 1999). The ease of using a certain
technology can influence the user’s belief as a result of the increase in A and BI or
the existence of external variables (Davis et al., 1989; Taylor and Todd 1995a).
TAM was developed via several stages. In its first version, the process of TAM
comprises two steps. The first one includes collecting the PU and PEOU from
technology’s users. The next step includes assigning weights to each belief in
order to anticipate behaviour strength (Davis et al., 1989). This process was not
Chapter 2: E-learning, Technology Acceptance & Cultural Models
Ali Tarhini 32
fully convincing especially in the case where positive behaviour exists. It could be
better assessing the usability of technology not the technology itself by measuring
the user’s beliefs (Bagozzi, 1984). For instance, technologies might have a
positive impact on people in spite of their unwillingness to use them. One solution
to this contradiction can be provided by studying the impact of external variables
on beliefs.
The process of weighting beliefs was not considered in the next version of TAM.
As a result, the obtained results were mixed and misleading. For instance, users
start giving contradicting evaluation outcomes for technologies under study. On
the other hand, the omission of beliefs’ weighting positively enables the
differentiation between (A, BI, PU and PEOU), and the impact of external
variables. The modification had a positive effect on TAM prediction as it
appeared from the outcomes of the study conducted by Davis et al., (1989).
The ability of quick evolving can be considered as one of the most important
factors that makes TAM popular. To clarify, TAM was developed to understand
and explain an individual’s intention toward accepting a technology on a
voluntary-based (Davis et al., 1989). However, TAM has evolved and been used
in different context including example, graphics (Adams et al., 1992; Karahanna
et al., 1999), in e-government e.g. (Phang et al., 2006; Walker and Johnson, 2008)
and e-health e.g. (Lanseng and Andreassen, 2007).
TAM has been extensively studied and evaluated, Lee et al., (2003) classified
TAM evolving phases as the following: (1) introduction, (2) validation, (3)
extension and (4) elaboration. To begin with, the first phase (i.e., introduction)
focused on the TAM elaboration process by applying it on different applications.
The research during this phase also ran several comparison studies with previous
theories such as TRA (Taylor and Todds, 1995a). The second phase (i.e.,
validation) included the studies interested in examining the concept of TAM
within different contexts (Chin and Todd, 1995; Davis et al., 1989). The third
phase (i.e., extension) comprised the studies focusing on extending TAM with
new constructs in order to enhance its performance (Agarwal and Prasad, 1999;

Chapter 2: E-learning, Technology Acceptance & Cultural Models
Ali Tarhini 33
Venkatesh et al., 2003). Finally, the elaboration phase focused on introducing
newer versions of TAM such as the one that includes external variables
(Venkatesh and Davis, 2000).
The large number of studies applying TAM enabled the detection of TAM
limitations. To begin with, self-reported usage (Davis, 1993) can be considered as
the most frequent reported limitation due to the bias it adds to TAM process
(Agarwal and Karahanna, 2000). Moreover, the lack of real full measures that
prove TAM validity can be considered as another limitation. In other words, the
existing measures were only based on beliefs, attitude and intentions not on usage
behaviour (Taylor and Todd, 1995a; Mathieson, 1991). Furthermore, TAM fails to
explain the reasons of some results. The explanatory power of TAM is still
questionable as it ignores the effect of social, individual and cultural influence on
the acceptance of technology (Straub et al., 1997; Teo et al., 2008; Straub and
Burton-Jones, 2007; Bagozzi, 2007; Benbasat and Barki, 2007). More
specifically, nowadays, the focus of the majority of studies has been within the
context of developed countries such as North America. Finally, TAM also suffers
from the weakness in illuminating the design process behind the acceptance
behaviour (Venkatesh and Davis, 1996; Venkatesh and Davis, 2000). In other
words, no feedback is available for improvement concepts (Taylor and Todd,
1995a; Venkatesh et al., 2003).
2.3.7 Revised Technology Acceptance Model (TAM2)
The continuous evolution of TAM leads to the inclusion of other additional
constructs related to the social influence (Venkatesh & Davis, 2000). In details,
TAM 2 mainly added two main factors: (1) social influence processing factors and
(2) cognitive instrumental processing factors, as depicted in Figure 2.7 (Venkatesh
and Davis, 2000).

Chapter 2: E-learning, Technology Acceptance & Cultural Models
Ali Tarhini 34
Subjective Norm
Image
Experience
Intention to Use
Usage Behavior
Job Relevance
Output Quality
Perceived Usefulness
Perceived Ease of Use
Result Demonstrability
Voluntariness
Technology Acceptance Model(TAM)
Figure 2-7: TAM2 (Source: Venkatesh & Davis 2000)
The social influence processing factors include any factors which have a direct
impact on innovation adoption decision. Several variables can be categorised
under this group: Subjective Norms (SN), voluntariness (VOL), experience (EXP)
and image (IMG).
First, SN represents the implication of other people on an individual’s adoption
decision (Fishbein and Ajzen, 1975). Second, IMG which extends DOI can be
known as “the degree to which use of an innovation is perceived to enhance one’s
… status in one’s social system” (Moore and Banbasat, 1991, p.195). IMG might
be influenced by SN since combining the intension of doing certain behaviour
with actions increases the individual standing within the group (Venkatesh and
Davis, 2000). Third, VOL is defined as an “extent to which potential adopters
perceive the adoption decision to be non-mandatory” (Venkatesh & Davis, 2000,
p.188). VOL tends to decrease SN’s impact compared with mandatory settings
(Barki and Hartwick, 1994; Moore and Benbasat, 1991). Finally, EXP can point to
the degree of familiarity towards a particular system (Venkatesh and Davis, 2000).
The larger EXP, the lower the SN influence on PU and BI will be (e.g., Harwick
& Barki, 1994; Agrawal & Prasad, 1997).

Chapter 2: E-learning, Technology Acceptance & Cultural Models
Ali Tarhini 35
On the other hand, cognitive process includes factors related to decision process
between a system capability and system usefulness in terms of the intended job
such as Job Relevance (JR), Output Quality (OQ), Result Demonstrability (RD)
and PEOU. First, similar to COMP factor in DOI, JR can be defined as “an
individual’s perception regarding the degree to which the target system is
applicable to his or her job” (Venkatesh & Davis, 2000, p.191). Second, OQ
considers the performance of a system. To clarify, OQ assess whether a system
can achieve its designed objectives or not. The higher the OQ, the higher the
effect is on PU (Venkatesh & Davis, 2000). Third, RD can be defined as
“tangibility of the results of using innovations” (Moore and Banbasat, 1991,
p.203).
To validate the model of TAM2, different studies were conducted within different
domains such as examining Website usage (Wu et al., 2008) and e-learning (Van
Raaij and Schepers, 2008). The results showed that the capability of TAM2 in
explaining variance was considerably better than TAM. The significant impact of
SN on BI in TAM2 was also noted (Venkatesh and Davis, 2000).
TAM2 was proposed to overcome TAM limitations. However, TAM2 still suffers
from some inherited TAM limitations. To begin with, there might still be a bias in
results especially after considering self-reported usage as a valid measure.
Moreover, TAM2 presumed that any action needs to be made on an absolutely
voluntarily basis; that would not be possible in practice for all factors such as
limited skill, limited time, environmental limits and unconscious habits (Wilkins
et al., 2009). The ability of TAM2 to explain the impact of external variables only
on PU can be considered another limitation.
2.3.8 Augmented version of TAM (A-TAM)
The limitations of TAM to measure the social and other control factors directs
Taylor and Todd (1995b) to propose the augmented version of TAM (A-TAM) as

Chapter 2: E-learning, Technology Acceptance & Cultural Models
Ali Tarhini 36
a hybrid model of TAM and TPB. Figure 2.8 depicts the A-TAM constructs; PU
and PEOU, SN, PBC, BI and BU.
Perceived Usefulness
(PU)
Perceived Ease of Use
(PEOU)
Attitude Towards Behavior
Behavioral Intention (BI)
Actual Behavior
Subjective Norm
Perceived Behavioral
Control
Figure 2-8: Augmented TAM (Source: Taylor and Todd 1995)
A-TAM gives a higher priority to the social factors (e.g., SN and PBC) especially
in IT (Compeau and Higgins, 1991; Mathieson, 1991; Moore and Benbasat,
1991). Considering new and experienced users within the model can be
considered as another reason for adopting A-TAM as shown in the Taylor and
Todd (1995) study conducted among experienced and inexperienced students. The
result of the study confirms the capability of A-TAM in predicting the usage
behaviour according to the users’ experience level.
On the other hand, A-TAM also poses some limitations. First, the A-TAM model
misses other important variables (e.g., age and gender) that are related to the user
experience. Second, the study results could not be generalised as it was conducted
with homogenous technology.
2.3.9 Unified Theory of Acceptance and Use of
Technology (UTAUT)
The Unified Theory of Acceptance and Use of Technology (UTAUT) were
developed by Venkatesh, Morris, Davis and Davis (2003) in order to fill the gap
of other models. UTAUT consists of four main constructs namely (see Figure

Chapter 2: E-learning, Technology Acceptance & Cultural Models
Ali Tarhini 37
2.9); performance expectancy (PE) which is similar to PU in TAM, effort
expectancy (EE) which is similar to PEOU in TAM, social influence (SI) which is
similar to SN in TRA, and facilitating conditions (FC) which is similar to PBC in
TPB/DTPB. Those factors may affect the BI and usage of technology. UTAUT
also included a set of four moderators (age, gender, voluntariness of use and
experience) that may influence the relationships between the main determinants
and behavioural intention and usage (Venkatesh et al. 2003).
While the UTAUT was received little attention compared to other models, it has
been used in different context such as health/hospital IT e.g. (Kijsanayotin et al.,
2009), online-banking e.g. (Abu-Shanab and Pearson, 2009; YenYuen and Yeow,
2009), and E-government e.g. (Carter and Weerakkody, 2008).
Although the UTAUT proved to be a good model for measuring the intention and
usage behaviour, however there are some criticisms concerning its parsimony and
explanatory power e.g. (Williams et al., 2011). A detailed comparison of UTAUT
with other models will be discussed in the next section.
Performance Expectancy
Effort Expectancy
Gender Age
Behavior Intention (BI)
Use Behavior
Social Influence
Facilitating Conditions
ExperienceVoluntariness
of Use
Figure 2-9: Unified Theory of Acceptance and Use of Technology (UTAUT) (Source:
Venkatesh et al. 2003)

Chapter 2: E-learning, Technology Acceptance & Cultural Models
Ali Tarhini 38
2.3.10 Comparison of Models
The existence of different user acceptance models in the literature gives a sort of
flexibility. On the other hand, choosing the best model that can fulfil the case
study requirements is considered a difficult decision to make. As a result, several
comparative studies to highlight the pros and cons of each user acceptance model
have been conducted. The following subsections highlight some of the
comparison studies.
2.3.10.1 TAM and TRA
Different studies compared the performance of TAM and TRA such as that of
Davis, Bagozzi and Warshaw (1989). In this study, the convergence of TAM and
TRA led to have stronger structure which is based on behaviour intention (BI), PU
and PEOU. In spite of its importance as a determinant of behavioural intention,
SN does not have that much attention in the study. SN can be considered the main
construct that differentiates TRA from TAM. Where TAM does not consider SN
as a main construct influencing BI, TRA has theorised SN to be a main construct.
However, the importance of SN is still controversial. Due to its poor scaling,
Davis, Bagozzi and Warshaw (1989) discussed that SN may not affect BI
especially when SN scales up and the systems usage is personal on a voluntary
basis.
In summary, comparing TAM with TRA highlights the simplicity and
applicability of TAM over TRA with a variety of applications in spite of the
possibility of losing rich information because of not considering SN (Han 2003).
2.3.10.2 TAM, TPB and DTPB
Mathieson (1991) highlighted several points in the comparison between TAM and
TPB. First, user intentions were successfully represented by both TAM and TPB.
Second, TPB might be more useful than TAM during the system development
cycle and post-implementation evaluation. This is due to the capability of TPB to

Chapter 2: E-learning, Technology Acceptance & Cultural Models
Ali Tarhini 39
provide specific information, reasons and justifications on the users’ intention to
use a technology. Third, compared with TPB, TAM was easier to follow and
much quicker in collecting information about users’ perception of a technology.
Another study of Taylor and Todd (1995b) compared TAM with TPB and a
decomposed version of TPB (DTPB). With regards to the usage of IT, DTPB
outperformed TAM due to several factors. First, similar to TAM, DTPB can
classify the beliefs that may affect the usage of IT such as PU and PEOU. Second,
different from TAM, DTPB includes additional influencing factors on behaviour
(i.e., normative beliefs, self-efficacy, and facilitating conditions) (Ajzen, 1991).
Considering normative beliefs highlights the significance of the user’s
communications and participations to measure the IT usage. Self-efficiency
emphasises the importance of training which influences the user acceptance.
Facilitating conditions would provide an informative guidance during the
implementation phase. Including such factors increases the capability of DTPB to
integrate the studies of IT usage with the influence of organisation decisions on it.
Another study was conducted by Chau and Hu (2001) to compare TAM, TPB and
DTPB. This study used those three models to understand a physician’s usage of
telemedicine technology. TAM, TPB and DTPB were capable to illustrate 40%,
32% and 42% of the physicians’ acceptance respectively.
In summary, TAM, TPB and DTPB can be considered useful in finding the IT
usage behaviour and users’ intention towards the usage. However, TPB and
DTPB outperformed TAM by providing more explanatory power when users’
intension behaviour is included. To clarify, TAM is capable of predicting IT usage
behaviour but DTPB gives more insights on behavioural intention by taking
normative and control beliefs into account. As a result, DTPB can supervise the
implementation process of an IT system (Taylor & Todd, 1995b).

Chapter 2: E-learning, Technology Acceptance & Cultural Models
Ali Tarhini 40
2.3.10.3 UTAUT and Other Theories
According to Bagozzi (1992), the model which has good parsimony (best
predictive power as well as fewest constructs) is favourable. On the other hand,
Venkatesh et al. (2003) mentioned that detailed understanding of the phenomena
under investigation is more important than parsimony. While Taylor and Todd
(1995b) argued that the balance between parsimony and their contribution to
understanding should be thought of when evaluating the models.
In this regards, Venkatesh et al. (2003) compared eight models based on their
percentage of explained variance. They indicated that the variance explained in
user intention for these 8 models varied between 17% and 53%. However, after
including the core determinates as well as the four moderators in the UTAUT.
They found that the variance explained 69% of behavioural intention and usage
behaviour. With this rationale, this study will adopt some of UTAUT’s constructs
in addition to the four moderators.
2.4 Culture
In this section relevant literature related to the culture is reviewed. First a
definition of culture is presented. This is followed by a brief explanation of the
different cultural models including their scope and criticisms. We then proceed
with a brief explanation about Hofstede’s cultural dimensions. Finally, we provide
a justification for measuring the cultural dimensions at the individual level.
2.4.1 Definition of Culture
The study of culture has been always important to explain behaviour and
differences within national, organizational and individual culture. However,
culture is one of the most difficult and complex terms to define (Williams, 1985)
and it is also, therefore, difficult to operationalise and measure.

Chapter 2: E-learning, Technology Acceptance & Cultural Models
Ali Tarhini 41
Cultural models usually compare the similarities and differences of two or more
cultures by using cultural variables (Hoft, 1996). This research follows the
definition and broad characterisation of culture provided by Hofstede (1991) since
it is generally well accepted within the IS literature and provides a clear
framework for defining cultural dichotomies. Hofstede (1991) describes “culture
as the software of the mind which distinguishes the member of one group or
category of people from another”. He mentioned that culture is learned and not
inherited, and people usually acquire patterns of thinking, feeling and actions
which remain with them until later stages of their lives. He also argues that culture
is affected by the social environment where people are interacting. Hofstede
(1991) argues that a person may carry many layers of culture and this is highly
dependent on his/her situational states. This research aims to provide an
understanding on how individual-level of culture might affect students’ behaviour
when using Web-based learning tools in developing and developed countries. The
cultural models and variables in addition to the reasons behind choosing the
individual level culture are described in more detail in the next sections.
2.4.2 Cultural Models
There are many models that study the culture and each of those models uses its
own scope and variables to identify culture characteristics. The following
subsections will discuss some of most the important cultural models.
2.4.3 Schwartz’s Cultural Model
Schwartz’s (1994) cultural framework calculate, compare and study the cultural
differences between nations or sub-groups. These cultural variables were derived
from both individual level values and cultural level values. In his framework,
Schwartz suggested seven cultural domains based on universal human value types
where were defined and labelled by Schwartz (1994):
1. Conservatism: in such societies, people emphasize close relations among other
group’s members, and usually avoid actions that disturb traditional order.

Chapter 2: E-learning, Technology Acceptance & Cultural Models
Ali Tarhini 42
2. Intellectual autonomy: in such kind of societies, individuals are recognized as
autonomous entities that are entitled to follow their own intellectual interests and
desires.
3. Affective autonomy: Again in such societies, individuals are recognized as
autonomous entities that are entitled to follow their stimulation and hedonism
interests and desires.
4. Hierarchy: A society that emphasizes the legitimacy of hierarchical roles and
resource allocation.
5. Mastery: in such kind of societies, individuals can get ahead of other people by
emphasizing active mastery of the social environment.
6. Egalitarian Commitment: A society that emphasizes the transcendence of selfless
interests.
7. Harmony: A society that emphasizes harmony with nature.
Schwartz’s (1999) framework originally focussed on teachers and students with
35000 respondents, its cultural values or variables were derived theoretically with
57 questions within 49 different nations that included 41 cultural groups, collected
between 1988 and 1992. He concluded that the seven value types “efficiently
captures the relations among national cultures” (Schwartz, 1999, p. 38).
2.4.4 Hall’s Cultural Model
For Hall (1973), culture is not something to simply study, but a "critical site of
social action and intervention, where power relations are both established and
potentially unsettled.” (p.13). In other words, culture is a program of behaviour.
Hall developed a method for the analysis of culture through defining the basic
units of culture. These units or variables are Context, Space and Time. As for
Time, Hall differentiates between Monochronic and Polychronic time orientation;
he argues for example that people with Monochronic time orientation deal with
time in a sequential way, while Polychronic-oriented people deal with time in
simultaneous way. As for Space, this was another area that reveals important
cultural differences among societies. As an example, Hoft (1996) cited that Latin
countries such as Spain or Italy and Arabs seem to prefer a closer relation and are

Chapter 2: E-learning, Technology Acceptance & Cultural Models
Ali Tarhini 43
close to half the body distance one would find acceptable in the U.K or United
States. As for Context, it refers to the amount of information that a person can
comfortably manage, context can vary from a high context culture where
background information is implicit to low context culture where much of the
background information must be made explicit in an interaction, for example by
the use of language. In other words, in high-context cultures which value
relationships and information more than schedules, the information tends to be
very fast and free, while in low-context cultures, where people usually follow
procedures, the information flow tends to be slow (Hoft, 1996).
2.4.5 Hofstede’s cultural model
During the late 1960s and early 1970s, while working for IBM, Hofstede initiated
a survey of the company’s employees across the world. The original aim of the
work was not specifically to study cross-cultural differences. However, in
analysing the results Hofstede began to identify systematic variations in the way
certain groups of questions were answered in different parts of the world.
Subsequent follow-up work focused more closely on identifying those questions
which showed variation between countries. As a result of his research Hofstede
identified four1 dimensions of national culture difference:
1 In his later work Hofstede also included a fifth dimension, long term vs. short term orientation,
which was identified through collaborative research between Hofstede and Michael Bond
Hofstede, G. & Bond, M. H. (1988). The Confucius connection: From cultural roots to economic
growth. Organizational dynamics 16, 4-21. The respective poles of this dimension contrast an
orientation towards the future with an orientation towards the present and past. This dimension is
not considered within the work reported here as it is not relevant to the context of this study.

Chapter 2: E-learning, Technology Acceptance & Cultural Models
Ali Tarhini 44
Power distance – this refers to the extent to which individuals expect and accept
differences in power between different people, in other words it reflects the
attitudes to authority and power.
Individualism-collectivism – this refers to the extent to which individuals are
integrated into groups. In other words, Individualism is defined as a situation in
which people are supposed to look after themselves and their immediate family
only. While in contrast, Collectivism can be defined as a situation where people
who belong to the same group should look after each other’s for loyalty. This can
be considered as reflecting attitudes to group membership.
Masculinity-femininity – this refers to the extent to which traditional gender roles
are differentiated. In general, Masculinity refers to a situation where the dominant
values in society are success, money and other things, while in contrast,
Femininity refers to a situation which is a preference for relationships, caring for
the weak, and quality of life.
Uncertainty avoidance – this refers to the extent to which ambiguities and
uncertainties are tolerated.
Hofstede’s work has been very widely cited (for example Hofstede is among the
100 most cited authors in the Social Science Citation Index; Hofstede and
Hofstede, 2001). However, while Hofstede’s work has been highly influential in a
number of disciplines, it has also been heavily criticized. Some challenge
Hofstede’s ideas on the fundamental issue of whether culture is a construct that
can be dimensionalized and measured empirically. Criticisms from within the
positivist tradition focus on the specifics of Hofstede’s data gathering
methodology and on the statistical properties of his measurement scales. For
example, Schwartz (1999) argues that the survey as a data collection is not the
appropriate instrument to measure cultural differences especially when the
variable being measured is a value which culturally sensitive and subjective.
Hofstede’s defence of his work in such cases is typically robust e.g see (Hofstede,
2002). Another criticism is the number of years that has passed since Hofstede’s
work took place between 1968 and 1972, some researchers question the validity of
such model in the evaluation of technologies as what may be applicable at that
time may not be applicable in the present (McCoy, 2003). Problems in the

Chapter 2: E-learning, Technology Acceptance & Cultural Models
Ali Tarhini 45
literature are also argued to have arisen from the inappropriate use of Hofstede’s
scales to measure cultural variables at the individual level rather than at the
country (group) level (Eckhardt and Houston, 2002).
Despite the criticism on Hofstede’s model, Hofstede’s research is considered one
of the most widely used pieces of research among scholars and social science
research (Rose and Straub, 1998; Søndergaard, 1994; Nakata, 2009). In addition,
Hofstede’s model was cited in more than 9000 articles in peer-reviewed journals
between 1981 and 2011 which reinforce the value of his work. Furthermore,
Hofstede’s research framework was based on systematic data collection and
coherent theory and it was supported by many empirical studies; and this is what
the scholars and researchers had been asking for (Søndergaard, 1994).
Nevertheless, in his book Culture’s Consequences: Comparing Values,
behaviours, institutions, and organizations across nations, Hofstede (2001) noted
that most of the research that has validated his framework reported that these
variables are reliable and valid.
Despite finding many examples of the use of Hofstede’s framework in the
Information Systems literature, Ford et al. (2003) found relatively little theory
development work in this area. They therefore make several recommendations for
developing a theoretical basis for the integration between IS and culture. They
recommend that researchers should have a theoretical basis for including
Hofstede’s dimensions in any study. Ford et al (2003) also suggest some ways in
which Hofstede’s dimensions could be incorporated into the design of research.
One suggestion is to hypothesize a moderating role for the dimensions,
particularly in relation to existing theories used within IS such as the technology
acceptance model (Davis, 1989). Our research approach adheres to these
suggestions.

Chapter 2: E-learning, Technology Acceptance & Cultural Models
Ali Tarhini 46
2.4.6 Cultural dimensions at the Country vs. Individual
level
Although few would disagree that cultural factors are important in theory, there is
surprisingly little published literature concerning the effect of national cultural
aspects of online learning and teaching (Elenurm, 2008; Ya-Wen Teng, 2009;
Hannon and D'Netto, 2007; Sánchez-Franco et al., 2009). Most of the literature
about cultural effects in IS research is based on the national or organizational
level. A typical approach is to use nationality as a surrogate for culture, comparing
similar samples of participants from two or more countries and attributing any
differences to the assumed cultural dichotomies between the respective countries.
This approach is problematic for several reasons. First, researchers often rely on
historical findings regarding the cultural characteristics of particular countries or
regions (dating from Hofstede’s original findings). Research by McCoy et al
(2005a) suggests that shifts may have occurred over the last 30 years and that
assumptions based on Hofstede’s work may therefore no longer be valid. This
finding argues for the importance of directly measuring participant cultural values
within any new research study. A second problem is that as there are several
cultural dichotomies within Hofstede’s model and these will covary between
different countries. It can therefore be difficult to infer which cultural factor is
responsible for differences between samples from different countries (for example
if two countries vary in both uncertainty avoidance and collectivism, it may be
unclear which of these variables might be having an influence in any observed
results). As a result, it can be a challenge to find samples that usefully isolate the
cultural variables that may be of interest. A third problem is that within the same
country, individuals will vary on cultural dimensions. While national culture is a
macro-level phenomenon, the acceptance of technology by end-users is an
individual level phenomenon. Individual behaviour cannot be measured or
predicted using the national measurement score since there are no means to
generalise cultural characteristics about individuals within the same country
especially for measuring actual behaviour in the adoption and acceptance of
technology (Ford et al., 2003; McCoy et al., 2005a; Straub et al., 2002). Hofstede

Chapter 2: E-learning, Technology Acceptance & Cultural Models
Ali Tarhini 47
himself mentioned that his country-level analysis was not able to predict the
individual behaviour (Hofstede, 1984a). This means that it is problematic to
include national culture constructs within individual level models such as TAM
(McCoy et al., 2005b). Therefore, to avoid the limitations of this research
conceptual model at the micro level of analysis and to avoid over generalization of
cultural typology, the four cultural dimensions were measured at the individual
level.
McCoy et al. (2005a) recommend that individual level versions of Hofstede’s
instrument (such as that developed by Dorfman and Howell (1988) should be used
with individual level research models. Srite and Karahanna (2006) followed this
approach in two studies of the general acceptance of computing technology (PCs
in the first study and PDAs in the second study). They argued that the effect of
culture on individuals depends on the degree the individual is willing to get
involved and engage with the values of his/her own culture. They therefore used
scales derived from the work of Hofstede (1980) and Dorfman and Howell (1988)
to measure cultural values at the individual level. The scales were found to have
adequate psychometric properties and Srite and Karahanna (2006) were able to
successfully integrate them with a model derived from TAM. The research in this
study therefore follows this approach and measures culture at the individual level,
enabling the moderating effects of culture within the TAM model to be
meaningfully explored. The direct measurement of cultural values within a
contemporary Lebanese and British samples also allow exploration of whether the
shift in cultural values observed over the last 30 years by McCoy et al. (2005a)
applies to this group.
2.5 Summary
This chapter has presented and discussed available literature related to e-learning,
technology acceptance and cultural models. These three essential parts will
provide the theoretical background of this research. In particular, an overview of
the web-based learning systems environment was presented in the first section. In

Chapter 2: E-learning, Technology Acceptance & Cultural Models
Ali Tarhini 48
this regards, the advantages, disadvantages as well as the factors that affect the
acceptance of such technologies were presented. Secondly, a review of the nine
most influential models that has been used to study human behaviour were
critically reviewed and compared. From the preceding critical literature, we can
note that some of the models have good parsimony (e.g., TAM) but lack the
comprehensive cover of many major factors, whereas other models include more
complex factors but compromise on the parsimony of the model. However,
compared to other models, the TAM was found to have an acceptable explanatory
power and also have good parsimony. In this regards, TAM has received
extensive empirical support in the IS implementation area. However, there have
been some criticisms concerning the theoretical contributions of the model,
specifically its ability to fully explain technology adoption and usage.
Additionally, the existing parameters of the TAM neglected investigating other
essential predictors and factors that may affect the adoption and acceptance of
technology such as social, individual and cultural factors. Taking into
consideration the above limitations, this research will extend the TAM to include
other factors in order to increase its predictive power.
Finally, this chapter presented and discussed the different cultural models that
have been used in the literature with an emphasis on Hofstede’s cultural theory
(1991). Although the acceptance of technology by end-users is an individual level
phenomenon, surprisingly it was found that most of the literature about cultural
effects in IS research is based on the national (macro-level) or organizational
level. Therefore, in an attempt to overcome this gap, this research will examine
the influence of culture at the individual level within the context of developing
(Lebanon) and developed (England) countries. The following chapter will discuss
the theoretical framework and hypotheses of this study.

Chapter 3: Theoretical basis and Conceptual Framework
Ali Tarhini 49
Chapter 3: Theoretical basis and Conceptual
Framework
“Data and facts are not like pebbles on a beach, waiting to be picked up and
collected. They can only be perceived and measured through an underlying
theoretical and conceptual framework, which defines relevant facts, and
distinguishes them from background noise.” (Wolfson M., 1994, p.309)
3.1 Introduction
The literature review chapter discussed the various theories and models that are
related to technology acceptance with its components and external factors which
directly or indirectly are useful in developing the conceptual framework for this
study. Therefore drawing on previous chapter, the aim of this chapter is to explain
and discuss the development of the proposed conceptual model to study e-learning
acceptance. This chapter also provides a further justification for including the
personal, social, and situational factors as key determinants, in addition to the
integration of individual characteristics and Hofstede’s cultural dimensions as
moderators within the model to study e-learning adoption and acceptance.
Moreover, research hypotheses are drawn and operational definitions are
presented. The proposed model will form the basis for the empirical data
collection and analysis.
The chapter is divided into 6 sections. Section 3.2 provides a review of the
theoretical background of the proposed conceptual framework. Section 3.3 briefly
discusses and justifies the inclusion of the key determinants for the research study;
these include PEOU, PU, SN, FC, SE, QWL, BI and AU. In sections 3.4 and 3.5,
two sets of moderators are introduced, more specifically, Hofstede’s cultural
dimensions at the individual level are presented in sections (3.4.1, 3.4.2, 3.4.3,

Chapter 3: Theoretical basis and Conceptual Framework
Ali Tarhini 50
and 3.4.4), while demographics characteristics are presented in sections (3.5.1,
3.5.2, 3.5.3 and 3.5.4). Finally, Section 3.6 concludes the chapter.
3.2 Theoretical Framework
Chapter two has presented a thorough review of the models and theories
frequently used in explaining behaviours related to acceptance and adoption of
IT/IS. In addition, this research identified a set of factors that fall in different
domains such as personal, social, behavioural, cultural and technological that
might affect the use and adoption of web-based learning systems. As discussed in
Chapter 2, these constructs have been established in the literature as salient
predictors of technology acceptance.
Therefore, in this chapter, we discuss the development of the proposed conceptual
model for this research by explaining the different factors in greater details. It is
worth noting that the proposed model is trying to obtain a complete understanding
of a phenomenon under investigation which requires some sacrifice in the degree
of parsimony (Taylor and Todd, 1995c). The development of the proposed model
will show the influence of independent variables on the value of dependent
variables (Mandell, 1987) and will help the researcher to hypothesise and test the
relationships between the identified constructs in order to check if the theorised
model is valid or not (Sekaran and Bougie, 2011). However, drawing on the fact
that prior models related to acceptance and adoptions of IT have some limitations
(see Chapter 2), therefore, the most appropriate approach was to select the
relevant constructs related to context of this study from the various models.
In particular, this study includes 3 categories of variables to be tested, the first
category include the key determinants (independent variables) that may have an
effect on BI and AU of the web-based learning systems. These constructs are
PEOU, PU, SN, FC, SE and QWL. The second category includes two dependent
variables which are BI and AU. In this study BI is expected to influence the AU of
the system. While the third category integrates two sets of moderators (M) that

Chapter 3: Theoretical basis and Conceptual Framework
Ali Tarhini 51
may have an impact on the relationships between the key determinants and BI, the
first group integrates Hofstede’s cultural dimensions (MF, IC, UA, and PD) at the
individual level and the second is demographic variables (age, gender, educational
level and experience). Figure 3.1 depicts the proposed research model and a
detailed explanation of each category is presented in the next sections of this
chapter.
Figure 3-1: The proposed Conceptual Model

Chapter 3: Theoretical basis and Conceptual Framework
Ali Tarhini 52
3.3 Direct Determinants
In the previous section, the proposed research model comprised the three groups
of variables that may affect the acceptance and adoption of web-based learning
systems. In this section, a detailed explanation about the key determinants that
may have an influence on BI and AU will be discussed with a justification for
including each of these constructs within the proposed model.
3.3.1 Perceived Ease of Use (PEOU)
Perceived ease of use (PEOU) is defined as ‘the degree to which a person believes
that using a particular system would be free of effort’ (Davis et al., 1989 p.320)
and is similar to effort expectancy in UTAUT (Venkatesh et al., 2003). In the
TAM, TAM2 and DTPB, PEOU was theorised as a direct determinant of BI. In
addition, a number of researchers found a support to the indirect relationship of
PEOU on BI through PU (Sun and Zhang, 2006; Yousafzai et al., 2007b). Strong
evidence supported the important role that PEOU play in predicting the BI (Davis,
1989; Igbaria et al., 1997; Venkatesh and Morris, 2000; Chan and Lu, 2004; Reid
and Levy, 2008).
Reviewing the literature, the majority of the subsequent studies about student
perceptions on using technologies support the important role that PEOU plays in
predicting the BI (Saadé and Galloway, 2005; Liu et al., 2010; Chang and Tung,
2008; Liu et al., 2005; Teo and Noyes, 2011). However, the degree of significance
was different between the findings in the literature. The difference in the findings
was based on the field of study, sample size, or techniques used for analysing. For
example, Peng et al. (2009) found that PEOU was the strongest determinant on
the intention to use the system, which supported the findings of Chao and Tung’s
(2008) study. Furthermore, Saeed and Abdinnour (2008) found that PEOU have a
direct and significant influence on BI. However, it was not the strongest predictor
on the BI to use to the system. In contrast, Chesney (2006) concluded that

Chapter 3: Theoretical basis and Conceptual Framework
Ali Tarhini 53
perceived ease of use did not have a direct and significant influence on the
intention to use the system.
In the context of this study, the inclusion of PEOU was to investigate students’
beliefs of whether the system is free of effort and to predict their behavioural
intention to use the Blackboard system. It is expected that if the students find the
Blackboard system easy to use, then they are more likely to adopt and use the
system. Therefore, based on many models and previous research that consider the
direct relationship of PEOU on BI and indirectly through PU, we propose the
following hypothesis:
H1a,b: Perceived Ease of Use will have a direct positive influence on the intention to use
web-based learning system in the British and Lebanese context.
H1c: Students’ mean Perceived Ease of Use will be significantly higher in England,
compared to Lebanon.
H10a.b: Perceived Ease of Use will have a direct positive influence on Perceived
Usefulness of web-based learning system in the British and Lebanese context.
3.3.2 Perceived Usefulness (PU)
Perceived Usefulness (PU) is defined as “the degree to which a person believes
that using a particular system would enhance his/her job performance” (Davis,
1989, p. 453). PU is similar to relative advantage in the model DOI and
performance expectancy in UTAUT (Venkatesh et al., 2003). In other words, it is
the extent to which benefits are seen as outweighing costs. In the TAM, TAM2
and Augmented TAM, PU was theorised as a direct determinant of BI. In
addition, many researchers have provided evidence of its direct determinant on
AU (Gefen and Straub, 1997; Igbaria et al., 1996; Lederer et al., 2000; Szajna,
1994). Compared to the other behavioural belief construct (PEOU), PU was found
to have a significantly greater correlation with BI than did PEOU (Davis, 1989)
and the same result has been found in e-learning studies (Liu et al., 2010; Chang

Chapter 3: Theoretical basis and Conceptual Framework
Ali Tarhini 54
and Tung, 2008). Davis (1989) concluded that users are mostly driven to adopt
and use the system primarily because of the functions it performs for them.
In the present context of the study, PU was used to investigate the students’
beliefs about the potential benefits in using the Blackboard system. Many research
studies have highlighted the important rule that PU plays on BI to use web-based
learning tools (Amoako-Gyampah, 2007; Chesney, 2006; Chang and Tung, 2008;
Saadé and Galloway, 2005; Liu et al., 2005; Landry et al., 2006; Liu et al., 2010;
Rodriguez and Lozano, 2011; Šumak et al., 2011). For example, Liu et al. (2010)
applied an extended TAM to explore the factors that affect BI to use an online
learning community. They found that PU was the most influential variable in
predicting the intention to use the web-based learning system. In contrast, Saeed
(2008) found that PU has an influence on the intention to use but was not the most
influential factor. In this cross-sectional study and in accordance with the TAM,
TAM2 and DTPB studies, it is expected that if students think that the Blackboard
system is useful and will add value to their education then they are more likely to
adopt and use the system. In contrast, students may resist educational technologies
if they are sceptical of their educational value. Therefore, it is hypothesised that
PU will have a positive significant influence on the BI to use the Blackboard
system. Therefore, the researcher hypothesised:
H2a,b: Perceived Usefulness (PU) will have a direct positive influence on the intention to
use web-based learning system in the British and Lebanese context.
H2c: Students’ mean perceived usefulness will be significantly higher in England,
compared to Lebanon.
3.3.3 Subjective Norm (SN)
Subjective Norm also known as Social Influence, is defined as “the person’s
perception that most people who are important to him or her think he or she
should or should not perform the behaviour in question” (Ajzen and Fishbein,
1980b; Ajzen, 1991). In other words, SN refers to the social pressure coming from

Chapter 3: Theoretical basis and Conceptual Framework
Ali Tarhini 55
external environment which surrounds the individuals and may affect their
perceptions and behaviours of engaging in a certain action (Ajzen, 1991 p.188).
SN was included in many theories such as TRA, TPB, DTPB and TAM2 and is
similar to social influence in UTAUT; and image in IDT (see Chapter 2).
SN was studied in some research as an antecedent of BI and in other studies as an
antecedent of PU. However, as mentioned by Venkatesh et al. (2003) the
influence of SN is very complex. SN was found to be an important determinant of
behaviour in TRA and TPB, and directly and significantly related to the
behavioural intention (Ventaktesh et al., 2003., Venkatesh and Morris, 2000,
Taylor and Todd, 1995). The direct effect of SN on BI is justified from the fact
that people may be influenced by the opinion of others and thus involved in
certain behaviour even if they don’t want to. Venkatesh and Davis (2000) argue
that the effect of SN occurs only in mandatory environments and has less
influence in a voluntary environment. Therefore, following the guidelines of TPB
and since the use of VLE is mandatory (i.e. students must use the web-based
learning system in order to complete their course), this research will study the
direct effect of SN on behavioural intention as well as on PU.
According to Taylor and Todd (1995a), SN is decomposed into two groups and
usually determined by peer and superior influences. In the context of e-learning
technologies, student’s decision to adopt and accept such technologies is usually
influenced by other colleagues/students and superiors/lecturers pressures
(Grandon et al., 2005; Ndubisi, 2006).
However, there are inconsistencies in the findings when studying the direct impact
of SN on BI. For example, while some scholars found a significant influence of
SN on BI such as (Park, 2009; Venkatesh and Morris, 2000; Venkatesh and Davis,
2000; Grandon et al., 2005; Van Raaij and Schepers, 2008) others failed to find
any influence (Lewis et al., 2003; Chau and Hu, 2002; Ndubisi, 2006; Davis,
1989). Davis (1989) omitted the SN construct from the original TAM due to
theoretical and measurement problems, however SN was added later in TAM2

Chapter 3: Theoretical basis and Conceptual Framework
Ali Tarhini 56
due to its importance in explaining the external influence of others on the
behaviour of an individual.
This research assumes that students will be influenced by their colleagues and
instructors in the Lebanese and British contexts, whereas the effect of SN on BI is
highly considered in the Lebanese context. The rationale is based on the cultural
index which is proposed by Hofstede (1980). He indicated that PD and UA are
high and Masculinity and Individualism are low in Lebanon, while PD and UA
are low and Individualism (I/C) and Masculinity are high in England. Therefore,
based on the inconsistencies of the above findings and the importance of SN in
establishing behavioural intention towards adoption and acceptance of a
technology and its impact on PU, and in an attempt to overcome the limitation of
TAM in measuring the influence of social environments (Venkatesh and Davis,
2000), it is hypothesised:
H4a,b: Subjective norm will have a positive influence on student’s behavioural intention
to use and accept the web-based learning system in the British and Lebanese context.
H4c: Students’ mean Subjective norm will be significantly higher in Lebanon, compared
to England.
H9a,b: SN will have a positive influence on perceived usefulness of web-based learning
system in the British and Lebanese context.
3.3.4 Quality of Work Life (QWL)
The Quality of Work Life (QWL) seeks to achieve integration among
technological, human, and societal demands (Cascio and McEvoy, 2003).
Reviewing the literature, the term “Quality of Work Life” has appeared in
research journals in USA only in 1970’s and since then it regained an interest by
scholars and researchers. QWL was included based on a number of suggestions in
the IS literature that this extension may improve the TAM model (Zakour, 2004b;
Kripanont, 2007; Srite and karahanna, 2000).

Chapter 3: Theoretical basis and Conceptual Framework
Ali Tarhini 57
QWL has not previously been considered within an educational context and the
current study therefore explores whether it plays a role within this context. In this
research, QWL is defined in terms of students’ perception and belief that using the
web-based learning system will improve their quality of work life such as saving
expenses when downloading e-journals, or in communication when using email to
communicate with their instructors and colleagues. Generally speaking, a
mismatch between students and the impact of technology on their lives can be
disadvantageous for both students and institutions and which in turn affect their
behavioural intention to use the web-based learning systems. Thus, the emphasis
is given to QWL construct due to the economic gains and increases in
opportunities for advancement in students’ lives and it is expected that the higher
the QWL the better the acceptance of the technology.
Srite and Karahnana (1999) found a moderating effect of a set of individual
differences including gender and culture on the relationship between QWL and
behavioural intention. They found that people with high masculinity will focus
more on materiality and might be concerned with usefulness and work goals
rather than perceived ease of use and quality of work life that is dominated in the
feminine cultures. Therefore, it is expected that introducing the QWL construct
will enable a better capturing of cultural influence on the acceptance of web-based
learning systems especially the impact of masculinity/femininity on intention to
use the system. According to Zakour (2004), the include of QWL in TAM will
help in better understanding the technology acceptance by users and conclude that
future research should highly consider this construct due to its importance.
Thus, we propose that understanding the relationship between QWL and BI is an
important goal, in order to satisfy the various needs of the students and in return
eliciting favourable behavioural intention. It is worth noting that QWL can be
considered the operationalize construct of PU. We therefore expect the
relationship between those two constructs to be correlated. Based on previous
discussions, we hypothesise the followings:

Chapter 3: Theoretical basis and Conceptual Framework
Ali Tarhini 58
H5a,b: QWL will have a positive influence on student’s behavioural intention to use the
web-based learning system in the British and Lebanese context.
H5c: Students’ mean QWL will be significantly higher in the England, compared to
Lebanon.
3.3.5 E-learning Self-Efficacy (SE)
Self-efficacy (SE) - as an internal individual factor - has been defined as the belief
“in one’s capabilities to organise and execute the courses of action required to
produce given attainments” (Bandura, 1997, pp.3). In the SCT, SE is a type of
self-assessment that helps the understanding of human behaviour and performance
in a certain task e.g., (Bandura, 1997; Bandura, 1995). In the context of IT, self-
efficacy has been defined as “an individual’s perceptions of his or her ability to
use computers in the accomplishment of a task rather than reflecting simple
component skills” (Compeau and Higgins, 1995, pp.192).
According to Marakas et al. (1998), SE is categorized into two types, the first is
related to general use of computers and is known as ‘general Computer self-
efficacy’, whereas the second is related to a specific task on the computer and is
known as ‘task-specific computer self-efficacy’. Several studies have found SE to
be an important determinant that directly influences the user’s behavioural
intention and actual usage of IT e.g. (Downey, 2006; Shih and Fang, 2004; Guo
and Barnes, 2007; Yi and Hwang, 2003; Hernandez et al., 2009) and e-learning
acceptance (Chang and Tung, 2008; Yuen and Ma, 2008; Park, 2009;
Vijayasarathy, 2004; Chatzoglou et al., 2009; Roca et al., 2006). On the contrary,
Venkatesh et al.(2003) did not find a casual direct relationship between SE and
BI.
In the context of this study, SE is defined as a student’s self-confidence in his or
her ability to perform certain learning tasks using the e-learning system. In
general, it is expected that e-learning users with higher level of SE are more likely
to be more willing to adopt and use the system than those with lower self-efficacy.

Chapter 3: Theoretical basis and Conceptual Framework
Ali Tarhini 59
Therefore, consistent with previous research that integrated self-efficacy as a
direct predictor that has effects on behavioural intention AU of the system, we
propose the following hypotheses:
H6a,b: Computer self-efficacy will have a positive influence on student’s behavioural
intention to use the web-based learning system in the British and Lebanese context.
H7a,b: Computer self-efficacy will have a positive influence on the actual usage of the
web-based learning system in the British and Lebanese context.
H7c: Students’ mean self-efficacy will be significantly higher in England, compared to
Lebanon.
3.3.6 Facilitating Conditions (FC)
The facilitating condition (FC) has been defined as “the degree to which an
individual believes that an organizational and technical infrastructure exists to
support use of the system” (Venkatesh et al. 2003, p. 453). More specifically, it
comprises the availability of external resources (time, money and effort), which is
known in the literature as Resource Facilitating Conditions “RFC” (Fu et al.,
2006; Lin, 2006; Guo and Barnes, 2007; Ajjan and Hartshorne, 2008) and also the
availability of the technological resources (PCs, broadband, accessible network,
network security etc), which is referred to as the Technology Facilitating
Conditions “TFC” (Fu et al., 2006; Taylor and Todd, 1995c). In other words, it is
providing the external resources that are needed to facilitate the performance of a
particular behaviour (Ajzen, 1985). In the context of this study, FC will be
measured by the perception of students of whether they are able to access the
required resources and the necessary support to use the web-based learning
services.
Reviewing the literature, FC construct is considered an important antecedent of
the UTAUT model and is similar to perceived behavioural control (PBC) from
TPB, C-TAM/TPB and compatibility from IDT (Ajzen, 1985; 1991; Taylor and
Todd, 1995; Venkatesh et al., 2003). FC was included as a direct determinant of

Chapter 3: Theoretical basis and Conceptual Framework
Ali Tarhini 60
BI and AU in many theories and by many researchers in the field of technology
studies. For example, the relationship between FC and BI was found to be
significant in several studies e.g. (Shih and Fang, 2004; Yi et al., 2006). On the
contrary, other researchers found FC non-significant in predicting BI but
significant in determining usage (Chang et al., 2007; Limayem and Hirt, 2000).
Thus, the importance of the external influence of facilitating conditions on the
decision-making process is a crucial antecedent of human behavioural roles within
information system studies (Tan and Teo, 2000; Shih and Fang, 2004) and within
the e-learning context (Teo, 2009b; Ngai et al., 2007; Maldonado et al., 2009).
Therefore, it is very important to investigate whether FC has a direct influence on
the actual usage of the web-based learning system, as the absences of facilitating
resources may represent barriers to usage (Taylor & Todd, 1995a, p.153). Hence,
it is expected that these external resources will lead the students to adopt the
learning management systems. Based on the above discussion, the researcher
proposes the following hypotheses:
H8a,b: Facilitating conditions will have a positive influence on actual usage of web-
based learning system in the British and Lebanese context.
H8c: Students’ mean facilitating conditions will be significantly higher in England,
compared to Lebanon.
3.3.7 Behavioural Intention (BI)
The presence of behavioural intention (BI) in TAM is one of the major differences
with TRA. BI is considered to be an immediate antecedent of usage behaviour and
gives an indication about an individuals’ readiness to perform a specific
behaviour.
Ajzen (1981) claimed that as a general rule, “the stronger the intention to engage
in a behavior, the more likely should be its performance”. In TAM, both PU and
PEOU influence the BI to use the technology, which in turns influence the usage
behaviour (Davis, 1989).

Chapter 3: Theoretical basis and Conceptual Framework
Ali Tarhini 61
There is considerable support in literature for the relationship between BI and AU
in general (Davis et al., 1989; Taylor and Todd, 1995b; Taylor and Todd, 1995c;
Venkatesh and Davis, 2000; Venkatesh et al., 2003). This has recently been
extended to the e-learning context (Zhang et al., 2008; Yi-Cheng et al., 2007;
Chang and Tung, 2008; Park, 2009; Saeed and Abdinnour-Helm, 2008;
McCarthy, 2006; Liu et al., 2010; Walker and Johnson, 2008; Teo et al., 2011). In
addition, the path from BI to AU is significant in the TAM, DTPB, and TPB. BI
has a large influence on AU. However, it is worth mentioning that when
individuals have prior experience with using the technology, the effect of BI is
more predictive on AU (Taylor and Todd 1995b).
In the context of information system research, system usage were studied as a
dependent variable and is often measured by only BI (Agarwal and Karahanna,
2000; Venkatesh and Morris, 2000; Gefen and Straub, 2000), or by only AU
(Szajna, 1994; Davis, 1989), or even both BI and AU (Venkatesh and Davis 2000;
Venkatesh et al., 2003, Taylor & Todd 1995a).
In the context of this research and similar to previous studies, this research
considered both BI and AU as dependent variables in the theoretical framework. It
is expected that BI will have a direct influence in predicting the usage behaviour
of students to accept and use the Blackboard system in the future (Self-reported
usage measures). Therefore, the researcher proposes the following hypotheses:
H3a,b: Student’s BI will have a positive effect on his or her actual use of web-
based learning system in the British and Lebanese context.
H3c: Students’ mean intention to use web-based learning systems will be
significantly higher in England, compared to Lebanon.
3.4 Hofstede’s Cultural dimensions
This section will discuss the first category of factors which is related to Hofstede’s
cultural dimensions (MF, ID, PD, UA) that may impact the relationships between

Chapter 3: Theoretical basis and Conceptual Framework
Ali Tarhini 62
the core constructs and behavioural intention to use the system. The rationale
behind the inclusions of moderators within our conceptual model is to increase the
predictive power of the model.
3.4.1 Power Distance (PD)
PD determines the extent to which individuals expect and accept differences in
power between different people (Hofstede, 1993; Hofstede and Peterson, 2000). A
number of authors have suggested that Power Distance might be expected to
moderate the relationship between SN and BI e.g. (McCoy et al., 2005a; Srite and
Karahanna, 2006; Dinev et al., 2009; Li et al., 2009). The general prediction is
that users with PD values would be more likely to be dependent on referent power
in decision making, i.e. they would be more influenced by the views of others,
particularly superiors, in deciding whether to adopt technologies. While this
argument appears logical, evidence in support of it has been ambiguous at best.
Dinev et al. (2009) compared samples from South Korea and the US in the context
of adoption of protective (e,g. anti-virus) software. They found that the
relationship between SN and BI was significant for the South Korean sample (a
high PD culture) but not for the US sample (low PD). While this finding is in line
with the discussion above, several other cultural factors co-varied between the two
sample groups and Dinev et al. (2009) attribute the result to a cumulative effect of
individualism, masculinity, power distance and uncertainty avoidance. McCoy et
al (2005a) compared email users in Uruguay and the USA, predicting that the
relationship between SN and BI would be stronger for the Uruguay sample based
on a number of cultural differences including Power Distance; however, they
found no significant effect of SN on BI in either sample. Li et al. (2009) compared
China and the US in the context of adoption of a web portal. While they measured
culture at the individual level, they found no moderating effects. Srite and
Karahanna (2006) also measured culture at the individual level. In one part of
their study they found that PD was a significant moderator of the relationship
between SN and BI, this was in the opposite direction to that predicted. The
second part of their study found no significant effect of PD. The effect of PD in

Chapter 3: Theoretical basis and Conceptual Framework
Ali Tarhini 63
the context of educational technology adoption does not appear to have been
explored directly in past research. Therefore, it is expected that the relationship
between SN and BI will be stronger for high PD users. Applying the concept of
PD on e-learning implementation, students with low PD cultural values will
implement many ways of learning which include using the technology, and the
education would be student-centred.
McCoy et al. (2005b) additionally predicted that PD would moderate the
relationship between Perceived Usefulness and Behavioural Intention, such that
the relationship would be stronger for low PD samples. While the justification for
this is not clearly articulated, it could be hypothesised that this would be the case
because in low PD cultures users might feel free to use their own intention
judgements based on usefulness, rather than rely heavily on the views of those
with higher perceived power. McCoy et al. (2005a) were not able to demonstrate
the predicted effect in their work, with both the US and Uruguay samples showing
similar strength PU->BI relationships. However, since the samples co-varied on a
number of other cultural factors it is difficult to interpret the result. Our study
provides the opportunity to explore this in more detail with individual level
cultural values data. Furthermore, individuals with high PD are characterized with
lower rates of innovation and acceptance (Zmud, 1982) and thus the effect of PD
will be weaker on the relationship between behavioural belief (PEOU,PU) and BI
(Harris, 1997). This argument is consistent with psychological studies which
suggests that individuals are less innovative when they have less autonomy and
freedom (Mumford and Licuanan, 2004). In contrast, the freedom in working
environment could increase the BI to adopt and use the new system (Straub et al.,
1997) and individuals will use their own skills (i.e SE) and accept the technology
due to its importance to perform the required job (i.e. PU) rather than under the
pressure from their superior. Moreover, it is expected that individuals with low
PD cultural values will mainly use the technology if it helps improve their quality
of work life (QWL). Generally speaking, a mismatch between students and the
impact of technology on their lives can be disadvantageous for both students and
institutions and which in turn affect their behavioural intention to use the web-

Chapter 3: Theoretical basis and Conceptual Framework
Ali Tarhini 64
based learning systems. There are evidence of a worldwide decrease in PD in
recent years especially in the Arab world, however as previously mentioned
Lebanon, as an Arab country, differs socially and culturally from England based
on Hofstede’s PD dimension. Lebanon historically has a significantly higher level
of PD (value index = 80) than England (value index = 35).
With respect to power distance and based on previous discussion, it is therefore
expected that the relationships between PEOU, PU, SE and QWL will be more
related to students with low power distance, while students with higher power
distance are expected to be influenced by SN, FC. Therefore, we propose the
following hypotheses:
H11a1,a2,a3,a4,a5,a6: The relationship between (PEOU, PU, SN, QWL, SE, FC) and
Behavioural Intention and actual usage of the web-based learning system is moderated
by the Power Distance value in the British context.
H11b1,b2,b3,b4,b5,b6: The relationship between (PEOU, PU, SN, QWL, SE, FC) and
Behavioural Intention and actual usage of the web-based learning system is moderated
by the Power Distance value in the Lebanese context.
H11c: Power Distance mean will be significantly higher in Lebanon, compared to
England.
3.4.2 Masculinity/Femininity (MF)
According to Hofstede’s (1980, 1984, 1991, 2001) definition of the
masculinity/femininity cultural dimension, a high masculinity culture (low
femininity) will emphasise work goals, such as earning and promotions. In
general, individuals high on masculinity usually value competitiveness,
assertiveness, ambition and focus on performance and material possessions. On
the other hand, low masculinity individuals (high on femininity) are encouraged to
follow more traditional, tender and modest roles.

Chapter 3: Theoretical basis and Conceptual Framework
Ali Tarhini 65
Those holding high femininity cultural values are characterised as being more
people-oriented than those with high masculinity values. For this reason they
would be expected to be more influenced by interpersonal contact and a number
of authors have therefore predicted a moderating effect of subjective norms on
behavioural intention, such that the relationship will be stronger for more
feminine samples (Li et al., 2009; Dinev et al., 2009; Srite and Karahanna, 2006).
Srite and Karahanna (2006) found support for this hypothesis in one study using
individual measures of culture, but a non-significant effect in their second study.
Dinev et al. (2009) showed the predicted effect in a cross-country sample, with the
relationship between SN and BI stronger for South Korea (more feminine culture)
than the USA (more masculine culture), though a number of other cultural
differences between the samples could also contribute to this result. Other studies
were unable to show the predicted effect e.g. (McCoy et al., 2005a; Li et al.,
2009). Here we predict that in an educational context the relationship between SN
and BI will be moderated by Masculinity-Femininity, such that it will be stronger
for those espousing more feminine values.
Conversely, those high in masculinity would be expected to focus more on
instrumental values and so would be expected to be more influenced by features
that enhance the achievement of work goals compared to those high on femininity.
PU is usually determined through the cognitive instrumental process by which
individuals use a mental representation for considering the match between the
potential goals and the consequences of performing an act of using the technology
(Venkatesh, 2000). A moderating relationship between PU and BI would therefore
be predicted, with the relationship expected to be stronger for those with more
masculine values. Srite and Karahanna (2006) hypothesised this effect but failed
to find a significant result. Srite (2006) found an effect in the opposite direct to
that expected, with a significant effect of PU on BI for a US sample (more
feminine) but no significant effect for a Chinese sample (more masculine). The
relationship has not been explicitly explored in relation to e-learning technology
acceptance; we predict that in this context the relationship will be stronger for
high masculinity individuals.

Chapter 3: Theoretical basis and Conceptual Framework
Ali Tarhini 66
In contrast to PU (an instrumental variable), PEOU captures the hedonic
experience of using a technology. Authors such as Srite and Karahanna (2006)
argue that such experiences will be more important for users who espouse
feminine values since feminine cultures tend to emphasise the creation of more
pleasant work environments. A number of authors found evidence to suggest that
the relationship between PEOU and BI is stronger for those with more feminine
values e.g. (Srite, 2006; Srite and Karahanna, 2006; McCoy et al., 2007; Qingfei
et al., 2009). We therefore predict the same effect in an educational context.
Quality of Working Life (QWL) has been suggested by several authors as a
potentially relevant factor when considering the impact of masculinity-femininity
on technology acceptance e.g. (Zakour, 2004b; Srite and Karahanna, 2006; Srite,
2006); however, none of these studies directly considered QWL. Quality of
Working Life is generally valued more within masculine cultures QWL is closely
related to the obtained benefits of the technology (Zakour, 2004b; Kripanont,
2007; Srite and karahanna, 2000), so would be expected to be a more important
predictor of technology acceptance for users with more masculine values. In an
educational context we hypothesise that QWL will be stronger predictor of BI for
those expressing more masculine cultural values. Similarly, individuals with high
masculine values perceive analytical and competitive approaches to solving
problems (Venkatesh et al., 2004; Venkatesh and Morris, 2000) which will lead to
higher score on Self-efficacy. Such individuals are also expected to rate a higher
performance towards FCS with respect to service aspects and the working
environment.
It is worth noting that England differs socially and has a significantly higher score
of masculinity (value index= 66) than Lebanon (value index= 53). At the national
level Lebanon is considered as moderate in masculine index compared to 66 in
England which indicates a very masculine society.
Therefore, based on previous discussions it is expected that students with high
masculine values will be more concerned about the usefulness of the web-based

Chapter 3: Theoretical basis and Conceptual Framework
Ali Tarhini 67
learning system and QWL, while students with feminine values perceive a higher
importance of PEOU, SN, SE and FC. Thus, we hypothesise the followings:
H12a1,a2,a3,a4,a5,a6: The relationship between (PEOU, PU, SN, QWL, SE, FC) and
Behavioural Intention and actual usage of the web-based learning system is moderated
by the masculinity/femininity value in the British context.
H12b1,b2,b3,b4,b5,b6: The relationship between (PEOU, PU, SN, QWL, SE, FC) and
Behavioural Intention and actual usage of the web-based learning system is moderated
by the masculinity/femininity value in the Lebanese context.
H12c: masculinity mean will be significantly higher in England, compared to Lebanon.
3.4.3 Individualism/Collectivism (IC)
According to Hofstede (1980), the terms individualism/collectivism refer to the
extent to which individuals are integrated into groups. In individualistic societies,
individuals focus on their own achievements and personal goals rather than on the
group they belong to, such people seem to be innovative, value personal time,
challenges and freedom. While in collectivistic societies people prefer loyalty and
group success on their individual gain (Kagitcibasi, 1997). The level of IC of an
individual strongly affects the relationship between a person and the group of
which one is a member (Benbasat and Weber, 1996; Hofstede, 1991).
Individualism/collectivism was found to have a moderating impact on the
relationship between PU, PEOU, SE, FC, SN, QWL and behavioural intention
(BI) to use a specific technology, such that PU and BI will be highly considered
with individualistic users, and PEOU, SE, FC, QWL, SN and BI will be highly
considered with collectivistic users.
A number of authors have hypothesised that the relationship between SN and BI
would be stronger in more collectivist cultures due to the views of others in-group
members being considered as more important within such cultures e.g. (Zakour,
2004b; McCoy et al., 2005a; Srite and Karahanna, 2006; Li et al., 2009; Dinev et
al., 2009). Srite and Karahanna (2006) for instance, argue that normative
influences may be a more important determinant of intended behaviour for those

Chapter 3: Theoretical basis and Conceptual Framework
Ali Tarhini 68
who espouse collectivist values. Unfortunately their empirical data did not support
the predicted relationship. Other researchers who predicted this moderating effect
of Individualism/Collectivism but failed to find support from their data include
McCoy et al. (2005a) using a cross-country comparison and Li et al. (2009) using
individual level cultural data. On the other hand Srite (2006) found that while SN
was a significant predictor of BI in a Chinese sample (collectivist culture), there
was no significant effect of SN on BI in the USA (individualistic culture), a result
they attribute as potentially due to the moderating effect of individualism. Dinev
et al. (2009) argued that the relationship was significant for South Koreans
(collectivist) but not for a US sample, but this particular cultural comparison
confounded a number of cultural differences and the authors attribute the result to
a cumulative effect of these differences. Therefore evidence is limited to support
the moderating role of individualism on the effect of SN in technology acceptance
and does not appear to have been investigated explicitly in relation to web-based
learning adoption. We predict that those espousing more collectivist values will be
more likely to be guided by SN in their decision to adopt web-based learning
systems.
Some authors have also suggested that Individualism/Collectivism may play a role
in other TAM relationships. Lee et al. (2007) predicted and found that
Individualism has a direct positive effect on both PU and PEOU. Other authors
have hypothesised a moderating role of Individualism/Collectivism on the
relationship between PU and Behavioural Intention e.g. (McCoy et al., 2005a;
Sánchez-Franco et al., 2009). Individualistic cultures are characterised by an
emphasis on the achievement of individual goals, so PU would appear to be a
highly relevant factor for technology adoption in such settings, relating as it does
to technology as a means for the achievement of specific goals. In an educational
context Sanchez-Franco et al. (2009) predicted that the relationship between PU
and BI would be higher for individualistic users. Their results support this in that
they showed that Nordic (individualist culture) users’ intentions were more
influenced by PU than those of Mediterranean users (collectivist culture). On the
other hand McCoy et al. (2005a) failed to find the predicted difference in a

Chapter 3: Theoretical basis and Conceptual Framework
Ali Tarhini 69
comparison of Uruguay and US samples. We re-examine this potential moderating
effect in an educational setting, using individual level measures of
Individualism/Collectivism, predicting a stronger relationship for those expressing
individualist values. Fewer authors have considered whether the effect of PEOU
might be moderated by Individualism/Collectivism. McCoy et al. (2005b)
explicitly state that they expect no influence of IC here. However, McCoy et al.
(2007) found that the path from PEOU to BI was impaired in collectivist settings
and speculate that people within these settings may be more willing to endure
poor usability so long as they are achieving goals that are valued by the wider
group. We therefore also consider in the current work whether this may be the
case. Furthermore and as TAM demonstrates, PEOU affects individual attitudes
through two mechanisms: instrumentality and SE, and this also can be improved
with the facilitation conditions (Csikszentmihalyi, 2000; Davis, 1989; Bandura,
1997; Thatcher et al., 2003). The rationale could be that users with high
collectivistic cultural values will need training, physical conditions and use of
skills which is associated collectivism.
It is worth noting that Lebanon cultural score is significantly lower on
individualism (value index= 38) compared to England (value index = 89) which is
considered very high on individualism. Therefore, based on previous discussions,
it is expected students with high individualistic values will be more concerned
about the usefulness of the web-based learning system and QWL, while students
with feminine values perceive a higher importance of PEOU, SE, and SN. Hence,
we postulate the following hypotheses:
H13a1,a2,a3,a4,a5,a6: The relationship between (PEOU, PU, SN, QWL, SE, FC) and
Behavioural Intention and actual usage of the web-based learning system is moderated
by the individualism /collectivism value in the British context.
H13b1,b2,b3,b4,b5,b6: The relationship between (PEOU, PU, SN, QWL, SE, FC) and
Behavioural Intention and actual usage of the web-based learning system is moderated
by the individualism /collectivism value in the Lebanese context.
H13c: Individualism mean will be significantly higher in England, compared to Lebanon.

Chapter 3: Theoretical basis and Conceptual Framework
Ali Tarhini 70
3.4.4 Uncertainty Avoidance (UA)
According to Hofstede (1980), UA refers to the extent to which ambiguities and
uncertainties are tolerated. Actually, the level of stress and anxiety for individuals
with high UA increases more when uncertain situation occurs compared to
individuals with low UA (Marcus and Gould, 2000). In other words, individuals
with high UA cultural values will establish formal rules and might reject deviant
ideas and behaviours since it has been associated with anxiety and the need for
security (Hofstede, 1984b). Conversely, individuals with low UA cultural values
might have a greater willingness to take risks (Hofstede, 1984b; Pfeil et al., 2006)
and will feel less anxiety with unfamiliar situations and problems (Dorfman and
Howell, 1988).
Several authors propose a moderating effect of UA in the relationship between SN
and Behavioural Intention e.g. (Zakour, 2004; Kim, 2008; Sanchez-France et al.,
2009; Dinev et al., 2009). The prediction is that SN will be more important in a
high UA context because the opinions of referent groups provide a useful means
for people to reduce the uncertainty associated with the uptake of new technology.
Support for this hypothesis comes from the work of Srite and Karahanna (2006)
and Dinev (2009), while Li et al. (2009) were unable to show a moderating effect
of UA in their study. In an educational context we predict the relationship
between SN and BI will be higher for those espousing high UA values.
UA has also been hypothesised to play a moderating role in a number of TAM
relationships and these have been explored with mixed results as described below.
In an educational context, Sanchez-Franco et al. (2009) predicted that UA would
have a moderating effect on the relationships between both PU and PEOU on BI,
arguing that these factors would help to resolve unclear situations and that this
information would have a relatively greater influence on the behaviour of high
UA samples. They conducted a comparison of samples of educators from Nordic
(high individualism, low UA) and Mediterranean (low individualism, high UA)
cultural settings. The results supported a moderating effect of PEOU on BI, with
PEOU more likely to encourage uptake among the Mediterranean e-learning
Chapter 3: Theoretical basis and Conceptual Framework
Ali Tarhini 71
system users (where UA was higher). However, the results with respect to PU
were counter-intuitive, with PU having a bigger effect on BI for Nordic users (the
lower UA group). This may be due to the confounding impact of individualism
(which was expected, and found, to influence the effect of PU, such that it played
a greater role in the more individualist Nordic culture). This study again illustrates
the difficulties of inference from studies that examine culture at the group, rather
than individual level. McCoy et al. (2007) found that the PU->BI and PEOU->BI
paths in TAM were only significant in high UA settings, not in lower UA settings,
supporting the moderating relationship of these two variables. However, in an
earlier study they failed to find the predicted difference between Uruguay (high
UA) and US (low UA) samples for either PU or PEOU (McCoy et al., 2005a).
The current study re-examines the moderating impact of UA on PEOU effects in
an e-learning context with culture measured at the individual level, predicting that
this factor will play a bigger role for those espousing higher UA values.
On the other hand, the relationship between PU and BI will be stronger for
individuals with low UA cultural values (Parboteeah et al., 2005). Previous
studies suggest that people with an orientation low on UA prefer situations that
are free and not bound by pre-defined rules and regulations (McCoy, 2002). In
such situations, individuals will relatively accept the technology as they are less
likely to be cautious towards technology and therefore perceive the system to be
more useful than those in high UA culture (McCoy et al., 2007; Straub et al.,
1997). In contrast, individuals rated high on UA will feel uncomforTable and thus
will resist to change easily especially in situations in which technology is
dominant and therefore will not perceive the usefulness of technology (Zakour,
2004b; Garfield and Watson, 1997).
Furthermore, the relationship between SE, FC, QWL and BI will be stronger for
individuals with high UA cultural values. This is due to the fact that individuals
with high UA tends to hold lower perceptions of SE and be more concerned about
the risks associated with technology. Adoption and acceptance of technology
involve taking risks and doing something new (Stoneman, 2002). Bandura (1986)

Chapter 3: Theoretical basis and Conceptual Framework
Ali Tarhini 72
argued that the relationship between SE and PEOU are reciprocal to each other.
This means that higher anxieties will decrease the SE and eventually decreasing
the overall performance. In such situations and to reduce uncertainty and anxiety
and improve performance, individuals will rely more on FC from the social
environment (Venkatesh and Morris, 2000; Hwang, 2005). Similarly, individuals
with low UA cultural values are associated with a strong motivation to achieve
and more ambition and therefore will perceive the importance of the technology
on their life.
It is worth noting that Lebanon has higher degree of UA (index value = 68) than
England (index value = 35). Based on the above discussion, we postulate the
following hypotheses in line with this discussion:
H14a1,a2,a3,a4,a5,a6: The relationship between (PEOU, PU, SN, QWL, SE, FC) and
Behavioural Intention and actual usage of the web-based learning system is moderated
by the Uncertainty Avoidance value in the British context.
H14b1,b2,b3,b4,b5,b6: The relationship between (PEOU, PU, SN, QWL, SE, FC) and
Behavioural Intention and actual usage of the web-based learning system is moderated
by the Uncertainty Avoidance value in the Lebanese context.
H14c: Uncertainty Avoidance mean will be significantly higher in Lebanon, compared to
England.
3.5 Individual Characteristics
Beside the first category which comprised of Hofstede’s cultural dimensions,
there are also another category of factors which is individual characteristics
(gender, age, educational level and experience) that may have moderating effects
on the relationships between the core constructs and BI and AU. These variables
will be discussed in the following section sequentially.

Chapter 3: Theoretical basis and Conceptual Framework
Ali Tarhini 73
3.5.1 Gender
The consideration of gender in models of behaviour was introduced in gender
schema theory (Bem, 1981) and other technology acceptance models (e.g. TAM2
and TPB). Previous studies have shown that men and woman are different in
decision-making processes and usually use different socially constructed cognitive
structures (Venkatesh and Morris, 2000).
Previous research has suggested that gender plays an important role in predicting
usage behaviour in the domain of IS research e.g. (Venkatesh and Morris, 2000;
Gefen and Straub, 1997; Porter and Donthu, 2006; Venkatesh et al., 2003; He and
Freeman, 2010; Wang et al., 2009; Morris and Venkatesh, 2000). For example,
Venkatesh et al. (2003) found that the explanatory power of TAM significantly
increased to 52% after the inclusion of gender as a moderator. More specifically,
gender was found to have a moderating impact on the relationships between PU,
PEOU, SE, SN, QWL and BI as well as AU.
Venkatesh et al. (2003) found gender to influence the relationship between
performance expectancy (similar to PU) and BI, with the relationship significantly
stronger for men compared to women. Their findings are consistent with literature
in social psychology, which emphasizes that men are more pragmatic compared to
women and highly task-oriented (Minton et al., 1980). It is also argued that men
usually have a greater emphasis on earnings and motivated by achievement needs
(Hoffmann, 1980; Hofstede and Hofstede, 2005) which is directly related to
usefulness perceptions. This suggests that men place a higher importance on the
usefulness of the system. Their argument is also supported by other researchers
e.g. (Srite and Karahanna, 2006; Venkatesh and Morris, 2000; Terzis and
Economides, 2011). In contrast, Wang et al (2009) did not find any moderating
effect of gender on the relationship between PE (similar to PU), EE (similar to
PEOU) and BI. It is expected that gender will also affect the relationship between
QWL and BI since it focuses on the benefits of the technology and this is
considered a more salient issue for males than females (Kripanont, 2007).

Chapter 3: Theoretical basis and Conceptual Framework
Ali Tarhini 74
In terms of the moderating impact of gender on the relationship between PEOU,
SE, FC, SN and BI, it is expected to be stronger for women compared to men.
Venkatesh et al. (2003) reported that the intention to adopt and use a system is
more highly affected by effort expectancy for women than men. Their results are
consistent with gender role studies (Lynott and McCandless, 2000; Schumacher
and Morahan-Martin, 2001). The reason could be that women generally have
higher computer anxiety and lower SE. The difference is based on the
correlational relationship which is closely related to PEOU, so that higher
computer SE will lead to lowering of the importance of ease of use perception
(Venkatesh and Morris, 2000). This is also supported in previous research in
psychology e.g.(Cooper and Weaver, 2003; Roca et al., 2006) which suggests that
men perceive analytical and competitive approaches to solving problems which
will lead to higher score on self-efficacy (Venkatesh et al., 2004). Furthermore, it
is expected that gender will have an impact on facilitating conditions (FC) and
that the relationship will be stronger for women compared to men. This argument
is based on Hofstede’s cultural theory (Hofstede and Hofstede, 2005) proposition
and more specifically related to masculinity/femininity cultural dimensions, which
indicates that women compared with men rated a higher importance towards FCs
with respect to service aspects and the working environment. Additionally, it has
been found that gender affects the relationship between SN and BI such that the
effect is stronger for women (Venkatesh and Morris, 2000; Venkatesh et al., 2003;
Kripanont, 2007; Huang et al., 2012). Women are found to rely more than men on
others’ opinion (Venkatesh and Morris, 2000; Hofstede and Hofstede, 2005) as
they have a greater awareness of others’ feelings and therefore more easily
motivated by social pressure and affiliation needs than men. Therefore it is
expected that the relationship between SN and BI will be stronger for women than
for men (Wang et al., 2009).
In line with previous discussion, it is expected that the relationship between PU,
QWL and BI will be stronger for male students, whereas the relationship between
PEOU, SE, FC, SN and BI will be stronger for female students. Thus we propose
the following hypotheses:

Chapter 3: Theoretical basis and Conceptual Framework
Ali Tarhini 75
H15a1,a2,a3,a4,a5,a6: The relationship between (PEOU, PU, SN, QWL, SE, FC) and
Behavioural Intention and actual usage of the web-based learning system will be
moderated by the gender in the British context.
H15b1,b2,b3,b4,b5,b6: The relationship between (PEOU, PU, SN, QWL, SE, FC) and
Behavioural Intention and actual usage of the web-based learning system will be
moderated by the gender in the Lebanese context.
3.5.2 Age
Research has shown that age is an important demographic variable that has direct
and moderating effects on behavioural intention, adoption and acceptance of
technology e.g. (Chung et al., 2010; Venkatesh et al., 2003; Wang et al., 2009;
McCoy et al., 2005a; Yousafzai et al., 2007b; King and He, 2006; Walker and
Johnson, 2008; Sun and Zhang, 2006; Akhter, 2003; Porter and Donthu, 2006).
Venkatesh et al. (2003) reported that age was an important moderator within his
UTAUT model. They found that within an organizational context, the
relationships between PE (similar to PU), FC and BI was stronger for younger
employees, while the relationship between EE (similar to PEOU) and SN was
stronger for older employees in accepting and using the technology (Venkatesh et
al., 2003). It could be that age increased the positive effect of SN due to greater
need of affiliation e.g. (Morris and Venkatesh, 2000; Burton-Jones and Hubona,
2006).
In contrast with this, Chung et al. (2010) did not find any moderating effect of age
on the relationship between PEOU, PU and BI in online communities. In sharp
contrast, Wang et al. (2009) found that age differences moderate the relationship
between effort expectancy (similar to PU) and BI and was stronger for older
adults but did not find any moderating effect of age on effort expectancy (similar
to PEOU) and BI. Sun and Zhang (2006) found that the relationship between PU
and BI was stronger for younger adults in the adoption decision. Correspondingly
and since QWL may be correlated with PU since its perceived the importance of
technology on user’s quality of work life, it is expected that the relationship
between QWL and BI will be stronger for younger users. Additionally, with

Chapter 3: Theoretical basis and Conceptual Framework
Ali Tarhini 76
respect to social and psychological influence on the adoption decision, Jones et al.
(2009) found the relationship between SN and BI to be stronger for older adults.
Similarly, Wang et al. (2009) found that age moderates the relationship between
SN and BI, and the effect was stronger for older adults on using m-learning
technology.
Despite the inconsistencies that have been found in previous research about the
direct or moderating effect of Age on the influence of various determinants on
behavioural intention, many researchers support the important role that age plays
in the context of technology acceptance. Therefore, in the context of this study, it
is expected that the effect of age on the relationship between PEOU, SE, SN and
BI will be stronger for older students, while the influence of PU, QWL on BI will
be stronger for younger students. Therefore, we propose the following hypotheses:
H16a1,a2,a3,a4,a5,a6: The relationship between (PEOU, PU, SN, QWL, SE, FC) and
Behavioural Intention and actual usage of the web-based learning system will be
moderated by the age in the British context.
H16b1,b2,b3,b4,b5,b6: The relationship between (PEOU, PU, SN, QWL, SE, FC) and
Behavioural Intention and actual usage of the web-based learning system will be
moderated by the age in the Lebanese context.
3.5.3 Educational level
In previous studies, education level was related to knowledge and skills which in
turns affect the behavioural beliefs (PU and PEOU) towards acceptance and usage
of new technologies (Rogers, 2003; Agarwal and Prasad, 1999). Educational
level, like other individual factors, has been studied as an antecedent of PU or
PEOU (Agarwal and Prasad, 1999) and as a moderator that affects the relationship
between main determinates and behavioural intention (Burton-Jones and Hubona,
2006). In particular, educational level was found to influence the relationships
between PEOU, PU, SN and BI (Porter and Donthu, 2006; Rogers, 2003; Sun and
Zhang, 2006; Zakaria, 2001; Mahmood et al., 2001; Burton-Jones and Hubona,
2006).

Chapter 3: Theoretical basis and Conceptual Framework
Ali Tarhini 77
Venkatesh et al. (2000) found a positive correlation between the level of
education and PU. Similarly, Burton-Jones and Hubona (2006) suggested that
higher education level leads to positive association with PU and those users are
less sensitive to PEOU since it will reduce the computer anxiety and improve the
overall attitude. In contrast, Agarwal and Prasad (1999) found that there was no
relationship between educational level and PU, but there was with PEOU.
Similarly, Al-Gahtani (2008) found that educational level only moderates the
influence of PEOU on BI, while no moderating impact were found on the
relationship between PU and BI towards using computer applications on a
voluntary basis in the context of Arab countries. Abu-Shanab (2011) found a
moderating effect of educational level on the relationship between most of the key
determinants of UTAUT and acceptance of Internet banking in Jordan. Moreover,
educational level was also found to negatively affect the social influence on
behaviour when adopting new technology in an organization as both education
and experience will empower the users (Burton-Jones and Hubona, 2006;
Lymperopoulos and Chaniotakis, 2005).
The moderating impact of educational level on the relationship between quality of
life and behavioural intention has not been investigated in literature. Nevertheless,
it is expected that educational level will have an impact on the relationship
between QWL and BI such that the relationship will be stronger for students with
higher educational level. The rationale is that students who have higher level of
education will perceive the web-based learning system and value the impact of
this system on their career.
Despite mixed results, however the moderating role that educational level can
play on the adoption and acceptance of technology is indisputable (see meta-
analysis of Mahmood et al. (2001) and Sun and Zhang (2006)). Hence, in the
context of this study, it is expected that the relationships between (PU, QWL) and
BI will be stronger for users with higher educational level, while the relationships
between (SN, PEOU) will be stronger for users with lower educational level. We
thus propose the following hypotheses:

Chapter 3: Theoretical basis and Conceptual Framework
Ali Tarhini 78
H17a1,a2,a3,a4,a5,a6: The relationship between (PEOU, PU, SN, QWL, SE, FC) and
Behavioural Intention and actual usage of the web-based learning system will be
moderated by Educational Level in the British context.
H17b1,b2,b3,b4,b5,b6: The relationship between (PEOU, PU, SN, QWL, SE, FC) and
Behavioural Intention and actual usage of the web-based learning system will be
moderated by Educational Level in the Lebanese context.
3.5.4 Experience
The concept of experience refers to the involvement of an individual in something
over a period of time. In the technology context, an individuals’ experience is
measured by the level of experience and number of years in using a specific
technology and will result in a stronger and more stable behavioural intention
relationship (Venkatesh and Morris, 2000; Venkatesh et al., 2003; Poon, 2007).
Users may employ the knowledge that have gained from their prior experience to
form their intentions (Fishbein and Ajzen, 1975). Experience was not incorporated
in the original TPB and DTPB; however it was added later after follow-on studies
due to its importance on the intentions (Morris and Venkatesh, 2000). Moreover,
TAM2 clearly incorporated Experience as a moderator that affects the relationship
between main determinants and behavioural intention (Venkatesh and Davis,
2000).
Previous research has found that a user’s degree of relevant experience moderates
a number of relationships within TAM e.g. (Lymperopoulos and Chaniotakis,
2005; Al-Jabri and Al-Khaldi, 1997; Venkatesh et al., 2003; Venkatesh and Bala,
2008). The relationship between behavioural intention and usage was empirically
confirmed to be more statistically significant for expert users compared to novice
users (Taylor and Todd, 1995b; Venkatesh et al., 2004; Venkatesh and Davis,
2000) and thus experience will have a positive influence on the strength of the
relationship between BI and AU.
As for PU, Taylor and Todd (1995a) reported that experience significantly
moderates the relationship of PU and BI such that the relationship was stronger
for experienced users. This means that experienced users tended to give less

Chapter 3: Theoretical basis and Conceptual Framework
Ali Tarhini 79
consideration on PU and based their consideration to control information in
formation their intentions (Taylor & Todd 1995a). In contrast, Venkatesh et al.
(2003) did not find a significant moderating effect of experience on the
relationship between PE on BI. This suggested that PU has a strong impact on BI
for inexperienced users.
Additionally, the moderating effect of experience on the relationship between
PEOU and BI is clear and stable in the literature (Venkatesh and Davis, 2000;
Venkatesh and Morris, 2000). Generally speaking, when users have prior
knowledge in using the technology, this will provide the users a more robust base
to learn as users will relate their incoming information with what they already
know (Cohen and Levinthal, 1990). In other words, experienced users will
perceive PEOU as not a big issue when learning a new technology (Taylor and
Todd, 1995a; Venkatesh et al., 2003). Venkatesh (2002) found that the direct
influence of PEOU on BI will decrease over time due to the experience that
individuals obtain during the time using the system. In contrast, inexperienced
users with no prior knowledge will prefer to use the technology which is easy to
use.
With respect to SN, empirical evidence has demonstrated that experience was also
found to significantly moderate the relationship between SN on BI (Venkatesh
and Davis, 2000; Venkatesh and Morris, 2000). Venkatesh and Davis (2000)
argued that the influence of SN on BI will decrease over time. Where users
already have extensive experience, the role of SN will be expected to be lower as
users are more able to draw on their own past experiences to shape their
perception rather than the opinions of others (Venkatesh and Davis, 2000;
Venkatesh and Morris, 2000). Similarly, Karahanna, Straub & Chervany (1999)
found that inexperienced users are more driven by SN than experienced users. It is
expected that the relationship will be stronger for inexperienced users since they
will be more sensitive to their colleagues’ opinion (Venkatesh et al., 2003).
In terms of self-efficacy and facilitating conditions, it is noteworthy to mention
that SE has been studied as a direct determinant and moderators on behavioural
Chapter 3: Theoretical basis and Conceptual Framework
Ali Tarhini 80
intention and usage behaviour to use the technology and is similar to “indirect”
experience e.g. (Park et al., 2012; Vijayasarathy, 2004; Ong and Lai, 2006; Roca
et al., 2006). In addition, experience was found to influence the relationship
between FC and BI (Venkatesh et al., 2003). The authors found that the
relationship was stronger for experience. They suggested that when the experience
increases, this will lead to user’s wider options for help and support and this will
lead to more usage of the system.
In the context of this study, it is expected that experience will play an important
role on the relationship between key predictors and BI to use the web-based
learning system. It is expected that when students experience increases; they will
be more aware of the benefits of the web-based learning system on their education
e.g. (Evanschitzky and Wunderlich, 2006; Stoel and Lee, 2003). Therefore, we
propose the following hypotheses:
H18a1,a2,a3,a4,a5,a6: The relationship between (PEOU, PU, SN, QWL, SE, FC) and
Behavioural Intention and actual usage of the web-based learning system will be
moderated by Experience in the British context.
H18b1,b2,b3,b4,b5,b6: The relationship between (PEOU, PU, SN, QWL, SE, FC) and
Behavioural Intention and actual usage of the web-based learning system will be
moderated by Experience in the Lebanese context.
3.6 Conclusion
In this chapter we proposed a theoretical framework that might be helpful in
understanding the various factors that are expected to influence the adoption and
acceptance of web-based learning systems in Lebanon and England in the context
of an HEI. The research model is based on prominent well known technology
acceptance models and theories that have been discussed in Chapter 2, e.g. TAM,
TAM2, TRA, DTPB and UTAUT which are relevant to the context of this
research.
These factors reflect personal, social, cultural and organisational factors and
specifically include PEOU, PU, SN, FC, SE, QWL, BI and AU. In addition,

Chapter 3: Theoretical basis and Conceptual Framework
Ali Tarhini 81
culture and demographic characteristics were integrated as two sets of moderators
in the model.
Therefore this research proposes and tests three types of hypotheses, in the first
category, this study proposes 10 direct hypotheses from H1 to H10. In the second
category, 4 individual characteristics and 4 cultural variables were hypothesised to
have a moderating impact on the relationship between the main determinants and
BI. While in the third category, 12 hypotheses were proposed to test the
differences between the Lebanese and British sample at the national level. It is
expected that extending the TAM to include SN, SE, QWL and FC, in addition to
the two sets of moderators, may help in explaining more of the variance of
behavioural intention and actual usage as well as explore reasons for why the
model may hold better in some contexts than others.
The conceptual framework will be tested empirically in two countries, Lebanon
and England, to achieve the objective of the research, as discussed in previous
chapters. Therefore, the next chapter discusses the chosen methodology, and
include a detailed explanation of the method of data collection, questionnaire
development and the various tools to be used for the data analysis.

Chapter 4: Research Design & Methodology
Ali Tarhini 82
Chapter 4: Research Design & Methodology
“The Formulation of the problem is often more essential than its solution” Albert
Einstein
4.1 Introduction
Chapter 2 reviewed the theories and concepts in technology acceptance and
culture. In Chapter 3, the conceptual model was developed to examine the
influence of culture and other demographic characteristics on the acceptance of
web-based learning system in Lebanon and England. This chapter describes and
justifies the philosophical approach, methods and techniques used in this research
to achieve the main research objectives and to answer the research questions.
Technically speaking, this research employed a quantitative method in order to
understand and validate the conceptual framework. A survey research approach
based on positivism was employed to guide the research. Questionnaire was used
as a data collection technique. Additionally, SEM using AMOS version 18.0 was
employed as a data analysis technique.
This chapter is structured as follows. Sections 4.2 and 4.3 examine the
philosophical assumptions with a justification and focus on the reasons behind
choosing the positivist epistemology and ontology which form the basis of this
research. Section 4.4 discusses two main research strategies qualitative and
quantitative with a discussion focus on the justification for the selection of
quantitative research strategy. Section 4.5 discusses the different research
approaches available in the IS field and justifies the use of survey research
approach in this study. Section 4.6 describes the research design and the research
framework. Section 4.7 explains the different available sampling strategies with a
Chapter 4: Research Design & Methodology
Ali Tarhini 83
justification of using convenience sampling technique in this research in. Sections
4.8 and 4.9 describe the different stages in developing the questionnaire and
measurement scales. Section 4.10 provides an overview of the pilot study. Section
4.11 outlines the issues related to data analysis and techniques using SEM with
AMOS. Before concluding this chapter in Section 4.13, the ethical considerations
related to this research are reported in Section 4.12.
4.2 Underlying research Assumptions
According to Denzin and Lincoln (2005), paradigms are a broad framework of
perceptions, beliefs, and feelings with which theories and practice operate. For
Guba and Lincoln (1994), research philosophies are the set of feelings about how
the world works (ontology) and how it should be understood (epistemology) and
studied (methodology). Whereas ontology raises questions about the nature and
form of reality to be known, epistemology raises questions about nature of the
relationship of the Knower (researcher) and what can be known (the problem
under investigation). Methodology refers to general principles which underline
how we investigate the social world and how we demonstrate that the knowledge
generated is valid (Blaikie, 2000; Mingers, 2003; Orlikowski and Baroudi, 1991).
According to Guba and Lincoln (1994) and Lincoln et al. (2011), positivism, post-
positivism, critical theory and constructivism or interpretivism are the 4 schools or
thoughts that underline the major paradigms that structure the social science
research.
According to Orlikowski and Baroudi (1991), a research is positivist if there was
evidence of formal propositions, quantifiable measures of variables, hypothesis
testing, and the drawing of inferences about a phenomenon from the sample to a
stated population (Orlikowski and Baroudi, 1991). For Straub et al. (2005),
positivism was described from the statistical viewpoint. They argued that the
objective of statistics is to falsify the null hypothesis. Thus, the theoretical
hypothesis is supported if the null hypothesis is rejected (Struab et al., 2005). In
previous IS studies, the positivism approach was the dominant between the other

Chapter 4: Research Design & Methodology
Ali Tarhini 84
3 approaches with more than 75% research employing this school of thought, 17%
interpretivist and only 5% critical research (Mingers, 2003). Examples of
positivist include the work of (Yin, 2009; Straub et al., 2004; Walsham, 1995;
Galliers, 1992). This research employs positivist approach since it includes
research hypothesis testing (Chapters 5 and 6) and quantifiable measures of
variables (Chapter 3) towards web-based learning systems adoption and also
provides evidence of propositions (Chapter 2). A further discussion of selecting
this approach is provided in the next section.
Post-positivist approach is positioned between positivism and interpretivism
(Lincoln et al., 2011). Post-positivists recognise that; when studying the
behaviour and actions of humans; the researchers cannot be ‘positive’ about their
claims of knowledge (Creswell, 2008). The findings that the researchers obtain
from the post-positivist studies are based on observation and measurement of the
objective reality that usually exists ‘out there’ in the world. There is no difference
in kind between positivist and post-positivist approach, only a difference in
degree. Both approaches conduct empirical and quantitative research (Creswell,
2008). This school of thought was not chosen since there is no lack of values and
ethical questioning in our theoretical model. The constructs used in this study
were heavily applied within information systems acceptance and tested within
North American and Western countries. Therefore, post-positivist would need
more effort, money and thus wasting a lot of time. Additionally, this approach
fails to explain the unpredicTable nature of human (Onwuegbuzie, 2002).
Walsham (1993) described interpretivism research in terms of “aiming at
producing an understanding of the context of the information system, and the
process whereby the information system influences and is influenced by the
context”(p.4-5). According to Bryman and Bell (2011), in an interpretative
research, the access to reality will be achieved through social actors and
constructions. Contrary to the positivist research, interpretive research does not
predefine dependent and independent variables (Kaplan and Maxwell, 2005).
Although this school of thought produces deep insights into social phenomena

Chapter 4: Research Design & Methodology
Ali Tarhini 85
since it employs qualitative data collection (Myers and Avison, 1997; Struab et
al., 2005). It lacks the ability to generalise the findings to larger population
(Winfield, 1991) and thus considered to be less appropriate to our research
compared with positivist approach.
According to Myers and Avison (1997), critical researches assume that “social
reality is historically constituted and that it is produced and reproduced by people.
Although people can consciously act to change their social and economic
circumstances, critical researchers recognise that their ability to do so is
constrained by various forms of social, ethnic and political domination” (Myers
and Avison, 1997, p.7). Interview and observation are the two main methods of
enquiry in critical studies (Bryman and Bell, 2011). As previously mentioned and
similar to interpretivist approach, this school of thoughts was considered to be less
relevant for our research compared to positivist approach. Critical research is still
immature and unclear as a legitimate approach in the IS discipline since it lacks an
agreed theoretical basis (Falconer, 2008; Kvasny and Richardson, 2006).
Furthermore, some other researchers describe it as “a missing paradigm” in IS
research due to the little research that consider this approach (Chen and
Hirschheim, 2004; Richardson and Robinson, 2007).
4.3 Choosing the Positivism Paradigm for Our
Research
The positivist approach was selected after considering the differences between all
the other three underlying approaches and the nature of the study being addressed
(Hall and Howard, 2008). More specifically, choosing this approach was based on
the following points:
As previously mentioned, the positivist approach was the dominant
between the other 3 approaches with more than 75% research employs this
approach (Mingers, 2003) and especially in the adoption and technology
acceptance research.

Chapter 4: Research Design & Methodology
Ali Tarhini 86
This research aims to investigate the moderating effect of culture and
demographic variables on e-learning behaviour within two culturally
different contexts (Lebanon and United Kingdom). Exploring the direct
impact of student’s acceptance beliefs on technology acceptance was also
a part of the study. Thus, this research is related to social subjects where
student’s behaviour is measured and where the researcher is isolated from
the aim of the study (Saunders et al., 2009). Therefore, the positivist
approach was justifiable from the ontological point of view.
This research posits a number of hypothesised relationships to be tested
and quantitatively measured within the context of technology acceptance.
The positivist approach is mostly linked with Quantitative methodology,
which in turn uses a deductive process (Bryman, 2008). Therefore, this
research is also justified from the methodological point of view.
The purpose of the research requires a well-defined conceptual framework
where the relationships between the constructs are clearly defined and with
precise measurements. In the current study, a number of constructs about
the adoption and technology acceptance from many developed and
validated theories and models were used and presented in Chapter 2.
Therefore, this research is justified from the epistemological perspective.
This research will use Structural Equation Modelling technique in order to
test hypotheses and moderators and to perform a number of tests such as
group comparisons (Chapters 5 and 6). The statistical packages used
describe the positivist approach (Struab et al., 2005).
Having discussed the reasons behind choosing the positivist paradigm for this
research, the following section describes the research method.
4.4 Strategy of Inquiry: Quantitative and
Qualitative
The next step after underlying philosophical assumptions is the research method.
This stage is focused on the research design and data collection methods and

Chapter 4: Research Design & Methodology
Ali Tarhini 87
techniques. The choice to employ a qualitative or quantitative methodology will
influence how to collect the data in later stages of the research. This section
discusses the differences between the two approaches in order to justify
employing the quantitative approach in this research.
According to Bryman (2008), quantitative research methods seek to collect
numerical data and verify the relationships between measureable variables in a
universal cause-effect way. Furthermore, quantitative methods use a deductive
approach that is associated with hypothesis testing in order to modify or support
the existing theory (David and Sutton, 2004). They are linked mainly with
positivist epistemology which uses scientific procedures and involves statistical
methods and usually presents data numerically (Creswell, 2008). On the other
hand, qualitative research methods tend to explore and discover meanings and
patterns instead of numbers (Creswell, 2008). The research of a qualitative nature
employs an inductive approach to derive the theories through the process of
collecting and analysing the data (Punch and Punch, 2005; Creswell, 2008). Table
4.1 summarises the differences that are agreed upon between qualitative and
quantitative according to Johnson and Christensen (2010) and Lichtman (2006).

Chapter 4: Research Design & Methodology
Ali Tarhini 88
Criteria Qualitative Research Quantitative Research
Aim /Purpose To understand and interpret
social interactions in order to
provide a complete
description.
To test hypotheses, look at
cause and effect, and
generalise results.
Group Studied Smaller & not randomly
selected.
Larger & randomly
selected.
Type of Data Collected Words, pictures, or objects. Numbers and statistics.
Nature of Reality and
Form of Data Collected
Multiple realities;
subjectivity is expected (In-
depth interviews, open-
ended responses, participant
observations).
Single reality; Objectivity
is critical (precise
measurements using
validated data-collection
instruments).
Type of Data Analysis Identify patterns, features,
themes.
Identify statistical
relationships.
Role of Researcher Researcher may influence
the participants (Subjectivity
is expected).
Researcher cannot
influence the participants.
The characteristics of the
participants are
intentionally hidden from
the researcher.
Results The results are less
generalisable, and the
findings are particular and
specialised to a certain
subject.
The findings are more
generalisable and can be
applied to different
contexts and other
populations.
Scientific Method Exploratory or bottom–up. Confirmatory or top-down.
Research Objectives Explore, discover, and
construct.
Describe, explain, and
predict.
Table 4-1: Qualitative versus Quantitative research (Source: Johnson and
Christensen, 2010; Lichtman, 2006)
The use of a quantitative research strategy which is rooted in the positivist
ontology is supported by various researchers in the domain of information
systems (Yin, 2009; Straub et al., 2004; Walsham, 1995; Galliers, 1992). This
research aims to examine and test hypothesised relationships within the context of
technology acceptance in an objective manner where the researcher is isolated
from the aim of the study. Additionally, the constructs and their relationships used
within the conceptual model were developed and validated thoroughly in the
theories and models about the adoption and technology acceptance (see Chapter
2). Furthermore, data survey method was employed to collect data from a large
number of participants in order to analyse the data using SEM technique and this

Chapter 4: Research Design & Methodology
Ali Tarhini 89
data was generally presented in numbers and thus belong to the quantitative
strategy rather than qualitative (Bryman, 2008; Creswell, 2008).
After the justification for the quantitative research approach, the next section
explains the data collection methodology employed in this research.
4.5 Survey Research Approach
There are a number of different research approaches that have been used in
literature when conducting any research, including field experiment, lab
experiment, field study, phonological research, narrative research, opinion
research, ethnography, grounded theory (Creswell, 2008; Guba and Lincoln, 1994;
Neuman, 2006; Crotty, 1998; Orlikowski and Baroudi, 1991). For the current
research, the researcher employed the survey approach in order to collect data
from the participants in both Lebanon and England for the following reasons:
Survey research approach is the most dominant approach (with at least
50% of the total number of articles) used in information system journals
(e.g, European Journal of Information Systems, MIS Quarterly, Journal of
Information System for example see (Mingers, 2003; Orlikowski and
Baroudi, 1991; Choudrie and Dwivedi, 2005).
Survey approach is most widely considered within technology adoption
research, for example Mingers (2003) found out that more than 74 % of
the articles in the previously mentioned journals that are related to the
technology adoption employed survey research, while the case study
method were employed by the remaining 26% only. For examples see
Venkatesh and Davis (2000), Venkatesh and Morris (2000), Srite and
Karahanna (2006), Venkatesh and Bala (2008).
This study aims to examine the individuals’ technology acceptance
behaviour within Lebanon and England which involves collecting data
from a large number of participants especially when using Structural
Equation Modelling (SEM) technique in data analysis, employing another

Chapter 4: Research Design & Methodology
Ali Tarhini 90
research approach will be very expensive and time-consuming (Hair et al.,
2010).
A number of research hypotheses need to be empirically tested within the
proposed conceptual model (see Chapter 3) which is only appropriate
using the survey research approach.
The survey approach is associated with the research using positivist-
quantitative methodologies (Saunders et al., 2009).
Since a large amount of data is being collected when using the survey
approach, this allows the findings to be generalised to the entire
population.
Another major factor that affects the research approach is the extent to
which a researcher is involved within the context being studied, this
research is related to social subjects where student’s behaviour is
measured and where the researcher is isolated from the aim of the study
(Saunders et al., 2009); therefore it is more appropriate and feasible to use
survey approach than others such as ethnography and case studies.
Within the survey research approach, data is usually collected through a number
of methods such as mail, telephone interview, email, and self-administrated
questionnaire (Zikmund, 2009). This research employed the self-administrated
questionnaire as a data collection method for the following reasons:
Data can be collected from a large number of participants simultaneously
in a quick, easy, efficient and economical way compared with other
methods such as interviews (Zikmund, 2009; Bryman, 2008; Sekaran and
Bougie, 2011).
It is easily designed and administrated. For example, interviews usually
require much administrative skills (Sekaran and Bougie, 2011).
Higher privacy of respondents because issues such as anonymity and
confidentiality were dealt with in the cover letter.
Collecting the questionnaires immediately after being completed will
assure a higher response rate (Sekaran and Bougie, 2011).

Chapter 4: Research Design & Methodology
Ali Tarhini 91
Respondents can seek clarity and therefore could understand the concepts
on any question they are answering which in turns minimise the outliers in
the study (Aaker et al., 2009).
A questionnaire as a data collection method has been widely used in
studies similar to the context of this study. For example see, Venkatesh
and Morris (2000), Venkatesh and Bala (2008), Srite and Karahanna
(2006).
The next section explains the research design and summarises the overall research
framework.
4.6 Research Design
According to Bryman and Bell (2011), a research design provides an overall
guidance and framework for the data collection and analysis of the study. It is
critical in terms of linking the theory and the empirical data collected in order to
answer the research questions (Nachmias and Nachmias, 2008). A choice of an
appropriate research design will influence the use and type of data collection,
sampling techniques, and the budget (Hair et al., 2010). Additionally, when
designing a study the researcher should make a sequence of rational decisions
regarding the purpose of the study, location of the study, the investigation type,
role of the researcher, time horizon and the level of data analysis (Sekaran and
Bougie, 2011).
Based on the guidelines provided by Sekaran and Bougie (2011) about the
research design, the purpose of the current study was to test the hypotheses
generated from the conceptual model. The relationships that exist among variables
can be easily understood through hypothesis testing; as such studies usually
explain the nature of certain relationships among variables. A correlational type of
study (i.e., field studies) is chosen over casual type to delineate the variables that
are associated with the research objectives and examine the salient relationships
between the main determinants of an individual’s behaviour with a set of

Chapter 4: Research Design & Methodology
Ali Tarhini 92
individual differences in a non-Western nation compared to a Western nation.
This study is conducted in a non-contrived setting which is similar to all studies
that use a correlation type of investigation. Since the data collection method used
in this study was based on survey, therefore there was no intervention from the
researcher. Furthermore, based on the aims and objective of the research it was
obvious that the unit of analysis is an individual university student within
Lebanon and England. This study selected a cross-sectional design as data can be
collected just once and over a fixed period of time due to the fact that using SEM
requires a relatively large number of respondents and it is beyond the timeframe
of this research to collect longitudinal data in a different time in order to examine
the change in the dependent variables.
Figure 4.1 illustrates the research design followed in this research which is based
on a sequence of interrelated step by step process (Sarantakos, 1993). The
literature review (Chapter 2) was critical in the first stage to gain a deep
understanding about the research problem. A conceptual model with constructs
was developed in order to test the generated hypotheses (Chapter 3). In the later
stage, the decisions about how to go about finding the solution to the research
problem was through methodology (Chapter 4), for example collecting data using
a quantitative methods, stages in the development of survey (validity, pilot test),
sampling technique and data collection process. To test the proposed model, a
descriptive analysis of the collected data was essential (Chapter 5), where Chapter
6 provides the results of testing the research model. The final step was the
discussion (Chapter 7); it is then followed by conclusion and future work in the
final chapter (Chapter 8).

Chapter 4: Research Design & Methodology
Ali Tarhini 93
Figure 4-1: Research Design
4.7 Population and Sampling
Before proceeding to data collection process, the sampling technique is considered
a critical concern to the research in order to represent the targeted population and

Chapter 4: Research Design & Methodology
Ali Tarhini 94
to eliminate the bias in the data collection methods and thus generalise the results
(Bryman and Bell, 2011; Russ-Eft and Preskill, 2009). According to Fowler
(2009), there are four critical issues to be considered when designing the sample
as follows; (1) the choice of probability or non-probability sample technique; (2)
the sample frame; (3) the size of sample; (4) the response rate.
4.7.1 The Sampling choice
It is common for a research to recognise the importance of collecting information
from the respondents that represent the entire population due to time and financial
constraints. According to Blumberg et al. (2008), when designing a sample, the
researcher should consider several decisions and take into account the nature of
the research problem and the specific questions that evolve from the question,
objectives, time and budget. Probability and non-probability are the two types of
sampling techniques (Krathwohl, 2004; Bryman and Bell, 2011). The following
Table (Table 4.3) provides a description about each sampling method within each
sampling technique.
A classification of Sampling technique
Sampling
Technique
1. Probability Sampling
Techniques
a. Simple Random Sampling
b. Systematic Sampling
c. Stratified Sampling
d. Cluster Sampling
e. Other Probability Sampling Techniques
2. Non-probability Sampling
Techniques
a. Convenience Sampling
b. Judgmental Sampling
c. Quota Sampling
d. Snowball Sampling
Table 4-2: A Classification of Sampling Techniques Source: (Groves et al., 2009)
A random selection of the sample is the base of the concept in probability
sampling. This guarantees a controlled procedure to ensure that each person
within the population has a known chance of selection (Groves et al., 2009;
Blumberg et al., 2008). The random probability technique consists of simple
random, stratified, systematic and cluster sampling.

Chapter 4: Research Design & Methodology
Ali Tarhini 95
In Simple Random Sample (SRS) each element of the population has an equal
probability of selection in the sample; this method requires a complete numbered
list of the population where each possible selection of a given size (n) from
probability of size (N), the probability of selection is n/N. Similar to SRS
methods, systematic sampling require a complete list of the population. However,
researchers select the subjects using set skip interval from starting element and
add skip interval to find the next elements until n elements found (N/n). This
method is simpler, quicker, and cheaper than SRS. In stratified random sampling,
two-step process is required, in the first step the researchers tend to partition the
population either proportionally or disproportionally into mutually exclusive and
collectively exhaustive subgroups or strata, while in the second step the
researchers use SRS method sampling in order to select from each subgroups.
Stratified sampling reduces sampling error by increasing precision without
increasing in cost (Blumberg et al., 2008; Bryman and Bell, 2011). In cluster
sampling, researchers tend to reduce the data collection costs by selecting the
sample for the targeted population from a number of small geographic areas. First,
the researcher partitions the population into exclusive and exhaustive subgroups
or clusters. They later use SRS in order to select a random sample of clusters.
After that, for each selected cluster, either includes all the subjects within each
subgroup in the sample are included, or a probability sample of subjects is
selected from each subgroup or cluster in the sample (two-stage). This method is
more cost efficient than other random methods but less statistically efficient.
Contrary to probability sampling, the concept of non-probability sampling is
based on non-random selection of sample and thus not all the elements within the
population has equal or known chance of selection (Blumberg et al., 2008; Groves
et al., 2009). The non-probability sampling technique includes judgmental, quota,
snowball and convenience sampling methods.
In judgmental; also called purposive; sampling, the selection of units from the
targeted population is based on the knowledge and professional judgment of the
researcher. In this method, usually the characteristics of the subjects needed are

Chapter 4: Research Design & Methodology
Ali Tarhini 96
already clear for the researcher. The researcher then targets the potential sample
members in order to check if they are suitable to meet the criteria of the research.
Quota sampling divides the targeted population into control categories and then
the selection of sample is based on convenience or judgment methods to ensure
equal representation of subjects. In snowball sampling, researchers start with an
initial respondent who meets the criteria of the study which is usually chosen
randomly, then other potential subjects are identified and included in the research
based on the recommendations of the initial subjects. This method is used when
the numbers of individuals are limited. This method is time consuming and results
depend on characteristics of the respondents in the sample and thus are hardly
representative of the population. The convenience sampling methods allow the
researcher to select the sample subjects from the targeted population based on
who are willing and easily accessible to be recruited and included in the research.
This method is the least expensive, least time-consuming among all other
techniques. According to Stangor (2010), the convenience sampling method is the
most common used method in behavioural and social science studies (p.151).
Table 4.3 explains the strength and weakness for each of the sampling methods.

Chapter 4: Research Design & Methodology
Ali Tarhini 97
Technique Advantages Disadvantages
Probability sampling
Simple random
sample (SRS)
Easy to implement, analysis, and
interpretation, results projectable.
Require a complete list of
population, expensive, time-
consuming, produces high error
rate.
Systematic Simpler, quicker, cheaper
expensive than SRS. Sampling
distribution of mean or proportion
is easy to be determined.
Costly, lower representative than
SRS, the results and sample may
be skewed due to the periodicity
within the population.
Stratified
random
The sample size in strata is
controlled by researcher. Include
all important subgroups, decrease
sampling error.
Expensive, more complex, and
also researcher should make a
greater effort compared to simple
random; the sample size in strata
must be carefully defined.
Cluster Cost effective, quick, good for
large population, easy to do
without a list of population.
Imprecise, not easy to compute
results, the fact that sub-groups
(clusters) are being homogenous
rather heterogeneous this will lead
to lower statistical efficiency.
Non-probability sampling
Convenience The least expensive, least time-
consuming and administration to
ensure sufficient participants of a
study, most convenient and
common among other methods.
Selection bias, cautious when
generalisation of findings as the
sample is not a representative of
the whole population.
Judgmental or
Purposive
Low cost, not time-consuming,
ensures balance of group sizes.
The subjectivity of the researcher
may lead to bias and thus
reliability and generalisability of
the results may be questionable.
Quota Low cost, and not time-
consuming, the researcher select
subgroups with controlled
characteristics and number of
participants of which is related to
the study.
Results depends on the
characteristics of the respondents
within the sample and thus not
easy to defensible the results as a
representative of targeted
population.
Snowball It is very efficient where
individuals are very rare. It is also
possible to include participants
even if there is no known list in
advance.
Time-consuming, questionable to
guarantee whether the sample is a
representative of the entire
population.
Table 4-3: Advantages and disadvantages of the sampling methods Source:
(Blumberg et al., 2008; Black, 1999)

Chapter 4: Research Design & Methodology
Ali Tarhini 98
Based on the previous discussion of the sampling techniques and methods, the
next section is explaining the reasons behind employing the convenience sampling
technique in this research.
4.7.2 The justifications behind using Convenience
sampling in this research
As previously mentioned, the convenience sampling method is the most
commonly used method in behavioural and social science studies. This method
allows the researcher to select the sample subjects from the targeted population
based on who is willing and easily accessible to be recruited in the research. This
method is the least expensive and least time-consuming among all other
techniques. In the present study, it was not feasible to access data to allow random
sampling to take place, as well as time and budget constraints led to decision to
employ the non-random approach with the potential to greatly collect the sample
sizes needed for the analysis.
The targeted population are Lebanese and British students studying full time at
universities and higher educational institutions who use web-based learning
system. Those students share many common similarities. For example, the
participants are all university students with very close age groups, and balance in
representation of gender (53 % male and 47 % female). In terms of technology
and Internet usage, it was found that they are mostly intermediate or expert in
using web-based learning system.
This research employed convenience sampling technique in collecting data which
assumes homogeneous population and thus generalisation of results to the entire
population should be done with caution. Based on the characteristics of the
respondents in this study which also share many similarities with other university
students demographically and in technology usage, then it could be argued that a
random sampling was partially used.

Chapter 4: Research Design & Methodology
Ali Tarhini 99
Furthermore, in a statistical meta-analysis study of applying the TAM within the
field of information system, King and He (2006) used 88 published studies to
analyse the conditions where TAM may produce different results based on user
types and usage types, they included that “in terms of type of user and type of use
demonstrated that professionals and general users produce quite different results.
However, students, who are often used as convenience sample respondents in
TAM studies, are not exactly like either of the other two groups”. Moreover,
several of other similar studies that involve students used the convenience
sampling and have contributed valuable results, for example:
a) Comparison at national culture and e-learning acceptance (Sánchez-Franco
et al., 2009; Li and Kirkup, 2007; Keller et al., 2007).
b) Cross-cultural and perceptions of web-based learning systems (Arenas-
Gaitán et al., 2011; Teo et al., 2008).
c) Individual-level culture and technology (Srite and Karahanna, 2006; Min
et al., 2009).
d) Behaviour towards using web-based learning systems (Zhang et al., 2008;
Martinez-Torres et al., 2008; Liaw and Huang, 2011).
Additionally, in an attempt not to limit collecting data from one geographical area
and to increase the reliability of the findings of this study, participants from 2
different universities in Lebanon and one central university in England were
targeted.
Since the target population for this research is too large especially in England, this
thesis adopted the convenience sampling method based on previous discussion
and due to time and financial constraints.
4.7.3 Population
For Zikmund (2009), the target population are the entire group of subjects by
which the researcher is interested to investigate to answer the research objectives.

Chapter 4: Research Design & Methodology
Ali Tarhini 100
Four categories defined for the population are inclusion, exclusion, expected
effect size and feasibility (Light et al., 1990).
With respect to the Lebanese population in this thesis, based on statistics retrieved
from the official website of the Center of Educational Research and Development
in Lebanon (http://crdp.org/CRDP/English/en_construction.asp) for the year
2006-07, there are 41 private higher educational institutions and one public. Based
on the categories of private higher institutions, there are 18 universities and 23
institutes. The total number students studying full time for the academic year 2011
was 160,364, with 45% studying in the Lebanese University and 55% studying in
private institutions.
With respect to the target population in England, according to the Higher
Education Statistics Agency (HESA)
(http://www.hesa.ac.uk/index.php/content/view/1973/239/), there are 130
universities based on different geographical areas, of which 82 universities uses e-
learning tools to support face to face education. The total number of British
students is 1746060, of which 76.5 % are undergraduate students, and 68.5% are
in full-time education.
In terms of inclusion criteria, this study targets all Lebanese and British full time
students from those 100 universities (18 in Lebanon and 82 in England) who use
web-based learning system in their education.
Regarding the feasibility criteria, the data has been collected from 2 universities
located in the capital of Lebanon (Beirut) and one central university (Brunel
University) from the capital of England (London). Regarding the exclusion
criteria, the UK sample excluded non-British students who studies in England,
whereas the Lebanese sample excluded students studying in the only public
university in Lebanon (The Lebanese University). Also, in terms of mode of
study, part time students from both countries were excluded. This study also
excluded students where the use of web-learning systems in the education is
voluntary.

Chapter 4: Research Design & Methodology
Ali Tarhini 101
4.7.4 Sample Size
It is critical for the research to specify the sample size within the targeted
population. According to Bryman (2011), using a large sample within the study
cannot guarantee precision and thus will waste time and money. On the contrary,
using a small size especially when statistical data analysis such as SEM is
required will result in lower accuracy of the results (Hair et al., 2010). The
targeted population within this study was very large especially in England.
Therefore, the sample size was determined based on the rules of thumb for using
structural equation modelling within AMOS. According to Roscoe (1975), the
following rules of thumb should be considered when considering the sample size:
a) Sample size > 30 and < 500 are appropriate for most research.
b) When categorising the sample into sub-groups (e.g., older/younger,
postgraduate /undergraduate), a minimum size of 30 is required within
each category.
c) In multivariate research (e.g., SEM), the required sample size should
exceed by several times (preferably 10 times) the number of variables
within the proposed framework or study.
Similarly, Kline (2010) suggested that a sample of 200 or larger are appropriate
for a complicated path model. While a sample size varies between 50 and 1000 of
which 50 as very poor and 1000 as excellent (Comrey and Lee, 1992).
Accordingly, Hair et al. (2010) recommended that a sample size should be
estimated in terms of the number of respondents per estimated parameter, and
therefore should consider the complexity of the model which takes into account
the number of constructs and variables within the model. For example, a sample
size of 400 or more is required for a model with 6 or more constructs with 3
indicators in each. Additionally, Schreiber et al. (2006) suggested that a generally
agreed-on value is 10 respondents for every estimated parameter within the
model.

Chapter 4: Research Design & Methodology
Ali Tarhini 102
In line with the above suggestions about SEM assumptions (Schreiber et al., 2006;
Hair et al., 2010), and considering the complexity of the proposed model in terms
of variables and ratio of respondents (estimation of approximately 48 parameters),
the sample size required from each of the two countries should be at least 400.
4.7.5 Execution of the sampling process
For the present study, the selection of participants from Lebanon and England
were based on participants’ availability and the researcher self-selection. As
previously discussed, this method of selection might affect the generalizability of
the results to the entire population as there is no equal chance for other students to
participate in the study. However, based on the literature about the effect of user
types and usage types in the TAM results, students share many similarities and
thus produce similar results (King and He, 2006). Therefore, the effect of this
method on generalizability of the results is decreased to minimum.
4.7.6 Non-response bias
The sample is intended to be a representative of the entire population, and thus a
relatively high response rate to acquire a large sample will increase the level of
confidence and decrease the bias from the collected data (Saunders et al., 2009).
There are two reasons of non-response: (1) refusal to respond to individual
questions, (e.g. leaving a few blank questions); and (2) refusal to respond to any
questions without even giving a reason (Saunders et al., 2009). When a relatively
high rate of non-response occurs, there is a high risk to effect the validity of the
survey.
The non-response bias occurs when those who respond differ in the outcome
variable from those who do not respond. The type of data collection methods
relatively affects the nature of bias. For example, a high non-response bias occurs
when using postal survey, telephone or even interview. For the current study,
taking into account that better-educated people (i.e., students) will return the

Chapter 4: Research Design & Methodology
Ali Tarhini 103
questionnaire within a reasonable rate compared to those who are less educated
(Fowler, 2009) and in an attempt to reduce the bias to minimum, this research
used a paper-based questionnaire to collect the data.
Furthermore, based on the pre-test and pilot study results of the questionnaire
(Chapter 4), a high response rate were acquired with also a high satisfaction about
the length, clarity of wording and layout of the self-administrated questionnaire.
Therefore, this will also help reducing the bias in the research. Additionally, a
case deletion is performed with all the biased questionnaires in this study.
4.8 Data collection Development
In this section, the researcher presents the different stages of developing the
questionnaire, instrument pre-testing and pilot study.
4.8.1 Questionnaire Design and Development
A questionnaire was developed to collect the data required to answer the research
questions and thus achieve the main objectives of the study (Saunders et al.,
2009). The questionnaire items were mainly obtained from reviewing the
literature about technology acceptance models, culture and e-learning outlined in
Chapter 2 and more specifically based on the proposed framework and the
research hypotheses outlined in Chapter 3. This research followed Sekaran and
Bougie’s (2011) and Ghauriand Grønhaug’s (2005) procedures to develop a
questionnaire which is based on 1) conceptualisation of each construct and 2)
operationalise the constructs.
In order to assure that there are neither ambiguous nor confusing questions and
keeping in mind the main objective of the research, the questionnaire design went
through different stages and took over a year before it was finalised (from
November 2010 till September 2011). The questionnaire consisted of 4 pages, a
consent form and a cover letter. The purpose of the study was briefly explained to
the respondents in the covering letter with other information, which indicate that

Chapter 4: Research Design & Methodology
Ali Tarhini 104
their participation will be strictly confidential (see Appendix A & B). The main
questionnaire consisted of 6 sections. Section A includes the moderating
demographic variables such as gender, age, educational level and Internet and
web-based learning experience. Sections B, C, D and E covered the direct
determinates within the proposed conceptual framework, while section F covered
the 4 moderating cultural variables. The conceptualisation and operationalisation
of the constructs and their variables used in the questionnaire are measured as
follows:
Section A: this section includes the demographic background of the participants
Demographics characteristics: refer to nationality, gender, age and
educational level. These variables are comprised in 4 questions (Q1-Q4)
all measured on nominal scale and were measured as moderators within
the proposed conceptual model. These questions were critical so they were
put in the first part of the questionnaire.
Experience: refers to individual’s experience in using web-based learning
systems and general Internet skills. This moderator is measured on a
nominal scale and consisted of one question (Q6).
Section B: this section includes the main determinants of TAM
PU: refers to the degree to which an individual believes that using the
web-based learning system would enhance his or her performance (Davis,
1989). This construct is consisted of 5 questions (Q7- Q11) measured
using seven-point Likert scale.
PEOU: refers to the degree to which an individual believes that using the
web-based learning system will be free of effort (Davis, 1989). This
construct is based on 5 questions (Q12-Q16) and measured using seven-
point Likert scale.
Section C: this section includes the extended TAM determinants’

Chapter 4: Research Design & Methodology
Ali Tarhini 105
SE: refers to individual’s belief in his/her own competence (Ormrod,
2010) in order to understand how and why individuals perform differently
at various tasks (Bandura, 1997). This construct is based on 6 questions
(Q17-22) and measured using seven-point Likert scale.
FC: it measures the degree to which the students believes that an
organisational and technical infrastructure are available to support usage of
the web-based learning system (Venkatesh et al., 2003). This construct is
based on 4 questions (Q23-26) and is measured using seven-point Likert
scale.
SN: refers to individual’s perception that most people who are important
to him or her think he or she should or should not perform the behaviour in
question (Ajzen, 1991; Ajzen and Fishbein, 1980a). This construct is
based on 4 questions (Q27-Q30) and is measured using seven-point Likert
scale.
QWL: QWL is defined in terms of students’ perception and belief that
using the technology will improve their quality of work life such as saving
expenses when downloading e-journals, or in communication when using
email to communicate with their instructors and friends. This construct is
based on 5 questions (Q31-35) adapted from the work of (Kripanont,
2007; Zakour, 2004b; Srite and karahanna, 2000) and is measured using
seven-point Likert scale.
Section D: this section measures the behavioural intention to use the web-based
learning system
Behavioural intention (BI): refers to the degree to which an individual
has formulated conscious plans to engage in a given behaviour (Davis,
1989). This construct is based on 3 questions (Q37-Q38) and are measured
using seven-point Likert scale ranging from 1 (strongly disagree) to 7
(strongly agree).

Chapter 4: Research Design & Methodology
Ali Tarhini 106
Section E: this section measures the actual usage of the web-based learning
system and also serves the profile description about what the students use the
system for.
Actual usage (AU): refers to individual’s actual use of web-based
learning system (Davis, 1989) and based on 2 questions (Q39-Q40). The
first question (Q40) measures how frequently the students use the system
and is measured using 6-point Likert scale where 1= less than a month, 2=
once a month, 3= a few times a month, 4= a few times a week, 5= about
once a day, 6= several times a day. The second question (Q41) measures
the students’ average daily using of the system and is measured using 6-
point Likert scale where 1= almost never, 2= less than 30 minutes, 3=
from 30 minutes to one hour, 4= from one hour to two hours, 5= from two
to three hours, 6= more than three hours.
This section also includes a subsection about questions related to what the
students use the system for. This question (Q41) gathers information about the
extent to which they use the system to perform the following tasks: 1) lecture
note, 2) Announcements, 3) Email, 4) Assessments, 5) course handbook, 6)
discussion board, 7) browsing websites, 8) take quizzes, 9) previous exams. These
questions are measured using 5-point Likert scale ranging from 1 (not at all) to 5
(to a great extent).
Section F: this section measures the four moderating cultural factors suggested by
Hofstede (1980). The reasons cultural variables were measured at the individual
level and not at the national level were discussed and outlined in Chapter 3.
PD: refers to the extent to which individuals expect and accept differences
in power between different people (Hofstede, 1980). This construct is
based on 6 questions (Q42-Q47) adapted from the work of Dorfman and
Howell’s (1988) and are measured using seven-point Likert scale.

Chapter 4: Research Design & Methodology
Ali Tarhini 107
MF: refers to the extent to which individuals traditional gender roles are
differentiated (Hofstede, 1980). This construct is based on 6 questions
(Q48-Q53) adapted from the work of Dorfman and Howell’s (1988) and
are measured using seven-point Likert scale.
IC: refers to the extent to which individuals are integrated into groups
(Hofstede, 1980). This construct is based on 6 questions (Q54-Q59)
adapted from the work of Dorfman and Howell’s (1988) and are measured
using seven-point Likert scale.
UA: refers to the extent to ambiguities and uncertainties are tolerated
(Hofstede, 1980). This construct is based on 5 questions (Q60-Q64)
adapted from the work of Dorfman and Howell’s (1988) and are measured
using seven-point Likert scale.
4.8.2 Methods to Achieve High Rates of Response
According to Manfreda et al. (2002), there are many reasons that may affect the
response rate and thus cause refusal from potential participants to help filling the
questionnaire such as length of the questionnaire, asking un-interesting questions
and difficult or sensitive questions.
Therefore, the following steps were followed in this research in order to enhance
the response rate and eliminate non-response bias:
The items within the questionnaire were measured either as nominal or 7-
point Likert scale so participants can focus on the questions.
The questionnaire uses easy and simple language and avoids the use of
open-ended questions. For example, personal and demographic
information were put at the first part of the questionnaire so students will
be encouraged to take place in the study.

Chapter 4: Research Design & Methodology
Ali Tarhini 108
In order to encourage participation and engage curiosity, an interesting
covering letter explaining the purpose and impact of the study were
provided to each participant prior to his/her participation. It also indicates
that their personal information will remain strictly confidential.
Keeping in mind the complexity of the proposed model (64 items), the
researcher produced a short and concise questionnaire and also avoided
the use of dull or uninteresting questions.
The questionnaire was distributed in Lebanon and England to a total number of
2000 students (1000 within each country) between the period of December 2010
and February 2011, of which 1197 were returned indicating a 59.7% response rate
overall.
4.8.3 Pre-testing the questionnaire
Pre-testing is considered to be critical and essential part of the questionnaire
design in order to provide valid, reliable and unbiased results and to detect any
potential problems in the questionnaire such as difficulty, time, wording and also
see how it works and whether changes are necessary before the start of the actual
survey (Sekaran and Bougie, 2011; Creswell, 2008).
In this study, two stages of pre-test took place before producing the final version
of the questionnaire, one with the academics (Expert knowledge) and the other
with potential participants.
The researcher sought the help of academic experts from Lebanon and England in
order to obtain content validity. The experts that participated in the pre-testing
stage in England were 5 academics who were mainly in the department of IS at
Brunel university (Professor XiaoHui Liu, Professor Panos Louvieris, Dr. Juile
Barnett, Dr Kate Hone) and one academic from the Business school (Dr. Maged
Ali), as well as 2 experts from Lebanon were also participated. This procedure
was critical in order to overcome the different cultural terminologies and avoid

Chapter 4: Research Design & Methodology
Ali Tarhini 109
collecting useless data (Saunders et al., 2009). The meetings were mainly focused
on refining the questionnaire items in order to delete or even generate additional
ones, and also to check the relevancy and accuracy of the items in answering the
purpose it was designed. A very constructive feedback and suggestions were
provided by the experts which led the researcher to revise the list of questions 5
times before producing the final version of the questionnaire. After adjustments to
the instrument and final approval were obtained from the experts, it was critical to
pre-test the questionnaire to a sample that is expected to respond in a similar way
in each cultural context (Douglas and Craig, 2006).
For the second stage of pre-testing, the questionnaires were distributed to 32
students studying at Brunel University from different disciplines (10 PhD, 8 MSc
and 14 undergraduates). 13 of these students were Syrian and Lebanese students
to ensure the readability and easiness of the questionnaire items in the Lebanese
context. Twenty one questionnaires were returned which indicate a high response
rate (65%). This stage was critical to capture potential wording ambiguities,
difficulty, length and timing of the questionnaire. The results of this stage is
considered a success, for example, one female student mentioned that she has a
problem to answer her age in years and suggested that it is better to present age in
different interval groups, another respondent highlighted some potential problem
with wording one of the questions (Q18), the researcher then tried to simplify the
question and make it clear and easy as possible. In general, the results indicated
that the questionnaire items were clearly worded and easy to understand.
Therefore, preliminary support for reliability and validity of the questionnaire
were obtained before proceeding to the data collection stage. After the
adjustments to the instrument, copies of the questionnaire were distrusted for pilot
test.
4.9 Instrument scale measurement
This study developed a questionnaire technique incorporating nominal and ordinal
scale (see Appendix A). Nominal scales were mainly used to determine the

Chapter 4: Research Design & Methodology
Ali Tarhini 110
participants’ demographic characteristics such as nationality, age, gender,
educational level and experience. Likert scales were used to measure the
participants’ beliefs and opinions towards technology acceptance in e-learning
environment. This scale was first developed by Rensis Likert in 1932 (Likert,
1932) and provides a sequential point scale that varies from 1 to 10 separated by
equal intervals. In order to allow participants to indicate their agreement or
disagreement with certain statements or questions related to their attitudes and
beliefs, the 7-point Likert scales were used to allow varieties in the answers as
participants in this study share a lot of similarities in their characteristics. In
addition, this scale is widely used by many scholars in the IS and social science
literature (Davis, 1989; Venkatesh and Davis, 2000; Dorfman and Howell, 1988).
4.10 Pilot Study Results
It was essential to pilot test the questionnaire prior to its use within this study in
order to examine the validity and reliability of the instrument and to improve
questions, format and scales (Creswell, 2008). A pilot study was conducted in
England and Lebanon before the actual questionnaires were distributed. The main
purpose of the pilot study was to ensure the readability, clarity, and easiness of the
questionnaire items and to check if the data collected answers the investigated
questions and provides face validity (Presser et al., 2004). The researcher then
analyses the data to discover any drawbacks or potential threats within the
questionnaire items and thus decisions can be made regarding the items to be
deleted, kept or even added.
The questionnaires were distributed to a convenience sample of 50 (N=100)
students in each country with a duration of two weeks. Of which 74 were returned
which indicate a high response rates (74%). The number of usable questionnaires
was 65 representing the average targeted sample in terms of age, gender etc were
analysed. The completion time of the questionnaire was 12 minutes which is
relatively reasonable. Based on the suggestions of the respondents and the results

Chapter 4: Research Design & Methodology
Ali Tarhini 111
of the basic statistical analysis, the researcher removed and modified some
questions. The result of the pilot study is presented in Chapter 5 (Section 5.2).
4.11 Data Analysis
For this research, the collected data was analysed into 2 different stages. In the
first stage, SPSS 18.02 version was used for the purpose of descriptive statistics
about the respondents and the preliminary data analysis (see Chapter 5) such as
missing value, outliers and extreme values, mean and standard deviation,
multicollinearity and Skewness. While in the second stage Structural Equation
Modelling (SEM) were used to test and examine the relationships among
variables within the proposed conceptual model (see Chapters 6 and 7). This
section briefly describes and justifies the use of SEM as the main data analysis
technique used in the research.
4.11.1 Structural Equation Modelling (SEM)
Due to its wide and general acceptance among researchers in IS, behavioural and
social science (Blunch, 2008; Janssens et al., 2008; Gefen et al., 2000), the
structural equation modelling (SEM), also known as path analysis, covariance
structure analysis, simultaneous equation models, is used to test and examine the
hypothesised relationships among variables within the proposed conceptual
model. SEM; as an example of second generation of multivariate analysis, which
differs greatly from first-generation techniques such as factor analysis or
regression; is a statistical technique for simultaneously testing and estimating a set
of hypothesised relationships among multiple independent and dependent
variables (Gefen et al., 2000). Similarly, Hair et al. (2010) define SEM as a
multivariate technique, which combines features of multiple regression and factor
analysis in order to estimate a multiple of networking relationships
simultaneously. Thus, SEM allows the researcher to test a set of interrelated
hypotheses in a single and systematic analysis (Gefen et al., 2000). According to
Tabachnick and Fidell (2007), SEM is mostly used to generate theories and

Chapter 4: Research Design & Methodology
Ali Tarhini 112
concepts. SEM also has the ability to assess whether the model ‘fit’ the collected
data (Yuan, 2005). It also has the ability to work effectively with complex
mathematical models. In the context of our study, the selection of SEM as the
main analysis technique was based on the following reasons:
Structural equation modelling is more appropriate than other statistical
technique when one exogenous (dependent) variable becomes an
endogenous (independent) variable (Tabachnick and Fidell; 2000). The
Behavioural Intention (BI) latent factor will act as an endogenous variable
that affect the actual usage of the web-based learning system. BI will
affected by the main determinants of the proposed research model and thus
will act as exogenous variable. In this case, the model will be tested
simultaneously. However, a large number of multiple analyses would be
required when using first generation statistical tool.
The proposed conceptual model aims to contribute to understanding the
acceptance of web-based learning systems in the context of developing
and developed countries which considered a complex model, and thus
scarifies the parsimony. Using first generation statistical tools is not
applicable to test complex modelling whereas SEM is more valuable when
testing complex mathematical models (Gefen et al, 2000).
This research will test a set of hypothesized relationships within the
constructs of the proposed research model which is more suitable for SEM
as it employs confirmatory modelling strategy (Tabachnick and Fidell,
2000).
According to Hair et al. (2010), there are 6 stages in SEM decision process (see
Figure 4.2); “1) Defining individual constructs, 2) Developing the overall
measurement model, 3) Designing a study to produce empirical results, 4)
Assessing measurement model validity, 5) Specifying the structural model, and 6)
Assessing structural model validity” (Hair et al. 2010, p. 654). The first 4 stages
are usually covered within the measurement model while the last 2 stages usually

Chapter 4: Research Design & Methodology
Ali Tarhini 113
covered in the Structural model. The use of the 6-stages in SEM techniques is
heavily discussed in Chapters 5, 6 and 7.
There are two families of SEM: 1) Covariance-based modelling using software
such as LISREL, Mplus, AMOS and EQS and 2) Variance-based modelling –
partial least squares (PLS) (Gefen et al., 2000). The covariance-based SEM is
appropriate when the main objective of the research is theory testing and
confirmation, while PLS-SEM is more appropriate when the main objective of the
research is prediction and theory development. For the current study, Analysis of
Moment Structures (AMOS version 18.0), a covariance-based SEM approach is
used to examine and analyse the data within the proposed model. As discussed in
previous paragraph, this study follows
Hair’s (2010) recommendations about evaluating the structural model using a
two-step approach (first the measurement model and then the structural model).
Additionally, Multiple Group Analysis (MGA) technique is used to measure the
impact of moderators on the conceptual model. The next two chapters provide a
detailed explanation about employing SEM in this research.

Chapter 4: Research Design & Methodology
Ali Tarhini 114
Figure 4-2: The six-stage process for structural equation modelling used in this
research (Source: Hair et al., 2010)

Chapter 4: Research Design & Methodology
Ali Tarhini 115
4.12 Ethical considerations
The ethical consideration is highly critical in any research and more specifically in
the ones that aims to study the social behaviour of participants (Hesse-Biber and
Leavy, 2010). For the present study, based on Brunel university guidelines about
ethical considerations when collecting the data, all participants were asked to sign
a printed consent form which indicate their rights to withdraw from the study at
any time if they choose to, and that their participation is voluntary, and also that
confidentiality and anonymity will be guaranteed at all stages of the research. This
procedure was critical for the research validity as participants can answer the
questionnaire with complete honesty. This research also considers other ethical
issues such as the role of the researcher after the data collection procedure
especially at the data analysis stage (Sekaran and Bougie, 2011).
Additionally, a cover letter was provided to all the participants. This letter
included the title, purpose and impact of the study, in addition to length and time
of the questionnaire, and also the contact details of the researcher and the
supervisor if there are any later questions, additionally the contact details of the
ethical committee at Brunel University regarding the ethical elements of the
research. A copy of the cover letter is included in Appendix B.
An approval from the Department of Information System and Computing at
Brunel University was received before the start of the data collection stage.
4.13 Conclusion
The main aim of this chapter was to present and justify the philosophical
perspectives, approaches, methods and statistical techniques used in this research
to achieve the main research objectives and to answer the research questions as
well as pilot study.
This research employed a quantitative method in order to understand and validate
the conceptual framework (see Chapter 3). A survey research approach, which is

Chapter 4: Research Design & Methodology
Ali Tarhini 116
based on positivism to guide the research, was found to be best appropriate for the
research.
A questionnaire was used as a data collection technique and a detailed account of
the various stages including the development, scale, pre-test and pilot study of the
questionnaire was offered. In this study, two stages of pre-test took place before
producing the final version of the questionnaire, one with the academics (Expert
knowledge) and the other with potential participants.
In this chapter, a detailed explanation of sampling size and different techniques
were provided with a justification for the selection of convenience non-probability
sampling technique.
The main data analysis technique adopted in this research is based on SEM using
AMOS version 18.0. A justification for the selection of this technique due to the
complexity of the conceptual model was provided. CFA and the structural model
are the two-step approach in the SEM analysis that will be applied in this study to
examine and test the relationships among independent and dependent variables.
Finally, the chapter considered the ethical issue related to this research.
The next chapter (Chapter 5) presents the preliminary data analysis including the
pilot study results and sample screening.

Chapter 5: Preliminary Data Analysis
Ali Tarhini 117
Chapter 5: Preliminary Data Analysis
“The competent analysis of research-obtained data requires a blending of art and
science, of intuition and informal insight, of judgement and statistical treatment,
combined with a thorough knowledge of the context of the problem being
investigated” (Green, Tull and Albaum, 1988: 379)
5.1 Introduction
Chapter 3 described the proposed conceptual model that is used to examine the
impact of culture and demographic characteristics on the adoption and acceptance
of e-learning technologies in Lebanon and England. In Chapter 4, the research
method that guided the research was discussed and justified the choice of the
survey research approach to test the hypotheses and thus answer the research
questions.
This chapter presents the preliminary data analysis of the data obtained from the
respondents. The Statistical Package for the Social Science (SPSS) version 18.0
was employed for preliminary data analysis including data screening, frequencies
and percentages, reliability analysis, exploratory factor analysis and t-tests. The
presentation of the results from the data analysis in this chapter focuses on the
cross-cultural differences between Lebanon and England and also investigates the
different tasks that students perform using the web-based learning systems.
This chapter comprises of 8 sections. The next section describes the results of the
pilot study to ensure the validity and reliability of the measuring instruments to be
used in testing the hypotheses. Section 5.3 then presents the results of the
preliminary examination of the main study. This is followed by presenting the
results of the reliability analysis for the main study in Section 5.4. Section 5.5

Chapter 5: Preliminary Data Analysis
Ali Tarhini 118
describes the demographic profile of the respondents. Following that, a detailed
descriptive analysis of all the constructs included in the proposed research model
is provided in Section 5.6 and 5.7 respectively. This is followed by results of the t-
test analysis at a cross-cultural level in Section 5.8. The tasks that students
perform using the web-based learning systems are illustrated in section 5.9.
Finally, Section 5.10 presents the summary and conclusions of this chapter.
5.2 Pilot Study Results
It was essential to pilot test the questionnaire prior to its use within this study in
order to examine the validity and reliability of the instrument and to improve the
questions, format and scales (Creswell, 2008). A pilot study was conducted in
England and Lebanon before the actual questionnaires were distributed. The main
purpose of the pilot study was to ensure the readability and clarity of the
questionnaire items and to check if the data collected answers the investigated
questions and provide face validity (Presser et al., 2004; Sekaran and Bougie,
2011; Zikmund, 2009). It is worth noting that all the items (questions) used by this
research have been drawn from the literature, where they were quoted to be
reliable and valid to measure constructs of the phenomena that they intend to
represent. More specifically, all of the items were used as part of questionnaires in
studies investigating how individual differences affect users’ perception and
behaviour in the context of technology acceptance. The fact that the items were
developed for and tested within similar contexts to the current study supports their
applicability here. The researcher seeks the help of academic experts from
Lebanon and England in order to obtain content validity (refer to Chapter 4,
Section 4.8.3). Based on the feedback and suggestions from the potential
participants (students), very minor changes were suggested on the questions
wording and the questionnaire layout by the respondents, and thus face validity
was established. The researcher then analysed the data to discover any drawbacks
or potential threats within the questionnaire items and thus decisions can be made

Chapter 5: Preliminary Data Analysis
Ali Tarhini 119
regarding the items to be deleted, kept or even added. Below are some examples
of the minor changes:
1) Although some of the measurement scales for some constructs were valid, they
were not relevant in the current study. For example, we removed the
Voluntariness construct as most of the participants believe that it is mandatory to
use the system during their learning process.
2) The term ‘Web-based learning system’ was used instead of ‘e-learning tools’
3) “A specific person was available to provide assistance” instead of “someone was
available to provide assistance”
The questionnaires were distributed to a convenience sample of 50 (N=100)
students in each country within a duration of two weeks. According to
Nargundkar (2003), the sample size for the pilot study should be relatively small
(up to 100) but representative for the population being investigated. Of the 100
questionnaire being distributed, 74 were returned which indicates a high response
rates (74%). The number of usable questionnaires was 65, which were analysed.
The completion time of the questionnaire was 12 minutes which is relatively
reasonable. The next step after content validity was the reliability check.
The reliability refers to the consistency of a measure used within the research
(Sekaran and Bougie, 2011). A test is considered reliable if we are able to get the
same results when we repeat the same research with different samples, assuming
we provide the same initial conditions for the test (Last and Abramson, 2001).
The reliability of the constructs in this research was checked using Cronbach’s
Alpha (Cronbach, 1951). Cronbach’s Alpha measures how well a set of items
measures a single unidirectional latent construct. Different reliability values were
considered satisfactory by different researchers. For instance, it should be at least
0.7 according to (DeVellis, 2003; Robinson et al., 1991) or 0.6 is considered
satisfactory while a value of 0.8 or higher is preferred according to (Nunnally,
1970). In other words, if Cronbach’s gets closer to 1.0, this means that the

Chapter 5: Preliminary Data Analysis
Ali Tarhini 120
constructs have high reliability. SPSS was used to analyse the reliability tests of
the pilot study which are presented in Table 5.1.
Factor Number of
Items
Cronbach
Alpha
Inter-Item
Correlation
Item-to-total
correlation
PU 5 .951 .7 - .88 .798 -.894
PEU 5 .962 .754 - .935 .813 -.95
SE 6 .891 .432 - .817 .649 -.761
FC 4 .866 .422 - .94 .572 - .792
SN 4 .855 .514 - .661 .652 - .758
QWL 5 .926 .591 - .825 .74 - .931
BI 3 .932 .795 - .849 .853 - .893
AU 2 .792 .721 - .721 .721 - .721
PD 6 .865 .336 - .83 .475 - .758
MF 6 .922 .54 - .8 .662 - 861
IC 6 .879 .366 - .78 .621 - .757
UA 5 .925 .595 - .801 .777 - .837
Table 5-1: Cronbach’s Alpha, Inter-item correlation for the pilot study
The results in Table 5.1 suggest that the constructs had adequate reliability, with a
score ranging from 0.792 for AU to .962 for PU. This means that the items related
to each construct used in the proposed model were positively correlated to one
another.
Table 5.1 also presents the results of anther two internal consistency reliability
indicators, namely inter-item correlation and item-to-total correlation. Hair et al.
(2010) suggests that the values should exceed 0.5 for the item-to-total correlation
and 0.3 for inter-item correlation. The results of the pilot study exceeded the cut-
off value for all the constructs used in the questionnaire except for PD. However,
after examining each item in PD, it was obvious that PD6 showed a lower item-to-
total correlation (0.475) than cut-off value 0.5 (Hair et al., 2010). Therefore, based
on the results of the basic statistical analysis, PD6 has been removed from the
questionnaire. Additionally, to avoid the misleading answers and to check the
seriousness of the respondents in answering the questions a Mann-Whitney-U-test
were performed on the first construct (PU) and compared to the last construct
(UA) of the questionnaire. The process was to run the test on groups belonging to
the same category; in this case the Gender was used.

Chapter 5: Preliminary Data Analysis
Ali Tarhini 121
As can be shown in Table 5.2, there is enough evidence to conclude that no
statistical significant difference between male and female on the PU and UA were
found and the significance for all the items were above 0.5 probability value
(Pallant, 2010). Therefore, there was no need for other versions of the
questionnaire. Moreover, when comparing the Z-score for all the items for PU and
UA, we detected that none of construct’ items are totally higher than the other
(e.g, PU1 > UA1, PU2> UA2 etc…). Therefore, we assumed that the participants
within the pilot study did accept the length of the questionnaire.
PU1 PU2 PU3 PU4 PU5
Mann-Whitney U 313.500 333.000 254.000 329.500 297.000
Wilcoxon W 566.500 586.000 507.000 582.500 550.000
Z -.876 -.524 -1.913 -.588 -1.153
Asymp. Sig. (2-tailed) .381 .600 .056 .557 .249
UA1 UA2 UA3 UA4 UA5
Mann-Whitney U 342.500 315.000 323.000 358.500 342.000
Wilcoxon W 903.500 568.000 884.000 919.500 903.000
Z -.360 -.853 -.705 -.079 -.368
Asymp. Sig. (2-tailed) .719 .393 .481 .937 .713
Table 5-2: Grouping Variable: Gender
Having discussed the results of the pilot study, the next section examines and
discusses the results of the main study including data screening, normality,
homogeneity and multicollinearity.
5.3 Preliminary Examination of the Main study
The aim of the preliminary examination of the data is to detect missing data,
outliers, as well as normality and homogeneity of the data in the two data files
through SPSS statistical package and AMOS 18.0. This process is very important
in preparing the collected data for final analysis later on. The next section presents
the findings and treatment of the above identified tests for both samples.

Chapter 5: Preliminary Data Analysis
Ali Tarhini 122
5.3.1 Data screening
All the questionnaires used in this research were screened for any missing answers
before the data entry. Although this process was simple but it was very critical to
facilitate data entry. Furthermore, a check at the descriptive statistics for each item
was undertaken in order to ensure the accuracy of data. In this regards, we
compared the answers of questions that produced out of range values with the
original questionnaires for more accuracy.
5.3.2 Missing Data
According to Hair et al. (2010), missing data is considered an influential problem
in data analysis that may affect the results of the research aims and objectives. The
impact of missing data is even more critical when using Structural Equation
Modelling in AMOS (Arbuckle, 2009). For example, Chi-Square and other fit
measures such as Goodness-of-Fit-Index and also modification indices (refer to
Chapter 6) cannot be computed if there are any missing data in the sample.
Furthermore, it is important to determine the type of missing values to know
whether the missing data were occurring randomly or non-randomly (Pallant,
2010). In this regards, if the missing values are randomly distributed within the
items of the questionnaire, then such data can be ignored. However, if the missing
values are non-randomly distributed, then the generalizability of the results will be
affected (Tabachnick and Fidell, 2007).
Schumacker and Lomax (2004) suggest that missing data up to 5% is considered
acceptable. After the initial screening in the SPSS 18.0, it was found that all
missing data for both samples were distributed in a random manner and were
below the 5 % threshold. The maximum percentage of missing data was 2.5 and
2.4 for the British and Lebanese samples respectively. This percentage of missing
data is very low and can be considered acceptable. Therefore, the researcher
applied the ‘mean substitution’ method to replace missing data for the categorical
variables while missing data for nominal variables were excluded later during the

Chapter 5: Preliminary Data Analysis
Ali Tarhini 123
multi-group analysis, as suggested by many scholars e.g.,(Pallant, 2010; Byrne,
2006; Arbuckle, 2009). The frequency and percentage of missing data for both
samples are presented in Tables 1 and 2 in Appendix C.
5.3.3 Outliers
According to (Hair et al, 2006, p.73), an outlier is defined as “observations with a
unique combination of characteristics identifiable as distinctly different from the
other observation”. Therefore, detecting and treating outliers is critical since it
may affect the normality of the data and can seriously distort statistical tests
(Tabachnick and Fidell, 2007). In this regards, Tabachnick and Fidell (2007)
suggest that extreme outliers should be deleted while keeping the mild-outliers.
Hair et al. (2006) identified two methods to detect the outliers: Univariate outliers
and multivariate outliers.
In the current study, SPPS was used to identify the univariate outliers for the two
data files by determining frequency distributions of z-score, as suggested (Kline,
2010). While there are no specific rules to identify extreme values in literature, for
a large sample (more than 80) a value up to ± 3.29 can be accepted. The decision
was to delete the row that has more than two univariate outliers from the dataset.
Accordingly, three rows (222, 455, and 143) were deleted from the Lebanese
sample and two outliers from the British sample (903 and 1197). Tables 3 and 4 in
Appendix D present the results of the univariate outliers for both samples.
The other type of outliers is known as multivariate outliers, this test involves
observation and analysis of more than one statistical outcome variable at a time.
In the current study, we used Mahalanobis D2 measure to determine the
multivariate outlier (Hair et al., 2010; Kline, 2010). Mahalanobis D2 measures the
distance of a particular case from the centroid of the remaining cases. In this
research, Mahalanobis D2
was measured using AMOS version 18.0. For all
records that p1 value < 0.05 (significant from one side) would consider influential
outlier and that the correlation between the variables for these responses are

Chapter 5: Preliminary Data Analysis
Ali Tarhini 124
significantly different or abnormal comparing to the rest of the dataset
(Tabachnick and Fidell, 2007). Twelve and fifteen multivariate outliers were
detected in the British and Lebanese sample respectively. However, the researcher
retained the outliers to the dataset because they were not found to be problematic
due to their limited number compared to the whole dataset and so were suitable to
be included in further analysis (Hair et al., 2010). Results of multivariate outliers
for both samples are shown in Tables 5 and 6 in Appendix D.
5.3.4 Testing the Normality Assumption
According to Hair et al. (2010), testing the presence of normality is essential in
multivariate analysis. In other words, if the data is not normally distributed then it
may affect the validity and reliability of the results.
In the current study, we employed Jarque-Bera (skewness-Kurtosis) test to check
whether the data is normally distributed or not. The skewness value indicate the
symmetry of the distribution (Pallant, 2010). A negative skew indicates that the
distribution is shifted to the right; whereas positive skew indicates a shift to the
left. Kurtosis provides information about the height of the distribution (Pallant,
2010). The positive kurtosis value indicates a peaked distribution; whereas a
negative value indicates a flatter distribution. According to Tabachnick and Fidell
(2007), the normal range for skewness-kurtosis value is ± 2.58. Following this
recommendation, all the items in the dataset for both samples were found to be
normally distributed (i.e, < ± 2.58). More specifically the skewness and Kurtosis
value in each case was in the range of ±1 which is considered negligible. Tables 7
and 8 in Appendix E show the means, standard deviation, skewness and kurtosis
values for each variable. This confirms that there was no major issue of non-
normality of the data.

Chapter 5: Preliminary Data Analysis
Ali Tarhini 125
5.3.5 Homogeneity of Variance in the Dataset
Tabachnick and Fidell (2007), state that homogeneity is “the assumption of
normality related with the supposition that dependent variable(s) display an equal
variance across the number of independent variable (s)”. According to Hair et al
(2010), it is essential to determine the presence of the homogeneity of variance
within multivariate analysis as it might lead to incorrect estimations of the
standard errors. In this study, Levene’s test in SPSS 18.0 was used to determine
the presence of homogeneity of variance in the data (see Table 5.3) using (gender)
as a non-metric variable in the t-test. The results revealed that most of the
constructs were non-significant (i.e. p>0.05) except PU and IC for British sample
and PEOU for the Lebanese sample. The results confirmed the homogeneity of
variance in the data and suggest that variance for all the constructs within the
proposed model were equal within groups for male and female.
England Lebanon
Item Levene Statistic
df1 df2 Sig. Levene Statistic
df1 df2 Sig.
PU 4.847 1 600 .032 2.800 1 564 .095
PEOU 1.201 1 600 .274 4.512 1 564 .034
SE 3.035 1 600 .082 .029 1 564 .866
FC 3.269 1 600 .071 .626 1 564 .429
SN 1.353 1 600 .245 3.206 1 564 .074
QWL 3.197 1 600 .074 3.637 1 564 .057
MF .926 1 600 .336 .132 1 564 .716
IC 4.216 1 600 .043 .259 1 564 .611
PD .155 1 600 .694 1.374 1 564 .242
UA .871 1 600 .351 .085 1 564 .771
Table 5-3: Test of Homogeneity of Variances
5.3.6 Multicollinearity
According to (Pallant, 2010), multicollinearity occurs when two or more variables
are highly correlated to each other. Different values were suggested to be
satisfactory by different scholars. For instance, correlations up around 0.8 or 0.9 is
considered highly problematic according to (Tabachnick and Fidell, 2007) while a
value 0.7 or higher is considered reason for concern according to (Pallant, 2010).
The presence of multicollinearity is determined by two values: tolerance and VIF

Chapter 5: Preliminary Data Analysis
Ali Tarhini 126
(Variance Inflation Factor) (Pallant, 2010). If the value of tolerance is greater than
0.10 and VIF value less than 3.0, then there is no multicollinearity. Given all the
independent constructs had VIF value less than 3.0 and tolerance value above 0.10
(see Appendix F) this suggests that the absence of multicollinearity in both
samples. After completion of the data screening and testing for multivariate
normality, the data was investigated further using SPSS version 18.0.
This section discussed the results of the preliminary examination of the two data
files through SPSS statistical package and AMOS 18.0 including the detecting of
the missing data, outliers, as well as normality, homogeneity and
multicollinearity. The next section discusses the results of reliability tests of the
two data sets.
5.4 Reliability
Similar to pilot study, the reliability of the constructs in the main study was
checked by Cronbach’s Alpha (Cronbach, 1951). SPSS was used to analyse the
reliability tests of the main study which are presented in Table 5.4. The results
suggest that the constructs had adequate reliability, with a score ranging from
0.705 for AU to .936 for UA for the British sample, whereas the lowest score was
.655 for the AU and the highest was .929 for PEOU within the Lebanese sample.
This means that the items related to each construct used in the proposed model
were positively correlated to one another (Hair et al., 2010).

Chapter 5: Preliminary Data Analysis
Ali Tarhini 127
England Lebanon
Factor Items Cronbach
Alpha
Inter-Item
Correlation
Item-to-
total
correlation
Cronbach
Alpha
Inter-Item
Correlation
Item-to-
total
correlation
PU 5 .922 .642 - .765 .779 -.824 .903 .544-.744 .681-.799
PEOU 5 .923 .647 - .786 .736 -.837 .929 .625-.798 .774-.837
SE 5 .841 .513 - .827 .518 -.683 .768 .273-.831 .487-.816
FC 4 .881 .525 - .867 .661 - .776 .9 .595-.805 .707-.818
SN 4 .833 .445 - .666 .55 - .734 .813 .387-.664 .586-.726
QWL 5 .889 .554 - .728 .701 - .767 .832 .376-.656 .519-.718
BI 3 .893 .701 - .813 .737 - .821 .864 .607-.788 .663-.797
AU 2 .705 .549 - .549 .549 - .549 .655 .551-.551 .551-.551
PD 5 .896 .521 - .693 .694 - .792 .899 .460-.677 .650-.772
MF 6 .87 .383 - .723 .612 - .757 .886 .557-.687 .678-.761
IC 6 .861 .394 - .687 .548 - .718 .851 .394-.757 .512-.732
UA 5 .936 .693 - .803 .807 - .836 .89 .511-.706 .683-.769
Table 5-4: Cronbach’s Alpha, Inter-item correlation for both samples
As can be shown in Table 5.4, the inter-item correlation and item-to-total
correlation values exceeded the cut-off value for all the constructs used in the
questionnaire except for SE within the Lebanese sample. After examining each
item in SE construct, we found that SE5 and SE6 showed a lower item-to-total
correlation (0.487) than cut-off value 0.5 (Hair et al., 2010). However, the
researcher retained these items as they will be checked again during the structural
equation modeling analysis stage (see Chapter 6), this will help the researcher to
understand the complete picture of the lower correlation of these two items before
their deletion.
5.5 Profile of Respondents
The target sample for this survey was British and Lebanese students that use web-
based learning systems provided by their university. These students were full time
students studying for Masters or undergraduate degrees from one university in
England located in London, and two universities in Lebanon located in Beirut. A
total of 2000 questionnaires were distributed to 1000 students from the UK and
1000 from Lebanon respectively, of which 1197 were returned indicating a
59.85% response rate overall. After screening for missing data, we retained 1168

Chapter 5: Preliminary Data Analysis
Ali Tarhini 128
questionnaires for data analysis. These included 566 Lebanese participants and
602 British participants (see Table 5.5).
Frequency Percent
Lebanon 566 48.5%
England 602 51.5%
Total 1168 100.0
Table 5-5: Frequency and percentage of respondents
The demographic information for both samples is discussed next. England Lebanon
Frequency Percent Frequency Percent
Male 315 52.3% 305 53.9%
Female 287 47.7% 261 46.1%
Table 5-6: Frequency and percentage of respondents in terms of their gender
Within the British sample, there were 315 (52.5%) male respondents and 287
(47.7%) female respondents. While within the Lebanese sample there were 305
(53.9%) male and 261 (46.1%) female respondents. The proportion of male and
female respondents was almost adequately distributed. The above Table 5.6
presents the gender category including the frequencies and percentage of each
category. Next, the respondents’ age were analysed in Table 5.7 below.
England Lebanon
Frequency Percent Frequency Percent
17-22 370 61.5% 409 72.3%
>22 232 38.5% 157 27.7%
Table 5-7: Frequency and percentage of respondents’ age group
In terms of age, the majority of the respondents for both samples were in the age
group 17-22 years old, with 370 (61.3%) and 409 (72.3%) within the British and
Lebanese sample respectively. While respondents belonging to the older group
were 232 (38.55) and 157 (27.7%) within the British and Lebanese respectively.
Next, the respondents’ educational levels were analysed in Table 5.8 below.
England Lebanon
Frequency Percent Frequency Percent
Undergraduate 347 57.6% 364 64.3%
Postgraduate 255 42.4% 202 35.7%
Table 5-8: Frequency and percentage of respondents’ educational level

Chapter 5: Preliminary Data Analysis
Ali Tarhini 129
From the educational level perspective, similar to the age, the majority of
respondents for both samples were undergraduate students with 347 within the
British sample and 364 within the Lebanese sample, while the rest were studying
for their master degree. Next, the respondents’ Internet experience were analysed
in Table 5.9 below.
England Lebanon
Frequency Percent Frequency Percent
Some Experience 192 31.9% 225 39.5%
Experienced 410 68.1% 344 60.5%
Table 5-9: Frequency and percentage of respondents’ web experience
The category Internet experience revealed that the majority of the students within
the two samples were experienced in using the Internet, with 410 (68.1%) and 341
(60.2%) within the British and Lebanese sample respectively. The lowest group
include the students who have some experience in using the Internet with 192
British respondents and 225 Lebanese respondents. Next, the respondents’
computer skills were analysed in Table 5.10 below.
England Lebanon
Frequency Percent Frequency Percent
Novice 96 15.9% 88 15.5 %
Moderate 279 46.3% 253 44.7 %
Expert 227 37.7% 225 39.8%
Table 5-10: Frequency and percentage of respondents’ computer experience
The results revealed that the majority of respondents were found moderate on
computer skills, with 46.3% and 44.7% respondents within the British and
Lebanese sample respectively. This was followed by 37.7% British respondents
and 39.8% Lebanese respondents who were found to be expert in using the
computer. Finally, there were only around 15% of the respondents who evaluated
themselves as novice in using the computer. Next, the numbers of courses using
web-based learning tools that the respondents have used within the current
academic year were analysed.
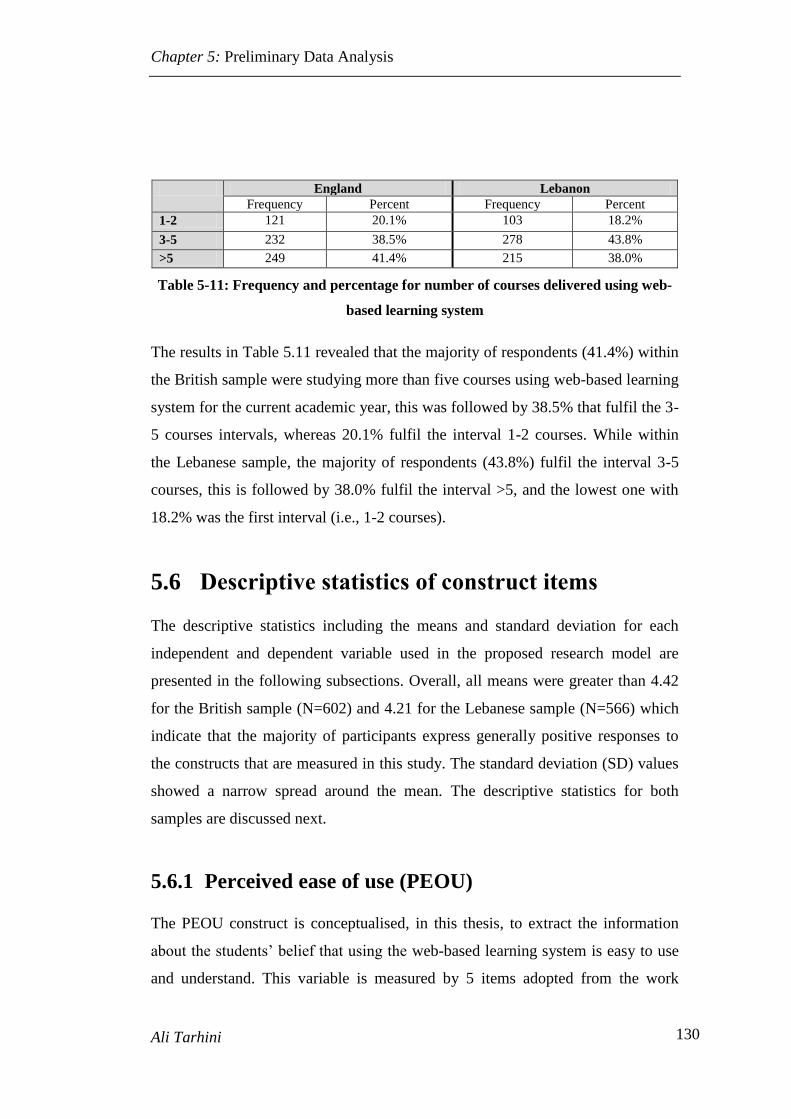
Chapter 5: Preliminary Data Analysis
Ali Tarhini 130
England Lebanon
Frequency Percent Frequency Percent
1-2 121 20.1% 103 18.2%
3-5 232 38.5% 278 43.8%
>5 249 41.4% 215 38.0%
Table 5-11: Frequency and percentage for number of courses delivered using web-
based learning system
The results in Table 5.11 revealed that the majority of respondents (41.4%) within
the British sample were studying more than five courses using web-based learning
system for the current academic year, this was followed by 38.5% that fulfil the 3-
5 courses intervals, whereas 20.1% fulfil the interval 1-2 courses. While within
the Lebanese sample, the majority of respondents (43.8%) fulfil the interval 3-5
courses, this is followed by 38.0% fulfil the interval >5, and the lowest one with
18.2% was the first interval (i.e., 1-2 courses).
5.6 Descriptive statistics of construct items
The descriptive statistics including the means and standard deviation for each
independent and dependent variable used in the proposed research model are
presented in the following subsections. Overall, all means were greater than 4.42
for the British sample (N=602) and 4.21 for the Lebanese sample (N=566) which
indicate that the majority of participants express generally positive responses to
the constructs that are measured in this study. The standard deviation (SD) values
showed a narrow spread around the mean. The descriptive statistics for both
samples are discussed next.
5.6.1 Perceived ease of use (PEOU)
The PEOU construct is conceptualised, in this thesis, to extract the information
about the students’ belief that using the web-based learning system is easy to use
and understand. This variable is measured by 5 items adopted from the work

Chapter 5: Preliminary Data Analysis
Ali Tarhini 131
related to TAM (Davis, 1989; Ngai et al., 2007; Pituch and Lee, 2006) and was
measured using a 7 point Likert scale. The results in Table 5.12 shows that the
means for the items related to PEOU range between 5.34(±1.264) and
5.44(±1.321) for the British sample, and 5.54(±1.237) and 5.8(±1.206) for the
Lebanese one. The results indicated that the students found the system easy to use
and understand and unexpectedly it was higher in the Lebanese sample.
England Lebanon
Item Mean Std Dev Mean Std Dev
PEOU1 5.41 1.377 5.80 1.206
PEOU2 5.34 1.264 5.54 1.237
PEOU3 5.36 1.234 5.59 1.195
PEOU4 5.40 1.257 5.67 1.173
PEOU5 5.44 1.321 5.74 1.171
Table 5-12: Descriptive statistics of PEOU construct
5.6.2 Perceived Usefulness (PU)
The PU construct is conceptualised in this thesis to extract the information about
the students’ belief that using the web-based learning system will improve his/her
performance and productivity. Five items were adopted from the work related to
TAM (Davis, 1989); (Ngai et al., 2007);(Pituch and Lee, 2006) and was measured
using a 7 point Likert scale. As can be shown in Table 5.13, the mean for each
item related to PU construct ranges between 5.17 (±1.289) and 5.37 (±1.288) for
the British sample, and between 5.02 (±1.323) and 5.41 (±1.225) which indicate
that the majority of participants agrees that web-based learning system is useful in
their education process.
England Lebanon
Item Mean Std Dev Mean Std Dev
PU1 5.25 1.330 5.41 1.225
PU2 5.17 1.289 5.06 1.244
PU3 5.37 1.288 5.36 1.288
PU4 5.23 1.312 5.07 1.310
PU5 5.24 1.338 5.02 1.323
Table 5-13: Descriptive statistics of PU construct

Chapter 5: Preliminary Data Analysis
Ali Tarhini 132
5.6.3 Subjective Norm (SN)
The SN construct is conceptualised, in this thesis, to extract information related to
students’ perceptions related to web-based learning system which usually
influenced by others’ opinion such as other colleagues/students and lecturers. Four
items were adopted from the work of (Park, 2009), (Van Raaij and Schepers,
2008) and (Venkatesh et al., 2003) and were measured using 7-point Likert scale.
The results of the descriptive statistics in Table 5.14 show that the mean for the
SN items ranged from 4.62 (±1.535) and 5.14(±1.381) within the British sample,
whereas ranged between 5.38(±1.521) and 5.51(±1.039) within the Lebanese
sample. The results indicate that students were moderately influenced by their
colleagues and instructors.
England Lebanon
Item Mean Std Dev Mean Std Dev
SN1 4.75 1.514 4.88 1.521
SN2 4.62 1.535 4.38 1.419
SN3 4.96 1.392 5.23 1.280
SN4 5.14 1.381 5.51 1.039
Table 5-14: Descriptive statistics of SN construct
5.6.4 Quality of work life (QWL)
The QWL construct is conceptualised, in this thesis, to extract information related
to students’ perception that using the technology and more specifically web-based
learning system will improve their quality of work life. This construct is measured
by five items adopted from the work of (Kripanont, 2007), (Zakour, 2004a), (Srite
and karahanna, 2000) and measured using 7 point Likert scale. The results in
Table 5.15 show that the mean ranges between 5.29(±1.347) and 5.7(±1.318) for
British students, whereas ranged between 4.49(±1.309) and 5.54(±1.270) for
Lebanese students. This indicates that the majority of the students in both samples
agree that using the technology will help improve their quality of work life.

Chapter 5: Preliminary Data Analysis
Ali Tarhini 133
England Lebanon
Item Mean Std Dev Mean Std Dev
QWL1 5.64 1.342 5.52 1.291
QWL2 5.70 1.318 5.54 1.270
QWL3 5.29 1.347 4.94 1.397
QWL4 5.56 1.321 5.49 1.309
QWL5 5.65 1.301 5.51 1.142
Table 5-15: Descriptive statistics of QWL construct
5.6.5 Computer Self-Efficacy (SE)
The SE construct is conceptualised, in this thesis, to extract information about
students’ self confidence in his/her ability to perform certain learning tasks using
the web-based learning system. This construct is measured by 6-items using a 7
point Likert scale, and was adopted from the work of (Chang and Tung, 2008),
(Compeau et al., 1999), (Vijayasarathy, 2004), (Yuen and Ma, 2008). The results
in Table 5.16 show that the mean for the items that measure the SE construct is
ranged between 4.99 (±1.683) and 5.07(± 1.470) for the British sample, while the
mean for SE items within the Lebanese sample ranged between 4.86(±1.696) and
5.7(±1.014) which indicate that the majority of the respondents were agreeable on
this construct.
England Lebanon
Item Mean Std Dev Mean Std Dev
SE1 5.06 1.596 5.33 1.476
SE2 5.07 1.470 5.32 1.407
SE3 4.76 1.561 4.98 1.446
SE4 4.93 1.563 5.70 1.014
SE5 5.05 1.459 4.96 1.440
SE6 4.99 1.683 4.86 1.696
Table 5-16: Descriptive statistics of SE construct
5.6.6 Facilitating Condition (FC)
The FC construct is conceptualised, in this thesis, to extract information related to
students’ perception of whether they are able to access the required resources and

Chapter 5: Preliminary Data Analysis
Ali Tarhini 134
the necessary support to use the e-learning services that the organizational and
technical infrastructure are available to support his/her usage of the web-based
learning system. This construct was measured by four items adopted from the
work of (Teo, 2009a), (Maldonado et al., 2009) and (Venkatesh et al., 2003) using
a 7 point Likert scale. As can be shown in Table 5.17, the results show that the
mean range between 4.67 (±1.743) and 5.29(±1.553) within the British sample,
and 5.36 (±1.352) and 5.51(±1.149) within the Lebanese sample indicating
agreement on the importance of the availability of the technological resources.
England Lebanon
Item Mean Std Dev Mean Std Dev
FC1 5.29 1.553 5.47 1.355
FC2 5.29 1.525 5.36 1.352
FC3 4.93 1.565 5.51 1.149
FC4 4.67 1.743 5.43 1.159
Table 5-17: Descriptive statistics of FC construct
5.6.7 Behavioural Intention (BI)
The BI construct is conceptualised, as a dependent variable in this thesis, to
extract information related to students’ behavioural intention to use the
Blackboard system in the future. Three items adopted from the work of (Moon
and Kim, 2001b),(Davis, 1989), (Park, 2009) and (Chang and Tung, 2008) and
were measured using 7 point Likert scale. The results of the descriptive analysis in
Table 5.18 show that the mean ranged between 5.51(±1.346) and 5.77(±1.309) for
the British sample, whereas it ranged between 5.42(±1.29) and 5.67(±1.26) for the
Lebanese sample. The results revealed that British and Lebanese students showed
agreement on this variable.
England Lebanon
Item Mean Std Dev Mean Std Dev
BI1 5.51 1.346 5.42 1.290
BI2 5.77 1.258 5.84 1.219
BI3 5.76 1.309 5.67 1.260
Table 5-18: Descriptive statistics of BI construct

Chapter 5: Preliminary Data Analysis
Ali Tarhini 135
5.6.8 Actual Usage (AU)
The AU construct is conceptualised, as a dependent variable in this thesis, to
extract the information about students’ actual use of the system. It is worth noting
that actual use was measured using self-reported measures. This construct is
measured by two items adopted from the work of (Davis, 1989), (Venkatesh et al.,
2000), (Venkatesh et al., 2003). Usage Behaviour construct uses scales from 1 to 6
(1= less than once a month and 6 = several times a day) to assess the frequency
and of using web-based learning system and (1= almost never and 6 = more than 3
hours) to measure the average of daily usage per hour. As can be seen in Table
5.19, the mean ranged between 4.01(±1.291) and 4.84(±1.136) for the British
sample, whereas ranged between 3.5 (±1.267) and 4.94(±1.074) for the Lebanese
sample. Therefore, the results suggest that there were high levels of usage in
general.
England Lebanon
Item Mean Std Dev Mean Std Dev
FreqUsage 4.84 1.136 4.94 1.074
DailyUsage 4.01 1.291 3.50 1.267
Table 5-19: Descriptive statistics of AU construct
5.7 Culture variables
This section presents the result of the four individual-level cultural values for the
British and Lebanese students. All the items were measured by 6 items except UA
and PD, which were measured by 5 items. Items were measured using a 7 point
Likert scale ranging from 1-strongly disagrees to 7-strongly agree. The constructs
adopted from the work of (Srite and Karahanna, 2006) who in return developed
their measures based on the work of Dorfman and Howell (1988) and Hofstede
(1980) and were modified to fit the context of the study. The following
subsections provide a detailed description of the four cultural variables used in the
study.

Chapter 5: Preliminary Data Analysis
Ali Tarhini 136
5.7.1 Power Distance (PD)
This construct is conceptualised to measure the students’ perception about the
acceptance of power from his/her instructor. The results in Table 5.20 revealed
that both British and Lebanese students were low on power distance, with a mean
ranged between 2.39(±1.233) and 2.65(±1.326) for the British students, whereas
ranged between 3.05(±1.514) and 3.49(±1.658) for the Lebanese students. Our
results are inconsistent with Hofstede’s (1980) finding who indicate that Arab
countries are high on power distance.
England Lebanon
Item Mean Std Dev Mean Std Dev
PD1 2.65 1.326 3.12 1.541
PD2 2.57 1.273 3.49 1.658
PD3 2.39 1.233 3.20 1.568
PD4 2.60 1.252 3.05 1.514
PD5 2.56 1.228 3.18 1.460
PD6 2.64 1.218 3.15 1.442
Table 5-20: Descriptive statistics of PD construct
5.7.2 Masculinity/Femininity (MF)
This construct is conceptualised, in this thesis, to observe the masculine/feminine
nature of the students. Students who have high masculinity (low femininity)
values will emphasise on the work goals and material accomplishments, such as
earnings and promotions, whereas low masculinity individuals (high on
femininity) place more value on human relationships and quality of life and
usually encouraged to follow more traditional, tender and modest roles. As can be
shown in Table 5.21, the results indicate that both students were rated high on
masculinity with the mean ranged between 2.42(±1.228) and 2.71(±1.332) for the
British students, whereas ranged between 3.06(±1.593) and 3.66(±1.568) for the
Lebanese students.
Although this study studied the cultural dimensions at the individual level and
there is no previous literature to support our findings, However, comparing it to
the national level, the results from the Lebanese sample were unexpected as at the

Chapter 5: Preliminary Data Analysis
Ali Tarhini 137
national level Lebanon is considered moderate in masculine index compared to
England which indicates a very masculine society (Hofstede, 1980).
England Lebanon
Item Mean Std Dev Mean Std Dev
MF1 2.42 1.228 3.13 1.671
MF2 2.51 1.229 3.17 1.644
MF3 2.52 1.285 3.06 1.593
MF4 2.43 1.273 3.21 1.597
MF5 2.71 1.332 3.21 1.600
MF6 2.62 1.328 3.66 1.568
Table 5-21: Descriptive statistics of MF construct
5.7.3 Individualism/Collectivism (IC)
This construct is conceptualised, in this thesis, to reflect the extent to which
individuals are integrated into groups. In individualistic societies, individuals
focus on their own achievements and personal goals rather than on the group they
belong to. Table 5.22 presents the descriptive statistics of the IC cultural values.
The mean average for the British students ranged between 3.36(±1.471) and
3.88(±1.576), whereas the mean ranged between 4.62(±1.477) and 5.21(±1.220)
for the Lebanese students. The results indicate that British students had
individualistic values whereas Lebanese students had collectivist values. Our
results is consistent with Hofstede’s (1980) finding at the national level.
England Lebanon
Item Mean Std Dev Mean Std Dev
IC1 3.36 1.471 4.74 1.412
IC2 3.88 1.576 5.21 1.220
IC3 3.71 1.418 4.99 1.290
IC4 3.65 1.492 5.00 1.319
IC5 3.53 1.435 5.04 1.368
IC6 3.50 1.434 4.62 1.477
Table 5-22: Descriptive statistics of IC construct

Chapter 5: Preliminary Data Analysis
Ali Tarhini 138
5.7.4 Uncertainty avoidance (UA)
This construct is conceptualised, in this thesis, to measure the extent to which
ambiguities and uncertainties are tolerated. In other words, individuals with high
UA cultural values will establish formal rules and might reject deviant ideas and
behaviours since it has been established with anxiety and the need for security.
Conversely, individuals with low UA cultural values might have a greater
willingness to take risks. As can be shown in Table 5.23, the average for the
British sample ranged between 4.08(±1.304) and 4.14(±1.432), whereas the mean
ranged between 5.32(±1.203) and 5.48(±1.240) for the Lebanese students. The
results indicate that British students were neutral about uncertainty avoidance
compared to the Lebanese students who were found to have high uncertainty
avoidance. This results are very close to Hofstede’s (1980) finding at the national
level.
England Lebanon
Item Mean Std Dev Mean Std Dev
UA1 4.10 1.346 5.47 1.168
UA2 4.08 1.304 5.48 1.240
UA3 4.10 1.366 5.32 1.203
UA4 4.12 1.335 5.33 1.173
UA5 4.14 1.432 5.46 1.179
Table 5-23: Descriptive statistics of UA construct
5.8 Cross-cultural Differences between the Two
Samples
A T-test was employed to examine the similarities and differences between the
British and Lebanese students at the national level. The results of this section will
help to achieve another objective of this research, which is “to develop an
inclusive categorization of the similarities and differences between British and
Lebanese students on the acceptance and usage of web-based learning systems at
the national level”. This will help in identifying and understanding any differences
between the cultures of these two countries.

Chapter 5: Preliminary Data Analysis
Ali Tarhini 139
Table 5.24 shows the mean and group differences (t-test) for each construct
between the Lebanese and British students at the national-level culture.
T-test for Equality of Means
Mean T-test Sig. (2-tailed) Mean
Difference Lebanon England
PU 5.182 5.25 -1.033 0.302 -.06750
PEOU 5.668 5.390 4.336*** .000*** .27781
SE 5.191 4.977 3.414** .002** .21351
FC 5.442 5.045 5.464*** .000*** .39687
SN 5.001 4.868 2.010* .044* .13294
QWL 5.4 5.566 -2.695** .007** -.16578
BI 5.643 5.681 -0.563 0.573 -.03795
AU 4.222 4.424 -3.325** .002** -.20269
PD 3.1603 2.567 9.377*** .000*** .63235
MF 3.22 2.535 10.401*** .000*** .70630
IC 5.0114 3.822 21.102*** .000*** 1.32902
UA 5.464 4.4 20.171*** .000*** 1.0130
Note: *p<.05, **p<.01,***p<.001
Table 5-24: T-test for all Constructs
Regarding the group differences at the national level, the results revealed that no
significant differences in terms of perceived usefulness (t=-1.033, main
difference=-.06750) and BI (t=-.563, mean difference= -.03795) between
Lebanese and British students. This means that both Lebanese and British students
found the system useful in their education and have good behavioural intention to
use the system in the future.
In terms of PEOU, the mean score is 5.668 for Lebanon and 5.390 for England;
unexpectedly the results revealed that PEOU is significantly higher in Lebanon
compared to England (t=4.336, p<.001). In what concerns self-efficacy, the mean
score is 5.191 for Lebanon and 4.977 for England, which is unexpectedly higher
for Lebanon than England (t=3.414, p<.01).
Similarly, the results in Table 5.24 revealed that facilitating conditions (FC) was
significantly higher in Lebanon (t=5.464, p<.001), with a mean 5.442 for Lebanon
and 5.045 for England. These results were unexpected; however this could be due

Chapter 5: Preliminary Data Analysis
Ali Tarhini 140
to the data being collected from two private universities in Lebanon, who invest a
large sum of money in their educational system.
The results also showed that there is slightly significant difference for Lebanese
and British students on subjective norm (SN), with a mean value 5.001 for
Lebanon and 4.868 for England (t=2.010, p<.05), thus indicating that Lebanese
students are more willing to accept the pressure from external environments (i.e.,
peers and superiors) to use the web-based learning system.
The results in Table 5.24 also showed that there is a significance difference for
Lebanese and British students on QWL, with the mean score 5.4 for Lebanon and
5.566 for England, indicating that a higher significant mean in England (t=-2.695,
p<.01). This means that both Lebanese and British students are aware of the
impact of technology on their quality of life. Similarly, with respect to AU, the
mean score is 4.424 for England and 4.222 for Lebanon, thus revealing that the
British students are using the web-based learning system more than the Lebanese
students (t=-.20269, p<.01)
Regarding the differences between Lebanon and England on the individual- level
cultural values, the results revealed that there is a significant difference on each of
the four variables.
In terms of PD, the mean score is 3.16 for Lebanon and 2.567 for England,
indicating that both British and Lebanese students were low on PD with the mean
being significantly higher in Lebanon (t=9.377, p<.001). Our results support the
original findings of Hofstede’s (1980) in terms of the British sample which
indicate that the UK is low on PD, however it deviates from the national score of
the Arab countries as Hofstede’s indicate that Arab countries are high on power
distance.
Regarding masculinity/femininity (MF), the mean is 3.22 for Lebanon and 2.535
for England, indicating a masculine cultural value in both samples with the mean
is significantly higher in Lebanon (t= 10.401, p<.001). This result is inconsistent

Chapter 5: Preliminary Data Analysis
Ali Tarhini 141
with Hofstede’s (1980) finding who indicate that Arab countries are high on
femininity.
In what concerns individualism/collectivism (IC), the mean score is 5.011 for
Lebanon and 3.82 for England with the mean significantly higher in Lebanon
(t=21.102, p<.001). The result reveals that British students have individualistic
cultural values, while Lebanese students had collectivistic cultural values. The
results is consistent with Hofstede’s (1980) findings about Lebanon and England.
Finally, concerning uncertainty avoidance (UA), the mean score is 5.46 for
Lebanon, whereas for British students the mean is 4.4, revealing that the mean is
significantly higher in Lebanon (t=20.171, p<.001). This means that Lebanese
students find the ambiguity more stressful and avoid unclear situation than British
students. Our results are consistent with Hofstede’s (1980) finding about the Arab
countries and England.
The next section will provide a more detailed explanation of each item used in the
survey questionnaire.
5.9 The tasks the students perform using the Web-
based learning system
This section will help in determining the current usage of Web-based learning
systems in Lebanese and British universities which help achieve the fourth
objective of this research. A descriptive analysis using SPSS was used to describe
the current usage of web-based learning system in both countries, where the T-test
were employed to examine the similarities and differences between the Lebanese
and British students on using the web-based learning system
Regarding the actual tasks the students perform using the web-based learning
system, the participants were asked to circle each questions based on the
following measurement scales, where 1= Do not use it at all; 2=to a small extent;
3= to some extent; 4= to a moderate extent; and 5= to a great extent. Overall, the

Chapter 5: Preliminary Data Analysis
Ali Tarhini 142
majority of students in both samples use the web-based learning system to
perform specific tasks. Tables 5.25 and 5.26 explain the percentage and
frequencies for each country, whereas the differences between the two groups are
presented in Table 5.27.
England
Item Not at
All
Small
extent
Some
extent
Moderate
extent
To a great
extent
Announcement 9.5%
(57)
15%
(90)
20.8%
(125)
28.4%
(171)
26.4%
(159)
Email 5.0%
(30)
9.8%
(59)
14%
(84)
24.3%
(146)
47%
(283)
Assessment 2.5%
(15)
4.8%
(29)
13%
(78)
24.4%
(147)
55.3%
333
Lecture note 2.5%
(15)
5%
(30)
11%
(66)
25.7%
(155)
55.8%
(336)
Course Handbook 9.8%
(59)
16.1%
(97)
21.6%
(130)
22.9%
(138)
29.6%
(178)
Past Papers 10%
(60)
13.5%
(81)
15.3%
(92)
23.5%
(143)
37.5%
(226)
Discussion Board 23.8%
(143)
25.2 %
(152)
18.4%
(111)
16.9%
(102)
15.6%
(94)
Websites 11.8%
(71)
17.4%
(105)
21.9%
(132)
21.4%
(129)
27.4%
(165)
Quizzes 29.2%
(176)
16.4%
(99)
15.8%
(95)
19.9%
(120)
16.6%
(112)
Table 5-25: British sample actual usage of the system
In terms of the British sample, the results in Table 5.25 showed that the majority
of participants responded “to a great extent” on all other tasks except for
“Announcement” which scored “to a moderate extent” and “Discussion Board”
with the majority responded “to a small extent”, whereas “Quizzes” scored the
lowest mean (M=2.82) among other tasks with the majority of the participants
answered “Not at all”.

Chapter 5: Preliminary Data Analysis
Ali Tarhini 143
Lebanon
Item Not at All Small
extent
Some
extent
Moderate
extent
To a great
extent
Announcement 3.4%
(19)
8.7%
(49)
16.8%
(95)
29.3%
(166)
41.9%
(237)
Email 10.1%
(57)
9.4%
(53)
15.2%
(86)
26.0%
(147)
39.4%
(223)
Assessment 8.5%
(48)
14.7%
(83)
20.7%
(117)
30.6%
(173)
25.6%
(145)
Lecture note 3.9%
(22)
4.4%
(25)
11.5%
(65)
24%
(136)
56.2%
(318)
Course
Handbook
10.1%
(57)
12%
(68)
22.4%
(127)
29%
(164)
26.5%
(150)
Past Papers 12.9%
(73)
13.1%
(74)
18.2%
(103)
28.4%
(161)
27.4%
(155)
Discussion
Board
28.6%
(162)
20.7%
(117)
19.3%
(109)
19.1%
(108)
12.4%
(70)
Websites 17.3%
(98)
17.8%
(101)
20.8%
(118)
23.1%
(131)
20.8%
(118)
Quizzes 11.5%
(65)
16.4%
(93)
24%
(136)
26.9%
(152)
21.2%
(120)
Table 5-26: Lebanese sample actual usage of the system
In terms of the Lebanese sample, Table 5.26 showed that the participants response
was either ‘to a moderate extent’ or ‘to a great extent’, with the majority of the
participants responding “to a moderate extent” for “Assessment”, “Course
Handbook”, “Past Papers”, “Websites”, “Quizzes”. The means, standard deviation
and t-test analysis are presented in the next Table.
Lebanon England T-test
Item Mean Std.
Dev
Mean Std.
Dev
T-test
results
Sig (2-
talied)
Mean
Difference
Announcement 3.98 1.112 3.49 1.299 6.848*** .000*** .484
Email 3.75 1.330 3.99 1.205 -3.123** .002** -.232
Assessment 3.50 1.252 4.25 1.019 -11.2*** .000*** -.751
Lecture note 4.24 1.071 4.27 1.009 -.526 .599 -.032
Course Handbook 3.50 1.276 3.46 1.324 .457 .648 .035
Past Papers 3.44 1.354 3.65 1.359 -2.657** .008** -.211
Discussion Board 2.66 1.387 2.75 1.393 -1.169 .243 -0.095
Websites 3.12 1.387 3.35 1.355 -2.847** .004** -.228
Quizzes 3.30 1.286 2.82 1.5 5.81*** .000*** .476
Note: *p<.05, **p<.01,***p<.001
Table 5-27: t-test for the tasks performed using web-based learning system

Chapter 5: Preliminary Data Analysis
Ali Tarhini 144
Regarding the group differences on the tasks performed using web-based learning
system, the results in Table 5.27 revealed no significant differences in “Lecture
Note”, “Course Handbook” and “Discussion Board” between Lebanon and
England, where significant difference were higher in Lebanon in terms of
“Announcement” and “Quizzes” and lower in terms of,“ Email”,“ Past Papers”,“
Assessment” and “Websites”. This means that Lebanese students use the web-
based learning system more for “Announcement” and “Quizzes” and lower for
“Email”, “Past Papers”, “Assessment” and “Websites than British students. It is
worth noting that the highest mean for both samples was observed for “Lecture
Note”, with 318 (Mean=4.24) and 336 (mean=4.27) of respondents responded ‘to
a great extent’ in Lebanon and England respectively.
5.10 Summary and Conclusions
This chapter reported the findings of the preliminary data analysis using the SPSS
version 18.0. The different statistical techniques used in this chapter helped the
researcher examine the preliminary results of the dataset.
This chapter first reported the results of the pilot study to ensure the validity and
reliability of the measuring instruments of the survey items. Although not all the
survey items; and especially the individual-level cultural variables; were
previously used in Lebanon or England. However, the results confirmed that the
survey items had high reliability (internal consistency) and all the constructs had a
Cronbach’s alpha above 0.7.
The second section involved the data screening of the dataset such as missing
data, outliers, testing the normality assumption, homogeneity and
multicollinearity. The results revealed that all missing data for both samples were
distributed in a random manner and were below 5 %. The maximum percentage of
missing data was 2.5 and 2.4 for the British and Lebanese samples, respectively.
This percentage of missing data is very low and can be considered acceptable.
Therefore, the researcher applied ‘mean substitution’ method to replace missing

Chapter 5: Preliminary Data Analysis
Ali Tarhini 145
data for the categorical variables while missing data for nominal variables were
excluded later during the multi-group analysis, as suggested by many scholars
e.g.,(Pallant, 2010; Arbuckle, 2009; Byrne, 2006). Mahalanobis D2 revealed that
twelve and fifteen multivariate outliers were detected in the British and Lebanese
sample respectively. However, the researcher retained the outliers to the dataset
because they did not find them to be problematic and so to be included in further
analysis (Hair et al., 2010). The results of the Jarque-Bera (skewness-Kurtosis)
test indicated that the value in each case was in the range of ±1, which confirms
that there were no major issues of non-normality of the data. Finally, given that all
the independent constructs had VIF value less than 3.0 and tolerance value above
0.10, this suggests the absence of multicollinearity in both samples. The
preliminary analysis of the data suggested the deletion of SE6 and PD66 as they
were highly cross-loaded on another latent construct.
The third section captured the respondents’ demographic characteristics such as
age, gender, nationality, educational level and experience in using Internet and
web-based learning systems. A total of 2000 questionnaires were distributed to
1000 students from the UK and 1000 from Lebanon respectively, of which 1179
were returned indicating a 59% response rate.
The fourth section presented the results of the descriptive statistics including the
means and standard deviation for each independent and dependent variable used
in the proposed research model. Overall, all means were greater than 4.42 for the
British sample (N=602) and 4.21 for the Lebanese sample (N=566) which indicate
that the majority of participants express generally positive responses to the
constructs that are measured in this study. In terms of the cultural variables, the
results indicate British students were scored low on (PD, MF, IC and UA),
whereas Lebanese students were scored low on (PD, MF), and high on (IC and
UA).
The results of the t-test between the Lebanese and British students are presented in
Section 5. The results showed that all the constructs were significant except for
perceived usefulness and behavioural intention. In addition, a summary related to

Chapter 5: Preliminary Data Analysis
Ali Tarhini 146
the main determinants as well as Hofstede’s cultural dimensions are summarised
in Tables 5.28 and 5.29 respectively.
The chapter ended with an elaboration on the differences between British and
Lebanese students on tasks performed using the web-based learning system, the
results in Section 5.8 revealed that no significant differences in “Lecture Note”,
“Course Handbook” and “Discussion Board” between Lebanon and England,
where significant difference were higher in Lebanon in terms of “Announcement”
and “Quizzes” and lower in terms of “Email”, “Past Papers”, “Assessment” and
“Websites”.
The next chapter will provide a further analysis using structural equation
modeling (SEM) to observe the construct validity and convergent validity and to
test the direct relationship between predictors and behavioural intention and actual
usage. These results will be discussed against hypotheses in Chapter 8.
T-test for Equality of Means (main determinants) Study Results
H1c: Students’ mean Perceived Ease of Use will be
significantly higher in England, compared to Lebanon.
(Significant but higher in
Lebanon), Not Supported
H2c: Students’ mean perceived usefulness will be
significantly higher in England, compared to Lebanon.
Not Supported
H4c: Students’ mean Subjective norm will be significantly
higher in Lebanon, compared to England.
Supported
H5c: Students’ mean QWL will be significantly higher in
England, compared to Lebanon.
Supported
H7c: Students’ mean self-efficacy will be significantly
higher in England, compared to Lebanon.
(Significant but higher in
Lebanon), Not Supported
H8c: Students’ mean facilitating conditions will be
significantly higher in England, compared to Lebanon.
Not Supported
H3c: Students’ mean intention to use web-based learning
systems will be significantly higher in England, compared
to Lebanon.
Not Supported
H3c: Students’ mean actual usage of web-based learning
systems will be significantly higher in England, compared
to Lebanon.
(Significant but higher in
Lebanon), Not Supported
Table 5-28: Summary of results related to the difference in Means for the main
predictors hypotheses

Chapter 5: Preliminary Data Analysis
Ali Tarhini 147
T-test for Equality of Means (Hofstede’s cultural variables) Study Results
H11c: Power Distance mean will be significantly higher in
Lebanon, compared to England.
Supported
H12c: masculinity mean will be significantly higher in England,
compared to Lebanon.
Supported
H13c: individualism mean will be significantly higher in
England, compared to Lebanon.
Supported
H14c: Uncertainty Avoidance mean will be significantly higher
in Lebanon, compared to England.
Supported
Table 5-29: Summary of Results related to the difference in Means for the Cultural
dimensions hypotheses

Chapter 6: Model Testing
Ali Tarhini 148
Chapter 6: Model Testing
“The competent analysis of research-obtained data requires a blending of art and
science, of intuition and informal insight, of judgement and statistical treatment,
combined with a thorough knowledge of the context of the problem being
investigated” (Green, Tull and Albaum, 1988: 379)
6.1 Introduction
Chapter 5 presented the preliminary data analysis. This chapter presents an in-
depth analysis of the relationships among the constructs within the proposed
research model. Two steps were used during the data analysis process. In the first
step, the confirmatory factor analysis (CFA) was employed to assess the
constructs’ validity and test the model fit. The next step employed the structural
equation modeling (SEM) technique to test the hypothesised relationships among
the independent and dependent variables. Using a two-step approach assures that
only the constructs retained from the survey that have good measures (validity and
reliability) will be used in the structural model (Hair et al., 2010).
Accordingly, this chapter is organised as follows: in the first section, the
assessment of the measures will be discussed including the measures of the
validity and reliability of the constructs. This is then followed by testing the direct
relationships among the constructs of the revised measurement model in Lebanon
and England respectively. Section 6.4 will discuss the criteria and methods used to
measure the impact of the moderators. This chapter will then investigate the
moderating effects of Hofstede’s four cultural dimensions (PD, M/F, I/C, UA) and
then the demographic characteristics such as age, gender, and experience on the
relationships between the exogenous (independent) and endogenous (dependent)
constructs in the generated model in Sections 6.5 and 6.6. Finally, Section 6.7

Chapter 6: Model Testing
Ali Tarhini 149
provides a summary of the main results. This research has employed the Analysis
of Moment Structures (AMOS) version 18.0 to test the causal relationships among
the variables. AMOS is considered easy-to-use and user-friendliness compared to
other software such as LISREL, EQS (Blunch, 2008). AMOS also has the ability
to estimate and present the model.
6.2 Analysis of measurement model
this study employed CFA in order to examine the relationships among the
different constructs within the conceptual model (Arbuckle, 2009). To assess the
measurement model in CFA, the researcher first considered the measurement
model fit and then evaluated the validity of the measurement model.
In the CFA, there is no need to distinguish between endogenous and exogenous
constructs while it is necessary during the model testing stage. As can be shown in
Figure 6.1, all the variables are linked together and the construct items (measured
variables) are represented in rectangular shapes. The covariance is usually
represented by two-headed arrows, whereas a causal relationship from a construct
to an indicator is represented by one-headed arrow. In the current study, the
researcher worked on each sample separately in order to generate a model that
best fit each sample. In total, 33 items were used in the CFA which derived from
the EFA (see Chapter 5).

Chapter 6: Model Testing
Ali Tarhini 150
Figure 6-1: Hypothesised CFA model derived from preliminary analysis
6.2.1 Goodness of fit indices
We adopt the maximum-likelihood method to estimate the model’s parameters
where all analyses were conducted on variance-covariance matrices (Hair et al.,
2010). There are some fit indices that should be considered in order to assess the
model goodness-of-fit (Kline, 2005; Hair et al., 2010). First, it was determined

Chapter 6: Model Testing
Ali Tarhini 151
using the χ². However, the χ² was found to be too sensitive for our sample size
(Hu and Bentler, 1999), in this case it is more likely that the model will reject
something true, and also very small differences between the observed model and
the good model fit might be found significant (Hair et al., 2010). Therefore, other
fit measures were used to overcome this problem. First, the ratio of the χ² statistic
to its degree of freedom (χ²/df) was used, with a value of less than 3 indicating
acceptable fit (Carmines and McIver, 1981). Hair (2010) suggested the following
indices to indicate acceptable fit “Goodness of Fit Index (GFI); Normed Fit Index
(NFI); Parsimony Normed Fit Index (PNFI); Root Mean Square Residuals
(RMSR); Comparative Fit Index (CFI); Adjusted Goodness-of-Fit Index (AGFI);
the Root Mean Square Error of Approximation (RMSEA)”. Table 6.1 shows the
level of acceptance fit obtained with the survey data.
The first run of the model revealed the following results for the British sample [χ²
=1640.667; df= 467; χ²/df= 3.513; GFI =.853; AGFI=.823; CFI=.921;
RMSR=.125; RMSEA=.065, NFI=.893; PNFI=.790] and [χ² =1377.704; df= 467;
χ²/df= 2.905; GFI =.860; AGFI=.832; CFI=.923; RMSR=.084; RMSEA=.059,
NFI=.888; PNFI=.785] for the Lebanese sample. These results indicated a further
room for improvement to indicate a good measurement model fit of the data. The
complete results are shown in Appendix G.
Fit Index Recommended
Value (Hair, 2006)
England
Measurement
Model
Lebanon
Measurement
Model
χ 2 Non-significant at p
<0.05 1640.667 1377.704
Degrees of freedom (df) n/a 467 467
χ 2 /df <5 preferable <3 3.513 2.905
Goodness-of-fit index (GFI) >0.90 .853 .860
Adjusted Goodness-of-fit index
(AGFI) >0.80 .823 .832
Comparative fit index (CFI) >0.90 .921 .923
Root mean square residuals (RMSR) <0.10 .125 .084
Root mean square error of
approximation (RMSEA) <0.08 .065 .059
Normed fit index (NFI) >0.90 .893 .888
Parsimony normed fit index (PNFI) >0.60 .790 .785
Table 6-1: Model fit summary for the Measurement Model

Chapter 6: Model Testing
Ali Tarhini 152
The modification indices in AMOS provide information on the improvement in
model fit. The following measures were applied by the researcher in order to
achieve a better fit of the model.
the standardised residual covariance should be within |2.58| (Byrne, 2006)
Factor loading (Standardised regression weight) should be greater than 0.5 and
preferably above 0.7 (Byrne, 2006)
Modification indices (MI) that reveal a very high covariance and also
demonstrate high regression weights should be deleted (Byrne, 2006; Hair et al.,
2010).
In terms of the British sample, the results revealed that only two items SE4 (3.9)
and SE5 (4.9) had a standardised regression weight below 0.5 (see Appendix H).
Furthermore, the standardised residuals values showed that items (SE4, SE5, FC4,
SN4 and FreqUsage) were not within the acceptable value |2.58|. In addition and
as can be shown in Table 6.2, the MI showed that items (FC3, FC4, SE4, SE5 and
SN4) had very high covariance.
Errors MI-covariance Path MI-regression weight
e27 e28 179.176 FC3 FC4 104.479
FC4 FC3 77.914
e23 e24 185.263 SE4 SE5 155.086
SE5 SE4 137.600
e14 e31 35.596 SN4 BI1 38.838
BI1 SN4 27.082
Table 6-2: British sample selected text output
To ensure a good fit model and as can be shown in Table 6.2, some indicators
(SE4,SE5, FC4, SN4) have to be deleted from the initial measurement model for
the British sample since they were demonstrating high covariance and also had
high regression weight (Byrne, 2006). The process was to delete one indicator at
a time and then re-estimate the model.
Regarding the Lebanese sample and following the recommended criteria
mentioned above, the output from AMOS revealed that only one items SE5 (3.41)
had a standardised regression weight below 0.5 (see Appendix F-2). In addition,
the standardised residuals values showed that items’ value for (SE4, SE5, QWL3,

Chapter 6: Model Testing
Ali Tarhini 153
FC4, PEOU2) were not within the recommended range |2.58|. Furthermore and as
can be shown in Table 6.3, the MI showed that items (FC3, FC4, SE4, SE5,
QWL3) had high covariance.
Errors MI-covariance Path MI-regression weight
e27 e28 108.302 FC3 FC4 48.749
FC4 FC3 30.090
e23 e24 87.482 SE4 SE5 76.520
SE5 SE4 62.227
e17 e18 52.362 QWL3 QWL4 18.331
QWL4 QWL3 20.332
Table 6-3: Lebanese sample selected text output
In this regards, items (SE4, SE5, FC4 and QWL3) have to be deleted from the
initial measurement model in order to achieve a good fit model. Table 6.4 shows
the level of acceptance fit and the fit indices for the Lebanese sample after the
improvement in model fit.
Fit Index Recommended
Value (Hair, 2006)
England Lebanon
χ 2 Non-significant at p
<0.05 840.368 866.050
Degrees of freedom (df) n/a 349 349
χ 2 /df <5 preferable <3 2.408 2.482
Goodness-of-fit index (GFI) >0.90 .908 .902
Adjusted Goodness-of-fit index (AGFI) >0.80 .886 .873
Comparative fit index (CFI) >0.90 .963 .951
Root mean square residuals (RMSR) <0.10 .063 .067
Root mean square error of approximation
(RMSEA) <0.08 .048 .051
Normed fit index (NFI) >0.90 .939 .922
Parsimony normed fit index (PNFI) >0.60 .807 .792
Table 6-4: England and Lebanon final measurement model fit
After achieving the good measurement model for both samples, we can proceed to
assess the validity and reliability in order to evaluate whether the psychometric
properties of the measurement model are adequate.

Chapter 6: Model Testing
Ali Tarhini 154
6.2.2 Construct Validity and reliability
It is an essential step before proceeding to test the hypotheses in the proposed
conceptual model to examine the validity and reliability of the measures as this
may affect the results and thus the objective of the research (Hair et al., 2010).
Although these two tests are separate from each other, they are closely related
(Bollen, 1989). According to Holmes-Smith (2011), a measure may have high
reliability (consistency) but not be valid (accurate), and a measure may have high
validity (accuracy) but not be reliable (consistent). Hair et al. (2010) defined
validity as “extent to which a set of measured variables actually represent the
theoretical latent construct they are designed to measure”. Construct validity can
be examined by convergent validity, discriminant validity and nomological
validity.
Convergent validity refers “to the extent to which measures of a specific construct
should converge or share a high proportion of variance in common” (Hair et al.,
2010). In other words, it is the degree to which two measures of constructs that
theoretically should be correlated (related), are in fact correlated (related),
whereas discriminant validity; also known as divergent validity; is the extent to
which a construct or concepts is not unduly related to other similar, yet distinct,
constructs (Hair et al., 2010).
According to (Hair et al., 2010), validity and reliability can be measured using:
“Composite Reliability (CR), Average Variance Extracted (AVE), Maximum
Shared Squared Variance (MSV) and Average Shared Squared Variance (ASV)”.
To establish reliability, Hair et al. (2010) suggest that CR should be greater than
0.6 and preferably above 0.7. To establish convergent validity the AVE should be
greater than 0.5 and CR is greater than the AVE, discriminant validity is
supported if MSV is less than AVE and ASV is less than AVE. According to
Tabachnick and Fidell (2007), convergent validity can be assessed using factor
loading and AVE. However, AMOS does not automatically calculate the AVE
and CR for each construct. Therefore the researcher followed the following two
formulas.

Chapter 6: Model Testing
Ali Tarhini 155
According to Fornell and Larcker (1981), the AVE can be calculated using the
following formula:
AVE= (summation of squared factor loadings)/(summation of squared factor
loadings) (summation of error variances).
∑
In the formula mentioned above represents factor loadings (standardised
regression weights) and represents the total number of items.
Regarding the CR, it can be calculated using the following formula (Chau and Hu,
2001):
CR = (square of summation of factor loadings)/(square of summation of factor
loadings) + (summation of error variances).
(∑
)
((∑ )
(∑
))
In the formula mentioned above represents factor loadings (standardised
regression weights) and represents the total number of items and represents
the error variance term for each latent construct.
In terms of the British sample and as can be shown in Table 6.5, the average
extracted variances were all above 0.575 and above 0.725 for CR. Therefore, all
factors have adequate reliability and convergent validity. Additionally, the total
AVE of the average value of variables employed within the proposed model is
larger than their correlation value, except of AU (MSV>AVE), thus there were
discriminant validity issues. However, since AU is measured by two items only,
deleting one of the variables might cause un-identification problems, we thus
established discriminant validity.

Chapter 6: Model Testing
Ali Tarhini 156
Factor Correlation Matrix with √AVE on the diagonal
CR AVE MSV ASV SE PU PEOU SN QWL FC AU BI
SE 0.907 0.765 0.711 0.370 0.875
PU 0.922 0.703 0.507 0.393 0.567 0.839
PEOU 0.925 0.711 0.416 0.328 0.624 0.645 0.843
SN 0.838 0.633 0.271 0.207 0.391 0.521 0.385 0.795
QWL 0.889 0.617 0.579 0.343 0.493 0.699 0.563 0.436 0.785
FC 0.893 0.738 0.516 0.360 0.653 0.580 0.580 0.458 0.560 0.859
AU 0.725 0.575 0.711 0.414 0.843 0.638 0.529 0.467 0.518 0.718 0.758
BI 0.898 0.745 0.579 0.425 0.586 0.712 0.637 0.507 0.761 0.616 0.707 0.863
Table 6-5: Construct reliability, convergent & discriminant validity for the British sample
Regarding the Lebanese sample and as can be shown in Table 6.6, all items
loading were above 0.631 where the cut-off value is 0.5. In addition, the factor
loading for all the average extracted variances were all above 0.521 and above
0.704 for CR. Therefore, all factors have adequate reliability and convergent
validity. Additionally, the total AVE of the average value of variables used for the
research model is larger than their correlation value; therefore we also established
discriminant validity.
Factor Correlation Matrix with √AVE on the diagonal
CR AVE MSV ASV SE PU PEOU SN QWL FC AU BI
SE 0.895 0.740 0.392 0.234 0.860
PU 0.904 0.655 0.293 0.191 0.317 0.809
PEOU 0.929 0.723 0.281 0.225 0.522 0.512 0.850
SN 0.824 0.542 0.188 0.146 0.383 0.356 0.343 0.736
QWL 0.836 0.563 0.460 0.255 0.444 0.541 0.492 0.425 0.750
FC 0.897 0.744 0.392 0.238 0.626 0.294 0.502 0.364 0.475 0.863
AU 0.733 0.521 0.402 0.238 0.527 0.441 0.387 0.361 0.436 0.570 0.705
BI 0.871 0.694 0.460 0.301 0.499 0.525 0.530 0.434 0.678 0.500 0.634 0.833
Table 6-6: Construct reliability, convergent & discriminant validity for the Lebanese sample
Therefore, after checking the goodness of fit indices in addition to validity and
reliability, the final refined model results in deleting SE4, SE5, FC4 and SN4
from the British sample. The final measurement model is depicted in Figure 6.2.

Chapter 6: Model Testing
Ali Tarhini 157
Figure 6-2: The refined measurement model for the British sample
The refined model results in deleting SE4, SE5, FC4 and QWL3 from the
Lebanese sample. The final measurement model is depicted in Figure 6.3.

Chapter 6: Model Testing
Ali Tarhini 158
Figure 6-3: The refined measurement model for the Lebanese sample

Chapter 6: Model Testing
Ali Tarhini 159
6.3 Analysis of the Structural Model and
Hypotheses testing
Having established reliability, convergent validity and discriminant validity for
both samples, the next step is to test the relationships between the exogenous and
endogenous latent variables which can be done during the structural model stage
(Arbuckle, 2009; Hair et al., 2010).
Unlike the CFA, there is a need to distinguish between dependent and
independent variables. SEM assumes the covariance between the independent
variables, which is represented by two-headed arrows, whereas the causal
relationship from an independent variable to a dependent variable is represented
by one-arrow. Therefore, the relationship between constructs is specified after the
transition from the measurement model to the structural model.
The results of the analysis of the structural model will be discussed in separate
subsections.
6.3.1 Testing the Structural Model for the British sample
The structural model for the British sample is depicted in Figure 6.4.

Chapter 6: Model Testing
Ali Tarhini 160
Figure 6-4: the structural model for the British sample Note: the covariance (the two-headed
arrows) between the independent variables was deleted for the purpose of presentation.
Based on the same criteria used for measurement model to measure the goodness-
of-fit for the proposed model, the results of the fit indices for the first run were as
follows: [CMIN=892.592; df= 355; CMIN/DF = 2.514; GFI=.903; AGFI=.882;

Chapter 6: Model Testing
Ali Tarhini 161
CFI=.960; RMSR=.069, RMSEA=.050, NFI=.935; PNFI=.818] indicating a very
good fit of the model. Thus, we proceed to examine the hypothesized relationships
within the model. Table 6.7 depicts the path coefficients for the hypothesised
relationships within the proposed research model.
H# Proposed
Relationship
Effects Type Path
coefficient
Study Results
Perceived usefulness, Intention and Actual Usage Prediction
H1a PEOU (+) BI Direct effect 0.120** Supported
H2a PU (+) BI Direct effect 0.201*** Supported
H4a SN (+) BI Direct effect 0.082* Supported
H5a QWL (+) BI Direct effect 0.430*** Supported
H6a SE (+) BI Direct effect 0.054 Not supported
H7a SE (+) AU Direct effect 0.282*** Supported
H8a FC(+) AU Direct effect 1.00** Supported
H3a BI (+) AU Direct effect 0.175*** Supported
H9a SN (+) PU Direct effect 0.299*** Supported
H10a PEOU (+) PU Direct effect 0.398*** Supported
Notes: * p<0.1; ** p<0.05; *** p<0.01; NS p>0.1
Table 6-7: The summary of results for the Direct Hypotheses for the British sample
As can be shown in Table 6.7, 9 out of 10 direct hypotheses were supported in the
model. PEOU (=0.12**) and PU (=0.201***) were found to have a significance
positive influence on behavioural intention to use web-based learning system,
supporting H1a and H2a. The influence of colleagues and instructors on students’
behavioural intention to use the system was significant, SN (=0.082*) supporting
H4a. Moreover, BI was also influenced by the quality of work life (=0.430***)
which supports H5a. However, the data fails to support the direct relationship
between SE (=0.054) and BI, indicating that H6a was rejected. The results of the
squared multiple correlations (SMC), which provides information about the extent
to which the model explains variance in the dataset, indicated that PEOU, PU,
SN,SE and QWL account for 68% (R2 = 0.68) of the variance of BI, with QWL
contributing the most to behavioural intention compared to the other constructs.
The results indicate that the higher the perceived ease of use, perceived
usefulness, subjective norm, quality of work life, the higher behavioural intention
to use the web-based learning system in education. Additionally, SN (=0.299***)
and PEOU (=0.398***) were found to have a significance positive influence on

Chapter 6: Model Testing
Ali Tarhini 162
PU, supporting H9a and H10a. Together SN and PEOU explained 54.1% of the
variance in PU with PEOU contributing the most.
AU is affected directly by BI, SE, and FC and indirectly by PEOU, PU, SN, SE
and QWL. The indirect effect is the product of the paths that are linked to the
dependent variable. The total indirect effect is the sum of all these paths. The
results of the direct, indirect and total effects on AU are presented in Table 6.8.
H# Variables Direct Indirect Total
PEOU - 0.039 0.039
PU - 0.035 0.035
SN - 0.27 0.27
SE - 0.018 0.018
QWL - 0.076 0.076
H7a SE 0.282*** - 0.284***
H8a FC 0.1** - 0.1***
H3a BI 0.175*** - 0.175***
Notes: * p<0.1; ** p<0.05; *** p<0.01; NS p>0.1
Table 6-8: The summary of Direct, Indirect, and Total Effects in predicting actual
usage for the British sample
Table 6.8 shows that both SE and FC have a strong direct positive effect on AU
(=0.284*** and =0.1**) which supports H7a and H8a respectively. AU is also
positively influenced by BI (ß=0.175***), supporting H3a. The results indicate
that BI, SE and FC account for 79 % (R2 = 0.79) of the variance of AU, with SE
contributing the most to actual usage compared to the other constructs.
In conclusion, there was no need for model refinement for the British sample as
the first run indicates that all the indices were in the acceptable level.
Furthermore, the results of the structural model revealed that all the hypothesised
relationships were supported except the relationship between SE and BI. The next
subsection reports the testing of the structural model for the Lebanese sample.
6.3.2 Testing the Structural Model for the Lebanese
sample
The structural model for the Lebanese sample is depicted in Figure 6.5.

Chapter 6: Model Testing
Ali Tarhini 163
Figure 6-5: the structural model for the Lebanese sample Note: the covariance (the two-
headed arrows) between the independent variables was deleted for the purpose of presentation.
As with the British sample, the results of the fit indices for the first run of the
Lebanese sample suggest a good fit of the model [CMIN=898.677; df= 355;
CMIN/df = 2.531; GFI=.894; AGFI=.871; CFI=.949; RMSR=.074,

Chapter 6: Model Testing
Ali Tarhini 164
RMSEA=.052, NFI=.915; PNFI=.803]. Therefore, the second stage is to examine
the hypothesized relationships within the proposed research model. The results of
the path coefficients for the hypothesised relationships within the proposed
research model are presented in Table 6.9.
H# Proposed
Relationship
Effects Type Path
Coefficient
Study Results
Behavioural Intention and Actual Usage Prediction
H1b PEOU (+) BI Direct effect 0.106* Supported
H2b PU (+) BI Direct effect 0.195*** Supported
H4b SN (+) BI Direct effect 0.095* Supported
H5b QWL (+) BI Direct effect 0.408*** Supported
H6b SE (+) BI Direct effect 0.041 Not supported
H7b SE (+) AU Direct effect 0.105* Supported
H8b FC(+) AU Direct effect 0.176*** Supported
H3b BI (+) AU Direct effect 0.374*** Supported
H9 b SN(+) PU Direct effect 0.167** Supported
H10 b PEOU(+) PU Direct effect 0.318*** Supported
Notes: * p<0.1; ** p<0.05; *** p<0.01; NS p>0.1
Table 6-9: The summary of results for the Direct Hypothesized relationships for the
Lebanese sample
The factor loadings (regression weights) output in AMOS indicate that 9 out of 10
hypothesised relationships for the Lebanese sample were supported (refer to Table
6.9). More specifically, both PEOU (=0.106*) and PU (=0.195***) were found
to have a strong significant positive influence on BI to use web-based learning
system, hence H1b and H2b were supported. Additionally, the hypothesised path
from SN (=0.095*) to BI was also significant, supporting H4b. Moreover, BI was
also influenced by QWL (=0.408***) which supports H5b. However, contrary to
our expectation, the hypothesised relationship between SE (=0.041) and BI was
rejected. PEOU, PU, SN and QWL account for 57% (R2 = 0.57) of the variance of
BI, and similar to the British sample, QWL contributed the most to behavioural
intention compared to the other constructs. Furthermore, PU was found to be
influenced by SN (=0.167**) and PEOU (=0.318***), supporting H9b and
H10b. Both SN and PEOU explained 32% of the PU.

Chapter 6: Model Testing
Ali Tarhini 165
The results of the direct, indirect and total effects on AU are presented in Table
6.10.
Variables Direct Indirect Total
PEOU - 0.068 0.068
PU - 0.073 0.073
SE - 0.048 0.048
SN - 0.043 0.043
QWL - 0.154 0.154
SE 0.105* - 0.105*
FC 0.176*** - 0.174***
BI 0.374*** - 0.374***
Notes: * p<0.1; ** p<0.05; *** p<0.01; NS p>0.1
Table 6-10: Direct, Indirect, and Total Effects in predicting actual usage for the
Lebanese sample
As can be shown in Table 6.10, the direct path from SE (=0.105*) and FC
(=0.176***) is significant, which supports H7b and H8b respectively.
Furthermore, actual usage is influenced by the behavioural intention
(ß=0.374***), supporting H3b. The results of the squared multiple correlation
indicate that BI, SE and FC account for 52 % (R2 = 0.52) of the variance of AU
(indicating a reasonable explanation for AU), with BI having the highest impact
on the actual usage compared to the other constructs. These results indicate that
the higher the level of behavioural intention, the higher the actual usage will be.
Overall, the results indicated that there was no need to refine the model since the
first run indicates that all the fit indices were within an acceptable range. The
results also indicate that; except for the relationship between SE and BI; all the
other hypothesised direct relationships were supported. A detailed discussion
about the results will take place in Chapter 7.
In summary, the determinants PEOU, PU, SN, SE and QWL accounted for 68%
and 57% of the variance of BI for the British and Lebanese sample, respectively.
Moreover, the determinants SE, FC and BI accounted for 79% of the variance of
AU for the British sample and 52% for the Lebanese sample.

Chapter 6: Model Testing
Ali Tarhini 166
The refined model indicated that the similarities between the Lebanese and British
model are greater than the differences. More specifically, PEOU, PU, SE, FC, BI
and AU were represented with the same indictors, whereas differences were
detected in terms of SN (SN4 was deleted from the British sample) and QWL
(QWL3 was deleted from the Lebanese sample).
Having tested the direct path for both samples, the next step is to test the
moderating effect of culture and other demographic characteristics on the
relationships between the 6 exogenous (PEOU, PU, SN, QWL, SE, FC) and the
two endogenous (BI and AU) constructs.
6.4 Moderating effects
This section will discuss the moderating effect of Hofstede’s four cultural
dimensions (MF, ID, PD, UA) at the individual level as well as four demographic
variables (gender, age, educational level and experience) on the relationships
between the exogenous (PEOU, PU, SN, QWL and FC) and the endogenous (BI
and AU) latent constructs.
The impacts of these moderators were investigated through using multi-group
analysis. In this approach, the data-sample is divided into subsamples and then the
same structural model is run at the same time for both samples. It is then followed
by pairwise comparison in path coefficients across the two groups (high vs. low),
considering the critical ratio for differences among the groups in order to establish
a reliability and validity. However, following Hair et al. (2010) recommendation,
we first examined the assessment of the measurement model (i.e. goodness of fit
including discriminant and convergent in addition to reliability for each construct)
before proceeding to examine the impacts of moderators on relationship between
the constructs. The hypotheses related to the moderating impact of culture and
other individual variables have been identified in Chapter 3 during the model
development stage.

Chapter 6: Model Testing
Ali Tarhini 167
6.5 Moderating Effects within the British dataset
This section will discuss the moderating effect of Hofstede’s four cultural
dimensions at the individual level, as well as, four demographic variables namely
gender, age, educational level and experience on the relationships between the
exogenous (PEOU, PU, SN, QWL and FC) and the endogenous (BI and AU)
latent constructs within the British model.
6.5.1 Hofstede’s Cultural Dimensions
This section will report the results of the moderating impact of Hofstede’s four
cultural dimensions (PD, MF, IC, UA) on the key factors that affect the
behavioural intention and actual usage of the we-based learning system.
6.5.1.1 Power distance
The construct PD was measured in the survey questionnaire by five items using 7-
point scales. The overall mean was 2.567/7 indicating a very low PD culture.
Since the moderating construct PD in metric is nature, we used median-split
method to transfer the metric scale into a nonmetric (categorical) scale (Hair et al.,
2010). Out of the 602 respondents, there were 307 students within the low PD
group (median<=2.4) and 295 within the high PD group (median>2.4).
Applying the measurement model for each group separately revealed the
following: for the low-PD group [χ² =658.380; df= 349; χ²/df= 1.964; GFI =.866;
AGFI=.833; CFI=.926; RMSR=.061; RMSEA=.056, NFI=.862; PNFI=.741] and
[χ² =566.435; df= 349; χ²/df= 1.623; GFI =.883; AGFI=.854; CFI=.964;
RMSR=.078; RMSEA=.046, NFI=.911; PNFI=.783] for the high-PD group,
indicating an acceptable fit of the data.
Table 6.11 shows that the CR and AVE values within both samples were all above
0.7 and above 0.5 respectively and therefore all factors have satisfactory reliability
and convergent validity. Additionally, except for AU in high-PD group, the MSV

Chapter 6: Model Testing
Ali Tarhini 168
for all other constructs is less than AVE and the square root of AVE is higher than
their correlation value, which indicates that discriminant validity is also
established for both samples.
Factor Correlation Matrix with √AVE on the diagonal (Power Distance: low level group)
Factor CR AVE MSV ASV SE PU PEOU SN QWL FC AU BI
SE 0.869 0.689 0.441 0.238 0.830
PU 0.883 0.603 0.335 0.200 0.387 0.776
PEOU 0.883 0.602 0.412 0.212 0.642 0.512 0.776
SN 0.819 0.602 0.111 0.054 0.190 0.255 0.197 0.776
QWL 0.858 0.548 0.308 0.132 0.283 0.538 0.253 0.145 0.740
FC 0.788 0.564 0.331 0.210 0.573 0.421 0.575 0.333 0.348 0.751
AU 0.711 0.514 0.441 0.149 0.664 0.346 0.366 0.165 0.193 0.341 0.666
BI 0.806 0.581 0.335 0.233 0.468 0.579 0.491 0.281 0.555 0.534 0.407 0.762
Factor Correlation Matrix with √AVE on the diagonal (Power Distance: high level group)
Factor CR AVE MSV ASV SE PU PEOU SN QWL FC AU BI
SE 0.856 0.666 0.542 0.229 0.816
PU 0.918 0.691 0.480 0.340 0.430 0.831
PEOU 0.931 0.730 0.396 0.256 0.462 0.599 0.854
SN 0.819 0.602 0.320 0.193 0.275 0.566 0.361 0.776
QWL 0.886 0.609 0.534 0.358 0.433 0.693 0.629 0.517 0.780
FC 0.897 0.747 0.587 0.280 0.508 0.495 0.462 0.374 0.536 0.864
AU 0.705 0.543 0.587 0.346 0.736 0.602 0.367 0.421 0.503 0.766 0.607
BI 0.893 0.735 0.634 0.340 0.373 0.655 0.585 0.492 0.796 0.476 0.608 0.858
Table 6-11: Construct reliability, convergent & discriminant validity for PD
The results presented in Table 6.12 show that the cultural variable power distance
was found to moderate the relationship between PU and BI (supporting H11a2),
SN and BI (supporting H11a3), QWL and BI (supporting H11a4). The
relationship was stronger for low-PD group in terms of PU and BI, QWL and BI,
while the relationship was stronger for high-PD group in terms of SN and BI.
Contrary to our expectation, PD did not moderate the relationship between PEOU
and BI (rejecting H11a1), SE and AU (rejecting H11a5), FC and AU (rejecting
H11a6). These results indicate that hypothesis H11a was partially supported.
Overall, the R2 for BI was 49.7% and 48.2% for AU within the low-PD group,
while within the high-PD group the variance explained (R2) for BI was 57.9% and
55.6% for AU which indicates a moderate fit for the low-group model and good
fit for the high-PD model.

Chapter 6: Model Testing
Ali Tarhini 169
Hypothesis
Low PD High PD
Z-score
Results R2 Estimate R
2 Estimate
PEOU BI
49.7%
0.184
57.9%
0.138 -0.479 Not supported
PU BI 0.241 0.125 -1.748* Supported
SN BI 0.267 0.344 1.684* Supported
QWLBI 0.458 0.307 -1.673* Supported
SEAU
48.2%
0.182
55.6%
0.195 0.219 Not supported
FCAU 0.121 0.158 0.325 Not supported
Notes: *** p-value < 0.01; ** p-value < 0.05; * p-value < 0.10
Table 6-12: The summary of the moderating effect of power distance
6.5.1.2 Masculinity/femininity
Six items were used to measure the moderating construct MF. The construct was
measured using 7-point scales. The overall mean was 2.535/7 indicating a
masculine culture. Since moderating construct MF is metric in nature, we used
median-split method to transfer the metric scale into a nonmetric (categorical)
scale. There were 290 within the masculine group (median<=2.833) and 312
within the feminine group (median>2.833).
The first run of the measurement model resulted the following fit for the low-MF
sample [χ² =637.930; df= 349; χ²/df= 1.828; GFI =.873; AGFI=.842; CFI=.950;
RMSR=.066; RMSEA=.053, NFI=.893; PNFI=.771] and [χ² =630.579; df= 349;
χ²/df= 1.807; GFI =.866; AGFI=.834; CFI=.957; RMSR=.08; RMSEA=.052,
NFI=.91; PNFI=.782] for the high-MF group which indicates a good fit of the
data.
The results presented in Table 6.13 show that the CR value is higher than 0.7 and
the AVE is higher than 0.5 for all the constructs within the two samples, which
indicates an adequate reliability and convergent validity. Except for the AU
construct for both samples, the MSV for all other constructs is less than AVE and
the square root of AVE is higher than their correlation value, therefore
discriminant validity is considered satisfactory for both samples.

Chapter 6: Model Testing
Ali Tarhini 170
Factor Correlation Matrix with √AVE on the diagonal (Masculinity: low level group)
Factor CR AVE MSV ASV SE PU PEOU SN QWL FC AU BI
SE 0.891 0.731 0.573 0.326 0.855
PU 0.905 0.655 0.493 0.319 0.515 0.809
PEOU 0.918 0.692 0.432 0.281 0.657 0.644 0.832
SN 0.850 0.654 0.166 0.114 0.317 0.337 0.325 0.809
QWL 0.886 0.609 0.461 0.229 0.385 0.649 0.411 0.278 0.780
FC 0.861 0.679 0.489 0.325 0.699 0.545 0.596 0.407 0.447 0.824
AU 0.725 0.502 0.573 0.275 0.757 0.478 0.424 0.316 0.355 0.651 0.709
BI 0.852 0.659 0.493 0.331 0.524 0.702 0.555 0.371 0.679 0.589 0.544 0.812
Factor Correlation Matrix with √AVE on the diagonal (Masculinity: high level group)
Factor CR AVE MSV ASV SE PU PEOU SN QWL FC AU BI
SE 0.896 0.742 0.711 0.325 0.861
PU 0.926 0.714 0.471 0.396 0.529 0.845
PEOU 0.923 0.707 0.421 0.315 0.546 0.607 0.841
SN 0.819 0.602 0.416 0.269 0.404 0.645 0.396 0.776
QWL 0.880 0.596 0.566 0.371 0.482 0.686 0.634 0.527 0.772
FC 0.903 0.759 0.534 0.333 0.564 0.559 0.529 0.467 0.587 0.871
AU 0.715 0.511 0.711 0.441 0.843 0.686 0.528 0.566 0.518 0.731 0.715
BI 0.905 0.760 0.599 0.416 0.522 0.675 0.649 0.576 0.774 0.569 0.712 0.872
Table 6-13: Construct reliability, convergent & discriminant validity for MF
Table 6.14 shows that masculinity/femininity cultural variable moderates the
relationship between PEOU and BI (supporting H12a1), PU and BI (supporting
H12a2), SN and BI (supporting H12a3) with the relationship found to be stronger
for masculine group in terms of PU and BI while the relationship was stronger for
feminine groups in terms of PEOU and BI and SN and BI. However, no
differences were found on the relationship between QWL and BI (rejecting
H12a4), SE and AU (rejecting H12a5), FC and AU (rejecting H12a6). The results
suggest that hypothesis H12a was partially supported. Overall, The R2 for BI was
61.1% and 63.4% for AU in the low-MF group, whereas the R2 for BI was 67.7%
and 72.5% for AU in the high-group indicating an acceptable model fit of the
data.

Chapter 6: Model Testing
Ali Tarhini 171
Hypothesis
High Masculine Low Masculine
Z-score
Results R2 Estimate R
2 Estimate
PEOU BI
61.1%
0.103
67.7%
0.278 1.656* Supported
PU BI 0.183 0.068 -1.889* Supported
SN BI 0.189 0.293 1.940* Supported
QWLBI 0.346 0.465 1.206 Not supported
SEAU
63.4% 0.127
72.5% 0.196 0.899 Not supported
FCAU 0.070 0.128 1.310 Not supported
Notes: *** p-value < 0.01; ** p-value < 0.05; * p-value < 0.10
Table 6-14: The summary of the moderating effect of masculinity\femininity
6.5.1.3 Individualism/collectivism
The moderating construct IC was measured by six items using 7-point scales. The
overall mean was 3.82/7 indicating a moderate individualism/collectivism culture.
Since the moderating construct IC is metric in nature, we used median-split
method to transfer the metric scale into nonmetric (categorical) scale. Out of the
602 respondents in the study, the low- IC group (median<=3.82) were 286
students and the high-IC group (median>3.82) were 316.
Applying the measurement model for each group separately revealed the
following: for the low-IC group [χ² =674.289; df= 349; χ²/df= 1.932; GFI =.865;
AGFI=.832; CFI=.953; RMSR=.076; RMSEA=.056, NFI=.909; PNFI=.781], and
[χ² =573.871; df= 349; χ²/df= 1.644; GFI =.885; AGFI=.857; CFI=.965;
RMSR=.068; RMSEA=.052, NFI=.914; PNFI=.786] for the high-PD group,
indicating an acceptable fit of the data.
Table 6.15 shows that the CR and AVE values for all the constructs within both
samples were all above 0.7 and above 0.5 respectively and therefore all factors
have satisfactory reliability and convergent validity. Additionally, except for AU
in both samples, the MSV for all other constructs is less than AVE and the square
root of AVE is higher than their correlation value, which indicates that
discriminant validity is also established for both samples.

Chapter 6: Model Testing
Ali Tarhini 172
Factor Correlation Matrix with √AVE on the diagonal (Individualism: low level group) Factor CR AVE MSV ASV SE PU PEOU SN QWL FC AU BI
SE 0.902 0.754 0.719 0.408 0.869
PU 0.932 0.732 0.539 0.407 0.591 0.856
PEOU 0.923 0.706 0.477 0.361 0.691 0.651 0.840
SN 0.871 0.693 0.280 0.229 0.427 0.529 0.364 0.832
QWL 0.901 0.645 0.569 0.351 0.509 0.701 0.540 0.478 0.803
FC 0.879 0.711 0.482 0.394 0.686 0.592 0.652 0.491 0.578 0.843
AU 0.746 0.599 0.719 0.434 0.848 0.646 0.587 0.527 0.530 0.694 0.774
BI 0.899 0.748 0.569 0.453 0.631 0.734 0.659 0.509 0.754 0.675 0.721 0.865
Factor Correlation Matrix with √AVE on the diagonal (Individualism: high level group)
Factor CR AVE MSV ASV SE PU PEOU SN QWL FC AU BI
SE 0.905 0.760 0.667 0.316 0.872
PU 0.910 0.669 0.465 0.368 0.529 0.818
PEOU 0.926 0.714 0.396 0.290 0.541 0.629 0.845
SN 0.785 0.550 0.261 0.184 0.345 0.505 0.419 0.742
QWL 0.875 0.585 0.575 0.320 0.454 0.682 0.583 0.378 0.765
FC 0.901 0.755 0.549 0.327 0.610 0.567 0.511 0.433 0.537 0.869
AU 0.724 0.533 0.667 0.377 0.817 0.629 0.447 0.384 0.475 0.741 0.730
BI 0.893 0.737 0.575 0.386 0.521 0.682 0.606 0.511 0.758 0.556 0.675 0.859
Table 6-15: Construct reliability, convergent & discriminant validity for IC
The results presented in Table 6.16 show that individualism\collectivism cultural
variable moderates the relationship between PEOU and BI (supporting H13a1),
PU and BI (supporting H13a2), SN and BI (supporting H13a3), FC and AU
(supporting H13a6). Specifically, the relationship was stronger for low-IC group
in terms of PU_BI, while the relationship was stronger for high-IC group in terms
of PEOU and BI, SN and BI, FC and AU. The results also show that no
differences were detected on the relationship between QWL_BI (rejecting H13a4)
and SE_AU (rejecting H13a5). This means that hypothesis H13a was partially
supported. Overall, The R2 for BI was 69.9% and for AU was 74.2% within the
low-IC group, while within the high-IC group the variance explained (R2) for BI
was 66.3% and 71.4% for AU, indicating an acceptable model.

Chapter 6: Model Testing
Ali Tarhini 173
Hypothesis
Individualism Collectivism
Z-score
Results R2 Estimate R
2 Estimate
PEOU BI
69.9%
0.153
66.3%
0.259 1.672* Supported
PU BI 0.265 0.103 -2.136** Supported
SN BI 0.095 0.168 1.702* Supported
QWLBI 0.398 0.289 -1.002 Not supported
SEAU
74.2% 0.239
71.4% 0.320 1.465
Not supported
FCAU 0.053 0.146 1.672* Supported
Notes: *** p-value < 0.01; ** p-value < 0.05; * p-value < 0.10
Table 6-16: The summary of the moderating effect of individualism/collectivism
6.5.1.4 Uncertainty Avoidance
Six items were used to measure the moderating construct UA. The construct was
measured using 7-point scales. The overall mean was 2.535/7 indicating a
moderate uncertainty avoidance culture. Since the moderating construct UA is
metric in nature, we used median-split method to transfer the metric scale into
nonmetric (categorical) scale. Out of the 602 respondents, the results of the
descriptive statistics showed that there are 324 students within the low UA group
(median<=4.4) and 278 within the high UA group (median>4.4).
The first run of the measurement model resulted the following fit for the low-UA
sample [χ² =689.260; df= 349; χ²/df= 2.001; GFI =.872; AGFI=.840; CFI=.955;
RMSR=.083; RMSEA=.056, NFI=.915; PNFI=.786] and [χ² =599.470; df= 349;
χ²/df= 1.718; GFI =.871; AGFI=.839; CFI=.955; RMSR=.067; RMSEA=.051,
NFI=.901; PNFI=.773] for the high-MF group, which also indicates a good fit of
the data.
As can be shown in Table 6.17, the CR values for all the constructs within both
samples were higher than 0.7 and therefore all factors have adequate reliability.
The results also show that the AVE is higher than 0.5 and that CR is higher than
AVE for all the constructs which establish a satisfactory convergent validity.
Additionally, Except for AU in both groups, the MSV for all other constructs is
less than AVE and the square root of AVE is higher than their correlation value,
therefore discriminant validity was also established for both samples.

Chapter 6: Model Testing
Ali Tarhini 174
Factor Correlation Matrix with √AVE on the diagonal (Uncertainty Avoidance: low level
group) Factor CR AVE MSV ASV SE PU PEOU SN QWL FC AU BI
SE 0.920 0.793 0.731 0.402 0.890
PU 0.930 0.727 0.554 0.427 0.600 0.853
PEOU 0.932 0.733 0.472 0.385 0.666 0.687 0.856
SN 0.849 0.654 0.287 0.226 0.424 0.491 0.438 0.808
QWL 0.897 0.635 0.552 0.361 0.517 0.722 0.612 0.435 0.797
FC 0.887 0.728 0.465 0.388 0.644 0.638 0.667 0.500 0.599 0.853
AU 0.748 0.601 0.731 0.418 0.855 0.658 0.580 0.490 0.514 0.614 0.775
BI 0.909 0.769 0.554 0.465 0.647 0.744 0.659 0.536 0.743 0.682 0.739 0.877
Factor Correlation Matrix with √AVE on the diagonal (Uncertainty Avoidance: high level group)
Factor CR AVE MSV ASV SE PU PEOU SN QWL FC AU BI
SE 0.880 0.711 0.646 0.316 0.843
PU 0.911 0.671 0.436 0.351 0.514 0.819
PEOU 0.913 0.678 0.364 0.254 0.562 0.572 0.823
SN 0.820 0.603 0.333 0.183 0.333 0.577 0.303 0.776
QWL 0.879 0.594 0.544 0.323 0.464 0.658 0.485 0.430 0.789
FC 0.889 0.730 0.681 0.342 0.643 0.536 0.491 0.409 0.545 0.855
AU 0.731 0.524 0.681 0.401 0.804 0.616 0.447 0.421 0.532 0.825 0.724
BI 0.881 0.713 0.613 0.375 0.499 0.660 0.603 0.461 0.783 0.557 0.665 0.844
Table 6-17: Construct reliability, convergent & discriminant validity for UA
Table 6.18 shows that only three paths were moderated by UA cultural variable.
These paths were PU_BI (supporting H14a2), SN_BI (supporting H140a3) and
FC_AU (supporting H14a6). More specifically, the relationship was stronger for
low-UA group in terms of PU_BI, while the relationship was stronger for high-
UA in terms of SN_BI and FC_AU. The results also show that no differences
were detected in the relationship between PEOU_BI (rejecting H14a1), QWL_BI
(rejecting H14a4) and SE_AU (rejecting H14a5). Thus it can be concluded that
hypothesis H14a was partially supported. It was also found that the R2 for BI was
68.7% and 64.5% for AU within the low-UA sample, while within the high-UA
sample the variance explained (R2) for BI was 63.8% and 66.4% for AU,
indicating an acceptable model fit.

Chapter 6: Model Testing
Ali Tarhini 175
Hypothesis
Low UA High UA
Z-score
Results R2 Estimate R
2 Estimate
PEOU BI
68.7%
0.163
63.8%
0.208 0.720 Not supported
PU BI 0.289 0.101 -1.829* Supported
SN BI 0.132 0.238 1.848* Supported
QWLBI 0.369 0.307 -.506 Not supported
SEAU
64.5%
0.078
66.4%
0.145 1.019 Not supported
FCAU 0.067 0.132 1.692* Supported
Notes: *** p-value < 0.01; ** p-value < 0.05; * p-value < 0.10
Table 6-18: The summary of the moderating effect of Uncertainty Avoidance
6.5.2 Demographic Characteristics of British sample
This section will report the results of the moderating impact of the demographic
characteristics namely gender, age, educational level and experience; on the
relationships within the British model.
6.5.2.1 Gender
Since gender was nonmetric (categorical) in nature, there was no need to refine
the division of the groups within the sample (Hair et al., 2010). Out of the 602
respondents in the survey, there were 315 males and 287 females. It is essential to
test whether each group achieve an adequate fit for the data separately before
proceeding with testing the effect of moderators on the relationship between
exogenous (independent) and endogenous (dependent) constructs (Hair et al.,
2010).
The first run of the model revealed the following results for the male group [χ²
=658.905; df= 349; χ²/df= 1.965; GFI =.867; AGFI=.834; CFI=.945;
RMSR=.074; RMSEA=.055, NFI=.895; PNFI=.769] and [χ² =608.282; df= 349;
χ²/df= 1.743; GFI =.871; AGFI=.839; CFI=.959; RMSR=.084; RMSEA=.051,
NFI=.909; PNFI=.782] for the female group, which indicate a good fit of the data.
As can be shown in Table 6.19, the CR for all the constructs within both sub-
samples were all above 0.7 and therefore all factors have adequate reliability. The

Chapter 6: Model Testing
Ali Tarhini 176
results also show that the AVE is higher than 0.5 and that CR is higher than AVE
for all the constructs which establish a satisfactory convergent validity.
Additionally, except for AU construct in both sub-samples, the MSV for all other
constructs is less than AVE and the square root of AVE is higher than their
correlation value, therefore discriminant validity was also established for both
sub-samples.
Factor Correlation Matrix with √AVE on the diagonal (Gender: Male group) Factor CR AVE MSV ASV SE PU PEOU SN QWL FC AU BI
SE 0.907 0.766 0.645 0.328 0.875
PU 0.905 0.657 0.480 0.320 0.522 0.810
PEOU 0.912 0.675 0.450 0.305 0.624 0.628 0.821
SN 0.790 0.557 0.222 0.129 0.303 0.384 0.314 0.746
QWL 0.879 0.593 0.445 0.249 0.423 0.609 0.447 0.344 0.770
FC 0.864 0.686 0.393 0.291 0.627 0.512 0.582 0.353 0.497 0.828
AU 0.728 0.583 0.602 0.332 0.803 0.559 0.515 0.321 0.428 0.603 0.764
BI 0.851 0.657 0.480 0.383 0.570 0.693 0.671 0.471 0.667 0.553 0.671 0.811
Factor Correlation Matrix with √AVE on the diagonal (Gender: Female group)
Factor CR AVE MSV ASV SE PU PEOU SN QWL FC AU BI
SE 0.884 0.718 0.669 0.318 0.847
PU 0.923 0.705 0.545 0.374 0.527 0.840
PEOU 0.923 0.707 0.371 0.266 0.542 0.596 0.841
SN 0.856 0.665 0.289 0.186 0.336 0.538 0.331 0.815
QWL 0.891 0.620 0.602 0.369 0.495 0.738 0.609 0.446 0.788
FC 0.897 0.746 0.520 0.323 0.595 0.554 0.494 0.426 0.556 0.863
AU 0.702 0.531 0.669 0.379 0.818 0.621 0.414 0.462 0.513 0.721 0.729
BI 0.914 0.779 0.654 0.382 0.520 0.678 0.561 0.443 0.809 0.589 0.657 0.883
Table 6-19: Construct reliability, convergent & discriminant validity for gender
The results of the multi-group analysis (MGA) presented in Table 6.20 show that
gender moderates the relationship between PU_BI (supporting H15a2), SN and BI
(supporting H15a3), QWL and BI (supporting H15a4),FC and AU (supporting
H15a6). Specifically, the relationship was stronger for males in terms of PU_BI
and QWL and BI, while the relationship was stronger for females in terms of SN
and BI, FC and AU. However, no differences were detected on the relationship
between PEOU and BI (rejecting H15a1), SE and AU (rejecting H15a5).
Therefore, the results indicate that hypothesis H15a was partially supported.
Overall, The R2 for BI was 66.7% and for AU was 69.1% within the male sample,

Chapter 6: Model Testing
Ali Tarhini 177
while within the female group the variance explained (R2) for BI was 67.8% and
73.3% for AU, which indicates a good fit of the data.
Hypothesis
Male Female
Z-score
Results R2 Estimate R
2 Estimate
PEOU BI
66.7%
0.214
67.8%
0.129 -0.839 Not supported
PU BI 0.106 0.271 2.219** Supported
SN BI 0.155 0.276 1.712* Supported
QWLBI 0.472 0.269 -2.169** Supported
SEAU
69.1%
0.242
73.3%
0.283 0.527 Not supported
FCAU 0.091 0.147 1.689* Supported
Notes: *** p-value < 0.01; ** p-value < 0.05; * p-value < 0.10
Table 6-20: The summary of the moderating effect of gender
6.5.2.2 Age
Similar to gender, the age was also ordinal in nature and therefore there was no
need to refine the division of the groups within the sample (Hair et al., 2010). In
our research, age was split into two groups; namely younger (age<=22) and older
age groups (age> 22). Out of the 602 respondents, there were 370 students within
the younger-age group and 232 students within the older-age group.
The first run of the measurement model resulted the following fit for the younger-
age sample [χ² =681.412; df= 349; χ²/df= 1.952; GFI =.884; AGFI=.855;
CFI=.955; RMSR=.077; RMSEA=.055, NFI=.913; PNFI=.784] and [χ² =615.858;
df= 349; χ²/df= 1.765; GFI =.851; AGFI=.814; CFI=.932; RMSR=.065;
RMSEA=.058, NFI=.859; PNFI=.738] for the older-age group, which indicates a
good fit of the data. The results presented in Table 6.21 show that for all the
constructs within the two age group sub-samples the CR values were all above 0.7
and the AVE is higher than 0.5, therefore establishing adequate reliability and
convergent validity. Except for AU construct for younger-age group (age <=22),
the MSV for all other constructs is less than AVE and the square root of AVE is
higher than their correlation value, therefore discriminant validity was also
established for both samples.

Chapter 6: Model Testing
Ali Tarhini 178
Factor Correlation Matrix with √AVE on the diagonal (Age: group <=22) Factor CR AVE MSV ASV SE PU PEOU SN QWL FC AU BI
SE 0.872 0.695 0.682 0.285 0.834
PU 0.912 0.676 0.444 0.321 0.467 0.822
PEOU 0.919 0.695 0.310 0.234 0.501 0.552 0.833
SN 0.839 0.636 0.285 0.182 0.315 0.534 0.354 0.797
QWL 0.880 0.595 0.561 0.296 0.406 0.666 0.505 0.438 0.771
FC 0.885 0.723 0.444 0.293 0.601 0.499 0.496 0.430 0.504 0.850
AU 0.717 0.508 0.516 0.340 0.826 0.565 0.385 0.414 0.452 0.666 0.713
BI 0.894 0.738 0.561 0.351 0.469 0.655 0.557 0.468 0.749 0.556 0.639 0.859
Factor Correlation Matrix with √AVE on the diagonal (Age: group >22)
Factor CR AVE MSV ASV SE PU PEOU SN QWL FC AU BI
SE 0.916 0.785 0.504 0.293 0.886
PU 0.901 0.645 0.441 0.280 0.500 0.803
PEOU 0.892 0.625 0.429 0.264 0.655 0.648 0.791
SN 0.792 0.561 0.132 0.064 0.267 0.259 0.168 0.749
QWL 0.855 0.543 0.333 0.174 0.379 0.564 0.416 0.170 0.737
FC 0.848 0.656 0.306 0.214 0.536 0.498 0.502 0.230 0.401 0.810
AU 0.737 0.504 0.500 0.239 0.710 0.467 0.435 0.264 0.241 0.553 0.731
BI 0.800 0.572 0.441 0.307 0.605 0.664 0.598 0.363 0.577 0.438 0.574 0.756
Table 6-21: Construct reliability, convergent & discriminant validity for Age
As can be shown in Table 6.22, the results of MGA show that age moderate the
relationships between PU_BI (supporting H16a2), SN and BI (supporting H16a3),
QWL and BI (supporting H16a4), SE and AU (supporting H16a5), with the
relationship stronger for the younger-age group in terms of PU_BI, while the
relationship was stronger for older-age group in terms of SN and BI, QWL and BI
and SE_AU. On the other hand, no moderating effect was found on the
relationship between PEOU and BI (rejecting H16a1) and FC and AU (rejecting
H16a6), which suggests that hypothesis H16a was partially supported. Overall,
The R2 for BI was 63.2% and for AU was 71.5% within the younger-age group,
while within the older-age group the variance explained (R2) for BI was 57.8%
and 56.4% for AU, which indicates a good fit of the data.
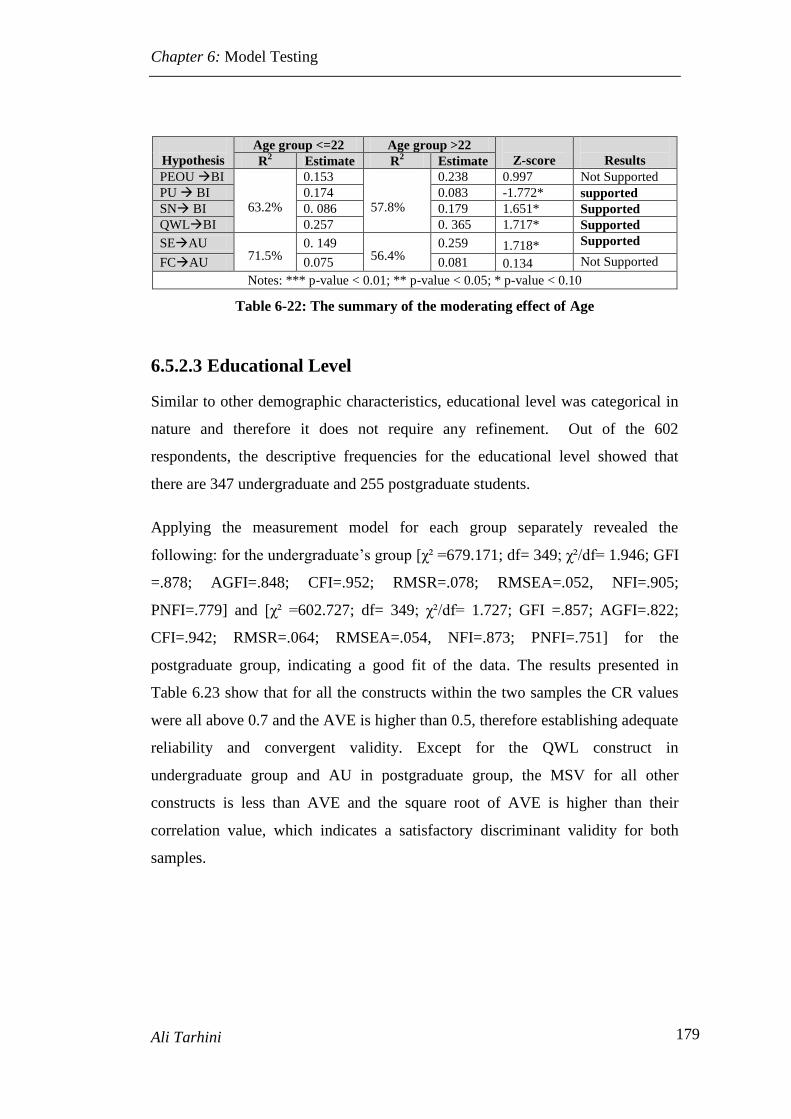
Chapter 6: Model Testing
Ali Tarhini 179
Hypothesis
Age group <=22 Age group >22
Z-score
Results R2 Estimate R
2 Estimate
PEOU BI
63.2%
0.153
57.8%
0.238 0.997 Not Supported
PU BI 0.174 0.083 -1.772* supported
SN BI 0. 086 0.179 1.651* Supported
QWLBI 0.257 0. 365 1.717* Supported
SEAU
71.5% 0. 149
56.4% 0.259 1.718* Supported
FCAU 0.075 0.081 0.134 Not Supported
Notes: *** p-value < 0.01; ** p-value < 0.05; * p-value < 0.10
Table 6-22: The summary of the moderating effect of Age
6.5.2.3 Educational Level
Similar to other demographic characteristics, educational level was categorical in
nature and therefore it does not require any refinement. Out of the 602
respondents, the descriptive frequencies for the educational level showed that
there are 347 undergraduate and 255 postgraduate students.
Applying the measurement model for each group separately revealed the
following: for the undergraduate’s group [χ² =679.171; df= 349; χ²/df= 1.946; GFI
=.878; AGFI=.848; CFI=.952; RMSR=.078; RMSEA=.052, NFI=.905;
PNFI=.779] and [χ² =602.727; df= 349; χ²/df= 1.727; GFI =.857; AGFI=.822;
CFI=.942; RMSR=.064; RMSEA=.054, NFI=.873; PNFI=.751] for the
postgraduate group, indicating a good fit of the data. The results presented in
Table 6.23 show that for all the constructs within the two samples the CR values
were all above 0.7 and the AVE is higher than 0.5, therefore establishing adequate
reliability and convergent validity. Except for the QWL construct in
undergraduate group and AU in postgraduate group, the MSV for all other
constructs is less than AVE and the square root of AVE is higher than their
correlation value, which indicates a satisfactory discriminant validity for both
samples.

Chapter 6: Model Testing
Ali Tarhini 180
Factor Correlation Matrix with √AVE on the diagonal (Educational level: Undergraduate group)
Factor CR AVE MSV ASV SE PU PEOU SN QWL FC AU BI
SE 0.866 0.684 0.613 0.263 0.827
PU 0.912 0.674 0.458 0.328 0.435 0.821
PEOU 0.919 0.695 0.298 0.234 0.496 0.536 0.834
SN 0.827 0.615 0.386 0.237 0.333 0.621 0.415 0.784
QWL 0.877 0.589 0.616 0.329 0.415 0.677 0.539 0.547 0.767
FC 0.880 0.714 0.456 0.281 0.560 0.490 0.457 0.486 0.502 0.845
AU 0.725 0.533 0.487 0.333 0.783 0.556 0.370 0.445 0.466 0.675 0.733
BI 0.898 0.747 0.616 0.351 0.440 0.655 0.546 0.505 0.785 0.512 0.634 0.864
Factor Correlation Matrix with √AVE on the diagonal (Educational level: postgraduate group)
Factor CR AVE MSV ASV SE PU PEOU SN QWL FC AU BI
SE 0.911 0.773 0.581 0.295 0.879
PU 0.895 0.630 0.406 0.259 0.505 0.794
PEOU 0.898 0.638 0.406 0.248 0.595 0.637 0.799
SN 0.827 0.616 0.138 0.061 0.276 0.210 0.141 0.785
QWL 0.864 0.561 0.300 0.147 0.326 0.548 0.347 0.096 0.749
FC 0.845 0.652 0.336 0.230 0.580 0.462 0.559 0.207 0.391 0.808
AU 0.733 0.516 0.581 0.241 0.762 0.451 0.404 0.308 0.236 0.494 0.718
BI 0.791 0.558 0.393 0.314 0.599 0.627 0.602 0.372 0.534 0.558 0.588 0.747
Table 6-23: Construct reliability, convergent & discriminant validity for educational
level
Table 6.24 shows that four paths were moderated by educational level. These
paths were PEOU_BI (supporting H17a1), SN and BI (supporting H17a3), QWL
and BI (supporting H17a4), FC and AU (supporting H17a6). Specifically, the
relationship was stronger for undergraduate students in terms of PEOU and BI,
SN and BI, FC and AU, while the relationship was stronger for postgraduates in
terms of QWL and BI. The results also show that no differences were detected on
the relationship between PU and BI (rejecting H17a2), SE and AU (rejecting
H17a5). Thus it can be concluded that hypothesis H17a was partially supported. It
was also found that the R2 for BI was 65.3% and 72.8% for AU in the
undergraduate sample, while in the postgraduate sample the variance explained
(R2) for BI was 58.3% and 60.3% for AU; indicating an acceptable model fit.

Chapter 6: Model Testing
Ali Tarhini 181
Hypothesis
Undergraduate Postgraduate
Z-score
Results R2 Estimate R
2 Estimate
PEOU BI
65.3%
0.288
58.3%
0.110 -2.164** Supported
PU BI 0.184 0.165 -0.186 Not supported
SN BI 0.154 0.031 -1.963** Supported
QWLBI 0.237 0.447 2.318** Supported
SEAU
72.8%
0.267
60.5%
0.234 -0.573 Not supported
FCAU 0.125 0.033 -2.47** Supported
Notes: *** p-value < 0.01; ** p-value < 0.05; * p-value < 0.10
Table 6-24: The summary of the moderating effect of educational level
6.5.2.4 Experience
The moderating variable experience was categorical in nature and therefore it does
not require any refinement. Experience was split into two categories: low-
experience, and experienced. The descriptive frequencies showed that there are
192 students having low level of experience, whereas the rest (N=410) were
experienced in using the web-based learning system.
Applying the measurement model for each group separately revealed the
following: for the some-experience group [χ² =576.472; df= 349; χ²/df= 1.652;
GFI =.827; AGFI=.784; CFI=.950; RMSR=.090; RMSEA=.058, NFI=.883;
PNFI=.759] and [χ² =760.074; df= 349; χ²/df= 2.178; GFI =.886; AGFI=.858;
CFI=.943; RMSR=.064; RMSEA=.054, NFI=.90; PNFI=.774] for the experienced
group, indicating an acceptable fit of the data.
As can be shown in Table 6.25, the CR for all the constructs within both samples
was higher than 0.7 and therefore all factors have adequate reliability. Except for
AU low-experience group, the AVE is higher than 0.5 and CR is higher than AVE
for all other constructs which indicate a satisfactory convergent validity.
Additionally, Except for AU construct in both samples, the MSV for all other
constructs is less than AVE and the square root of AVE is higher than their
correlation value, therefore discriminant validity is considered satisfactory for
both samples.

Chapter 6: Model Testing
Ali Tarhini 182
Factor Correlation Matrix with √AVE on the diagonal (Experience: low-experience group)
Factor CR AVE MSV ASV SE PU PEOU SN QWL FC AU BI
SE 0.886 0.723 0.616 0.331 0.850
PU 0.926 0.713 0.546 0.381 0.477 0.845
PEOU 0.930 0.725 0.452 0.320 0.580 0.649 0.852
SN 0.858 0.668 0.325 0.217 0.412 0.570 0.328 0.818
QWL 0.913 0.677 0.623 0.382 0.504 0.739 0.604 0.437 0.823
FC 0.919 0.792 0.672 0.385 0.639 0.561 0.540 0.473 0.622 0.890
AU 0.734 0.473 0.672 0.424 0.785 0.583 0.516 0.534 0.558 0.820 0.688
BI 0.910 0.772 0.623 0.424 0.555 0.704 0.672 0.468 0.789 0.630 0.688 0.879
Factor Correlation Matrix with √AVE on the diagonal (Experience: Experienced group)
Factor CR AVE MSV ASV SE PU PEOU SN QWL FC AU BI
SE 0.901 0.752 0.689 0.311 0.867
PU 0.886 0.608 0.355 0.279 0.535 0.779
PEOU 0.903 0.652 0.333 0.222 0.577 0.522 0.807
SN 0.807 0.583 0.180 0.120 0.279 0.370 0.308 0.763
QWL 0.848 0.529 0.464 0.222 0.399 0.561 0.417 0.333 0.728
FC 0.862 0.682 0.378 0.260 0.610 0.494 0.518 0.354 0.414 0.826
AU 0.729 0.580 0.689 0.330 0.830 0.596 0.428 0.339 0.400 0.615 0.761
BI 0.850 0.655 0.464 0.309 0.508 0.584 0.480 0.424 0.681 0.511 0.655 0.809
Table 6-25: Construct reliability, convergent & discriminant validity for experience
As can be shown in Table 6.26, experience was found to moderate the relationship
between PEOUBI (supporting H18a1), PUBI (supporting H18a2), SNBI
(supporting H18a3), SEAU (supporting H18a5), and FCAU (supporting
H18a6). The result shows that the relationship between PEOUBI, SNBI,
SEAU and FCAU was stronger for the low-experience group while the
relationship between PUBI was stronger for experienced group. On the other
hand, no moderating effect of experience on the relationship between QWLBI
was found. This results indicate that hypothesis H18a was partially supported.
Overall, the R2 for BI was 70.4% and for AU was 74.9% within the low-
experience group, whereas in the experienced group the R2 for BI was 55.9% and
66.7% for AU, indicating an acceptable model fit of the data.

Chapter 6: Model Testing
Ali Tarhini 183
Hypothesis
some-experience Experienced
Z-score
Results R2 Estimate R
2 Estimate
PEOU BI
70.4%
0.252
55.9%
0.112 -1.746* Supported
PU BI 0.097 0.262 1.687* Supported
SN BI 0.227 0.104 -1.695* Supported
QWLBI 0.246 0.308 0.577 Not Supported
SEAU
74.9% 0.309
66.7% 0.188 -2.083** Supported
FCAU 0.206 0.105 -2.466** Supported
Notes: *** p-value < 0.01; ** p-value < 0.05; * p-value < 0.10
Table 6-26: The summary of the moderating effect of experience
6.6 Moderating effects within the Lebanese
Sample
This section will report the moderating effect of Hofstede’s four cultural
dimensions (MF, ID, PD, UA) at the individual level as well as four demographic
variables namely gender, age, educational level and experience on the
relationships between the exogenous (PEOU, PU, SN, QWL and FC) and the
endogenous (BI and AU) latent constructs within the Lebanese dataset.
6.6.1 Hofstede’s Cultural Dimensions Lebanese sample
This section will report the results of the moderating impact of Hofstede’s four
cultural dimensions on the relationships within the Lebanese model.
6.6.1.1 Power distance
Out of the 569 respondents, the descriptive statistics showed that the overall mean
for PD was 3.1603/7 indicating a low PD culture. Using median-split method
(median= 3.0), there were 324 (median<=3) students within the low-PD group and
278 within the high-PD group (median >3).
The first run of the measurement model resulted the following fit for the low-PD
sample [χ² =669.837; df= 349; χ²/df= 1.710; GFI =.878; AGFI=.848; CFI=.949;
RMSR=.069; RMSEA=.049, NFI=.888; PNFI=.763] and [χ² =647.993; df= 349;
χ²/df= 1.857; GFI =.852; AGFI=.816; CFI=.957; RMSR=.098; RMSEA=.057,

Chapter 6: Model Testing
Ali Tarhini 184
NFI=.882; PNFI=.758] for the high-PD group, which also indicates a good fit of
the data. As can be shown in Table 6.27, the CR was higher than 0.7 and the AVE
was higher than 0.5 which satisfied the criteria for reliability and convergent
validity. Moreover, except for AU in the high-level PD group, the MSV for all
other constructs is less than the AVE and the square root of AVE is higher than
their correlation value, which indicates satisfactory discriminant validity for both
samples.
Factor Correlation Matrix with √AVE on the diagonal (Power Distance: low level group)
Factor CR AVE MSV ASV SE PU PEOU SN QWL FC AU BI
SE 0.876 0.705 0.291 0.152 0.840
PU 0.879 0.594 0.181 0.095 0.233 0.771
PEOU 0.924 0.708 0.199 0.121 0.446 0.426 0.842
SN 0.813 0.527 0.135 0.092 0.327 0.316 0.263 0.726
QWL 0.824 0.541 0.342 0.160 0.379 0.402 0.365 0.348 0.736
FC 0.903 0.757 0.291 0.117 0.539 0.169 0.336 0.247 0.394 0.870
AU 0.711 0.553 0.141 0.062 0.375 0.207 0.014 0.217 0.248 0.273 0.706
BI 0.838 0.637 0.342 0.145 0.358 0.305 0.387 0.368 0.585 0.315 0.256 0.798
Factor Correlation Matrix with √AVE on the diagonal (Power Distance: high level group)
Factor CR AVE MSV ASV SE PU PEOU SN QWL FC AU BI
SE 0.897 0.745 0.430 0.268 0.863
PU 0.919 0.694 0.397 0.235 0.331 0.833
PEOU 0.925 0.711 0.325 0.260 0.509 0.524 0.843
SN 0.799 0.509 0.236 0.183 0.410 0.365 0.367 0.713
QWL 0.838 0.566 0.498 0.289 0.440 0.615 0.546 0.471 0.752
FC 0.877 0.705 0.521 0.290 0.640 0.310 0.570 0.417 0.465 0.840
AU 0.712 0.514 0.590 0.353 0.656 0.507 0.495 0.459 0.469 0.722 0.628
BI 0.872 0.696 0.590 0.372 0.551 0.630 0.535 0.486 0.706 0.539 0.768 0.835
Table 6-27: Construct reliability, convergent & discriminant validity for PD
The results presented in Table 6.28 show that the cultural variable power distance
was found to moderate the relationship between PUBI (supporting H11b2),
SN_BI (supporting H11b3) and SEAU (supporting H11b5). The relationship
was stronger for the low-PD group in terms of PUBI while the relationship was
stronger for the high-PD group in terms of SNBI and SEAU. Contrary to our
expectation, PD did not moderate the relationship between PEOUBI (rejecting
H11b1), QWLBI (rejecting H11b4) and FCAU (rejecting H11b6). The
results indicate that hypothesis H11b was partially supported. Overall, the R2 for

Chapter 6: Model Testing
Ali Tarhini 185
BI was 40.3% and 51.9% for AU within the low-PD group, indicating a moderate
model fit, while within the high-PD group the variance explained (R2) for BI was
60.2% and 66.1% for AU, indicating a good fit for the high-PD model.
Hypothesis
Low PD High PD
Z-score
Results R2 Estimate R
2 Estimate
PEOU BI
40.3%
0.166
60.2%
0.202 0.606 Not supported
PU BI 0.256 0.133 -1.743* Supported
SN BI 0.087 0.153 1.677* Supported
QWLBI 0.341 0.320 -0.185 Not supported
SEAU
51.9% 0.108
66.1% 0.283 2.247**
Supported
FCAU 0.111 0.124 0.205 Not supported
Notes: *** p-value < 0.01; ** p-value < 0.05; * p-value < 0.10
Table 6-28: The summary of the moderating effect of power distance
6.6.1.2 Masculinity/femininity
The overall mean was 3.22/7 indicating a moderately masculine culture. Using the
median-split method, the descriptive statistics showed that there are 281 within
the low-MF group (median<=3) and 288 within the high-MF group (median>3).
Applying the measurement model for each group separately revealed the
following: for the low-MF group [χ² =544.599; df= 349; χ²/df= 1.589; GFI =.881;
AGFI=.852; CFI=.951; RMSR=.074; RMSEA=.054, NFI=.879; PNFI=.756] and
[χ² =667.890; df= 349; χ²/df= 1.914; GFI =.858; AGFI=.823; CFI=.942;
RMSR=.078; RMSEA=.057, NFI=.886; PNFI=.762] for the high-MF group,
indicating an acceptable fit of the data.
The results presented in Table 6.29 show that, except for AU in both samples, the
CR was higher than 0.7, which indicates that the constructs have adequate
reliability. Moreover, the results also show that the AVEs for all constructs were
higher than 0.5 which satisfied the criterion of convergent validity. Additionally,
except for AU in the high-level masculinity group, the MSV for all other
constructs is less than the AVE and the square root of AVE is higher than their
correlation value, which satisfied the criterion of discriminant validity for both
samples.

Chapter 6: Model Testing
Ali Tarhini 186
Factor Correlation Matrix with √AVE on the diagonal (Masculinity: low level group)
Factor CR AVE MSV ASV SE PU PEOU SN QWL FC AU BI
SE 0.875 0.702 0.375 0.131 0.838
PU 0.871 0.577 0.158 0.069 0.115 0.759
PEOU 0.914 0.681 0.114 0.073 0.300 0.337 0.825
SN 0.749 0.542 0.196 0.162 0.250 0.216 0.171 0.665
QWL 0.810 0.518 0.336 0.150 0.324 0.398 0.330 0.310 0.720
FC 0.894 0.739 0.375 0.128 0.612 0.130 0.307 0.255 0.395 0.859
AU 0.731 0.527 0.187 0.076 0.433 0.175 -0.017 0.211 0.298 0.290 0.690
BI 0.814 0.598 0.336 0.127 0.289 0.317 0.272 0.304 0.580 0.323 0.308 0.773
Factor Correlation Matrix with √AVE on the diagonal (Masculinity: high level group)
Factor CR AVE MSV ASV SE PU PEOU SN QWL FC AU BI
SE 0.893 0.738 0.349 0.261 0.859
PU 0.912 0.675 0.335 0.212 0.375 0.821
PEOU 0.929 0.723 0.349 0.267 0.591 0.538 0.850
SN 0.843 0.576 0.236 0.172 0.434 0.396 0.385 0.759
QWL 0.845 0.578 0.494 0.271 0.467 0.579 0.530 0.458 0.761
FC 0.887 0.725 0.423 0.240 0.551 0.282 0.542 0.370 0.447 0.851
AU 0.725 0.513 0.466 0.261 0.549 0.413 0.427 0.353 0.395 0.650 0.619
BI 0.880 0.711 0.494 0.343 0.570 0.559 0.568 0.486 0.703 0.496 0.683 0.843
Table 6-29: Construct reliability, convergent & discriminant validity for MF
Table 6.30 shows that masculinity\femininity cultural variable moderates the
relationship between PEOU_BI (supporting H12b1), SN_BI (supporting H18b3)
and SE_AU (supporting H12b5) with the relationship was stronger for low
masculinity group. However, no differences were found on the relationship
between PU_BI (rejecting H12b2), QWL_BI (rejecting H12b4), and FC_AU
(rejecting H12b6). The result suggests that hypothesis H12b was partially
supported. Overall, The R2 for BI was 47.2% and 43.4% for AU within the low-
MF group indicating a moderate model fit, while the R2 for BI was 58.7% and
56.9% for AU within the high-group, indicating a good model fit of the data.
Hypothesis
High Masculinity Low Masculinity
Z-score
Results R2 Estimate R
2 Estimate
PEOU BI
47.2%
0.102
58.7%
0.223 1.813* Supported
PU BI 0.180 0.143 -0.382 Not supported
SN BI 0.086 0.197 1.679* Supported
QWLBI 0.345 0.371 0.256 Not supported
SEAU
43.4% 0.139
56.9% 0.249 1.771* Supported
FCAU 0.209 0.148 -0.482 Not supported
Notes: *** p-value < 0.01; ** p-value < 0.05; * p-value < 0.10
Table 6-30: The summary of the moderating effect of masculinity\femininity

Chapter 6: Model Testing
Ali Tarhini 187
6.6.1.3 Individualism/collectivism
The results of the descriptive statistics showed that the overall mean for the
moderating construct IC was 5.011/7 indicating a collectivist cultural value. The
data were split into two groups using the median-split method, there were 338
students within the low-IC group (median<=5) and 231 within the high-MF group.
The first run of the measurement model resulted in the following fit for the low-IC
sample [χ² =646.667; df= 349; χ²/df= 1.853; GFI =.883; AGFI=.854; CFI=.954;
RMSR=.083; RMSEA=.050, NFI=.906; PNFI=.779] and [χ² =586.034; df= 349;
χ²/df= 1.679; GFI =.848; AGFI=.811; CFI=.945; RMSR=.081; RMSEA=.054,
NFI=.875; PNFI=.752] for the high-IC group, which also indicates a good fit of
the data. The results presented in Table 6.31 revealed that the CR and AVE were
higher than 0.7 and 0.5 respectively, which indicates an adequate reliability and
convergent validity. Furthermore, the AVE for all constructs is higher than the
MSV and also the square root of AVE is higher than their correlation value, and
therefore satisfactory discriminant validity was established for both samples.
Factor Correlation Matrix with √AVE on the diagonal (Individualism: low level group)
Factor CR AVE MSV ASV SE PU PEOU SN QWL FC AU BI
SE 0.905 0.763 0.367 0.223 0.873
PU 0.912 0.674 0.315 0.186 0.312 0.821
PEOU 0.932 0.734 0.267 0.203 0.449 0.511 0.857
SN 0.785 0.548 0.260 0.158 0.394 0.300 0.365 0.699
QWL 0.834 0.560 0.533 0.258 0.417 0.533 0.454 0.434 0.748
FC 0.897 0.744 0.367 0.218 0.606 0.260 0.463 0.380 0.454 0.863
AU 0.731 0.516 0.404 0.245 0.579 0.434 0.371 0.369 0.464 0.545 0.680
BI 0.881 0.713 0.533 0.320 0.483 0.561 0.517 0.510 0.730 0.479 0.636 0.844
Factor Correlation Matrix with √AVE on the diagonal (Individualism: high level group)
Factor CR AVE MSV ASV SE PU PEOU SN QWL FC AU BI
SE 0.865 0.683 0.426 0.269 0.826
PU 0.900 0.645 0.336 0.219 0.363 0.803
PEOU 0.927 0.719 0.426 0.274 0.653 0.530 0.848
SN 0.832 0.555 0.203 0.141 0.397 0.451 0.306 0.745
QWL 0.846 0.580 0.362 0.259 0.478 0.580 0.564 0.423 0.762
FC 0.898 0.747 0.397 0.253 0.630 0.348 0.555 0.323 0.482 0.864
AU 0.711 0.555 0.411 0.237 0.492 0.453 0.413 0.352 0.398 0.587 0.745
BI 0.861 0.677 0.411 0.290 0.549 0.501 0.563 0.350 0.602 0.514 0.641 0.823
Table 6-31: Construct reliability, convergent & discriminant validity for IC

Chapter 6: Model Testing
Ali Tarhini 188
The results presented in Table 6.32 show that individualism\collectivism cultural
variable moderates the relationship between SNBI (supporting H13b3),
SEAU (supporting H13b5) and FCAU (supporting H13b6). Specifically, the
relationship was stronger in the collectivistic group for all of them. The results
also show that no differences were detected on the relationship between PEOU_BI
(rejecting H13b1), PUBI (rejecting H13b2) and QWLBI (rejecting H13b4).
This means that hypothesis H13b was partially supported. Overall, The R2 for BI
was 54.3% and for AU was 47.7% within the low-IC group, while within the
high-IC group the variance explained (R2) for BI was 46.1% and 50.5% for AU,
indicating a moderate model fit.
Hypothesis
Individualism Collectivism
Z-score
Results R2 Estimate R
2 Estimate
PEOU BI
54.3%
0.113
46.1%
0.179 0.656 Not supported
PU BI 0.168 0.155 -0.042 Not supported
SN BI 0.128 0.279 1.71* Supported
QWLBI 0.383 0.231 -1.392 Not supported
SEAU
47.7%
0.084
50.5%
0.154 1.658* Supported
FCAU 0.125 0.266 1.727* Supported
Notes: *** p-value < 0.01; ** p-value < 0.05; * p-value < 0.10
Table 6-32: The summary of the moderating effect of individualism\collectivism
6.6.1.4 Uncertainty Avoidance
The overall mean for the moderating construct UA was 5.46/7, indicating a high
UA cultural value. Based on median-split method, the data was split into two
groups, there were 274 within the low-UA group (median <6) and 295 within the
high-UA level group (median >=6).
Applying the measurement model for each group separately revealed the
following: for the low-UA group [χ² =642.541; df= 349; χ²/df= 1.841; GFI =.858;
AGFI=.823; CFI=.946; RMSR=.078; RMSEA=.056, NFI=.889; PNFI=.764] and
[χ² =584.109; df= 349; χ²/df= 1.674; GFI =.886; AGFI=.850; CFI=.950;
RMSR=.079; RMSEA=.048, NFI=.886; PNFI=.762] for the high-UA group,
indicating an acceptable fit of the data. The results presented in Table 6.33
revealed that the CR and AVE were higher than 0.7 and 0.5 respectively, which

Chapter 6: Model Testing
Ali Tarhini 189
indicates an adequate reliability and convergent validity. Furthermore, the AVE
for all constructs is higher than the MSV and also the square root of AVE is
higher than their correlation value, and therefore satisfactory discriminant validity
was established for both samples.
Factor Correlation Matrix with √AVE on the diagonal (Uncertainty Avoidance: low level group)
Factor CR AVE MSV ASV SE PU PEOU SN QWL FC AU BI
SE 0.921 0.795 0.445 0.236 0.892
PU 0.919 0.694 0.331 0.197 0.277 0.833
PEOU 0.935 0.742 0.331 0.243 0.522 0.575 0.862
SN 0.827 0.547 0.213 0.169 0.434 0.409 0.396 0.739
QWL 0.796 0.536 0.483 0.251 0.434 0.505 0.528 0.449 0.704
FC 0.893 0.737 0.445 0.223 0.667 0.288 0.507 0.362 0.469 0.859
AU 0.715 0.518 0.350 0.200 0.539 0.398 0.379 0.348 0.362 0.456 0.695
BI 0.873 0.698 0.483 0.290 0.437 0.557 0.512 0.462 0.695 0.468 0.592 0.835
Factor Correlation Matrix with √AVE on the diagonal (Uncertainty Avoidance: high level group)
Factor CR AVE MSV ASV SE PU PEOU SN QWL FC AU BI
SE 0.847 0.652 0.279 0.188 0.808
PU 0.888 0.614 0.320 0.166 0.338 0.784
PEOU 0.913 0.679 0.228 0.150 0.444 0.395 0.824
SN 0.773 0.539 0.148 0.100 0.297 0.290 0.226 0.687
QWL 0.838 0.567 0.329 0.194 0.367 0.566 0.364 0.353 0.753
FC 0.894 0.738 0.416 0.192 0.502 0.244 0.424 0.312 0.380 0.859
AU 0.718 0.509 0.416 0.238 0.502 0.450 0.321 0.325 0.415 0.645 0.702
BI 0.849 0.655 0.413 0.260 0.528 0.478 0.477 0.385 0.574 0.441 0.643 0.809
Table 6-33: Construct reliability, convergent & discriminant validity for UA
Table 6.34 shows that four paths were moderated by the UA cultural variable.
These paths were PEOUBI (supporting H14b1), SNBI (supporting H14b3)
and FCAU (supporting H14b6). More specifically, the relationship was stronger
for users with high UA cultural values. The results also show that no differences
were detected in the relationship between PUBI (rejecting H14b2), QWLBI
(rejecting H14b4) and SEAU (rejecting H14b5). Thus, it can be concluded that
hypothesis H14b was partially supported. It was also found that the R2 for BI was
52.8% and 43.5% for AU within the low-UA sample, while within the high-UA
sample the variance explained (R2) for BI was 46.1% and 54.7% for AU,
indicating a moderate model fit.

Chapter 6: Model Testing
Ali Tarhini 190
Hypothesis
Low UA High UA
Z-score
Results R2 Estimate R
2 Estimate
PEOU BI
52.8%
0.129
46.1%
0.256 1.732* Supported
PU BI 0.197 0.134 -0.662 Not supported
SN BI 0.095 0.213 1.926* Supported
QWLBI 0.370 0.267 -0.895 Not supported
SEAU
43.5% 0.109
54.7% 0.134 0.383 Not supported
FCAU 0.128 0.277 2.387** Supported
Notes: *** p-value < 0.01; ** p-value < 0.05; * p-value < 0.10
Table 6-34: The summary of the moderating effect of Uncertainty Avoidance
6.6.2 Demographic Characteristics of Lebanese sample
This section will report the results of the moderating impact of four demographic
variables (age, gender, educational level and experience) on the relationships
between the main predictors and behavioural intention and usage of web-based
learning systems within the Lebanese model.
6.6.2.1 Gender
Out of the 569 respondents, the sample descriptive frequencies show that there are
306 males and 263 females. The first run of the model resulted in the following fit
for the male group [χ² =600.814; df= 349; χ²/df= 1.722; GFI =.877; AGFI=.847;
CFI=.946; RMSR=.082; RMSEA=.049, NFI=.881; PNFI=.754] and [χ² =606.026;
df= 349; χ²/df= 1.736; GFI =.862; AGFI=.829; CFI=.955; RMSR=.084;
RMSEA=.053, NFI=.901; PNFI=.755] for the female group, indicating an
acceptable fit of the data.
As shown in Table 6.35, only AU in male group had lower than the
recommended value (0.7), which indicates an adequate reliability for all the
factors. The results also show that the AVE values were all above 0.5 and that CR
is higher than AVE for all the constructs, which establish a satisfactory
convergent validity. Additionally, except for AU construct in the male group, the
MSV values for all other constructs is less than AVE values and the square root of
AVE is higher than their correlation values, which indicates satisfactory
discriminant validity for both samples.

Chapter 6: Model Testing
Ali Tarhini 191
Factor Correlation Matrix with √AVE on the diagonal (Gender: Male group)
Factor CR AVE MSV ASV SE PU PEOU SN QWL FC AU BI
SE 0.876 0.705 0.237 0.157 0.840
PU 0.881 0.599 0.205 0.118 0.237 0.774
PEOU 0.916 0.685 0.234 0.160 0.484 0.410 0.828
SN 0.781 0.583 0.218 0.185 0.292 0.262 0.277 0.695
QWL 0.819 0.532 0.312 0.159 0.367 0.453 0.373 0.344 0.729
FC 0.887 0.724 0.237 0.157 0.487 0.192 0.460 0.331 0.365 0.851
AU 0.636 0.507 0.368 0.149 0.365 0.371 0.294 0.165 0.266 0.466 0.586
BI 0.814 0.596 0.368 0.217 0.466 0.394 0.454 0.329 0.559 0.391 0.607 0.772
Factor Correlation Matrix with √AVE on the diagonal (Gender: Female group)
Factor CR AVE MSV ASV SE PU PEOU SN QWL FC AU BI
SE 0.893 0.737 0.480 0.282 0.858
PU 0.928 0.721 0.401 0.270 0.379 0.849
PEOU 0.938 0.751 0.347 0.261 0.506 0.589 0.866
SN 0.833 0.558 0.328 0.237 0.491 0.479 0.404 0.747
QWL 0.856 0.599 0.594 0.343 0.483 0.630 0.577 0.523 0.774
FC 0.907 0.766 0.480 0.281 0.693 0.372 0.504 0.380 0.539 0.875
AU 0.728 0.575 0.382 0.295 0.608 0.484 0.401 0.526 0.528 0.602 0.758
BI 0.902 0.756 0.594 0.367 0.502 0.633 0.559 0.573 0.771 0.545 0.618 0.869
Table 6-35: Construct reliability, convergent & discriminant validity for gender
The results of the MGA presented in Table 6.36 show that gender moderates the
relationship between PEOUBI (supporting H15b1), SNBI (supporting
H15b3) and QWLBI (supporting H15b4). Specifically, the relationship was
stronger for males in terms of QWL_BI, while the relationship was stronger for
female in terms of PEOU_BI and SNBI. However no differences were detected
in the relationship between PU_BI (rejecting H15b2), SEAU (rejecting H15b5)
and FCAU (rejecting H15b6). This results indicates that hypothesis H15b was
partially supported. Overall, the R2 for BI was 40.2% and for AU was 44.5%
within the male sample indicating a moderate model fit, while the variance
explained (R2) for BI was 57.2% and 51.3% for AU within the female group,
which indicates a good model fit of the data.

Chapter 6: Model Testing
Ali Tarhini 192
Hypothesis
Male Female
Z-score
Results R2 Estimate R
2 Estimate
PEOU BI
40.2%
0.096
57.2%
0.229 1.759* Supported
PU BI 0.176 0.109 -0.610 Not supported
SN BI 0.093 0.186 1. 692* Supported
QWLBI 0.482 0.329 -1.855* Supported
SEAU
44.5%
0.159
51.3%
0.128 -0.286 Not supported
FCAU 0.390 0.340 -0.492 Not supported
Notes: *** p-value < 0.01; ** p-value < 0.05; * p-value < 0.10
Table 6-36: The summary of the moderating effect of gender
6.6.2.2 Age
Out of the 602 respondents, there were 412 students within the younger-age group
and 157 students within the older-age group. The model fit indices for the
younger-age sample are [χ² =725.007; df= 349; χ²/df= 2.077; GFI =.889;
AGFI=.861; CFI=.950; RMSR=.086; RMSEA=.051, NFI=.906; PNFI=.781] and
[χ² =537.8899; df= 349; χ²/df= 1.541; GFI =.814; AGFI=.768; CFI=.938;
RMSR=.082; RMSEA=.059, NFI=.844; PNFI=.725] for the older-age group,
which also indicate a good fit of the data.
The results presented in Table 6.37 show that for all the constructs within the two
samples the CR were all above 0.7 and the AVE values were all above 0.5 and
therefore established adequate reliability and convergent validity. Additionally,
the MSV for all constructs is less than AVE and the square root of AVE is higher
than their correlation value, therefore discriminant validity was also established
for both samples.

Chapter 6: Model Testing
Ali Tarhini 193
Factor Correlation Matrix with √AVE on the diagonal (Age: group <=22)
Factor CR AVE MSV ASV SE PU PEOU SN QWL FC AU BI
SE 0.891 0.734 0.318 0.222 0.856
PU 0.912 0.675 0.308 0.198 0.320 0.822
PEOU 0.929 0.722 0.311 0.222 0.521 0.534 0.850
SN 0.781 0.543 0.230 0.150 0.389 0.311 0.343 0.699
QWL 0.830 0.552 0.436 0.239 0.397 0.555 0.470 0.434 0.743
FC 0.886 0.722 0.335 0.210 0.564 0.285 0.443 0.339 0.428 0.850
AU 0.731 0.529 0.375 0.245 0.551 0.472 0.388 0.392 0.422 0.579 0.655
BI 0.867 0.688 0.436 0.304 0.502 0.537 0.558 0.480 0.660 0.489 0.612 0.829
Factor Correlation Matrix with √AVE on the diagonal (Age: group >22)
Factor CR AVE MSV ASV SE PU PEOU SN QWL FC AU BI
SE 0.875 0.703 0.543 0.235 0.839
PU 0.882 0.602 0.254 0.163 0.305 0.776
PEOU 0.932 0.734 0.398 0.211 0.474 0.430 0.857
SN 0.844 0.577 0.211 0.119 0.363 0.459 0.301 0.760
QWL 0.843 0.574 0.497 0.257 0.515 0.483 0.536 0.358 0.758
FC 0.918 0.789 0.543 0.266 0.737 0.272 0.631 0.370 0.529 0.888
AU 0.751 0.604 0.398 0.163 0.433 0.301 0.324 0.195 0.331 0.462 0.777
BI 0.877 0.705 0.497 0.265 0.450 0.504 0.431 0.316 0.705 0.466 0.631 0.840
Table 6-37: Construct reliability, convergent & discriminant validity for age
As shown in Table 6.38, age was found to moderate the relationship between
PEOU_BI (supporting H16b1), QWLBI (supporting H16b4) and FCAU
(supporting H16b6), with the relationship stronger for the younger-age group in
terms of QWLBI and FCAU, while the relationship was stronger for the
older-age group in terms of PEOU_BI. On the other hand, no moderating effect
was found on the relationship between PU_BI (rejecting H16b2), SNBI
(rejecting H16b3) and SEAU (rejecting H16b5), which suggests that hypothesis
H16b was partially supported. Overall, the R2 for BI was 56.5% and for AU was
48.2% within the younger-age group, while within the older-age group the
variance explained (R2) for BI was 53% and 42.4% for AU, indicating a moderate
model fit.
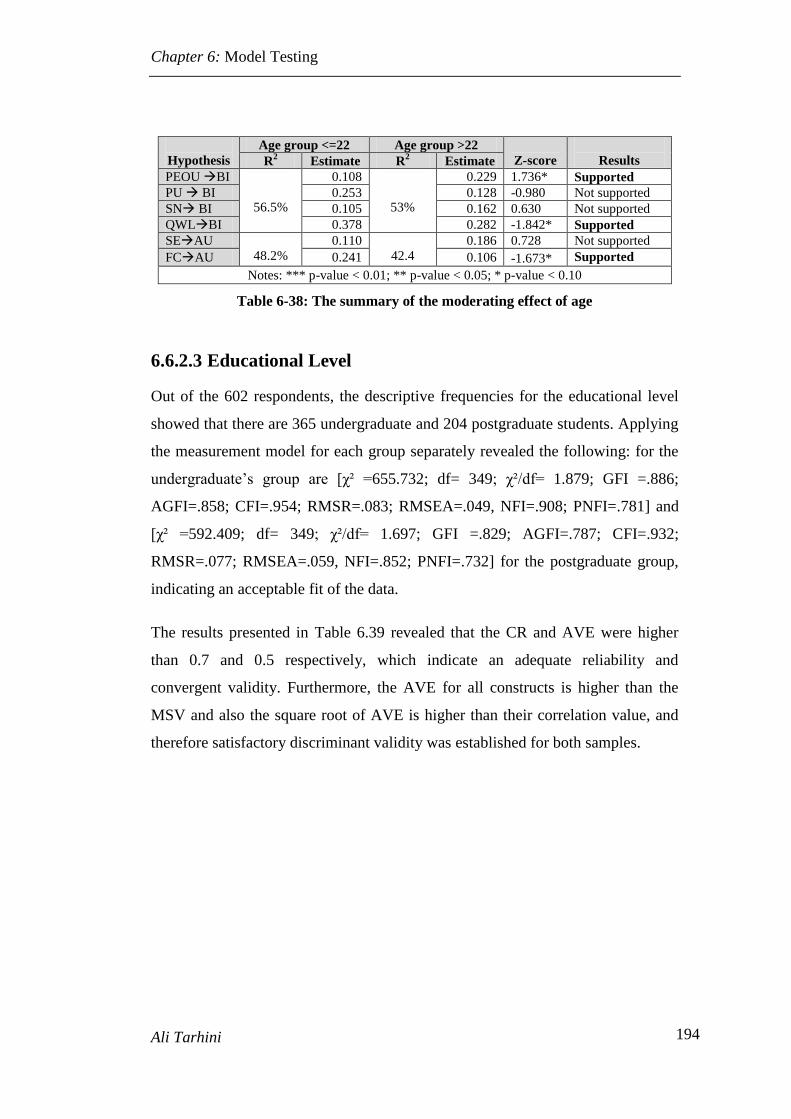
Chapter 6: Model Testing
Ali Tarhini 194
Hypothesis
Age group <=22 Age group >22
Z-score
Results R2 Estimate R
2 Estimate
PEOU BI
56.5%
0.108
53%
0.229 1.736* Supported
PU BI 0.253 0.128 -0.980 Not supported
SN BI 0.105 0.162 0.630 Not supported
QWLBI 0.378 0.282 -1.842* Supported
SEAU
48.2%
0.110
42.4
0.186 0.728 Not supported
FCAU 0.241 0.106 -1.673* Supported
Notes: *** p-value < 0.01; ** p-value < 0.05; * p-value < 0.10
Table 6-38: The summary of the moderating effect of age
6.6.2.3 Educational Level
Out of the 602 respondents, the descriptive frequencies for the educational level
showed that there are 365 undergraduate and 204 postgraduate students. Applying
the measurement model for each group separately revealed the following: for the
undergraduate’s group are [χ² =655.732; df= 349; χ²/df= 1.879; GFI =.886;
AGFI=.858; CFI=.954; RMSR=.083; RMSEA=.049, NFI=.908; PNFI=.781] and
[χ² =592.409; df= 349; χ²/df= 1.697; GFI =.829; AGFI=.787; CFI=.932;
RMSR=.077; RMSEA=.059, NFI=.852; PNFI=.732] for the postgraduate group,
indicating an acceptable fit of the data.
The results presented in Table 6.39 revealed that the CR and AVE were higher
than 0.7 and 0.5 respectively, which indicate an adequate reliability and
convergent validity. Furthermore, the AVE for all constructs is higher than the
MSV and also the square root of AVE is higher than their correlation value, and
therefore satisfactory discriminant validity was established for both samples.

Chapter 6: Model Testing
Ali Tarhini 195
Factor Correlation Matrix with √AVE on the diagonal (Educational level: Undergraduate group)
Factor CR AVE MSV ASV SE PU PEOU SN QWL FC AU BI
SE 0.888 0.726 0.308 0.217 0.852
PU 0.913 0.677 0.360 0.220 0.308 0.823
PEOU 0.931 0.731 0.333 0.230 0.499 0.541 0.855
SN 0.765 0.554 0.250 0.160 0.376 0.347 0.339 0.680
QWL 0.830 0.552 0.464 0.258 0.399 0.600 0.501 0.468 0.743
FC 0.895 0.741 0.347 0.211 0.554 0.303 0.455 0.305 0.433 0.861
AU 0.711 0.518 0.394 0.259 0.555 0.507 0.400 0.427 0.408 0.589 0.646
BI 0.874 0.701 0.464 0.324 0.507 0.571 0.577 0.500 0.681 0.496 0.628 0.837
Factor Correlation Matrix with √AVE on the diagonal (Educational level: postgraduate group)
Factor CR AVE MSV ASV SE PU PEOU SN QWL FC AU BI
SE 0.879 0.710 0.491 0.214 0.842
PU 0.887 0.612 0.175 0.119 0.310 0.782
PEOU 0.921 0.702 0.320 0.176 0.506 0.418 0.838
SN 0.856 0.599 0.186 0.121 0.374 0.376 0.316 0.774
QWL 0.839 0.567 0.402 0.200 0.444 0.390 0.432 0.348 0.753
FC 0.886 0.722 0.491 0.234 0.701 0.210 0.566 0.431 0.485 0.850
AU 0.715 0.535 0.307 0.130 0.375 0.245 0.260 0.208 0.330 0.431 0.731
BI 0.850 0.657 0.402 0.209 0.422 0.403 0.359 0.336 0.634 0.417 0.554 0.811
Table 6-39: Construct reliability, convergent & discriminant validity for education
level
Table 6.40 shows that three paths were moderated by educational level. These
paths were PEOU_BI (supporting H17b1), PUBI (supporting H17b2) and
SNBI (supporting H17b3). Specifically, the relationship was stronger for
undergraduate students in terms of PEOUBI and SNAU, while the
relationship was stronger for postgraduate in terms of PU_BI. The results also
show that no differences were detected on the relationship between QWLBI
(rejecting H17b4), SEAU (rejecting H17b5) and FCAU (rejecting H17b6).
Thus, it can be concluded that hypothesis H17b was partially supported. It was
also found that the R2 for BI was 59.1% and 49.5% for AU within the
undergraduate sample, indicating a good model fit. Whereas, within the
postgraduate sample, the variance explained (R2) for BI was 44.1% and 42.9% for
AU, indicating a moderate acceptable model fit.

Chapter 6: Model Testing
Ali Tarhini 196
Hypothesis
Undergraduate Postgraduate
Z-score
Results R2 Estimate R
2 Estimate
PEOU BI
59.1%
0.244
44.1%
0.101 -1.718* Supported
PU BI 0.086 0.231 1.936* Supported
SN BI 0.254 0.156 -1.664* Supported
QWLBI 0.396 0.488 0.802 Not supported
SEAU
49.5% 0.186
42.9 0.158 -0.290 Not supported
FCAU 0.228 0.326 0.916 Not supported
Notes: *** p-value < 0.01; ** p-value < 0.05; * p-value < 0.10
Table 6-40: The summary of the moderating effect of educational level
6.6.2.4 Experience
The descriptive frequencies for the category Internet experience revealed that the
majority of the students (N=344) were experienced in using the web-based
learning system, whereas the rest (N= 225) have low experience.
Applying the measurement model for each group separately revealed the
following: for the low-experience group [χ² =576.385; df= 349; χ²/df= 1.652; GFI
=.849; AGFI=.812; CFI=.949; RMSR=.093; RMSEA=.054, NFI=.883;
PNFI=.759] and [χ² =624.705; df= 349; χ²/df= 1.790; GFI =.887; AGFI=.859;
CFI=.950; RMSR=.064; RMSEA=.048, NFI=.894; PNFI=.768] for the
experienced group, indicating an acceptable fit of the data. The result in Table
6.41 show that the CR was higher than 0.7 and the AVE was higher than 0.5,
which satisfied the criterion for reliability and convergent validity. Moreover, the
MSV for all the constructs is less than AVE and the square root of AVE is higher
than their correlation value, and therefore discriminant validity is also established
for both samples.

Chapter 6: Model Testing
Ali Tarhini 197
Factor Correlation Matrix with √AVE on the diagonal (Experience: low-experience group)
Factor CR AVE MSV ASV SE PU PEOU SN QWL FC AU BI
SE 0.909 0.771 0.419 0.266 0.878
PU 0.910 0.669 0.321 0.218 0.370 0.818
PEOU 0.937 0.748 0.329 0.268 0.568 0.567 0.865
SN 0.787 0.522 0.278 0.194 0.488 0.452 0.396 0.701
QWL 0.858 0.603 0.480 0.266 0.469 0.522 0.514 0.425 0.777
FC 0.896 0.743 0.419 0.279 0.647 0.354 0.573 0.453 0.509 0.862
AU 0.717 0.526 0.441 0.232 0.517 0.387 0.390 0.307 0.427 0.583 0.703
BI 0.877 0.706 0.480 0.340 0.510 0.562 0.574 0.527 0.693 0.526 0.664 0.840
Factor Correlation Matrix with √AVE on the diagonal (Experience: Experienced group)
Factor CR AVE MSV ASV SE PU PEOU SN QWL FC AU BI
SE 0.877 0.705 0.340 0.218 0.840
PU 0.857 0.550 0.230 0.129 0.300 0.742
PEOU 0.914 0.680 0.219 0.150 0.468 0.346 0.825
SN 0.815 0.527 0.164 0.104 0.297 0.258 0.248 0.726
QWL 0.805 0.511 0.381 0.218 0.443 0.480 0.422 0.405 0.715
FC 0.900 0.751 0.340 0.199 0.583 0.247 0.431 0.260 0.453 0.867
AU 0.713 0.519 0.354 0.230 0.567 0.429 0.335 0.394 0.410 0.559 0.699
BI 0.857 0.669 0.381 0.240 0.521 0.389 0.416 0.354 0.617 0.470 0.595 0.818
Table 6-41: Construct reliability, convergent & discriminant validity for experience
As can be seen in Table 6.42, experience was found to moderate the relationship
between PEOUBI (supporting H18b1), SNBI (supporting H18b3) and
SEAU (supporting H18b5). The result shows that the relationship between
PEOUBI, SNBI and SEAU was stronger for the low-experience group. On
the other hand, no moderating effects of experience on the relationship between
PUBI (rejecting H18b2), QWLBI (rejecting H18b4) and FCAU (rejecting
H18b6) were found. This result indicates that hypothesis H18b was partially
supported. Overall, it was found that the R2 for BI was 56.8% and 49.3% for AU
within the some-experience group, while the R2 for BI was 44.5% and 46.8% for
AU, indicating that the model had a moderate acceptable fit of the data.

Chapter 6: Model Testing
Ali Tarhini 198
Hypothesis
Low-experience Experienced
Z-score
Results R2 Estimate R
2 Estimate
PEOU BI
56.8%
0.168
44.5%
0.087 -1.892* Supported
PU BI 0.089 0.128 1.033 Not supported
SN BI 0.145 0.082 -1.694* Supported
QWLBI 0.350 0.379 0.256 Not supported
SEAU
49.3% 0.165
46.8% 0.057 -1.827* Supported
FCAU 0.170 0.191 0.250 Not supported
Notes: *** p-value < 0.01; ** p-value < 0.05; * p-value < 0.10
Table 6-42: The summary of the moderating effect of experience
6.7 Summary and Conclusions
This chapter started by assessing the discriminant validity, convergent validity
and reliability of all the constructs within the proposed research model for the two
samples. The results of the confirmatory factor analysis revealed that four items
(SE4, SE5, FC4, SN4) have to be deleted from the initial measurement model for
the British sample. On the other hand, four items (SE4, SE5, FC4 and QWL3)
have to be deleted from the Lebanese sample. The criterion for deletion was based
on the indicators that demonstrate high covariance and also had high regression
weight. Having established validity and reliability of the constructs, the next step
was to evaluate the structural model in order to test the hypothesised relationships
among the constructs, within the proposed research model. The results of the
squared multiple correlations (R2), which provide information about the extent to
which the model explains variance in the data set, suggested that the refined
model exhibits a strong explanatory power for both samples. More specifically,
the determinants PEOU, PU, SN, SE and QWL accounted for 68% and 57% of
the variance of BI for the British and Lebanese sample respectively. Moreover,
the determinants SE, FC and BI accounted for 79% of the variance of AU for the
British sample and 52% for the Lebanese sample. The path model showed that
nine out of ten of the direct hypotheses for both samples were accepted. Table
6.43 summarise the results in terms of supported/ not supported hypotheses that
are related to the direct determinates.
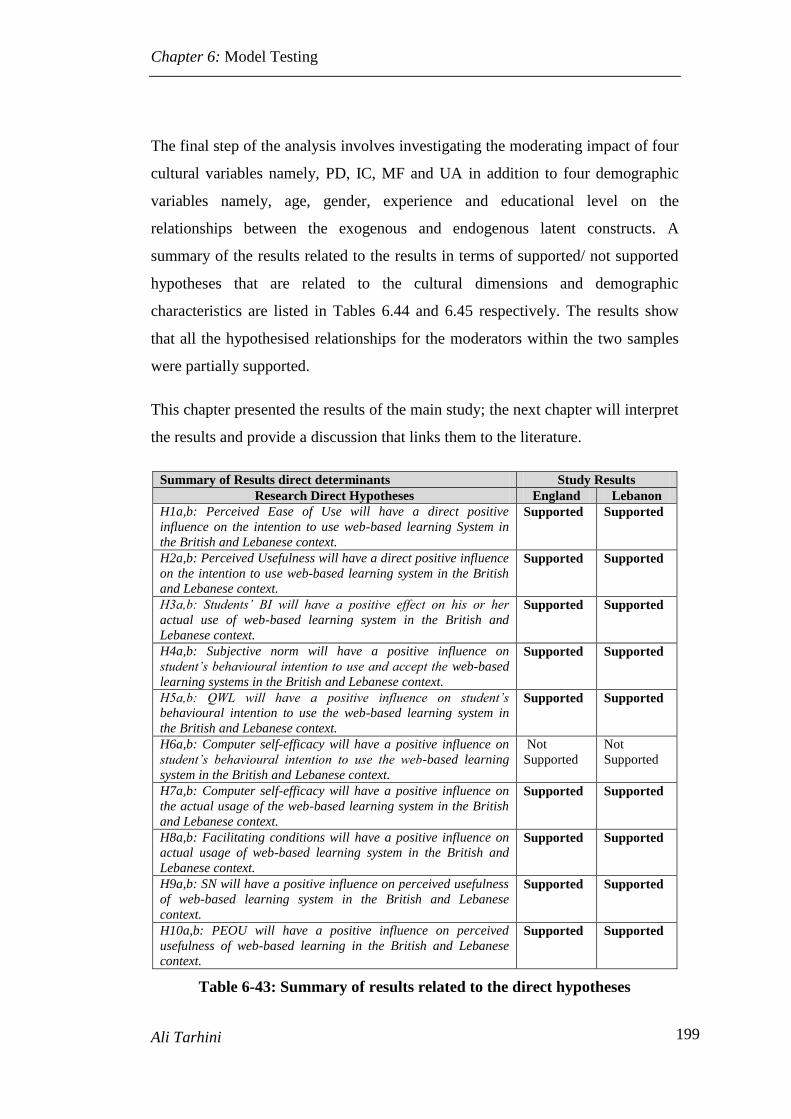
Chapter 6: Model Testing
Ali Tarhini 199
The final step of the analysis involves investigating the moderating impact of four
cultural variables namely, PD, IC, MF and UA in addition to four demographic
variables namely, age, gender, experience and educational level on the
relationships between the exogenous and endogenous latent constructs. A
summary of the results related to the results in terms of supported/ not supported
hypotheses that are related to the cultural dimensions and demographic
characteristics are listed in Tables 6.44 and 6.45 respectively. The results show
that all the hypothesised relationships for the moderators within the two samples
were partially supported.
This chapter presented the results of the main study; the next chapter will interpret
the results and provide a discussion that links them to the literature.
Summary of Results direct determinants Study Results
Research Direct Hypotheses England Lebanon
H1a,b: Perceived Ease of Use will have a direct positive
influence on the intention to use web-based learning System in
the British and Lebanese context.
Supported Supported
H2a,b: Perceived Usefulness will have a direct positive influence
on the intention to use web-based learning system in the British
and Lebanese context.
Supported Supported
H3a,b: Students’ BI will have a positive effect on his or her
actual use of web-based learning system in the British and
Lebanese context.
Supported Supported
H4a,b: Subjective norm will have a positive influence on
student’s behavioural intention to use and accept the web-based
learning systems in the British and Lebanese context.
Supported Supported
H5a,b: QWL will have a positive influence on student’s
behavioural intention to use the web-based learning system in
the British and Lebanese context.
Supported Supported
H6a,b: Computer self-efficacy will have a positive influence on
student’s behavioural intention to use the web-based learning
system in the British and Lebanese context.
Not
Supported
Not
Supported
H7a,b: Computer self-efficacy will have a positive influence on
the actual usage of the web-based learning system in the British
and Lebanese context.
Supported Supported
H8a,b: Facilitating conditions will have a positive influence on
actual usage of web-based learning system in the British and
Lebanese context.
Supported Supported
H9a,b: SN will have a positive influence on perceived usefulness
of web-based learning system in the British and Lebanese
context.
Supported Supported
H10a,b: PEOU will have a positive influence on perceived
usefulness of web-based learning in the British and Lebanese
context.
Supported Supported
Table 6-43: Summary of results related to the direct hypotheses

Chapter 6: Model Testing
Ali Tarhini 200
Summary of Results for moderating impact of Culture Study Results
Research Moderators Hypotheses Proposed
Relationship
England Lebanon
(H11a1,a2,a3,a4,a5,a6),
(H11b1,b2,b3,b4,b5,b6)
The relationship between (PEOU, PU, SN,
QWL, SE, FC) and Behavioural Intention
and actual usage of the web-based learning
system system is moderated by the Power
Distance value in the British/Lebanese
context.
PEOU BI Not Supported Not
Supported
PU BI Supported Supported
SN BI Supported Supported
QWLBI Supported Not
Supported
SEAU Not Supported Supported
FCAU Not Supported Not
Supported
(H12a1,a2,a3,a4,a5,a6),
(H12b1,b2,b3,b4,b5,b6)
The relationship between (PEOU, PU, SN,
QWL, SE, FC) and Behavioural Intention
and actual usage of the web-based learning
system is moderated by the
masculinity/femininity value in the
British/Lebanese context.
PEOU BI Supported Supported
PU BI Supported Not
Supported
SN BI Supported Supported
QWLBI Not Supported Not
Supported
SEAU Not Supported Supported
FCAU Not Supported Not
Supported
(H13a1,a2,a3,a4,a5,a6)
(H13b1,b2,b3,b4,b5,b6) The relationship
between (PEOU, PU, SN, QWL, SE, FC)
and Behavioural Intention and actual
usage of the web-based learning system is
moderated by the individualism
/collectivism value in the British/ Lebanese
context.
PEOU BI Supported Not
Supported
PU BI Supported Not
Supported
SN BI Supported Supported
QWLBI Not Supported Not
Supported
SEAU Not Supported Supported
FCAU Supported Supported
(H14a1,a2,a3,a4,a5,a6)
(H14b1,b2,b3,b4,b5,b6) The relationship
between (PEOU, PU, SN, QWL, SE, FC)
and Behavioural Intention and actual
usage of the web-based learning system is
moderated by the Uncertainty Avoidance
value in the British/ Lebanese context.
PEOU BI Not Supported Supported
PU BI Supported Not
Supported
SN BI Supported Supported
QWLBI Not Supported Supported
SEAU Supported Not
Supported
FCAU Supported Supported
Table 6-44: Summary of results related to the moderating cultural
dimensions hypotheses

Chapter 6: Model Testing
Ali Tarhini 201
Summary of Results for the moderating impact of
the demographic characteristics
Study Results
Research Moderators Hypotheses Proposed
Relationship England Lebanon
(H15a1,a2,a3,a4,a5,a6)
(H15b1,b2,b3,b4,b5,b6)
The relationship between (PEOU, PU,
SN, QWL, SE, FC) and Behavioural
Intention and actual usage of the web-
based learning system will be
moderated by the gender in the
British/Lebanese context.
PEOU BI Not Supported Supported
PU BI Supported Not Supported
SN BI Supported Supported
QWLBI Supported Supported
SEAU Not Supported Not Supported
FCAU Supported Not Supported
(H16a1,a2,a3,a4,a5,a6),
(H16b1,b2,b3,b4,b5,b6)
The relationship between (PEOU, PU,
SN, QWL, SE, FC) and Behavioural
Intention and actual usage of the web-
based learning system will be
moderated by the age in the
British/Lebanese context.
PEOU BI Not Supported Supported
PU BI Supported Not Supported
SN BI Supported Not Supported
QWLBI Supported Supported
SEAU Supported Not Supported
FCAU Not Supported Supported
(H17a1,a2,a3,a4,a5,a6),
(H17b1,b2,b3,b4,b5,b6)
The relationship between (PEOU, PU,
SN, QWL, SE, FC) and Behavioural
Intention and actual usage of the web-
based learning system will be
moderated by Educational Level in the
British/Lebanese context.
PEOU BI Supported Supported
PU BI Not Supported Supported
SN BI Supported Supported
QWLBI Supported Not Supported
SEAU Not Supported Not Supported
FCAU Supported Not Supported
(H18a1,a2,a3,a4,a5,a6),
(H18b1,b2,b3,b4,b5,b6)
The relationship between (PEOU, PU,
SN, QWL, SE, FC) and Behavioural
Intention and actual usage of the web-
based learning system will be
moderated by Experience in the
British/Lebanese context.
PEOU BI Supported Supported
PU BI Supported Not Supported
SN BI Supported Supported
QWLBI Not Supported Not Supported
SEAU Supported Supported
FCAU Supported Not Supported
Table 6-45: Summary of results related to the four demographic variables

Chapter 8: Conclusion and Further Research
Ali Tarhini 202
Chapter 7: Discussion
“Unobstructed access to facts can produce unlimited good only if it is matched by
the desire and ability to find out what they mean and where they lead.” (Norman
Cousins, Human Options: An Autobiographical Notebook, 1981)
7.1 Introduction
Chapters 5 and 6 presented the results of the proposed research model to examine
the potential factors that affect the adoption and usage of web-based learning
system in Lebanon and England. Two-step approach was used during the data
analysis process. In the first step, the Confirmatory Factor Analysis (CFA) was
employed to assess the constructs’ validity and test the model fit. The next step
employed the Structural Equation Modeling (SEM) technique to test the
hypothesised relationships among the independent and dependent variables and to
examine the moderating impact of demographic characteristics and cultural
dimensions. In this chapter, the researcher seeks to discuss and provide an in-
depth interpretation of the main findings presented in Chapters 5 and 6, and link
them to the main aim and objectives of this research.
More specifically, this chapter is centred around 3 main parts. The first part
provides a detailed discussion of the direct relationships in the research model.
This part is dedicated to understanding the important roles that behavioural belief,
social and organisational factors plays in affecting the student’s beliefs towards
adoption and acceptance of web-based learning systems in Lebanon and England.
The impact of two sets of moderators (demographic and cultural dimensions) on
the relationships between the exogenous and endogenous latent variables in the
structural model are then discussed for both samples together in order to compare
the findings in section 7.2. It is followed in section 7.3 by a detailed discussion

Chapter 8: Conclusion and Further Research
Ali Tarhini 203
related to the similarities and dissimilarities between the two countries at the
national level.
7.2 Validation of extended TAM across cultural
settings (The impact of direct determinants)
This section is devoted to the discussion of the direct relationships between the
exogenous (PU, PEOU, SN, QWL, SE and FC) and the endogenous (BI and AU)
latent constructs. Figure 7.1 depicts the results of the direct hypothesised
relationships in the proposed research model for both samples. The results
revealed that 9 out of 10 paths for each sample were supported. The empirical
results have shown that behavioural beliefs, social beliefs and organisational
support have been found to affect the students’ perceptions towards using the
web-based learning system in Lebanon and England. This section will provide a
brief discussion about the direct hypotheses testing in the British and Lebanese
model, whereas a detailed discussion is provided in the sections that follow.
Figure 7-1: Results of hypothesised direct relationships in the structural
models in Lebanon and England
The standardised path coefficient of the factors affecting the Behavioural
Intention within the proposed conceptual model for the British and Lebanese

Chapter 8: Conclusion and Further Research
Ali Tarhini 204
sample are shown in Tables 6.7 and 6.9 respectively, whereas the results related to
AU are shown in Tables 6.8 and 6.10 respectively. The factor loadings (regression
weights) output in AMOS indicates that 9 out of 10 hypothesised relationships for
the two samples were supported. More specifically, PEOU (=0.12**, =0.106*)
and PU (=0.201***, =0.195***) were found to have a significant positive
influence on behavioural intention to use web-based learning system, supporting
H1a,b and H2a,b respectively. Our result is in accordance with TAM which
postulates that PU has more influence than PEOU on BI. Additionally, the
influence of colleagues and instructors on students’ behavioural intention to use
the system was significant, SN (=0.082*,=0.095*) supporting H4a and H4b
respectively. Moreover, Behavioural Intention were also influenced by the quality
of work life (=0.430***, =0.408***) which supports H5a and H5b respectively.
However, contrary to our expectation, our results fail to support the direct
relationship between SE (=0.054, =0.041) and BI thus H6a and H6b were not
supported.
The results of the squared multiple correlations (SMC) indicated that PEOU, PU,
SN, SE and QWL account for 68% (R2 = 0.68) of the variance of BI of the British
sample and 57% of the Lebanese sample, with QWL contributing the most to
behavioural intention compared to the other constructs. Additionally, SN
(=0.299***, =0.167**) and PEOU (=0.398***, =0.318***) were found to
have a significant positive influence on PU, supporting H9a,b and H10a,b
respectively. Both SN and PEOU explained 54.1% of the variance of PU within
the British sample and 32% within the Lebanese sample with PEOU contributing
the most.
The results also shows that both SE (=0.284*** and =0.105*) and FC
(=0.284*** and =0.176**) have a strong direct positive effect on AU which
supports H7a,b and H8a,b respectively. Furthermore, AU is positively influenced
by BI (ß=0.175***, ß=0.374***) which provide support for H3a,b. The results of
the squared multiple correlation indicate that BI, SE and FC account for 79 % (R2
= 0.79) of the variance of AU within the British sample, with SE contributing the

Chapter 8: Conclusion and Further Research
Ali Tarhini 205
most. While BI, SE and FC account for 52 % (R2 = 0.52) of the variance of AU
(indicating a reasonable explanation for AU) within the Lebanese sample, with BI
having the highest impact on the actual usage compared to the other constructs.
These results indicate that the higher the level of behavioural intention, the higher
the actual usage will be.
In summary, the empirical results have shown that behavioural beliefs, social
beliefs and organisational support have been found to affect the students’
perceptions towards using the web-based learning system in the context of
developing and developed countries, represented here in Lebanon and England.
However, the level of significance varies among the two samples. Our results are
in contrast with previous literature which suggests that Web-based learning
system in Lebanon is still in its infancy (Nasser, 2000; UNDP, 2002; Baroud and
Abouchedid, 2010). Our results support theoretically and empirically the ability
of our proposed model to be a useful theoretical framework for better
understanding the student’s acceptance of web-based learning systems in the
context of developing countries where the generalizability of TAM is still
questionable, and in the context of western/ developed countries where the
majority of previous research has been conducted.
7.2.1 Behavioural beliefs and Behavioural Intention
The next two subsections provide empirical evidence of how behavioural beliefs
(PEOU and PU) affect BI towards using the web-based learning system.
7.2.1.1 Perceived Ease of Use and Behavioural Intention
As per the discussion provided in Chapter 3, PEOU is defined as “the degree to
which a person believes that using a particular system would be free of effort”
(Davis et al., 1989 p.320). In the context of the research, previous TAM research
suggests that if the web-based learning system is easy to use, then students are
more likely to use it e.g. (Park, 2009; Chang and Tung, 2008; Zhang et al., 2008).
The results in Table 6.7 and 6.9 showed that PEOU has a significant positive

Chapter 8: Conclusion and Further Research
Ali Tarhini 206
influence on the BI to use the web-based learning system for both samples which
provide support for hypothesis H1a and H1b. This finding is important as it
validates and supports the relationship between PEOU and BI in the context of e-
learning in Lebanon where such relationship is rarely explored, and also in the
western/developed countries. Our results is in accordance with TAM model and
previous literature e.g. (Saadé and Galloway, 2005; Liu et al., 2010; Davis et al.,
1989), which posits that PEOU plays an important role in predicting the
behavioural intention towards using technology. However, PEOU was found to be
less important than other predictive variables with =0.120* and =0.106* in the
UK and Lebanon sample respectively. This is maybe because students are
experienced in using the computers in general and thus will use the system if it’s
useful in their education. This argument is supported by previous research (Davis
et al., 1989; Venkatesh, 2002) which indicates that the direct influence of PEOU
on BI will becomes non-significant over time due to the experience that
individuals obtain when using the system.
In summary the path between PEOU and BI was significant for both samples
indicating that H1a and H1b are supported.
7.2.1.2 Perceived Usefulness and Behavioural Intention
PU is defined as “the degree to which a person believes that using a particular
system would enhance his/her job performance” (Davis, 1989, p. 453). In the
context of this research, if the students find the web-based learning system to be
useful in their education, then they are more likely to use it (Park, 2009; Chang
and Tung, 2008; Zhang et al., 2008).
The parameter estimate results in Table 6.7 and 6.9 show that the hypothesised
path between PU and BI was significant for both samples (UK and Lebanon)
which provide support for hypothesis H2a and H2b. Our findings is in accordance
with TAM and previous literature e.g. (Liu et al., 2010; Chang and Tung, 2008)
which found PU to have a strong positive effect on BI to use the technology. The
strong significant influence of PU (=0.201*** in the UK and 0.195*** in

Chapter 8: Conclusion and Further Research
Ali Tarhini 207
Lebanon) on BI indicate that students think that the web-based learning system is
useful in their education hence it is more likely to be accepted. Our results also
suggest that students are more driven with the usefulness of the system rather than
its ease of use.
In summary, the empirical results suggest that hypothesis H2a and H2b are
supported. Therefore, our results support theoretically and empirically the
relationship between PU and BI in the context of developing countries where such
relationship has been rarely explored as well as in the context of western
countries.
7.2.1.3 Perceived Ease of Use and Perceived Usefulness
The result of the structural model (see Tables 6.7 and 6.9) show that perceived
ease of use had a positive significant effect on perceived usefulness for both
samples (=0.398*** in the UK and 0.318*** in Lebanon). Our results provide
empirical evidence that hypothesis H10a and H10b were accepted. The results
indicate that perceived ease of use influence the user’s beliefs of usefulness
towards the acceptance of the web-based learning system. In other words, PEOU
was found to increase the perception of usefulness of the web-based learning
system. Our finding is consistent with previous literature in IS e.g. (Davis et al.,
1989; Venkatesh and Davis, 2000; Igbaria et al., 1997; Teo, 2009a; Teo, 2010)
and in accordance with TAM model. Therefore, this finding contributes to the
existing research on technology acceptance by validating this relationship in the
Lebanese context among educational users where the majority of the previous
studies were conducted in the context of western-countries. In summary, the
results of this research suggest that hypotheses H10a and H10 were strongly
supported.

Chapter 8: Conclusion and Further Research
Ali Tarhini 208
7.2.2 Subjective Norm
Subjective norm also known as Social Influence, is defined as “the person’s
perception that most people who are important to him or her think he or she
should or should not perform the behaviour in question" (Ajzen and Fishbein,
1990 p.188). In another words, SN refers to the social pressure coming from
external environment which surrounds the individuals and may affect their
perceptions and behaviours of engaging in a certain role. SN was included in
many theories such as TRA, TPB, DTPB and TAM2 and is similar to social
influence in UTAUT (refer to Chapter 2).
The results in Tables 6.7 and 6.9 show that the path between SN and BI was
supported for the two samples, supporting hypotheses H4a and H4b. Our finding
is consistent with previous research e.g. (Teo, 2010; Park, 2009; Van Raaij and
Schepers, 2008) which indicates that others’ opinions such as colleagues and
superiors have an important influence on forming the perceptions towards using
the technology. The significant impact of SN on BI maybe because the system is
under mandatory usage conditions. This result provides more support that the
impact of SN on BI will operate in mandatory setting (Venkatesh and Davis,
2000) even in a low power distance country such as England. However, it should
be noted that SN was found to have less influence on behavioural intention
compared to other factors (PEOU, PU, QWL, FC and SE), with =0.082* and
=0.095** in the UK and Lebanon samples, respectively. This may be due to the
fact that the impact of SN on BI will be reduced with the increase of experience
and time (Venkatesh and Morris, 2000; Taylor and Todd, 1995b). Additionally,
SN was found to have a direct positive effect on PU in both samples, providing
support for H9a and H9b. Our result is accordance with the TAM2 (Venkatesh
and Davis, 2000) and previous research (e.g., Teo, 2010).
In summary, the relationships between SNBI and SNPU were supported in
both samples. Therefore, our results support theoretically and empirically the
relationship between SN and BI and SN and PU for e-learning in the context of

Chapter 8: Conclusion and Further Research
Ali Tarhini 209
developing countries where such relationship has not been extensively explored as
well as in the context of western countries.
7.2.3 Quality of work life and Behavioural Intention
In this research, QWL is defined in terms of students’ perception and belief that
using the web-based learning system will improve their quality of work life such
as saving expenses when downloading e-journals, or in communication when
using email to communicate with their instructors and friends. Generally
speaking, a mismatch between students and the impact of technology on their
lives can be disadvantageous for both students and institutions and which in turn
affect their behavioural intention to use the web-based learning systems.
The results of parameter estimate presented in Tables 6.7 and 6.9 show that the
path between QWL and BI was highly significant for both samples. These results
provide empirical evidence that highly support hypotheses H5a and H5b. It is
noteworthy that perceived quality of work life had the strongest magnitude on
behavioural intention compared with other predictors with =0.430*** in the UK
and =0.408*** in Lebanon. Our findings is in line with previous studies in IS
that suggest this extension may improve the TAM model e.g.(Zakour, 2004b;
Kripanont, 2007; Srite and karahanna, 2000), which posits that perceived quality
of work life influence the users’ intent to adopt and use the technology.
A significant contribution of this work is to demonstrate the relevance of quality
of work life as an antecedent to behavioural intention within the context of web-
based learning adoption. This variable has previously been suggested as
potentially important but had not been included in empirical work on TAM, nor
had it been investigated in relation to the acceptance of web-based learning
system in the Lebanese or British cultural context. The results of our study
confirm that quality of work life is an important consideration in the study of
adoption and acceptance of web-based learning systems.
In summary, hypotheses H5a and H5b were accepted.

Chapter 8: Conclusion and Further Research
Ali Tarhini 210
7.2.4 Facilitating Technology and Actual Usage
As an organisational factor, FC has been defined as “the degree to which an
individual believes that an organizational and technical infrastructure exists to
support use of the system” (Venkatesh et al., 2003). More specifically, it refers to
the availability of external resources (time, money and effort) and also the
technological resources (PCs, broadband, etc...) needed to facilitate the
performance of a particular behaviour.
The results in Tables 6.7 and 6.9 suggest that the link between facilitating
conditions and actual usage of the web-based learning system was significant for
both samples. The results indicate that H8a and H8b were accepted with =0.1**
in the UK and =0.176*** in Lebanon. The result of this relationship suggests that
providing the technological resources will motivate the students to use the web-
based learning system. Our results is consistent with previous research context
(Teo, 2009a; Sivo and Brophy, 2003; Maldonado et al., 2009; Chang et al., 2007)
and UTAUT model (Venkatesh et al., 2003), which posits that FC has a direct
positive influence on actual usage of technology. Another contribution of this
study is the use of facilitating technology factors within an extended TAM to
study the web-based learning adoption within the context of developed countries
and especially within the context of developing countries, where such countries
typically support traditional styles of pedagogy in education, due to a lack of
financial resources and appropriately trained staff.
7.2.5 Self-efficacy and usage behaviour
Self-efficacy (SE) - as an internal individual factor- has been defined as the belief
“in one’s capabilities to organise and execute the courses of action required to
produce given attainments” (Bandoura, 1997, p.3).
The results of the parameter estimate in Tables 6.7 and 6.9 indicate that the path
between SE and BI was not significant which suggest that H6a and H6b were not
supported, while the relationship between SE and AU were significant which

Chapter 8: Conclusion and Further Research
Ali Tarhini 211
support H7a and H7b. These results were not expected as the majority of the
previous studies have found SE to be an important determinant that directly
influences the user’s behavioural intention towards using the e-learning
acceptance (Chang and Tung, 2008; Yuen and Ma, 2008; Park, 2009;
Vijayasarathy, 2004; Chatzoglou et al., 2009; Roca et al., 2006), however our
results is similar to the findings of Venkatesh et al. (2003) who found that the a
casual direct relationship between SE and BI was non-significant while the path
between SE and AU was significant.
A plausible explanation for the failure to find a significant link between SE and BI
could be that most of the students were experienced in using the computer and
thus will form their perceptions on the bases of the usefulness of the system rather
than self-efficacy or perceived ease of use. This study adds to the few studies
which demonstrate the importance of SE as an antecedent to actual usage within
the context of e-learning adoption in developing and developed countries. Our
results support the importance of extending the TAM to include individual factors
such as SE in the context of e-learning.
7.2.6 Behavioural Intention and Actual Usage
Table 6.7 and 6.9 presents the results of the direct hypothesised relationships in
the structural model. The data analysis showed that the path between BI and AU
was significant in both models; thus, supporting H3a and H3b. The results suggest
that if students have a strong intention to engage in using the web-based learning
systems, then they are more likely to use it. Our finding is consistent with
previous research in IS e.g., (Davis et al., 1989; Taylor and Todd, 1995b; Taylor
and Todd, 1995c; Venkatesh and Davis, 2000; Venkatesh et al., 2003) and in e-
learning context (Zhang et al., 2008; Yi-Cheng et al., 2007; Chang and Tung,
2008; Park, 2009; Saeed and Abdinnour-Helm, 2008; McCarthy, 2006; Liu et al.,
2010; Walker and Johnson, 2008) and in accordance with TAM, DTPB, and TPB
models.

Chapter 8: Conclusion and Further Research
Ali Tarhini 212
In summary, the empirical results provide evidence to accept hypotheses H3a and
H3b.
7.3 Discussion Related to the Effect of Moderators
This section is devoted to discussing the moderating impact of the four cultural
dimensions (MF, ID, PD, UA) in addition to four demographic variables namely
gender, age, educational level and experience; on the relationships between the
exogenous (PEOU, PU, SN, QWL and FC) and the endogenous (BI and AU)
latent constructs. The impacts of these moderators were investigated through
using multi-group analysis (as discussed in the previous chapter). In this
approach, the data-sample is divided into subsamples and then the same structural
model is run at the same time for both samples. It is then followed by pairwise
comparison in path coefficients across the two groups and also considering the
critical ratio for differences among the groups.
7.3.1 Discussion related to cultural variables
This section will discuss the results of the moderating impact of the four cultural
dimensions (PD, MF, IC, UA) on the direct relationships within the British and
Lebanese model.
7.3.1.1 Power distance (PD)
In terms of the British sample, the result in Section 6.5.1.1 showed that the overall
mean for the PD construct was 2.567/7 indicating a very low PD culture. The low
level of PD in England is also consistent with the original findings of Hofstede’s
(1980) which indicate that the UK is low on power distance (scored 35/100). To
analyse the moderating effects of PD the data were split into two groups using
median split-method with 307 students included in the low PD group and 295 in
the high PD group. Thus, the generalisability of the results of this variable should
be treated with caution. The results revealed that both groups have an acceptable
Chapter 8: Conclusion and Further Research
Ali Tarhini 213
model fit of the data with the variance explained for BI was 49.7% and 48.2% for
AU in the low PD group, whereas the R2 for BI was 57.9% and 55.6% for AU in
the high PD group. The highest path coefficient for both samples was between
QWLBI, while the lowest was between FCAU in the low PD group and
PEOUBI in high level PD group. These results indicate that both groups
perceived QWL as a major factor in forming their perceptions when using the
technology. Furthermore, management support was found to be less important in
the low level PD compared with social and individual factors. While in the high
level PD group, although perceived ease of use was significant but its importance
was limited compared to other factors in using and accepting the technology.
Regarding the Lebanese sample, the descriptive statistics in Section 6.6.1.1
showed that the overall mean for PD construct was 3.160/7 indicating a moderate
PD culture. The low level of PD in Lebanon, as part of the Arab world, deviates
from the original findings of Hofstede’s (1980) which indicate that the Arab world
are high on PD (scored 80/100). However, this result is acceptable as Hofstede’s
collected the data 30 years ago. The data were split into two groups using median
split-method with 324 students included in the low PD group and 278 in the high
PD group. Thus, the generalisability of the results of this variable should be
treated with caution. Overall, the R2 for BI was 40.3% and 51.9% for AU in the
low-PD group indicating a moderate model fit, whereas in the high-PD group the
R2 for BI was 60.2% and 66.1% for AU indicating a good fit. The highest path
coefficient for both samples was between QWLBI, while the lowest was
between SNBI in the low PD group and FCBI in high level PD group. These
results indicate that both groups perceived QWL as a major factor in forming their
perceptions when using the technology. Furthermore, the influence of other
colleagues and superiors were found to be less important in the low level PD
compared with social and individual factors. While in the high level PD group,
although management support was significant but its importance was limited
compared to other factors in using and accepting the technology. Furthermore, the
results of MGA showed that PD moderates the relationship between PUBI,
SNBI and SEBI.

Chapter 8: Conclusion and Further Research
Ali Tarhini 214
Table 7.1 presents the results of the moderating effect of power distance on the
key determinants of behavioural intention and actual usage of an web-based
learning system for both samples.
Research Moderator Hypotheses
(Power Distance)
Proposed
Relationship
England Lebanon
(H11a1,a2,a3,a4,a5,a6),
(H11b1,b2,b3,b4,b5,b6)
The relationship between (PEOU, PU, SN,
QWL, SE, FC) and Behavioural Intention
and actual usage of the web-based
learning system is moderated by the
Power Distance value in the
British/Lebanese context.
PEOU BI Not Supported Not Supported
PU BI Supported Supported
SN BI Supported Supported
QWLBI Supported Not Supported
SEAU Not Supported Supported
FCAU Not Supported Not Supported
Table 7-1: The summary of the moderating effect of PD for both samples
The results of the MGA showed that PD moderates the relationship between
PUBI for the British and Lebanese sample. As hypothesised, the relationship
was stronger for low PD. Thus, the findings show that users with lower level of
PD will perceive higher importance to the usefulness of technology in the decision
to adopt technology, which confirm the predictions of McCoy et al. (2005a). Our
findings is in line with previous research e.g. (Zmud, 1982) which suggests that
individuals with high PD are characterised with lower rates of innovation and
acceptance of technology and thus the effect of PD will be weaker on the
relationship between PU and BI (Harris, 1997).
As hypothesised, PD was also found to moderate the relationship between SN and
BI for the UK and Lebanese sample. The relationship between SN and BI was
stronger for students with high Power Distance. Our results are consistent with the
majority of previous research (Srite and Karahanna, 2006; Dinev et al., 2009;
McCoy et al., 2005a). Thus, the results indicate that for users with higher power
distance cultural values the opinions of others such as supervisors and peers play
greater roles in the decision to adopt technology. It could be that users with higher
level of PD were using the technology to comply with their superior opinions and
suggestions and thus complete the required tasks given by supervisor and not
because usefulness, but simply because she/he is the boss (Hofstede, 1980).
Conversely, for people within low PD cultural values, the inequality is reduced to

Chapter 8: Conclusion and Further Research
Ali Tarhini 215
minimum and thus the impact of superiors are expected to be accessible to
subordinates (Hoecklin et al., 1995).
The results of the MGA also revealed that PD moderates the relationship between
QWLBI for the UK sample. This means that users with lower level of PD will
perceive higher importance on the impact of using the technology on their work
life when forming their decision to adopt technology. However, contrary to our
expectation, the relationship between QWL and BI was not found to be moderated
by PD in the Lebanese sample, which means that the degree to which perceived
QWL affects intention to use an web-based learning system was not affected by
power distance cultural variable.
Additionally, the empirical results showed that the relationship SE and BI was
moderated by PD for the Lebanese sample. The relationship was stronger for users
with high PD cultural values which confirm the results of the majority of previous
research e.g. (Straub et al., 1997) which indicate that the freedom in working
environment could increase the behavioural intention to adopt and use the
technology and thus individuals will use their own skills (i.e. SE) and accept the
technology. On the other hand, PD did not moderate the relationship between SE
and BI in the British sample, this maybe because students perceive the usefulness
of the technology on their education. Therefore, the degree to which SE affect
intention to use the web-based learning system was not affected by PD in the
British sample.
Finally, contrary to our expectations e.g. (McCoy et al., 2005a; Li et al., 2009),
the power distance cultural variable did not moderate the relationship between
PEOUBI and FCAU for the UK and Lebanese samples. This means that the
degree to which perceived ease of use and facilitating conditions affects intention
to use the web-based learning system was not affected by power distance cultural
variable.
Therefore, hypothesis H11a and H11b were partially supported.

Chapter 8: Conclusion and Further Research
Ali Tarhini 216
7.3.1.2 Masculinity/Femininity (MF)
In terms of the UK sample, the results in Section 6.5.1.2 showed that the overall
mean for MF construct was 2.535/7 indicating a very low feminine (high
masculine) culture. The high level of masculinity in England is also consistent
with the original findings of Hofstede’s (1980) which indicate that the UK is high
on masculinity cultural values (scored 66/100). Data were split into two groups
using median split methods with 312 students included in the low masculine
group and 290 in the high masculine group. Therefore, the generalizability of the
results of this variable should be treated with caution since both groups were
masculine but with different level. The results also showed that the variance
explained for BI was 61.1% and 63.4% for AU in the masculine group, whereas
the R2 was 67.7% for BI and 72.5% for AU in the feminine group indicating an
acceptable model fit of the data. The highest path coefficient for both samples was
between QWLBI, while the lowest was between FCAU in the high masculine
group and PUBI in the low masculine group. This means that both groups
perceived the importance of technology on their quality of work life. Furthermore,
management support was found to be less important in the high masculine group.
Conversely, low masculine group give little attention to the usefulness of the
systems rather than any other factors.
As for the Lebanese sample, the results in Section 6.6.1.3 showed that the overall
mean for the MF construct was 3.22/7 indicating a moderately masculine culture.
The moderate level of masculinity in Lebanon is very close to Hofstede’s (1980)
original findings, which indicates that the Arab world is moderate on masculinity
cultural values (scored 53/100). The descriptive statistics showed that there are
281 respondents with high masculine cultural values and 288 with low masculine
cultural values. The generalizability of the results of this variable should be
treated with caution since both groups were masculine but with different levels.
Overall, The R2 for BI was 47.2% and 43.4% for AU in the high masculine group
indicating a moderate model fit, while the R2 for BI was 58.7% and 56.9% for AU
in the low masculine group indicating a good model fit of the data. The highest

Chapter 8: Conclusion and Further Research
Ali Tarhini 217
path coefficient for both samples was between QWLBI, while the lowest was
between SNBI in the high masculine group and PUBI in the low masculine
group. These results indicate that both groups perceived QWL as a major factor in
their decision to adopt the technology. Similar to the UK sample, social influence
was found to be less important in the high masculine group compared to other
factors. Conversely, low masculine group give little attention to the usefulness of
the systems rather than social or individual factors.
Table 7.2 presents the results of the moderating effect of masculinity/femininity
on the key determinants of behavioural intention and actual usage of an web-
based learning system for both samples.
Research Moderator
Hypotheses (masculinity/femininity)
Proposed
Relationship
England Lebanon
(H12a1,a2,a3,a4,a5,a6),
(H12b1,b2,b3,b4,b5,b6)
The relationship between (PEOU, PU, SN,
QWL, SE, FC) and Behavioural Intention and
actual usage of the web-based learning system
is moderated by the masculinity/femininity
value in the British/Lebanese context.
PEOU BI Supported Supported
PU BI Supported Not Supported
SN BI Supported Supported
QWLBI Not Supported Not Supported
SEAU Not Supported Supported
FCAU Not Supported Not Supported
Table 7-2: The summary of the moderating effect of MF for both samples
The results of the MGA showed that masculinity moderates the relationship
between PEOUBI for the British and Lebanese sample, with the relationship
stronger in the low masculine group. This result confirms that of previous work by
(Li et al., 2009; Dinev et al., 2009; Srite and Karahanna, 2006; Zakour, 2004b;
McCoy et al., 2005a) and demonstrates its applicability in the e-learning domain.
This is maybe due to the fact that PEOU emphasise more on the creation of a
pleasant and better work environment and emphasise less on work goals and
achievements (McCoy et al., 2007; Srite and Karahanna, 2006; Qingfei et al.,
2009) which is related to individuals with low masculine (feminine) cultural
values.
The results also showed that masculinity moderates the relationship between
PUBI for the British sample. In particular, the relationship was stronger for
users with high masculine cultural values. This is maybe due to the fact that PU is

Chapter 8: Conclusion and Further Research
Ali Tarhini 218
closely related to achievements of work goals (Venkatesh and Davis, 2000). This
finding is consistent with previous research e.g. (Venkatesh et al., 2004) which
found that instrumental beliefs influenced the technology acceptance intentions of
individuals’ with high masculine values. However, contrary to our expectation
and hypotheses, the results have showed that the MF cultural variable did not
moderate the relationship between PU and BI for the Lebanese sample. Therefore,
our results suggest whether individual hold masculine or feminine cultural values,
those who found the system useful will have a stronger intention to use the system
than those with lower score of PU in the context of Lebanese culture.
Additionally, the results of the MGA have showed that PD moderates the
relationship between SNBI for the UK and Lebanese sample, with the
relationship was found to be stronger for low masculine (feminine) group. This
result confirms that of previous work by (Srite and Karahanna, 2006; Dinev et al.,
2009; McCoy et al., 2005a) and demonstrates its applicability in the e-learning
domain in Lebanon and England. It is argued that individuals who hold low
masculine cultural values are more influenced by interpersonal relationships and
cooperation (Hofstede, 1991). Such individuals will tend to respond more to the
opinions and suggestions of others (Li et al., 2009; Dinev et al., 2009; Srite and
Karahanna, 2006; Venkatesh et al., 2004).
Furthermore, MF cultural variable was found to moderate the relationship
between SE and AU for the Lebanese sample, with the relationship was stronger
for individuals with low masculine values. Similar results were also reported by
(Venkatesh et al., 2004; Venkatesh and Morris, 2000) who found that individuals
with high masculine values perceive analytical and competitive approaches to
solving problems which will lead to higher score on Self-efficacy. However, MF
did not moderate the relationship between SE and AU for the British sample. This
is maybe due to the fact that the sample was relatively masculine. This means that
the degree to which SE affects intention and acceptance of web-based learning
system is not affected by MF cultural value an individual may hold.

Chapter 8: Conclusion and Further Research
Ali Tarhini 219
Furthermore, MF cultural variable did not moderate the relationship between
QWLBI and FCAU for the UK and Lebanese sample. This may be a result of
the educational setting of the current study (as the quality of the experience may
be more highly valued by all users in this context than it necessarily would in a
purely work setting) or it may be that the measurement of QWL itself is
ambiguous with respect to the relative emphasis on hedonic vs. instrumental
features. Therefore, the degree to which QWL and FC affects intention to use the
web-based learning system is not affected by MF cultural variable.
Therefore, hypothesis H12a and H12b were partially supported.
7.3.1.3 Individualism/Collectivism (IC)
In terms of the British sample, the results of the moderating impact of IC cultural
variable are presented in Section 6.5.1.3. The overall mean for IC construct was
3.82/7, indicating a moderate IC culture. This results deviates from Hofstede’s
(1980) findings which found that the UK scored 89 on the individualism scale.
Thus, the generalisation of data should be treated with caution. As with other
cultural variables, the data was split into two groups using median-split methods.
There were 286 respondents in the individualistic group and 316 in the high
collectivistic group. The results also showed that the R2 for BI was 69.9% and
74.2% for AU in the individualistic group, whereas in the collectivistic group the
variance explained (R2) for BI was 66.3% and 71.4% for AU indicating a good
model fit. In the individualistic group, the highest path coefficient was between
QWLBI, while the lowest was between FCAU. This means that although
technical infrastructure exists to support the use of the web-based learning system,
but their importance is limited compared to social and individual factors. It also
means that individuals with individualistic cultural values perceive the importance
of technology on their quality of work life. On the other hand, the highest path
coefficient was between SEAU in the collectivistic group, while the lowest was
between PUBI. Although perceived usefulness is important but it still get little
attention compared to other factors. Conversely, such students perceive the

Chapter 8: Conclusion and Further Research
Ali Tarhini 220
highest importance to self-efficacy when forming their perceptions towards using
the web-based learning system. Furthermore, the test of the multi-group analysis
showed that four paths were moderated by individualism\collectivism cultural
variable. These paths were PEOUBI, PU BI, SNBI and FCAU.
In terms of the Lebanese sample, the results of the descriptive statistics in Section
6.6.1.3 showed that the overall mean for the moderating construct IC was 5/7
indicating a collectivist cultural value. This results is consistent with Hofstede’s
(1980) findings which found that the Arab countries scored 38 on the
individualism scale which means a moderate culture on I\C cultural values. As
with other cultural variables, the data was split into two groups using median-split
methods. There were 338 respondents in the low collectivistic group and 231 in
the high collectivistic group. Overall, the R2 for BI was 54.3% and for AU was
47.7% in the low collectivistic group, while in the high collectivistic group the
variance explained (R2) for BI was 46.1% and 50.5% for AU indicating a
moderate model fit. In the low collectivistic group, the highest path coefficient
was between QWLBI, while the lowest was between SEAU. This result
suggests that for individuals with lower level of collectivism will perceive QWL
as a major factor in forming their perceptions towards using the technology,
whereas paid less attention to the importance of self-efficacy on their behaviours.
On the other hand, in the high collectivistic group, the highest path was between
SNBI while the lowest was between PUBI. The findings indicate that for
users with high collectivistic cultural values, the influence of their colleagues and
superiors plays an important role in their decision to adopt the web-based learning
system, whereas such users paid less attention to the usefulness of the system
compared with other factors.
The results of the moderating effect of individualism /collectivism on the
predictors of BI and AU of the web-based learning system for both samples are
presented in Table 7.3.

Chapter 8: Conclusion and Further Research
Ali Tarhini 221
Research Moderator
Hypotheses (individualism /collectivism)
Proposed
Relationship
England Lebanon
(H13a1,a2,a3,a4,a5,a6),
(H13b1,b2,b3,b4,b5,b6)
The relationship between (PEOU, PU, SN,
QWL, SE, FC) and BI and AU of the web-
based learning system is moderated by the
individualism /collectivism value in the
British/Lebanese context.
PEOU BI Supported Not Supported
PU BI Supported Not Supported
SN BI Supported Supported
QWLBI Not Supported Not Supported
SEAU Not Supported Supported
FCAU Supported Supported
Table 7-3: The summary of the moderating effect of IC for both samples
The results of the MGA have showed that Individualism/Collectivism cultural
values moderate the relationship between PEOU BI for the UK sample. The
relationship is stronger for users with high collectivistic cultural values. Thus, the
findings show that for more collectivist users, the ease of use of the system plays
greater roles in the decision to adopt technology. This result is in line with
previous research e.g. (Lee et al., 2007; McCoy et al., 2005a; Sánchez-Franco et
al., 2009) which found that users with high individualistic cultural values will be
more confident in using new technologies and will find the technology easier to
use than users with high collectivistic cultural values. However, IC cultural
variable did not moderate the relationship between PEOU BI for the Lebanese
sample. This result was unexpected. McCoy et al. (2007) found that the path from
PEOU and BI was impaired in collectivist settings and speculated that people
within these settings may be more willing to endure poor usability so long as they
are achieving goals that are valued by the wider group. Therefore, the speculation
that users with high individualistic cultural values will be more confident in using
new technologies and will find the technology easier to use than users with high
collectivistic cultural values was not supported. This means that the degree to
which PEOU affects intention and acceptance of an web-based learning system is
not affected by IC cultural value an individual may hold.
The results of the MGA also showed that IC cultural variable moderates the
relationship between PU and BI to adopt and use the system for the British
sample. The relationship is stronger for users with individualistic cultural values.
Thus, the findings showed that users with individualistic cultural values may
adopt and use the technology because of their potential usefulness on their

Chapter 8: Conclusion and Further Research
Ali Tarhini 222
education rather than the ease of use of the web-based learning system. In other
words, individualistic users will use the technology because it can enhance their
productivity which is related to PU even if they do not have a positive attitude
towards using the technology (Parboteeah et al., 2005). Our results is also in line
with the social presence theory (Short et al., 1976), which suggests that people
with collectivistic cultural values tend to underestimate the usefulness of a certain
technology since they mute the group effects (Straub et al., 1997). However, our
result fails to support this relationship within the Lebanese sample. This result
was unexpected since individualistic cultures are characterised by an emphasis on
the achievement of individual goals, so PU would appear to be a highly relevant
factor for technology adoption in such settings, relating as it does to technology as
a means for the achievement of specific goals. Therefore, the speculation that such
users may adopt and use the technology because of their potential usefulness on
their education rather than the ease of use of the web-based learning system was
not supported.
Additionally, the results revealed that IC moderates the relationship between SN
and BI for the UK and Lebanese sample. The relationship was stronger for users
with high collectivistic cultural values. Thus, the findings showed that for more
collectivist users the opinions of others such as supervisors and peers play greater
roles in the decision to adopt technology. This effect had been predicted by a
number of authors, but previous support for it was limited to a few studies that
compared samples across countries where there may have been other variables at
work e.g. (Srite and Karahanna, 2006; Dinev et al., 2009). The results also
support Hofstede’s (1980) findings which indicated that the relationship between
the individual and the collectivity in human society goes beyond people living
together; it is related and linked with social norms which mean that people with
high collectivistic cultural values are more likely to comply with the opinions and
suggestions of their direct referents.
Although no moderating effect of Individualism/Collectivism cultural variable
was found on the relationship between QWL and BI for the UK and Lebanese

Chapter 8: Conclusion and Further Research
Ali Tarhini 223
sample, however QWL was found to be an important predictor in both samples. In
other words, the degree to which QWL affect the intention to use the web-based
learning is not affected by IC cultural value that an individual may hold.
Furthermore, the results of the MGA showed that IC cultural variable moderates
the relationship between FC and AU for the Lebanese sample, with the
relationship was stronger for users with high collectivistic cultural values. Our
finding is in line with previous research e.g. (Csikszentmihalyi, 2000; Thatcher et
al., 2003) which show that for more collectivist users the management support
such as training, technical infrastructure plays greater roles in the decision to
adopt technology. However, this relationship was not supported in the British
sample. This is maybe because technical infrastructures are related to
organisational factors and not related directly to users’ belief. This means that the
degree to which FC affect the intention to use the web-based learning is not
affected by IC cultural value that an individual may hold.
Thus, hypothesis H13a and H13b were partially supported.
7.3.1.4 Uncertainty avoidance (UA)
In terms of the UK sample, Section 6.5.1.4 presents the results of the moderating
impact of uncertainty avoidance cultural variable. The overall mean for UA
construct was 4.4/7, indicating a moderate uncertainty avoidance culture. Our
results deviates from the original findings of Hofstede (1980) which indicate that
the UK is low on uncertainty avoidance (scored 35/100). The results of the
descriptive statistics showed that there are 324 students in the low UA group and
278 in the high UA group. The results indicated that both models had good model
fit of the data. It was also found that the R2 for BI was 68.7% and 64.5% for AU
in the low-UA sample, while in the high-UA sample the R2 for BI was 63.8% and
66.4% for AU. The highest path coefficient for both groups was between
QWLBI, while the lowest was between FCAU for low UA group and
PUBI for high UA group. This means that both groups perceive QWL as a
major factor in forming their perceptions towards using the web-based learning

Chapter 8: Conclusion and Further Research
Ali Tarhini 224
systems. Additionally, for users with low UA cultural values, it was found that
management support affects the user’s decision to accept the web-based learning
systems however its importance was less than social and individual factors. While
for users with high UA cultural values, the perceived usefulness was found to be
important, however it gained little attention compared to other factors.
Furthermore, the test of the multi-group analysis showed that three paths were
moderated by the UA cultural variable. These paths were PUBI, SNBI
SEAU, and FCAU.
In terms of the Lebanese sample, Section 6.6.1.4 presents the results of the
moderating impact of the uncertainty avoidance cultural variable. The mean
average for UA was 5.46/7 indicating a high UA culture. Our results is consistent
with the original findings of Hofstede’s (1980) which reported that the Arab world
scored 68 on uncertainty avoidance which means a high culture on UA. The
results of the descriptive statistics showed that there are 274 students in the low
UA group and 295 in the high UA group. The R2 for BI was 52.8% and 43.5% for
AU within the low-UA sample, while in the high-UA sample the variance
explained (R2) for BI was 46.1% and 54.7% for AU, indicating a moderate model
fit. The highest path coefficient for both samples was between QWLBI, while
the lowest was between SNBI for low UA group and PUBI for high UA
group. This means that both groups perceive QWL as a major factor in forming
their perceptions towards using the web-based learning systems. Additionally, for
users with low UA cultural values the influence of colleagues and superiors
affects their decision to accept the system however it was less important than
other factors. While users with high UA cultural values, perceived usefulness was
found to be important, however less attention was paid to this factor compared to
other social and individual factors. Furthermore, the test of the multi-group
analysis showed that three paths were moderated by UA cultural variable. These
paths were PEOUBI, SNBI, QWLBI and FCAU.

Chapter 8: Conclusion and Further Research
Ali Tarhini 225
The results of the moderating effect of individualism/collectivism on the key
factors of BI and AU of the web-based learning system for both samples are
presented in Table 7.4.
Research Moderator
Hypotheses (Uncertainty Avoidance)
Proposed
Relationship
England Lebanon
(H14a1,a2,a3,a4,a5,a6),
(H14b1,b2,b3,b4,b5,b6)
The relationship between (PEOU, PU, SN,
QWL, SE, FC) and BI and AU of the web-
based learning system is moderated by the
Uncertainty Avoidance value in the
British/Lebanese context.
PEOU BI Not Supported Supported
PU BI Supported Not Supported
SN BI Supported Supported
QWLBI Not Supported Not Supported
SEAU Supported Not Supported
FCAU Supported Supported
Table 7-4: The summary of the moderating effect of UA for both samples
The results of the MGA have showed that UA moderates the relationship between
PEOU and BI for the Lebanese sample. The relationship was stronger for users
with high UA cultural values. Thus, the findings suggest that for users high on
UA, perceived ease of use plays greater role on their decision to adopt the
technology. Our findings confirm the predictions of McCoy et al., (2007) and
Straub et al. (1997) and Sanchez-Franco et al. (2009) which indicate that users
with high UA tends to hold lower perceptions of using computers and is more
concerned about ease of use of the technology in order to decrease their anxieties
towards using the technology. However, our results fail to support the same
relationship within the UK sample. This means the degree to which PEOU affect
the intention to use the web-based learning system is not affected by UA cultural
values.
Furthermore, the relationship between PU and BI to use the web-based learning
system was moderated by UA for the UK sample. The relationship is stronger for
users with low UA cultural values. Thus, the findings show that users with lower
level of UA will perceive higher importance to the usefulness of technology in the
decision to adopt technology. This supports the earlier findings McCoy et al.
(2007) and the predictions of Sánchez-Franco et al. (2009). The fact that we
examined culture at the individual level allowed our research to untangle the
impact of several cultural variables and this may explain why we were able to

Chapter 8: Conclusion and Further Research
Ali Tarhini 226
demonstrate an impact of UA on the PU->BI relationship where Sánchez-Franco
et al. (2009) failed. However, our results fail to support the same relationship
within the Lebanese sample. Therefore, the speculation that users with low UA
will accept the technology as they are less likely to be cautious towards
technology and therefore perceive the system to be more useful than those with
high UA cultural values was not supported in the context of e-learning in
Lebanon.
Additionally, UA moderates the relationship between SN and BI for the UK and
Lebanese sample. In particular, the relationship was stronger for users with high
UA cultural values. In other words, students with high Uncertainty Avoidance
will be highly influenced by their colleagues, peers and even their instructors to
use the system as they are more likely to be cautious towards technology and the
views of others provide useful information that reduces uncertainty. Again these
results confirm some of the previous research (Srite and Karahanna, 2006; Dinev
et al., 2009).
Furthermore, the results showed that the relationship between FC and AU was
stronger for users with high UA cultural values in the UK and Lebanese sample.
Thus, the findings show that for high UA users, management support such as
training and technical infrastructure, plays a greater role in the decision to adopt
technology. In other words, such users will rely more on FC from the social
environment (Venkatesh and Morris, 2000; Hwang, 2005) in order to reduce
uncertainty and anxiety and improve performance.
Finally, contrary to our expectation, UA did not moderate the relationship
between QWL and BI for the UK and Lebanese sample. This means that the
degree to which QWL affects the users’ decisions to use an web-based learning
system is not affected by Uncertainty Avoidance cultural variable.
Therefore, it can be concluded that hypothesis H14a and H14bwas partially
supported.

Chapter 8: Conclusion and Further Research
Ali Tarhini 227
7.3.2 Discussion Related to the Demographic variables
This section will discuss the results of the moderating impact of the demographic
characteristics namely gender, age, educational level and experience; on the
relationships within the British and Lebanese model.
7.3.2.1 Gender
In terms of the UK sample, the results in Section 6.5.2.1 showed that the variance
explained (R2) for BI was 66.7% and 69.1 % for AU in the male group, whereas in
the female group the variance explained (R2) for BI was 67.8% and 73.3% for
AU, indicating a good fit of the data. In the male group, the highest path
coefficient was between QWLBI, while the lowest was between FCAU. This
means that although technical infrastructure exists in order to support and increase
the usage the web-based learning system, their importance is limited compared to
social and individual factors. On the other hand, the highest path coefficient was
between SEAU in the female groups, while the lowest was between PUBI.
This result suggests that female students are more driven by self-efficacy in
forming their perceptions towards using the web-based learning system rather
than its usefulness on their education. The test of the multi-group analysis showed
that gender moderates the relationship between PUBI, SNBI, QWLBI and
FCAU. In particular, the relationship was stronger for males in terms of
PUBI and QWLBI, while the relationship was stronger for female in terms of
SNBI and FCAU. However no differences were detected on the relationship
between PEOUBI, BIAU and SEAU.
In the Lebanese sample, the results in Section 6.6.2.1 revealed that the R2 for BI
was 40.2% and for AU was 44.5% within the male sample, indicating a moderate
model fit, while the variance explained (R2) for BI was 57.2% and 51.3% for AU
within the female group, which indicates a good model fit of the data. The
strongest magnitude for male and female was between QWLBI while the lowest
was between SNBI in the male group and PUBI in the female group. These
results indicate that both groups perceived QWL as a major factor in forming their

Chapter 8: Conclusion and Further Research
Ali Tarhini 228
perceptions towards using the web-based learning system. It also suggests that for
male users the influence of other colleagues and instructors was important but less
than other factors. The results also suggest that female students are more driven
by social and individual factors rather than the usefulness of the web-based
learning system on their education. The results of the multi-group analysis showed
that gender moderates the relationship between PEOUBI, SNBI and
QWLBI, while no moderating effects were detected in terms of PUBI,
SEAU and FCAU.
A summary of the moderating effect of gender for the British and Lebanese
samples is presented in the Table 7.5:
Research Moderator
Hypotheses (Gender)
Proposed
Relationship
England Lebanon
(H15a1,a2,a3,a4,a5,a6)
(H15b1,b2,b3,b4,b5,b6)
The relationship between (PEOU, PU, SN,
QWL, SE, FC) and BI and AU of the web-
based learning system will be moderated
by the gender in the British/Lebanese
context.
PEOU BI Not Supported Supported
PU BI Supported Not Supported
SN BI Supported Supported
QWLBI Supported Supported
SEAU Not Supported Not Supported
FCAU Supported Not Supported
Table 7-5: The summary of the moderating effect of gender for both samples
Gender was found to moderate the relationship between PEOU and BI within the
Lebanese sample, such that the relationship was stronger for the female group.
This means that female students tend to place more emphasis on the ease of use of
the system when deciding whether or not to adopt the system. Our finding is
consistent with previous studies e.g. (Venkatesh et al., 2003). This is may be due
to the fact that men generally have lower computer anxiety which will increase the
self-efficacy since they follow a competitive approaches to solve the problems
(Venkatesh and Morris, 2000; Cooper and Weaver, 2003; Roca et al., 2006). On
the contrary, gender did not moderate the relationship between PEOUBI within
the British sample, our results is inconsistent with previous research studies e.g.
(Venkatesh and Morris, 2000; Venkatesh et al., 2003). In another words, no
differences between male and female students were detected in terms of perceived
ease of use. However, our results supports the findings of Wang et al. (2009) who

Chapter 8: Conclusion and Further Research
Ali Tarhini 229
did not find any moderating impact of gender on the relationship between effort
expectancy (similar to PEOU) and BI.
In terms of the moderating effect of gender on PUBI, our results indicate that
the relationship was stronger for male users within the UK sample. Our findings
are consistent with literature in social psychology, which emphasises that men are
more ‘‘pragmatic’’ compared to women and highly task-oriented (Minton et al.,
1980) and usually have a greater emphasis on earnings and motivated by
achievement needs (Hoffmann, 1980; Hofstede and Hofstede, 2005; Terzis and
Economides, 2011) which is directly related to usefulness perceptions. However,
contrary to our hypotheses and previous research e.g. (Venkatesh and Morris,
2000; Venkatesh et al., 2003), gender did not moderate the relationship between
PU and BI within the Lebanese sample. Our results indicate that the strength of
relationships among the PU and BI does not change with gender. This means that
no matter what the gender an individual belonged to, those with higher score on
perceived usefulness had a better intention to use web-based learning system.
In addition, gender was also found to moderates the relationship between SN and
BI for both samples, such that the relationship was stronger for female students.
This result is consistent with the majority of previous literature (Venkatesh and
Morris, 2000; Wang et al., 2009; Hu et al., 2010; He and Freeman, 2010) which
report that men are less likely to accept a certain behaviour even if the majority of
the people accept and agree on that behaviour. This might be because women are
thought to rely more than men on others’ opinion (Venkatesh and Morris, 2000;
Hofstede and Hofstede, 2005) as they have a greater awareness of others’ feelings
and therefore are more easily motivated by social pressure and affiliation needs
than men (Venkatesh and Morris, 2000). Another reason might be because men
are more confident in using computers and have higher self-efficacy compared
with women (Venkatesh et al., 2003) and the impact of other people to adopt the
technology will be weaker for men since they base their decision on their own
personal knowledge and experience.

Chapter 8: Conclusion and Further Research
Ali Tarhini 230
The test of the Multi-Group Analysis also showed that the relationship between
QWLBI was moderated by gender with the relationships found to be stronger
for male for both samples. These results was expected, as QWL focuses on
benefits of technology which are generally thought to be more relevant to males
and focuses less on the issue of using technology to generate rapport (Srite and
karahanna, 2000; Venkatesh et al., 2004).
However, contrary to our hypotheses and previous research e.g. (Venkatesh and
Morris, 2000; Venkatesh et al., 2003), the results of the multi-group analysis
revealed that gender did not moderate the relationship between SE and AU for the
British and Lebanese samples. Our results indicate that the strength of
relationships among SE and AU does not change with gender. This means that no
matter what gender group a user belonged to, users with higher score on self-
efficacy had a better intention to use web-based learning system than those with
lower perceived usefulness and self-efficacy.
Furthermore, gender was found to moderate the relationship between FCAU
within the British sample, the relationship between was found to be stronger for
female users, this results is consistent with Hofstede’s cultural theory (Hofstede
and Hofstede, 2005) proposition which is related to masculinity\femininity
cultural dimensions, which indicates that women compared with men rated a
higher importance towards FCs, with respect to the service aspects and the
working environment. On the contrary, the results of MGA indicate that gender
did not moderate the relationship between FC and AU for the Lebanese sample.
In summary, the results indicate that hypothesis H15a and H15b were partially
supported.
7.3.2.2 Age
In terms of the UK sample, the results in Section 6.5.2.2 revealed that the variance
explained for BI was 63.2% and 71.5% for AU in the younger-age group
(age<=22), whereas in the older-age group (age>22) the R2 for BI was 57.8% and

Chapter 8: Conclusion and Further Research
Ali Tarhini 231
56.4% for AU, which indicates a good fit of the data. The highest path coefficient
for both samples was between QWLBI, while the lowest was between
FCAU. These results indicate that both groups perceived the importance of
technology on their quality of work life. Furthermore, management support was
found to be less important in both age groups compared to social and individual
factors. the results revealed that age had a significant moderating impact on the
relationship between PUBI, SNBI, QWLBI and SEAU with the
relationship was stronger in younger-age group in terms of PUBI, whereas the
relationship was stronger for older-age group in terms of SNBI, QWLBI and
SEAU.
In the Lebanese sample, the results of moderating impact of age on the
relationship between the exogenous and endogenous latent constructs presented in
Section 6.6.2.2 indicated a good model fit of the data, with the R2 was 56.5% for
BI and 48.2% for AU in the younger-age group, and the R2 for BI was 53% and
42.4% for AU in the older-age group. The highest path coefficient for both
samples was between QWLBI, while the lowest was between SNBI in the
younger-age group and between FCAU in the older age group. These results
indicate that both groups perceived QWL as a major factor in the decision to
adopt the technology. Furthermore, for younger age group the social influence
doesn’t play an important role in determining their perceptions towards using the
web-based learning system. On the other hand, although management support was
found to be an important factor for older age group, however it gained less
attention compared to the social and other individual factors. The results of the
MGA showed that age moderates the relationship between PEOUBI, QWLBI
and FCAU.
As expected, age was found to moderate the relationship among most of the
predictors and behavioural intention and actual usage (see Table 7.6). These
results were expected as previous research showed that age plays an important
role in the acceptance of technology e.g. (Wang et al., 2009; Morris et al., 2005).

Chapter 8: Conclusion and Further Research
Ali Tarhini 232
Research Moderator
Hypotheses (Age)
Proposed
Relationship
England Lebanon
(H16a1,a2,a3,a4,a5,a6)
(H16b1,b2,b3,b4,b5,b6)
The relationship between (PEOU, PU, SN,
QWL, SE, FC) and BI and AU of the web-
based learning system will be moderated by
the age in the British/Lebanese context.
PEOU BI Not Supported Supported
PU BI Supported Not Supported
SN BI Supported Not Supported
QWLBI Supported Supported
SEAU Supported Not Supported
FCAU Not Supported Supported
Table 7-6: The summary of the moderating effect of Age for both samples
The results of the MGA showed that age moderates the relationship between
PEOU and BI for the Lebanese sample. The relationship was stronger for older
students which confirms the results of Wang et al (2009) and Venkatesh et al.
(2003). These results indicate that older students are motivated by the ease of use
of the web-based learning system. The rationale could be that younger users
usually tend to have higher self-efficacy, and their decision to accept the
technology will be influenced by PU rather than PEOU (Wang et al., 2009;
Burton-Jones and Hubona, 2006). However, contrary to previous research and our
hypotheses, age did not moderate the relationship between PEOUBI within the
British sample, which means that the degree to which PEOU affects the BI to use
the web-based learning system is not affected by the age group a user belongs to.
The results of the MGA also showed that age moderate the relationship between
PUBI within the UK sample, with the relationship being stronger for younger-
age group. The rationale could be that younger users usually tend to have higher
self-efficacy, and their decision to accept the technology will be influenced by
perceived usefulness more than any other factors (Wang et al., 2009). On the other
hand, age did not moderate the relationship between PU and BI within the
Lebanese sample. Our result is inconsistent with the majority of previous research
(Venkatesh et al., 2003; Wang et al., 2009; Czaja et al., 2006), but confirm the
results of Chung et al (2010). This means that no matter what age group a user
belonged to, students with higher score on perceived usefulness had a better BI to
use web-based learning system than those with lower perceived usefulness.
The results of the MGA also revealed that age moderates the relationship between
SN and BI within the British sample, with the relationship was stronger for older

Chapter 8: Conclusion and Further Research
Ali Tarhini 233
users. Older users tends to be more influenced by other’s opinions (Venkatesh et
al., 2003) compared to younger students. This may be due to the fact that
affiliation needs increase with age (Morris and Venkatesh, 2000). However,
contrary to our hypotheses and previous research e.g., (Wang et al., 2009;
Venkatesh et al., 2003; Jones et al., 2009), no moderating role of age was found
on the relationship between SN and BI within the Lebanese sample. This is maybe
because age differences were not large enough to demonstrate differences on the
relationship between SN and BI. In this regards, the speculation that older users
are affected more by others in terms of technology acceptance and adoption
(Venkatesh et al., 2003) than younger users was not empirically supported.
Additionally, age moderate the relationship between QWL and BI for the UK and
Lebanese samples. The relationship was found to be stronger for younger users.
These results were expected since QWL focuses on benefits of technology which
are generally more relevant to younger users (Srite and Karahanna, 2000).
Age was also found to moderate the relationship between FC and BI within the
UK sample, with the relationship stronger for younger users which confirm the
results of Venkatesh et al (2003) and Morris and Venkatesh (2000). Thus, the
findings suggest that for younger students the management support plays an
important role in the decision to adopt the web-based learning system. However,
contrary to our hypotheses, our results fail to support the moderating impact of
age on the relationship between FC and AU within the Lebanese sample. This
means that degree to which FC affects the actual usage of an web-based learning
system is not affected by the age group a user belongs to.
Finally, age moderate the relationship between SE and AU for the Lebanese
sample, with the relationship was found to be stronger for older users. The
rationale could be that older people often believe that they are very old to learn a
new Internet skills or even technology (Turner et al., 2007; Jung et al., 2010).
However, contrary to our expectation, age did not moderate the relationship
between SE and AU within the British sample. In another words, it does not
matter what age group a user belonged to, students with higher score on self-

Chapter 8: Conclusion and Further Research
Ali Tarhini 234
efficacy will use the web-based learning system than those with lower self-
efficacy.
Our results suggest that hypothesis H16a and H16b were partially supported.
7.3.2.3 Educational level
In terms of the UK sample, the results in Section 6.2.2.3 showed that the R2 for BI
was 65.3% and for AU was 72.8% in the undergraduate sample, whereas in the
postgraduate group the variance explained (R2) for BI was 58.3% and 60.5% for
AU, indicating a good model fit. In the undergraduate group, the highest path
coefficient was between PEOUBI, while the lowest was between FCAU.
This means that although technical infrastructure exists in order to support and
increase the usage the web-based learning system, their importance is limited
compared to other factors, such as social and individual factors. It also means that
undergraduate students focus on the ease of use of the web-based learning system
to establish positive intentions towards the acceptance behaviour. On the other
hand, the highest path coefficient was between QWLBI in the postgraduate
group, while the lowest was between SNBI. This means that although
postgraduate students are influenced by SN, but the influence of other’s opinions
(peers and superior) were very limited on their perceptions towards using the
technology. Conversely, postgraduate students perceived the quality of work life
as the major factor in forming their perceptions towards using the technology.
Furthermore, the test of the MGA showed that four paths were moderated by
educational level. These paths were PEOUBI, SNBI, QWLBI and
FCAU.
Regarding the Lebanese sample, the results in Section 6.6.2.3 showed that the R2
for BI was 59.1% and 49.5% for AU in the undergraduate group, whereas in the
postgraduate sample the variance explained (R2) for BI 44.1% and 42.9% for AU
indicating a moderate acceptable model fit. The highest path coefficient for both
samples was between QWLBI, while the lowest was between PUBI in the
undergraduate group and between PEOUBI in the postgraduate group. Our

Chapter 8: Conclusion and Further Research
Ali Tarhini 235
results indicate that both groups perceived QWL as a major factor in the decision
to adopt the technology. Furthermore, for undergraduate students, perceived
usefulness was found to be less important than other factors in determining their
perceptions towards using the web-based learning system. Conversely,
postgraduate students emphasise more on the usefulness of the web-based
learning system rather than the ease of use. The test of the MGA showed that four
paths were moderated by educational level. These paths were PEOUBI,
PUBI and SNBI.
The following Table (7.7) provide a summary of the moderating effect of
educational level.
Research Moderator
Hypotheses (Educational Level)
Proposed
Relationship
England Lebanon
(H17a1,a2,a3,a4,a5,a6)
(H17b1,b2,b3,b4,b5,b6)
The relationship between (PEOU, PU,
SN, QWL, SE, FC) and BI and AU of the
web-based learning system will be
moderated by the Educational level in
the British/Lebanese context.
PEOU BI Supported Supported
PU BI Not Supported Supported
SN BI Supported Supported
QWLBI Supported Not Supported
SEAU Not Supported Not Supported
FCAU Supported Not Supported
Table 7-7: The summary of the moderating effect of educational level for both
samples
Consistent with the previous research (Morris et al., 2005; Burton-Jones and
Hubona, 2006), educational level was found to have a significant influence on the
relationship between SNBI, PEOUBI within the UK and Lebanese sample,
where the relationship was stronger for users with lower educational level. These
results were expected since less educated people would find the technology hard
to use and thus would rely on other’s opinion regarding the adoption and usage of
web-based learning system. Conversely, higher educational level will negatively
affect the social influence on behaviour as both education and experience will
empower the users (Burton-Jones and Hubona, 2006; Lymperopoulos and
Chaniotakis, 2005). Furthermore, previous research have shown that when the
education level of users increases, their intention to use web-based learning
systems increases (Calisir, 2009).

Chapter 8: Conclusion and Further Research
Ali Tarhini 236
Furthermore, educational level was also found to moderate the relationship
between PU and BI for the Lebanese sample where the relationship was stronger
for postgraduate students, which confirm the majority of previous research e.g.
(Porter and Donthu, 2006; Rogers, 2003). Thus, our findings suggest that
postgraduate students place more emphasis on the usefulness of the system rather
than the ease of use when forming their perceptions towards using the web-based
learning system. However, contrary to our hypotheses; no moderating effect of
educational level was found on the relationship between PU and BI. This means
that the degree to which PU affects intention to use the web-based learning system
is not affected by students’ educational level. This is maybe because both
undergraduate and postgraduate students already familiar with the benefits of the
web-based learning systems on their education.
Educational level was also found to moderate the relationship between QWLBI
and FCAU within the UK sample, with the relationship was found to be
stronger for postgraduate students. This result was expected as QWL focuses on
benefits of technology which are generally thought to be more relevant to people
with higher level of education and focuses less on the issue of using technology to
generate rapport (Srite and karahanna, 2000; Venkatesh et al., 2004).
Additionally, the significant impact of educational level on the relationship
between FCAU indicates that management support has a strong effect on
behavioural intention for undergraduate users but has very little effect on
postgraduates. However, contrary to our expectation, no moderating effect of
educational level was found on the relationship between FCAU and QWLBI
within the Lebanese sample. This is maybe because both undergraduate and
postgraduate students are already familiar with the benefits of web-based learning
systems on their education. Our result suggests that the degree to which FC and
QWL affects BI to use the system is not affected by students’ educational level.
Thus it can be concluded that hypothesis H17a and H17b were partially supported.

Chapter 8: Conclusion and Further Research
Ali Tarhini 237
7.3.2.4 Experience
In terms of the British sample, the results in Section 6.4.1.4 showed that the
variance explained (R2) for BI was 70.4% and for AU was 74.9% within the
some-experience group, whereas in the experienced group the R2 for BI was
55.9% and 66.7% for AU, indicating an acceptable model fit of the data. Our
results show that the strongest path coefficient in the some-experience group was
between SEAU, while the lowest was between PUBI. This result suggests
that inexperienced users will form their perceptions based on their self-efficacy
which is related to ease of use of the technology rather than its usefulness on their
education. On the other hand, the results revealed that the highest path for the
experienced group among the predictors of behavioural intention and usage was
between QWLBI, whereas the lowest was between SN BI. This result
suggests that experienced users perceived the quality of work life as the major
factor among other predictors in forming their perceptions towards using the
system, while also found to give little attention to others’ opinions (peers and
superiors) towards using technology. Multi-group analysis showed that experience
moderates the relationship between PEOUBI, PUBI, SNBI, SEAU, and
FCAU. The result shows that the relationship between PEOUBI, SNBI,
SEAU and FCAU was stronger for the low-experience group while the
relationship between PUBI was stronger for the experienced group.
As for the Lebanese sample, the results in Section 6.6.2.4 showed that the
variance explained (R2) for BI was 56.8% and 49.3% for AU in the low-
experience group, while in the experienced group, the R2 for BI was 44.5% and
46.8% for AU, indicating that the model had a moderate acceptable fit of the data.
The highest path coefficient for both groups was between QWLBI, while the
lowest was between PUBI in the low-experience group and between SNBI in
the experienced group. This result suggests that both experienced and
inexperienced users perceived the quality of work life as the major factor among
other predictors in forming their perceptions towards using the system. The result
also suggests that individuals with low experience will give less attention to the

Chapter 8: Conclusion and Further Research
Ali Tarhini 238
usefulness of the system compared to other factors. On the other hand,
experienced users paid very little attention to the opinions of others such as
colleagues and superiors in their decision to adopt the technology. The results of
the MGA showed that experience moderates the relationship between PEOU_BI,
SN_BI and SE_AU.
Table 6.8 presents the results related to the moderating impact of experience on
the predictors of BI and AU of the system.
Research Moderator
Hypotheses (Experience)
Proposed
Relationship
England Lebanon
(H18a1,a2,a3,a4,a5,a6)
(H18b1,b2,b3,b4,b5,b6)
The relationship between (PEOU, PU, SN,
QWL, SE, FC) and BI and AU of the web-
based learning system will be moderated
by the Experience in the British/Lebanese
context.
PEOU BI Supported Supported
PU BI Supported Not Supported
SN BI Supported Supported
QWLBI Not Supported Not Supported
SEAU Supported Supported
FCAU Supported Not Supported
Table 7-8: The summary of the moderating effect of experience for both samples
The results of the MGA showed that experience moderates the relationship
between PEOUBI, SEAU for the UK and Lebanese sample, with the
relationship stronger for the low-experience group. Our results supports the
findings of the majority of previous research e.g. (Taylor and Todd, 1995b;
Venkatesh et al., 2000; Venkatesh et al., 2003; Venkatesh and Morris, 2000; Choi
and Han, 2009). These results suggest that experienced users will form their
perception towards using a new technology based on their previous knowledge
that they gained from using similar technologies in the past (Morris and
Venkatesh, 2000). The significant moderating impact of experience on the
relationship between PEOU and BI is clear and stable in previous studies
(Venkatesh and Davis, 2000; Venkatesh and Morris, 2000). Generally speaking,
when users have prior knowledge in using the technology, this will provide the
users with a more robust base to learn as users will relate their incoming
information with what their already know (Cohen and Levinthal, 1990). In other
words, experienced users will perceive that PEOU and SE are not a big issue
when learning a new technology (Taylor and Todd, 1995a; Venkatesh et al.,

Chapter 8: Conclusion and Further Research
Ali Tarhini 239
2003). In contrast, inexperienced users with no prior knowledge will prefer to use
the technology which is easy to use (Vijayasarathy, 2004; Roca et al., 2006).
The results also showed that experience moderate the relationship between SN
and BI for the UK and Lebanese sample, the empirical result has demonstrated
that the relationship was stronger for inexperienced users. Our findings is in line
with previous research which suggest that the role of SN will be expected to be
lower for experienced users as they more able to draw on their own past
experiences to shape their perception rather than the opinions of others
(Venkatesh et al., 2003; Venkatesh and Davis, 2000; Venkatesh and Morris,
2000).
Experience also moderates the relationship between PU_BI for the British sample,
with the relationship was stronger for the experienced group. These results is
consistent with previous research (Venkatesh et al., 2003; Maldonado et al.,
2009). Additionally, experience moderate the relationship between FC and AU for
the British sample, with the relationship found to be stronger for low-experience
group. On the other hand, contrary to our hypotheses, experience did not moderate
the relationship between PU_BI, QWL_BI and FC_AU for the Lebanese sample.
These results were not expected as it argued that the increase in users’ experience
will lead to user’s wider options for help and support and this will lead to more
usage of the system. It could be that both groups perceived the importance of the
system on their education. In other words, the degree to which PU, QWL and FC
affects intention to use the system is not affected by users’ experience.
Thus, hypothesis H18a and H18b were partially supported.

Chapter 8: Conclusion and Further Research
Ali Tarhini 240
7.4 Discussion related to the cross cultural
differences between Lebanon and England
7.4.1 National culture differences
The last objective of this research was to investigate the differences between
Lebanon and England on the individual- level cultural variables. The findings of
this research (see Chapter 5, Table 5.24) revealed that there is a significant
difference between the two countries on each of the four individual-level cultural
variables.
In terms of PD, the mean score is 3.16 for Lebanon and 2.567 for England,
indicating that both British and Lebanese students were low on PD, with the mean
significantly higher in Lebanon (t=9.377, p<.001). The results deviate from the
original findings of Hofstede’s (1980) which indicate that Arab countries are high
on power distance. Regarding masculinity/femininity (MF), the mean is 3.22 for
Lebanon and 2.535 for England, which indicate a masculine cultural values in
both samples, with the mean being significantly higher in Lebanon (t= 10.401,
p<.001). This result is inconsistent with Hofstede’s (1980) finding which
indicated that Arab countries are high on femininity. In what concerns
individualism/collectivism (IC), the mean score is 5.011 for Lebanon and 3.82 for
England with the mean significantly higher in Lebanon (t=21.102, p<.001). The
result reveals that British students have individualistic cultural values, while
Lebanese students had collectivistic cultural values. The results is consistent with
Hofstede’s (1980) findings about Lebanon and England. Finally, concerning
uncertainty avoidance (UA), the mean score is 5.46 for Lebanon, whereas for
British students the mean is 4.4, revealing that the mean is significantly higher in
Lebanon (t=20.171, p<.001). This means that Lebanese students find ambiguity
more stressful and avoid unclear situation than British students. Our results is
consistent with Hofstede’s (1980) finding about the Arab countries and England.

Chapter 8: Conclusion and Further Research
Ali Tarhini 241
It could be concluded that the mean for the individual-level cultural variables in
the British sample were close to that of Hofstede’s (1991). This result suggests
that the characteristics of the sample satisfied the cultural criteria of the overall
population. On the other hand, the findings from the Lebanese sample deviates on
power distance and masculinity femininity. A plausible explanation could be that
Arab countries were not as homogenous as Hofstede (1991) assumed, and also
changes have occurred over time since Hofstede’s collected his data 30 years ago.
For example, the power distance is reduced to minimum especially in the Arab
countries and more particularly in Lebanon while Hofstede’s work was done 30
years ago and at that time a big gap between the people regarding the authority
and power.
7.4.2 Differences on E-learning Acceptance
The results of the group differences at the national level between Lebanon and the
UK in terms of the predictors of the web-based learning system are presented in
Chapter 5 (Table 5.24). The results revealed that there are no significant
differences in terms of perceived usefulness (t=-1.033, main difference=-.06750)
and BI (t=-.563, mean difference= -.03795) between the two samples. This means
that both Lebanese and British students found the system usefulness in their
education and have good behavioural intention to use the system in the future.
In terms of PEOU, the mean score is 5.668 for Lebanon and 5.390 for England;
unexpectedly the results revealed that PEOU is significantly higher in Lebanon
compared to England (t=4.336, p<.001). In what concerns self-efficacy, the mean
score is 5.191 for Lebanon and 4.977 for England, which is unexpectedly higher
for Lebanon than England (t=3.414, p<.01).
Similarly, the results in Table 5.24 revealed that facilitating conditions (FC) was
significantly higher in Lebanon (t=5.464, p<.001), with a mean of 5.442 for
Lebanon and 5.045 for England. These results were not expected, however the
acquisition of the data could explain the results because it was collected from two

Chapter 8: Conclusion and Further Research
Ali Tarhini 242
private universities in Lebanon who has been investing heavily in web-based
learning systems to support their traditional teaching and to improve the learning
experience as well as the performance of their students.
The results also showed that there is marginally significant difference for
Lebanese and British students on subjective norm (SN), with a mean value 5.001
for Lebanon and 4.868 for England (t=2.010, p<.05), thus indicating that
Lebanese students are more willing to accept the pressure from external
environments (i.e., peers and superiors) to use the system. This result was
expected as there is a proportional relationship between SN and PD. Therefore; it
could be that users with higher level of PD were using the technology simply to
comply with their superior’s opinions and suggestions in using the technology.
Conversely, for people within low PD cultural values such as British, the
inequality is reduced to minimum and thus the impacts of superiors are expected
to be accessible to subordinates (Srite and Karahanna, 2006).
The results in Table 5.24 also showed that there is a significant difference for
Lebanese and British students on QWL, with a mean score of 5.4 for Lebanon and
5.566 for England, indicating that a higher significant mean in England (t=-2.695,
p<.01). This means that British students are more aware of the impact of
technology on their quality of life. Similarly, with respect to AU, the mean score
is 4.424 for England and 4.222 for Lebanon, thus revealing that British students
are using system more than the Lebanese students (t=-.20269, p<.01).
These results are important as it develops an inclusive categorisation of the
similarities and differences between British and Lebanese students on the
acceptance and usage of web-based learning systems. This will help in identifying
and understanding any differences between the cultures of these two countries.

Chapter 8: Conclusion and Further Research
Ali Tarhini 243
7.4.3 The Differences in the tasks the students perform
using the web-based learning system
In terms of the British sample, the results in Chapter 5 (Table 5.25) showed that
the majority of participants responded “to a great extent” on all other tasks except
for “Announcement” which scored “to a moderate extent” and “Discussion
Board” with the majority responded “to a small extent” where “Quizzes” scored
the lowest mean (M=2.82) among other tasks with the majority of the participants
answered “Not at all”. In terms of the Lebanese sample, Table 5.26 showed that
the participants responses was either ‘to a moderate extent’ or ‘to a great extent’,
with the majority of the participants responded “to a moderate extent” for
“Assessment”, “Course Handbook”, “Past Papers”, “Websites” and “Quizzes”.
Regarding the group differences on the tasks performed using the web-based
learning system, the results in Table 5.27 revealed no significant differences in
“lecture note”, “course Handbook” and “Discussion Board” between Lebanon and
England, significant difference were higher in Lebanon in terms of
“Announcement” and “Quizzes” and lower in terms of “Email”, “Past Papers”,
“Assessment” and “Websites”. This indicates that Lebanese students use the web-
based learning system more for “Announcement” and “Quizzes” and lower for
“Email”, “Past Papers”, “Assessment” and “Websites than British students. It is
worth noting that the highest mean for both samples was observed for “lecture
note”, with 318 (Mean=4.24) and 336 (mean=4.27) of respondents responded ‘to a
great extent’ in Lebanon and England respectively.
These results are important since it will add to the few studies that determine the
current usage of Web-based learning systems in the context of western/developed
countries exemplified here in England, and in non-western/ developing countries
exemplified here in Lebanon.

Chapter 8: Conclusion and Further Research
Ali Tarhini 244
7.5 Conclusion
This chapter presented an in-depth interpretation of the key findings of the
structural model. The hypotheses developed in the research study were discussed
and linked to previous research literature. Specifically, this chapter was centred
around 3 main parts. The first part provided a detailed discussion of hypotheses
related to the direct relationships in the research model. This part helped the
researcher to explain the overall relationships among the exogenous (PEOU, PU,
SN, QWL, SE, FC) and endogenous (BI and AU) latent constructs. In other
words, this set of hypotheses helped to understand the important role the
behavioural beliefs, social and organisational factors plays in affecting the
student’s beliefs towards adoption and acceptance of the web-based learning
systems in Lebanon and England. The other part of this chapter was dedicated to
discuss the results related to the impact of moderators namely; demographic
characteristics and cultural dimensions; on the relationships in the structural
model. Finally the last part of this chapter presented a detailed discussion related
to the similarities and dissimilarities between the two countries at the national
level.
In the next chapter (Chapter 8), a summary of the key findings of this research
will be presented. Furthermore, Chapter 8 will highlight the methodological,
theoretical and practical implications of the research study and discuss the
potential limitations and directions for future research.

Chapter 8: Conclusion and Further Research
Ali Tarhini 245
Chapter 8: Conclusion and Further Research
“Unobstructed access to facts can produce unlimited good only if it is matched by
the desire and ability to find out what they mean and where they lead.” (Norman
Cousins, Human Options: An Autobiographical Notebook, 1981)
8.1 Introduction
This chapter provides a conclusion of the research findings. The chapter begins
with an overall summary of this research in Section 8.2. It then presents
discussion on the key methodological, theoretical and practical contributions to
knowledge arising from this research in Section 8.3. This is followed by a brief
discussion of the potential limitations and directions for future research in
Sections 8.4 and 8.5 respectively. Finally, Section 8.6 concludes this chapter.
8.2 Research Overview
This section will provide a brief overview of the eight main chapters of this thesis
and the steps undertaken to fulfil the research aim and objectives.
Defining the research problem and setting the research aims and
objectives
Chapter 1 introduces the research problem and the motivation behind conducting
this research and its scope. It has been identified in literature that e-learning there
are many factors that affect the adoption and acceptance of e-learning systems
such as individual, social, behavioural, organizational, and cultural contexts. Such
factors play an important role in how an information technology is developed and
used. However, it has been argued that there is a lack of research covering the
important role of such factors in technology adoption and acceptance in the

Chapter 8: Conclusion and Further Research
Ali Tarhini 246
context of the developing countries such as Lebanon where universities and higher
education institutions support traditional styles of pedagogy in education.
Additionally, it has been identified in literature that although web-based learning
system is considered as a global technology, but it has been argued that the
efficiency of such tools should also be measured locally since users usually work
in local/national contexts. Therefore, this chapter highlights the importance of
examining the effects of individual, social, organizational and individual level
culture on the adoption and acceptance of web-based learning systems by students
in Lebanon and the UK.
Developing the Research Framework including the Direct and
Moderators Hypothesised
Chapter two provides a comprehensive literature review about the three main
research areas that form the basis for this research: technology adoption, e-
learning technologies, and individual-level culture. This chapter first discuss the
different e-learning tools being used by higher educational institutions. It is then
followed with a review of the nine most influential theories and models related to
technology adoption including IDT, SCT, TRA, TPB, DTPB, TAM, TAM2,
ATAM, and UTAUT. Finally, the importance of culture at the macro and micro
level is also examined.
The literature review chapter discusses the various theories and models related to
technology acceptance with its components and external factors which directly or
indirectly are useful in developing the conceptual framework for this study.
Chapter 3 explains and justifies the reasons behind choosing the Technology
Acceptance Model (TAM) as a foundation for our conceptual model to study e-
learning acceptance. This chapter also provides a further justification for including
the personal, social, and situational factors as key determinants in addition to the
integration of individual characteristics and Hofstede’s cultural dimensions as
moderators within the model to study e-learning adoption and acceptance.
Moreover, research hypotheses are drawn and operational definitions are
presented. The results of this chapter along with the detailed literature review in

Chapter 8: Conclusion and Further Research
Ali Tarhini 247
Chapter 2 helped achieve the first objective of this research, which is “to develop
a conceptual framework that captures the silent factors influencing the user
adoption and acceptance of web-based learning system”.
Selecting the Method of Research and the Data Gathering Technique
Chapter 4 describes and justifies the philosophical approach, methods and
techniques used in this research to achieve the main research objectives and to
answer the research questions. Technically speaking, this research employs a
quantitative method in order to understand and validate the conceptual framework.
It also justifies the reasons behind employing the cross-sectional survey research
approach which is based on positivism to guide the research. Additionally, a
justification for the selection of Structural Equation Modelling (SEM) as a data
analysis technique is provided. Furthermore, this chapter explained the sampling
technique and the reasons behind choosing the convenience sampling technique.
Preliminary data analysis
Chapter 5 describes the results of the pilot study to ensure the validity and
reliability of the measuring instruments to be used in testing the hypotheses and
presents the preliminary analysis of the data obtained from the respondents. The
Statistical Package for the Social Science (SPSS) version 18.0 is employed for
preliminary data analysis, including data screening, frequencies and percentages,
reliability analysis and t-test. The results from the data analysis in this chapter
focus on the cross-cultural differences between Lebanon and England (research
objective number 2) and also investigate the different tasks that students perform
using the web-based learning systems (research objective number 3). This chapter
helps achieve the second and third objectives of the research, which are “to
examine the similarities and differences between British and Lebanese students on
the acceptance and usage of web-based learning systems”.
Model Testing Phase
Chapter 6 provides the results of the model testing phase where an in-depth
analysis of the relationships among the constructs within the proposed research

Chapter 8: Conclusion and Further Research
Ali Tarhini 248
model is presented. Two steps have been used during the data analysis process. In
the first step, the confirmatory factor analysis (CFA) is employed to assess the
constructs’ validity and test the model fit where both samples have been found to
have satisfied reliability, discriminant validity and convergent validity. The next
step employs the structural equation modeling (SEM) technique to test the
hypothesised relationships among the independent and dependent variables. This
step includes testing the direct relationships among the constructs of the revised
measurement model in Lebanon and England respectively using the path analysis
technique. The researcher then uses the multi-group analysis technique to
investigate the moderating effect of demographic characteristics and individual-
level culture on the relationships between the key factors in the generated model.
The results of the structural model support the robustness of the model in Lebanon
and England respectively. More specifically, this chapter helps achieve the main
research question, which is “to empirically identify the factors that affect the
students’ intention to adopt and use the web-based learning system, and to
examine the moderating impact of individual-level culture and other demographic
differences on the relationship between those factors”
Discussion and Interpretation of the Main Research Findings
Chapter 7 discusses the main findings from Chapters 5 and 6 through an in-depth
interpretation of the demonstrated results and findings, and then links them to the
main aim and objectives of this research. This chapter helps in understanding the
important role the behavioural beliefs, social, organizational, individual and
cultural factors play in affecting the student’s beliefs towards adoption and
acceptance of web-based learning systems in Lebanon and England and also
discusses the similarities and dissimilarities between the two countries at the
national level.
Implications, Limitations and Future Research
Having developed and tested the research hypotheses and thus answered the
research questions, this chapter will highlight the methodological, theoretical and

Chapter 8: Conclusion and Further Research
Ali Tarhini 249
practical implications of the research study and discusses the potential limitations
and directions for future research.
8.3 Contribution of the research
In this section, we summarise the contributions the work described in this thesis
makes to theory, practice and methodology in the field.
8.3.1 Contribution to Theory
From the theoretical point of view, this study offers a number of significant
contributions. The core outcomes of this research is to develop a conceptual
research model that allow a better understanding of the factors that affect the
acceptance of e-learning technology in UK and Lebanon, and to study the impact
of two sets of moderators; namely cultural dimensions and individual
characteristics; on the relationship between those factors and behavioural intention
to use the technology. The literature review has revealed that there is a lack of
research on the impact of social, individual, organizational and cultural factors
especially in Lebanon and the UK. The results of this study contribute to the
followings:
First, this thesis provides a critical analysis of the adoption and acceptance
models in the IS literature. To answer the main research questions and thus
achieve the objectives of this study, a thorough and critical literature review of the
different constructs within each theoretical model is provided (Chapter 2). In
addition, a comparative study between each of the models is conducted including
the strength, weakness and explanatory power. Furthermore, individual-level
culture is also investigated. This study employs the Technology Acceptance
Model (Davis, 1989) due to its acceptable explanatory power and popularity in a
number of application areas (Venkatesh and Bala, 2008). Although the TAM
measures and predicts the acceptance and usage level of technology, there have
been some criticisms concerning the theoretical contributions of the model,

Chapter 8: Conclusion and Further Research
Ali Tarhini 250
specifically its ability to fully explain technology adoption and usage e.g. see,
(Bagozzi, 2007; Straub and Burton-Jones, 2007; Benbasat and Barki, 2007).
Consequently, the existing parameters of TAM neglect the investigation of other
essential predictors and factors that may affect the adoption and acceptance of
technology such as social, organizational and individual factors. Additionally, the
applicability of TAM is limited in the educational settings as much of the research
has been carried out in non-educational contexts. Hence, this study extended TAM
to include factors from different adoption models such as subjective norm, Quality
of work life, self-efficacy and facilitating conditions towards understanding of
acceptance intentions. Therefore, the detailed literature review and the
parsimonious model used in this study make a contribution for the design of
future technology acceptance models. In addition, this research added a further
step to the studies that take into account the individual, social and organizational
factors in technology acceptance and adoption.
The second contribution is to empirically confirm that TAM is applicable to e-
learning acceptance in developing countries exemplified by the Lebanon, and in
the developed world exemplified by the UK. TAM has been criticised for showing
bias in a cross-cultural context e.g. (McCoy et al., 2005a; Straub et al., 1997).
Furthermore, many TAM studies focus on Western/developed countries, while
TAM has not been widely tested within non-Western/developing countries (Teo
et al., 2008). Consequently, Teo (2008) emphasizes on the importance of testing
TAM in different cultures as it is argued that when Davis developed the TAM
(Davis, 1989), he did not take into consideration the un-biased reliability of TAM
in cross-cultural settings. Additionally, the applicability of TAM is limited in the
educational settings as much of the research has been carried out in non-
educational contexts. Abbad et al. (2009) had previously demonstrated support for
an extended TAM in Jordan in the context of e-learning, but their study did not
seek to characterise the Jordanian sample according to Hofstede’s cultural
dimensions. The current work therefore provides an additional contribution by
clarifying the specific pattern of cultural responses for which TAM has been
shown to apply. In addition, this is one of the few studies that validate the TAM

Chapter 8: Conclusion and Further Research
Ali Tarhini 251
model and other factors adopted from different theoretical models outside the
context of North America. Our results indicate that TAM holds across cultures, in
other words, it is applicable to both developing and developed worlds; therefore
other Lebanese and British researchers may apply findings from previous research
to local studies.
A third significant contribution of this work is to demonstrate the relevance of
quality of work life as an antecedent to behavioural intention within the context of
e-learning adoption. This variable has previously been suggested as potentially
important but had not been included in empirical work on TAM, nor had it been
investigated in relation to e-learning acceptance in Lebanon. The results of our
study validate and confirm that quality of work life is an important consideration
in the study of e-learning adoption. However, we have not been able to
demonstrate the predicted cultural effect, so the applicability of this attribute may
be relevant beyond the specific cultural focus of this study and further work on
this issue is necessary.
The fourth contribution to knowledge is that, this is one of the few studies that
combine technology acceptance models and cultural theories at the micro-level
within different cultural contexts who apparently exhibited unique psychological
and personal characteristics. To our knowledge, no other research has measured
cultural factors at the individual level in Lebanon and England. Therefore, this
study is considered as a useful guide for other researchers to understand whether
the acceptance of technology is mainly affected by individuals’ cultural
background (moderation effect) or whether the acceptance is mainly based on the
key determinants of technology itself (without an indirect effect of moderation).
Additionally, most of the literature about cultural studies in information systems
research is based on the national or organizational level. Within the same country,
individuals are usually influenced and motivated by professional, organizational,
social groups they belong to. While national culture is a macro-level phenomenon,
the acceptance of technology by end-users is at an individual level. Individual
behaviour cannot be measured or predicted using the national measurement score

Chapter 8: Conclusion and Further Research
Ali Tarhini 252
since there are no means to generalise cultural characteristics about individuals
within the same country, especially for measuring actual behaviour in the
adoption and acceptance of technology (Ford et al., 2003; McCoy et al., 2005a;
Straub et al., 2002). There is more evidence about the misleading of using country
score in explaining individual behaviour, for example Hofstede (1984a)
mentioned that his country-level analysis was not able to predict the individual
behaviour. Therefore, this study differs from the majority of the research which
uses the score of national culture to study the individual behaviour.
Therefore, the results of this research are beneficial in understanding the
importance of individual level culture on the different factors that affect e-learning
acceptance in Lebanon and England at individual and national level. For example,
the moderating effect of culture on the relationship between subjective norm and
behavioural intention are highly important in all of the four cultural dimensions in
the Lebanese context, while less important in the context of the UK. In other
words, the findings from technology acceptance models in one country may not be
applicable to another country, especially in the developing world. Our work
should therefore help towards building a clearer picture of precisely what
moderating roles culture might play within the extended TAM models. Our work
has particularly emphasised the role of multiple cultural variables in moderating
the effect of subjective norms in technology acceptance, providing evidence for
several relationships that have previously been hypothesised but for which
supportive evidence was ambiguous at best.
The fifth contribution of this study is that, it adds to the few studies that integrate
a set of individual factors in the model and highlight their important role in user
technology acceptance (Venkatesh et al., 2003). This study concludes that age,
gender, experience and educational level play an important role between the key
determinants and users’ intentions and users’ actual usage of the web-based
learning systems. Previous research (Venkatesh et al., 2003; Morris et al., 2005;
Wang et al., 2009) has only investigated the impact of individual characteristics

Chapter 8: Conclusion and Further Research
Ali Tarhini 253
on many factors, but there is inconclusive evidence of whether it actually affects
the relationship between the Quality of work life and behavioural intention.
The final theoretical contribution of this study is the development and validation
of a survey instrument. It is essential to modify and validate the new measures in a
situation where the theory is being formatted, but no prior validation in the same
context. (Straub et al, 2004). This study adopts the constructs’ items from many
different contexts and applies it to the context of e-learning, for example, the four
individual-level cultural dimensions (Dorfman and Howell, 1988) and quality of
work life constructs have never been used and validated in the context of this
study (e-learning). Therefore, the modifications and validating measures of the
cultural dimensions and quality of work life are considered as an important
contribution to theory.
8.3.2 Implication to Practice
Our research question of this study has focused on identifying the factors that
influence students’ intention to adopt and use web-based learning systems and
explore whether there are differences among these factors between British and
Lebanese students. This study identified many factors, which has led to a
conceptual model that extends the TAM to include subjective norms, self-
efficacy, quality of work life and facilitating conditions constructs as main
determinants. This model also incorporates culture and demographic variables as a
two sets of moderators that affect the relationship between the key predictors of
BI and AU of the web-based learning system. The empirical results have shown
that behavioural beliefs, social beliefs, organizational support, cultural
background and other individual characteristics have been found to affect the
students’ perceptions towards using the web-based learning system in Lebanon
and England. These empirical findings have managerial implications which are
relevant for system developers and university policy makers and administrators.

Chapter 8: Conclusion and Further Research
Ali Tarhini 254
In terms of behavioural beliefs (PEOU and PU), the results shows that PU
contributed the most to behavioural intention compared to the PEOU. These
findings are noticed more within respondents who are males, skilled in using
technology, holds high masculine and individualistic values and low in power
distance (PD) and uncertainty avoidance (UA) cultural values. In this context, it is
therefore believed that students who find the system useful in their learning
process and also find the system easy to use are more likely to adopt the system.
The results also suggest that training is not necessary for individuals who belong
to the first segment mentioned above; however it is crucial for the other one, since
those users will form their perceptions about using the web-based learning system
on the ease of use of the system no matter how useful the system is. Therefore, in
order to attract more users of e-learning, instructors should improve the content
quality of their web-based learning systems by providing sufficient, up-to-date
content that can fit the students’ needs. In order to promote the ease of use of such
systems, system designers should provide a system which promotes ease of use.
Quality of work life (QWL) has been found to be the most important construct in
explaining the causal process in the model for both samples. The demonstration
that quality of work life is important in the e-learning context also suggests that
system designers should pay attention to providing systems that address this
concern and that educators should explain the benefits of e-learning in terms that
relate to this construct. Additionally, this finding should inspire not only
organizations but also the government in promoting the importance of introducing
a new technology on the quality of work life.
We have also found that subjective norm is a significant determinant on
behavioural intention to use e-learning especially in the Lebanese sample. The
impact of this construct has been highly observed within users that are female,
less experienced, with feminine, high on power distance and uncertainty values. It
is therefore advisable for management and instructors in particular to target this
segment of students. In this context, the instructor should announce to the students
that using the system is mandatory and it is also advised that practitioners should

Chapter 8: Conclusion and Further Research
Ali Tarhini 255
persuade users who are familiar with the system to help in promoting it to other
users. This emphasises the need to consider implementation strategies that
develop buy-in from those within the wider social environment. The identified
moderating effects of culture also suggest that educators may need to consider the
balance of attributes (instrumental, hedonic or social) that they emphasise on
encouraging technology up-take, depending on the dominant local cultural values.
As mentioned above, facilitating conditions has been found to be an important
factor that positively influences actual usage of the web-based learning system.
This construct is found to be less influential for males, older in age and less
experienced users. Therefore, through categorization of the users into segments,
the management may decrease the time and money constraints and thus provide
efficient technical support in case they know the category the students belong to.
In addition, university administrators can improve their strategic decision making
about technology in the future.
Self-efficacy has been found to play an important role on the actual usage of the e-
learning system. It is clear that individuals with higher self-efficacy induce a more
active learning process (Chung et al., 2010). Therefore, IT teams should provide
both on- and off-line support in addition to training and this is necessary to
increase e-learning self-efficacy. Training is very useful in boosting self-
confidence in the use of technology and eventually individuals who demonstrate
higher self-confidence in using technology are more likely to use the system.
This research sheds lights on the important role of the demographic characteristics
and culture plays in the acceptance of technology especially when there is no
homogeneity across the countries and even across the individuals within the same
country. Therefore, e-learning designers and policy makers should advertise the
benefits of e-learning tools and also provide training and user support programmes
that consider the demographic differences. This is essential especially during the
first stage of adoption as once users become familiar with an e-learning system
they may persuade their friends to start using the system. Additionally, providing
a user-friendly interface and standard way of course delivery is one possible

Chapter 8: Conclusion and Further Research
Ali Tarhini 256
solution to help students increase their perception towards acceptance and
adoption of e-learning technologies.
The findings of this research also have practical implications to the higher
educational institutions and universities in Lebanon and the UK. Although the
government of these two countries are investing in e-learning technology, it
should be noticed that students will not accept and use the technology only
because it is useful. As previously mentioned, students’ perceptions towards using
the web-based learning system are formed through individual, social and
organizational beliefs, in addition to cultural values and other demographic
differences. In this context, all the major and different individual factors should be
considered simultaneously; this will help in understanding the complete picture of
problem under investigation. In other words, it is futile to facilitate a technology
which is implemented in a Western country or for specific group of users and then
apply it in non-western countries that have substantial cultural differences without
taking into consideration the cultural values. Therefore, policy makers should not
consider the strategies related to content, design and structure in one country and
simply apply it to another as it will be doomed to fail in other contexts.
Additionally, it is recommended that educational authorities should decide on the
best approach that fits their students before implementing any new technology.
Additionally, for the system developer of web-based learning systems and
particularly the Blackboards Inc., this research provides the opinions of the British
and Lebanese students on the important factors that affect the adoption and
acceptance of such system. Similarly, the users (students) can understand what
motivations and factors drive them into accepting the technology, and are aware
of the impact of using technology on their working life and that using the
technology is usually related to their social, attitudinal, cultural and individual
differences.
In conclusion, the findings of this study provide a framework that allows the
students, policy makers and system developers to understand the factors that

Chapter 8: Conclusion and Further Research
Ali Tarhini 257
affect students’ intention to adopt and use e-learning systems in Lebanon and
England.
8.3.3 Contribution to Research Methodology
From the methodological perceptive, this research illustrates the power of
quantitative method in verifying and confirming the research model, thus
achieving the research aim and objectives with several methodological
contributions.
Firstly, this study contributes to the trends of IS research which uses the structural
equation technique to test the measurement and structural models. Specifically,
this research uses two-step approach (confirmatory factor analysis and structural
equation modeling). Therefore, this research is one of the few studies to use SEM
statistical methods in a cross-cultural investigation of the factors affecting the
acceptance of e-learning environments. In addition, having conducted this
research in Lebanon is another significant contribution. There is a lack of studies
in the Arab world and specifically in Lebanon with applying SEM technique as a
method of analysis. Therefore, this thesis provides a clear example to other
researchers of how AMOS and structural equation modeling can be used in
cultural research as a technique of analysis.
Secondly, the use of Multi-group Analysis (MGA) technique to examine the
impact of moderators (individual characteristics and cultural dimensions) on the
relationship between exogenous and endogenous latent contrasts in the proposed
research model has been limited in previous literature; thus this research is among
the few studies employing MGA to detect and analyse moderation effects. The
results reveal that this method of testing the impact of moderators is successful in
highlighting the effect of individual-level culture and individual characteristics on
e-learning acceptance. Therefore, this technique is still new in AMOS and thus
the inclusion of MGA to answer the questions related to group comparisons and

Chapter 8: Conclusion and Further Research
Ali Tarhini 258
differences could be useful for future cultural IS studies especially in the
Lebanese context where researchers are not familiar at all with this technique.
Thirdly, the fact that the constructs used in the research have been drawn from
previous literature and mostly designed and applied in American or European
contexts highlights the importance of the validity and reliability of those
predictors and their measurement scales in different cultural settings. For
example, individual-level culture was tested in USA by Srite and Karahanna
(2006) and McCoy et al., (2005). Our results have revealed that some indictors
have to be deleted and thus are not the same as those of original scales to achieve
convergent and discriminant validity in addition to reliability. For example, the
items FC4 in facilitating conditions and SN4 from subjective norm have to be
deleted from the Lebanese sample due to high covariance and loading on other
variables. Therefore, this study contributes to examinations of the robustness of
the constructs that has been used in the research in cross-cultural settings,
particularly in Lebanon and in the UK. Nevertheless, this research also has shown
some limitations.
8.4 Research Limitations
The findings of this research are encouraging and useful for academic institutions
as they are based on a wide range of theoretical viewpoints and include a very
large sample size (N=1168). However as with any research, this research has
some limitations.
Firstly, our sample frame was based on convenience sampling technique and
included participants studying at two private universities in Lebanon and one
university in the UK. Although most of the cultural dimensions are in line with
Hofstede’s (2001) findings and the sample characteristics satisfies the criteria for
the target population, this sampling technique limits the ability to generalise the
findings to the entire Lebanese and UK population.

Chapter 8: Conclusion and Further Research
Ali Tarhini 259
Secondly, although our results find support for TAM in Lebanon and England
respectively, however generalizability of the findings to other countries should be
treated with caution. McCoy et al. (2007) found significant problems when
applying TAM in a range of countries. They indicated that TAM may not produce
satisfying results in countries with extreme cultural characteristics such as very
high power distance or very low uncertainty avoidance.
Thirdly, we used a self-report measure of the actual usage of the system rather
than a log file or observation, which limits our findings in terms of capturing more
thoroughly the students’ way of using the web-based learning system. However,
using self-report to measure the actual usage has been supported by previous
researchers (Zhang et al., 2008; Martinez-Torres et al., 2008; Liaw and Huang,
2011) and it has been shown to be a strong predictor to actual usage of the system.
Another limitation is that we assume the moderators (demographic characteristics
and individual cultural dimensions) to be statistically invariant. In other words, we
did not investigate the measurement invariance which is related to the
psychometric properties of the instrument before applying the multi-group
analysis to check for group differences among the groups to be compared. Thus,
the findings of the moderators should be treated with cautions.
Fourthly, our study has investigated the impact of moderating factors in a
mandatory environment and specific user group (e-learning users) and thus our
findings could not be generalised to a voluntary environment and other groups and
other e-learning systems. Additionally, the current work is only limited to one
particular e-learning system (Blackboard).
Furthermore, this research employs a cross-sectional method and quantitative
survey to collect the data, in other words, the data were collected at one single
time from Lebanon and the UK. Although the questionnaires have strong
theoretical literature and were carefully distributed to students, using a purely
quantitative analysis limits the ability to have an in-depth view of the phenomena
being investigated which is mainly found in qualitative research. Hence, using this

Chapter 8: Conclusion and Further Research
Ali Tarhini 260
method only is justified due to time and resources taking into consideration that
the research aim and objectives have been achieved.
Finally, contrary to previous empirical studies in IS, the relationship between
QWL and behavioural intention to use the technology did not mediate
masculinity/femininity cultural value. Although masculinity/femininity is not
referred to gender as defined by biological sex (male versus female), we recognize
some of the answers are based on the biological sex and not on the work or study
environment. Further study of the relationship between gender and
masculinity/femininity is needed to check if those two variables are related to
each other’s.
8.5 Future research directions
This is the first study to focus on the examination of the potential factors that
affect the adoption and usage of e-learning in Lebanon and England respectively,
especially the factors related to the individual-level cultural dimensions.
Therefore, there are a number of suggestions for future research arising from this
work, especially that the explanatory power of the Lebanese model is lower than
the UK’s one. In other words, there are other factors that should be considered in
explaining web-based learning behaviour in non-western countries. Therefore this
study is only a beginning and suggests for several research directions.
First, although it was not possible to use triangulation method (both survey and
interviews) due to time and resources constraints, the questionnaire findings
would have been strengthened if it were supported by direct observation and
interviews with the participants in an effort to produce more reliable data. A
triangulation method would provide the researcher with an in-depth understanding
about the students’ opinions regarding the web-based learning systems and why
they use or not use these tools. In other words, if adaptation of e-learning system
is required, would the student choose to compromise their learning pedagogy or
simply give up using e-learning technology?

Chapter 8: Conclusion and Further Research
Ali Tarhini 261
Second, since user’s behaviour may differ depending on culture, social,
situational, beliefs and technology acceptance level and since the findings of our
study are context-specific (Lebanon and the UK), it would be more typical to
investigate if our developed model may hold for different nationalities and
different geographical countries, like other Arab or Asian countries. This will be
valuable in assessing the robustness and the validity of the research model across
different cultural settings. Therefore, future research could replicate our study
among mono-and-multi-cultural samples.
Third, our study has investigated the impact of moderating factors in a mandatory
environment within one context. Future research should explore the impact of
moderating factors in voluntary environment as it was found that this variable has
a big influence on students’ perception towards using technology (Venkatesh et
al., 2003), or with different user groups (e.g., students with disability, children)
and/or different organizational contexts (e.g., High schools or public institutions)
to explore their validity in different contexts.
Fourth, the current work is only limited to web-based learning systems (such as
Moodle and Blackboard). Therefore, future research may replicate the study using
different e-learning tools or platforms (e.g. mobile learning, IPAD and digital TV)
with a different pedagogical perceptive to find out how the results might differ
from the current research. Furthermore, different technologies other than e-
learning could be investigated, such as online banking, e-commerce, and
telecommunication in order to generalise and prove the usefulness of the research
model and to establish external validity of the model. Additionally, another area
of possible research could be to investigate how cultural characteristics could be
translated into e-learning interface guidelines. Such research helps the future
developers of web-based learning systems in targeting various cultures.
Fifth, future research may extend our study to integrate other potential constructs
of interest to the education community and technology itself such as learning
skills, perceived enjoyment, accessibility, flexibility, and system reliability and
design characteristics, privacy and security of assessments in web-based

Chapter 8: Conclusion and Further Research
Ali Tarhini 262
educational technologies at higher educational institutions. In addition, further
research could consider whether individual-level cultural variables also have a
direct effect within the current research model or other competing models such as
TRA and TPB.
Finally, the subjective norms construct that are included in this research combines
the influence of both instructors and colleagues. Previous researchers have
suggested that the different norm groups should be split and studied separately
e.g. (Srite and Karahanna, 2006). While we note that in this study we are able to
demonstrate significant interactions with cultural values and subjective norms
without separating the different referent groups, future work could usefully
examine the relative importance of these groups for the different cultural effects
observed.
This research highlights the importance of each individual characteristic and
cultural dimension, where one individual characteristic may override the others in
web-based learning environments. Hence, future research is welcomed to examine
the interaction between combinations of different dimensions to determine their
relative importance in web-based learning environments. For example, research
studies could be conducted to investigate the interaction effects between
masculinity\femininity cultural variable and gender on student learning in web-
based learning system by dividing participants into four groups (Masculinity and
Female; Masculinity and Male; Femininity and Female, Femininity and Male).
8.6 Personal Reflection
The journey throughout my PhD is one of the most interesting and enjoyable
experience in my whole life. I feel like research has become part of my life now,
and I have been fortunate to be surrounded by inspirational researchers who are
willing to help me grow in many areas. More importantly, this experience has not
only taught me how to be a good researcher, but also changed the way I see life as
many of the skills are transferable to my personal life.

Appendix A
263
References
Aaker, D. A., Kumar, V., Day, G. S. & Leone, R. (2009) Marketing Research.
John Wiley & Sons.
Abbad, M. M., Morris, D. & De Nahlik, C. (2009). Looking under the bonnet:
Factors affecting student adoption of e-learning systems in Jordan. The
International Review of Research in Open and Distance Learning 10.
Abu-Shanab, E. & Pearson, J. (2009). Internet banking in Jordan: an Arabic
instrument validation process. Int. Arab J. Inf. Technol. 6, 235-244.
Abu-Shanab, E. A. (2011) Education level as a technology adoption moderator.
Computer Research and Development (ICCRD), 2011 3rd International
Conference on. (pp. 324-328).
Adams, D. A., Nelson, R. R. & Todd, P. A. (1992). Perceived usefulness, ease of
use, and usage of information technology: a replication. MIS quarterly,
227-247.
Agarwal, R. & Karahanna, E. (2000). Time flies when you're having fun:
cognitive absorption and beliefs about information technology usage 1.
MIS quarterly 24, 665-694.
Agarwal, R. & Prasad, J. (1998). A conceptual and operational definition of
personal innovativeness in the domain of information technology.
Information systems research 9, 204-215.
Agarwal, R. & Prasad, J. (1999). Are individual differences germane to the
acceptance of new information technologies? Decision Sciences 30, 361-
391.
Ajjan, H. & Hartshorne, R. (2008). Investigating faculty decisions to adopt Web
2.0 technologies: Theory and empirical tests. The Internet and Higher
Education 11, 71-80.
Ajzen, I. (1985) From intentions to actions: A theory of planned behavior.
Springer.
Ajzen, I. (1988) Attitudes, personality, and behavior. Dorsey Press (Chicago, IL).
Ajzen, I. (1991). The theory of planned behavior. Organizational Behavior and
Human Decision Processes 50, 179-211.
Ajzen, I. (2005) Attitudes, personality, and behavior. McGraw-Hill International.
Ajzen, I. & Fishbein, M. (1980) Understanding attitudes and predicting social
behavior (278). Prentice-Hall.
Akhter, S. H. (2003). Digital divide and purchase intention: Why demographic
psychology matters. Journal of Economic Psychology 24, 321-327.
Al-Gahtani, S. S. (2008). Testing for the applicability of the TAM model in the
Arabic context: exploring an extended TAM with three moderating
factors. Information Resources Management Journal (IRMJ) 21, 1-26.
Al-Jabri, I. M. & Al-Khaldi, M. A. (1997). Effects of user characteristics on
computer attitudes among undergraduate business students. Journal of
Organizational and End User Computing (JOEUC) 9, 16-23.

Appendix A
264
Amoako-Gyampah, K. (2007). Perceived usefulness, user involvement and
behavioral intention: an empirical study of ERP implementation.
Computers in Human Behavior 23, 1232-1248.
Arbaugh, J. & Duray, R. (2002). Technological and structural characteristics,
student learning and satisfaction with web-based courses An exploratory
study of two on-line MBA programs. Management Learning 33, 331-347.
Arbuckle, J. (2009) Amos 18 User's Guide. SPSS Incorporated.
Arenas-Gaitán, J., Ramírez-Correa, P. E. & Javier Rondán-Cataluña, F. (2011).
Cross cultural analysis of the use and perceptions of web Based learning
systems. Computers & Education 57, 1762-1774.
Armitage, C. J. & Conner, M. (2001). Efficacy of the theory of planned
behaviour: A meta‐analytic review. British journal of social psychology
40, 471-499.
Bagozzi, R. P. (1981). An examination of the validity of two models of attitude.
Multivariate Behavioral Research 16, 323-359.
Bagozzi, R. P. (1984). Expectancy-value attitude models an analysis of critical
measurement issues. International Journal of Research in Marketing 1,
295-310.
Bagozzi, R. P. (2007). The Legacy of the Technology Acceptance Model and a
Proposal for a Paradigm Shift. Journal of the Association for Information
Systems 8, 3.
Bandura, A. (1986) Social foundations of thought and action: A social cognitive
theory. Prentice-Hall, Inc.
Bandura, A. (1995) Self-efficacy in changing societies. Cambridge University
Press.
Bandura, A. (1997) Self-Efficacy: The Exercise of Control (604). New York:
W.H. Freeman.
Bandura, A. & McClelland, D. C. (1977). Social learning theory.
Bandura, A. (2006). On integrating social cognitive and social diffusion theories.
Communication of innovations: A journey with Ev Rogers, 111-135.
Barki, H. & Hartwick, J. (1994). Measuring user participation, user involvement,
and user attitude. MIS quarterly, 59-82.
Baroud, F. & Abouchedid, k. (2010) eLEARNING IN LEBANON: Patterns of E-
learning Development in Lebanon’s Mosaic Educational Context. In
Demiray, U. (Editor) e-learning practices: cases on challenges facing e-
learning and national development, institutional studies and practices (pp.
409-424). Eskisehir-Turkey, Anadolu University.
Bem, S. L. (1981). The BSRI and gender schema theory: A reply to Spence and
Helmreich.
Benbasat, I. & Barki, H. (2007). Quo vadis, TAM. Journal of the Association for
Information Systems 8, 211-218.
Benbasat, I. & Weber, R. (1996). Research commentary: Rethinking “diversity” in
information systems research. Information systems research 7, 389-399.
Benbunan-Fich, R., Hiltz, S. R. & Harasim, L. (2005). The online interaction
learning model: An integrated theoretical framework for learning
networks. Learning together online: Research on asynchronous learning
networks, 19-37.

Appendix A
265
Berger, I. (1993). A framework for understanding the relationship between
environmental attitudes and consumer behavior. Marketing theory and
application 4, 157-163.
Bhattacherjee, A. (2000). Acceptance of e-commerce services: the case of
electronic brokerages. Systems, Man and Cybernetics, Part A: Systems and
Humans, IEEE Transactions on 30, 411-420.
Blaikie, N. (2000). Designing social research: the logic of anticipation. Recherche
67, 02.
Blumberg, B., Cooper, D. R. & Schindler, P. S. (2008) Business Research
Methods. McGraw-Hill Higher Education.
Blunch, N. J. (2008) Introduction to structural equation modelling using SPSS
and AMOS. SAGE.
Blackboard Inc. (2012) Accelerate with Blackboard Learn. [online document]
[Accessed 10.09.2013] Available at:
http://blackboard.com/Platforms/Learn/Products/Blackboard-Learn.aspx
Bollen, K. A. (1989) Structural equations with latent variables. MA: Wiley.
Bouhnik, D. & Marcus, T. (2006). Interaction in distance‐learning courses.
Journal of the American Society for Information Science and Technology
57, 299-305.
Bryman, A. (2008) Social Research Methods. Oxford University Press.
Bryman, A. & Bell, E. (2011) Business research methods. Cambridge; New York,
NY: Oxford University Press.
Burton-Jones, A. & Hubona, G. S. (2006). The mediation of external variables in
the technology acceptance model. Information & Management 43, 706-
717.
Byrne, B. M. (2006) Structural Equation Modeling With Amos: Basic Concepts,
Applications, and Programming. Taylor & Francis Group.
Calisir, F., Gumussoy, A.C. & Bayram, A (2009). Predicting the behavioral
intention to use enterprise resource planning systems: An exploratory
extension of the technology acceptance model. Management Research
News 32, 597 - 613.
Callan, V. J., Bowman, K. & Framework, A. F. L. (2010). Sustaining e-learning
innovations: a review of the evidence and future directions: final report,
November 2010.
Carmines, E. G. & McIver, J. P. (1981). Analyzing models with unobserved
variables: Analysis of covariance structures. Social measurement: Current
issues, 65-115.
Carter, L. & Weerakkody, V. (2008). E-government adoption: A cultural
comparison. Information Systems Frontiers 10, 473-482.
Cascio, W. F. & McEvoy, G. (2003) Managing human resources: Productivity,
quality of work life, profits. McGraw-Hill.
Chaffin, A. J. & Harlow, S. D. (2005). Cognitive learning applied to older adult
learners and technology. Educational Gerontology 31, 301-329.
Chan, S.-c. & Lu, M.-t. (2004). Understanding Internet banking adoption and use
behavior: a Hong Kong perspective. Journal of Global Information
Management (JGIM) 12, 21-43.

Appendix A
266
Chang, I., Hwang, H.-G., Hung, W.-F. & Li, Y.-C. (2007). Physicians’ acceptance
of pharmacokinetics-based clinical decision support systems. Expert
Systems with Applications 33, 296-303.
Chang, S. C. & Tung, F. C. (2008). An empirical investigation of students'
behavioural intentions to use the online learning course websites. British
Journal of Educational Technology 39, 71-83.
Chatzoglou, P. D., Sarigiannidis, L., Vraimaki, E. & Diamantidis, A. (2009).
Investigating Greek employees’ intention to use web-based training.
Computers & Education 53, 877-889.
Chau, P. Y. & Hu, P. J. H. (2001). Information Technology Acceptance by
Individual Professionals: A Model Comparison Approach*. Decision
Sciences 32, 699-719.
Chau, P. Y. K. & Hu, P. J. (2002). Examining a model of information technology
acceptance by individual professionals: An exploratory study. Journal of
management information systems 18, 191-230.
Chen, L.-d., Gillenson, M. L. & Sherrell, D. L. (2002). Enticing online
consumers: an extended technology acceptance perspective. Information &
Management 39, 705-719.
Chen, W. S. & Hirschheim, R. (2004). A paradigmatic and methodological
examination of information systems research from 1991 to 2001.
Information Systems Journal 14, 197-235.
Chesney, T. (2006). An acceptance model for useful and fun information systems.
Chin, W. W., Marcolin, B. L. & Newsted, P. R. (2003). A partial least squares
latent variable modeling approach for measuring interaction effects:
Results from a Monte Carlo simulation study and an electronic-mail
emotion/adoption study. Information systems research 14, 189-217.
Chin, W. W. & Todd, P. A. (1995). On the use, usefulness, and ease of use of
structural equation modeling in MIS research: a note of caution. MIS
quarterly, 237-246.
Choi, B. & Han, G. (2009). Psychology of selfhood in china: Where is the
collective ? Culture & Psychology 15, 73-82.
Choudrie, J. & Dwivedi, Y., K. (2005). Investigating the Research Approaches for
Examining Technology Adoption Issues. Journal of Research Practice 1.
Christie, M. F. & Ferdos, F. (2004). The mutual impact of educational and
information technologies: Building a pedagogy of e-learning. Journal of
Information Technology Impact 4, 15-26.
Chung, J. E., Park, N., Wang, H., Fulk, J. & McLaughlin, M. (2010). Age
differences in perceptions of online community participation among non-
users: An extension of the Technology Acceptance Model. Computers in
Human Behavior 26, 1674-1684.
Cohen, W. M. & Levinthal, D. A. (1990). Absorptive capacity: a new perspective
on learning and innovation. Administrative science quarterly, 128-152.
Compeau, D., Higgins, C. A., Huff, S., Redesign, B. P., Broadbent, M., Weill, P.,
Clair, D. S., Karahanna, E., Straub, D. W. & Chervany, N. L. (1999).
Social Cognitive Theory and Individual Reactions to Computing
Technology: A Longitudinal Study.
Compeau, D. R. & Higgins, C. A. (1991) A social cognitive theory perspective on
individual reactions to computing technology. Proceedings of the twelfth

Appendix A
267
international conference on Information systems. (pp. 187-198).
University of Minnesota.
Compeau, D. R. & Higgins, C. A. (1995). Computer self-efficacy: Development
of a measure and initial test. MIS quarterly, 189-211.
Comrey, A. L. & Lee, H. B. (1992) A First Course in Factor Analysis. L. Erlbaum
Associates.
Conner, M. & Armitage, C. J. (1998). Extending the theory of planned behavior:
A review and avenues for further research. Journal of Applied Social
Psychology 28, 1429-1464.
Cooper, J. & Weaver, K. D. (2003) Gender and computers: Understanding the
digital divide. Lawrence Erlbaum.
Creswell, J. W. (2008) Research design : qualitative, quantitative, and mixed
methods approaches. Los Angeles: Sage.
Cronbach, L. J. (1951). Coefficient alpha and the internal structure of tests.
Psychometrika 16, 297-334.
Crotty, M. (1998) The Foundations of Social Research: Meaning and Perspective
in the Research Process. Sage Publications.
Csikszentmihalyi, M. (2000) The contribution of flow to positive psychology:
scientific essays in honour of Martin EP Seligman. The Science of
Optimism and Hope. Philadelphia, PA: Templeton Foundation Press.
Czaja, S. J., Charness, N., Fisk, A. D., Hertzog, C., Nair, S. N., Rogers, W. A. &
Sharit, J. (2006). Factors predicting the use of technology: findings from
the Center for Research and Education on Aging and Technology
Enhancement (CREATE). Psychology and aging 21, 333.
David, M. & Sutton, C. D. (2004) Social research: The basics. Sage Publications
Ltd.
Davis, F. D. (1989). Perceived usefulness, perceived ease of use, and user
acceptance of information technology. MIS quarterly, 319-340.
Davis, F. D. (1993). User acceptance of information technology: system
characteristics, user perceptions and behavioral impacts.
Davis, F. D., Bagozzi, R. P. & Warshaw, P. R. (1989). User acceptance of
computer technology: a comparison of two theoretical models.
Management science, 982-1003.
Denzin, N. K. & Lincoln, Y. S. (2005) The Sage handbook of qualitative
research. Sage Publications, Inc.
DeVellis, R. F. (2003) Scale development: theory and applications. Newbury
Park: CA: Sage.
Dinev, T., Goo, J., Hu, Q. & Nam, K. (2009). User behaviour towards protective
information technologies: the role of national cultural differences.
Information Systems Journal 19, 391-412.
Dishaw, M. T. & Strong, D. M. (1999). Extending the technology acceptance
model with task–technology fit constructs. Information & Management 36,
9-21.
Dorfman, P. W. & Howell, J. (1988). Dimension of national culture and effective
leadership patterns: Hofstede revisited. Advances in International
Comparative Management 3, 127-150.

Appendix A
268
Douglas, S. P. & Craig, C. S. (2006). On improving the conceptual foundations of
international marketing research. Journal of International Marketing, 1-
22.
Downey, J. (2006) Measuring general computer self-efficacy: The surprising
comparison of three instruments in predicting performance, attitudes, and
usage. System Sciences, 2006. HICSS'06. Proceedings of the 39th Annual
Hawaii International Conference on. (pp. 210a-210a). IEEE.
Eagly, A. H. & Chaiken, S. (1993) The psychology of attitudes. Harcourt Brace
Jovanovich College Publishers.
Eckhardt, G. M. & Houston, M. J. (2002). Cultural paradoxes reflected in brand
meaning: McDonald's in Shanghai, China. Journal of International
Marketing, 68-82.
Elenurm, T. (2008). Applying cross-cultural student teams for supporting
international networking of Estonian enterprises. Baltic Journal of
Management 3, 145-158.
Elliott, M. A., Armitage, C. J. & Baughan, C. J. (2003). Drivers' compliance with
speed limits: an application of the theory of planned behavior. Journal of
Applied Psychology 88, 964.
Evanschitzky, H. & Wunderlich, M. (2006). An examination of moderator effects
in the four-stage loyalty model. Journal of Service Research 8, 330-345.
Falconer, D. (2008). A demographic and content survey of critical research in
information systems for the period 2001–2005. Communications of the
Association for Information Systems 22, 30.
Fishbein, M. & Ajzen, I. (1975) Belief, attitude, intention and behavior: An
introduction to theory and research.
Fletcher, K. M. (2005). Self-efficacy as an evaluation measure for programs in
support of online learning literacies for undergraduates. The Internet and
Higher Education 8, 307-322.
Ford, D. P., Connelly, C. E. & Meister, D. B. (2003). Information systems
research and Hofstede's culture's consequences: an uneasy and incomplete
partnership. Engineering Management, IEEE Transactions on 50, 8-25.
Fornell, C. & Larcker, D. F. (1981). Structural equation models with unobservable
variables and measurement error: Algebra and statistics. Journal of
marketing research, 382-388.
Fowler, F. J. (2009) Survey Research Methods. Sage Publications.
Foxall, G. R. (1997) Marketing psychology: The paradigm in the wings. Palgrave
Macmillan.
Freire, L. L., Arezes, P. M. & Campos, J. C. (2012). A literature review about
usability evaluation methods for e-learning platforms. Work: A Journal of
Prevention, Assessment and Rehabilitation 41, 1038-1044.
Fu, J.-R., Farn, C.-K. & Chao, W.-P. (2006). Acceptance of electronic tax filing:
A study of taxpayer intentions. Information & Management 43, 109-126.
Galliers, R. (1992). Choosing Appropriate Information Systems Research
Approaches: A Revised Taxonomy.
Garfield, M. J. & Watson, R. T. (1997). Differences in national information
infrastructures: the reflection of national cultures. The Journal of Strategic
Information Systems 6, 313-337.

Appendix A
269
Garrison, D. R. (2011) E-learning in the 21st century: A framework for research
and practice. Taylor & Francis.
Gefen, D. & Straub, D. W. (1997). Gender differences in the perception and use
of e-mail: An extension to the technology acceptance model. MIS
quarterly, 389-400.
Gefen, D. & Straub, D. W. (2000). The Relative Importance of Perceived Ease of
Use in IS Adoption: A Study of E-Commerce Adoption. J. AIS 1, 0-.
Gefen, D., Straub, D. W. & Boudreau, M. C. (2000). Structural equation modeling
and regression: Guidelines for research practice.
Ghauri, P. N. & Grønhaug, K. (2005) Research methods in business studies: a
practical guide. Prentice Hall.
Govindasamy, T. (2002). Successful implementation of e-Learning Pedagogical
considerations. Internet and Higher Education 4, 287-299.
Grandon, E. E., Alshare, K. & Kwun, O. (2005). Factors influencing student
intention to adopt online classes: a cross-cultural study. Journal of
Computing Sciences in Colleges 20, 46-56.
Groves, R. M., Fowler, F. J., Couper, M. P., Lepkowski, J. M. & Singer, E. (2009)
Survey methodology. John Wiley & Sons Inc.
Guba, E. G. & Lincoln, Y. S. (1994). Competing paradigms in qualitative
research. Handbook of qualitative research 2, 163-194.
Guo, Y. & Barnes, S. (2007). Why people buy virtual items in virtual worlds with
real money. ACM SIGMIS Database 38, 69-76.
Hair, J. F. J., Black, W. C., Babin, B. J., Anderson, R. E. & Tatham, R. L. (2010)
Multivariate data analysis. New Jersey: Prentice-Hall.
Hair, J., Black W. C., Babin B. J., Anderson R. E. & Tatham R. L. (2006)
Multivariate Data Analysis. Upper Saddle River, New Jersey: Pearson
Prentice Hall, Pearson Education, Inc. .
Hall, B. & Howard, K. (2008). A Synergistic Approach: Conducting Mixed
Methods Research With Typological and Systemic Design Considerations.
Journal of mixed methods research 2, 248-269.
Hall, E. T. (1973). The silent language.
Hannon, J. & D'Netto, B. (2007). Cultural diversity online: student engagement
with learning technologies. International Journal of Educational
Management 21, 418-432.
Han, S. (2003) Individual adoption of information systems in organizations: A
literature review of technology acceptance model, TUCS.
Harris, R. W. (1997). Teaching, learning and information technology: Attitudes
towards computers among Hong Kong’s faculty. Journal of computing in
higher education 9, 89-114.
He, J. & Freeman, L. A. (2010). Are men more technology-oriented than women?
The role of gender on the development of general computer self-efficacy
of college students. Journal of Information Systems Education 21, 203.
Hernandez, B., Jimenez, J. & Jose Martin, M. (2009). The impact of self-efficacy,
ease of use and usefulness on e-purchasing: an analysis of experienced e-
shoppers. Interacting with Computers 21, 146-156.
Hesse-Biber, S. N. & Leavy, P. (2010) The Practice of Qualitative Research
(400). Sage Publications.

Appendix A
270
Ho, C.-L. & Dzeng, R.-J. (2010). Construction safety training via e-Learning:
Learning effectiveness and user satisfaction. Computers & Education 55,
858-867.
Hoecklin, L. A., Unit, E. I. & Britain, G. (1995) Managing cultural differences:
Strategies for competitive advantage. Addison-Wesley Wokingham,,
England.
Hoffmann, L. W. (1980). Early childhood experiences and women's achievement
motives. Communication Research & Broadcasting.
Hofstede, G. (1980) Culture’s consequences: comparing values, behaviours,
institutions and organisations across nations. Thousand Oaks, CA: Sage
Publications.
Hofstede, G. (1991) Cultures and Organizations: Software of the Mind:
Intercultural Cooperation and its Importance for Survival. McGraw-Hill
International.
Hofstede, G. (1993). Cultural constraints in management theories. The Academy
of Management Executive 7, 81-94.
Hofstede, G. (2002). The Pitfalls of Cross-National Survey Research: A Reply to
the Article by Spector et al. on the Psychometric Properties of the
Hofstede Values Survey Module 1994. Applied psychology 51, 170-173.
Hofstede, G. & Bond, M. H. (1988). The Confucius connection: From cultural
roots to economic growth. Organizational dynamics 16, 4-21.
Hofstede, G. & Hofstede, J. (2005) Cultures and Organizations: Software of the
Mind. McGraw-Hill.
Hofstede, G. & Peterson, M. F. (2000). National values and organizational
practices. Handbook of organizational culture. and climate, 401-414.
Hofstede, G. H. (1984) Culture's consequences: International differences in work-
related values. Sage Publications, Inc.
Hoft, N. L. (1996) Developing a cultural model. International users interface. (pp.
41-73). John Wiley \& Sons, Inc.
Holmes-Smith, P. (2011). Structural Equation Modelling (Using Amos): From the
Fundamentals to Advanced Topics. Melbourne: SREAMS.
Holmes, B. & Gardner, J. (2006) E-learning: Concepts and practice. Sage.
Horton, W. (2011) E-learning by design. Wiley. com.
Hsu, M.-H. & Chiu, C.-M. (2004). Predicting electronic service continuance with
a decomposed theory of planned behaviour. Behaviour & Information
Technology 23, 359-373.
Hu, H., Al-Gahtani, S. S. & Hu, P. J. H. (2010). Examining Gender Effects in
Technology Acceptance by Arabian Workers: A Survey Study.
Hu, L. & Bentler, P. M. (1999). Cutoff criteria for fit indexes in covariance
structure analysis: Conventional criteria versus new alternatives.
Structural Equation Modeling: A Multidisciplinary Journal 6, 1-55.
Huang, W.-H. D., Hood, D. W. & Yoo, S. J. (2012). Gender divide and
acceptance of collaborative Web 2.0 applications for learning in higher
education. The Internet and Higher Education.
Hwang, Y. (2005). Investigating enterprise systems adoption: uncertainty
avoidance, intrinsic motivation, and the technology acceptance model.
Eur. J. Inf. Syst. 14, 150-161.

Appendix A
271
Igbaria, M., Parasuraman, S. & Baroudi, J. J. (1996). A motivational model of
microcomputer usage. Journal of management information systems 13,
127-143.
Igbaria, M., Zinatelli, N., Cragg, P. & Cavaye, A. L. (1997). Personal computing
acceptance factors in small firms: a structural equation model. MIS
quarterly, 279-305.
Iskander, M. (2008) Innovative techniques in instruction technology, E-learning,
E-assessment and education. Springer.
Jackson, S. & Scott, S. (2001). Putting the body's feet on the ground: Towards a
sociological reconceptualization of gendered and sexual embodiment.
EXPLORATIONS IN SOCIOLOGY 59, 9-24.
Janssens, W., de Pelsmacker, P., Wijnen, K. & Van Kenhove, P. (2008)
Marketing research with SPSS. Prentice Hall.
Johns, S. K., Murphy Smith, L. & Strand, C. A. (2003) How culture affects the
use of information technology. (pp. 84-109). Wiley Online Library.
Johnson, B. & Christensen, L. B. (2010) Educational Research: Quantitative,
Qualitative, and Mixed Approaches (p.34). Thousand Oaks: Sage
Publications.
Jones, G. H. & Jones, B. H. (2005). A comparison of teacher and student attitudes
concerning use and effectiveness of web-based course management
software. Educational Technology & Society 8, 125-135.
Jones, S., Fox, S., Internet, P. & Project, A. L. (2009) Generations online in 2009.
Pew Internet & American Life Project Washington, DC.
Jung, Y., Peng, W., Moran, M., Jin, S. A. A., McLaughlin, M., Cody, M., Jordan-
Marsh, M., Albright, J. & Silverstein, M. (2010). Low-income minority
seniors' enrollment in a cybercafé: Psychological barriers to crossing the
digital divide. Educational Gerontology 36, 193-212.
Kagitcibasi, C. (1997). Individualism and collectivism.
Kaplan, B. & Maxwell, J. (2005). Qualitative research methods for evaluating
computer information systems. Evaluating the Organizational Impact of
Healthcare Information Systems, 30-55.
Karahanna, E., Straub, D. W. & Chervany, N. L. (1999). Information technology
adoption across time: a cross-sectional comparison of pre-adoption and
post-adoption beliefs. MIS quarterly, 183-213.
Keller, C., Hrastinski, S. & Carlsson, S. A. (2007). Students' Acceptanc of E-
learning Environments: A Comparative Study in Sweden and Lithuania.
International Business, 395-406.
Kijsanayotin, B., Pannarunothai, S. & Speedie, S. M. (2009). Factors influencing
health information technology adoption in Thailand's community health
centers: Applying the UTAUT model. International journal of medical
informatics 78, 404-416.
Kim, D. J. (2008). Self-perception-based versus transference-based trust
determinants in computer-mediated transactions: A cross-cultural
comparison study. Journal of management information systems 24, 13-45.
Kim, K. & Moore, J. (2005). Web-based learning: Factors affecting student'
satisfaction and learning experience. First Monday 10.
King, W. R. & He, J. (2006). A meta-analysis of the technology acceptance
model. Information & Management 43, 740-755.

Appendix A
272
Kline, R. B. (2005) Principles And Practice Of Structural Equation Modeling.
Guilford Press.
Kline, R. B. (2010) Principles and practice of structural equation modeling. The
Guilford Press.
Koufaris, M. (2002). Applying the technology acceptance model and flow theory
to online consumer behavior. Information systems research 13, 205-223.
Krathwohl, D. R. (2004) Methods of Educational and Social Science Research:
An Integrated Approach. Waveland Press.
Kripanont, N. (2007) Examining a technology acceptance model of Internet usage
by academics within Thai business schools. Victoria University
Melbourne, Australia.
Kvasny, L. & Richardson, H. (2006). Critical research in information systems:
looking forward, looking back. Information Technology & People 19, 196-
202.
Landry, B. J. L., Griffeth, R. & Hartman, S. (2006). Measuring student
perceptions of blackboard using the technology acceptance model.
Decision Sciences Journal of Innovative Education 4, 87-99.
Lanseng, E. J. & Andreassen, T. W. (2007). Electronic healthcare: a study of
people's readiness and attitude toward performing self-diagnosis.
International Journal of Service Industry Management 18, 394-417.
Last, J. & Abramson, J. (2001) International epidemiological association. A
dictionary of epidemiology. New York: Oxford University Press.
Lederer, A. L., Maupin, D. J., Sena, M. P. & Zhuang, Y. (2000). The technology
acceptance model and the World Wide Web. Decision Support Systems 29,
269-282.
Lee, I., Choi, B., Kim, J. & Hong, S. J. (2007). Culture-technology fit: Effects of
cultural characteristics on the post-adoption beliefs of mobile Internet
users. International Journal of Electronic Commerce 11, 11-51.
Lewis, W., Agarwal, R. & Sambamurthy, V. (2003). Sources of influence on
beliefs about information technology use: An empirical study of
knowledge workers. MIS quarterly, 657-678.
Li, N. & Kirkup, G. (2007). Gender and cultural differences in Internet use: A
study of China and the UK. Computers & Education 48, 301-317.
Li, X., Hess, T. J., McNab, A. L. & Yu, Y. (2009). Culture and acceptance of
global web sites: a cross-country study of the effects of national cultural
values on acceptance of a personal web portal. ACM SIGMIS Database 40,
49-74.
Liaw, S.-S. (2008). Investigating students’ perceived satisfaction, behavioral
intention, and effectiveness of e-learning: A case study of the Blackboard
system. Computers & Education 51, 864-873.
Liaw, S. & Huang, H. (2011). A study of investigating learners attitudes toward e-
learning.
Lichtman, M. (2006) Qualitative Research in Education: A User's Guide (pp. 7-
8). Thousand Oaks: Sage Publications.
Light, R. J., Singer, J. D. & Willett, J. B. (1990) By Design: Planning Research
on Higher Education. Harvard University Press.
Likert, R. (1932). A technique for the measurement of attitudes. Archives of
psychology 22, 1-55.

Appendix A
273
Limayem, M. & Hirt, S. G. (2000) Internet-based teaching: how to encourage
university students to adopt advanced Internet-based technologies? ,
System Sciences, 2000. Proceedings of the 33rd Annual Hawaii
International Conference on. (pp. 9 pp.). IEEE.
Lin, H.-F. (2006). Understanding behavioral intention to participate in virtual
communities. CyberPsychology & Behavior 9, 540-547.
Lincoln, Y. S., Lynham, S. A. & Guba, E. G. (2011). Paradigmatic controversies,
contradictions, and emerging confluences, revisited. The Sage handbook of
qualitative research, 97-128.
Liu, I. F., Chen, M. C., Sun, Y. S., Wible, D. & Kuo, C. H. (2010). Extending the
TAM model to explore the factors that affect Intention to Use an Online
Learning Community. Computers & Education 54, 600-610.
Liu, S. H., Liao, H. L. & Peng, C. J. (2005). Applying the Technology Acceptance
Model And Flow Theory to Online E-learning Users' Acectpance
Behavior. E-learning 4, H8.
Lymperopoulos, C. & Chaniotakis, I. E. (2005). Factors affecting acceptance of
the Internet as a marketing-intelligence tool among employees of Greek
bank branches. International Journal of Bank Marketing 23, 484-505.
Lynott, P. P. & McCandless, N. J. (2000). The impact of age vs. life experience
on the gender role attitudes of women in different cohorts. Journal of
Women & Aging 12, 5-21.
Mahmood, M. A., Hall, L. & Swanberg, D. L. (2001). Factors affecting
information technology usage: A meta-analysis of the empirical literature.
Journal of Organizational Computing and Electronic Commerce 11, 107-
130.
Maldonado, U. P. T., Khan, G. F., Moon, J. & Rho, J. J. (2009) E-learning
motivation, students' acceptance/use of educational portal in developing
countries: a case study of Peru. Computer Sciences and Convergence
Information Technology, 2009. ICCIT'09. Fourth International
Conference on. (pp. 1431-1441). IEEE.
Mandell, S. L. (1987) Computers and information processing: concepts and
applications with BASIC. West Pub. Co.
Manfreda, K. L., Batagelj, Z. & Vehovar, V. (2002). Design of web survey
questionnaires: Three basic experiments. Journal of Computer‐Mediated
Communication 7, 0-0.
Marakas, G. M., Mun, Y. Y. & Johnson, R. D. (1998). The multilevel and
multifaceted character of computer self-efficacy: Toward clarification of
the construct and an integrative framework for research. Information
systems research 9, 126-163.
Marcus, A. & Gould, E. W. (2000). Crosscurrents: cultural dimensions and global
Web user-interface design. interactions 7, 32-46.
Martinez-Torres, M., Marin, S. L. T., Garcia, F. B., Vazquez, S. G., Oliva, M. A.
& Torres, T. (2008). A technological acceptance of e-learning tools used
in practical and laboratory teaching, according to the European higher
education area 1. Behaviour & Information Technology 27, 495-505.
Mathieson, K. (1991). Predicting user intentions: comparing the technology
acceptance model with the theory of planned behavior. Information
systems research 2, 173-191.

Appendix A
274
McCarthy, R. (2006). MEASURING STUDENTS PERCEPTIONS OF
BLACKBOARD USING THE TECHNOLOGY ACCEPTANCE
MODEL: A PLS APPROACH. E-learning 26, 18.
McCombs, B. (2011). Learner-centered practices: Providing the context for
positive learner development, motivation, and achievement (Chapter 7).
Handbook of research on schools, schooling, and human development.
Mahwah, NJ: Erlbaum.
McCoy, S. (2002). The effect of national culture dimensions on the acceptance of
information technology: A trait based approach. Unpublished doctoral
dissertation, University of Pittsburgh, Pittsburgh, PA. Diffusion of E-
Medicine 259.
McCoy, S. (2003). Integrating national culture into individual IS adoption
research: The need for individual level measures.
McCoy, S., Everard, A. & Jones, B. (2005a). An examination of the technology
acceptance model in Uruguay and the U.S.: a focus on culture. Journal of
Global Information Technology 8, 27-45.
McCoy, S., Galletta, D. F. & King, W. R. (2005b). Integrating national culture
into IS research: the need for current individual level measures.
Communications of the Association for Information Systems 15, 12.
McCoy, S., Galletta, D. F. & King, W. R. (2007). Applying TAM across cultures:
the need for caution. European Journal of Information Systems 16, 81-90.
McNeil, S. G., Robin, B. R. & Miller, R. M. (2000). Facilitating interaction,
communication and collaboration in online courses. Computers &
Geosciences 26, 699-708.
Min, Q., Li, Y. & Ji, S. (2009) The Effects of Individual-Level Culture on Mobile
Commerce Adoption: An Empirical Study. (pp. 305-312). IEEE.
Mingers, J. (2003). A classification of the philosophical assumptions of
management science methods. Journal of the Operational Research
Society, 559-570.
Minton, H. L., Schneider, F. W. & Wrightsman, L. S. (1980) Differential
psychology. Brooks/Cole Publishing Company.
Moon, J.-W. & Kim, Y.-G. (2001). Extending the TAM for a World-Wide-Web
context. Information & Management 38, 217-230.
Moore, G. C. & Benbasat, I. (1991). Development of an instrument to measure the
perceptions of adopting an information technology innovation.
Information systems research 2, 192-222.
Morris, M. G. & Venkatesh, V. (2000). Age differences in technology adoption
decisions: Implications for a changing work force. Personnel psychology
53, 375-403.
Morris, M. G., Venkatesh, V. & Ackerman, P. L. (2005). Gender and age
differences in employee decisions about new technology: An extension to
the theory of planned behavior. Engineering Management, IEEE
Transactions on 52, 69-84.
Mumford, M. D. & Licuanan, B. (2004). Leading for innovation: Conclusions,
issues, and directions. The leadership quarterly 15, 163-171.
Myers, M. D. & Avison, D. (1997). Qualitative research in information systems.
Management Information Systems Quarterly 21, 241-242.

Appendix A
275
Nachmias, C. & Nachmias, D. (2008) Research Methods in the Social Sciences.
WORTH PUBL Incorporated.
Nakata, C. (2009) Beyond Hofstede: Culture frameworks for global marketing
and management. Palgrave Macmillan.
Nargundkar, R. (2003) Marketing Research-Text & Cases 2E. Tata McGraw-Hill
Education.
Nasser, R., Abouchedid, K. (2000). Attitudes and concerns towards distance
education: the case of Lebanon. Online Journal of Distance Learning
Administration 3, 1-10.
Ndubisi, N. (2006). Factors of online learning adoption: a comparative
juxtaposition of the theory of planned behaviour and the technology
acceptance model. International Journal on E-learning 5, 571-591.
Neuman, W. L. (2006) Social research methods: qualitative and quantitative
approaches. Pearson/Allyn and Bacon.
Ngai, E. W. T., Poon, J. K. L. & Chan, Y. H. C. (2007). Empirical examination of
the adoption of WebCT using TAM. Computers & Education 48,
250-267.
Norman, P. & Conner, M. (1996). The role of social cognition models in
predicting health behaviours: Future directions.
Nunnally, J. C. (1970) Introduction to psychological measurement. New York:
McGraw-Hill.
Ong, C. S. & Lai, J. Y. (2006). Gender differences in perceptions and
relationships among dominants of e-learning acceptance. Computers in
Human Behavior 22, 816-829.
Onwuegbuzie, A. J. (2002). Positivists, post-positivists, post-structuralists, and
post-modernists: Why can’t we all get along? Towards a framework for
unifying research paradigms. Education 122, 518–530.
Orlikowski, W. & Baroudi, J. J. (1991). Studying information technology in
organizations: Research approaches and assumptions.
Ormrod, J. E. (2010) Educational psychology : developing learners. Boston:
Pearson/Allyn & Bacon.
Pallant, J. (2010) SPSS survival manual: A step by step guide to data analysis
using SPSS. Open University Press.
Parboteeah, K. P., Bronson, J. W. & Cullen, J. B. (2005). Does national culture
affect willingness to justify ethically suspect behaviors? A focus on the
GLOBE national culture scheme. International Journal of Cross Cultural
Management 5, 123-138.
Park, S. Y. (2009). An analysis of the technology acceptance model in
understanding university students' behavioral intention to use e-learning.
Educational Technology & Society 12, 150-162.
Park, S. Y., Nam, M. W. & Cha, S. B. (2012). University students' behavioral
intention to use mobile learning: Evaluating the technology acceptance
model. British Journal of Educational Technology.
Peng, H., Su, Y. J., Chou, C. & Tsai, C. C. (2009). Ubiquitous knowledge
construction: Mobile learning re‐defined and a conceptual framework.
Innovations in Education and Teaching International 46, 171-183.

Appendix A
276
Pfeil, U., Zaphiris, P. & Ang, C. S. (2006). Cultural differences in collaborative
authoring of Wikipedia. Journal of Computer‐Mediated Communication
12, 88-113.
Phang, C. W., Sutanto, J., Kankanhalli, A., Li, Y., Tan, B. C. & Teo, H.-H.
(2006). Senior citizens' acceptance of information systems: A study in the
context of e-government services. Engineering Management, IEEE
Transactions on 53, 555-569.
Pituch, K. A. & Lee, Y. (2006). The influence of system characteristics on e-
learning use. Computers & Education 47, 222-244.
Poon, W. C. (2007). Users' adoption of e-banking services: the Malaysian
perspective. Journal of Business & Industrial Marketing 23, 59-69.
Porter, C. E. & Donthu, N. (2006). Using the technology acceptance model to
explain how attitudes determine Internet usage: The role of perceived
access barriers and demographics. Journal of Business Research 59, 999-
1007.
Presser, S., Couper, M. P., Lessler, J. T., Martin, E., Martin, J., Rothgeb, J. M. &
Singer, E. (2004). Methods for testing and evaluating survey questions.
Public opinion quarterly 68, 109-130.
Punch, K. F. & Punch, K. (2005) Introduction to Social Research: Quantitative
and Qualitative Approaches. Sage.
Qingfei, M., Yuping, L. & Shaobo, J. (2009) The Effects of Individual-Level
Culture on Mobile Commerce Adoption: An Empirical Study. Mobile
Business, 2009. ICMB 2009. Eighth International Conference on. (pp.
305-312).
Reid, M. & Levy, Y. (2008). Integrating trust and computer self-efficacy with
TAM: An empirical assessment of customers’ acceptance of banking
information systems (BIS) in Jamaica. Journal of Internet Banking and
Commerce 12, 2008-2012.
Richardson, H. & Robinson, B. (2007). The mysterious case of the missing
paradigm: a review of critical information systems research 1991–2001.
Information Systems Journal 17, 251-270.
Robinson, J. P., Wrightsman, L. S. & Andrews, F. M. (1991) Measures of
personality and social psychological attitudes. Academic Pr.
Roca, J. C., Chiu, C. M. & Martínez, F. J. (2006). Understanding e-learning
continuance intention: An extension of the Technology Acceptance Model.
International Journal of Human-Computer Studies 64, 683-696.
Rodriguez, T. & Lozano, P. (2011). The acceptance of Moodle technology by
business administration students. Computers & Education.
Rogers, E. M. (1995) Diffusion of innovations. New York: Simon and Schuster.
Rogers, E. M. (2003) Diffusion of innovations. New York: Free Press.
Roscoe, J. T. (1975) Fundamental research statistics for the behavioral sciences.
Holt, Rinehart and Winston.
Rose, G. & Straub, D. (1998). Predicting general IT use: Applying TAM to the
Arabic world. Journal of Global Information Management (JGIM) 6, 39-
46.
Russ-Eft, D. & Preskill, H. (2009) Evaluation in Organizations: A Systematic
Approach to Enhancing Learning, Performance, and Change. Basic
Books.

Appendix A
277
Saadé, R. G. & Galloway, I. (2005). Understanding intention to use multimedia
information systems for learning. Informing Science: International
Journal of an Emerging Transdiscipline 2, 287-296.
Saeed, K. A. & Abdinnour-Helm, S. (2008). Examining the effects of information
system characteristics and perceived usefulness on post adoption usage of
information systems. Information & Management 45, 376-386.
Sánchez-Franco, M. J., Martínez-López, F. J. & Martín-Velicia, F. A. (2009).
Exploring the impact of individualism and uncertainty avoidance in Web-
based electronic learning: An empirical analysis in European higher
education. Computers & Education 52, 588-598.
Sarantakos, S. (1993) Social Research. Basingstoke: Macmillan.
Saunders, E. J. (2004). Maximizing computer use among the elderly in rural
senior centers. Educational Gerontology 30, 573-585.
Saunders, M., Lewis, P. & Thornhill, A. (2009) Research Methods for Business
Students. Financial Times/Prentice Hall.
Schepers, J. & Wetzels, M. (2007). A meta-analysis of the technology acceptance
model: Investigating subjective norm and moderation effects. Information
& Management 44, 90-103.
Schreiber, J. B., Nora, A., Stage, F. K., Barlow, E. A. & King, J. (2006).
Reporting structural equation modeling and confirmatory factor analysis
results: A review. The Journal of Educational Research 99, 323-338.
Schumacher, P. & Morahan-Martin, J. (2001). Gender, Internet and computer
attitudes and experiences. Computers in Human Behavior 17, 95-110.
Schumacker, R. E. & Lomax, R. G. (2004) A beginner's guide to structural
equation modeling. Lawrence Erlbaum.
Schwartz, S. H. (1994). Are there universal aspects in the structure and contents of
human values? Journal of social issues 50, 19-45.
Schwartz, S. H. (1999). A theory of cultural values and some implications for
work. Applied psychology 48, 23-47.
Sekaran, U. & Bougie, R. (2011) RESEARCH METHODS FOR BUSINESS : A
SKILL BUILDING APPROACH, 5TH ED. Wiley India Pvt. Ltd.
Sheppard, B. H., Hartwick, J. & Warshaw, P. R. (1988). The theory of reasoned
action: A meta-analysis of past research with recommendations for
modifications and future research. Journal of consumer research, 325-343.
Shih, Y.-Y. & Fang, K. (2004). The use of a decomposed theory of planned
behavior to study Internet banking in Taiwan. Internet Research 14, 213-
223.
Short, J., Williams, E. & Christie, B. (1976). The social psychology of
telecommunications.
Sivo, S. & Brophy, J. (2003). Students' Attitude in a Web-enhanced Hybrid
Course: A Structural Equaadon Modeling Inquiry. Journal of Educational
Media & Library Sciences 41, 181-194.
Søndergaard, M. (1994). Research note: Hofstede's consequences: a study of
reviews, citations and replications. Organization studies 15, 447-456.
Sørnes, J.-O., Stephens, K. K., S_tre, A. S. & Browning, L. D. (2004). The
reflexivity between ICTs and business culture: Applying Hofstede’s theory
to compare Norway and the United States. Informing Science Journal 7,
1–30.

Appendix A
278
Srite, M. (2006). Culture as an explanation of technology acceptance differences:
an empirical investigation of Chinese and US users. Australasian Journal
of Information Systems 14.
Srite, M. & karahanna, E. (2000) A Cross-Cultural Model of Technology
Acceptance. the Annual Diffusion of Innovations Group in Information
Technology (DIGIT). Charlotte, NC.
Srite, M. & Karahanna, E. (2006). The role of espoused national cultural values in
technology acceptance. MIS quarterly 30, 679-704.
Srite, M. & Karahnana, E. (1999). The influence of national culture on the
acceptance and use of information technologies: An empirical study.
Stangor, C. (2010) Research methods for the behavioral sciences. Wadsworth Pub
Co.
Steven, R. (2001). Is online learning right for you? American Agent & Broker 73,
54.
Stoel, L. & Lee, K. H. (2003). Modeling the effect of experience on student
acceptance of Web-based courseware. Internet Research 13, 364-374.
Stoneman, P. (2002) The economics of technological diffusion. Blackwell
Publishers Oxford,, UK.
Straub, D., Boudreau, M. C. & Gefen, D. (2004). Validation guidelines for IS
positivist research. Communications of the Association for Information
Systems 13, 380-427.
Straub, D. & Burton-Jones, A. (2007). Veni, vidi, vici: Breaking the TAM logjam.
Journal of the Association for Information Systems 8, 223-229.
Straub, D., Keil, M. & Brenner, W. (1997). Testing the technology acceptance
model across cultures: A three country study. Information & Management
33, 1-11.
Straub, D., Loch, K., Evaristo, R., Karahanna, E. & Srite, M. (2002). Toward a
theory-based measurement of culture. Human factors in information
systems, 61-82.
Straub, D., Gefen, D. & Boudreau, C. (2005) "Qunatiative Research" in Research
In Information Systems: A Handbook For Research Supervisors And Their
Students, , D. Avison and J. Pries-Heje, Elsevier/Butterworth-Heinemann,
221-238.
Šumak, B., Heričko, M. & Pušnik, M. (2011). A meta-analysis of e-learning
technology acceptance: The role of user types and e-learning technology
types. Computers in Human Behavior 27, 2067-2077.
Sun, H. & Zhang, P. (2006). The role of moderating factors in user technology
acceptance. International Journal of Human-Computer Studies 64, 53-78.
Sun, P.-C., Tsai, R. J., Finger, G., Chen, Y.-Y. & Yeh, D. (2008). What drives a
successful e-Learning? An empirical investigation of the critical factors
influencing learner satisfaction. Computers & Education 50, 1183-1202.
Szajna, B. (1994). Software evaluation and choice: predictive validation of the
technology acceptance instrument. MIS quarterly, 319-324.
Tabachnick, B. G. & Fidell, L. S. (2007) Using Multivariate Statistics (980).
Pearson.
Tan, M. & Teo, T. S. (2000). Factors influencing the adoption of Internet banking.
Journal of the AIS 1, 5.
Tarde, G. (1903). The laws of imitation, trans. EC Parsons, New York.

Appendix A
279
Taylor, S. & Todd, P. (1995b). Assessing IT usage: The role of prior experience.
MIS quarterly, 561-570.
Taylor, S. & Todd, P. (1995c). Decomposition and crossover effects in the theory
of planned behavior: A study of consumer adoption intentions.
International Journal of Research in Marketing 12, 137-155.
Taylor, S. & Todd, P. A. (1995a). Understanding information technology usage:
A test of competing models. Information systems research 6, 144-176.
Tella, A. (2012). System-related Factors that Predict Students' Satisfaction with
the Blackboard Learning System at the University of Botswana. AFRICAN
JOURNAL OF LIBRARY ARCHIVES AND INFORMATION SCIENCE 22,
41-52.
Teo, T. (2009a). The Impact of Subjective Norm and Facilitating Conditions on
Pre-Service Teachers' Attitude toward Computer Use: A Structural
Equation Modeling of an Extended Technology Acceptance Model.
Journal of Educational Computing Research 40, 89-109.
Teo, T. (2009b). Modelling technology acceptance in education: A study of pre-
service teachers. Computers & Education 52, 302-312.
Teo, T. (2010). Examining the influence of subjective norm and facilitating
conditions on the intention to use technology among pre-service teachers:
a structural equation modeling of an extended technology acceptance
model. Asia Pacific Education Review 11, 253-262.
Teo, T. (2011). Assessing the cross-cultural validity study of the E-learning
Acceptance Measure (ElAM): A structural equation modeling approach.
Teo, T., Luan, W. S. & Sing, C. C. (2008). A cross-cultural examination of the
intention to use technology between Singaporean and Malaysian pre-
service teachers: an application of the Technology Acceptance Model
(TAM). Journal of Educational Technology and Society 11, 265-280.
Teo, T. & Noyes, J. (2011). An assessment of the influence of perceived
enjoyment and attitude on the intention to use technology among pre-
service teachers: A structural equation modeling approach. Computers &
Education 57, 1645-1653.
Teo, T., Ursaves, O. F. & Bahçekapili, E. (2011). Efficiency of the technology
acceptance model to explain pre-service teachers' intention to use
technology: A Turkish study. Campus-Wide Information Systems 28, 93-
101.
Terzis, V. & Economides, A. A. (2011). Computer based assessment: Gender
differences in perceptions and acceptance. Computers in Human Behavior
27, 2108-2122.
Thatcher, J. B., Srite, M., Stepina, L. P. & Liu, Y. (2003). Culture overload and
personal innovativeness with information technology: Extending the
nomological net. Journal of Computer Information Systems 44, 74-81.
Trompenaars, F. (1993). Riding the Waves of Culture: Understanding Diversity in
Global Business (Irwin, New York, NY).
Tsang, P., Kwan, R. & Fox, R. (2007) Enhancing learning through technology.
World Scientific.
Turner, P., Turner, S. & Van de Walle, G. (2007). How older people account for
their experiences with interactive technology. Behaviour & Information
Technology 26, 287-296.
Appendix A
280
UNDP (2002) United Nations Development Program. Arab Human Development
Report. New York.
Van Raaij, E. M. & Schepers, J. J. L. (2008). The acceptance and use of a virtual
learning environment in China. Computers & Education 50, 838-852.
Venkatesh, V. (2000). Determinants of perceived ease of use: Integrating control,
intrinsic motivation, and emotion into the technology acceptance model.
Information systems research 11, 342-365.
Venkatesh, V. & Bala, H. (2008). Technology Acceptance Model 3 and a
Research Agenda on Interventions. Decision Sciences 39, 273-315.
Venkatesh, V. & Davis, F. D. (1996). A model of the antecedents of perceived
ease of use: Development and test*. Decision Sciences 27, 451-481.
Venkatesh, V. & Davis, F. D. (2000). A theoretical extension of the technology
acceptance model: Four longitudinal field studies. Management science,
186-204.
Venkatesh, V. & Morris, M. G. (2000). Why don't men ever stop to ask for
directions? Gender, social influence, and their role in technology
acceptance and usage behavior. MIS quarterly, 115-139.
Venkatesh, V., Morris, M. G. & Ackerman, P. L. (2000). A longitudinal field
investigation of gender differences in individual technology adoption
decision-making processes. Organizational Behavior and Human Decision
Processes 83, 33-60.
Venkatesh, V., Morris, M. G., Davis, G. B. & Davis, F. D. (2003). User
acceptance of information technology: Toward a unified view. MIS
quarterly, 425-478.
Venkatesh, V., Morris, M. G., Sykes, T. A. & Ackerman, P. L. (2004). Individual
reactions to new technologies in the workplace: The role of gender as a
psychological construct. Journal of Applied Social Psychology 34, 445-
467.
Vijayasarathy, L. R. (2004). Predicting consumer intentions to use on-line
shopping: the case for an augmented technology acceptance model.
Information & Management 41, 747-762.
Vogt, W. P. (2005) Dictionary of Statistics & Methodology: A Nontechnical
Guide for the Social Sciences. Sage Publications.
Wagner, E. D. (2008) Minding the Gap: Sustaining eLearning Innovation. World
Conference on E-Learning in Corporate, Government, Healthcare, and
Higher Education 2008. Las Vegas, Nevada, USA, AACE.
Walker, G. & Johnson, N. (2008). Faculty intentions to use components for Web-
enhanced instruction. INTERNATIONAL JOURNAL ON E LEARNING 7,
133.
Walsham, G. (1993) Interpreting Information Systems in Organizations (286).
John Wiley; Sons, Inc.
Walsham, G. (1995). Interpretive case studies in IS research: nature and method.
European Journal of Information Systems 4, 74-81.
Wang, Y. S., Wu, M. C. & Wang, H. Y. (2009). Investigating the determinants
and age and gender differences in the acceptance of mobile learning.
British Journal of Educational Technology 40, 92-118.
Weimer, M. (2013) Learner-centered teaching: Five key changes to practice.
John Wiley & Sons.

Appendix A
281
Wilkins, L., Swatman, P. & Holt, D. (2009). Adding value to enterprisewide
system integration: A new theoretical framework for assessing technology
adoption outcomes. e-COMMERCE 2009, 53.
Williams, M. D., Rana, N. P., Dwivedi, Y. K. & Lal, B. (2011) Is UTAUT really
used or just cited for the sake of it? a systematic review of citations of
UTAUT's originating article. ECIS.
Williams, R. (1985) Keywords: A vocabulary of culture and society. Oxford
University Press, USA.
Winfield, I. (1991) Organisations and Information Technology: Systems, Power
and Job Design. Boston.
Wu, J., Tsai, R. J., Chen, C. C. & Wu, Y. (2006). An integrative model to predict
the continuance use of electronic learning systems: hints for teaching.
International Journal on E-learning 5.
Wu, M.-Y., Chou, H.-P., Weng, Y.-C. & Huang, Y.-H. (2008) A Study of Web
2.0 Website Usage Behavior Using TAM 2. Asia-Pacific Services
Computing Conference, 2008. APSCC'08. IEEE. (pp. 1477-1482). IEEE.
Ya-Wen Teng, L. (2009). Collaborating and communicating online: A cross-
bordered intercultural project between Taiwan and the US. Journal of
Intercultural Communication.
YenYuen, Y. & Yeow, P. (2009) User acceptance of Internet banking service in
Malaysia. Web information systems and technologies. (pp. 295-306).
Springer.
Yi-Cheng, C., Chun-Yu, C., Yi-Chen, L. & Ron-Chen, Y. (2007). Predicting
College Student’Use of E-Learning Systems: an Attempt to Extend
Technology Acceptance Model.
Yi, M. Y. & Hwang, Y. (2003). Predicting the use of web-based information
systems: self-efficacy, enjoyment, learning goal orientation, and the
technology acceptance model. International Journal of Human-Computer
Studies 59, 431-449.
Yi, M. Y., Jackson, J. D., Park, J. S. & Probst, J. C. (2006). Understanding
information technology acceptance by individual professionals: Toward an
integrative view. Information & Management 43, 350-363.
Yin, R. K. (2009) Case Study Research: Design and Methods. Sage Publications.
Yousafzai, S. Y., Foxall, G. R. & Pallister, J. G. (2007a). Technology acceptance:
a meta-analysis of the TAM: Part 1. Journal of Modelling in Management
2, 251-280.
Yousafzai, S. Y., Foxall, G. R. & Pallister, J. G. (2007b). Technology acceptance:
a meta-analysis of the TAM: Part 2. Journal of Modelling in Management
2, 281-304.
Yousafzai, S. Y., Foxall, G. R. & Pallister, J. G. (2010). Explaining Internet
banking behavior: theory of reasoned action, theory of planned behavior,
or technology acceptance model? Journal of Applied Social Psychology
40, 1172-1202.
Yuan, K. H. (2005). Fit indices versus test statistics. Multivariate Behavioral
Research 40, 115-148.
Yuen, A. H. K. & Ma, W. W. K. (2008). Exploring teacher acceptance of e‐learning technology. Asia‐Pacific Journal of Teacher Education 36, 229-
243.

Appendix A
282
Zakaria, Z. (2001) Factors related to information technology implementation in
the Malaysian Ministry of Education Polytechnics. Virginia Polytechnic
Institute and State University.
Zakour, A. B. (2004) Cultural differences and information technology acceptance.
Proceedings of the 7th Annual Conference of the Southern Association for
Information Systems. (pp. 156-161).
Zhang, S., Zhao, J. & Tan, W. (2008). Extending TAM for online learning
systems: An intrinsic motivation perspective. Tsinghua Science &
Technology 13, 312-317.
Zikmund, W. (2009) Business Research Methods. Texere Publishing Limited.
Zmud, R. W. (1982). Diffusion of modern software practices: influence of
centralization and formalization. Management science 28, 1421-1431.

Appendix A
I
Appendix A
Survey Questionnaire

Appendix A
II

Appendix A
III

Appendix A
IV

Appendix A
V

Appendix B
VI
Appendix B
Cover Letter
Brunel University West London Department of Information System and Computing Dear Participant,
I am a PhD research student at Brunel University West London, under the supervision of
Professor Xiaohui Liu, Deputy Head of School (Research) for department of Information
System, Computing and Mathematics. The research title is:
The Effects of Individual-level Culture and Demographic Characteristics on E-
learning Acceptance in Lebanon and England: A Structural Equation Modeling
Approach
The main aim of this study is to investigate and understand how cultural and individual
differences affect students’ perceptions and behaviours when using web-based learning
systems in order to generate a model that determines the acceptance of technology in
developing and developed worlds. This research will help to better understand the
characteristics of students in the Arab worlds and England respectively. The outcome of
the research should help policy makers, educators and experts to understand “what” the
students expect from the learning management systems, and system for developers to
understand “how” they could improve their learning management systems in the
concerned cultural contexts and overcome problems that may occur during cross-cultural
educational cooperation and e-learning implementation.
The questionnaire consists of five parts. The first part collects data about the participant’s
general information. The second and third parts assess the perceptions of students about
web-based learning system. The fourth part measures the actual usage of the web-based
learning system, while the last part measures the cultural factors about the participants.
The questionnaire will take approximately 10 to 12 minutes of your time. Your
participation is voluntary. If you do not wish to participate, simply discard the
questionnaire at any time. All your information including your name will be kept
completely anonymous and will be used for the purpose of this PhD research and
destroyed after two years.
If you have any questions or concerns, please contact me [email protected] or my
supervisor [email protected]. If you have any concerns or complaints regarding
the ethical elements of this project please contact [email protected] or Professor
Zidong Wang, Tel. No. 0044 (1) 895 266021.

Appendix C
VII
Appendix C
Missing Data
N Mean Std.
Deviation
Missing Data (England)
Frequency Percent
Gender 600 1.48 .500 4 .5
Age 599 2.29 1.007 5 .8
EdLevel 600 1.35 .478 4 .5
WebExp 601 2.23 .707 2 .3
CompExp 600 2.22 .698 4 .5
NOfCourses 600 1.78 .759 3 .5
PU1 599 5.23 1.354 5 .8
PU2 601 5.16 1.305 3 .5
PU3 600 5.35 1.313 4 .5
PU4 598 5.23 1.333 6 1.0
PU5 595 5.24 1.342 9 1.5
PEU1 601 5.40 1.399 3 .5
PEU2 599 5.32 1.289 5 .8
PEU3 601 5.35 1.260 3 .5
PEU4 602 5.39 1.279 2 .3
PEU5 599 5.42 1.348 5 .8
SE1 594 5.48 1.455 10 1.7
SE2 600 5.48 1.289 4 .7
SE3 599 5.02 1.497 5 .8
SE4 600 4.94 1.567 4 .7
SE5 599 5.04 1.479 5 .8
SE6 598 4.98 1.703 6 1.0
FC1 596 5.51 1.321 8 1.3
FC2 599 5.49 1.301 5 .8
FC3 599 4.99 1.440 5 .8
FC4 599 4.66 1.653 5 .8
SN1 595 4.74 1.529 9 1.5
SN2 597 4.42 1.496 7 1.2
SN3 598 4.95 1.410 6 1.0
SN4 592 5314 1.387 12 2.0
QWL1 596 5.64 1.345 8 1.3
QWL2 595 5.68 1.343 9 1.5
QWL3 598 5.27 1.361 6 1.0
QWL4 598 5.55 1.329 6 1.0
QWL5 596 5.65 1.295 8 1.3
BI1 600 5.50 1.367 4 .7
BI2 597 5.77 1.265 7 1.2

Appendix C
VIII
BI3 594 5.78 1.291 10 1.7
FreqUsage 595 4.85 1.128 9 1.5
DailyUsage 594 4.02 1.298 10 1.7
LecNotes 595 4.30 .982 9 1.5
Announ 599 3.50 1.297 5 .8
Email 596 4.00 1.199 8 1.3
Assess 593 4.27 1.011 11 1.8
Handbook 596 3.47 1.331 8 1.3
DiscBoard 601 2.76 1.397 3 .5
Websites 597 3.36 1.361 7 1.2
Quizzes 599 2.83 1.505 5 .8
PastPapers 597 3.66 1.362 7 1.2
PD1 599 2.77 1.541 5 .8
PD2 600 2.58 1.420 4 .7
PD3 594 2.23 1.357 10 1.7
PD4 595 2.77 1.443 9 1.5
PD5 599 2.65 1.411 5 .8
PD6 597 2.83 1.296 7 1.2
MF1 593 2.30 1.481 11 1.8
MF2 596 2.52 1.589 8 1.3
MF3 597 2.17 1.493 7 1.2
MF4 593 2.14 1.547 11 1.8
MF5 594 2.57 1.600 10 1.7
MF6 596 2.49 1.633 8 1.3
IC1 600 3.59 1.538 4 .7
IC2 593 4.24 1.559 11 1.8
IC3 599 4.04 1.398 5 .8
IC4 593 3.99 1.496 11 1.8
IC5 598 3.84 1.540 6 1.0
IC6 598 3.66 1.540 6 1.0
UA1 597 4.35 1.302 7 1.2
UA2 597 4.18 1.218 7 1.2
UA3 596 4.30 1.348 8 1.3
UA4 589 4.29 1.381 15 2.5
UA5 593 4.27 1.459 11 1.8
Table 1: British Sample Univariate missing data (individual-level)

Appendix C
IX
N Mean Std.
Deviation
Missing Data (Lebanon)
Frequency Percent
Gender 589 1.47 .499 5 .8
Age 589 2.06 .904 5 .8
EdLevel 587 1.36 .480 7 1.2
WebExp 588 2.38 .686 6 1.0
CompExp 589 2.23 .704 5 .8
NOfCourses 585 1.79 .724 9 1.5
PU1 580 5.33 1.281 14 2.4
PU2 583 4.94 1.303 11 1.9
PU3 588 5.27 1.350 6 1.0
PU4 586 4.94 1.399 8 1.3
PU5 580 4.91 1.414 14 2.4
PEU1 583 5.80 1.261 11 1.9
PEU2 587 5.52 1.299 7 1.2
PEU3 583 5.57 1.261 11 1.9
PEU4 589 5.67 1.206 5 .8
PEU5 588 5.76 1.172 6 1.0
SE1 586 5.52 1.390 8 1.3
SE2 587 5.48 1.307 7 1.2
SE3 588 5.07 1.420 6 1.0
SE4 589 5.71 1.034 5 .8
SE5 588 4.97 1.467 6 1.0
SE6 588 4.82 1.750 6 1.0
FC1 588 5.62 1.246 6 1.0
FC2 587 5.49 1.255 7 1.2
FC3 583 5.69 .974 11 1.9
FC4 584 5.61 .994 10 1.7
SN1 585 4.83 1.608 9 1.5
SN2 587 4.28 1.507 7 1.2
SN3 585 5.16 1.363 9 1.5
SN4 585 5.49 1.121 9 1.5
QWL1 588 5.49 1.323 6 1.0
QWL2 588 5.51 1.295 6 1.0
QWL3 587 4.91 1.419 7 1.2
QWL4 584 5.48 1.333 10 1.7
QWL5 583 5.49 1.153 11 1.9
BI1 585 5.37 1.366 9 1.5
BI2 582 5.80 1.291 12 2.0
BI3 586 5.64 1.323 8 1.3
FreqUsage 583 4.90 1.104 11 1.9
DailyUsage 583 3.47 1.277 11 1.9
LecNotes 585 4.22 1.091 9 1.5
Announ 585 3.93 1.149 9 1.5
Email 580 3.47 1.335 14 2.4

Appendix C
X
Assess 580 3.47 1.274 14 2.4
Handbook 588 3.45 1.292 6 1.0
DiscBoard 586 2.67 1.393 8 1.3
Websites 579 3.09 1.397 15 2.5
Quizzes 585 3.30 1.296 9 1.5
PastPapers 585 3.44 1.366 9 1.5
PD1 585 3.16 1.740 9 1.5
PD2 588 3.26 1.696 6 1.0
PD3 587 3.12 1.603 7 1.2
PD4 586 3.33 1.642 8 1.3
PD5 582 3.32 1.661 12 2.0
PD6 580 3.86 1.577 14 2.4
MF1 586 3.28 1.759 8 1.3
MF2 584 3.71 1.819 10 1.7
MF3 585 3.38 1.779 9 1.5
MF4 585 3.19 1.700 13 2.2
MF5 585 3.38 1.698 9 1.5
MF6 586 3.32 1.663 8 1.3
IC1 587 4.73 1.440 7 1.2
IC2 583 5.21 1.245 11 1.9
IC3 584 4.99 1.300 10 1.7
IC4 585 5.00 1.325 9 1.5
IC5 586 5.06 1.369 8 1.3
IC6 588 4.61 1.498 6 1.0
UA1 589 5.44 1.200 5 .8
UA2 588 5.47 1.259 6 1.0
UA3 584 5.31 1.220 10 1.7
UA4 582 5.31 1.225 12 2.0
UA5 584 5.46 1.198 10 1.7
Table 2: Lebanese Sample Univariate missing data (individual-level)

Appendix D
XI
Appendix D
Outliers
Univariate outliers
Variable Minimum Maximum Outlier Case Number
PU1 -3.13383 1.30944 No case
PU2 -3.17424 1.41063 No case
PU3 -3.32012 1.25831 838-1111
PU4 -3.16435 1.33981 No case
PU5 -3.11268 1.30579 No case
PEU1 -3.14438 1.14761 No case
PEU2 -3.15942 1.30516 No case
PEU3 -3.45838 1.31434 803-1197
PEU4 -3.42964 1.25878 803-1197
PEU5 -3.29416 1.17367 No case
SE1 -2.52576 1.21488 No case
SE2 -2.76579 1.31533 No case
SE3 -2.40962 1.43558 No case
SE4 -2.50572 1.32905 No case
SE5 -2.75217 1.33716 No case
SE6 -2.35570 1.19401 No case
FC1 -2.75016 1.10240 No case
FC2 -2.79183 1.12062 No case
FC3 -2.50757 1.32679 No case
FC4 -2.10617 1.33977 No case
SN1 -2.47619 1.48746 No case
SN2 -2.35888 1.55531 No case
SN3 -2.83278 1.46801 No case
SN4 -2.99391 1.34780 No case
QWL1 -3.21033 1.01309 No case
QWL2 -3.50023 .98521 616-751-803-1004
QWL3 -3.14917 1.26576 No case
QWL4 -3.19169 1.08771 No case
QWL5 -3.55592 1.04153 751-757
BI1 -3.29679 1.10379 No case
BI2 -2.94906 .97263 No case
BI3 -2.84205 .94568 No case
FreqUsage -3.36973 1.02620 637-1069-1197
DailyUsage -2.33257 1.54435 No case
PD1 -1.24969 3.00019 No case
PD2 -1.23364 2.69630 No case
PD3 -1.13212 2.91883 No case
PD4 -1.27889 2.71930 No case
PD5 -1.27036 2.80234 No case
PD6 -1.34659 2.76534 No case
MF1 -1.15562 2.91669 No case

Appendix D
XII
MF2 -1.23394 2.83873 No case
MF3 -1.18979 2.70736 No case
MF4 -1.12426 2.81000 No case
MF5 -1.28492 3.22287 No case
MF6 -1.22312 3.29072 1183
IC1 -1.54729 4.41913 1121 (Data Entry: 14
instead of 4)
IC2 -1.82962 1.97884 No case
IC3 -1.91304 2.32206 No case
IC4 -1.77593 2.24153 No case
IC5 -1.76677 2.40714 No case
IC6 -1.74761 2.44527 No case
UA1 -2.30847 2.15334 No case
UA2 -2.36260 2.24314 No case
UA3 -2.27492 2.12439 No case
UA4 -2.34087 2.15717 No case
UA5 -2.19354 2.00138 No case
Table 3: British sample Univariate outliers
Variable Minimum Maximum Outlier Case
Number
PU1 -3.55967 1.29947 57
PU2 -3.23756 1.56185 No case
PU3 -3.34091 1.27311 10
PU4 -3.06897 1.46869 No case
PU5 -2.99905 1.49163 No case
PEU1 -3.12839 .99211 No case
PEU2 -2.84488 1.17782 No case
PEU3 -2.97841 1.18142 No case
PEU4 -3.10110 1.13444 No case
PEU5 -3.16400 1.07603 No case
SE1 -2.24074 1.13223 No case
SE2 -2.33348 1.19402 No case
SE3 -2.73085 1.39808 No case
SE4 -4.53976 1.26936 169-222-313
SE5 -2.73101 1.41284 No case
SE6 -2.26729 1.26559 No case
FC1 -2.55564 1.13325 No case
FC2 -2.48722 1.21757 No case
FC3 -3.93611 1.29875 107
FC4 -2.96300 1.36216 No case
SN1 -2.52498 1.39333 No case
SN2 -2.36507 1.84251 No case
SN3 -3.25863 1.38257 No case
SN4 -4.25933 1.41867 213-195-143-
222
QWL1 -2.68959 1.14402 No case
QWL2 -2.75537 1.15242 No case
QWL3 -2.81427 1.47881 No case
QWL4 -2.65317 1.15716 No case
QWL5 -3.92402 1.29679 77

Appendix D
XIII
BI1 -3.37989 1.22280 143
BI2 -3.10777 .94987 No case
BI3 -3.63546 1.04811 143
FreqUsage -3.66245 .98711 77-523
DailyUsage -1.95989 1.96403 No case
PD1 -1.37616 2.52278 No case
PD2 -1.50365 2.11656 No case
PD3 -1.40661 2.42287 No case
PD4 -1.35977 2.60458 No case
PD5 -1.49777 2.61266 No case
PD6 -1.49076 2.67752 No case
MF1 -1.27915 2.30920 No case
MF2 -1.32061 2.33301 No case
MF3 -1.29828 2.47071 No case
MF4 -1.38877 2.37116 No case
MF5 -1.38342 2.37095 No case
MF6 -1.69228 2.13384 No case
IC1 -2.65210 1.60272 No case
IC2 -3.45662 1.47274 497-541
IC3 -3.09797 1.56127 No case
IC4 -3.03288 1.51644 No case
IC5 -2.94922 1.43799 No case
IC6 -2.43872 1.61079 No case
UA1 -3.77632 1.30742 63-225-455
UA2 -3.57095 1.22308 225-248-352-
455
UA3 -3.00140 1.39712 No case
UA4 -3.70107 1.42487 225-353
UA5 -3.75738 1.30086 225
Table 4: Lebanese sample Univariate outliers
Multivariate Outliers
Observation
number
Mahalanobis d-
squared
P1 P2
544 111.728 .000 .000
17 105.275 .000 .000
156 103.695 .003 .000
108 103.470 .006 .000
188 97.280 .008 .000
122 96.959 .011 .000
406 90.396 0.16 .000
157 86.905 0.26 .000
405 86.005 0.37 .000
327 84.484 0.41 .000
80 80.853 0.41 .000
268 78.774 0.48 .000
Table 5: British sample Multivariate outliers

Appendix D
XIV
Observation number Mahalanobis d-
squared
P1 P2
390 89.484 .000 .000
557 81.739 .000 .000
204 80.930 0.001 .000
371 76.709 0.002 .000
333 71.080 0.004 .000
339 69.625 0.004 .000
263 69.176 0.007 .000
114 69.122 0.009 .000
285 68.797 0.013 .000
106 67.810 0.017 .000
167 67.525 0.019 .000
2 66.647 0.022 .000
207 66.601 0.026 .000
127 65.179 0.290 .000
500 65.036 0.030 .000
Table 6: Lebanese sample Multivariate outliers

Appendix E
XV
Appendix E
Normality
Items Mean Std. Deviation
Skewness Kurtosis
PU1 5.25 1.330 -.972 .943
PU2 5.17 1.289 -.863 .666
PU3 5.37 1.288 -.995 .847
PU4 5.23 1.312 -.842 .522
PU5 5.24 1.338 -.760 .481
PEU1 5.41 1.377 -.930 .564
PEU2 5.34 1.264 -.750 .465
PEU3 5.36 1.234 -.742 .549
PEU4 5.40 1.257 -.887 .887
PEU5 5.44 1.321 -.880 .617
SE1 5.06 1.596 -.562 -.559
SE2 5.07 1.470 -.503 -.551
SE3 4.76 1.561 -.299 -.745
SE4 4.93 1.563 -.534 -.506
SE5 5.05 1.459 -.687 -.075
SE6 4.99 1.683 -.646 -.496
FC1 5.29 1.553 -1.032 .463
FC2 5.29 1.525 -.939 .222
FC3 4.93 1.565 -.684 -.175
FC4 4.67 1.743 -.474 -.761
SN1 4.75 1.514 -.472 -.217
SN2 4.62 1.535 -.427 -.294
SN3 4.96 1.392 -.725 .442
SN4 5.14 1.381 -.760 .436
QWL1 5.64 1.342 -1.116 1.020
QWL2 5.70 1.318 -1.082 .857
QWL3 5.29 1.347 -.700 .031
QWL4 5.56 1.321 -.848 .066
QWL5 5.65 1.301 -.913 .439
BI1 5.51 1.346 -.924 .479
BI2 5.77 1.258 -1.007 .386
BI3 5.76 1.309 -1.012 .383
FreqUsage 4.84 1.136 -.995 1.016
DailyUsage 4.01 1.291 -.162 -.876
PD1 2.65 1.326 .588 -.217
PD2 2.57 1.273 .538 -.432
PD3 2.39 1.233 .514 -.597
PD4 2.60 1.252 .294 -.855
PD5 2.56 1.228 .494 -.380
PD6 2.64 1.218 .296 -.861
MF1 2.42 1.228 .359 -.909
MF2 2.51 1.229 .372 -.730
MF3 2.52 1.285 .268 -.977
MF4 2.43 1.273 .546 -.500
MF5 2.71 1.332 .437 -.342
MF6 2.62 1.328 .441 -.527
IC1 3.36 1.471 .088 -.783

Appendix E
XVI
IC2 3.88 1.576 -.122 -.775
IC3 3.71 1.418 -.197 -.640
IC4 3.65 1.492 -.071 -.712
IC5 3.53 1.435 -.097 -.804
IC6 3.50 1.432 -.032 -.747
UA1 4.10 1.346 -.348 -.795
UA2 4.08 1.304 -.304 -.696
UA3 4.10 1.366 -.290 -.707
UA4 4.12 1.335 -.277 -.614
UA5 4.14 1.432 -.165 -.870
Table 7: British sample Normality (Skewness and Kurtosis values)
Items Mean Std. Deviation
Skewness
Kurtosis
PU1 5.41 1.225 -.633 .040
PU2 5.06 1.244 -.451 -.193
PU3 5.36 1.288 -.683 -.115
PU4 5.07 1.310 -.494 -.106
PU5 5.02 1.323 -.492 -.119
PEU1 5.80 1.206 -1.017 .568
PEU2 5.54 1.237 -.768 .107
PEU3 5.59 1.195 -.721 -.056
PEU4 5.67 1.173 -.738 .059
PEU5 5.74 1.171 -.906 .480
SE1 5.33 1.476 -.728 -.443
SE2 5.32 1.407 -.665 -.385
SE3 4.98 1.446 -.369 -.690
SE4 5.70 1.014 -.813 .762
SE5 4.96 1.440 -.463 -.446
SE6 4.86 1.696 -.629 -.442
FC1 5.47 1.355 -.828 -.024
FC2 5.36 1.352 -.628 -.319
FC3 5.51 1.149 -.942 .986
FC4 5.43 1.159 -.915 1.061
SN1 4.88 1.521 -.447 -.445
SN2 4.38 1.419 -.135 -.381
SN3 5.23 1.280 -.500 .077
SN4 5.51 1.039 -1.094 .993
QWL1 5.52 1.291 -.642 -.317
QWL2 5.54 1.270 -.650 -.244
QWL3 4.94 1.397 -.413 -.328
QWL4 5.49 1.309 -.685 -.242
QWL5 5.52 1.142 -.444 -.304
BI1 5.42 1.290 -.797 .214
BI2 5.84 1.219 -.958 .305
BI3 5.67 1.260 -.822 -.005
FreqUsage 4.94 1.074 -.961 .686
DailyUsage 3.50 1.267 .149 -.898
MF1 3.12 1.541 .435 -.439
MF2 3.49 1.658 .185 -.924
MF3 3.20 1.568 .349 -.699
MF4 3.05 1.514 .285 -.774
MF5 3.18 1.460 .288 -.568
MF6 3.15 1.442 .440 -.588

Appendix E
XVII
PD1 3.13 1.671 .520 -.599
PD2 3.17 1.644 .340 -.988
PD3 3.06 1.593 .444 -.691
PD4 3.21 1.597 .398 -.703
PD5 3.21 1.600 .368 -.843
PD6 3.66 1.568 .248 -.849
IC1 4.74 1.412 -.490 -.291
IC2 5.21 1.220 -.588 .177
IC3 4.99 1.290 -.512 -.060
IC4 5.00 1.319 -.449 -.305
IC5 5.04 1.368 -.480 -.272
IC6 4.62 1.477 -.457 -.491
UA1 5.47 1.168 -.725 .495
UA2 5.48 1.240 -.845 .720
UA3 5.32 1.203 -.561 -.048
UA4 5.33 1.173 -.547 .115
UA5 5.47 1.179 -.674 .274
Table 8: Lebanese sample Normality (Skewness and Kurtosis values)

Appendix F
XVIII
Appendix F
Multicollinearity
England
Perceived Usefulness
Variables Entered/Removedb
Model Variables Entered
Variables Removed Method
1 QWL, SN, PEOU, FC, SE
a
. Enter
a. All requested variables entered. b. Dependent Variable: PU
Coefficients
a
Model
Collinearity Statistics
Tolerance VIF
1 PEOU .559 1.790
SE .460 2.173
FC .512 1.954
SN .726 1.377
QWL .619 1.615
a. Dependent Variable: PU
Collinearity Diagnosticsa
Model Dimension Eigenvalue Condition
Index
Variance Proportions
(Constant) PEOU SE FC SN QWL
1 1 5.869 1.000 .00 .00 .00 .00 .00 .00
2 .041 12.027 .11 .00 .08 .37 .24 .02
3 .034 13.107 .11 .09 .01 .14 .64 .03
4 .021 16.740 .23 .30 .22 .33 .12 .12
5 .018 17.941 .52 .00 .00 .03 .00 .82
6 .017 18.728 .02 .61 .69 .13 .00 .01
a. Dependent Variable: PU

Appendix F
XIX
Perceived Ease Of Use
Variables Entered/Removed
b
Model Variables Entered
Variables Removed Method
1 PU, SN, FC, QWL, SE
a
. Enter
a. All requested variables entered. b. Dependent Variable: PEOU
Collinearity Diagnosticsa
Model Dimension Eigenvalue Condition
Index
Variance Proportions
(Constant) SE FC SN QWL PU
1 1 5.872 1.000 .00 .00 .00 .00 .00 .00
2 .041 12.021 .12 .09 .41 .18 .01 .00
3 .032 13.530 .15 .03 .08 .74 .07 .01
4 .022 16.284 .60 .00 .12 .00 .09 .36
5 .019 17.488 .00 .82 .37 .05 .16 .01
6 .014 20.342 .13 .07 .01 .03 .67 .62
a. Dependent Variable: PEOU
Self-Efficacy
Variables Entered/Removedb
Model Variables Entered
Variables Removed Method
1 PEOU, SN, QWL, FC, PU
a
. Enter
a. All requested variables entered. b. Dependent Variable: SE
Coefficientsa
Model
Collinearity Statistics
Tolerance VIF
1 SE .490 2.039
FC .511 1.956
SN .691 1.448
QWL .549 1.822
PU .460 2.176
a. Dependent Variable: PEOU

Appendix F
XX
Coefficients
a
Model
Collinearity Statistics
Tolerance VIF
1 FC .602 1.662
SN .690 1.448
QWL .545 1.836
PU .444 2.253
PEOU .575 1.740
a. Dependent Variable: SE
Collinearity Diagnosticsa
Model Dimension Eigenvalue Condition
Index
Variance Proportions
(Constant) FC SN QWL PU PEOU
1 1 5.874 1.000 .00 .00 .00 .00 .00 .00
2 .037 12.547 .14 .82 .04 .01 .00 .00
3 .034 13.216 .04 .00 .87 .03 .01 .10
4 .022 16.250 .63 .15 .00 .04 .31 .02
5 .019 17.405 .01 .02 .05 .37 .02 .74
6 .014 20.589 .17 .00 .03 .55 .66 .14
a. Dependent Variable: SE
Facilitating Conditions
Variables Entered/Removed
b
Model Variables Entered
Variables Removed Method
1 SE, SN, QWL, PEOU, PU
a
. Enter
a. All requested variables entered. b. Dependent Variable: FC
Coefficients
a
Model
Collinearity Statistics
Tolerance VIF
1 SN .713 1.403
QWL .545 1.834
PU .437 2.291
PEOU .530 1.888
SE .532 1.880
a. Dependent Variable: FC

Appendix F
XXI
Collinearity Diagnosticsa
Model Dimension Eigenvalue Condition
Index
Variance Proportions
(Constant) SN QWL PU PEOU SE
1 1 5.885 1.000 .00 .00 .00 .00 .00 .00
2 .036 12.779 .00 .81 .00 .00 .07 .12
3 .026 14.912 .61 .11 .05 .02 .00 .27
4 .021 16.608 .20 .05 .30 .30 .04 .21
5 .018 18.285 .03 .01 .11 .02 .77 .41
6 .014 20.597 .17 .03 .54 .66 .12 .00
a. Dependent Variable: FC
Subjective norms
Variables Entered/Removed
b
Model Variables Entered
Variables Removed Method
1 FC, QWL, PEOU, PU, SE
a
. Enter
a. All requested variables entered. b. Dependent Variable: SN
Coefficients
a
Model
Collinearity Statistics
Tolerance VIF
1 QWL .548 1.826
PU .455 2.200
PEOU .526 1.903
SE .448 2.231
FC .523 1.911
a. Dependent Variable: SN
Collinearity Diagnosticsa
Model Dimension Eigenvalue Condition
Index
Variance Proportions
(Constant) QWL PU PEOU SE FC
1 1 5.886 1.000 .00 .00 .00 .00 .00 .00
2 .039 12.291 .20 .04 .01 .01 .05 .51
3 .022 16.204 .58 .00 .18 .12 .06 .28
4 .022 16.524 .07 .27 .18 .22 .24 .07
5 .017 18.734 .00 .06 .00 .54 .65 .14
6 .014 20.426 .15 .64 .62 .11 .00 .00
a. Dependent Variable: SN

Appendix F
XXII
Quality of Work Life
Variables Entered/Removedb
Model Variables Entered
Variables Removed Method
1 SN, PEOU, FC, PU, SE
a
. Enter
a. All requested variables entered. b. Dependent Variable: QWL
Coefficients
a
Model
Collinearity Statistics
Tolerance VIF
1 PU .495 2.020
PEOU .534 1.874
SE .452 2.214
FC .511 1.956
SN .699 1.430
a. Dependent Variable: QWL
Collinearity Diagnosticsa
Model Dimension Eigenvalue Condition
Index
Variance Proportions
(Constant) PU PEOU SE FC SN
1 1 5.871 1.000 .00 .00 .00 .00 .00 .00
2 .040 12.114 .12 .00 .00 .08 .33 .33
3 .033 13.270 .17 .01 .11 .01 .21 .49
4 .022 16.282 .64 .28 .08 .03 .24 .02
5 .018 18.189 .01 .44 .00 .67 .18 .12
6 .016 19.014 .06 .28 .80 .22 .04 .03
a. Dependent Variable: QWL

Appendix F
XXIII
Lebanon
Perceived Usefulness
Variables Entered/Removed
b
Model Variables Entered
Variables Removed Method
1 QWL, SN, FC, PEOU, SE
a
. Enter
a. All requested variables entered. b. Dependent Variable: PU
Coefficients
a
Model
Collinearity Statistics
Tolerance VIF
1 PEOU .673 1.487
SE .560 1.786
SN .782 1.279
FC .661 1.513
QWL .716 1.396
a. Dependent Variable: PU
Collinearity Diagnosticsa
Model
Dimension
Eigenvalue
Condition Index
Variance Proportions
(Constant) PEOU SE SN FC QWL
1 1 5.897 1.000 .00 .00 .00 .00 .00 .00
2 .031 13.849 .00 .04 .02 .75 .19 .00
3 .022 16.249 .06 .13 .03 .17 .44 .28
4 .020 17.270 .01 .50 .06 .02 .13 .46
5 .016 19.296 .71 .00 .27 .00 .04 .23
6 .014 20.220 .22 .33 .61 .06 .20 .03
a. Dependent Variable: PU
Perceived Ease Of Use
Variables Entered/Removed
b
Model Variables Entered
Variables Removed Method
1 PU, FC, SN, QWL, SE
a
. Enter
a. All requested variables entered. b. Dependent Variable: PEOU

Appendix F
XXIV
Coefficients
a
Model
Collinearity Statistics
Tolerance VIF
1 SE .607 1.647
SN .770 1.298
FC .676 1.479
QWL .631 1.585
PU .711 1.405
a. Dependent Variable: PEOU
Collinearity Diagnosticsa
Model Dimension Eigenvalue Condition
Index
Variance Proportions
(Constant) SE SN FC QWL PU
1 1 5.889 1.000 .00 .00 .00 .00 .00 .00
2 .034 13.257 .00 .07 .02 .32 .02 .39
3 .029 14.303 .00 .00 .89 .05 .03 .13
4 .017 18.567 .31 .12 .02 .06 .41 .41
5 .016 19.191 .49 .22 .06 .26 .31 .00
6 .016 19.407 .20 .59 .01 .30 .23 .07
a. Dependent Variable: PEOU
Self-Efficacy
Variables Entered/Removed
b
Model Variables Entered
Variables Removed Method
1 PEOU, SN, FC, QWL, PU
a
. Enter
a. All requested variables entered. b. Dependent Variable: SE
Coefficients
a
Model
Collinearity Statistics
Tolerance VIF
1 SN .800 1.250
FC .752 1.329
QWL .641 1.561
PU .640 1.562
PEOU .657 1.523
a. Dependent Variable: SE

Appendix F
XXV
Collinearity Diagnosticsa
Model Dimension Eigenvalue Condition
Index
Variance Proportions
(Constant) SN FC QWL PU PEOU
1 1 5.888 1.000 .00 .00 .00 .00 .00 .00
2 .031 13.722 .00 .01 .47 .01 .40 .00
3 .030 14.008 .00 .89 .09 .00 .03 .07
4 .019 17.440 .00 .03 .02 .51 .00 .56
5 .017 18.775 .60 .06 .36 .04 .31 .03
6 .015 20.121 .39 .01 .05 .43 .26 .35
a. Dependent Variable: SE
Subjective norms
Variables Entered/Removed
b
Model Variables Entered
Variables Removed Method
1 SE, PU, FC, QWL, PEOU
a
. Enter
a. All requested variables entered. b. Dependent Variable: SN
Coefficients
a
Model
Collinearity Statistics
Tolerance VIF
1 FC .659 1.517
QWL .645 1.551
PU .650 1.537
PEOU .606 1.651
SE .582 1.719
a. Dependent Variable: SN
Collinearity Diagnosticsa
Model Dimension Eigenvalue Condition
Index
Variance Proportions
(Constant) FC QWL PU PEOU SE
1 1 5.900 1.000 .00 .00 .00 .00 .00 .00
2 .033 13.281 .00 .29 .03 .39 .00 .06
3 .020 17.182 .03 .04 .44 .01 .47 .05
4 .017 18.545 .53 .45 .01 .32 .02 .01
5 .016 19.393 .35 .21 .22 .03 .00 .52
6 .014 20.550 .09 .01 .31 .24 .51 .35
a. Dependent Variable: SN

Appendix F
XXVI
Facilitating Condition
Variables Entered/Removed
b
Model Variables Entered
Variables Removed Method
1 SN, PEOU, QWL, PU, SE
a
. Enter
a. All requested variables entered. b. Dependent Variable: FC
Coefficients
a
Model
Collinearity Statistics
Tolerance VIF
1 QWL .647 1.546
PU .644 1.554
PEOU .622 1.607
SE .640 1.561
SN .772 1.296
a. Dependent Variable: FC
Collinearity Diagnosticsa
Model Dimension Eigenvalue Condition
Index
Variance Proportions
(Constant) QWL PU PEOU SE SN
1 1 5.896 1.000 .00 .00 .00 .00 .00 .00
2 .030 13.940 .00 .02 .24 .05 .01 .68
3 .025 15.310 .02 .03 .35 .12 .29 .19
4 .019 17.605 .10 .57 .13 .27 .00 .10
5 .016 19.149 .75 .11 .02 .03 .36 .00
6 .014 20.673 .13 .28 .26 .54 .34 .03
a. Dependent Variable: FC
Quality of Work Life
Variables Entered/Removed
b
Model Variables Entered
Variables Removed Method
1 FC, PU, SN, PEOU, SE
a
. Enter
a. All requested variables entered. b. Dependent Variable: QWL

Appendix F
XXVII
Coefficients
a
Model
Collinearity Statistics
Tolerance VIF
1 PU .729 1.372
PEOU .607 1.648
SE .570 1.755
SN .788 1.269
FC .676 1.480
a. Dependent Variable: QWL
Collinearity Diagnosticsa
Model Dimension Eigenvalue Condition
Index
Variance Proportions
(Constant) PU PEOU SE SN FC
1 1 5.889 1.000 .00 .00 .00 .00 .00 .00
2 .033 13.384 .00 .42 .00 .05 .06 .33
3 .030 14.027 .00 .15 .08 .00 .82 .01
4 .017 18.346 .00 .28 .44 .16 .00 .48
5 .017 18.876 .96 .10 .00 .10 .05 .04
6 .014 20.299 .03 .05 .48 .68 .07 .14
a. Dependent Variable: QWL

Appendix G
XXVIII
Appendix G
Measurement Model (Model Fit Summary)
Measurement model (British sample first run)
CMIN
Model NPAR CMIN DF P CMIN/DF
Default model 94 1640.667 467 .000 3.513
Saturated model 561 .000 0
Independence model 33 15295.398 528 .000 28.969
RMR, GFI
Model RMR GFI AGFI PGFI
Default model .125 .853 .823 .710
Saturated model .000 1.000
Independence model .807 .143 .089 .134
Baseline Comparisons
Model NFI
Delta1
RFI
rho1
IFI
Delta2
TLI
rho2 CFI
Default model .893 .879 .921 .910 .921
Saturated model 1.000
1.000
1.000
Independence model .000 .000 .000 .000 .000
Parsimony-Adjusted Measures
Model PRATIO PNFI PCFI
Default model .884 .790 .814
Saturated model .000 .000 .000
Independence model 1.000 .000 .000

Appendix G
XXIX
NCP
Model NCP LO 90 HI 90
Default model 1173.667 1054.003 1300.888
Saturated model .000 .000 .000
Independence model 14767.398 14367.255 15173.894
FMIN
Model FMIN F0 LO 90 HI 90
Default model 2.730 1.953 1.754 2.165
Saturated model .000 .000 .000 .000
Independence model 25.450 24.571 23.906 25.248
RMSEA
Model RMSEA LO 90 HI 90 PCLOSE
Default model .065 .061 .068 .000
Independence model .216 .213 .219 .000
AIC
Model AIC BCC BIC CAIC
Default model 1828.667 1839.941 2242.292 2336.292
Saturated model 1122.000 1189.280 3590.544 4151.544
Independence model 15361.398 15365.356 15506.607 15539.607

Appendix G
XXX
Measurement model (Lebanese sample first run)
CMIN
Model NPAR CMIN DF P CMIN/DF
Default model 94 1377.704 467 .000 2.950
Saturated model 561 .000 0
Independence model 33 12300.361 528 .000 23.296
RMR, GFI
Model RMR GFI AGFI PGFI
Default model .084 .860 .832 .716
Saturated model .000 1.000
Independence model .544 .207 .158 .195
Baseline Comparisons
Model NFI
Delta1
RFI
rho1
IFI
Delta2
TLI
rho2 CFI
Default model .888 .873 .923 .913 .923
Saturated model 1.000
1.000
1.000
Independence model .000 .000 .000 .000 .000
Parsimony-Adjusted Measures
Model PRATIO PNFI PCFI
Default model .884 .785 .816
Saturated model .000 .000 .000
Independence model 1.000 .000 .000

Appendix G
XXXI
NCP
Model NCP LO 90 HI 90
Default model 910.704 803.192 1025.822
Saturated model .000 .000 .000
Independence model 11772.361 11414.640 12136.454
FMIN
Model FMIN F0 LO 90 HI 90
Default model 2.438 1.612 1.422 1.816
Saturated model .000 .000 .000 .000
Independence model 21.771 20.836 20.203 21.480
RMSEA
Model RMSEA LO 90 HI 90 PCLOSE
Default model .059 .055 .062 .000
Independence model .199 .196 .202 .000
AIC
Model AIC BCC BIC CAIC
Default model 1565.704 1577.742 1973.532 2067.532
Saturated model 1122.000 1193.842 3555.951 4116.951
Independence model 12366.361 12370.587 12509.535 12542.535

Appendix H
XXXII
Appendix H
Standardised regression weights
Lebanon (Standardised regression
weight)
England (Standardised regression
weight)
Estimates Estimates
PU1 <--- PU .727 PU1 <--- PUU .824
PU2 <--- PU .836 PU2 <--- PUU .861
PU3 <--- PU .777 PU3 <--- PUU .818
PU4 <--- PU .858 PU4 <--- PUU .850
PU5 <--- PU .840 PU5 <--- PUU .839
PEOU1 <--- PEOU .807 PEOU1 <--- PEU .852
PEOU2 <--- PEOU .866 PEOU2 <--- PEU .879
PEOU3 <--- PEOU .880 PEOU3 <--- PEU .863
PEOU4 <--- PEOU .855 PEOU4 <--- PEU .850
PEOU5 <--- PEOU .843 PEOU5 <--- PEU .767
SN1 <--- SN .713 SN1 <--- SNN .829
SN2 <--- SN .641 SN2 <--- SN .765
SN3 <--- SN .862 SN3 <--- SN .771
SN4 <--- SN .712 SN4 <--- SN .632
QWL1 <--- QWL .731 QWL1 <--- QWL .802
QWL2 <--- QWL .797 QWL2 <--- QWL .820
QWL3 <--- QWL .575 QWL3 <--- QWL .753
QWL4 <--- QWL .664 QWL4 <--- QWL .740
QWL5 <--- QWL .797 QWL5 <--- QWL .808
SE1 <--- SE .887 SE1 <--- SE .903
SE2 <--- SE .913 SE2 <--- SE .888
SE3 <--- SE .768 SE3 <--- SE .818
SE4 <--- SE .517 SE4 <--- SE .490
SE5 <--- SE .341 SE5 <--- SE .390
FC1 <--- FC .880 FC1 <--- FC .920
FC2 <--- FC .899 FC2 <--- FC .920
FC3 <--- FC .821 FC3 <--- FC .729
FC4 <--- FC .719 FC4 <--- FC .627
BI1 <--- BI .722 BI1 <--- BI .807
BI2 <--- BI .852 BI2 <--- BI .874
BI3 <--- BI .914 BI3 <--- BI .907
FreqUsage <--- AU .777 FreqUsage <--- AU .634
DailyUsage <--- AU .628 DailyUsage <--- AU .867
Table 10: Standardized Regression Weights for both samples: the red items
are below the cut off 0.5