Embed Size (px)
Citation preview

The Effects of Hyperbaric Oxygen Therapy on
Bone Distant From Sites of Surgery
By
Mohammed Yousef Mohammed Alghamdi
A thesis submitted in conformity with the requirements
for the degree of Master of Science
Graduate Department of Dentistry
University of Toronto
© Copyright by Mohammed Yousef Alghamdi 2011

ii
The Effects of Hyperbaric Oxygen Therapy on Bone
Distant From Sites of Surgery
Mohammed Yousef Mohammed Alghamdi
DEGREE OF MASTERS OF SCIENCE
GRADUATE DEPARTMENT OF DENTISTRY
UNIVERSITY OF TORONTO
November 2011
Abstract
Background: Hyperbaric Oxygen Therapy (HBOT) is used to promote soft and hard tissue
repair at sites of injury or disease. It is not known whether it has any effect on uninjured tissues.
Objective: To evaluate the effect of HBO on vertebral bones distant from a calvarial surgical
site. Materials and Methods: 22 male New Zealand white rabbits were divided into two groups
(n=11). All animals underwent surgery to produce bilateral calvarial critical sized defects. Group
1 received HBOT while Group 2 served as controls breathing room air (NBO). The Marx HBO
protocol was used (90min, 100% oxygen at 2.4 ATA, 5 days a week for 4 weeks). Subjects were
sacrificed at 6 weeks. The vertebrae were analyzed by micro-CT (µCT) and histology. Results:
There were no statistical significant differences between the two groups. Conclusion: we
concluded that there were no harmful effects of HBOT on non-injured vertebrae at 6 weeks.

iii
Acknowledgements
I would like to begin by thanking my advisors Dr. Cameron Clokie, Dr. Howard
Holmes, and Dr. Sean Peel for all their help and guidance throughout my time at the
University of Toronto. Your efforts have provided me with the skills and knowledge to
achieve my professional goals. I am truly thankful to all of you.
I would like also to acknowledge Nancy Valiquette for helping me endlessly in the
histology and histochemistry parts. I would like to thank Geoff Rytell for his efficient help
reviewing every part of this thesis for English language proficiency.
I would like to acknowledge my parents Khadija Nooh and Yousef Alghamdi for
their endless support and passion throughout my life.
Mostly, I would like to thank my wife Sarah and my daughter Aseel and my son
Faisal for their love and support. You have been always there for me. I would not be
here without your encouragement.

iv
Table of Contents
Abstract……………………………..............…………..………………….......ii
Acknowledgeme…...……..…......................................……………………..iii
Table of contents……………………...…..........……………………………..iv
List of Tables _______________________________________________ ix
List of Figures ________________________________________________ x
1) Introduction _______________________________________________ 1
1.1) Hyperbaric Oxygen Therapy _________________________________________ 1
1.1.1) Definition and History _____________________________________________________ 1
1.1.2) Physiology of HBO _______________________________________________________ 2
I) Effects of HBO on Inflammatory Cells _______________________________________ 5
II) Effects of HBO on Bacteria and Antibiotic Efficiency ___________________________ 5
III) Effects of HBO on Tissue Reparative Cells ___________________________________ 6
IV) Effects of HBO on Angiogenesis ____________________________________________ 7
1.1.3) Treatment Protocols ______________________________________________________ 8
1.1.4) Indications for HBO Use __________________________________________________ 11
1.1.5) Contraindications and Side Effects of HBO Use ______________________________ 12
I) Absolute Contraindications ________________________________________________ 12
II) Relative Contraindications ________________________________________________ 13
III) Complications of HBO Use ________________________________________________ 14
1.2) Bone ________________________________________________________________ 16
1.2.1) Definition and Composition _________________________________________________ 16

v
1.2.2) Classification of Bone ______________________________________________________ 17
I) Based on Gross Appearance ______________________________________________ 17
II) Based on Maturity (and Matrix Arrangement) ________________________________ 17
III) Based on Developmental Origin ___________________________________________ 17
IV) Based on Layer Characteristics (Texture of Cross Section) ____________________ 18
1.2.3) Bone Histology ___________________________________________________________ 18
I) General______________________________________________________________________ 18
II) Bone Cells __________________________________________________________________ 20
A) Osteogenic Cells ___________________________________________________________ 20
I) Mesenchymal Cells and Osteoprogenitor Cells _________________________________ 20
II) Pre-osteoblasts ____________________________________________________________ 20
III) Osteoblasts _______________________________________________________________ 21
IV) Osteocytes _______________________________________________________________ 22
V) Bone Lining Cells __________________________________________________________ 23
B) Osteoclasts and Osteoclast Precursors _______________________________________ 23
1.2.4) Bone Formation ___________________________________________________________ 25
I) Modeling of Bone __________________________________________________________ 25
A) Intramembranous Bone Formation ________________________________________ 25
B) Endochondral Bone Formation ___________________________________________ 26
II) Bone Remodeling _________________________________________________________ 28
1.3) Studies of HBO Effects on Bone: ___________________________________ 30
1.4) Aims & Objectives of the Study: ____________________________________ 36
Null Hypothesis: _________________________________________________________________ 37
2) Materials and Methods ______________________________________ 38
2.1) Experimental Design _________________________________________________ 38
vi
2.2) Calvarial Defect Surgery ______________________________________________ 40
2.3) HBO Protocol ________________________________________________________ 41
2.4) Sacrifice ____________________________________________________________ 43
2.5) Collection of Vertebrae _______________________________________________ 43
2.6) Micro-CT (µCT) Analysis ______________________________________________ 45
2.6.1) Scanning and Reconstruction _______________________________________________ 45
2.6.2) Selection of a Region of Interest (ROI) for Analysis ____________________________ 48
2.6.3) Thresholding _____________________________________________________________ 52
2.6.4) Parameters Measured _____________________________________________________ 52
I) Measurements of Bone Quantity _____________________________________________ 52
Total volume (TV) _______________________________________________________ 52
Bone volume (BV) _______________________________________________________ 52
Bone Mineral Content (BMC) ______________________________________________ 53
Tissue Mineral Content (TMC) _____________________________________________ 53
II) Measurements of Bone Quality ______________________________________________ 53
Bone Mineral Density (BMD) ______________________________________________ 53
Tissue Mineral Density (TMD) _____________________________________________ 53
Bone Volume Fraction (BVF) ______________________________________________ 53
III) Measurements Affected by Changes in Bone Architecture _______________________ 54
Surface area (SA) _______________________________________________________ 54
Trabecular Thickness (Tb. Th.) ____________________________________________ 54
Structure Model Index (SMI) ______________________________________________ 54
2.7) Histological Methods _________________________________________________ 55
2.7.1) Tissue Processing_________________________________________________________ 55
2.7.2) Evaluation of Histological Sections __________________________________________ 57

vii
Osteoblasts _____________________________________________________________ 57
Bone Lining Cells (Inactive ostoblasts) ______________________________________ 57
Osteoclasts _____________________________________________________________ 61
Blood vessels ___________________________________________________________ 61
2.7.3) Histochemistry ____________________________________________________________ 63
Alkaline Phosphatase (ALP) staining method: _______________________________ 63
Tartrate-resistant acid phosphatase (TRAP) staining method: __________________ 64
2.8) Statistical Analysis ___________________________________________________ 65
3) Results __________________________________________________ 66
3.1) Micro-CT (µCT) Results ____________________________________________ 66
3.1.1) Analysis of Measures of Bone Quantity_______________________________________ 68
3.1.2 Analysis of Measures of Bone Quality ________________________________________ 71
3.1.3 Analysis of Measures of Bone Architecture __________________________________ 74
3.2 Histological Results _______________________________________________ 77
3.2.1 Evaluation of Histology (H & E stained slides) _______________________________ 77
Endplate: _______________________________________________________________ 77
Epiphyseal Growth Plate: _________________________________________________ 78
Vertebral Body:__________________________________________________________ 79
3.2.2 Histochemistry (TRAP & ALP) _____________________________________________ 86
4) Discussion _______________________________________________ 91
4.1) Study Design __________________________________________________________ 91
4.1.1 The Use of Vertebrae _________________________________________________________ 91
4.1.2 HBO Protocol _______________________________________________________________ 92
4.1.3 Analysis Methods ____________________________________________________________ 95

viii
4.1.4 Time Points Investigated ______________________________________________________ 96
4.2) Interpretation of Results _________________________________________________ 97
Bibliography…………………………………………………………………..105

ix
LIST OF TABLES
Table 2.1: Micro-CT Scanner Specifications....................................................... 46
Table 2.2: Calibration Values Used. ................................................................... 46
Table 3.1 Summary of Micro-CT Quantitative Parameter Results. .................. 68
Table 3.2 Summary of Micro-CT Qualitative Parameter Results. ..................... 71
Table 3.3 Summary of Bone Architecture Parameters. .................................... 74
Table 4.1 Commonly Used Laboratory Protocols of HBO. ................................. 93
Table 4.2 Different Clinical Protocols Used for the Delivery of HBO. .................. 94

x
LIST OF FIGURES
Figure 2.1: Experiment’s Flow Diagram. ............................................................. 39
Figure 2.2: HBO Chamber. ................................................................................. 42
Figure 2.3: Illustration of a Rabbit’s Skeleton. .................................................... 44
Figure 2.4: Region of Interest (ROI). .................................................................. 49
Figure 2.5: Final Tracing of the ROI. .................................................................. 50
Figure 2.6: Frontal and Side Views of the Isosurface of the ROI. ....................... 51
Figure 2.7: Active Bone Surface Undergoing Remodeling. ................................ 58
Figure 2.8: Active Osteoblasts and Osteoid Tissue. ........................................... 59
Figure 2.9: Quiescent Bone Surface. .................................................................. 60
Figure 2.10: Osteoclasts in Howship Lacunae.................................................... 62
Figure 3.1: Endplate of the Vertebral Body (ROI). .............................................. 67
Figure 3.2: Histograms of Total Volume & Bone Volume. ................................. 69
Figure 3.3 Bone and Tissue Mineral Contents of the Bone Voxels. ................ 70
Figure 3.4: Bone and Tissue Mineral Density Values. ........................................ 72
Figure 3.5: Bone Volume Fraction of Both Groups. ............................................ 73
Figure 3.6: Surface Area and Trabecular Thickness for Both Groups. ............... 75
Figure 3.7: Histogram of the Structure Model Index of the Groups. .................... 76
Figure 3.8: General Zones Seen in Both Groups (low magnification). ................ 81
Figure 3.9: Different Zones within the Epiphyseal Growth Plate Area. ............... 82
Figure 3.10: Osteoclasts Resorbing Bone in Cutting Cones. .............................. 83
Figure 3.11: Mature Bone Showing Osteocytes in their Lacunae. ...................... 84
Figure 3.12: Blood Vessels Appearing Similar in Thickness in Both Groups. ..... 85
xi
Figure 3.13: ALP Stained Slides from Both Groups (low power, 4X). ................. 87
Figure 3.14: ALP Stained Slides from Both Groups (higher power, 10X). .......... 88
Figure 3.15: TRAP Stained Samples from Both Groups (low power, 10X). ........ 89
Figure 3.16: TRAP Stained Samples from Both Groups )magnified osteoclasts)90

1
1) INTRODUCTION
1.1) Hyperbaric Oxygen Therapy
1.1.1) Definition and History
Hyperbaric oxygen (HBO) therapy is defined as the process by which a patient
breathes 100% oxygen under a pressure that is greater than 1 atmosphere absolute
(ATA).1 In order for this treatment to be delivered to the patient, monoplace and
multiplace chambers are used. Monoplace chambers, as the name indicates, can fit a
single person at a time. They resemble tanning beds but the walls are made of clear
acrylic material. These walls allow the physician to observe the patient during the
delivery of the treatment session. It is also beneficial for the patients; they can watch
TV, for example, through the clear acrylic wall for the whole length of the treatment
session. Multiplace chambers, on the other hand, are larger and can accommodate
more than one person along with a trainer who gives the treatment instructions to be
followed. Oxygen can be delivered via facemasks, nasal hoods, or endotracheal tubes.
For safety purposes, all the personal possessions are left outside the treatment
chamber as some of the personal contents might contain flammable materials.2,3
From a historical perspective, the first hyperbaric chamber “domicilium” was
designed in Britain in 1662.4 It was built by a British clergyman, Henshaw. It used
compressed air as oxygen was not discovered yet. In 1775, Joseph Priestly discovered
oxygen but he called it “dephlogisticated air”. It was given the name of “oxygen”
however, by the French chemist Antoine Lavoisier, who lived after Priestly. In 1928, the
steel bell hospital or “hyperbaric hotel” was invented. It was a six-floor hospital with 72
luxurious rooms. It was eventually closed down because of the lack of evidence

2
supporting the use of HBO treatment (HBOT) to treat some of the medical conditions
such as cancer or diabetes.2,4 In 1937, the first medical application of HBOT was
achieved. It was for the treatment of decompression sickness.5 Boyle’s law can explain
the mechanism of action in this context (see below). Some cardiac surgeries in the
1950s were performed in operating rooms that were designed as a large multiplace
chamber. Those are no longer in use due to their high costs and because of the
invention of recent ventilators which deliver enough oxygen during surgery.2,4
1.1.2) Physiology of HBO
Boyle’s law states that at constant temperature for a fixed mass, the absolute
pressure and the volume of a gas are inversely proportional. The law can also be stated
in a slightly different manner, that the product of absolute pressure and volume is
always constant. It describes the inversely proportional relationship between the
absolute pressure and volume of a gas, if the temperature is kept constant within a
closed system. This explains the mechanism of action by which HBOT can be used to
treat decompression sickness (DCS) and cerebral arterial gas emboli (CAGE). The
increased pressure affects gas emboli in the circulation, inversely resulting in minimizing
the size of the gas emboli. Now the size of the gas embolus is small enough so that it
can be exchanged on the alveolar side. The patient can breathe it out as a next step.2,4,6
To fully understand the physiology of HBO, it should studied it from two aspects.
The first aspect discusses the blood-oxygen saturation and the second aspect
discusses the oxygen pressure which further affects the saturation of blood with oxygen.
The room air that we breathe contains 21% oxygen, 79% nitrogen, and 0.04% carbon
dioxide at sea level. This results in saturation of 97% of the haemoglobin, and 3% of the

3
plasma, with oxygen. After air enters the alveoli, it diffuses through the alveolar wall,
then through the interstitium to the blood vessel wall (into the alveolar capillaries) to
enter the blood stream. The pressure gradient controls this diffusion process from the
alveoli to the blood. The partial pressure of oxygen in the alveoli (PAO2) equals 104
mmHg. On the other hand, the partial oxygen pressure in the arteries (PaO2) equals 90
mmHg. So the oxygen will diffuse from the alveolar side to the arterial side and then will
be carried to the heart which in turn pumps it to the rest of the body. The oxygen
dissociation curve governs the release of oxygen as it reaches the tissue side.7,8
Evaluation of the same figure from a pressure stand point needs important laws
to be explained first. The air pressure at sea level is defined as 1 atmosphere absolute
(ATA). This is equivalent to 760 mmHg. This value is calculated using “Dalton’s law”
which states that “the total pressure exerted by a gaseous mixture equals the sum of
the “partial pressures” of the different gases in the mixture”. According to this law, the
oxygen partial pressure in the room air (PO2) equals 160 mmHg, at sea level, through
the following formula:
(PO2 = 760 (mmHg) * 21/100 = 160 mmHg).
Another important law here is “Henry’s law”. It states that “At a constant
temperature, the amount of a given gas dissolved in a given type and volume of liquid is
directly proportional to the partial pressure of that gas in equilibrium with that liquid”. It is
represented by the following formula:
(Gas concentration = gas partial pressure * solubility coefficient).
Oxygen is the example of the gas in this case. The plasma represents the
fluid. And the coefficient is directly proportional to the body temperature.

4
Hyperbaric oxygen therapy increases the hemoglobin saturation with oxygen
from 97% to 100%, but this is not the main reason why HBO works. HBOT also
increases the plasma saturation with oxygen. This increase was found to be directly
proportional to the increase in oxygen pressure being inspired. By applying the
previously explained laws to the air that we breathe (contains 21% O2), it was
concluded that at 1 ATA, the amount of dissolved oxygen in 100 milliliters (ml) of
plasma equals 0.449 ml. In the HBO case, when breathing 100% oxygen at 1 ATA, the
O2 concentration increases to 1.5ml to every 100ml of plasma. And when the pressure
is increased to 3 ATA, it was found that the amount of dissolved oxygen increases to
6.422 ml for every 100 ml of plasma.7-9 In other words, atmospheric air- 21% O2 and 1
ATA- has an arterial oxygen tension of 100 mmHg and tissue oxygen tension of 55
mmHg; oxygen is delivered at 3 ml per liter of blood under this condition.10 When
breathing 100% oxygen, the arterial oxygen tension is raised 6 fold when under 1 ATA,
14 fold under 2 ATA, and 22 fold when under 3 ATA. This raises the tissue oxygen
tension to a maximum of 500 mmHg, at 3 ATA, and increases the oxygen delivery to up
to 60 ml per liter of blood. This is enough to meet the basic metabolic tissue needs of
reparative tissues in the human body without the contribution of hemoglobin.4,7,11,12 This
represents the main path of the mechanism of action of HBOT. Studies showed that
ATA between 2.0 to 2.5 and up to 2.8 (in case of treating decompression sickness) was
found to be beneficial for bone formation if applied for 90-120 minutes per day.7,9,13-18
Pressures higher than 3 ATA have higher rates of side effects from HBOT (explained
below). Increasing oxygen tension in the blood was found to cause vasoconstriction.19
However, the beneficial increase of oxygen pressure, above 2 ATA but below 3 ATA,
5
was also found to increase the oxygen diffusion and penetration into the tissues 10-15
fold.4 The net result was an increase in the oxygen concentration of the tissues.
Ischemic areas benefit substantially from this increase in the concentration.4 The
increased oxygenation of different tissues has been shown to have several effects.
These effects include the following:
I) Effects of HBO on Inflammatory Cells
Hypoxia has been shown to trigger macrophage chemotaxis and the release of
macrophage derived angiogenic and growth factors. According to Knighton et al, the
macrophage needs a minimum oxygen gradient of 20 mmHg of oxygen per cm for
chemotaxis and secretion of the angiogenic factor. In irradiated tissues, this gradient is
missing. The role of HBO is to magnify the gradient for those factors to be secreted. As
a result of the study, he concluded that the oxygen gradient created by the application
of HBO has been shown to stimulate macrophages to secrete macrophage-derived
angiogenesis factor (MDAF) and macrophage-derived growth factor (MDGF). In the
same study, he found that HBO not only increases the chemotaxis of macrophages but
it also increases its killing ability through the enhancement of its oxidative killing that is
considered to be an oxygen- dependent mechanism.20,21
II) Effects of HBO on Bacteria and Antibiotic Efficiency
Studies had shown that HBO has a direct effect on obligate anerobic bacterial
species.22-24 This is beneficial in the treatment of infections caused partially or totally by
those anaerobes. For example, HBOT plays an integral role in the treatment protocol of
necrotizing fasciitis and osteomyelitis. It has also been shown to inactivate and inhibit
clostridial toxins, the causative agent of gas gangrene. Not only that, but it has been

6
shown to increase the penetration and action of antibiotics. For example, HBOT has
been shown to enhance aminoglycosides (antibiotic that works by inhibiting bacterial
protein synthesis, e.g. tobramycin) activity. Recent research has demonstrated a
prolonged post-antibiotic effect, when HBOT was combined with tobramycin against
Pseudomonas aeruginosa.6
III) Effects of HBO on Tissue Reparative Cells
Collagen synthesis is considered an essential element in wound healing. Oxygen
is essential in the process of collagen synthesis. It controls the hydroxylation of proline
and lysine during the collagen synthesis process. In the absence of oxygen, collagen
synthesis cannot take place. HBOT has been shown to influence this process positively
with an oxygen partial pressure of 150mmHg being the optimum level.4,6 Not only that,
but HBOT has been shown to influence cellular proliferation positively as the process is
oxygen- dependent. According to Broussard et al, fibroblasts cannot proliferate in tissue
cultures in the absence of oxygen.25
HBOT effect on bone tissue has been heavily investigated and reported in the
literature. Basset et al demonstrated that cultures of multi-potent mesenchymal cells
can differentiate into bone or cartilage depending on the oxygen tension. At increased
oxygen tension with compression, there was an enhancement of bone formation,
whereas reduced oxygen tensions produced cartilaginous cells and tissues.26 These
mesenchymal cells are found within the perivascular zone. Trueta et al demonstrated
that pericytes from blood vessels act as osteoprogenitor cells. These pericytes are
considered undifferentiated mesenchymal cells which have the capacity to differentiate
into various connective tissue forming cell types, including bone forming osteoblasts.27
7
According to Hulth et al, vascularity is essential in the healing of all tissues except for
cartilage.28 Jan et al showed enhanced healing of supra-critical sized defects with
HBOT even in the absence of bone grafts or bone substitutes.8,29 Muhonen et al
investigated the effect of HBOT on the osteoblastic activity and angiogenesis in both
irradiated and non-irradiated rabbit model subjected to mandibular distraction
osteogenesis (DO) procedure. DO is used to surgically elongate bone. They found that
HBO increased the osteoblastic activity in the irradiated rabbit model but not to the
same level as in the non-irradiated controls.15,16,18,30
IV) Effects of HBO on Angiogenesis
Marx et al demonstrated a positive effect of HBOT on angiogenesis. They
showed an eight to nine fold increase in the vascular density in the HBO group
compared to the NBO group in the irradiated rabbit model. They concluded that oxygen
can be considered a drug that requires pressure to generate its therapeutic effects.9
HBOT may stimulate angiogenesis through its effects on vascular endothelial growth
factor (VEGF). Fok et al showed that HBOT increased the levels of VEGF in calvarial
defects in rabbits at the 6 week time point. Other studies have shown that the regulation
of VEGF appears to be mediated by oxygen tension in a healing wound. An increase in
the oxygen tension results in an increase in the VEGF levels.31 This in turn increases
the angiogenesis process and improves the healing process.32-34 Muhonen et al found
that the angiogenic response was markedly increased by the application of HBO in the
experiments explained in the previous section of this thesis.15,16,18,30
We can summarize the mechanism of action of HBO that was discussed in the
previous sections into the following points:

8
Improved chemotactic ability of the inflammatory cells.20,21
Promotion of the killing and phagocytic ability of different inflammatory cells.20,21
Enhancement of macrophages as they secrete their macrophage-derived growth
factor (MDGF) as well as the angiogenic factor (MDAF). This promotes the
angiogenesis process.20,21
Improves antibiotic penetration into the tissues.21
Direct toxic effects on anaerobic bacteria.22-24
Inactivation of clostridium toxins.6
Promotion of fibroblast proliferation.4,25
Enhancement of collagen synthesis and cross linking.4,10
Direct promotion of angiogenesis.9
Promotion of vascular endothelial growth factor (VEGF) function. This further
promotes angiogenesis.31-34
Enhancement of osteoblastic function.15-18,30,35
Promotion and enhancement of bone formation versus cartilage formation.8,26,29,36
1.1.3) Treatment Protocols
There are many protocols reported in the literature. No single protocol has
achieved sole use status. The protocol suggested by Marx in 1990 is an example of a
clinical protocol used as an aid in the dental extraction cases in previously irradiated
patients’ mandibles.9 One treatment session in the chamber is called a “dive”. Some of
the clinical protocols used to treat different medical and surgical problems are as
follows:

9
100% oxygen, under 2.5 ATA, for 90 minutes per dive, 20 dives pre-operatively and
another 10 dives post-operatively. This was done to facilitate implant placement in a
previously irradiated mandible. The treatment was successful. The same protocol
was used in another case for the placement of an ear implant following surgical
resection of squamous cell carcinoma.6 The same protocol is used at Toronto
General Hospital for minor oral surgical procedures.4
100% oxygen for 90 minutes/dive, a total of 26 dives to rescue a split thickness graft
obtained from the thigh to reconstruct the temporal area. There was also a
vascularized trapezius flap under the graft placed in the same surgery to provide
bulk and to serve as a vascular bed. This combination was failing but when the
patient received HBOT it eventually survived. The pressure was not specified by the
author. The HBOT were applied in a twice per day fashion for the first two days to
salvage the compromised flap/graft area.6
100% oxygen, under 2.5 ATA, for 90 minutes/dive, a total of 30 dives for the full
treatment course. This was the protocol used to treat a cellulitis of the skin overlying
the 5th toe with concomitant osteomyelitis in the underlying bone. Intravenous
antibiotics were used initially, but the ulcer persisted. No surgical intervention was
done to this case. Complete healing with HBOT combined with oral antibiotics was
achieved in 2 months (2 weeks post cessation of HBOT).6
100% oxygen, under 2.0 ATA, for 90 minutes/dive, a total of 50 treatment dives. This
was the protocol used for the treatment of a chronic arterial ulcer of the ankle. The
ulcer was deep enough to expose bone. The patient was treated initially with i.v.
antibiotics and a soft tissue graft that failed eventually. HBOT was started four

10
months post- grafting. Granulation tissue was seen at the end of the 50 dives
indicating positive response to the treatment.6
Osteoradionecrosis cases are treated in Miami following a protocol suggested by Dr.
Robert Marx. This protocol has 3 stages. HBOT is delivered as 100% oxygen under
2.4 ATA, for 90 minute/dive. This is done for 30 dives pre-operatively and 10 dives
post-operatively. The first ORN stage might not involve surgical intervention at all.
But the same length was followed pre- and post- assessment of the affected area.
Surgical intervention and continuation of HBOT are based on the local response of
the affected area to the treatment delivered.37 The same protocol is used at Toronto
General Hospital for major oral surgical procedures.4
When a patient attends his/her dive, their medical history and physical exam are
checked and vital signs recorded. The blood-glucose level has to be at a minimum level
of 100mg/dl as this value decreases during the treatment session. The patient will be
asked to put on a 100% cotton gown and leave personal items outside the treatment
chamber. Pressurization of the chamber is done gradually to avoid complications
mentioned in subsequent sections. Once the intended pressure is attained, then the
patient stays in the chamber for the duration as determined by the protocol used. Upon
completion of the treatment, depressurization is done gradually. Pressurization and
depressurization processes take 10 minutes each. After completion of the treatment, the
patient should undergo a quick physical exam (post-dive exam) to make sure that
he/she survived the treatment session well without complications. Post-dive vital signs
should be recorded as well.2
11
1.1.4) Indications for HBO Use
The Undersea Hyperbaric Medical Society (UHMS) approved the use of HBO
under several conditions. HBO use for these situations is evidence-based with literature
showing significant results in the treatment outcomes. 25,38 These indications are as
follow:
Air or gas embolism.
Carbon monoxide poisoning with or without cyanide poisoning.
Clostridial myositis and myonecrosis (gas gangrene).
Crush injury, compartment syndrome and other acute ischemias.
Decompression illness (the bends).
Enhancement of healing in selected problem wounds (diabetic foot ulcers).
Exceptional anemia.
Intracranial abscess.
Necrotizing soft tissue infections (includes necrotizing fasciitis and brown recluse
spider bites).
Refractory osteomyelitis.
Delayed radiation injury (soft tissue and bony necrosis).
Failed or failing skin grafts and flaps.
Thermal burns.
Beyond these conditions, the use of HBOT has been studied for the treatment of
acquired immunodeficiency syndrome (AIDS), multiple sclerosis (MS), infectious
mononucleosis myocardial infarction, and many other conditions.25,38

12
1.1.5) Contraindications and Side Effects of HBO Use
Contraindications can be divided into absolute and relative contraindications. A
complete history and physical examination is a must for every patient indicated for HBO
treatment to rule out any contraindication to treatment. These are as follows:
I) Absolute Contraindications
Untreated pneumothorax. The increase in pressure during HBOT dives will
exacerbate the existing pneumothorax. In fact, it might transform it into tension
pneumothorax which will be life-threatening. Hence, those patients are absolutely
contraindicated for HBOT until they receive full treatment with intercostal chest
tubes.2
Previous treatment with certain chemotherapeutic agents such as Bleomycin or
Adriamycin. Animal studies showed a mortality rate of 87% when HBOT was
combined with adriamycin in rats.2,6
Current treatment with Cis-platinum (chemotherapeutic agent). Cis-platinum is useful
in the control of a number of cancers because it interferes with DNA synthesis and
causes subsequent delays in fibroblast production and collagen synthesis. The
wound breaking strength was found to be low in patients who had Cis-platinum/HBO
combination. Cis-platinum should be discontinued at least 1 week prior to HBOT.2,6
Current treatment with Antabuse (anti-alcoholic agent). Antabuse was found to
decrease the body’s superoxide dismutase levels. The superoxide dismutase system
constitutes the body’s main defence mechanism against oxygen toxicity. Patients
who require serial HBOT dives should stop the use of Antabuse at least 1 week prior
to the initiation of HBOT dives.2,6
13
Current use of Sulfamylon (antibacterial cream). Sulfamylon was found to be useful in
burn patients. It exerts its action by vasodilating peripheral vessels. Keeping in mind
the cerebral vasospasms caused by HBOT, a synergistic detrimental effect occurs
when this effect is combined with the action of Sulfamylon. All of the cream should be
removed by tubbing prior to HBOT. Silver Sulfadiazene is an effective substitute and
is compatible with HBOT.6
Traditional pacemakers which are not designed to tolerate pressure. Pressurization
during HBOT dives might result in damage to those devices.2,6
II) Relative Contraindications
History of spontaneous pneumothorax. Chest x-rays prior to therapy are required. A
prophylactic chest tube insertion is needed if the patient elects to proceed with the
therapy.2,6
Upper respiratory tract infection (URTI). Concomitant HBOT might result in ear
barotraumas or sinus squeeze.2,6
Chronic sinusitis. Those patients will encounter difficulty clearing their ears during
treatment. This can be overcome by the use of myringotomy tubes during the
treatment session.2,6
Severe chronic obstructive pulmonary disease (COPD) or emphysema. Those
patients might have emphysematous bullae or blebs on the lung surface. These
blebs represent weak areas within the lung wall that might rupture under
pressurization during HBOT dive.2,6

14
Severe congestive heart failure. These patients can have their heart failure worsened
during treatment sessions. To avoid this complication, patients with an ejection
fraction of less than 35% are not typically treated with HBOT.12
Seizure disorder. There is a possibility of seizure attacks as a result of cerebral
vasospasm due to the effect of oxygen on cerebral vasculature.2,6
High fever (above 1000F). This might also lead to seizure attacks.2,6
III) Complications of HBO Use
HBOT is generally a safe treatment if contraindicated patients are avoided, and
oxygen pressures do not exceed 3 ATA, and the treatment time does not exceed 120
minutes. However, some rare complications related to hyperoxia and increased
pressure can occur. These include:
Ear barotrauma.2,6 This represents the commonest side effect. It accounts for 52
cases in every 10,000 patients treated with HBOT. It can be prevented by proper
patient education (the patients have to know how to clear their ears during
treatment dives).39
Sinus discomfort. This is due to increased pressure inside the maxillary sinuses.2,6
Temporary myopia (near-sightedness).2,6 It is the result of reversible lens
deformation due to the high pressure in the hyperbaric chamber. This usually
resolves within two months after completion of the treatment.3,40
Dental pain (tooth ache). It happens if there is an undermined filling where
pressurized oxygen is entrapped under the filling, causing pain.2,6
Claustrophobia. This applies to the monoplace chambers. Patient can be
premedicated with benzodiazepines to overcome this problem.2,6

15
Precipitation of seizures.2,6 This happens with breathing 100% oxygen at higher
than 3 ATA. It was found that this decreases the brain perfusion- due to
vasospasm- by 25% which leads to neurotoxic effects resulting in seizure
episodes.40 This is a rare complication (1 in 10,000). To overcome this complication,
a recommendation by Leach et al was made to allow for the patient to breathe
normal air in the chamber for 5 minutes for every 30 minutes of HBO treatment.
Hendricks et al reported tracheal irritation after 6 hours of hyperoxia. This might
progress to severe chest pain and dyspnea (shortness of breath).41
A single exposure to HBO has been shown to increase both the level of DNA
damage and superoxide anion production in lymphocytes.42
HBOT has been investigated heavily in the literature. Some studies showed its
beneficial use. Other studies failed to demonstrate added benefits from its use. On the
other hand, there are studies reported in the literature that showed adverse effects and
did not support its use as a treatment modality or adjunct. These studies will be
discussed in the third part of this introduction.
16
1.2) Bone
1.2.1) Definition and Composition
Bone is a highly specialized form of connective tissue that offers support and
protection to the internal organs. It forms the basic unit of the human skeletal system. It
performs several vital functions that can be classified into three categories: mechanical,
synthetic, and metabolic. Mechanical functions include protection, shape formation, aid
in movement, and sound transduction. Synthetic function occurs in the process of
“Haematopoiesis” as the bone marrow contains hematopoietic stem cells. These cells
are responsible for the production of all blood cell types. In terms of metabolic functions,
bone tissue represents the main mineral storage of calcium and phosphate in the form
of “Hydroxyapatite”. Fatty marrow offers a fat storage function as well. Acid-Base
balance forms another metabolic function of bone as it is considered a buffering system
to the blood against excessive pH changes by absorbing or releasing alkaline salts.43,44
Bone is composed of inorganic components as well as organic contents. The
inorganic part constitutes 67% of the total bone volume in the form of hydroxyapatite
crystals (HA crystals), with a chemical formula of Ca5(PO4)3(OH). The organic content
represents the remaining 33% of its volume.43,44 This 33% can be further subdivided
into 28% as type I collagen and 5% in the form of proteoglycans and numerous non-
collagenous proteins. Non-collagenous proteins, synthesized by bone cells, include
bone sialoprotein (BSP-II),45 osteopontin (BSP-I),46 osteocalcin,47 osteogenin,48,49
osteonectin “SPARC”,50 fibronectin,51 thrombospondin,52 in addition to biglycan and
decorin.53 Bone also contains lipids and other proteins such as the bone morphogenetic
protein superfamily (BMP).54-56 These lipids and growth factors are involved in
17
regulating the various bone cells discussed below. This unique composition gives bone
tissues a high compressive but low tensile strength. The bony skeleton is essentially
brittle; however, it has an inherent degree of elasticity owing to the type I collagen
content.43,44
1.2.2) Classification of Bone
Bone can be classified in many ways. The classification systems used were
based on the assessment methods as follows:43
I) Based on Gross Appearance
Long bones- which include bones of the axial skeleton. Namely, tibia, femur, radius,
humerus, ulna. Vertebral bones fall under this category as well.
Flat bones: those include all skull bones, sternum, scapula, and the pelvis.
II) Based on Maturity (and Matrix Arrangement)
Immature bone (primary bone tissue), also called woven bone, where osteocytes are
large and randomly oriented through randomly arranged collagen fibers, this
eventually will be replaced by lamellar bone as bone matures.
Mature bone (secondary bone tissue): described as lamellar bone. Collagen fibers
assume a parallel array or pattern (trabecular bone) or concentric around Haversian
canals (cortical bone) while osteocytes become smaller in size and more organized in
comparison to non-mature bone osteocytes.
III) Based on Developmental Origin
Intramembranous bone (Mesenchymal bone): Where bone forms from direct
transformation of condensed mesenchymal tissue.

18
Intracartilaginous bone (Endochondral bone): Bone forms by replacing a prior-formed
cartilage model.
IV) Based on Layer Characteristics (Texture of Cross Section)
Cortical bone (dense, compact bone): outer dense sheet of bone.
Trabecular bone (cancellous, spongy bone): inner reticular network of bone.
Trabeculae tend to be oriented along the lines of stress.
Bone marrow: further sub-classified into red and yellow marrow. Red marrow is
young and full of haematopoietic stem cells while yellow marrow represents an older
fatty marrow, not rich in stem cells.
1.2.3) Bone Histology
I) General
Histologically, mature adult bone, whether cortical or trabecular, is identical in that it
consists of microscopic layers or “lamellae”. Those lamellae are more closely packed in
the case of cortical bone. Three types of lamellae are seen in the cortical bone:
circumferential, concentric, and interstitial. Circumferential lamellae enclose the entire
bone tissue, forming its outer perimeter. Concentric lamellae, on the other hand, make
up the bulk of the cortical bone in the form of the basic metabolic unit of bone, the
osteon. The osteon, also called “the Haversian system”, is a cylinder of bone oriented
along the long axis of the bone tissue. It contains the “Haversian canal” in its center.
Interstitial lamellae are found in between concentric lamellae. They represent remnants
left after the resorption of those lamellae during modelling and remodeling processes.43

19
Haversian canals are lined by a single layer of osteoblasts. They also contain a
capillary in their centers. Haversian canals are interconnected (side to side) by the so-
called “Volkmann canals”. Those canals have the same histology of the Haversian
canals but they have different orientation. They are oriented perpendicular to the long
axis of the bone tissue. Complete osteons and Haversian canals are both absent in the
trabecular bone. This is because trabeculae are thin enough for the nutrients to diffuse
through them.43
The periosteum, another important tissue in bone histology, is a form of connective
tissue which consists of two layers: the inner layer, also called the “cambium layer”, and
the outer fibrous layer. The cambium layer is found next to the bone surface; i t is a
highly cellular layer as it contains osteoblasts and osteoprogenitor cells. It is also a very
well-vascularised layer rich in blood vessels. This forms a major source of the blood
supply to the bone as well as bone-forming cells or “osteocompetent cells”. The
cambium layer loses cellularity and osteogenic potential as it ages. The fibrous outer
layer, as the name suggests, is comprised mostly of fibrous tissue with fewer cells. It
gives rise to Sharpey’s fibers, which represent another form of connective tissue that
penetrates the inner layer to attach to the circumferential lamellae. Its main function is to
keep the intimate relationship between the periosteum and the bone surface. This in
turn ensures sufficient blood supply and cellular availability for turnover and healing
purposes. Endosteum is the inner counterpart of periosteum. It is a single layer of bone
cells (osteoblasts and osteoprogenitor cells) that lines the internal surface of cortical
bone and covers the entire surface of trabecular bone separating them from the bone
marrow.43

20
II) Bone Cells
Bone is very cellular. The majority of cells are part of the osteogenic or
osteoclastic lineage. This section will discuss the different types of cells found in the
bone tissue or which are functionally related to it.57
A) Osteogenic Cells
I) Mesenchymal Cells and Osteoprogenitor Cells
Mesenchymal cells are “stem cells” (MSC) that are able to differentiate into a variety
of connective tissue- forming cells. They are located within the perivascular area. They
can be located at the periosteum, endosteum, marrow stroma, and perivascular. They
can literally differentiate into “any” cell type depending on the needs and the tissue they
invade.58 Osteoprogenitor cells are defined as precursors of a certain cell lineage:
namely, osteoblasts and chondroblasts.59 Osteoprogenitor cells are the result of
mesenchymal cell differentiation within the bone tissue. These in turn differentiate into
osteoblasts or chondroblasts, depending on the surrounding environment.58,59
Osteoprogenitor cells are spindle-shaped cells with elongated nuclei. They reside in
close proximity to the pre-osteoblast layer.60,61
II) Pre-osteoblasts
Osteoprogenitor cells proliferate and then differentiate into preosteoblasts. These
cells are anatomically close to osteoblasts. However, they are not capable of the
production of bone matrix. They reside away from the bone surface, leaving that spot to
osteoblasts. These cells have a greater ability to proliferate than bone-forming
osteoblasts.57,59 Further maturation of the preosteoblasts is required to give rise to the
mature osteoblasts, which synthesize and lay down osteoid.60,61

21
III) Osteoblasts
These are the primary bone forming cells. They are derived from pre-osteoblasts.
They are located next to the bone surface onto which they lay down a collagenous bone
matrix known as osteoid tissue.57,59 These cells are polygonal in shape, mono-
nucleated, with a highly basophilic cytoplasm. They have abundant rough endoplasmic
reticulum (rER), prominent Golgi apparatus and numerous mitochondria. These
contents account for the basophilic appearance of the cytoplasm of these cells. They
also serve as indicators, along with the eccentric, dark-staining nuclei, of the active
secretory nature of these cells. They are usually found on top of the unmineralized
osteoid that they produced.57,59
HA crystals form and grow in this matrix later on.62,63 They are also characterized by
their ability to produce membrane-associated alkaline phosphatase enzyme (ALP) as
well as various matrix proteins. They are responsive to different hormones (e.g.
parathyroid hormone, PTH; and glucocorticoids) and growth factors (e.g. bone
morphogenic protein, BMP; basic fibroblast growth factor, bFGF; insulin- like growth
factors, IGF; platelet-derived growth factor, PDGF; and vascular endothelial growth
factor, VEGF).31,64-67 These factors play a key role in the formation of bone matrix and
its subsequent mineralization.68-71
ALP is believed to cleave organically bound phosphate. It also stimulates the
initiation and progression of mineralization. As the bone matrix secretion and
mineralization process proceeds, these cells become encased in lacunae becoming the
so- called “osteocytes”. Osteoblasts remaining on the surface undergo morphologic

22
change after the bone formation process is completed and they are then known as
“bone lining cells” at that stage (see below).43
Although osteoblasts are mainly bone-forming cells, they also mediate osteoclastic
resorption via secretion of Receptor Activator of Nuclear factor Kappa-B Ligand
(RANKL); Osteoprotegerin (OPG); and other cytokines under the influence of certain
growth factors and hormones.72,73 The response of osteoblasts to Parathyroid Hormone
(PTH) is one example of this influence. It is known that PTH is biphasic in its action.
Although at low doses it promotes bone formation (the physiologic effect), it induces
osteoblast-mediated osteoclastic bone resorption at higher doses (pathologic effect).43
IV) Osteocytes
As mentioned above, when osteoblasts become entrapped in matrix-lacunae, then
they are called osteocytes. At their early stages following entrapment, they resemble
osteoblastic cells in their histologic appearance (i.e. large nucleus, prominent nucleolus,
and numerous cytoplasmic components).74 However, they lose the ability to synthesize
osteoid tissue. Osteocytes are still connected to each other, and to osteoblasts and to
bone-lining cells via cytoplasmic processes. Those processes are found within small
tunnels called “canaliculi”.75,76 This cell population is the most dominant type in bone
tissue.77-80 Their numbers are indicative of the rate of bone formation where higher
numbers are seen in areas of high bone formation. They are thought to play a major
role in the maintenance of bone tissue through their canalicular inter-connection
“lacuna-canalicular system”.43

23
V) Bone Lining Cells
When osteoblasts finish the task of synthesizing bone matrix, they become flattened
in shape. Their nuclei become elongated. Their cytoplasm becomes less basophilic.
They are generally called “bone lining cells”, “inactive osteoblasts”, or “resting
osteoblasts” at this stage.43,57 They are found to line the surfaces of “quiescent bone”.
Quiescent bone is defined as bone tissue that is not undergoing active remodeling.81
They are part of the lacuna-canalicular system as mentioned above. Although these
cells are post-proliferative, it has been proposed that they can be reactivated to become
bone-forming osteoblasts in response to PTH.82 When this happens, the cells swell in
size and their nuclei look larger than usual, compared to non- stimulated lining cells.
B) Osteoclasts and Osteoclast Precursors
Osteoclasts are the cells responsible for bone resorption. They are multinucleated
cells derived from haematopoietic stem cells of monocyte-macrophage lineage.
Osteoclasts precursors are recruited from the bone marrow and can travel via the
circulatory system to distant sites from bone marrow.83-86 Once at the site of action (i.e.
bone surface to be resorbed), these precursors start to proliferate. The resultant cells
fuse together to form larger, multinucleated cells (i.e. osteoclasts). Their cytoplasm is
rich in rough endoplasmic reticulum (RER), ribosomes, and large cytoplasmic vacuoles.
The cells form “ruffled borders” next to the bone to be resorbed.43,87 The level of the
multinucleation is an indicator of their level of activity. The overall number of cells is an
indicator of the overall activity in the resorption front.43
Once activated, osteoclasts are found residing in the so called “Howship lacunae”.
Those are shallow crater-like depressions found on the surface of bone to be

24
resorbed.43,88 A tight seal is created between the ruffled border and the bone surface.
The cells now secrete their lysosomal acid hydrolase enzymes (e.g. cysteine proteinase
cathepsin K) in this isolated environment created by the seal.89 Osteoclasts secrete
carbonic anhydrase enzyme through their ruffled borders. This enzyme, along with the
lysosomal enzymes, is required for the conversion of the metabolically released carbon
dioxide into carbonic acid.90 The collective action of different osteoclasts, deepening
their Howships’ lacunae, results in the generation of “cutting cones” and large resorptive
cavities.43,91
Osteoclasts can be identified by the tartrate-resistant acid phosphatase stain
(TRAP).85,86,92-96 TRAP is an iron-containing, cationic glycoprotein.97,98 TRAP is secreted
at the ruffled border and is thought to play a role in the degradation of phosphate, prior
to the degradation of the HA crystals.99,100
Receptor Activator of Nuclear factor Kappa-B (RANK, also known as TRANCE)
is a membrane protein that serves as a receptor expressed on the surface of
osteoclasts and their precursors. Osteoclasts are regulated by osteoblasts through the
interaction between RANK ligand (RANKL), expressed by the osteoblast, and the
osteoclast’s RANK receptor. It was found that osteoclastogenesis and bone resorption
were promoted when RANKL attaches to RANK receptor on osteoclast precursors and
on mature osteoclasts. Osteoblast also express osteoprotegrin (OPG) which inhibits
those processes through its interaction with RANKL preventing its attachment to RANK
receptor on those cells.72,73

25
1.2.4) Bone Formation
During embryologic bone formation, bone is formed by one of two mechanisms:
intramembranous bone formation and endochondral bone formation. Both processes
are induced in the “modeling” phase of bone formation. Modeling of bone is the initial
shaping of different parts of the bony skeleton for the first time. Remodeling of bone, on
the other hand, is the dynamic process of bone renewal and turnover throughout the life
span of the individual.43
I) Modeling of Bone
Intramembranous bone formation differs from endochondral bone formation with
regard to the type of tissue that precedes the bone tissue in the formation process. In
the case of intramembranous ossification, embryonic mesechymal tissues are replaced
directly by bone tissue, while cartilage is the intermediate tissue for the endochondral
ossification process. Another difference between the two processes is the site where
endochondral ossification takes place: in the long bones and vertebral bones. On the
other hand, intramembranous ossification happens in the flat bones.43,101
A) Intramembranous Bone Formation
The cranial vault, maxilla, body of the mandible, and mid-shaft of long bones
form via intramembranous bone formation.43,102,103 The process begins when multiple
groups of mesenchymal cells, found in loose connective tissue, condense and
differentiate into preosteoblasts and then into osteoblasts, forming a “primary
ossification center”. Osteoid tissue is then laid down and intermingled with the original
connective tissue. Subsequent mineralization of this osteoid tissue follows. Osteoblasts
get entrapped within the matrix they secrete, gradually becoming osteocytes. This

26
process occurs in each primary ossification center separately. Later in the process,
these primary ossification centers fuse, forming a loose trabecular structure known as
“primary spongiosa”. This represents immature bone. Collagen fibers are coarse,
irregular, wavy bundles, giving this bone the term “woven bone”.43,102,103 Subsequently,
blood vessels invade the connective tissue in between the trabeculae. Hematopoietic
stem cells will then give rise to the various hematopoietic cells. Those cells are brought
to the primary spongiosa via the invading blood vessels. Those cells include the
precursors for the osteoclast cell type.85,86 Growth and fusion of several ossification
centers eventually replace the original mesenchymal tissue. In flat bones, cortical bone
is formed at both the internal and external surfaces due to a marked predominance of
bone deposition over bone resorption, whereas a trabecular pattern remains in the
central portion. Osteons form in the cortical bone. Woven bone becomes replaced by
lamellar bone. The endosteum and periosteum are formed from layers of connective
tissue that are not undergoing ossification on the inner and outer aspect of the ossified
bones respectively.43,102,103
B) Endochondral Bone Formation
Endochondral ossification occurs at the epiphysis of all long bones, vertebrae,
ribs, TMJ, and the base of skull.43,104 This process takes place within a “Hyaline
cartilage model” which provides a template of the shape of the bone to be formed.
During embryonic development, mesenchymal cells form a condensation of tissue that
takes the shape of the bone to be formed. Those cells differentiate into “chondroblasts”
(at the diaphysis), while perichondrium forms around the periphery. Chondroblasts
become entrapped in the cartilage matrix and become “chondrocytes”.43,101,102

27
Differentiation of chondrocytes proceeds towards the metaphysis. Chondrocytes
organize themselves into longitudinal columns. Those columns can be further
subdivided into three zones: the zone of proliferation, the zone of hypertrophy and
maturation, and the zone of mineralization. Chondrocytes proliferate within the first
zone. This increases the total number of cells in this zone. Those cells undergo
hypertrophy and maturatation within the subsequent zone. As the chondrocytes
hypertrophy, the matrix around them starts to mineralize (third zone) and they become
isolated from nutrients and eventually most of them die. Blood vessels are located on
the outer surface of the long bones at this stage. They are few, however. Blood vessels
penetrate the perichondium towards the center of the cartilage model. Peripheral
mesenchymal stem cells convert to osteoblasts and form a cortical rim of bone at the
periphery of the cartilage model. The perichondrium converts to periosteum due to
increased vascularity. The middle part of the model undergoes resorption under the
effect of resorbing chondroclasts (identical to osteoclasts).43,101,102 This resorption
creates more space for vascular invasion to take place.105 Perivascular mesenchymal
stem cells (MSC) are brought to the resorbed center of the model. They differentiate
into osteoblasts and deposit osteoid around the mineralized cartilage columns. The
osteoid is subsequently mineralized. Osteoblasts will become osteocytes as the bone
matrix is produced. This mineralized cartilage core-bone matrix is collectively called the
“primary spongiosa” or the “primary ossification center”. Cartilage growth is considered
the primary source of growth in these bones.43,101,102
In time, the space created by the invading vessels develops into red bone
marrow. This marrow is rich in haematopoietic stem cells. Osteoclasts resorb the

28
primary spongiosa at the same rate as the formation of cartilage. This simultaneous
formation and resorption of the primary spongiosa makes the volume of the primary
spongiosa remain relatively constant during growth.
In some bones (e.g. tibia), a secondary blood vessels invasion process occurs at
the epiphysis-the proximal and distal ends of the long bone. This creates a secondary
ossification center in the same fashion as the primary ossification center had previously
formed. The two growth centers are separated by the “epiphyseal growth plate”. This
plate grows in the same fashion as the primary spongiosa did earlier. The growth of the
secondary ossification centers further contributes to the longitudinal bone growth and
usually takes place at the time of puberty. As bone growth ceases (i.e. post-pubertal),
the epiphyseal growth plate completely hypertrophies and subsequently is replaced by
bone. This is seen as a fusion of the primary and secondary ossification centers,
indicating the end of the pubertal growth spurt. The bone-covered cartilage in the
primary spongiosa and secondary ossification centers is replaced by lamellar bone, thus
creating secondary spongiosa found throughout adult life.43,101,102
II) Bone Remodeling
Bone remodeling is a physiologic process that involves alternating osteoclast-
osteoblast action.106 It is composed of two phases: resorption of the pre-existing bone,
followed by “de novo” synthesis of new bone.107-109 Bone remodeling occurs at higher
rates in younger individuals compared to older ones. It also happens at a higher rate in
the trabecular bone compared to bone cortices. Early in life, the rate of deposition is
higher than the rate of resorption, resulting in growth. Later in life, the rates are
reversed, resulting in osteoporosis. The trigger to the bone remodeling process is

29
unknown. One of the suggested theories proposes that osteocyte apoptosis may act as
the trigger. Following cell death, osteoclasts resorb the apoptotic-cell zones.
Subsequently, vascular invasion takes place. Blood vessels bring more osteoclast
precursors to the site. Osteoclasts further resorb more bone. This results in the
generation of cutting cones (phase one).43,91 Phase two follows when the perivascular
mesenchymal stem cells differentiate into osteoblasts. That lay down osteoid that is
uncalcified. This results in filling cones. Mineralization and maturation of this osteoid
follows. “Reversal lines” are irregular lines containing concavities directed away from
the bundle bone and serving as histologic indicators that resorption has taken place up
to that line from the marrow side.43,101 Sigma time, defined as the time required for
activation, resorption, and formation of bone in a given species, differs according to the
species. According to Parfitt et al, the sigma time for human beings was found to be 18
weeks ,while for rabbits it was 6 weeks.77

30
1.3) Studies of HBO Effects on Bone:
The effects of oxygen and HBOT on bone have been investigated in the literature.
Selected investigations have demonstrated its beneficial effects. However, other studies
failed to show added benefits from HBO use. In addition, there are studies that report
adverse effects with HBOT. In the section below, the effects of oxygen and HBOT on
bone will be reviewed.
As mentioned earlier, the sum effect of breathing 100% oxygen under pressure,
ideally between 2.0 to 2.5 ATA, increases the amount of oxygen dissolved into the
plasma, thereby increasing the oxygen tension.9,14-18 This increase in the oxygen
tension was shown to increase the distance of oxygen diffusion into the tissues 10-15
fold.4 This results in increasing local tissue-oxygen concentration.110 Marx et al used a
protocol of breathing 100% oxygen at 2.4 ATA for 90 minutes/session. They subjected
previously irradiated individuals (more than 6000cGy) to 20 sessions of HBOT pre-
operatively and 10 sessions post-operative. They found that HBOT produced a state of
intermittent hyperoxia which alternated with periods of hypoxia, maintaining the stimulus
for healing.37 while excessive hypoxia prevents the healing process, the initial hypoxia
which occurs following injury is believed to initiate the healing process. The beneficial
effects of HBOT appeared when the pressure was between 2.0-3.0 ATA. On the other
hand, excessive hyperoxia, higher than 3 ATA, or continuous 2.0-3.0 ATA for longer
than 120 minutes per session, were found to have adverse effects as well (see below).
Shaw et al investigated the effects of increasing oxygen concentration on embryonic
chick tibiae. Embryonic tibial cartilages were extracted and then incubated on plasma
clots in the presence of varying oxygen concentrations for a period of two weeks.

31
Chondrogenesis was found to dominate when the oxygen level supplied to tissue
cultures was 5%. Osteoid tissue increased within cultures exposed to oxygen
concentrations of 35%. However, osteogenesis was suppressed in cultures subjected to
oxygen concentrations of 95%. The duration of the incubation was thought to be the
reason for the decreased osteogenesis seen at 95% concentration.111 However, the
effect of high oxygen concentration (95%) has been found to vary according to the
duration of the incubation. Examiners who incubated similar tissues for six hours found
the highest levels of osteoid at 95% oxygen concentration.112,113 Marx et al found that
HBOT of 100% oxygen for 30-60 minutes under 2.5 ATA was shown to enhance
fibroblast proliferation in irradiated rabbit tissue.9 However, Conconi et al reported that
fibroblasts exposed to hyperbaric oxygen (2.5 ATA) for 120 minutes in vitro, showed a
marked pro-apoptotic effect. The study also found that cultures subjected to HBOT for
durations of 30 and 60 minutes to have raised fibroblast proliferation rates while 15
minutes had no effect.114 These results suggest that the duration of HBOT may result in
a biphasic effect.
The role of oxygen in collagen synthesis is well established. Oxygen is essential in
the hydroxylation of proline and lysine during collagen synthesis. In the absence of
oxygen, collagen synthesis cannot take place.25 A partial pressure of 150 mmHg was
shown to be the optimum level for the synthesis.4 HBOT has shown a positive effect on
the cross linking of collagen.4,25
Angiogenesis is essential for bone formation and hyperoxia has shown positive
effects on angiogenesis.37 Marx et al observed increased capillary angiogenesis and
increased cellularity with HBOT in irradiated patients. However, the HBO-induced

32
angiogenesis in irradiated tissues only achieved approximately 75% to 80% of the
normal vessel density which has thought to be because vessel ingrowth, reducing the
oxygen gradient to less than 20mmHg (see below).37 Nilsson et al demonstrated an
increased number of blood vessels, measured using radioactive isotopes, with HBOT.
This increase in vascularity is thought to be one of the main mechanisms by which HBO
induces healing. It ultimately improves the local oxygen supply to injured tissues.115
Along with the blood vessels come important precursor cells. One of these precursors is
the haematopoietic stem cells population, which include precursors of osteoclasts and
macrophages. Another type is the mesenchymal stem cells population that resides
perivascularly. These undifferentiated mesenchymal stem cells can give rise to
osteoprogenitor cells.27
HBOT has been shown to promote the expression of vascular endothelial growth
factor (VEGF),27,31,66,67 macrophage-derived angiogenic factor (MDAF),20 basic
fibroblast growth factor (bFGF, also known as FGF-II).37,116 All of these are known to
stimulate angiogenesis. VEGF is a potent angiogenic factor with mitogenic effects on
endothelial cells.32-34 Vascularity is important for the healing of all the tissues in the body
except for cartilage which requires low oxygen tension during its formation. Bone, on the
other hand, requires a higher oxygen supply to form and heal.28
Bassett et al demonstrated that cultured multipotential undifferentiated
mesenchymal stem cells can differentiate into either cartilage or bone. Their fate is
governed primarily by the local oxygen tension to the cultured tissues. Cartilage formed
when the oxygen tension was low, while bone formed when the oxygen tension was
raised.26 Tuncay et al cultivated fetal rat calvarial tissues in vitro and observed a

33
proportional increase in osteogenesis with hyperoxia (90% oxygen) while decreased
osteogenesis was observed in the case of hypoxia (10% oxygen).117 Nilsson et al
demonstrated increased bone formation with HBOT in bone chambers inserted into
rabbits’ tibias.118 Sawai et al demonstrated in their rabbit model that HBOT accelerated
the rate of bone graft integration.119 Jan et al showed healing of critical- sized defects
with HBOT.8,29 The effects of HBOT on healing bones after distraction osteogenesis
(DO) had been investigated in different models. Irradiated rabbit mandibles subjected to
DO have shown increased angiogenesis and osteogenesis with HBOT.15-18,30 In a non-
irradiated rabbit model, the effect of HBOT in combination with DO on tibial bones
resulted in increased bone mineral density and torsional strength.120
All of these studies evaluated the effects of HBOT on injured, irradiated, and/or
surgical sites but they did not evaluate the effects of HBOT on tissues distant from
those sites. Aoki et al investigated the effects of breathing 12% oxygen at 2 ATA for an
extended period of time (weeks) without performing any type of surgery. They
concluded that increased pressure promoted bone mineralization.36
Studies of hyperoxia effects on inflammatory cells demonstrated an increased
chemotactic ability of macrophages. It has also been shown that the increased oxygen
tension promotes the release of macrophage-derived angiogenic and growth factors
(MDAF & MDGF respectively). Macrophages require a minimum oxygen gradient of 20
mmHg per centimeter to promote chemotaxis and secretion of the aforementioned
factors. In compromised wounds, macrophages move out of the blood and along the
oxygen gradient towards the hypoxic tissues. Once the minimum oxygen partial
pressure gradient is lost, secretion of macrophage-derived angiogenic factor (MDAF)

34
and macrophage-derived growth factor (MDGF) ceases. HBOT was shown to maintain
a higher oxygen gradient, keeping the angiogensis process ongoing until the healing is
complete.20
Groger et al compared the effect of repetitive HBOT applications on human blood
cell DNA. Undersea demolition team (UDT) divers were used as the HBO group. Their
diving practices comprise repetitive HBO exposure over a period of years. Non-divers
were used as controls. There was no difference in the incidence of blood cell DNA
damage or in antioxidant enzyme activity between the groups in vivo. Lymphocytes
were isolated from both categories and subjected to a single HBOT (98% oxygen at 4
ATA for 2h) ex vivo. The divers’ lymphocytes demonstrated significant DNA damage
and superoxide free radical production compared to the non-divers’ lymphocytes.
However, the effect was transient and disappeared completely in one hour post-
treatment. The conclusion was reported as “at least in healthy volunteers with
endurance training, long-term repetitive exposure (i.e. UDT divers) to HBO does not
modify the basal blood antioxidant capacity or the basal level of DNA strand breaks”.42
DNA damage induces apoptosis (programmed cell death). As discussed above, in the
case of osteocytes, this may stimulate bone remodeling. However, apoptosis of
osteoclasts would inhibit resorption and likewise, osteoblast death would inhibit bone
formation. Further repetitive HBOT might be a risk for cancer.121
Most studies have evaluated the effect of HBOT on injured, irradiated, or surgical
sites. None of these studies looked at the effects of HBOT on sites away from these
compromised sites. Lu et al measured the oxygen tension in mice tibiae. Fractures were
induced in one tibia and the other tibia served as the control. Oxygen tension fell in the

35
fractured tibia significantly when room air was breathed. When mice were subjected to
HBOT, the oxygen tension was found to rise significantly in both tibias (injured and
intact ones).122 This rise in the oxygen tension in intact tibia demonstrates the fact that
oxygen tension does change in sites away from injury sites. Consequently, HBOT might
have an effect on tissues away from injury sites. This study is designed to evaluate the
effect of HBOT on bone parameters in sites distant from the surgical sites.

36
1.4) Aims & Objectives of the Study:
As is evident from the preceeding review of litrature, the partial pressure of
oxygen in tissues can affect a wide range of cellular and biochemical activities and may
influence bone formation and remodeling. The oxygen effects can be summarized as
follows:
1) Higher oxygen tension promotes macrophage chemotaxis. Osteoclasts are derived
from the same cellular lineage as macrophages. Consequently increased oxygen
tension may increase the migration of osteoclasts or their precursors.
2) Increased oxygen tension promotes production of a variety of growth factors by
macrophages, osteoblasts and fibroblasts including EGF, VEGF and bFGF
3) Increased oxygen tension promotes angiogenesis. This could increase tissue
vascularity and “bring-in” more osteoclast and osteoblast precursors.
4) Increased oxygen tension can result in generation of reactive oxygen species (ROS)
which can cause DNA damage and cell death by apoptosis. Apoptosis of osteoclasts
could result in reduced bone resorption, while apoptosis of osteoblasts could reduce
bone formation. However, apoptosis of osteocytes may initiate bone resorption.
5) Oxygen is essential for collagen formation. Increased oxygen increases collagen
matrix formation, with maximal effects at levels above normal physiological levels.
Bone matrix is predominantly composed of collagen. Consequently hyperoxic
conditions may increase bone matrix production.
6) Lower oxygen tensions are associated with chondrogenic differentiation of MSCs
and cartilage formation, while increasing oxygen tension results in the same cells
undergoing osteoblastic differentiation resulting in bone rather than cartilage

37
formation. Long bone growth is associated with cartilage formation at the epiphyseal
growth plate. Consequently increased oxygen tensions may result in inhibition of
chondrogenesis and possibly premature closure of the growth plate.
It is important to realize that regardless of reason why HBO treatment is being used,
it is not only the injured area that will be exposed to changes in oxygen pressure due to
the cycles of “HBO”. Tissues throughout the entire body experience an increased
oxygen tension by as much as 3 times higher than the physiological norm.
As summarized above these hyperoxic conditions could potentially affect bone
formation and resorption in normal uninjured as well as injured bones. The aim of our
study was to determine whether uninjured bone was affected when an animal
undergoes HBO treatment.
The specific objectives of this study were to:
Evaluate the effect of HBO treatment on uninjured vertebral bone density and
structure by micro-CT analysis.
Evaluate the effect of HBO on the cells of uninjured vertebrae in situ, by histology.
Null Hypothesis:
The null hypothesis for this study is that, HBO treatment will have no effect on the
density, structure or cells of uninjured vertebrae.

38
2) MATERIALS AND METHODS
2.1) Experimental Design
The investigation reported in this thesis was undertaken as part of a larger study
examining the effect of HBO on bone following calvarial defect surgery. The results of
HBO on healing of the calvarial defects in the same rabbits has been reported by
Humber et al.123 Twenty two, skeletally mature, male New Zealand white rabbits
weighing 3.5-4.0 kg were randomly divided into two groups of eleven animals. All
animals underwent surgery to create bilateral defects in each parietal bone of the rabbit.
Following calvarial surgery the first group underwent hyperbaric oxygen
treatment (HBOT). HBO sessions started 24 hours post-operatively. Animals in the HBO
group underwent 5 sessions a week for 4 weeks. The second group served as controls
(designated as NBO in this thesis), breathing room air at 1 ATA throughout the
experiment. Six weeks post surgery all animals were euthanized.
At sacrifice, the calvarial bones were removed for analysis as part of the Humber
study and at the same time two lumbar vertebrae (L6, and L7) were dissected from the
spine of each rabbit. Each sample was given a unique identification number. The
samples were processed and analyzed blindly to limit the potential for bias.
Following fixation, the vertebrae were analyzed by micro-CT (µCT) for
quantitative bone analysis. They were then processed for histology to evaluate the
effects of HBO on the bone cells. Figure 2.1 shows the experiment’s flow diagram along
with the timeline of all the events.

39
Figure 2.1: Experiment’s Flow Diagram.
A flow diagram of the experiment’s stages along with the time line displayed at the
bottom. Day 0, represents the day when the surgery was performed. Day 1 represents
the first post-operative day. The HBO sessions started on day 1 and continued for four
weeks. Sacrifice and samples collection were performed two weeks after the cessation
of HBO treatment sessions (i.e. six weeks from the date of the surgery). Samples were
fixed in formalin. Vertebral samples were then exposed to different types of analysis;
micro-CT, histology, and histochemistry.

40
2.2) Calvarial Defect Surgery
The surgical procedures were completed in a fashion similar to that undertaken
in other published works from our group.124-126 All procedures for this investigation were
performed according to protocols approved by the University of Toronto Animal Care
and Ethics Committee (Protocol No. 20006125). Each animal was premedicated
according to their weight with an intramuscular injection of a mixture of Ketamine 35
mg/kg and Xylazine 2 mg/kg. Airway control was maintained with a paediatric size
laryngeal mask airway (LMA). A mixture of 1:1.5% Isoflurane/ N2O: Oxygen (2/3: 1: 3)
was used for maintenance of anesthesia. Anesthetic gases were delivered through a
mechanical ventilator. A pulse oximeter was used for monitoring throughout the surgical
procedure.
The scalp of each animal was shaved just prior to the surgery. The shaved areas
were then cleaned with 70% ethyl alcohol and then prepared with Povidone- Iodine
solution. Each animal was then placed prone on the operating table. The surgical sites
were then draped in a sterile fashion. A local anesthetic consisting of a mixture of 1.8 cc
of 2% Xylocaine with epinephrine (1: 100,000) was injected at the surgical incision site
for hemostasis. A 5 cm incision was made along the midline of the scalp along a point
located midway between the ears and extended 5 cm forward. The incision was made
through the skin and galeal layer and periosteum using a #15 Bard Parker blade. A
subperiosteal dissection was achieved exposing the parietal bones. An electric drill with
a #702 carbide fissure bur was used, under copious irrigation, to create bilateral full-
thickness calvarial defects. Each defect measured 15 mm in its longest diameter. The
longest diameter was positioned in an anterio-posterior direction. One defect was

41
created on either side of the midline. The most medial aspect was placed 2 mm away
from the midline. Osteotomies were carefully performed to avoid injury to the dura
matter and the superior sagittal sinus.
The appropriate bone substitutes (autogenous, or ceramic) were placed onto the
dura matter, replacing the volume of bone removed in two thirds of the samples; this
was done unilaterally (i.e. one defect only per animal). The remaining one third did not
receive any bone grafts in either defect. A resorbable liquid membrane (RLM) was
placed on top of the bone substitutes in the former two thirds while on top of the dura in
the latter one third. Closure was achieved in layers, where the pericranium was closed
with interrupted 3-0 Vicryl sutures and the skin was closed with 3-0 Vicryl sutures in
running continuous fashion. The anesthetic gas was stopped and the LMA was
removed once the animals began to breathe spontaneously. The rabbits survived the
surgery well. They went through an uneventful recovery period. Each rabbit was caged
separately and received food and water in its own cage. Each received a one-time
intramuscular injection of Buprenorphine (0.02mg/kg) on the first post-operative day.
2.3) HBO Protocol
The HBO protocol used was the same as the clinical protocol described by Marx
which is as follows:
Rabbits were subjected to 100% Oxygen (O2) under 2.4 Atmospheres Absolute
(ATA) for 90 minutes per session.9 There was one session per day, five days per week,
for a total of 4 weeks. Each rabbit was placed in a monoplace chamber (figure 2.2) and
aviator grade oxygen was slowly fed into the chamber until a pressure of 2.5ATA was

42
Figure 2.2: HBO Chamber.
Mono-place HBO chamber used in the study to deliver oxygen under pressure (2.4
ATA). It is connected to a large size oxygen aviator. The aviator was regularly checked
for fullness (Courtesy of Dr. Ahmed Jan).

43
achieved. At the end of each session the pressure in the chamber was slowly
equilibrated to normobaric levels.
Slow increase and decrease in the pressure was undertaken to ensure the
animals did not sustain injury due to rapid pressure changes. Pressurization and
depressurization were included in the 90 minute treatment period. A carbon dioxide
absorbent was placed in the chamber to absorb the exhaled carbon dioxide (CO2). This
was done to ensure that each rabbit was only breathing 100% O2 through-out the
session. The absorbent particles were replaced when the particles turned purple. Colour
changes in the particles served as an indicator of their saturation with CO2. All rabbits
tolerated the HBO sessions very well. There were no complications observed in any of
the animals in either group.
2.4) Sacrifice
All twenty two animals were sacrificed 2 weeks after the completion of the HBOT
(i.e. 6 weeks post surgery). Prior to sacrifice, each rabbit was weighed and pre-
medicated with Ketamine (35mg/kg) and Xylazine (2mg/kg). After that, the animals were
euthanized with an injection of T-61 R using 3.5mg/kg in the marginal vein of the ear.
2.5) Collection of Vertebrae
Following euthanasia manual identification of the vertebral processes was
performed and then the hair was shaved over the skin covering the spine in that region.
A number 10 Bard-Parker Blade was then used to incise the skin down to bone over the
spinous processes. The sacral vertebrae were the easiest to identify. This was due to
their unique morphology. Lumbar vertebrae are found in a cephalad position to the
sacral vertebrae.

44
Figure 2.3: Illustration of a Rabbit’s Skeleton.
Lumbosacral junction of a rabbit’s skeleton. The red arrow shows the position of L6. L7
is obscured by the sacral bone. We can see the side process only of L7 in this view (red
circle). (modified from: www.hawkerantiques.com).

45
In the case of rabbits, there are seven lumbar vertebrae. The sixth (L6) and
seventh (L7) lumbar vertebrae were evaluated in this study. L7 was obscured by the
sacral vertebrae (figure 2.3), making their collection challenging. Large bone cutters
were used to separate the portion of spine containing L6 and L7 from the remaining
spinal column. The cut edges were later used to identify the vertebrae and for
orientation within the micro-CT. The excised block of tissue incorporating L6 and L7 was
then fixed in 10% neutral buffered formalin for a minimum of three days at room
temperature before the samples were scanned by micro-CT (µCT).
2.6) Micro-CT (µCT) Analysis
2.6.1) Scanning and Reconstruction
All µCT scans were done at Sunnybrook Research Institute using an EVS micro-
CT scanner (Enhanced Vision Systems, London ON) upgraded with an Atmel Camelia
8M detector. Scans were performed using the EVS Evolver software included with the
scanner.
A fixed µCT scanning protocol was used to obtain standardized scan data. The
specifications for the scan are shown in table 2.1. The large scanning tube was used. In
order to fit the vertebral bodies into the tube, the spinous and side processes were
removed using a bone cutter. Each sample was composed of both L6, L7 and the
vertebral musculature attached to them. Stumps of the processes were left to serve as a
guide for orienting the reconstructed images of the vertebral bodies.
The bottom of the scanning tube was filled with wetted cellulose sponge so that
each specimen could be placed in a similar orientation where the intervertebral disc was
parallel to the bottom of the tube. A calibration sample was also placed in the tube with

46
each sample. The tube was then filled with tap water and the tube closed using the
plastic cover supplied by the manufacturer.
Rotation axis 360 degrees
Views 900
Frames per view 3 (average)
Field of view 34 mm
Pixel size 17 µm
Magnification 2
Amperage 90 mA
Voltage 80 kVA
Exposure time 2000 ms
Scanning time 2.5 hours / vertebra
Fluoro function used to adjust Window and Level, position height of specimen and determine
ROI coordinates. Table 2.1: Micro-CT Scanner Specifications.
Table showing different specification values of the micro-CT scanner. Those values
were used to obtain the initial scans.
Calibration
Value
Bone Water Air
22076 6336 843
Table 2.2: Calibration Values Used.
Calibration values used to reformat the initial scans into 3D reconstructed images and to
perform the bone quantitative analysis.

47
The calibration sample contains water, air, and a bone-like material (SB3). SB3
has the same radio-density as bone with a density of 1050 mg of hydroxyapatite per cc.
The value obtained for each part of the calibration sample was determined for each
scan. An average of the values obtained was used as the calibration value when
performing bone analysis. The calibration values used are listed in table 2.2. These
values were compared to the value obtained for the volume outside of the tissue, which
would be composed of water.
At the beginning of each day the scanner was turned on and the X-ray tube went
through a warm-up protocol prior to initiating scanning. Once the warm up procedure
was completed the large scanning tube containing the specimen was placed in its place
inside the scanner, and a preliminary fluoro-scan of each sample was taken. This was
examined to ensure that the entire sample was in the volume that was to be scanned.
The tube position was adjusted when needed and then the samples underwent a 2.5hr
µCT scan.
After the scanning process was completed the resultant files, called “acquisition
data”, were corrected and reconstructed using the eXplore Reconstruction Utility
software. This yielded corrected files which were then reconstructed into 3-dimensional
volumes and saved as VFF files. Bone analysis was done on the reconstructed
volumes.
Bone analysis was performed using the GE Healthcare eXplore Micro View
version 2.0 software. The reconstructed VFF file was visualized as a 3D image using
the isosurface modality. The 3D image made it easier to orient the samples in
preparation for tracing the region of interest (see figures 2.5 and 2.6).
48
2.6.2) Selection of a Region of Interest (ROI) for Analysis
Analysis was performed on a restricted portion of the scanned vertebrae, called
the region of interest (ROI). The secondary ossification center, which lies immediately
“below” the articular surface of the vertebral body and “above” the growth plate was
selected as the region of interest as it was a well defined volume that was easily
identifiable and could be accurately reproduced in all the samples. The following
protocol was used to standardize tracing of the ROI:
1. The volume was oriented until the sagittal plane passed perpendicularly through the
bodies of both vertebrae (figure 2.4)
2. The 2D sagittal image was expanded to the whole screen and the view was moved
back and forth through the stack of frames (sections) in the sagittal plan to identify
the beginning of the edge of the secondary ossification center (SOC).
3. The margins of the SOC were traced.
4. The view was advanced ten frames and the SOC traced once more. This was
repeated until the far edge of the SOC was reached. The last frame with a defined
SOC was traced even when it was not the tenth frame.
5. Once this was done the entire volume of the ROI was interpolated by the software.
In the 3D image the ROI was coloured yellow.
6. Each tracing was evaluated after the interpolation process was done. The yellow
coloured ROI was then evaluated in the 3D image to determine whether it
accurately defined the ROI. If the ROI extended beyond, or missed, part of the SOC
the tracings were modified until the ROI matched the margins of the SOC (figures
2.5 and 2.6).
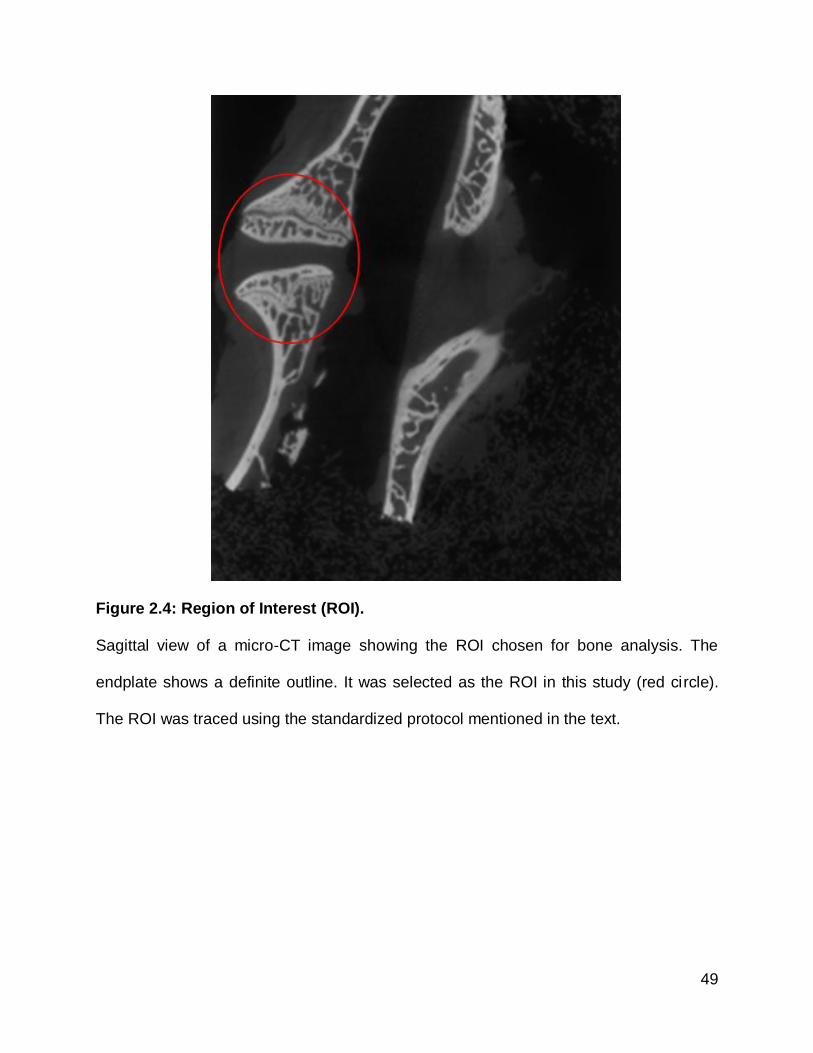
49
Figure 2.4: Region of Interest (ROI).
Sagittal view of a micro-CT image showing the ROI chosen for bone analysis. The
endplate shows a definite outline. It was selected as the ROI in this study (red circle).
The ROI was traced using the standardized protocol mentioned in the text.

50
Figure 2.5: Final Tracing of the ROI.
Micro-view window showing a traced slice in the sagittal view (arrow #1) in orange.
Arrow #2 shows the interpolated ROI which looks satisfactory from this perspective.
The calibration sample also can be seen at the bottom (arrow #3).

51
Figure 2.6: Frontal and Side Views of the Isosurface of the ROI.
(A) Anterior view of the traced ROI shown in yellow on the top vertebral body (arrow
#1). (B) lateral view of the same ROI (arrow #1). The calibration sample can also be
seen as a cylindrical object at the bottom right of the figures (arrow #2).

52
2.6.3) Thresholding
To permit the analysis software to distinguish voxels that were composed of bone,
from those composed of soft tissue a threshold value for the radio-density of a pixel was
determined. Voxels with a radio-density above that threshold value would be counted as
bone.
The threshold value was determined using the “autothreshold function.” This function
works by generating a distribution plot of the radiodensity of all of the voxels within the
ROI. This plot appears as 2 overlapping distribution curves, one representing soft-tissue
and the other calcified bony tissue. The autothreshold identifies a radio-density value
which separates these curves.
2.6.4) Parameters Measured
Following selection of the ROI and completion of thresholding, the following three
groups of parameters were measured and exported as excel files for future statistical
analysis:127
I) Measurements of Bone Quantity
Total volume (TV)
This is the total volume of the ROI, including bone and soft tissue. It is expressed in
cubic millimeters (mm3).
Bone volume (BV)
This represents the volume ROI whose radiodensity was greater than the threshold
value. It is expressed in mm3. The bone volume is sensitive to the threshold value
selected.

53
Bone Mineral Content (BMC)
BMC is the estimated mass of calcium within the ROI. It is estimated based on the
radio-density of each voxel compared to the input calibration values for bone and water,
and is expressed in milligrams (mg).
Tissue Mineral Content (TMC)
TMC is defined as the amount of calcium in the voxels that are counted as bone. It is
expressed in milligrams (mg). As this is a value of the calcium present within the fraction
of voxels counted as bone, the TMC will be lower than the BMC.
II) Measurements of Bone Quality
Bone Mineral Density (BMD)
BMD is obtained by dividing the BMC by the volume of the ROI (i.e. TV) and is
expressed in milligrams per cubic centimetre (mg/cc). As it is volume corrected it is not
affected by the threshold to the ROI dimensions.
Tissue Mineral Density (TMD)
TMD is obtained by dividing the TMC by the bone volume within the ROI (i.e. BV). It
is expressed in mg/cc. This value is a measure of the “density of the bone tissue” within
the ROI. The value for TMD typically is larger than that for BMD as most of the calcium
is restricted to the voxels containing bone.
Bone Volume Fraction (BVF)
BVF represents the proportion of the total volume of the ROI which is occupied by
bone (BVF=BV/TV).

54
III) Measurements Affected by Changes in Bone Architecture
Surface area (SA)
SA is the direct measurement of the total bone surface area. It is expressed in
square millimetres (mm2).
Trabecular Thickness (Tb. Th.)
This is a direct measure of the trabecular thickness within the ROI. It is expressed in
millimetres (mm).
Structure Model Index (SMI)
SMI is a parameter of bone architecture. It is used to measure how “rod-like” or
“plate-like” trabecular architecture is. With aging and disease, trabecular bone
architecture deteriorates in some sites from plate-like to rod-like. SMI is expressed in
numerical values with no units used. Each value has an indication. For example, for
ideal plates the SMI will be “0” while for ideal rods, the SMI will be “3”. While SMI is
normally positive, when it is calculated for specimens with high bone volume fraction
then it can become a negative value.

55
2.7) Histological Methods
2.7.1) Tissue Processing
Upon completion of the µCT scanning, the specimens were stored in 10% neutral
buffered formalin at room temperature. Prior to embedding, all the samples were
decalcified using a 22% formic acid, 10% sodium citrate solution. The solution was
changed twice per week for a total of twelve weeks. The samples were washed out
under distilled water for 15 minutes prior to embedding.
The sample was sectioned into two halves, anterior and posterior. Subsequently
they were dehydrated with increasing concentrations of ethanol. 70% ethanol for 24
hours at 40C, then 95% ethanol for one hour at room temperature, then a final three
changes with 100% ethanol for one hour each at room temperature. Following this, the
samples were left overnight in methyl benzoate, then bathed in toluene for one hour at
room temperature and placed on an orbital shaker. Both portions of each sample were
infiltrated with wax (Blue Ribbon, Surgipath) for one hour at 600C. Completion of the
infiltration process was accomplished by changing wax three times at intervals of two
hours each under vacuum (20 mmHg) at 600C.
Each posterior half of each sample was embedded in paraffin, and sectioned into
anterior and posterior blocks for the second time. The posterior block was sectioned at
seven microns using the Shandon Finesse rotary microtome. Sections floated on a
water bath and picked up on coated slides (Surgipath Micro Slides, Snowcoat Xtra).
Slides were dried overnight on the slide warmer (Fisher) at 370C.

56
The slides were then stained with Hematoxylin and Eosin (H &E) as follows:128
1. Slides were dried at 56°C in an oven for 1-2 hours.
2. They were then de-waxed by emersion in xylene for three minutes, for a total of three
times.
3. The slides were then placed in 100% ethanol for two minutes, a total of three times.
4. Then 95% ethanol for two minutes, twice.
5. Then 70% ethanol for two minutes, twice.
6. Then 50% ethanol for two minutes, twice.
7. And then distilled water for two minutes, twice.
8. The slides were then stained with Harris’ hematoxylin for seven minutes.
9. They were then rinsed under cold running water for two minutes.
10. The slides were then dipped in 1% acid alcohol and rinsed with tap water twice for
one minute.
11. The slides were then placed in 0.5% lithium carbonate for one minute.
12. Then rinsed with distilled water twice for two minutes.
13. The slides were then stained with 5% eosin for 45 seconds.
14. Then dipped fifteen times in 95% ethanol (this was done twice).
15. Then dipped fifteen times in 100% ethanol (done twice as well).
16. Finally, a coverslip was mounted on each slide using Permount.

57
2.7.2) Evaluation of Histological Sections
Each slide was examined under the light microscope for the following:
Osteoblasts
Cells were considered to be active osteoblasts if they were cuboidal to columnar
in shape (figures 2.7 & 2.8), had a basophilic (bluish or purplish) appearance in Active
osteoblasts are also associated with modeling and remodeling processes. They are
always found on top of the "osteoid" that they laid down as a result of their activity.
Osteoid is non-calcified, non-lamellated “woven” bone matrix (figures 2.7 & 2.8).
Osteoid can be identified under “polarized light.” Mature bone is strongly birefringent
under polarized light due to the highly ordered collagen. However osteoid is poorly
birefringent.
Bone Lining Cells (Inactive ostoblasts)
Cells were considered to be “bone lining cells” or inactive osteoblasts when whey
appeared as flattened, spindle shaped cells with elongated nuclei and a non-basophilic
cytoplasm, and were directly opposite to the bone surface (figure 2.9). The bone
underneath these cells is usually mature or “lamellated”, showing characteristic
concentric layered appearance. These inactive osteoblasts represent one of the targets
for HBO according to some studies.

58
Figure 2.7: Active Bone Surface Undergoing Remodeling.
H & E stain of bone tissue in an active remodeling stage. Active osteoblasts are shown
at the top (arrow #1). They appear cuboidal to columnar in shape. They stain dark
“basophilic” due to their increased load of cytoplasmic granules. They are secreting
“osteoid” which appear underneath them (small multiple arrows). Moving to the middle
of the slide we can see osteocytes in their lacunae (arrow #2). They have large nuclei
and are surrounded by “woven” bone (asterisk). On the other hand, the bottom of the
slide shows osteoclast (arrow #3). It appears multinucleated containing at least 6 nuclei.
The number of the nuclei is indicative of the osteoclast’s level of activity. This slide
shows an area of active bone remodeling where bone is being resorbed on one side by
osteoclasts and deposited on the other side by osteoblasts.

59
Figure 2.8: Active Osteoblasts and Osteoid Tissue.
Goldner's Trichrome stained slide showing active secretory osteoblasts (long arrow).
They are secreting osteoid tissue which appears green using this stain (small multiple
arrows).

60
Figure 2.9: Quiescent Bone Surface.
H & E stained bone tissue in quiescent stage. The bone is not being actively remodelled
at the site shown in this slide. Bone lining cells (long arrow) are sitting on top of a
mature, lamellar (multiple small arrows) bone. The bone lining cells appear flattened,
spindle shaped with elongated, darkly stained nuclei. The small arrows are pointing to
one concentric layer of bone to emphasize the appearance of bone lamellae.
Hematogenous marrow is seen in the middle of the slide (asterisk). Osteocytes are
encased in their lacunae (bottom of the slide). In general, this slide shows an area of
quiescence where bone is being neither resorbed nor laid down.

61
Osteoclasts
Cells were considered to be osteoclasts when they were multinucleated and
were found either sitting within “Howship’s lacunae” when solitary, or “cutting cones”,
when in groups next to bone. When present they were be evaluated based on the
number and size of osteoclasts at a site and the number of nuclei per cell. The number
of nuclei in an osteoclast, which affects their size, along with the number of osteoclasts,
serves as indicators of their level of activity. This indicates the level of remodeling of
bone in that particular area. Figure 2.10 shows osteoclasts sitting in their “Howship
lacunae”. It also shows that the cutting cone is being formed by their action as a group.
Blood vessels
Blood vessels were identified based on the appearance of their endothelial lining;
tunica intima; and/or the existence of red blood cells (RBC) in their lumens. The
endothelium of a blood vessel is a single layer of flattened cells with elongated nuclei in
their centers. The number of blood vessels within a field of view was evaluated.
Thickening of the blood vessels’ walls was also evaluated. A relative increase in the
number of blood vessels would serve as evidence of vascular invasion. Along with the
thickening of the blood vessel wall, they indicate an area of activity within the bone
influenced by HBO.

62
Figure 2.10: Osteoclasts in Howship Lacunae.
H & E stained bony tissue under high magnification showing multiple osteoclasts
resorbing the bone surface. Each osteoclast sits in its “Howship lacuna” as shown by
the multiple small arrows. As the resorption process continues, these lacunae meet
together forming a cutting cone (crater extending between arrows #1 & #3). Each
osteoclast is multinucleated with eosinophilic cytoplasm.

63
2.7.3) Histochemistry
Slides from each sample were stained for “alkaline phosphatase” (ALP) to
stain osteoblasts, or for “Tartrate-resistant acid phosphatase” (TRAP) to stain
osteoclasts. The procedures were as follow: 129-131
Alkaline Phosphatase (ALP) staining method:
In order to stain the slides with ALP stain, two solutions had to be prepared first
and then mixed together to get the final stain which is then applied to the slides. The
solutions and reagents were as follows:
Naphthol AS-MX Phosphate/(DMF)N,N Dimethylformamide Solution:
1) Naphthol AS-MX Phosphate ----------------------- 5 mg.
2) N, N Dimethylformamide --------------------------- 0.25 ml.
Both ingredients were mixed until they completely dissolved, resulting in the first
solution.
Tris-hydrochloric acid buffer, pH 8.74:
1) 0.2 M Tris (2.42 g Tris Base/100 ml) ------------- 10 ml.
2) 0.1 M Hydrochloric acid (HCl) -------------------- 4 ml.
3) Distilled water ---------------------------------------- 26 ml.
Those were mixed to form the second solution.
Substrate Working Solution:
1) Naphthol AS-MX phosphate/DMF solution ----- 0.25 ml.
2) Distilled water ---------------------------------------- 25 ml.
3) Tris buffer, pH 8.74 ---------------------------------- 25 ml.

64
As seen above, the substrate working solution is the net result of mixing the first
two solutions with distilled water. The solution has to be shaken very well in order to mix
the ingredients thoroughly. To that was added 30 mg of diazonium salt (fast red violet
LB salt). We insured that the ingredients were thoroughly mixed before the mixture was
filtered into a Coplin jar. The solution should be clear. This gives an indication of proper
mix. A slight cloudiness is acceptable. If the solution was reddish, this is an indication
that it would not stain the sections. The sections were then de-paraffinized through
xylenes and alcohol, and brought to running de-ionized water. Next, the sections were
placed into the substrate working solution at 37 C for 30-60 minutes. The slides were
checked microscopically after 30 minutes for the intense red color indicative of enzyme
activity (the background should be yellow), and then rinsed in distilled water for 2
minutes. The rinsing process is repeated three times. Active osteoblasts are rich in ALP
and will stain red when subjected to this type of stain.
Tartrate-resistant acid phosphatase (TRAP) staining method:
The process by which the slides were exposed to the TRAP stain was as follows:
Sections were deparaffinized through xylenes and alcohol. They were then
brought to running de-ionized water. This was followed by preparation of acetate buffer
in the volumes needed to accommodate the number of slides to be stained. This puffer
consisted of the following:
0.2 Molar (M) acetate buffer.
50 ml of distilled water.
0.82g of sodium acetate (formula weight of 82.03).
0.58g of L (+) tartaric acid (formula weight of 230.1).

65
Those ingredients were stirred using a magnetic stirrer until the particles
dissolved and the pH was brought to 5.0. Following a 5 minute wash under running
water, the sections were incubated in 0.2 M acetate buffer for 20 minutes at room
temperature. After 20 minutes, the slides were incubated in the same buffer containing
0.5mg/ml of naphthol AS-MX phosphate and 1.1mg/ml of “Fast Red TR salt”. The
sections were incubated for 1-4 hours at 37degrees C. The sections were monitored
after the first hour, rinsed with distilled water, dehydrated, and mounted. This method is
a slight modification of the method used in the paper of Erlebacher and Derynck. Active
osteoclasts will stain red using this kind of stain.
2.8) Statistical Analysis
Data obtained from the micro-CT (µCT) scanning was tested for normality and all
parameters were found to be normally distributed. Therefore the results for each
parameter in each group were compared using the Independent (student) t-test. The
level of statistical significance accepted was (P < 0.05). Due to the small sample size
however, we cannot ascertain the normal distribution of the data. Hence, non-
parameteric test was used as well to confirm the results.
Micro-CT data is presented graphically using histograms showing the mean and
standard deviation of the parameter for both HBO and NBO groups.

66
3) RESULTS
All animals survived the calvarial surgery and had an uneventful recovery period.
Hyperbaric sessions were well tolerated by each of the rabbits in the HBO group. After
the animals were sacrificed, no abnormalities were seen either in hard or soft tissues
when they were dissected to collect the vertebrae. The seventh lumbar vertebra was
usually overlapped by the sacral spines and was mostly obscured by those spines. This
made the collection of the L7 vertebrae difficult. For this reason, one of the NBO group
vertebra was sufficiently damaged during the collection process that it had to be omitted
from further analysis. This resulted in only ten samples being available from the NBO
group (n=10).
3.1) Micro-CT (µCT) Results
Micro-CT images of the vertebral bodies showed a dense line of calcified tissue
spanning from cortex to cortex that clearly separated the secondary ossification center,
immediately below the articular plate and the more distant portion of the vertebral body
(figure 3.1). This line was used as the lower margin when outlining the region of interest,
as described previously.

67
Figure 3.1: Endplate of the Vertebral Body (ROI).
A micro-CT sagittal view showing the ROI (asterisks). Note the non-fusion of the
endplate (asterisk) to the rest of the vertebral body. Note the radiolucent zone
separating the endplate from the rest of the vertebral body (arrows). This dark area
represents the epiphyseal growth plate.

68
3.1.1) Analysis of Measures of Bone Quantity
Bone volume (BV), bone mineral content (BMC) and tissue mineral content of the
bone voxels (TMC) reflect the quantity of bone within the region of interest (ROI).
Changes in the total volume of the ROI (TV) would suggest differences in the shape and
possibly growth of the vertebrae.
While none of the differences observed for these measures were significant the
HBO treated group showed a consistent trend toward having higher values for TV, BV
(both in figure 3.2), BMC, and TMC (both in figure 3.3) compared to the NBO subjects.
There was no significant difference in the TV of the ROIs of the secondary ossification
centre for each group (figure 3.4). The results are summarized in table 3.1
Variable HBO (Mean±SD) NBO (Mean±SD) Levene’s test P-value (t-test) P-value (Mann-
Whitney U test)
TV (mm3) 89.1±11.7 81.6±9.6 0.359 0.128 0.251
BV (mm3) 57.6±14.3 50.5±5.4 0.081 0.120 0.197
BMC (mg) 58.7±9.8 53.6±5.9 0.068 0.171 0.251
TMC (mg) 44.7±9.9 39.8±4.8 0.158 0.178 0.282
Table 3.1 Summary of Micro-CT Quantitative Parameter Results.
All results are expressed as mean ± the standard deviation. The HBO group shows
slightly higher values of all bone quantity variables. However, these differences are not
of any statistical significance (p > 0.05 in both t-test and Mann-Whitney U test).
Levene’s test result was not significant (i.e. equality of variance assumed).

69
Figure 3.2: Histograms of Total Volume & Bone Volume.
Histograms showing the graphical representations of the TV and BV of both groups.
The HBO group shows slightly larger volume of the ROI as well as higher mineral
content per voxels within the ROI. The difference, however, is said to be not of any
statistical significance (p = 0.128 for TV while p = 0.120 for BV).
0
20
40
60
80
100
120
HBO NBO
TV
(m
m3)
Total Volume
0
10
20
30
40
50
60
70
80
HBO NBO
BV
(m
m3)
Bone Volume

70
Figure 3.3 Bone and Tissue Mineral Contents of the Bone Voxels.
These histograms show the BMC and TMC values for the HBO and NBO samples
(mean ±SD). The HBO samples tended to have a higher BMC as well as a higher TMC
than the NBO group. However the differences seen were not statistically significant (p =
0.171 for BMC, P = 0.178 for TMC).
0
10
20
30
40
50
60
70
80
HBO NBO
BM
C (
mg)
Bone Mineral Content
0
10
20
30
40
50
60
HBO NBO
TM
C (
mg)
Tissue Mineral Content

71
3.1.2 Analysis of Measures of Bone Quality
The parameters in this category include bone mineral density (BMD), tissue
mineral density (TMD), and bone volume fraction (BVF). These parameters change with
changes in the quality of bone rather than in its quantity. They represent the quantity
measures corrected for volume effects. In this group of parameters the NBO group
trended to higher values than the HBO group except for the BVF, however none of the
differences was found to be statistically significant. The results are summarized in table
3.2 and figures 3.4 (BMD & TMD) and 3.5 (BVF).
Variable HBO (Mean±SD) NBO (Mean±SD) Levene’s test P-value (t-test) P-value (Mann-
Whitney U test)
BMD (mg/cc) 664.7±75.6 670.1±53.7 0.310 0.852 0.756
TMD (mg/cc) 781.2±78.2 795.5±53.6 0.201 0.633 0.426
BVF (BV/TV) 0.65±0.08 0.63±0.03 0.353 0.448 0.756
Table 3.2 Summary of Micro-CT Qualitative Parameter Results.
This table summarizes the results of the bone quality variables for both groups. Here
the slight increase was seen at the NBO group for the BMD and TMD values. The BVF
however tended to be higher in the HBO group. Regardless of these difference, the
results were said not to be statistically significant in any of the variables (p > 0.05 in
both t-test and Mann-Whitney U test). Levene’s test result was not significant (i.e.
equality of variance assumed).
.

72
Figure 3.4: Bone and Tissue Mineral Density Values.
The histograms show the differences in bone and tissue mineral density for both
groups. The NBO group subjects tended to be mildly higher than the values in the HBO
group without statistical significance (p = 0.852 for BMD while p = 0.633 for TMD).
0
100
200
300
400
500
600
700
800
HBO NBO
BM
D (
mg/c
c)
Bone Mineral Density
0
100
200
300
400
500
600
700
800
900
1000
HBO NBO
TM
D (
mg/c
c)
Tissue Mineral Density

73
Figure 3.5: Bone Volume Fraction of Both Groups.
The histogram shows the comparison with regards to the BVF. The HBO group tended
to have higher bone content per the volume of the ROI compared to the NBO group.
However, the difference was not significant (p = 0.448).
0
0.1
0.2
0.3
0.4
0.5
0.6
0.7
0.8
HBO NBO
BV
F (
BV
/TV
)
Bone Volume Fraction

74
3.1.3 Analysis of Measures of Bone Architecture
The parameters surface area (SA), trabecular thickness (TbTh), and structure
model index (SMI) are sensitive to changes in bone architecture, as opposed to
changes in the quantity or quality of bony material. The HBO subjects tended to have
thicker trabeculae with a correlated increase in surface area (figure 3.6). These
differences, however, were not statistically significant. The SMI is an indicator of the
shape of the trabeculae giving indicting a transition from plates to rods. The SMI value
was negative for both groups (figure 3.7) with the NBO subjects tending to have a
slightly more negative SMI, although this difference was not significant. The results are
summarized in table 3.3
Variable HBO (Mean±SD) NBO (Mean±SD) Levene’s test P-value (t-test) P-value (Mann-
Whitney U test)
SA (mm2) 308.0±32.6 292.9±37.6 0.795 0.338 0.468
Tb.Th. (mm) 0.37±0.08 0.33±0.05 0.488 0.212 0.223
SMI -2.8±0.6 -2.9±0.7 0.840 0.715 0.756
Table 3.3 Summary of Bone Architecture Parameters.
Table summarizing the results of the variables affected by changes in bone architecture.
The surface area tended to be higher in the HBO group with the trabeculae tending to
be thicker in this group compared to their NBO counterparts. However, these
differences are not of any statistical significance (p > 0.05 in both t-test and Mann-
Whitney U test). Levene’s test result was not significant (i.e. equality of variance
assumed). Note the negative values of the SMI in both groups.

75
Figure 3.6: Surface Area and Trabecular Thickness for Both Groups.
Histograms reflecting the tendency of the HBO group to have a wider surface area with
thicker trabecular content in them. None of these values however shows a statistical
significance difference (p = 0.338 for SA while p = 0.212 for Tb. Th.).
0
50
100
150
200
250
300
350
400
HBO NBO
SA
(m
m2)
Surface Area
0
0.1
0.2
0.3
0.4
0.5
HBO NBO
Tb
.Th
. (m
m)
Trabecular Thickness

76
Figure 3.7: Histogram of the Structure Model Index of the Groups.
The histogram shows the SMI of both groups. Note the negative values of the SMI of
both groups. More negativity was shown by the NBO group compared to the HBO
group. Reliability of this value is unknown. The difference between the two groups was
found to be not of any statistical significance when subjected to the student t-test (p =
0.715).
-4
-3.5
-3
-2.5
-2
-1.5
-1
-0.5
0
HBO NBO S
MI
Structure Model Index

77
3.2 Histological Results
General histological evaluation was done by examination of the H&E stained
slides, while identification of osteoblasts and osteoclasts by histochemical staining was
also attempted.
3.2.1 Evaluation of Histology (H & E stained slides)
Each vertebra was divided into 3 zones (figure 3.8). The zones were as follows
(L7 will be used as an example for orientation purpose in this context):
Endplate:
The Endplate is equivalent to the “epiphysis” in the long bones. Both the endplate
and the epiphysis of the long bone are the sites of the secondary ossification center.
They are initially separated from the main body of the bone by a cartilaginous
epiphyseal growth plate. The endplate is juxtaposed to the inter-vertebral disk (IVD),
and the tissue transitions from the fibrous annulus of the IVD to the bone of the end
plate in an irregular fashion.
The appearance of the endplates was similar in both the NBO and HBO groups.
A thick plate of cortical bone lies immediately next to the IVD. Internal to this was a
marrow cavity consisting loose fibrovascular tissue and bony trabeculae. These then
merged with another plate of bone opposite to the epiphyseal growth plate (figure 3.8).
A moderate number of blood vessels could be seen running through the sub-IVD
bone plates. There were no signs of wall thickening in either group. Large areas of bone
surface were covered with lining cells. They are flattened, spindle-shaped, and were
found directly opposed to the surfaces of the bone. Active osteoblasts were not seen in
this region in either group.

78
Osteocytes were found to be the most predominant type of cells in this region of
the vertebrae. Some had larger nuclei than others suggesting their recent entrapment in
their bony lacunae.
A small number of multi-nucleated cells, which were presumed to be osteoclasts,
were seen sitting within shallow craters on the bone surface, or grouped together in
“cutting cones”. The number of nuclei was variable. Their cytoplasm was eosinophylic.
They possessed ruffled borders which were in contact with bone.
In general, the bone in the endplate was considered to be in a quiescent state in
both groups.
Epiphyseal Growth Plate:
Moving away from the secondary growth center and intervertebral disc, the
epiphyseal growth plate was encountered. The plate showed classical features of
epiphyseal growth plates found in long bones (figure 3.9). These were as follows:
The region closest to the secondary ossification center comprised randomly
arranged chondrocytes sitting in small lacunae which were relatively close together. The
surrounding extracellular matrix tended to stain a darker pink than was the case in the
middle of the growth plate.
Deeper within the growth plate, chondrocytes showed signs of proliferation. The
cells were arranged in longitudinal columns. Those columns were parallel to one
another. The cells are sitting in similar sized lacunae within these columns. Some
lacunae looked fused or in the stage of dividing, while some others were at a distance
from each other after the division process was completed. This area appeared lightly
stained compared to the peripheries of the epiphyseal growth plate.
79
Moving further away from the IVD area, the recently divided chondrocytes
showed signs of hypertrophy. The lacunae appeared larger than those in the columns.
The nuclei appeared smaller due to the relative increase in the size of the lacunae.
The last zone in this plate was showing signs of ossification around the
chondrocytes. This end of the plate was darkly stained, a little darker than the superior
edge of the plate. The amounts of ossification around the chondrocytes were variable.
The lacunae of those chondrocytes appeared irregular in shape; variable sizes were
seen in both the lacunae and the nuclei of the cells. Some lacunae were empty.
In general the histological appearance of the epiphyseal growth plates were
similar in both groups. They both showed increased bone volume at the inferior part of
those plates. However, some evidence of mineralization was seen at the superior parts
of those plates in both groups as well.
Vertebral Body:
Inferior to the epiphyseal growth plate, the main bulk of the vertebral body was
seen in the samples from both groups. This is equivalent to the diaphysis of the long
bones. It also constitutes the primary ossification centers in those bones.
Blood vessels were seen in the superior aspect of this area. They were identified
by their endothelial lining. The endothelium looked normal showing a single cell lining
with flattened, elongated nuclei. RBCs were seen in the middle of those vessels. There
were no signs of thickening in either group. In other words, the blood vessels looked
normal without showing thicker vessel walls in either group (figure 3.12).
Some osteoclasts were seen at the superior aspect of this vertebral body. They
appeared as multinucleated cells expressing different numbers and sizes of their nuclei.

80
The nuclei were darkly stained while the cytoplasms of these cells were eosinophylic.
Osteoclasts were seen in either Howship lacunae or in cutting cones (figure 3.10).
Inferior to this level, mature, well-lamellated bone was seen surrounding
osteocytes encased in their lacunae (figure 3.11). The nuclei of these cells were
variable in size. The number of these cells appeared to be higher than those seen in a
similar population in the endplate.
Bony trabeculae were lined with bone lining cells (figure 3.11). Those cells
showed the same appearance as described in the endplate part but were more
numerous in this area compared to the endplate. The bone marrow between these
trabeculae looked different than the marrow in the endplate. It was more vascular than
fatty. It was stained dark; more basophilic; compared to the lightly stained marrow in the
endplate zone. Generally the marrow can be said to be more hematopoietic compared
to the endplate’s marrow.
Collectively, these findings were similar in both groups. No difference was found
between the HBO group subjects’ histology and the NBO counterparts at the six weeks
time point as shown in the figures below (figures 3.8 to 3.12).

81
Figure 3.8: General Zones Seen in Both Groups (low magnification).
H & E stained sections of HBO (left) and NBO (right) under low magnification power
(4X). We can see the general three layers of each slide. Arrow #1 is pointing to the
superior plate of bone. Moderate amounts of blood vessels are seen horizontal (on the
level of the arrow). Arrow #2 points to the epiphyseal growth plate area. This shows that
fusion of these samples has not yet occurred. The columns formed by mitotic
chondrocytes can be seen under this magnification. Arrow #3 is showing the vertebral
body area. In general there is a great similarity between the HBO subject’s histology
and the NBO control under this magnification.

82
Figure 3.9: Different Zones within the Epiphyseal Growth Plate Area.
H & E stained sections of HBO (left) and NBO (right) under higher magnification (10X).
Different stages of cartilaginous growth can be seen. Arrow #1 shows the “zone of
resting cartilage”. Arrow #2 shows the “zone of proliferation”. The columns array is well
illustrated under this magnification. Arrow #3 points to the “zone of hypertrophy and
maturation”. The size of the chondrocytes is larger compared to the previous two zones.
Arrow #4 shows the “zone of mineralization”. The mineralization around the dead
chondrocytes is seen clearly in both groups. Generally, these zones look similar in both
groups with an area of mineralization closer to the superior bone plate in the NBO
sample (top of the asterisk).

83
Figure 3.10: Osteoclasts Resorbing Bone in Cutting Cones.
H & E stained sections of HBO (left) and NBO (right) under high magnification (40X)
showing cutting cones with osteoclasts (arrow #1) in them. Hematogenous marrow is
seen in the middle of the cutting cones (asterisk). Arrow #3 shows a large osteocyte in
the HBO slide where the ruffled border is sealing the bone surface underneath it.
Osteocytes are seen in their lacunae (arrow #2). The sizes of the nuclei of those
osteocytes are considered moderate to large. Generally, the HBO slide has a larger
cutting cone and more multinucleated osteoclasts containing larger number of nuclei in
them indicating their activity level (see the discussion).

84
Figure 3.11: Mature Bone Showing Osteocytes in their Lacunae.
H & E stained sections of HBO (left) and NBO (right) under high power (40X) showing
the bone lining cells (arrow #1). The cells are flattened, spindle-shaped, with elongated
nuclei. They are on the bone surface. The bone underneath them is mature and very
well lamellated (arrow #2). Osteocytes are seen in their lacunae (arrow #3). Their nuclei
are variable in size indicating their time of entrapment. The slides from both groups are
very similar with no differences seen in one group over the other in these sections.
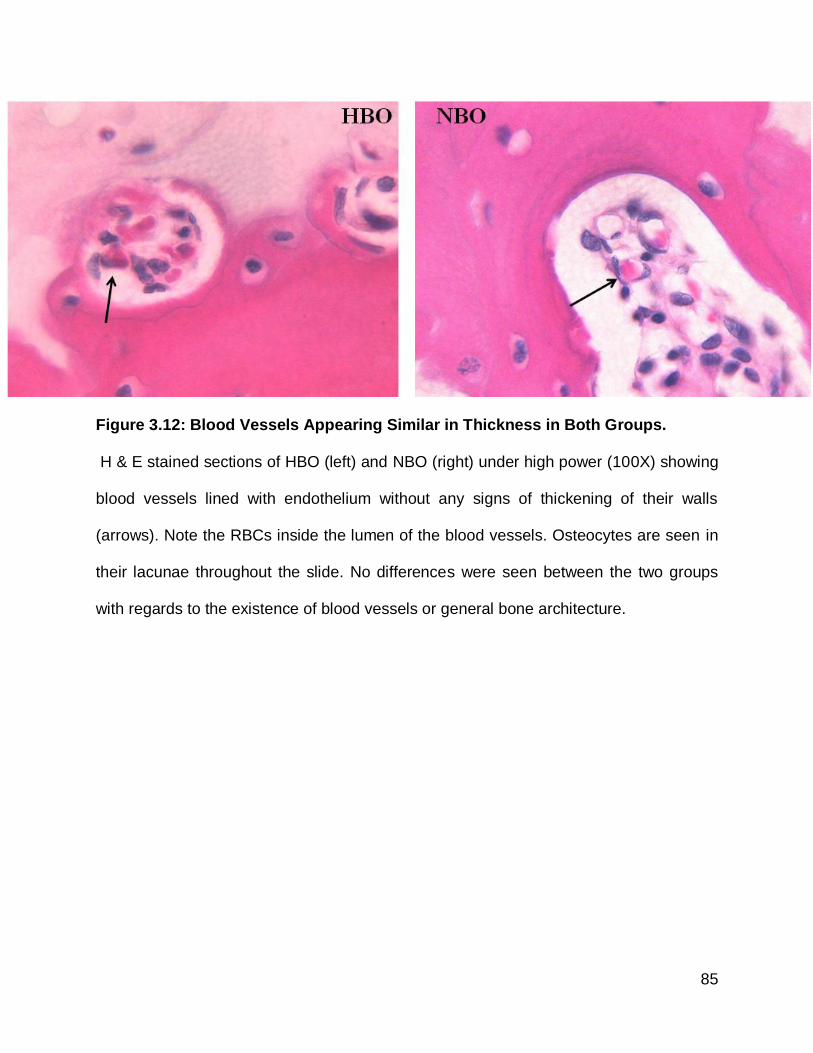
85
Figure 3.12: Blood Vessels Appearing Similar in Thickness in Both Groups.
H & E stained sections of HBO (left) and NBO (right) under high power (100X) showing
blood vessels lined with endothelium without any signs of thickening of their walls
(arrows). Note the RBCs inside the lumen of the blood vessels. Osteocytes are seen in
their lacunae throughout the slide. No differences were seen between the two groups
with regards to the existence of blood vessels or general bone architecture.

86
3.2.2 Histochemistry (TRAP & ALP)
We also attempted to stain the slides with TRAP and ALP. We were
unsuccessful in these attempts. Figures 3.13 to 3.16 show examples of samples from
both groups.

87
Figure 3.13: ALP Stained Slides from Both Groups (low power, 4X).
Alkaline phosphates stained samples of the HBO (left) and NBO (right) groups. The
same orientation that was used in the H & E stained slides is displayed here. The
endplate is sitting at the top of the figure (arrow #1) while the body of the vertebrae is at
the bottom (arrow #3). The epiphyseal growth plate is in the middle (arrow #2). Areas of
mineralization are seen at the bottom of the epiphyseal growth plates (arrow #2).
Osteocytes are encased in their lacunae (arrows #1 & 3). They are surrounded by
mature, lamellated bone. The marrow is more hematogenous; it is vascular in the case
of HBO group. There were no osteoblasts catching the stain near the areas of
mineralization or elsewhere in the slides in both groups.

88
Figure 3.14: ALP Stained Slides from Both Groups (higher power, 10X).
Another ALP stained set of samples of both groups (HBO is on the left, NBO is on the
right). We can see osteocytes in their lacunae (arrow #1) in the middle of mature bone.
Marrow spaces were more vascular in the case of HBO (arrow #2). The columns of the
proliferating cartilage in the epiphyseal growth plate are obvious (arrow #3). Areas of
mineralization are found inferior to those columns (arrow #4). No evidence of any red-
stained osteoblasts is seen in those samples as well.
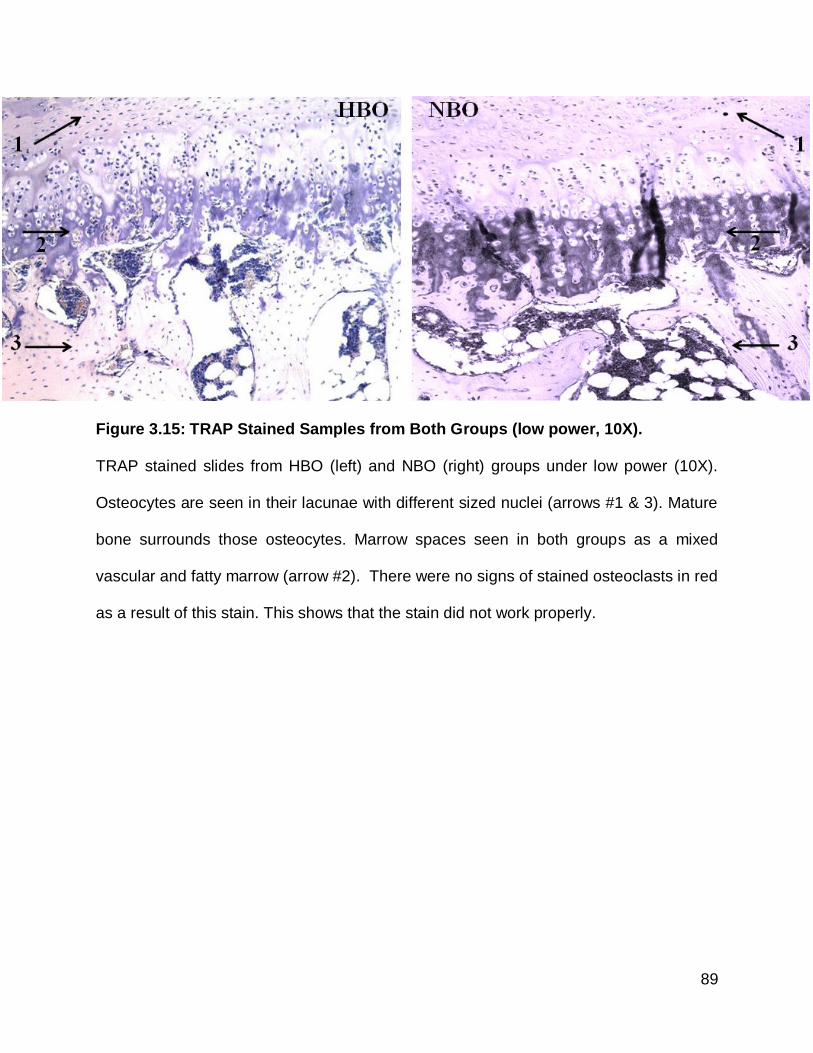
89
Figure 3.15: TRAP Stained Samples from Both Groups (low power, 10X).
TRAP stained slides from HBO (left) and NBO (right) groups under low power (10X).
Osteocytes are seen in their lacunae with different sized nuclei (arrows #1 & 3). Mature
bone surrounds those osteocytes. Marrow spaces seen in both groups as a mixed
vascular and fatty marrow (arrow #2). There were no signs of stained osteoclasts in red
as a result of this stain. This shows that the stain did not work properly.

90
Figure 3.16: TRAP Stained Samples from Both Groups )magnified osteoclasts).
Another set of TRAP stained samples from HBO (left) and NBO (right). Arrows are
pointing to osteoclasts under higher power (100X). It is obvious that those osteoclasts
did not retain the TRAP stain. If the stain had been retained by those cells they would
have assumed a red colour instead. No difference is seen between both groups. Both
groups did not retain the TRAP stain.

91
4) DISCUSSION
HBOT is used as a treatment modality for many indications. Its mechanism of
action has demonstrated different effects on many different elements of bone
physiology. As stated earlier, studies that evaluated the effects of HBOT on bone had
not evaluated the effects of HBOT on sites other than those surgically operated on for
the purpose of the given study. The purpose of this investigation was to examine the
effects of HBOT on bones distant from designated surgical sites.
In this study, evaluation of the bone sites identified a subtle increase in bone
values in the HBO group. However, no statistically significant differences were seen
between HBO and NBO groups. The following will discuss our study design and results
in relation to the current literature.
4.1) Study Design
The aim of this study was to evaluate the effect of HBO treatment on uninjured
vertebrae, at sites distant from surgical sites, with respect to bone density and structure.
These indices were examined using micro-CT analysis. Histology was utilized to
evaluate the effect of HBO on the cells of uninjured vertebrae in situ.
4.1.1 The Use of Vertebrae
Vertebral bones were collected for this investigation because these bones are
rich in trabecular bone content. Trabecular bone remodels faster than cortical bone.
This makes these bones a likely site at which to see any effect of HBOT. Vertebral
bones represent good models to be evaluated due to the high rate of fracture in these
bones.132,133 The last two lumbar vertebrae (L6 & L7) were evaluated as these were the
easiest to identify by counting starting at the lumbo-sacral junction.

92
Due to the irregular shapes of these bones, the decision to choose the micro-CT
region of interest (ROI) as being the endplate was based on the fact that it was well-
defined, and easy to trace in a reproducible fashion in all the samples.
4.1.2 HBO Protocol
Multiple protocols exist for the delivery of HBOT, but no one protocol is set as a
standard in terms of pressure and total exposure to oxygen. Differences exist across
both laboratory studies and clinical treatment protocols. The most commonly used
laboratory protocols in bone are reported in table 4.1
In the case of clinical applications of these protocols, the main determinant of the
final amount of oxygen exposure, i.e. total number of dives, is the response to treatment
sessions. If the patient shows signs of improvement but the case is not yet fully healed,
then therapy would continue. On the other hand, if no improvement is seen, then this
might dictate that there is no added benefit to more exposure to HBO. There is no
definitive rule to determine what is the best pressure of oxygen that should be used, but
the beneficial range with minimal side effects has been reported to be between 2-2.5
ATA. Table 4.2 shows the most commonly used clinical protocols for HBO.

93
Research Group ATA 1 Dive (min.) Dives (total) Period(day) Animal Model Comments
Marx et al, 1990 2.4 90 20 20 Rabbits 8-9 fold increase of vascular density in irradiated rabbit model exposed to HBOT
9
Muhonen et al, 2004 2.5 90 18 18 Rabbits Marked increase of osteoblastic activity and neoangiogenesis irradiated rabbits’ mandibles subjected to DO
30
Gokce et al, 2008 2.5 60 14 7 Rats HBOT enhanced bone formation during experimental tooth movements
134
Sawai et al, 1996 2.4 60 30 30 Rabbits HBOT accelerates the union of autogenous bone grafts from iliac crest to the mandible in the rabbit model
119
Okubo et al, 2001 2.0 60 21 21 Rats HBOT accelerates the activity and the rate of osteoinduction by rhBMP-2
135
All the protocols used 100% oxygen in a mono-place chamber.
Table 4.1 Commonly Used Laboratory Protocols of HBO.
A table presenting different laboratory protocols used to deliver HBOT to animal models.
All the protocols use mono-place chambers for the delivery of 100% oxygen under
different pressures. The pressures used range from 2.0 to 2.5 ATA for 60 to 90
minutes. The total number of dives ranges from 14 to 30 over different periods of time
as seen in the “period” column in this table. Different experimental designs have been
used to test the effect of HBO on those animal models as seen in the “comments”
column. Results all show positive effects of HBOT. ATA = Atmospheric absolute, DO =
Distraction osteogenesis, rhBMP-2 = Recombinant human bone morphogenetic
protein-2.

94
Pressure (ATA) Minutes/Dive Dives (total) Period (days) Comments
2.5 90 30 30 20 dives pre-op. and 10 dives post-op. to facilitate placement of
dental implants in a previously irradiated mandible.6
Not specified 90 26 24 HBOT was applied twice per day for the first 2 days to salvage a
compromised split thickness skin graft.6
2.5 90 30 30 For the treatment of cellulitis of the 5
th toe with concomitant
osteomyelitis in the underlying bone (no surgery was done).6
2.0 90 50 50 For the treatment of a chronic arterial ulcer of the ankle (bone
exposed), HBOT was started 4 months after skin graft failure.6
2.4 90 40 40 30 dives pre-op. and 10 dives post-op. for the treatment of ORN
of the mandible (Miami ORN treatment protocol).6
All the protocols used 100% oxygen in a mono-place chamber.
Table 4.2 Different Clinical Protocols Used for the Delivery of HBO.
A table showing some clinical protocols used to deliver HBO for different clinical
indications. All used 100% oxygen for 90 minutes/dive. Pressures range from 2.0 to 2.5
for a varying number of dives depending on the response to treatment. Most of the
results were satisfactory and healing was attained in most cases at different numbers of
dives (i.e. total exposure to oxygen was different). ATA = Atmospheric absolute, ORN =
Osteoradionecrosis.

95
The majority of the previous laboratory and clinical investigations have used
treatment protocols with HBO pressures that range between 2.0-2.5 ATA. The most
common treatment length used was 90 minutes per dive. Consequently, we decided to
use a treatment protocol of 2.4 ATA for 90 minutes/dive for 5 days/week for a total of 20
dives. This protocol closely matches previously published papers examining the effects
of HBOT on bone healing in our laboratory.
4.1.3 Analysis Methods
Micro-CT (µCT) was used to evaluate the quality and quantity of bone in the
lumbar vertebrae. The use of µCT is more sensitive to variations in bone mineral density
as compared to two dimensional x-ray films, which require at least 30-40% difference in
bone density compared to less than 5% for the µCT.136,137
Other methods were reported in the literature for bone analysis including plain x-
ray films and technetium bone scans. As noted previously, x-rays are poorly
quantitative. The use of radio-active tracers is more sensitive at detecting minute
changes within the bone tissue.36 The most commonly used is technetium-99m-
methylene diphosphonate (99m
Tc-MDP). 99mTc-MDP has a high affinity for bone due to the
diphosphonate, which binds to calcium. Their uptake is high where there is increased
osteoblastic activity. When new bone is formed, then the surface area increases; this in
turn increases the uptake of the 99mTc-MDP. Bone scanning will then quantify the uptake
of the labelled tracers by the bone.
Micro-CT was used in the current study as it has shown reliable results in
previous studies in our laboratory.

96
Histological evaluation has the advantage of evaluating the evolution of events at
the cellular level while micro-CT does not have this capability. Consequently, histology
will demonstrate changes that the µCT will not detect. As previously discussed, HBOT
has been shown to positively influence angiogenesis thereby increasing the total
number of blood vessels in surgical and injured sites. 9,30-34 It has also been proved that
HBOT positively affects bone density.8,15-18,29,30,117,119 Furthermore, tissues exposed to
higher oxygen tension, in vitro, formed bone while tissues exposed to low oxygen
tension have been shown to produce cartilage. 8,26,29,36 Hence, we decided to identify
osteoclasts, active osteoblasts, osteoid tissue, and increased vascularity in our H&E
stained histological sections. We also attempted to stain the slides with TRAP and ALP.
As our samples were stored in formalin for two years, we were unsuccessful in these
attempts as extended fixation has been known to adversely affect the histochemical
staining.131
4.1.4 Time Points Investigated
Jan et al found significant effects with the use of HBOT on bone regeneration in
critical- sized defects (15mm) in rabbits’ calvarial models at 6 weeks. The protocol used
for the HBOT was similar to the one used in our study (100% oxygen at 2.4 ATA,
90min/dive, 20 dives). A difference in bone density between the groups sacrificed at 6
weeks as compared to the group sacrificed at 12 weeks was not demonstrated.8 Fok et
al found significantly increased expression of VEGF in rabbit calvarial samples exposed
to HBO as compared to their NBO counterparts at 6 weeks. There was no difference,
however, in the VEGF expression in the 12 weeks samples.31 Based on the findings of
the previous studies, we decided to use the 6 weeks time point in this study.

97
4.2) Interpretation of Results
Three different parameters were evaluated using µCT reflecting bone quantity,
quality, and architecture. Bone quantity was evaluated by examining the total volume
(TV), bone volume (BV), bone mineral content (BMC), or tissue mineral content (TMC).
Increases in the absolute amounts of these indices could indicate bone growth,
remodelling, or a disease process that results in bone deposition such as osteopetrosis.
On the other hand, decreases in these parameters may be seen in cases of bone loss,
such as osteoporosis or bone resorbing tumors.
Changes in bone quality were evaluated using bone mineral density (BMD),
tissue mineral density (TMD), and bone volume fraction (BVF). Those values were
corrected to the volume of the region of interest (ROI). A higher BMD may reflect
increased bone formation while lower BMD values could reflect increased bone
resorption. A higher TMD could indicate that bone matrix was becoming more
mineralized, while lower values would reflect accumulations of under-mineralized
osteoid (such as seen in rickets). Higher BVF, on the other hand, would suggest
increased bone formation, while low BVFs would reflect decreased bone formation (e.g.
remodelling or osteolytic tumor). Generally, these variables are directly influenced by
increased or decreased calcium content within the bone tissue and do not provide any
indications about the form of the bone.
Changes in bone architecture were identified using the surface area (SA),
trabecular thickness (Tb. Th.), or structure model index (SMI). Bone formation would be
expected to result in a net increase in the surface area and trabecular thickness of
bone; on the other hand, bone resorption would result in thinner trabeculae and smaller

98
surface area resulting in lower values for those variables. The SMI gives information
about the shape of the trabeculae. Trabecular forms ranged from rod-like to plate-like.
Rod-like trabeculae had an SMI of "3" while plate-like trabeculae had values of "0". One
would normally expect positive values; however, when calculated in the presence of
high BVF samples then the SMI becomes negative.
As stated earlier, there was a slight increase in all bone quantity measures (i.e.
TV, BV, BMC, TMC) in the HBO group as compared to the NBO group with p values
ranging from 0.12 to 0.17. The other parameters (TV, BV, BVF, TMC, BMC, S.A., Tb.
Th.) showed variable pattern with p values of 0.21 to 0.85. Due to the small sample size
however, we cannot rely on the results of the test of normality (i.e. Shapiro-Wilk and
Kolmogorov-Smirnova test) so we did the Mann-Whitney U test to confirm our results. It
showed similar results where the quantity measures showed a p value of 0.19 to 0.28
while the other parameter had a p value of 0.22 to 0.75.
Histological results confirmed the non-fusion of the endplate to the main vertebral
body, reflecting the age of these rabbits used in this investigation. According to the
growth charts, our rabbits were 4.5 months old at sacrifice.138 Fusion of the endplates
occurs at four years old. The appearance of the endplates was similar in both groups in
all the aspects that were evaluated. The exception to this was the main vertebral body
that appeared to have more hematogenous infiltrate within the marrow spaces in these
animals treated with HBO. Osteoclasts were seen in both groups, forming cutting cones.
No differences in the blood vessel distribution were noticed between and within the
groups. Neither active osteoblasts nor osteoid were detected in any of the samples from
both groups. The differentiation of chondrocytes and the amount of mineralization seen

99
closer to the main vertebral body end of the epiphyseal growth plate were comparable
in both groups. Some mineralization was also noticed at the endplate end of the
epiphyseal growth plate.
No TRAP or ALP staining was seen in any section. Even when we stained
sections where we can see multinucleated osteoclastic cells, there were no positive
staining. This indicated that TRAP stain did not work. A similar lack of staining was
noticed with ALP stained slides. However, as we did not see any histologically
osteoblast-like cells in the H & E stained slides. This lack of TRAP staining is probably
due to the extended period of fixation in formalin as mentioned earlier.
Interpretation of these findings combined together (i.e. micro-CT and histology),
in the lumbar vertebrae allowed for development of two possible explanations for the
findings of this study. One explanation is that there was no actual difference between
the groups investigated and that the benefit from the HBO therapy seen at the surgical
sites was not seen at distant sites. Another possible explanation is that there might be a
difference that was not discovered due to type II error (also known as β error), and as
such a larger sample would be needed.
HBOT did not have an effect on bone distant from surgical sites and these
findings are similar to those reported by others. Berendt did a systematic review
assessing the use of HBO for the treatment of diabetic feet. From this analysis, he
concluded that the studies that were selected for this review had methodological
weaknesses. He recommended that HBOT should not be offered for the treatment of
diabetic foot wounds until large scale double- blind studies were undertaken.139 Yuan et
al performed an investigation where a novel isolated blood vessel preparation was used

100
to investigate the effects of HBO on VEGF. They determined that there was no effect of
HBOT on the expression of VEGF in vitro.140 Similarly, Humber et al reported no
statistically significant differences between the HBO and NBO groups on the calvarial
defects investigated in the animals used in our study. Differences were not seen in any
of the parameters measured including the radiomorphometric evaluation of the residual
bony defects. These findings were explained as resulting from a compromised blood
supply to the defects covered with the resorbable liquid membrane that isolated the
periosteum.123
Other studies evaluating the effects of HBOT on implant integration rates
concluded that this form of treatment was not cost-effective. Keller et al, for example,
reviewed implant placement in irradiated mandibles without HBO. Fourteen studies
were included in his review. A total of 760 implants were evaluated retrospectively in
those studies and success rates of at least 95% were seen. This rate of implant
integration in irradiated cases is equivalent to the rate of integration reported for
implants placed in non-irradiated patients. They found that the use of HBOT would not
be cost- effective based on their findings even if any insignificant benefits were seen
with the use of HBOT.141
Differences in bone densities that were seen in the current study, although not
statistically significant, could reflect a positive influence of HBOT. There are numerous
studies reported in the literature supporting the positive influence of HBOT on bone and
other tissues. Marx et al determined that HBOT promoted angiogenesis.9 Others found
that HBOT stimulates vascular endothelial growth factor (VEGF) expression in healing
tissues which further promotes angiogenesis.31-34 In our study, we did not observe a

101
difference between the two groups in the appearance or the number of blood vessels as
shown in the histological sections. VEGF was not evaluated in our samples as they
were kept in formalin for an extended period of time (i.e. archive samples) making
staining with a VEGF stain difficult.
HBOT has also been reported to exert effects through the recruitment of
macrophages- stimulating the macrophages to secrete their macrophage-derived
growth factor (MDGF) as well as the angiogenic factor (MDAF). These are also believed
to promote angiogenesis.20
HBOT has been shown to influence osteoblasts resulting in increased levels of
activity in these cells as shown by Muhonen et al. In their study, osteoblastic activity
was measured by ex vivo [18F] fluoride digital autoradiography in an irradiated rabbit
model subjected to distraction osteogenesis with and without HBO. Higher osteoblastic
activity was seen in the HBO group. They also demonstrated positive effects of HBOT
on angiogenesis. Vascularity was evaluated histomorphometrically using type IV
collagen in addition to H&E stained sections. The results showed a 1.7-fold increase in
the number of blood vessels in the HBO group compared to irradiated rabbits without
HBO.30 Jan et al demonstrated positive effects of HBOT on a rabbit’s calvarial critical-
sized defect (i.e. 15mm). When the defect sizes were increased to 18mm (i.e. supra-
critical), they were found to be completely filled with bone under the influence of HBOT.8
Other studies showed positive effects of high oxygen concentration (95%) on embryonic
tissues incubated for 6 hours in vitro.112,113 However, most of these studies evaluated
the effect of HBOT on surgical sites.

102
To our knowledge, only one study has evaluated the effects of HBOT on un-
operated bones that had not undergone any surgery or radiation. This study was
conducted by Aoki et al. They exposed mice to continuous hyperbaric conditions (2ATA)
for a two- week period. They used "Heliox" which contains 12% oxygen mixed with 88%
helium. The controls were exposed to Heliox at 1 ATA for the same period of time. The
bone was visually analyzed using plain x-ray films. They also used bone scanning to
measure the amount of uptake of 99mTc-MDP. They found a 4% difference between the
two groups, a difference that was found to be statistically significant according to their
methodology. They concluded that hyperbaric conditions result in improved bone
density.36
Based on the results of the aforementioned studies, we would expect HBOT to
improve bone formation. Our study showed similarly improved bone measurements in
the HBO group. However, the results were found to be of no statistical significance (p >
0.05). Based on the sample size calculation, the difference seen in this investigation
could suggest significance if the sample size was enlarged. For example, the BV
difference could probably reach significant levels if the sample size was increased to 33
animals per group (n=33).
Some studies reported in the literature discussed some possible negative effects
of HBOT. Annane et al did a randomized, placebo-controlled, double-blind multicenter
trial to study the effects of HBOT on the treatment of patients having mandibular ORN.
A total of 68 patients were included in the study. They used a protocol similar to the one
used in this study with a total number of 40 dives. A 19% recovery rate was seen in the
HBO arm versus 32% in the NBO arm. The trial was stopped due to potentially worse

103
outcomes in the HBO arm.142 D’Souza et al performed an eight- year retrospective
study and demonstrated that there was a 12.5% cure rate in the HBO group and 86% in
the non-HBO group. They observed no added benefit from HBOT, and hence did not
recommend its use.143Groger et al compared the effect of repetitive HBOT applications
on human blood cell DNA. Undersea demolition team (UDT) divers were used as the
HBO group. Their diving practices comprised repetitive HBO exposure over a period of
years. Non-divers were used as controls. There was no difference in the incidence of
blood cell DNA damage or in antioxidant enzyme activity between the groups in vivo.
Lymphocytes were isolated from both categories and subjected to a single HBOT (98%
oxygen at 4 ATA for 2h) ex vivo. The divers’ lymphocytes demonstrated significant DNA
damage and superoxide free radical production compared to the non-divers’
lymphocytes.42 Not only that, but the risk of developing blood mutations, as a result of
repetitive HBOT, might exist.121
In our study, although HBOT did not significantly improve bone density, neither did it
harm the bone tissue. There were no harmful effects seen in bone due to the application
of HBOT. The effect of the HBOT was not seen in the calvarial side of this sample due
to the use of the resorbable liquid membrane (RLM) as explained by Humber et al. The
amount of RLM used had elevated the periosteum of the surgical site, compromising its
blood supply. As discussed earlier Jan et al used the same HBO protocol and had
statistically significant results on the calvarial defects. On the vertebral side however,
there were no comparative studies except for the one by Aoki et al. The differences
between the two studies (i.e. our study and Aoki’s study) were discussed in the previous
pages of this discussion. Our recommendation for future studies investigating the

104
effects of HBOT on bone distant from the surgical sites, that may result in a positive
effect of HBOT on these bones, will be summarized as follows:
Based on our sample size calculations, larger sample sizes are recommended. The
methodology should be improved so that it is more sensitive in detecting minor changes
in bone tissues. For example, we suggest the use of bone radio-labelled tracers or
markers like the one used by Aoki et al. Appropriate tissue processing and immuno-
histochemistry should also be considered. For example, VEGF stain should be
considered for blood vessel changes. We would also suggest that multiple ages of
animals be examined. This would allow for differences in the aging and physiological
rates to be identified between rabbits and humans. Increasing the sigma time- 2 sigma
times (12 weeks) instead of one- might have an effect due to the increased
compactness of bone as reported earlier. Due to the difference in the rate of fusion of
rabbit bones as compared to the human fusion rate, comments should be made
carefully as we apply the results to human beings. Aoki found a significant difference by
increasing the atmospheric pressure. He used 12 % oxygen concentration only.36 If we
combine his results with the theory that supports HBO use, we would expect to see a
difference that might be significant. This might lead to another suggestion for future
studies. Increasing the total amount of oxygen exposure to 30 or even 40 dives in total
might show an effect. Including other trabecular- rich bones should be considered as
well. The heads of femur, humorus, and tibial bones are examples of trabecular- rich
sites.

105
In conclusion, while we did not observe any beneficial effects from hyperbaric
oxygen therapy on bones distant from surgical sites neither did we see any harmful
effects at the 6 weeks time point. Further studies in this matter are recommended to
further investigate the effect of HBOT on bones distant from surgical sites.

106
Reference List
(1) Hampson NB. Hyperbaric oxygen: a plea for uniform nomenclature. Undersea
Hyperb Med. 1999;26:267.
(2) Allan File. Hyperbaric Oxygen Therapy. Carle Selected Papers. 2006;49:4-7.
(3) Gill AL, Bell CN. Hyperbaric oxygen: its uses, mechanisms of action and
outcomes. QJM. 2004;97:385-395.
(4) Evans, A. W. Hyperbaric Oxygen Therapy. University Health Network Website.
2002.
Ref Type: Internet Communication
(5) Severinghaus JW. Fire-air and dephlogistication. Revisionisms of oxygen's
discovery. Adv Exp Med Biol. 2003;543:7-19.
(6) Caritas Health Group. Hyperbaric Oxygen Therapy. Caritas Hyperbaric
Oxygen Program . 2011.
Ref Type: Electronic Citation
(7) Tibbles PMEJS. Medical Progress: Hyperbaric-Oxygen Therapy. N Engl J Med.
1996;334:1642-1649.

107
(8) Jan AM, Sandor GK, Iera D et al. Hyperbaric oxygen results in an increase in
rabbit calvarial critical sized defects. Oral Surg Oral Med Oral Pathol Oral
Radiol Endod. 2006;101:144-149.
(9) Marx RE, Ehler WJ, Tayapongsak P, Pierce LW. Relationship of oxygen dose
to angiogenesis induction in irradiated tissue. Am J Surg. 1990;160:519-524.
(10) Hunt TK, Pai MP. The effect of varying ambient oxygen tensions on wound
metabolism and collagen synthesis. Surg Gynecol Obstet. 1972;135:561-567.
(11) Gabb G, Robin ED. Hyperbaric oxygen. A therapy in search of diseases. Chest.
1987;92:1074-1082.
(12) Leach RM, Rees PJ, Wilmshurst P. Hyperbaric oxygen therapy. BMJ.
1998;317:1140-1143.
(13) Brown DH, Evans AW, Sandor GK. Hyperbaric oxygen therapy in the
management of osteoradionecrosis of the mandible. Adv Otorhinolaryngol.
1998;54:14-32.
(14) Brown DH, Evans AW, Sandor GK. Hyperbaric oxygen therapy in the
management of osteoradionecrosis of the mandible. Adv Otorhinolaryngol.
1998;54:14-32.

108
(15) Muhonen A, Peltomaki T, Hinkka S, Happonen RP. Effect of mandibular
distraction osteogenesis on temporomandibular joint after previous irradiation
and hyperbaric oxygenation. Int J Oral Maxillofac Surg. 2002;31:397-404.
(16) Muhonen A, Muhonen J, Lindholm TC et al. Osteodistraction of a previously
irradiated mandible with or without adjunctive hyperbaric oxygenation: an
experimental study in rabbits. Int J Oral Maxillofac Surg. 2002;31:519-524.
(17) Muhonen A, Peltomaki T, Knuuti J, Raitakari O, Happonen RP. Osteoblastic
activity of the rabbit temporomandibular joint during distraction osteogenesis
assessed by [18F]fluoride positron emission tomography. Eur J Oral Sci.
2002;110:144-148.
(18) Muhonen A, Muhonen J, Lindholm TC et al. Osteodistraction of a previously
irradiated mandible with or without adjunctive hyperbaric oxygenation: an
experimental study in rabbits. Int J Oral Maxillofac Surg. 2002;31:519-524.
(19) van Golde JM, Mulder TA, Scheve E, Prinzen FW, Blanco CE. Hyperoxia and
local organ blood flow in the developing chick embryo. J Physiol. 1999;515 ( Pt
1):243-248.
(20) Knighton DR, Hunt TK, Scheuenstuhl H, Halliday BJ, Werb Z, Banda MJ.
Oxygen tension regulates the expression of angiogenesis factor by
macrophages. Science. 1983;221:1283-1285.

109
(21) Knighton DR, Halliday B, Hunt TK. Oxygen as an antibiotic. The effect of
inspired oxygen on infection. Arch Surg. 1984;119:199-204.
(22) Thom SR. Antagonism of carbon monoxide-mediated brain lipid peroxidation by
hyperbaric oxygen. Toxicol Appl Pharmacol. 1990;105:340-344.
(23) Larson A. EMUJKLLF&M. Hyperbaric oxygen treatment of postoperative
neurosurgical infections. Neurosurgery. 2002;287-295.
(24) Fenton CC, Kertesz T, Baker G, Sandor GK. Necrotizing fasciitis of the face: a
rare but dangerous complication of dental infection. J Can Dent Assoc.
2004;70:611-615.
(25) Broussard CL. Hyperbaric oxygenation and wound healing. J Wound Ostomy
Continence Nurs. 2003;30:210-216.
(26) Bassett CAL. Current Concepts of Bone Formation. J Bone Joint Sur.
1962;44:1217-1244.
(27) Trueta J. The Role of Vessels in Osteogenesis. J Bone Joint Surg Br.
1963;45:402.

110
(28) Hulth A, Johnell O, Lindberg L, Paulsson M, Heinegard D. Demonstration of
blood-vessellike structures in cartilaginous callus by antilaminin and antiheparin
sulfate proteoglycan antibodies. Clin Orthop Relat Res. 1990;289-293.
(29) Jan A, Sandor GK, Brkovic BB, Peel S, Evans AW, Clokie CM. Effect of
hyperbaric oxygen on grafted and nongrafted calvarial critical-sized defects.
Oral Surg Oral Med Oral Pathol Oral Radiol Endod. 2009;107:157-163.
(30) Muhonen A, Haaparanta M, Gronroos T et al. Osteoblastic activity and
neoangiogenesis in distracted bone of irradiated rabbit mandible with or without
hyperbaric oxygen treatment. Int J Oral Maxillofac Surg. 2004;33:173-178.
(31) Fok TC, Jan A, Peel SA, Evans AW, Clokie CM, Sandor GK. Hyperbaric
oxygen results in increased vascular endothelial growth factor (VEGF) protein
expression in rabbit calvarial critical-sized defects. Oral Surg Oral Med Oral
Pathol Oral Radiol Endod. 2008;105:417-422.
(32) Mulhauser J MMPReal. VEGF 165 expressed by a replication-deficient
recombinant adenovirus vector induces angiogenesis in vivo. Circ Res.
1995;77:1077-1086.
(33) Ozaki H, Hayashi H, Vinores SA, Moromizato Y, Campochiaro PA, Oshima K.
Intravitreal sustained release of VEGF causes retinal neovascularization in

111
rabbits and breakdown of the blood-retinal barrier in rabbits and primates. Exp
Eye Res. 1997;64:505-517.
(34) Tsurumi Y, Takeshita S, Chen D et al. Direct intramuscular gene transfer of
naked DNA encoding vascular endothelial growth factor augments collateral
development and tissue perfusion. Circulation. 1996;94:3281-3290.
(35) Wu DMJCR&XY. Effects of hyperbaric oxygen on
proliferation and differentiation of osteoblasts from human alveolar bone. Connect
Tissue Res. 2007;48:206-213.
(36) Aoki H. Bone changes due to hyperbaric exposure. Appl Human Sci.
1997;16:143-148.
(37) Marx RE SD. Management of irradiated patients and osteonecrosis. Oral and
Maxillofacial pathology. A rational for diagnosis and treatment. (Eds). Illinois:
Quintessence
Publishing Co Inc; 2003:375-94.
(38) Feldmeier JJ, Court WS, Davolt DA, Stegmann B, Heimbach RD, Sheffield PT.
Hyperbaric oxygen therapy. Otolaryngol Head Neck Surg. 1997;116:703-704.
(39) Thackham JA, McElwain DL, Long RJ. The use of hyperbaric oxygen therapy to
treat chronic wounds: A review. Wound Repair Regen. 2008;16:321-330.

112
(40) Gelfand R, Lambertsen CJ, Clark JM. Ventilatory effects of prolonged
hyperoxia at pressures of 1.5-3.0 ATA. Aviat Space Environ Med. 2006;77:801-
810.
(41) Hendricks PL, Hall DA, Hunter WL, Jr., Haley PJ. Extension of pulmonary O2
tolerance in man at 2 ATA by intermittent O2 exposure. J Appl Physiol.
1977;42:593-599.
(42) Groger M, Oter S, Simkova V et al. DNA damage after long-term repetitive
hyperbaric oxygen exposure. J Appl Physiol. 2009;106:311-315.
(43) Ten Cate AR. Bone. In: Don Ladig, Linda L.Duncan, Melba Steube, George
B.Stericker, eds. Oral Histology; Development, Structure, and Function. Fourth
ed. Toronto: Mosby; 1994:120-46.
(44) Robinson RA. Bone tissue: composition and function. Johns Hopkins Med J.
1979;145:10-24.
(45) Fisher LW, McBride OW, Termine JD, Young MF. Human bone sialoprotein.
Deduced protein sequence and chromosomal localization. J Biol Chem.
1990;265:2347-2351.
(46) Denhardt DT, Guo X. Osteopontin: a protein with diverse functions. FASEB J.
1993;7:1475-1482.

113
(47) Weinreb M, Shinar D, Rodan GA. Different pattern of alkaline phosphatase,
osteopontin, and osteocalcin expression in developing rat bone visualized by in
situ hybridization. J Bone Miner Res. 1990;5:831-842.
(48) Luyten FP, Cunningham NS, Vukicevic S, Paralkar V, Ripamonti U, Reddi AH.
Advances in osteogenin and related bone morphogenetic proteins in bone
induction and repair. Acta Orthop Belg. 1992;58 Suppl 1:263-267.
(49) Luyten FP, Yu YM, Yanagishita M, Vukicevic S, Hammonds RG, Reddi AH.
Natural bovine osteogenin and recombinant human bone morphogenetic
protein-2B are equipotent in the maintenance of proteoglycans in bovine
articular cartilage explant cultures. J Biol Chem. 1992;267:3691-3695.
(50) Termine JD, Kleinman HK, Whitson SW, Conn KM, McGarvey ML, Martin GR.
Osteonectin, a bone-specific protein linking mineral to collagen. Cell.
1981;26:99-105.
(51) Potts JR, Campbell ID. Fibronectin structure and assembly. Curr Opin Cell Biol.
1994;6:648-655.
(52) Sherbina NV, Bornstein P. Modulation of thrombospondin gene expression
during osteoblast differentiation in MC3T3-E1 cells. Bone. 1992;13:197-201.

114
(53) Steijlen PM, Maessen E, Kresse H et al. Expression of tenascin, biglycan and
decorin in disorders of keratinization. Br J Dermatol. 1994;130:564-568.
(54) Urist MR. Bone morphodifferentiation and tumorigenesis. Perspect Biol Med.
1979;22:S89-S113.
(55) Urist MR, Mikulski A, Lietze A. Solubilized and insolubilized bone
morphogenetic protein. Proc Natl Acad Sci U S A. 1979;76:1828-1832.
(56) Urist MR, Mikulski AJ. A soluble bone morphogenetic protein extracted from
bone matrix with a mixed aqueous and nonaqueous solvent. Proc Soc Exp Biol
Med. 1979;162:48-53.
(57) Marks SC, Jr., Popoff SN. Bone cell biology: the regulation of development,
structure, and function in the skeleton. Am J Anat. 1988;183:1-44.
(58) Bruder SP, Fink DJ, Caplan AI. Mesenchymal stem cells in bone development,
bone repair, and skeletal regeneration therapy. J Cell Biochem. 1994;56:283-
294.
(59) Bilezikian JP, Raisz LG, Rodan GA. Principles of bone biology. San Diego:
Academic Press; 1996.
(60) Aubin JE. Bone stem cells. J Cell Biochem Suppl. 1998;30-31:73-82.

115
(61) Aubin JE. Advances in the osteoblast lineage. Biochem Cell Biol. 1998;76:899-
910.
(62) Hicks DG, O'Keefe RJ, Reynolds KJ et al. Effects of lead on growth plate
chondrocyte phenotype. Toxicol Appl Pharmacol. 1996;140:164-172.
(63) Myers MA, Casciani T, Whitbeck MG, Jr., Puzas JE. Vertebral body osteopenia
associated with posterolateral spine fusion in humans. Spine (Phila Pa 1976 ).
1996;21:2368-2371.
(64) Aubin JE, Liu F, Malaval L, Gupta AK. Osteoblast and chondroblast
differentiation. Bone. 1995;17:77S-83S.
(65) Pinero GJ, Farach-Carson MC, Devoll RE, Aubin JE, Brunn JC, Butler WT.
Bone matrix proteins in osteogenesis and remodelling in the neonatal rat
mandible as studied by immunolocalization of osteopontin, bone sialoprotein,
alpha 2HS-glycoprotein and alkaline phosphatase. Arch Oral Biol. 1995;40:145-
155.
(66) Clarkin CE, Emery RJ, Pitsillides AA, Wheeler-Jones CP. Evaluation of VEGF-
mediated signaling in primary human cells reveals a paracrine action for VEGF
in osteoblast-mediated crosstalk to endothelial cells. J Cell Physiol.
2008;214:537-544.

116
(67) Samee M, Kasugai S, Kondo H, Ohya K, Shimokawa H, Kuroda S. Bone
morphogenetic protein-2 (BMP-2) and vascular endothelial growth factor
(VEGF) transfection to human periosteal cells enhances osteoblast
differentiation and bone formation. J Pharmacol Sci. 2008;108:18-31.
(68) Bellows CG, Aubin JE, Heersche JN. Initiation and progression of
mineralization of bone nodules formed in vitro: the role of alkaline phosphatase
and organic phosphate. Bone Miner. 1991;14:27-40.
(69) Canalis E, Centrella M, McCarthy TL. Regulation of insulin-like growth factor-II
production in bone cultures. Endocrinology. 1991;129:2457-2462.
(70) Canalis E, McCarthy TL, Centrella M. Effects of desamino-(1-3)-insulin-like
growth factor I on bone cell function in rat calvarial cultures. Endocrinology.
1991;129:534-541.
(71) Canalis E, McCarthy TL, Centrella M. Growth factors and cytokines in bone cell
metabolism. Annu Rev Med. 1991;42:17-24.
(72) Liu JZ, Ji ZL, Chen SM. [The OPG/RANKL/RANK system and bone resorptive
disease]. Sheng Wu Gong Cheng Xue Bao. 2003;19:655-660.
(73) Theoleyre S, Wittrant Y, Tat SK, Fortun Y, Redini F, Heymann D. The
molecular triad OPG/RANK/RANKL: involvement in the orchestration of

117
pathophysiological bone remodeling. Cytokine Growth Factor Rev.
2004;15:457-475.
(74) Palumbo C, Palazzini S, Zaffe D, Marotti G. Osteocyte differentiation in the tibia
of newborn rabbit: an ultrastructural study of the formation of cytoplasmic
processes. Acta Anat (Basel). 1990;137:350-358.
(75) Aarden EM, Wassenaar AM, Alblas MJ, Nijweide PJ. Immunocytochemical
demonstration of extracellular matrix proteins in isolated osteocytes. Histochem
Cell Biol. 1996;106:495-501.
(76) Aarden EM, Nijweide PJ, van der PA et al. Adhesive properties of isolated chick
osteocytes in vitro. Bone. 1996;18:305-313.
(77) Parfitt AM. The actions of parathyroid hormone on bone: relation to bone
remodeling and turnover, calcium homeostasis, and metabolic bone disease.
Part I of IV parts: mechanisms of calcium transfer between blood and bone and
their cellular basis: morphological and kinetic approaches to bone turnover.
Metabolism. 1976;25:809-844.
(78) Parfitt AM. The actions of parathyroid hormone on bone: relation to bone
remodeling and turnover, calcium homeostasis, and metabolic bone diseases.
II. PTH and bone cells: bone turnover and plasma calcium regulation.
Metabolism. 1976;25:909-955.

118
(79) Parfitt AM. The actions of parathyroid hormone on bone: relation to bone
remodeling and turnover, calcium homeostasis, and metabolic bone disease.
Part III of IV parts; PTH and osteoblasts, the relationship between bone
turnover and bone loss, and the state of the bones in primary
hyperparathyroidism. Metabolism. 1976;25:1033-1069.
(80) Parfitt AM. The actions of parathyroid hormone on bone: relation to bone
remodeling and turnover, calcium homeostasis, and metabolic bone disease.
Part IV of IV parts: The state of the bones in uremic hyperaparathyroidism--the
mechanisms of skeletal resistance to PTH in renal failure and
pseudohypoparathyroidism and the role of PTH in osteoporosis, osteopetrosis,
and osteofluorosis. Metabolism. 1976;25:1157-1188.
(81) Vander Wiel CJ, Grubb SA, Talmage RV. The presence of lining cells on
surfaces of human trabecular bone. Clin Orthop Relat Res. 1978;350-355.
(82) Dobnig H, Turner RT. Evidence that intermittent treatment with parathyroid
hormone increases bone formation in adult rats by activation of bone lining
cells. Endocrinology. 1995;136:3632-3638.
(83) Ash P, Loutit JF, Townsend KM. Osteoclasts derived from haematopoietic stem
cells. Nature. 1980;283:669-670.
119
(84) Braidman IP, Rothwell C, Webber DM, Crowe P, Anderson DC. Location of
osteoclast precursors in fetal rat calvaria cultured on collagen gels. J Bone
Miner Res. 1990;5:287-298.
(85) van de Wijngaert FP, Tas MC, Burger EH. Characteristics of osteoclast
precursor-like cells grown from mouse bone marrow. Bone Miner. 1987;3:111-
123.
(86) van de Wijngaert FP, Tas MC, van der Meer JW, Burger EH. Growth of
osteoclast precursor-like cells from whole mouse bone marrow: inhibitory effect
of CSF-1. Bone Miner. 1987;3:97-110.
(87) Holtrop ME, King GJ. The ultrastructure of the osteoclast and its functional
implications. Clin Orthop Relat Res. 1977;177-196.
(88) Alsina M, Boyce B, Devlin RD et al. Development of an in vivo model of human
multiple myeloma bone disease. Blood. 1996;87:1495-1501.
(89) Drake FH, Dodds RA, James IE et al. Cathepsin K, but not cathepsins B, L, or
S, is abundantly expressed in human osteoclasts. J Biol Chem.
1996;271:12511-12516.
(90) Blair HC, Teitelbaum SL, Ghiselli R, Gluck S. Osteoclastic bone resorption by a
polarized vacuolar proton pump. Science. 1989;245:855-857.

120
(91) Walker DG. Control of bone resorption by hematopoietic tissue. The induction
and reversal of congenital osteopetrosis in mice through use of bone marrow
and splenic transplants. J Exp Med. 1975;142:651-663.
(92) Clark SA, Ambrose WW, Anderson TR, Terrell RS, Toverud SU. Ultrastructural
localization of tartrate-resistant, purple acid phosphatase in rat osteoclasts by
histochemistry and immunocytochemistry. J Bone Miner Res. 1989;4:399-405.
(93) Reponen P, Sahlberg C, Munaut C, Thesleff I, Tryggvason K. High expression
of 92-kDa type IV collagenase (gelatinase) in the osteoclast lineage during
mouse development. Ann N Y Acad Sci. 1994;732:472-475.
(94) Reponen P, Sahlberg C, Munaut C, Thesleff I, Tryggvason K. High expression
of 92-kD type IV collagenase (gelatinase B) in the osteoclast lineage during
mouse development. J Cell Biol. 1994;124:1091-1102.
(95) Rice DP, Kim HJ, Thesleff I. Detection of gelatinase B expression reveals
osteoclastic bone resorption as a feature of early calvarial bone development.
Bone. 1997;21:479-486.
(96) Dew G, Murphy G, Stanton H et al. Localisation of matrix metalloproteinases
and TIMP-2 in resorbing mouse bone. Cell Tissue Res. 2000;299:385-394.

121
(97) Vincent JB, Averill BA. An enzyme with a double identity: purple acid
phosphatase and tartrate-resistant acid phosphatase. FASEB J. 1990;4:3009-
3014.
(98) Vincent JB, Averill BA. Sequence homology between purple acid phosphatases
and phosphoprotein phosphatases. Are phosphoprotein phosphatases
metalloproteins containing oxide-bridged dinuclear metal centers? FEBS Lett.
1990;263:265-268.
(99) Zaidi M, Pazianas M, Shankar VS et al. Osteoclast function and its control. Exp
Physiol. 1993;78:721-739.
(100) Zaidi M, Alam AS, Shankar VS et al. Cellular biology of bone resorption. Biol
Rev Camb Philos Soc. 1993;68:197-264.
(101) Storey E. Growth and remodeling of bone and bones. Am J Orthod.
1972;62:142-165.
(102) Baron RE. Anatomy and ultrastructure of bone. In: Favus MJ, ed. Primer on
the metabolic bone diseases and disorders of mineral metabolism. New York:
Lippincott-Raven Publishers.; 1996:3-10.
(103) PRITCHARD JJ, SCOTT JH, GIRGIS FG. The structure and development of
cranial and facial sutures. J Anat. 1956;90:73-86.
122
(104) McKibbin B. The biology of fracture healing in long bones. J Bone Joint Surg
Br. 1978;60-B:150-162.
(105) Bianco P, Cancedda FD, Riminucci M, Cancedda R. Bone formation via
cartilage models: the "borderline" chondrocyte. Matrix Biol. 1998;17:185-192.
(106) Horowitz MC, Xi Y, Wilson K, Kacena MA. Control of osteoclastogenesis and
bone resorption by members of the TNF family of receptors and ligands.
Cytokine Growth Factor Rev. 2001;12:9-18.
(107) Karsenty G. Role of Cbfa1 in osteoblast differentiation and function. Semin Cell
Dev Biol. 2000;11:343-346.
(108) Karsenty G. Bone formation and factors affecting this process. Matrix Biol.
2000;19:85-89.
(109) Karsenty G. The central regulation of bone remodeling. Trends Endocrinol
Metab. 2000;11:437-439.
(110) Moon RE, Feldmeier JJ. Hyperbaric oxygen: an evidence based approach to its
application. Undersea Hyperb Med. 2002;29:1-3.
(111) Shaw JK BC. The effects of varying oxygen concentrations on osteogenesis
and embryonic cartilage in vitro. J Bone Joint Surg. 1967;49A:73-80.
123
(112) FLANAGAN B, NICHOLS G, Jr. Metabolic studies of bone in vitro. IV. Collagen
biosynthesis by surviving bone fragments in vitro. J Biol Chem. 1962;237:3686-
3692.
(113) KAO KY, HITT WE, BUSH AT, MCGAVACK TH. CONNECTIVE TISSUE XI.
FACTORS AFFECTING COLLAGEN SYNTHESIS BY RAT UTERINE SLICES.
Proc Soc Exp Biol Med. 1964;115:422-424.
(114) Conconi MT, Baiguera S, Guidolin D et al. Effects of hyperbaric oxygen on
proliferative and apoptotic activities and reactive oxygen species generation in
mouse fibroblast 3T3/J2 cell line. J Investig Med. 2003;51:227-232.
(115) Nilsson LP, Granstrom G, Rockert HO. Effects of dextrans, heparin and
hyperbaric oxygen on mandibular tissue damage after osteotomy in an
experimental system. Int J Oral Maxillofac Surg. 1987;16:77-89.
(116) Hsieh CP, Chiou YL, Lin CY. Hyperbaric oxygen-stimulated proliferation and
growth of osteoblasts may be mediated through the FGF-2/MEK/ERK 1/2/NF-
kappaB and PKC/JNK pathways. Connect Tissue Res. 2010;51:497-509.
(117) Tuncay OC, Ho D, Barker MK. Oxygen tension regulates osteoblast function.
Am J Orthod Dentofacial Orthop. 1994;105:457-463.

124
(118) Nilsson P, Albrektsson T, Granstrom G, Rockert HO. The effect of hyperbaric
oxygen treatment on bone regeneration: an experimental study using the bone
harvest chamber in the rabbit. Int J Oral Maxillofac Implants. 1988;3:43-48.
(119) Sawai T, Niimi A, Takahashi H, Ueda M. Histologic study of the effect of
hyperbaric oxygen therapy on autogenous free bone grafts. J Oral Maxillofac
Surg. 1996;54:975-981.
(120) Ueng SW, Lee SS, Lin SS et al. Bone healing of tibial lengthening is enhanced
by hyperbaric oxygen therapy: a study of bone mineral density and torsional
strength on rabbits. J Trauma. 1998;44:676-681.
(121) Speit G, Dennog C, Radermacher P, Rothfuss A. Genotoxicity of hyperbaric
oxygen. Mutat Res. 2002;512:111-119.
(122) Lu C, Rollins M, Hou H et al. Tibial fracture decreases oxygen levels at the site
of injury. Iowa Orthop J. 2008;28:14-21.
(123) Humber CC, Sandor GK, Davis JM et al. Bone healing with an in situ-formed
bioresorbable polyethylene glycol hydrogel membrane in rabbit calvarial
defects. Oral Surg Oral Med Oral Pathol Oral Radiol Endod. 2010;109:372-384.

125
(124) Haddad AJ, Peel SA, Clokie CM, Sandor GK. Closure of rabbit calvarial critical-
sized defects using protective composite allogeneic and alloplastic bone
substitutes. J Craniofac Surg. 2006;17:926-934.
(125) Moghadam HG, Sandor GK, Holmes HH, Clokie CM. Histomorphometric
evaluation of bone regeneration using allogeneic and alloplastic bone
substitutes. J Oral Maxillofac Surg. 2004;62:202-213.
(126) Clokie CM, Moghadam H, Jackson MT, Sandor GK. Closure of critical sized
defects with allogenic and alloplastic bone substitutes. J Craniofac Surg.
2002;13:111-121.
(127) The General Electric Company.
GE Healthcare Pre-Clinical Application Note-12, Direction 5262393-100 .
2008.
Ref Type: Generic
(128) Sheehan DC, Hrapchak BB. Theory and practice of histotechnology. 2nd ed ed.
Columbus, Ohio: Battelle Press; 1987.
(129) BURSTONE MS. Histochemical demonstration of acid phosphatases with
naphthol AS-phosphates. J Natl Cancer Inst. 1958;21:523-539.

126
(130) BURSTONE MS. Histochemical demonstration of acid phosphatase activity in
osteoclasts. J Histochem Cytochem. 1959;7:39-41.
(131) Gruber HE, Marshall GJ, Nolasco LM, Kirchen ME, Rimoin DL. Alkaline and
acid phosphatase demonstration in human bone and cartilage: effects of
fixation interval and methacrylate embedments. Stain Technol. 1988;63:299-
306.
(132) Gallacher SJ, Gallagher AP, McQuillian C, Mitchell PJ, Dixon T. The
prevalence of vertebral fracture amongst patients presenting with non-vertebral
fractures. Osteoporos Int. 2007;18:185-192.
(133) Van der KM, De Laet CE, McCloskey EV, Hofman A, Pols HA. The incidence of
vertebral fractures in men and women: the Rotterdam Study. J Bone Miner
Res. 2002;17:1051-1056.
(134) Gokce S, Bengi AO, Akin E et al. Effects of hyperbaric oxygen during
experimental tooth movement. Angle Orthod. 2008;78:304-308.
(135) Okubo Y, Bessho K, Fujimura K, Kusumoto K, Ogawa Y, Iizuka T. Effect of
hyperbaric oxygenation on bone induced by recombinant human bone
morphogenetic protein-2. Br J Oral Maxillofac Surg. 2001;39:91-95.

127
(136) Roodman GD. Skeletal imaging and management of bone disease.
Hematology Am Soc Hematol Educ Program. 2008;313-319.
(137) Ding M, Odgaard A, Hvid I. Accuracy of cancellous bone volume fraction
measured by micro-CT scanning. J Biomech. 1999;32:323-326.
(138) Harlan Laboratories. New Zealand White Rabbit. internet . 2008. Harlan
Laboratories, Inc.
Ref Type: Electronic Citation
(139) Berendt AR. Counterpoint: hyperbaric oxygen for diabetic foot wounds is not
effective. Clin Infect Dis. 2006;43:193-198.
(140) Yuan J, Handy RD, Moody AJ, Bryson P. Response of blood vessels in vitro to
hyperbaric oxygen (HBO): modulation of VEGF and NO(x) release by external
lactate or arginine. Biochim Biophys Acta. 2009;1787:828-834.
(141) Keller EE. Placement of dental implants in the irradiated mandible: a protocol
without adjunctive hyperbaric oxygen. J Oral Maxillofac Surg. 1997;55:972-980.
(142) Annane D, Depondt J, Aubert P et al. Hyperbaric oxygen therapy for
radionecrosis of the jaw: a randomized, placebo-controlled, double-blind trial
from the ORN96 study group. J Clin Oncol. 2004;22:4893-4900.

128
(143) D'Souza J, Goru J, Goru S, Brown J, Vaughan ED, Rogers SN. The influence
of hyperbaric oxygen on the outcome of patients treated for osteoradionecrosis:
8 year study. Int J Oral Maxillofac Surg. 2007;36:783-787.