Embed Size (px)
Citation preview
289
Gadjah Mada International Journal of Business Vol. 21, No. 3 (September-December 2019): 289-307
*Corresponding author’s e-mail: [email protected]: PRINT 1411-1128 | ONLINE 2338-7238http://journal.ugm.ac.id/gamaijb
The Effects of Financial Derivatives on Earnings Management and Market Mispricing
Oktavia*1, Sylvia Veronica Siregar2, Ratna Wardhani2, and Ning Rahayu2
1Universitas Kristen Krida Wacana, Indonesia2Universitas Indonesia, Indonesia
Abstract: This study aims to examine the effects of financial derivatives on earnings management and market mispricing. A cross-country analysis was applied within the scope of four ASEAN (Association of Southeast Asian Nations) countries that comply with IAS 39, consisting of the Philippines, Indonesia, Malaysia, and Singapore. A sample of 1,395 firm-years of companies using financial derivatives were engaged for study and the ev- idence shows that the use of financial derivatives for hedging purposes decreases the mag- nitude of the earnings management. In addition, this study also supports the idea that earn- ings expectations embedded in the stock returns of companies using financial derivatives, that meet the hedge accounting criteria, reflect the difference in the persistence of cash flow components more accurately than those using financial derivatives for speculative purposes.
Keywords: financial derivatives, earnings management, market mispricing
JEL Classification: G14, G30, M41
Gadjah Mada International Journal of Business - Sept.-Dec., Vol. 21, No. 3, 2019
290
IntroductionThe criteria required by IAS (Interna-
tional Accounting Standard) 39 - Financial Instruments: Recognition and Measurement - to apply hedge accounting for company derivative contracts are strict. Consequent-ly, companies find it difficult to apply hedge accounting to derivative contracts which are actually intended for hedging. When compa-nies fail to meet the hedge accounting criteria for their financial derivatives contracts, any changes in the fair value of such financial de-rivatives instruments would be immediately recognized in their income statements. This could cause the companies’ earnings volatility to increase. Discretionary accruals are often used as a management tool to stabilize earn-ings. However, if financial derivatives trans-actions fulfill the hedge accounting criteria, then companies would be able to offset their gains or losses arising from the financial de-rivatives transactions with the gains or losses arising from their underlying assets. Conse-quently, using discretionary accruals as an income smoothing tool would be greatly re-duced since they would have been substituted by the financial derivatives. The use of finan-cial derivatives by companies can also affect the persistence of their earnings components. Since high-quality earnings are persistent earnings, they can be used as a company’s best forecast for its future earnings (Dichev et al., 2013). This outcome is highly desirable for investors because it can enhance their ability to predict a company’s future earnings.
Besides their ability to affect the com-pany’s earning management, financial deriv-atives also affect market mispricing. Since ASEAN countries have committed them-selves to their convergence with the IFRS, it is without doubt that companies in these coun-tries have also experienced some difficulties
in classifying their financial derivatives’ trans-actions as hedging activities, due to the strict accounting standards set by IAS 39. When a company is unable to apply hedge account-ing to its derivative contracts, it is deemed to be bad news for investors even though the derivatives transactions were intended for hedging activities. The occurrence causes in-vestors to lose confidence in the persistence of the company’s cash flow components. As a result, they will appraise that the cash flow components in companies using speculative financial derivatives would be lower. This is despite the fact that the earnings persistence in companies using financial derivatives for speculative purposes is not lower than in those companies using financial derivatives for hedging purposes. The outcome can be disadvantageous to the companies because lower valuations from investors can affect their stock prices, thereby influencing the in-vestment decisions of potential investors. In this regard, it is important for companies to obtain empirical evidence showing the re-lationship that exists between the use of fi-nancial derivatives and market mispricing.
In comparison, when a company ap-plies hedge accounting to its derivative con-tracts, the practice is viewed positively by investors because it portrays the respective company’s commitment to conducting risk management (e.g. the company’s readiness to provide advanced information technolo-gies for formal documentation of hedging relationships). This study assumes that com-panies using financial derivatives for hedging purposes are more transparent in disclosing information to outside parties than compa-nies using financial derivatives for specula-tive purposes. Based on that argument and the lack of literature emphasizing the rela-tionship between financial derivatives, and market mispricing, the current study will
Oktavia et al.
291
thus strive to answer the following research question – Does IAS 39 classify economical-ly/financially respectable hedges as specu-lative derivatives, thus distorting their use?
This study uses a panel data analysis to in-vestigate the effect of financial derivatives on earnings management and market mispricing. It also uses the iterative generalized nonlinear least-squares estimation procedure, as noted in Mishkin (1985), to investigate the effect of financial derivatives on market mispricing. This study measures financial derivatives by using notional amounts and discretionary ac-cruals, following Kothari, Leone, and Wasley (2005). To split the purposes of the financial derivatives into speculative purposes, and hedging purposes, this study uses the crite-ria for the fulfillment of hedge accounting, that is, are they fulfilled or not? The results of this study show that the relationship between financial derivatives for hedging purposes (speculative purposes), and accrual-based earnings management is substitutive (com-plementary). This study also found evidence that supports the idea that earnings expecta-tions embedded in the stock returns of com-panies using financial derivatives for hedging purposes reflect the difference in the per-sistence of cash flow components more ac-curately when compared to companies using financial derivatives for speculative purposes.
This study contributes to the litera-ture in several ways. First, it extends pre-vious studies into the use of financial de-rivatives as an earnings management tool. Second, it extends the prior research into market mispricing by linking market mis-pricing with the purpose of using financial derivatives. To the best of our knowledge, this study is also the first to provide empir-ical evidence showing that the use of finan-cial derivatives leads to market mispricing.
Literature Review
The Effect of Financial Derivatives on Earnings Management
There are two mechanisms that manag-ers can use to smooth companies’ earnings. One is through the use of financial derivatives (real earnings management), and the other is through accrual-based earnings management (artificial earnings management). Previous studies (Asdrubali and Kim, 2008; Barton, 2001; Petersen and Thiagarajan, 2000; Pincus and Rajgopal, 2002) have revealed that com-pany managers use financial derivatives, and discretionary accruals, for income smooth-ing and for reducing earnings volatility. For instance, a company’s earnings volatility will increase if managers use financial derivatives for speculative purposes. Therefore, manag-ers are motivated toward using discretionary accruals, so as to reduce the earnings volatil-ity which results from the use of speculative derivatives. This illustration shows that the relationship between such use of derivatives and discretionary accruals is complementary (Barton, 2001; Murwaningsari et al., 2015).
However, if a company uses financial derivatives for hedging purposes, to reduce earnings volatility, the role of the discretionary accruals in reducing earnings volatility would be replaced by the derivatives. The higher the use of the financial derivatives for hedging purposes, the lower the magnitude of earn-ings management. It indicates that there is a trade-off between the use of financial deriva-tives and discretionary accruals (Barton, 2001; Huang et al., 2009; Petersen and Thiagarajan, 2000; Pincus and Rajgopal, 2002; Shaw, 2003).
When the use of financial derivatives, which do not meet the criteria for hedge accounting, causes earnings to become too
Gadjah Mada International Journal of Business - Sept.-Dec., Vol. 21, No. 3, 2019
292
volatile, managers are motivated to reduce the earnings volatility by using discretionary accruals. This kind of transaction causes the use of financial derivatives for speculative purposes to be positively related to the mag-nitude of the earnings management. Howev-er, when the use of financial derivatives does meet the criteria for hedge accounting, com-panies would be able to maximize the role of their financial derivatives so as to achieve rela-tively stable earnings. This kind of transaction reduces the use of the discretionary accru-als, which act as the income smoothing tool. Their role is then substituted by the use of financial derivatives. In its aim to re-examine the effect of the use of financial derivatives on the magnitude of earnings management, this study posits the following hypothesis:
H1: The use of financial derivatives for hedging pur-poses (speculative purposes) negatively (positive-ly) affects the magnitude of earnings management
The Effects of Financial Derivatives on Market Mispricing
The use of financial derivatives has a direct impact on a company’s cash flow com-ponents (Barton, 2001). As mentioned earli-er, the use of financial derivatives for hedg-ing purposes tends to decrease cash flow volatility. In comparison, the use of financial derivatives for speculative purposes tends to increase cash flow volatility. This decrease, or increase, in the cash flow’s volatility will also have an impact on the increase or de-crease of earnings volatility. Therefore, the use of financial derivatives for hedging pur-poses is expected to increase the persistence of the cash flow components. Conversely, the use of financial derivatives for specu-lative purposes is expected to decrease the persistence of the cash flow components.
If investors realize that the use of fi-nancial derivatives, which do not fulfill the hedge accounting criteria, cause an increase in the volatility of cash flow components and a decrease in the persistence of cash flow components, the investors will be-come cautious of any company that uses financial derivatives which do not meet the hedge accounting criteria. Such companies’ inability to apply hedge accounting to their derivative contracts (when the derivatives are actually intended for hedging) would be viewed negatively by investors. Consequent-ly, they lose confidence in the persistence of these companies’ cash flow components.
Nonetheless, if the use of financial derivatives fulfills the criteria of hedge ac-counting, then companies could apply hedge accounting to their derivative con-tracts. These companies’ are perceived more positively by investors, because of the companies’ commitment towards con-ducting risk management (e.g. the com-panies’ readiness to provide advanced information technologies for formal doc-umentation of their hedging relationships).
Based on the above explanation, this study thus presumes that companies using fi-nancial derivatives for hedging purposes are more transparent in disclosing information to outside parties than companies using fi-nancial derivatives for speculative purposes. Consequently, the level of market mispric-ing of the operating cash flow components would be lower in the former than in the lat-ter. Given the fact that the use of financial derivatives has a direct impact on a compa-ny’s cash flow components (Barton, 2001), this study will also focus on the market mis-pricing of the company’s cash flow compo-nents. Based on the aforementioned assump-tion, the following hypothesis is formulated:

Oktavia et al.
293
H2: Earnings expectations embedded in the stock returns of companies using financial derivatives for hedging purposes reflect the difference in the persistence of the operating cash flow com-ponents more accurately than companies using financial derivatives for speculative purposes.
Methods
Sample selection and data sourceThe annual reports and financial re-
ports, serving as the data source for this study, were obtained from the Thomson Re-uters Eikon Database while the stock prices were obtained from the Thomson Reuters Data stream Pro. The period of this study was from 2009 to 2013. Year 2008 was ex-cluded even though in 2008, all the sample countries involved in this study had carried out the IFRS convergence process. This is because the global financial crisis was deemed to have affected the financial con-dition of companies throughout the world.
The population for this study comprised of companies listed on the stock exchanges in ASEAN countries. According to the data reported by the Bank for International Settle-ments (BIS), and the International Swaps and Derivatives Association (ISDA), derivative markets in the ASEAN region include the Philippines, Indonesia, Malaysia, Singapore, and Thailand. However, only four of the five countries were used as samples for this study - the Philippines, Indonesia, Malaysia, and Singapore. Thailand was excluded be-cause the Thai Financial Reporting Standards (TFRS) had not adopted the international accounting standards for financial instru-ments, namely IAS 39 (www.iasplus.com).
The selection of the companies used in this study was based on purposive sam-
pling. The sample criteria used include: (i) Companies that carried out financial de-rivatives transactions, and also disclosed the notional amount of their financial de-rivatives. (ii) Companies that were not part of the financial industry. (iii) Companies which calculated their taxable income nor-mally, and used normal corporate income tax rates. (iv) Companies which carry En-glish versions of their financial statements.
In addition, the companies which were noted as financial derivative users were clas-sified into two categories: (1) Users of finan-cial derivatives for hedging purposes - these companies need to reveal that their financial derivatives meet the criteria for hedge ac-counting. (2) Users of financial derivatives for speculative purposes - these companies do not reveal that their financial deriva-tives meet the criteria for hedge accounting.
The reasons why the classification of the financial derivative users in this study was based on whether the criteria for hedge ac-counting were fulfilled or not are: (i) During the hand-collection procedure to find the no-tional amount and purpose of financial deriv-atives, the study does not find any company which discloses that its financial derivatives contracts are for speculative purposes. (ii) Although there are about 4% of the financial derivative users that do not reveal the purpose of their financial derivative’s usage, it is not appropriate to judge that their use of the fi-nancial derivatives is for speculative purposes simply because they do not state the purpose of the financial derivative instruments clearly.
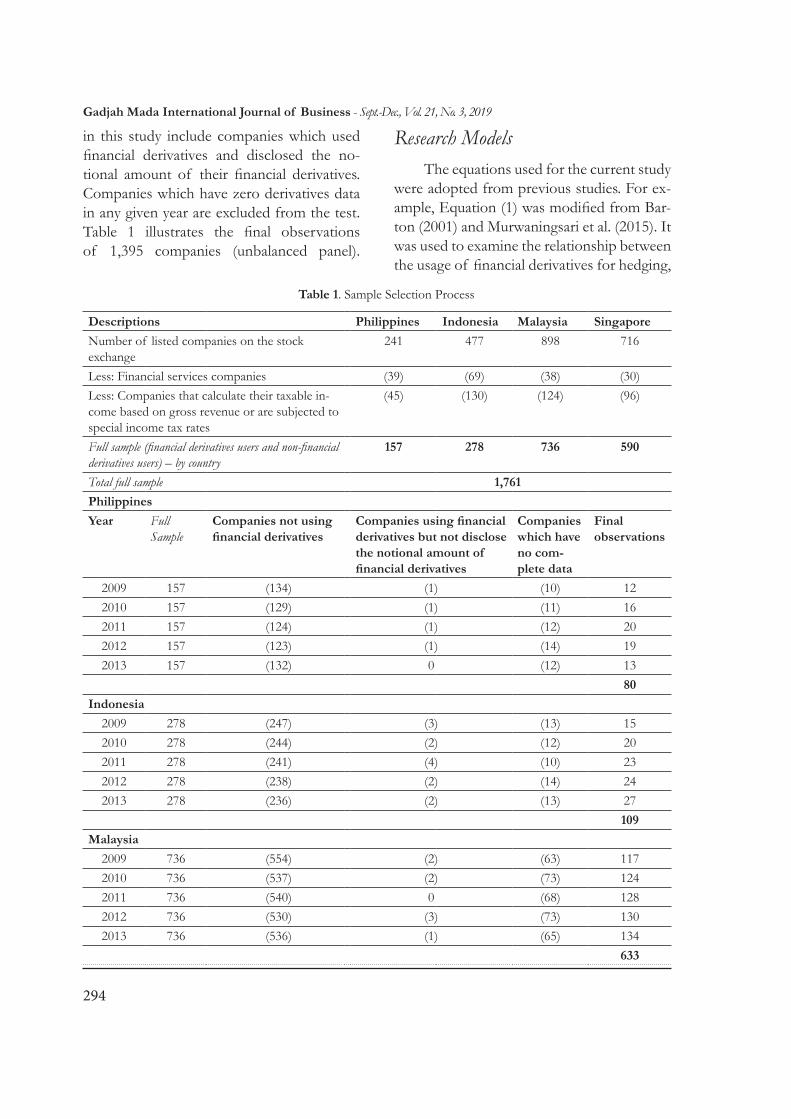
Table 1 presents the sample’s selection process. It shows that the total number of samples (for both financial derivatives us-ers and non-financial derivatives users) is 1,761. Upon scrutiny, the final samples used
Gadjah Mada International Journal of Business - Sept.-Dec., Vol. 21, No. 3, 2019
294
in this study include companies which used financial derivatives and disclosed the no-tional amount of their financial derivatives. Companies which have zero derivatives data in any given year are excluded from the test. Table 1 illustrates the final observations of 1,395 companies (unbalanced panel).
Research ModelsThe equations used for the current study
were adopted from previous studies. For ex-ample, Equation (1) was modified from Bar-ton (2001) and Murwaningsari et al. (2015). It was used to examine the relationship between the usage of financial derivatives for hedging,
Table 1. Sample Selection Process
Descriptions Philippines Indonesia Malaysia SingaporeNumber of listed companies on the stock exchange
241 477 898 716
Less: Financial services companies (39) (69) (38) (30)Less: Companies that calculate their taxable in-come based on gross revenue or are subjected to special income tax rates
(45) (130) (124) (96)
Full sample (financial derivatives users and non-financial derivatives users) – by country
157 278 736 590
Total full sample 1,761PhilippinesYear Full
SampleCompanies not using financial derivatives
Companies using financial derivatives but not disclose the notional amount of financial derivatives
Companies which have no com-plete data
Final observations
2009 157 (134) (1) (10) 122010 157 (129) (1) (11) 162011 157 (124) (1) (12) 202012 157 (123) (1) (14) 192013 157 (132) 0 (12) 13
80Indonesia
2009 278 (247) (3) (13) 152010 278 (244) (2) (12) 202011 278 (241) (4) (10) 232012 278 (238) (2) (14) 242013 278 (236) (2) (13) 27
109Malaysia
2009 736 (554) (2) (63) 1172010 736 (537) (2) (73) 1242011 736 (540) 0 (68) 1282012 736 (530) (3) (73) 1302013 736 (536) (1) (65) 134
633

Oktavia et al.
295
Singapore2009 590 (374) (6) (115) 952010 590 (372) (9) (95) 1142011 590 (362) (8) (94) 1262012 590 (367) (9) (90) 1242013 590 (374) (5) (97) 114
573The number of final observations from the sample countries 1,395
Table 1. Continued
and for speculative purposes, with the mag-nitude of earnings management (H1). This study also incorporated five control variables when estimating Equation (1), for example, firm size (SIZE), profitability (ROA), lever-age (DTA), a country dummy variable, and a year dummy variable. SIZE was selected to control the effects of company size on the magnitude of the accrual-based earn-ings management. Large companies tend to be more under the spotlight from analysts and investors, as compared to small compa-nies, which makes them more cautious when taking action (Siregar and Utama, 2008).
ROA was used to control the effects of the company’s profitability on the mag-nitude of accrual-based earnings manage-ment. According to the bonus plan hypoth-eses, managers were more likely to perform income-increasing types of earnings man-agement when companies give bonuses, based on the earnings figures, to managers (Watts and Zimmerman, 1978). The DTA was used to control the effects of the debt level on the magnitude of the accrual-based earnings management. Companies with high levels of debts can reduce the cost of their debts through earnings manage-ment (Barton, 2001; Smith and Stulz, 1985).
Additionally, a country dummy vari-able, and a year dummy variable were used to control the effects of country,
and the observation year, on the magni-tude of accrual-based earnings manage-ment. Equation (1) is provided below.
ABS_DACCit = α0 +α1DERIVit + α2DSPECit + α3DERIV*DSPECit + α4SIZEit + α5ROAit + α6DTAit +α7COUNTRYit + α8YEARit+ εit
(1)
Hypothesis H1 is accepted if α1 < 0 and α1+ α3 > 0.
Descriptions:ABS_DACCit = Absolute value of discre-tionary accruals.DERIVit = Notional amount of financial derivatives, scaled by lagged total assets.DSPECit = Speculation dummy variable. One if the company has a notional amount of financial derivatives for speculative pur-poses (does not fulfill the criteria for hedge accounting), greater than 50% of the total notional amount of its financial derivatives, and zero if otherwise.SIZEit = Natural logarithm of total assets.ROAit = Return on assets.DTAit = Total debt to total assets. COUNTRYit= Country dummy variable.YEARit = Year dummy variable.
To address Hypothesis H2, which states that earnings expectations embedded in stock returns reflect the differential per-sistence of the operating cash flow compo-nents more accurately for companies using
Gadjah Mada International Journal of Business - Sept.-Dec., Vol. 21, No. 3, 2019
296
financial derivatives for hedging purposes, the Mishkin (1985) test was applied. Fol-lowing Mishkin (1985), we estimated equa-tions (2) and (3) jointly by using an iterative generalized nonlinear least squares estima-tion procedure. They are presented below.
EARNit+1 = γ0 + γ1CFOit + γ2NDACit + γ3DACCit+ γ4CFOit*DSPECit + γ5NDACit *DSPECit + γ6DACCit*DSPECit + θit+1
(2)
RETURNit+1 = α + β (EARNit+1 – γ0 + γ*1 CFOit + γ*2NDACit + γ*3DACCit + γ*4 CFOit*DSPECit + γ*5NDACit*DSPECit + γ*6 DACCit*DSPECit) + εit +1
(3)
Equation (2) serves as the forecasting equation and Equation (3) serves as the val-uation equation. Hypothesis H2 predicts that the ratio of γ1 to γ*1 is significantly smaller than the ratio of (γ1 + γ4) to (γ*1 + γ*4). If the ratio of γ1 to γ*1 is significantly different from one, it indicates that the market mis-prices the persistence of the cash flow com-ponents in companies using financial deriva-tives for hedging purposes. Furthermore, if the ratio of (γ1 + γ4) to (γ*1 + γ*4) is signifi-cantly different from one, it will also indicate that the market misprices the persistence of the cash flow components in compa-nies using speculative financial derivatives.
To answer Hypothesis H2, the ratio of γ1 to γ*1 needs to be compared with the ratio of (γ1 + γ4) to (γ * 1 + γ * 4). If the value of the ratio of (γ1 + γ4) to (γ*1 + γ*4) is significantly greater than the ratio of γ1 to γ*1, it is conclud-ed that the largest market mispricing occurs in companies which use financial derivatives for speculative purposes. Conversely, if the ratio of γ1 to γ*1 is significantly greater than the ratio of (γ1 + γ4) to (γ*1 + γ*4), it means that the largest market mispricing occurs in
companies which use financial derivatives for hedging purposes. Hypothesis H2 is thus ac-cepted if the ratio of (γ1 + γ4) to (γ*1 + γ*4) is significantly greater than the ratio of γ1 to γ*1.
Variables MeasurementThe use of financial derivatives
(DERIV) was determined through the total notional amount of financial derivatives di-vided by the lagged total assets. This mea-surement has been used in previous stud-ies (Allayannis and Weston, 2001; Barton, 2001; Huang et al., 2009; Murwaningsari et al., 2015). The DSPEC variable used in this study was measured through a dummy vari-able. As there were quite a number of com-panies which simultaneously used financial derivatives for hedging and speculative pur-poses during the same period, the DSPEC variable was thus given a value of one if a company’s notional amount of financial de-rivatives for speculative purposes was great-er than 50% of its total notional amount of financial derivatives. The DSPEC was given the value of zero if a company has a no-tional amount of financial derivatives for speculative purposes less than 50% of the total notional amount of its financial deriva-tives. In this study, the discretionary accruals were estimated using the model proposed by Kothari et al. (2005) while the residual value was obtained through Equation (4) below:
ACCit/TAit-1 = α1 (1/TAit-1 ) + β1((ΔRE-Vit - ΔRECit )/TAit-1) + β2(PPEit/TAit-1) + b3ROAit + εit
(4)
Descriptions:ACCit = Total accruals, calculated from earnings before extraordinary items sub-stracted by the operating cash flow.

Oktavia et al.
297
TAit-1 = Lagged total assets. ΔREV = Change in revenue. ΔREC = Change in accounts receivable. PPE = Gross property, plants, and equip-ment.
This study uses the absolute value of discretionary accruals to specifically test Hypothesis H1 because the focus of this hypothesis is the magnitude of earnings management. EARNt+1 was measured by earnings before the extraordinary item in year t+1, then divided by the lagged total assets. Stock returns in this study were measured by the cumulative abnormal returns using the market adjusted returns, for a period of 12 months which ended in the third month after the end of a fiscal year. SIZE was measured as the natural logarithm of total assets. ROA was measured as net income divided by the lagged total assets, and leverage (DTA) was measured as total debts divided by total assets.
Results
Descriptive StatisticsThe descriptive statistics presented in
Table 2 show that the mean value of the use of financial derivatives was greater than the mean value of ABS_DACC. This means that the sample companies used more financial derivatives than discretionary accruals. This is not surprising since the sample companies in this study were mainly financial deriva-tives users. Table 2 also shows that the aver-age earnings derived for the upcoming year (EARNt+1) were positive. This shows that, on average, the sample companies experienced an increase in their earnings, particularly for the coming period. In addition, the CFO variable was noted to carry an average value of 0.0788. This indicates that, on average, the compa-nies have a positive cash flow. From the total
Table 2. Descriptive Statistics
Variabel N Mean Median Minimum Maximum Std. Dev.DERIV 1,395 0.1164 0.0520 0.0001 1.1342 0.1770ABS_DACC 1,395 0.0598 0.0428 0.0001 0.2649 0.0548RETURNt+1 1,395 0.0901 0.0280 -0.7409 1.8446 0.4073EARNt+1 1,395 0.0616 0.0507 -0.1846 0.4478 0.0885CFO 1,395 0.0788 0.0669 -0.2469 0.5058 0.1128NDAC 1,395 -0.0129 -0.0135 -0.1673 0.1354 0.0492DACC 1,395 -0.0016 -0.0029 -0.2377 0.2649 0.0811SIZE 1,395 21.1970 20.3397 17.1222 31.4198 3.1455ROA 1,395 0.0688 0.0567 -0.1901 0.4460 0.0861DTA 1,395 0.4753 0.4853 0.0641 0.9578 0.1947
Dummy Proportion = 1 Dummy Proportion = 0(N = 1091) (N=304)
DSPEC 78.21% 21.79%DERIV: Notional amount of financial derivatives, scaled by lagged total assets; ABS_DACC: Absolute value of discretionary accrual; DSPEC: one if the firm uses speculative financial derivatives and disclose the notional amount of financial derivatives and zero if otherwise; RETURNit+1: Cummulative abnormal return for year t+1, measured over the 12-month period ending three months after the firm’s fiscal year-end; EARNit+1: Earnings before extraor-dinary item in year t+1; CFO: Cash flow from operation; NDAC: Nondiscretionary accrual; DACC: Discretionary accrual; SIZE: natural logarithm of total assets; ROA: Return on asset; DTA: Total debt to total assets.
Gadjah Mada International Journal of Business - Sept.-Dec., Vol. 21, No. 3, 2019
298
sample of 1,395 companies being examined, 78.21% of them used financial derivatives for speculative purposes while only 21.79% used financial derivatives for hedging purposes.
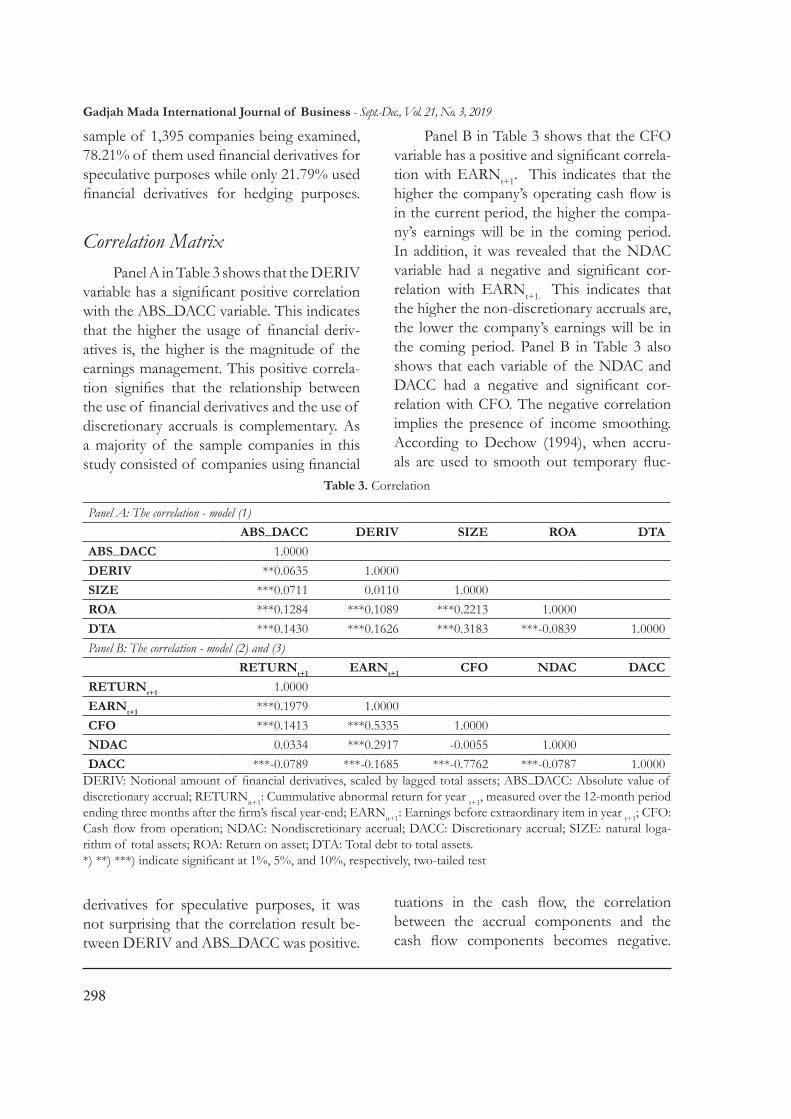
Correlation MatrixPanel A in Table 3 shows that the DERIV
variable has a significant positive correlation with the ABS_DACC variable. This indicates that the higher the usage of financial deriv-atives is, the higher is the magnitude of the earnings management. This positive correla-tion signifies that the relationship between the use of financial derivatives and the use of discretionary accruals is complementary. As a majority of the sample companies in this study consisted of companies using financial
derivatives for speculative purposes, it was not surprising that the correlation result be-tween DERIV and ABS_DACC was positive.
Panel B in Table 3 shows that the CFO variable has a positive and significant correla-tion with EARNt+1. This indicates that the higher the company’s operating cash flow is in the current period, the higher the compa-ny’s earnings will be in the coming period. In addition, it was revealed that the NDAC variable had a negative and significant cor-relation with EARNt+1. This indicates that the higher the non-discretionary accruals are, the lower the company’s earnings will be in the coming period. Panel B in Table 3 also shows that each variable of the NDAC and DACC had a negative and significant cor-relation with CFO. The negative correlation implies the presence of income smoothing. According to Dechow (1994), when accru-als are used to smooth out temporary fluc-
tuations in the cash flow, the correlation between the accrual components and the cash flow components becomes negative.
Table 3. Correlation
Panel A: The correlation - model (1) ABS_DACC DERIV SIZE ROA DTAABS_DACC 1.0000DERIV **0.0635 1.0000SIZE ***0.0711 0.0110 1.0000ROA ***0.1284 ***0.1089 ***0.2213 1.0000DTA ***0.1430 ***0.1626 ***0.3183 ***-0.0839 1.0000Panel B: The correlation - model (2) and (3) RETURNt+1 EARNt+1 CFO NDAC DACCRETURNt+1 1.0000EARNt+1 ***0.1979 1.0000CFO ***0.1413 ***0.5335 1.0000NDAC 0.0334 ***0.2917 -0.0055 1.0000DACC ***-0.0789 ***-0.1685 ***-0.7762 ***-0.0787 1.0000
DERIV: Notional amount of financial derivatives, scaled by lagged total assets; ABS_DACC: Absolute value of discretionary accrual; RETURNit+1: Cummulative abnormal return for year t+1, measured over the 12-month period ending three months after the firm’s fiscal year-end; EARNit+1: Earnings before extraordinary item in year t+1; CFO: Cash flow from operation; NDAC: Nondiscretionary accrual; DACC: Discretionary accrual; SIZE: natural loga-rithm of total assets; ROA: Return on asset; DTA: Total debt to total assets.*) **) ***) indicate significant at 1%, 5%, and 10%, respectively, two-tailed test
Oktavia et al.
299
Regression Results
The Effect of Financial Derivatives on Earnings Management
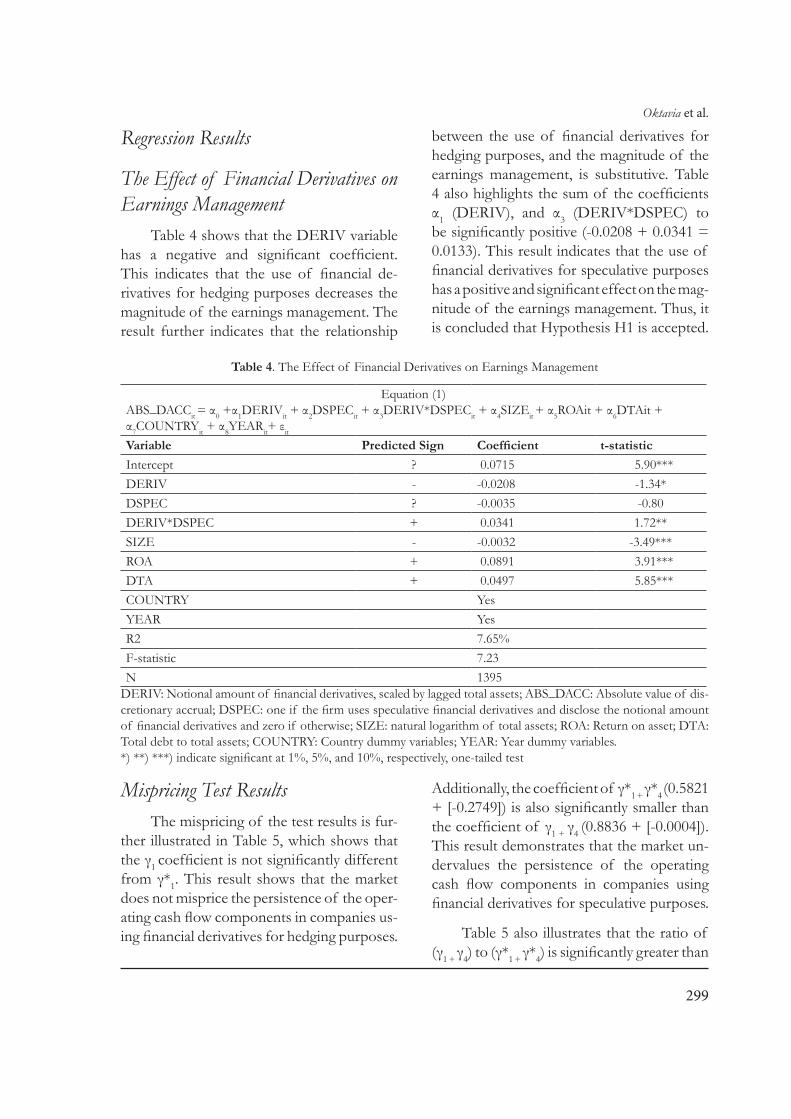
Table 4 shows that the DERIV variable has a negative and significant coefficient. This indicates that the use of financial de-rivatives for hedging purposes decreases the magnitude of the earnings management. The result further indicates that the relationship
between the use of financial derivatives for hedging purposes, and the magnitude of the earnings management, is substitutive. Table 4 also highlights the sum of the coefficients α1 (DERIV), and α3 (DERIV*DSPEC) to be significantly positive (-0.0208 + 0.0341 = 0.0133). This result indicates that the use of financial derivatives for speculative purposes has a positive and significant effect on the mag-nitude of the earnings management. Thus, it is concluded that Hypothesis H1 is accepted.
Table 4. The Effect of Financial Derivatives on Earnings Management
Equation (1)ABS_DACCit = α0 +α1DERIVit + α2DSPECit + α3DERIV*DSPECit + α4SIZEit + α5ROAit + α6DTAit + α7COUNTRYit + α8YEARit+ εit
Variable Predicted Sign Coefficient t-statisticIntercept ? 0.0715 5.90***DERIV - -0.0208 -1.34*DSPEC ? -0.0035 -0.80DERIV*DSPEC + 0.0341 1.72**SIZE - -0.0032 -3.49***ROA + 0.0891 3.91***DTA + 0.0497 5.85***COUNTRY YesYEAR YesR2 7.65%F-statistic 7.23N 1395
DERIV: Notional amount of financial derivatives, scaled by lagged total assets; ABS_DACC: Absolute value of dis-cretionary accrual; DSPEC: one if the firm uses speculative financial derivatives and disclose the notional amount of financial derivatives and zero if otherwise; SIZE: natural logarithm of total assets; ROA: Return on asset; DTA: Total debt to total assets; COUNTRY: Country dummy variables; YEAR: Year dummy variables.*) **) ***) indicate significant at 1%, 5%, and 10%, respectively, one-tailed test
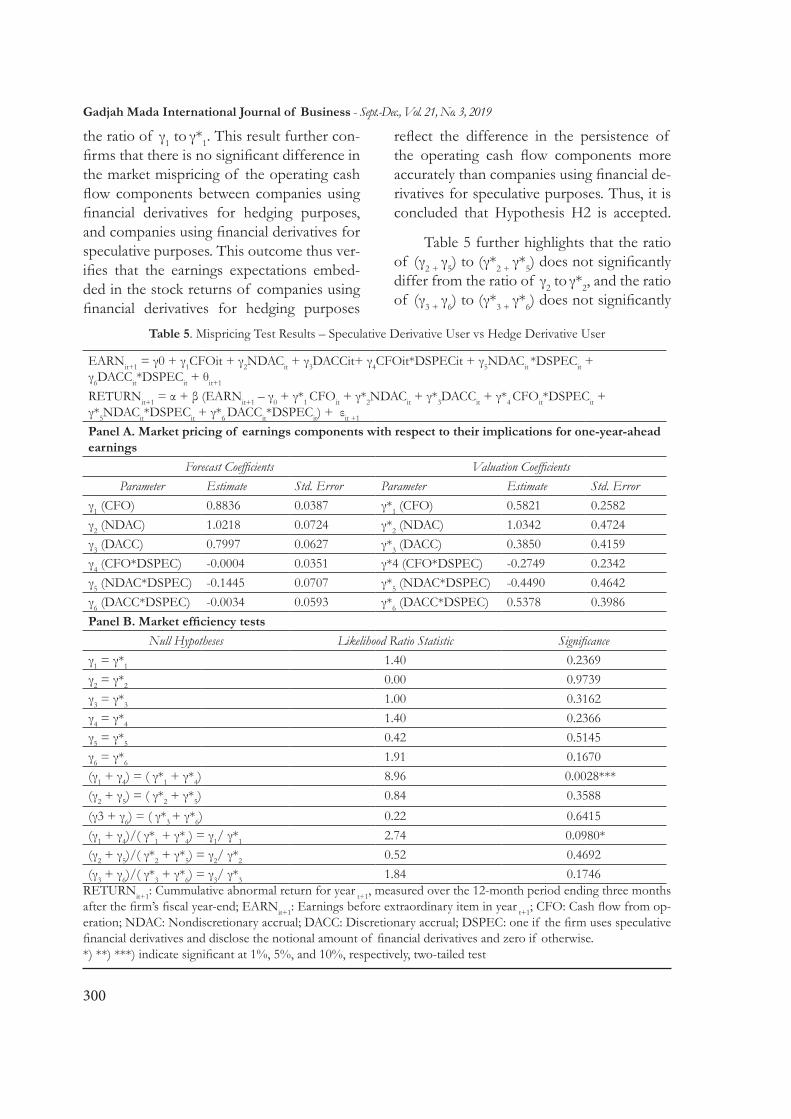
Mispricing Test Results The mispricing of the test results is fur-
ther illustrated in Table 5, which shows that the γ1 coefficient is not significantly different from γ*1. This result shows that the market does not misprice the persistence of the oper-ating cash flow components in companies us-ing financial derivatives for hedging purposes.
Additionally, the coefficient of γ*1 + γ*4 (0.5821 + [-0.2749]) is also significantly smaller than the coefficient of γ1 + γ4 (0.8836 + [-0.0004]). This result demonstrates that the market un-dervalues the persistence of the operating cash flow components in companies using financial derivatives for speculative purposes.
Table 5 also illustrates that the ratio of (γ1 + γ4) to (γ*1 + γ*4) is significantly greater than
Gadjah Mada International Journal of Business - Sept.-Dec., Vol. 21, No. 3, 2019
300
the ratio of γ1 to γ*1. This result further con-firms that there is no significant difference in the market mispricing of the operating cash flow components between companies using financial derivatives for hedging purposes, and companies using financial derivatives for speculative purposes. This outcome thus ver-ifies that the earnings expectations embed-ded in the stock returns of companies using financial derivatives for hedging purposes
reflect the difference in the persistence of the operating cash flow components more accurately than companies using financial de-rivatives for speculative purposes. Thus, it is concluded that Hypothesis H2 is accepted.
Table 5 further highlights that the ratio of (γ2 + γ5) to (γ*2 + γ*5) does not significantly differ from the ratio of γ2 to γ*2, and the ratio of (γ3 + γ6) to (γ*3 + γ*6) does not significantly
Table 5. Mispricing Test Results – Speculative Derivative User vs Hedge Derivative User
EARNit+1 = γ0 + γ1CFOit + γ2NDACit + γ3DACCit+ γ4CFOit*DSPECit + γ5NDACit *DSPECit + γ6DACCit*DSPECit + θit+1 RETURNit+1 = α + β (EARNit+1 – γ0 + γ*1 CFOit + γ*2NDACit + γ*3DACCit + γ*4 CFOit*DSPECit + γ*5NDACit*DSPECit + γ*6 DACCit*DSPECit) + εit +1
Panel A. Market pricing of earnings components with respect to their implications for one-year-ahead earnings
Forecast Coefficients Valuation CoefficientsParameter Estimate Std. Error Parameter Estimate Std. Error
γ1 (CFO) 0.8836 0.0387 γ*1 (CFO) 0.5821 0.2582γ2 (NDAC) 1.0218 0.0724 γ*2 (NDAC) 1.0342 0.4724γ3 (DACC) 0.7997 0.0627 γ*3 (DACC) 0.3850 0.4159γ4 (CFO*DSPEC) -0.0004 0.0351 γ*4 (CFO*DSPEC) -0.2749 0.2342γ5 (NDAC*DSPEC) -0.1445 0.0707 γ*5 (NDAC*DSPEC) -0.4490 0.4642γ6 (DACC*DSPEC) -0.0034 0.0593 γ*6 (DACC*DSPEC) 0.5378 0.3986Panel B. Market efficiency tests
Null Hypotheses Likelihood Ratio Statistic Significanceγ1 = γ*1 1.40 0.2369γ2 = γ*2 0.00 0.9739γ3 = γ*3 1.00 0.3162γ4 = γ*4 1.40 0.2366γ5 = γ*5 0.42 0.5145γ6 = γ*6 1.91 0.1670(γ1 + γ4) = ( γ*1 + γ*4) 8.96 0.0028***(γ2 + γ5) = ( γ*2 + γ*5) 0.84 0.3588(γ3 + γ6) = ( γ*3 + γ*6) 0.22 0.6415(γ1 + γ4)/( γ*1 + γ*4) = γ1/ γ*1 2.74 0.0980*(γ2 + γ5)/( γ*2 + γ*5) = γ2/ γ*2 0.52 0.4692(γ3 + γ6)/( γ*3 + γ*6) = γ3/ γ*3 1.84 0.1746
RETURNit+1: Cummulative abnormal return for year t+1, measured over the 12-month period ending three months after the firm’s fiscal year-end; EARNit+1: Earnings before extraordinary item in year t+1; CFO: Cash flow from op-eration; NDAC: Nondiscretionary accrual; DACC: Discretionary accrual; DSPEC: one if the firm uses speculative financial derivatives and disclose the notional amount of financial derivatives and zero if otherwise.*) **) ***) indicate significant at 1%, 5%, and 10%, respectively, two-tailed test
Oktavia et al.
301
differ from the ratio of γ3 to γ*3. These find-ings thus suggest that there is no significant difference in the market mispricing of the discretionary accrual, and the non-discretion-ary accrual components, between companies using financial derivatives for hedging pur-poses, and companies using financial deriv-atives for speculative purposes. The fact that no significant difference was found in the test result is attributed to the fact that finan-cial derivatives only have a direct impact on the volatility of the cash flow components.
Additional Tests: Developed Countries versus Emerging Countries
The Effect of Financial Derivatives on Earnings Management
To evaluate whether a country’s econo-my affects the results that were presented in Table 4, we performed a few more tests sim-ilar to those in Table 4. First we partitioned our samples according to the countries’ econ-omies. Malaysia and Singapore were deemed to be developed countries, while Indonesia and the Philippines were classified as emerg-ing countries. Our test results (unreported) showed that the DERIV variable in developed and emerging countries carried a negative and significant coefficient. This indicates that for both the developed and emerging countries, the use of financial derivatives for hedging purposes had negatively, and significantly, af-fected the magnitude of the earnings man-agement. The results further showed that in both the developed and emerging countries, the sum of the coefficients of α1 (DERIV), and α3 (DERIV*DSPEC) carried a positive result. This indicates that the use of finan-cial derivatives for speculative purposes, had positively, and significantly, affected the magnitude of the earnings management.
Mispricing TestTo investigate whether a country’s econ-
omy affected the results presented in Table 5, we likewise partitioned our samples ac-cording to each country’s economy. We then performed tests which were similar to those in Table 5. Our results (unreported) showed that in developed countries, the market does not misprice the persistence of the operating cash flow components in companies using financial derivatives for hedging purposes. However, the market undervalues the per-sistence of the operating cash flow compo-nents in companies using financial derivatives for speculative purposes. We also found (unre-ported) that in developed countries, the ratio of (γ1 + γ4) to (γ*1 + γ*4) was significantly great-er than the ratio of γ1 to γ*1. These findings support the acceptance of Hypothesis H2.
We further found evidence which showed that in emerging countries, the market misprices the persistence of the operating cash flow components for both types of companies, those using finan-cial derivatives for hedging purposes, and those using financial derivatives for specu-lative purposes. Finally, we also found that in emerging countries, there was no signif-icant difference in the market mispricing of the operating cash flow components between both types of companies. These findings do not support Hypothesis H2.
Findings And Discussions
The Effect of Financial Derivatives on Earnings Management
The test results showing the effect of fi-nancial derivatives on earnings management indicate that there was a trade-off between
Gadjah Mada International Journal of Business - Sept.-Dec., Vol. 21, No. 3, 2019
302
the use of financial derivatives for hedging purposes, and the magnitude of the accru-al-based earnings management. This result is consistent with the results of previous studies (Barton, 2001; Huang et al., 2009; Petersen and Thiagarajan, 2000; Pincus and Rajgopal, 2002; Shaw, 2003). Previous find-ings had shown that the effect of the use of financial derivatives for hedging purposes on accrual-based earnings management in ASEAN countries adopting the IFRS was consistent with the results found in countries that do not adopt the IFRS. Based on this, it was concluded that regardless of the type of accounting standards used, be it US GAAP or the IFRS, the use of financial derivatives for hedging purposes decreased a company’s earnings volatility. Financial derivatives were also used as a replacement for discretionary accruals, as an income smoothing tool for companies. This means that if the earnings volatility was decreased by the use of financial derivatives for hedging purposes, a company would not need to use discretionary accru-als as a tool to reduce its earnings volatility.
The test results also showed that there was a complementary relationship between the use of financial derivatives for specula-tive purposes, and the magnitude of accru-al-based earnings management. This result is consistent with previous studies (Bar-ton, 2001; Murwaningsari et al., 2015; Papa, 2010). Previous findings had indicated that the effect of using financial derivatives for speculative purposes, on accrual-based earn-ings management in ASEAN countries that have adopted the IFRS, was consistent with the results found in countries that do not adopt the IFRS. Based on this, it was thus concluded that regardless of the type of ac-counting standards used, the use of financial derivatives for speculative purposes leads to an increase in earnings volatility. This occur-
rence could prompt managers to reduce the earnings volatility, and to stabilize earnings by using discretionary accruals. Therefore, the relationship between the use of financial derivatives for speculative purposes, and the earnings management activities using discre-tionary accruals, is said to be complementa-ry. The reason why there was no difference in the findings between countries adopt-ing IFRS, and countries adopting the US GAAP, was because there is not much dif-ference between both accounting standards.
The Effects of Financial Derivatives on Market Mispricing
The results further showed that the market did not misprice the persistence of the operating cash flow components in com-panies using financial derivatives for hedging purposes. However, the market did misprice the persistence of the operating cash flow components in companies using financial derivatives for speculative purposes, causing them to be lower. This low pricing was giv-en because investors were likely to be wary of companies using financial derivatives for speculative purposes. As discussed earlier, a company’s inability to apply hedge account-ing to its derivative contracts is perceived negatively by investors. Consequently, inves-tors lose confidence in the persistence of the cash flow components of such companies.
The results in this study thus suggest that the level of the market mispricing of the operating cash flow components is low-er in companies using financial derivatives for hedging purposes than in companies us-ing financial derivatives for speculative pur-poses. Based on this, it was thus concluded that earnings expectations embedded in the stock returns of companies using financial

Oktavia et al.
303
derivatives for hedging purposes can reflect the difference in the persistence of the op-erating cash flow components of earnings more accurately than companies using fi-nancial derivatives for speculative purpos-es. This result can be attributed to the fact that companies using financial derivatives for hedging purposes were more transparent in disclosing information to outside parties. Therefore, investors in such companies have more information for their decision making. In turn, this enabled the companies to reduce the level of the market mispricing. These findings proved that the purpose of using financial derivatives has an effect on mar-ket mispricing. This outcome thus enriches the existing literature on market mispricing.
When the sample companies were par-titioned based on country’s economy, there was evidence to suggest that, in emerging
countries, the market mispriced the per-sistence of the operating cash flow compo-nents for both types of companies – those using financial derivatives for hedging pur-poses as well as those using financial deriv-atives for speculative purposes. Poor quality financial reporting was the reason for such findings. This made it difficult for investors to distinguish the use of financial deriva-tives for hedging purposes from the use of financial derivatives for speculative purposes.
Sensitivity TestsA sensitivity test was conducted to ensure
the reliability of the regression results and the mispricing test results. First, the speculation dummy variable (DSPEC) was measured by using a proportion of the notional amount of financial derivatives for speculative pur-
Table 6. Sensitivity Test Results – DSPEC was measured by using a proportion
Equation (1)ABS_DACCit = α0 +α1DERIVit + α2DSPECit + α3DERIV*DSPECit + α4SIZEit + α5ROAit + α6DTAit +α7COUNTRYit + α8YEARit+ εit
Variable Predicted Sign Coefficient t-statisticIntercept ? 0.0701 ***5.78DERIV - -0.0239 *-1.43DSPEC ? -0.0029 -0.64DERIV*DSPEC + 0.0380 **1.77SIZE - -0.0031 ***-3.42ROA + 0.0894 ***3.92DTA + 0.0501 ***5.89COUNTRY YesYEAR YesR-Square 7.69%F-statistic 7.21N 1395
DERIV: Notional amount of financial derivatives, scaled by lagged total assets; ABS_DACC: Absolute value of discretionary accrual; DSPEC: Proportion of the notional amount of specu-lative derivatives; SIZE: natural logarithm of total assets; ROA: Return on asset; DTA: Total debt to total assets; COUNTRY: Country dummy variables; YEAR: Year dummy variables.*) **) ***) indicate significant at 1%, 5%, and 10%, respectively, one-tailed test

Gadjah Mada International Journal of Business - Sept.-Dec., Vol. 21, No. 3, 2019
304
poses (which does not meet the criteria for hedge accounting). The result of the sensitiv-ity test is consistent with the main test results.
Second, the test only used observa-tions from the period of 2010, 2011, 2012,
and 2013. The reason is because on Jan-uary 1, 2010, Indonesia and Malaysia im-plemented the accounting standards which refer to the IFRS (IAS 39). Year 2009 was excluded from the test because in that year Indonesia and Malaysia still applied the ac-
Table 7. Sensitivity Test Results for Equation (1) – Use observations on the period of 2010, 2011, 2012, and 2013
Equation (1)ABS_DACCit = α0 +α1DERIVit + α2DSPECit + α3DERIV*DSPECit + α4SIZEit + α5ROAit + α6DTAit +α7COUNTRYit + α8YEARit+ εit
Variable Predicted Sign Coefficient t-statisticIntercept ? 0.0771 ***4.80DERIV - -0.0246 *-1.33DSPEC ? -0.0042 -0.67DERIV*DSPEC + 0.0407 **1.67SIZE - -0.0030 ***-2.64ROA + 0.0858 ***2.90DTA + 0.0510 ***4.68COUNTRY YesYEAR YesR-Square 7.39%F-stat 5.51p-value ***0.0000N 1156
DERIV: Notional amount of financial derivatives, scaled by lagged total assets; ABS_DACC: Abso-lute value of discretionary accrual; DSPEC: one if the firm uses speculative financial derivatives and disclose the notional amount of financial derivatives and zero if otherwise; SIZE: natural logarithm of total assets; ROA: Return on asset; DTA: Total debt to total assets; COUNTRY: Country dummy variables; YEAR: Year dummy variables.*) **) ***) indicate significant at 1%, 5%, and 10%, respectively, one-tailed test
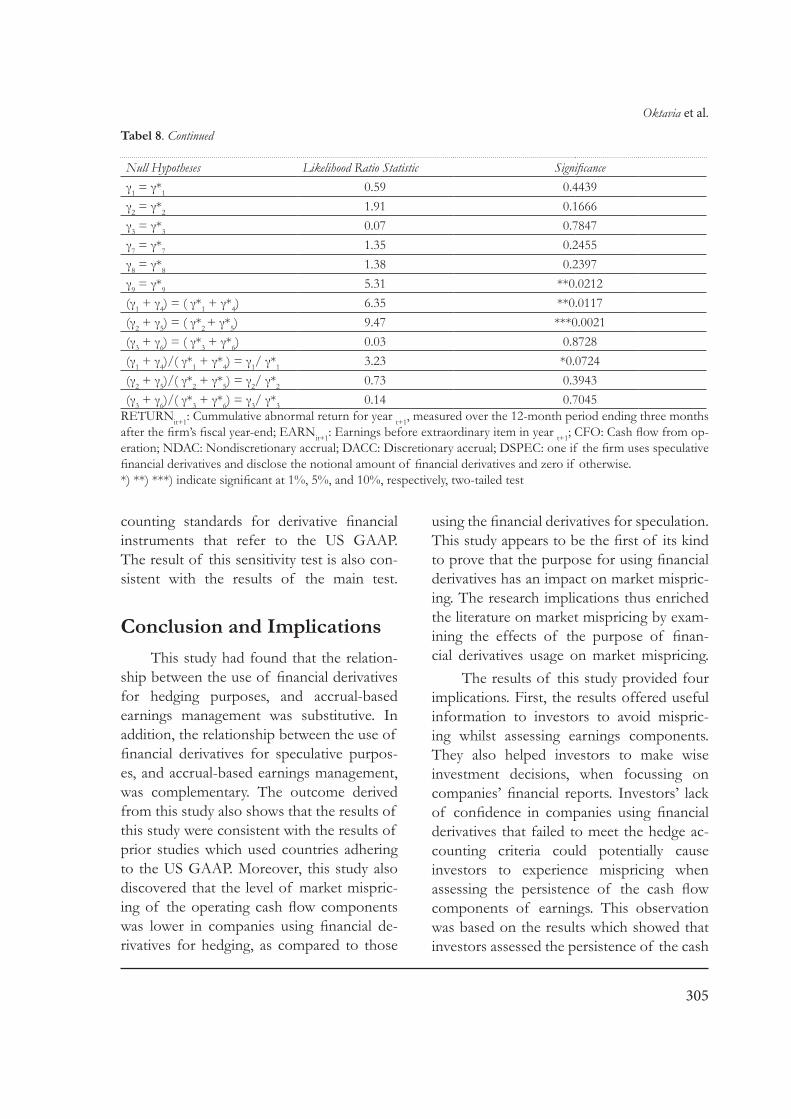
Table 8. Sensitivity Test Results for Mispricing Test – Use observations on the period of 2010, 2011, 2012, and 2013
EARNit+1 = γ0 + γ1CFOit + γ2NDACit + γ3DACCit+ γ4CFOit*DSPECit + γ5NDACit *DSPECit + γ6DACCit* DSPECit + θit+1RETURNit+1 = α + β (EARNit+1 – γ0 + γ*1 CFOit + γ*2NDACit + γ*3DACCit + γ*4 CFOit*DSPECit + γ*5NDACit*DSPECit + γ*6 DACCit*DSPECit) + εit +1
Forecast Coefficients Valuation CoefficientsParameter Estimate Std. Error Parameter Estimate Std. Errorγ1 (CFO) 0.8690 0.0408 γ*1 (CFO) 0.6517 0.2845γ2 (NDAC) 1.0736 0.0796 γ*2 (NDAC) 0.3081 0.5696γ3 (DACC) 0.8369 0.0668 γ*3 (DACC) 0.7101 0.4604γ4 (CFO*DSPEC) -0.0145 0.0375 γ*4 (CFO*DSPEC) -0.3380 0.2666γ5 (NDAC*DSPEC) -0.1141 0.0791 γ*5 (NDAC*DSPEC) -0.4588 0.5493γ6 (DACC*DSPEC) -0.0179 0.0641 γ*6 (DACC*DSPEC) 0.1590 0.4430
Oktavia et al.
305
counting standards for derivative financial instruments that refer to the US GAAP. The result of this sensitivity test is also con-sistent with the results of the main test.
Conclusion and ImplicationsThis study had found that the relation-
ship between the use of financial derivatives for hedging purposes, and accrual-based earnings management was substitutive. In addition, the relationship between the use of financial derivatives for speculative purpos-es, and accrual-based earnings management, was complementary. The outcome derived from this study also shows that the results of this study were consistent with the results of prior studies which used countries adhering to the US GAAP. Moreover, this study also discovered that the level of market mispric-ing of the operating cash flow components was lower in companies using financial de-rivatives for hedging, as compared to those
using the financial derivatives for speculation. This study appears to be the first of its kind to prove that the purpose for using financial derivatives has an impact on market mispric-ing. The research implications thus enriched the literature on market mispricing by exam-ining the effects of the purpose of finan-cial derivatives usage on market mispricing.
The results of this study provided four implications. First, the results offered useful information to investors to avoid mispric-ing whilst assessing earnings components. They also helped investors to make wise investment decisions, when focussing on companies’ financial reports. Investors’ lack of confidence in companies using financial derivatives that failed to meet the hedge ac-counting criteria could potentially cause investors to experience mispricing when assessing the persistence of the cash flow components of earnings. This observation was based on the results which showed that investors assessed the persistence of the cash
Null Hypotheses Likelihood Ratio Statistic Significanceγ1 = γ*1 0.59 0.4439γ2 = γ*2 1.91 0.1666γ3 = γ*3 0.07 0.7847γ7 = γ*7 1.35 0.2455γ8 = γ*8 1.38 0.2397γ9 = γ*9 5.31 **0.0212(γ1 + γ4) = ( γ*1 + γ*4) 6.35 **0.0117(γ2 + γ5) = ( γ*2 + γ*5) 9.47 ***0.0021(γ3 + γ6) = ( γ*3 + γ*6) 0.03 0.8728(γ1 + γ4)/( γ*1 + γ*4) = γ1/ γ*1 3.23 *0.0724(γ2 + γ5)/( γ*2 + γ*5) = γ2/ γ*2 0.73 0.3943(γ3 + γ6)/( γ*3 + γ*6) = γ3/ γ*3 0.14 0.7045
RETURNit+1: Cummulative abnormal return for year t+1, measured over the 12-month period ending three months after the firm’s fiscal year-end; EARNit+1: Earnings before extraordinary item in year t+1; CFO: Cash flow from op-eration; NDAC: Nondiscretionary accrual; DACC: Discretionary accrual; DSPEC: one if the firm uses speculative financial derivatives and disclose the notional amount of financial derivatives and zero if otherwise.*) **) ***) indicate significant at 1%, 5%, and 10%, respectively, two-tailed test
Tabel 8. Continued
Gadjah Mada International Journal of Business - Sept.-Dec., Vol. 21, No. 3, 2019
306
flow components in companies using finan-cial derivatives for speculative purposes lower than others, even though the persistence of the cash flow components in companies us-ing speculative financial derivatives did not differ from companies using financial deriv-atives for hedging purposes. Therefore, the level of the market mispricing on the oper-ating cash flow components was higher in companies using financial derivatives for speculative purposes than in companies us-ing financial derivatives for hedging purposes.
Second, the results are beneficial to companies using financial derivatives. The findings of this study had proven that a company’s inability to apply hedge account-ing for its financial derivatives could reduce the investors’ confidence, in turn, companies using financial derivatives for speculation would be valued less, Therefore, compa-nies must be able to recognize the negative consequences of using financial derivatives which do not qualify for hedge accounting.
Third, the results can also contribute to the boards of financial accounting standards for the respective countries. The findings de-rived from this study indicated that there was market mispricing of the cash flow compo-nents of the earnings in companies using fi-nancial derivatives for speculative purposes. This information can encourage the boards of financial accounting standards to prepare, and establish accounting policies that govern the disclosure of derivative instruments in a format that will be easier to understand, and be identified by investors. This will: (i) Assist investors in understanding and identifying the types of derivative instruments used by a company, the purpose of using these de-rivative instruments, the risk exposures that drive the use of these instruments, as well
as the differences that exist between the ac-counting hedges (derivatives that meet the criteria for hedge accounting), economic hedges (derivatives that aim to hedge risks), and derivatives for trading activities. (ii) In-crease the availability of information for in-vestors when making investment decisions and reduce the level of market mispricing.
Fourth, capital markets in the respec-tive countries will also gain some advantag-es. The findings of this study provide useful information for the respective capital market supervisory authorities to learn about the negative impacts that the use of financial de-rivatives for speculative purposes will have on market mispricing. This information can encourage the authorities to create a better protection mechanism for investors in the capital markets, for example, through mon-itoring, so as to ensure company compliance with the financial accounting standards in the respective countries, especially in dis-closing their financial derivative instruments.
Despite the many contributions men-tioned above, this study is also affected by two limitations. First, this study only used the criteria of meeting or not meeting the hedge accounting requirement when classifying the users of financial derivatives into two cate-gories (financial derivatives users for specula-tive purposes, and financial derivatives users for hedging purposes). Future research may consider using other alternatives to separate the use of financial derivatives for specu-lative purposes from the use of financial derivatives for hedging purposes. Second, this study only used four countries in the ASEAN region as sample countries. Future research should expand on the research by using countries in the Asia-Pacific region.

Oktavia et al.
307
ReferencesAllayannis, G., and Weston, J. P. (2001). The Use of Foreign Currency Derivatives and Firm
Market Value. The Review of Financial Studies, 14(1), 243–276.Asdrubali, P., and Kim, S. (2008). On the empirics of international smoothing. Journal of Banking
and Finance, 32(3), 374–381.Barton, J. (2001). Does the Use of Financial Derivatives Affect Earnings Management Deci-
sions? The Accounting Review, 76(1), 1–26.Dechow, P. M. (1994). Accounting Earnings and Cash Flow as Measures of Firm Performance:
The role of accounting accruals. Journal of Accounting and Economics, 18(1), 3–42.Dichev, I. D., and Tang, V. W. (2009). Earnings volatility and earnings predictability. Journal of
Accounting and Economics, 47(1-2), 160–181.Dichev, I. D., John R. Graham, Campbell R. Harvey, and Shiva Rajgopal. (2013). Earnings qual-
ity: Evidence from the field. Journal of Accounting and Economics, 56, 1-33.Huang, P., Zhang, Y., Deis, D. R., and Moffitt, J. S. (2009). Do artificial income smoothing and
real income smoothing contribute to firm value equivalently? Journal of Banking and Fi-nance, 33(2), 224–233.
Kothari, S. P., Leone, A. J., and Wasley, C. E. (2005). Performance matched discretionary accrual measures. Journal of Accounting and Economics, 39(1), 163–197.
Mishkin, F. S. (1985). A rational expectations approach to macroeconometrics: Testing policy ineffectiveness and efficient-markets models. Journal of Macroeconomics, 7(1), 127.
Murwaningsari, E., Utama, S., and Rossieta, H. (2015). The Combined Effects of Financial De-rivatives and Discretionary Accruals on the Value Relevance of Earnings and the Book Value of Equity. Gadjah Mada International Journal of Business, 17(2), 179–198.
Papa, V. (2010). Impact of US derivatives accounting policy (SFAS 133) on income smoothing choices and disclosure of derivatives related information. Ph.D Thesis. Cranfield School of Management.
Petersen, M., and Thiagarajan, S. (2000). Risk Measurement and Hedging: With and Without Derivatives. Financial Management, 29(Winter 2000), 5–30.
Pincus, M., and Rajgopal, S. (2002). The Interaction between Accrual Management and Hedging: Evidence from Oil and Gas Firms. The Accounting Review, 77(1), 127–160.
Shaw, K. W. (2003). Corporate disclosure quality, earnings smoothing, and earnings’ timeliness. Journal of Business Research, 56(12), 1043–1050.
Siregar, S. V., and Utama, S. (2008). Type of earnings management and the effect of ownership structure, firm size, and corporate-governance practices: Evidence from Indonesia. The International Journal of Accounting, 43(1) , 1-27.
Smith, C. W., and Stulz, R. M. (1985). The Determinants of Firms’ Hedging Policies. Journal of Financial and Quantitative Analysis, 20(4), 391–405.
Watts, R. L., and Zimmerman, J. L. (1978). Towards a Positive Theory of the Determination of Accounting Standards Towards a Positive Theory of the Determination of Accounting. The Accounting Review, 53(1), 112–134.