Embed Size (px)
Citation preview

The Effects of Early Chronic Absenteeism on Third-Grade
Academic Achievement Measures
Prepared for the Wisconsin Department of Public Instruction
By
Richard Coelho
Sierra Fischer
Forrest McKnight Sam Matteson
Travis Schwartz
Workshop in Public Affairs
Spring 2015

©2015 Board of Regents of the University of Wisconsin System All rights reserved.
For an online copy, see www.lafollette.wisc.edu/research-public-service/workshops-in-public-affairs
[email protected] The Robert M. La Follette School of Public Affairs is a teaching and research department
of the University of Wisconsin–Madison. The school takes no stand on policy issues; opinions expressed in these pages reflect the views of the authors.
The University of Wisconsin–Madison is an equal opportunity and affirmative-action educator and employer. We promote excellence through diversity in all programs.

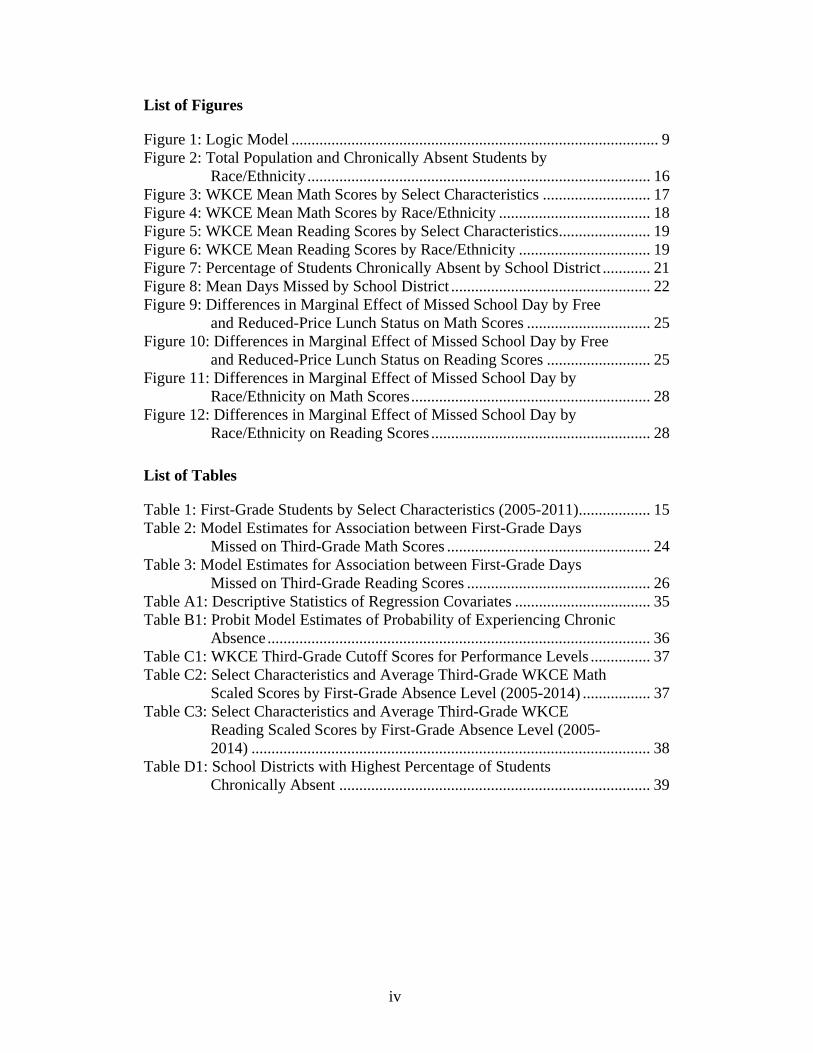
Table of Contents
List of Figures ........................................................................................................ ivList of Tables ......................................................................................................... ivForeword ................................................................................................................. vAcknowledgments.................................................................................................. viExecutive Summary .............................................................................................. viiIntroduction ............................................................................................................. 8Background on Chronic Absenteeism .................................................................... 8
What Affects Absenteeism ............................................................................... 10What Affects Achievement ............................................................................... 11How Absenteeism and Achievement Are Linked ............................................. 12
Data ....................................................................................................................... 13Methodology ......................................................................................................... 13
Academic Achievement .................................................................................... 13Absenteeism ...................................................................................................... 14Controls ............................................................................................................. 14Model ................................................................................................................ 14
Results ................................................................................................................... 14Descriptive Statistics ......................................................................................... 15Chronically Absent Children ............................................................................ 15Chronic Absence and Math Scores ................................................................... 17Chronic Absences and Reading Scores............................................................. 18The Geography of Absence .............................................................................. 19Marginal Effects of Days Missed on Third-Grade Test Scores ........................ 22Marginal Effects of Days Missed for Chronically Absent Students ................. 23Marginal Effects of Days Missed for Low Income Students ............................ 25Marginal Effects of Days Missed for Students of Different Race/Ethnicity .... 27
Data Limitations .................................................................................................... 29Endogeneity ...................................................................................................... 29
Discussion ............................................................................................................. 30Policy Implications ............................................................................................... 31
Early Warning Indicator Systems ..................................................................... 31Interventions ..................................................................................................... 32
Recommendations ................................................................................................. 33Identification ..................................................................................................... 33Program Intervention and Policy Options ......................................................... 33
Conclusion ............................................................................................................ 34Appendix A ........................................................................................................... 35Appendix B ........................................................................................................... 36Appendix C ........................................................................................................... 37Appendix D ........................................................................................................... 39References ............................................................................................................. 40
iv
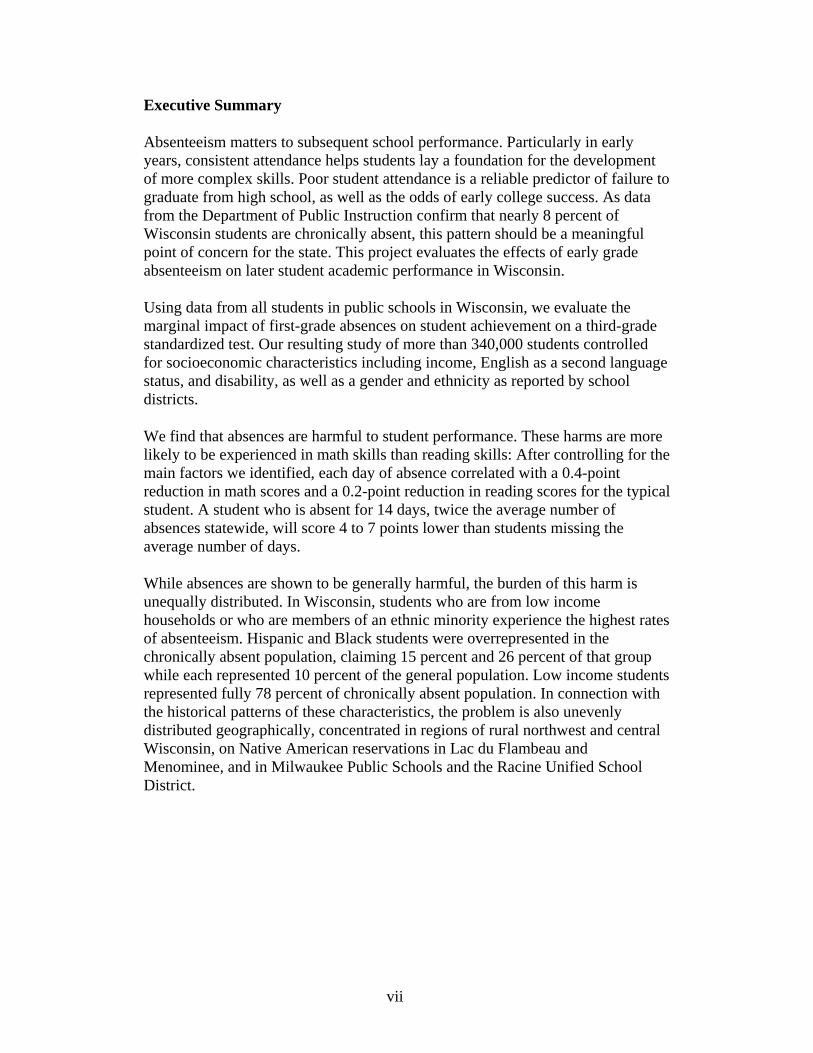
List of Figures
Figure 1: Logic Model ............................................................................................ 9Figure 2: Total Population and Chronically Absent Students by
Race/Ethnicity ...................................................................................... 16Figure 3: WKCE Mean Math Scores by Select Characteristics ........................... 17Figure 4: WKCE Mean Math Scores by Race/Ethnicity ...................................... 18Figure 5: WKCE Mean Reading Scores by Select Characteristics ....................... 19Figure 6: WKCE Mean Reading Scores by Race/Ethnicity ................................. 19Figure 7: Percentage of Students Chronically Absent by School District ............ 21Figure 8: Mean Days Missed by School District .................................................. 22Figure 9: Differences in Marginal Effect of Missed School Day by Free
and Reduced-Price Lunch Status on Math Scores ............................... 25Figure 10: Differences in Marginal Effect of Missed School Day by Free
and Reduced-Price Lunch Status on Reading Scores .......................... 25Figure 11: Differences in Marginal Effect of Missed School Day by
Race/Ethnicity on Math Scores ............................................................ 28Figure 12: Differences in Marginal Effect of Missed School Day by
Race/Ethnicity on Reading Scores ....................................................... 28
List of Tables
Table 1: First-Grade Students by Select Characteristics (2005-2011) .................. 15Table 2: Model Estimates for Association between First-Grade Days
Missed on Third-Grade Math Scores ................................................... 24Table 3: Model Estimates for Association between First-Grade Days
Missed on Third-Grade Reading Scores .............................................. 26Table A1: Descriptive Statistics of Regression Covariates .................................. 35Table B1: Probit Model Estimates of Probability of Experiencing Chronic
Absence ................................................................................................ 36Table C1: WKCE Third-Grade Cutoff Scores for Performance Levels ............... 37Table C2: Select Characteristics and Average Third-Grade WKCE Math
Scaled Scores by First-Grade Absence Level (2005-2014) ................. 37Table C3: Select Characteristics and Average Third-Grade WKCE
Reading Scaled Scores by First-Grade Absence Level (2005-2014) .................................................................................................... 38
Table D1: School Districts with Highest Percentage of Students Chronically Absent .............................................................................. 39

v
Foreword
This report is the result of collaboration between the La Follette School of Public Affairs at the University of Wisconsin–Madison and Wisconsin Department of Public Instruction. Our objective is to provide graduate students at La Follette the opportunity to improve their policy analysis skills while contributing to the capacity of Wisconsin education policymakers to understand how absenteeism early in the educational process affects later student performance. The La Follette School offers a two-year graduate program leading to a master’s degree in public affairs. Students study policy analysis and public management, and they can choose to pursue a concentration in a policy focus area. They spend the first year and a half of the program taking courses in which they develop the expertise needed to analyze public policies. The authors of this report are all in their final semester of their degree program and are enrolled in Public Affairs 869 Workshop in Public Affairs. Although acquiring a set of policy analysis skills is important, there is no substitute for doing policy analysis as a means of learning policy analysis. Public Affairs 869 gives graduate students that opportunity. This year the workshop students were divided into eight teams. Other teams completed projects for the City of Madison, the Wisconsin Department of Children and Families, the Wisconsin Legislative Council, Madison Metro Transit System, the Center for Economic Progress, and The Financial Clinic of New York City. The report builds on research that shows that absenteeism has negative effects on student educational and other outcomes. But there is relatively little research on the effects of absenteeism among younger students or among students in Wisconsin. What research exists relies on large representative state samples. The report contributes to our understanding of this issue by providing evidence that absenteeism is associated with lower student performance, controlling for other observable factors such as socioeconomic status. The findings also show that absenteeism is not just more prevalent among poorer and minority students, but that the effects of absenteeism is greater on performance for these groups.
Donald Moynihan Professor of Public Affairs
Madison, Wisconsin May 2015

vi
Acknowledgments
We would like to thank: Jared Knowles and Carl Frederick from the Wisconsin Department of Public Instruction for providing us with the opportunity to work on this project; Professor Donald Moynihan at the La Follette School of Public Affairs for serving as our advisor; the great folks at the University of Wisconsin–Madison Social Sciences Computing Center for assisting us with the data analysis; Professor David Weimer for providing us with statistical analysis skills; Professor Erica Turner for providing context around data in school; and Karen Faster for her time spent editing our paper.
vii
Executive Summary
Absenteeism matters to subsequent school performance. Particularly in early years, consistent attendance helps students lay a foundation for the development of more complex skills. Poor student attendance is a reliable predictor of failure to graduate from high school, as well as the odds of early college success. As data from the Department of Public Instruction confirm that nearly 8 percent of Wisconsin students are chronically absent, this pattern should be a meaningful point of concern for the state. This project evaluates the effects of early grade absenteeism on later student academic performance in Wisconsin.
Using data from all students in public schools in Wisconsin, we evaluate the marginal impact of first-grade absences on student achievement on a third-grade standardized test. Our resulting study of more than 340,000 students controlled for socioeconomic characteristics including income, English as a second language status, and disability, as well as a gender and ethnicity as reported by school districts.
We find that absences are harmful to student performance. These harms are more likely to be experienced in math skills than reading skills: After controlling for the main factors we identified, each day of absence correlated with a 0.4-point reduction in math scores and a 0.2-point reduction in reading scores for the typical student. A student who is absent for 14 days, twice the average number of absences statewide, will score 4 to 7 points lower than students missing the average number of days.
While absences are shown to be generally harmful, the burden of this harm is unequally distributed. In Wisconsin, students who are from low income households or who are members of an ethnic minority experience the highest rates of absenteeism. Hispanic and Black students were overrepresented in the chronically absent population, claiming 15 percent and 26 percent of that group while each represented 10 percent of the general population. Low income students represented fully 78 percent of chronically absent population. In connection with the historical patterns of these characteristics, the problem is also unevenly distributed geographically, concentrated in regions of rural northwest and central Wisconsin, on Native American reservations in Lac du Flambeau and Menominee, and in Milwaukee Public Schools and the Racine Unified School District.
8
Introduction
A central assumption in the learning process is that an individual student’s presence in an educational environment is a prerequisite for the student to gain from that environment. Throughout the early elementary years, students gain the social and academic skills that are essential to their educational achievement. The learning and attainment of these skills occurs during a critical period of development of a child’s life. Disturbances or delays in a child’s learning in early years can ripple across their progress, as they attempt to build new knowledge and skills upon more basic iterations, and ultimately alter their life course trajectories on several measures of well-being. We find that in the state of Wisconsin, 8 percent of students in first through third grade are chronically absent. A firmly established position among child development and educational experts is that by the end of the third grade, students should no longer be learning to read, but should instead be reading to learn. This frame of logic is highlighted in a report by the Annie E. Casey Foundation, which found that students who did not read at a proficient level by the end of the third grade were four times more likely to not complete high school on time than those who could read proficiently (Hernandez 2011). Failing to graduate high school is associated with negative social outcomes, such as lower lifetime earnings, lower employment levels, poorer health, and increased rates of incarceration (Tyler and Lofstrom 2009). In this report, we define several categories of absenteeism and review the factors associated with educational achievement. Our regression analysis uses statewide longitudinal data from the Wisconsin Department of Public Instruction (DPI), and investigates the relationship between individual student attendance in first grade and their level of achievement on reading and math sections of a third-grade standardized test. Our key research question is: What is the extent of the effect of absences in elementary school on academic achievement? For this study, third-grade standardized test scores measure achievement. Additional questions addressed in this report include: How do absences differentially affect various subgroups? What policies can reduce chronic absenteeism? Our report concludes with a discussion of the results, and our policy recommendations for addressing the issue of chronic absenteeism in Wisconsin’s public schools.
Background on Chronic Absenteeism
The public education system in the United States is based on the assumption that students should attend school on a regular basis in order to learn; this assumption has been codified in every state through compulsory attendance laws. Barring illness, family emergencies, or the occasional special event or crisis, students are expected to attend school. Student absences—whether excused or unexcused—

9
affect education achievement metrics of public interest, such as student standardized test scores, graduation, and dropout rates (Balfanz and Byrnes 2012). In turn, absence rates are themselves influenced by several factors, some of which offer potential avenues for policy intervention as Figure 1 shows.
Figure 1: Logic Model
Source: Authors
In Wisconsin, state law mandates that public schools be open for students for a time equivalent to 180 full school days, with some flexibility to account for weather, early release days, and unforeseen circumstances, etc. Chronic absenteeism, while having no universal definition, is commonly referred to as having missed 10 percent or more of the school year, or more than 18 school days in total (Chang and Romero 2008). Most states’ definitions of chronic absenteeism range between 15-20 days missed (Balfanz and Byrnes 2012). Some states and districts may categorize students as severely or excessively chronically absent if more than 40 school days are missed—about 20 percent of the school year. For our analysis we define chronically absent as 18 to 35 days missed, and excessively chronically absent as 36 or more days missed. Researchers Balfanz and Byrnes (2012) find that chronic absenteeism affects up to 15 percent of the national student population , or 5 million to 7.5 million students each year; with students of color and students living in poverty being most disproportionately affected. The number of chronically absent students is difficult for researchers to estimate because mandated average-daily-attendance reports capture the attendance rate for entire schools, but do not highlight individual student patterns of attendance. A 2008 report focusing on elementary students estimates that 11 percent of kindergartners, 9 percent of first-graders, and 6 percent of third-graders are chronically absent (Chang and Romero 2008). However, the actual rate of absences can vary widely within states and school districts, with some schools experiencing chronic absenteeism as high as 54 percent (Chang and Romero 2008). From the data available from the states that monitor chronic absenteeism,
Absence
AchievementHigh School
Graduation
Lifecourse OutcomesLifetime Earnings
Employment
Incarceration
Health
Determinant Factors
Neighborhood
Factors
School Factors
Parent/ Family
Factors
Individual Student
Factors

10
Balfanz and Byrnes (2012) found that more than half of all chronically absent students come from just 15 percent of schools.
Research suggests that the number of total days missed matters more than the reasons why a student misses school (Gottfried 2010). Although both the cause and the volume of absences matter, the latter is distinctly more important. In his study of multiple cohorts of elementary and middle school students in Philadelphia, Gottfried (2010) finds that the number of school days present significantly affects multiple measures of achievement and indicates that attendance is a robust predictor of student academic achievement. For this reason, chronic absenteeism is different than truancy, which typically measures the pattern and frequency of unexcused absences—hence underestimating total absenteeism.
What Affects Absenteeism
Students can be absent from school for a variety of reasons. The educational process, and the student’s connection to it can influence student attendance, while some other factors can be a function of home or social life. Understanding the most significant factors behind absenteeism is an important precursor to effectively addressing the problem. Several school-level variables lead to chronic absenteeism. The first is the physical condition of the school building. A study of elementary schools in New York found that school building condition was a significant predictor of school attendance after controlling for socioeconomic status variables (Duran-Narucki 2008). The results suggest that increasing the quality of facilities decreases the probability of absenteeism. Schools that lack adequate janitorial staff or use temporary facilities are more likely to have increased rates of absenteeism (Duran-Narucki 2008). In addition to the physical condition of the building, characteristics of school climate affect absenteeism. Factors such as bullying increase the probability of absences. One study found that 20 percent of elementary school students reported they would skip school to avoid being bullied. Furthermore, boredom is a significant cause of absenteeism and later drop out, with 47 percent of dropouts reporting that boredom was a main reason for their decision (Kearney 2008). A student’s ability to be present during the school day is heavily influenced by circumstances outside of school hours, governed instead by their family and neighborhood. Free and reduced-price lunch is determined by family income levels, and eligibility is significantly positively associated with absenteeism (Epstein and Sheldon 2002; Gottfried 2014). As with achievement measures, social effects from broader units outside the home also have a notable effect on attendance. A student’s sense of personal endangerment as provoked by neighborhood culture or active violence has major explanatory power for increased absenteeism (Bowen and Bowen 1999). As neighborhood poverty increases, student absences increase for elementary school
11
students. This effect holds even after controlling for student demographics. Other statistically significant neighborhood characteristics include average household family size and home ownership. As the average household size in neighborhood increases, the level of absenteeism among students from that neighborhood also tends to increase, although the mechanics of this relationship remain unclear. Conversely, as the number of residents owning their own homes increases, absenteeism decreases, possibly pointing again to the effect of residential stability (Gottfried 2014). Education research typically focuses on external factors that can be influenced by policy, however, students are also actors unto themselves, possessing abilities and traits that inform their educational success regardless of the larger systems in which they are placed. From cognitive functionality to personal health, students have some degree of predisposition and autonomy that can contribute to higher rates of absences. However, these factors are less likely to affect student absences in early elementary grades, and student agency is a much larger contributing factor toward the absences of older students. Student health has a meaningful effect on attendance; obesity, to name one factor, contributes to a small but significant increase in absenteeism (Geier et al 2007). In fact, research suggests that chronic health issues—a category including asthma, disabilities, or lasting injuries, among other problems—are the single most common factor behind student absences (Holbert, Wu, and Stark 2002). Research has found that cognitive ability has an effect on attendance, but its magnitude is debated. Amongst other factors, discouragement can become a fundamental element in a student’s willingness to exert further effort as the “student who is struggling cognitively is likely to feel less connected and less inclined to attend” (Basch 2010). Many studies have attempted to account for active decisions and changing aspirations on the part of students. Some research focused on the role of personality, such as persistence: Duckworth and Seligman (2005) found that “self-discipline has a bigger effect on academic performance than does intellectual talent,” explaining a greater amount of variation in both test scores and school attendance than did IQ measurements.
What Affects Achievement
Many of the factors that predict student absenteeism also predict student performance on test scores. A well-maintained and aesthetically pleasant school building not only increases attendance, but also primes students to put forth a greater scholastic effort (Duran-Narucki 2008). Conversely if structural conditions are allowed to deteriorate or are undercut to begin with, students can internalize negative messages on society’s prioritization of the educational process and respond in kind. School funding is brought up as a possible determinant of student achievement; however the impact of funding is not clear (Greenwald 1996). In a meta-analysis of 400 studies, Hanushek finds “no strong or consistent relationship between school
12
resources and student performance” (Hanushek 1997). This finding is not to be construed to mean that increased school funding will not lead to increased performance, but rather that the marginal effect of additional funding is highly irregular and dependent on specific applications and school circumstances. Funding is therefore not a straightforward determinant of performance in every case. It is well established that children from families with high socioeconomic status, as a general pattern, experience improved educational outcomes, to such an extent that nearly all research attempts to control for this status as a matter of course (Harwell and LeBeau, 2010). The finer points of how this effect translates through class, race, geographic location, family structure or other mediating factors remains in greater dispute. One relatively consistent finding holds that high socioeconomic status parents take a more active role in overseeing their children’s education, supporting schoolwork in the home and involving themselves in school activities and governance. This type of parental involvement is strongly correlated with student achievement, regardless of all other family traits (Jeynes 2005). Parental economic status may also reflect familial expectations for academic success, and that these expectations are a primary mechanism in motivating and supporting achievement (Davis-Kean 2005). Students additionally appear to take cues from larger social units to a limited extent. After family influences, neighbors have generally been shown to have the heaviest affect on student achievement (Levanthal and Brooks-Gunn 2000).
How Absenteeism and Achievement Are Linked
Absenteeism in early grades alters the academic trajectory of students, which can have a prolonged effect on academic and social outcomes. Barrington and Hendricks found that high school dropouts could be identified as early as first grade; high school dropouts demonstrated an absence rate twice that of their peers during the fifth grade (Barrington and Hendricks 1989). Dropping out of high school is correlated with lower earnings, increased rate of incarceration, and lower levels of employment compared to students who received a high school degree (Tyler and Lofstrom 2009). When compared to children with average attendance, students who were chronically absent in kindergarten gained fewer skills in math and reading literacy in first grade (Ready 2010). Most literature on absenteeism relies on older students. One exception finds that individuals chronically absent in kindergarten were among the lowest achievers on first-grade tests, with particularly strong effects for minority students. This association persists until fifth grade: “among poor children[,] chronic absence in kindergarten predicts the lowest levels of educational achievement in fifth grade” (Romero and Lee 2008). They hypothesize that these children come from homes where they are less likely to compensate for missed classroom time with extra work at home.
13
Few studies available directly link absenteeism to academic outcomes in elementary school. However, this inquiry has been explored in relation to secondary and post-secondary education. The research consistently shows that students who are chronically absent perform worse on exams than their peers (Chen and Lin 2008; Gottfried 2009; Marburger 2006). Previous studies have included a large number of students tracked over several years but have focused only on one or two large cities (Gottfried 2009, 2014). Based on our literature review, we believe that our study is the first publicly available study to analyze absences and achievement using a statewide population of early elementary public school students. Our study features a much more comprehensive population than other studies, including several statewide grades in their entirety, but only within the context of Wisconsin.
Data
For our analysis, we used data from Wisconsin Department of Public Instruction’s Longitudinal Data System. DPI collects statewide, pupil-level data from public schools, including demographics, assessment scores, attendance, and suspensions/expulsions from 2005-06 to 2013-14. If the system had data on a student’s first-grade attendance and third-grade test scores, the individual was included in our analysis.
Methodology
Our dataset includes information from 340,332 students. We divided students into cohorts based on the year they began first grade. We then identified and included students who were held back or accelerated forward by examining who took the third-grade test on time with the rest of their cohort. Our estimates of the associations of absences and achievement are slightly more conservative because students who were held back were more likely to have a higher number of absences and lower test scores.
Academic Achievement
Student’s academic achievement was measured using third-grade standardized test scores from the Wisconsin Knowledge and Concepts Examination (WKCE). Wisconsin public schools administer the WKCE to students to assess their mathematics, reading, social studies, science, and language arts skills. The test meets requirements as laid out by the 2001 reauthorization of the Elementary and Secondary Education Act, also known as No Child Left Behind. Our analysis examines the reading and math skills components of the test. Each student receives a raw score based on the number of correct answers, and the test scores are scaled so they can be compared across different test years. In addition, students are rated as attaining minimal performance, basic, proficient, or advanced based on their scaled score. We used the scaled reading and math score as the dependent variables in our analysis. According to DPI, a student rated as
14
proficient should “demonstrate a solid understanding of challenging subject matter and solve a wide variety of problems.” See Appendix A for a complete descriptive statistics for our dependent variables.
Absenteeism
Schools report the number of days each student attended school per year. We subtracted the number of days a child attended school from the number of total possible days they could have attended school as reported by the school. The modal possible attendance days were 180 days.
Controls
We created seven specifications for our model. Our specifications controlled for characteristics that the literature has found may have an effect on academic achievement. Demographic controls include race and gender controls. We control for student disabilities by using an indicator variable that captures whether a student has a school identified disability in grade 1 or grade 2. Furthermore, children who speak English as their second language may score lower on tests because of the language barrier. Therefore, we controlled for students who had English as a second language. In addition, the literature indicates that children in lower income households experience poorer academic outcomes. We were able to use whether a child was ever eligible for free and reduced-price lunch as a proxy for poverty.
Model
We used both ordinary least squares and probit regression analysis to explore the relationship between first-grade absences and third-grade test scores among Wisconsin students. We used linear models to estimate the association between each day missed while controlling for a number of factors. We also used model specifications with specific interactions among variables of interest and days missed to identify the different marginal effects across different subgroups. Our probit models explore factors associated with chronic absent or excessively chronic absenteeism. The probit models served to verify the relationships observed in descriptive analysis of key variables and are included in Appendix B.
Results
Consistent with other studies, we found a negative relationship among the number of school days missed and third-grade math or reading scores. We found that this relationship is stronger for math scores than reading scores. A student who is absent for 14 days, twice the average days of absence, will score 4 to 7 points lower than students missing the average number of days. The test score reduction associated with each day missed displays some variation across sub groups. Students who are chronically or excessively chronically absence display lower average test scores. Student eligibility for free and reduced-price lunch is associated with test score reductions twice that of the peers for each day missed.
15
Descriptive Statistics
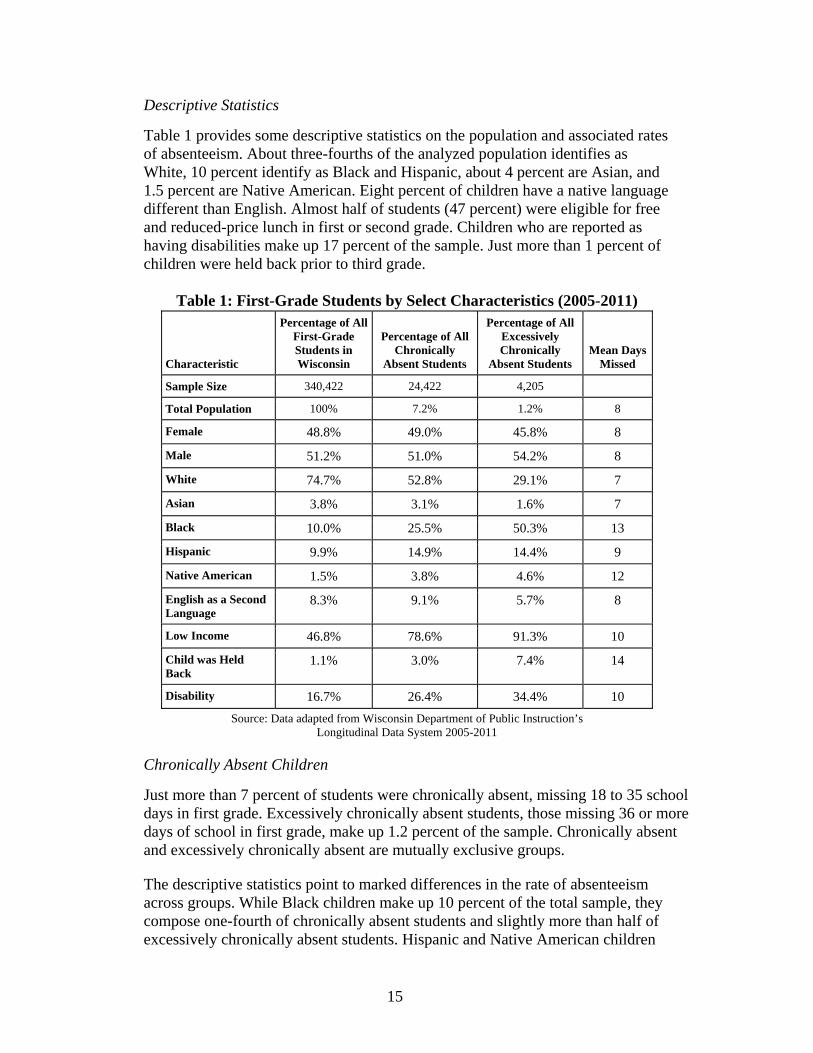
Table 1 provides some descriptive statistics on the population and associated rates of absenteeism. About three-fourths of the analyzed population identifies as White, 10 percent identify as Black and Hispanic, about 4 percent are Asian, and 1.5 percent are Native American. Eight percent of children have a native language different than English. Almost half of students (47 percent) were eligible for free and reduced-price lunch in first or second grade. Children who are reported as having disabilities make up 17 percent of the sample. Just more than 1 percent of children were held back prior to third grade.
Table 1: First-Grade Students by Select Characteristics (2005-2011)
Characteristic
Percentage of All First-Grade Students in Wisconsin
Percentage of All Chronically
Absent Students
Percentage of All Excessively Chronically
Absent Students Mean Days
Missed
Sample Size 340,422 24,422 4,205
Total Population 100% 7.2% 1.2% 8
Female 48.8% 49.0% 45.8% 8
Male 51.2% 51.0% 54.2% 8
White 74.7% 52.8% 29.1% 7
Asian 3.8% 3.1% 1.6% 7
Black 10.0% 25.5% 50.3% 13
Hispanic 9.9% 14.9% 14.4% 9
Native American 1.5% 3.8% 4.6% 12
English as a Second Language
8.3% 9.1% 5.7% 8
Low Income 46.8% 78.6% 91.3% 10
Child was Held Back
1.1% 3.0% 7.4% 14
Disability 16.7% 26.4% 34.4% 10
Source: Data adapted from Wisconsin Department of Public Instruction’s Longitudinal Data System 2005-2011
Chronically Absent Children
Just more than 7 percent of students were chronically absent, missing 18 to 35 school days in first grade. Excessively chronically absent students, those missing 36 or more days of school in first grade, make up 1.2 percent of the sample. Chronically absent and excessively chronically absent are mutually exclusive groups.
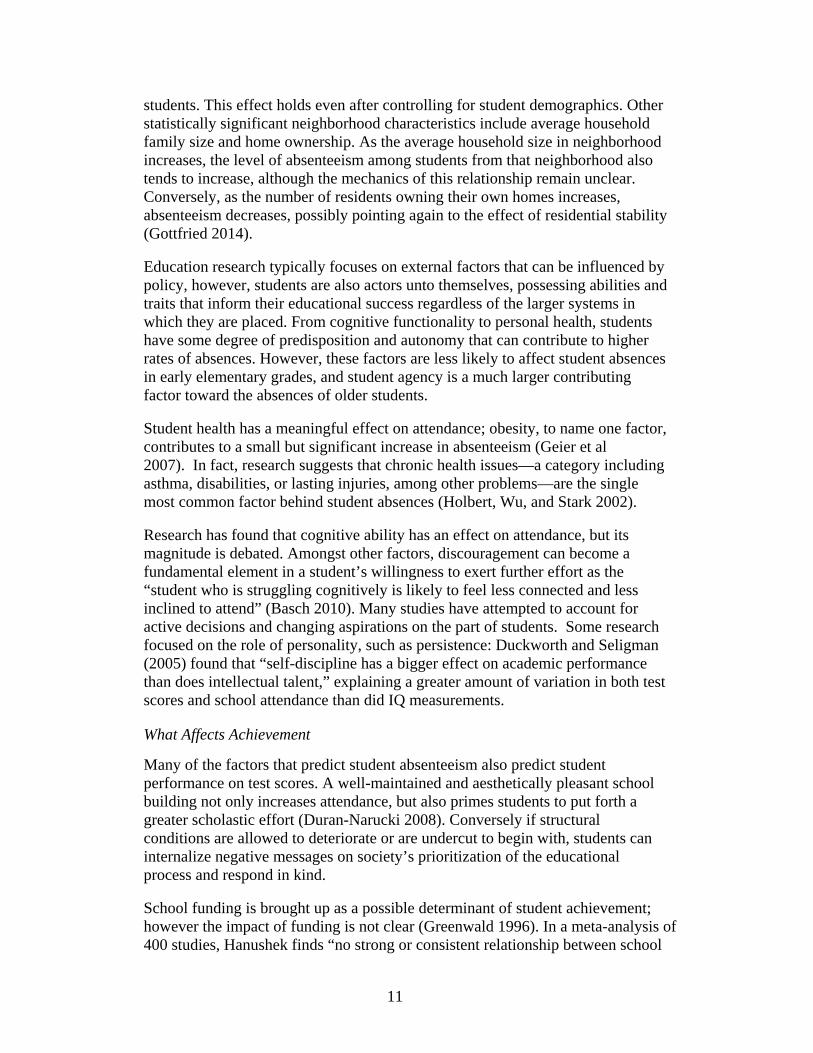
The descriptive statistics point to marked differences in the rate of absenteeism across groups. While Black children make up 10 percent of the total sample, they compose one-fourth of chronically absent students and slightly more than half of excessively chronically absent students. Hispanic and Native American children

16
have a similar trend and a larger percentage of the chronically and excessively chronically absent students than they do in the general population. Conversely, White students account for three-fourths of the population and over half of the chronically absent students and 29 percent of excessively chronically absent students. Similarly, Asians make up 3.8 percent of the population, but 3.1 percent of chronically absent students and 1.6 percent of excessively chronically absent students (Figure 2).
Figure 2: Total Population and Chronically Absent Students by Race/Ethnicity
Source: Data adapted from Wisconsin Department of Public Instruction’s
Longitudinal Data System 2005-2011
Likewise, while poor students make up 47 percent of the sample, they make up 79 percent of those chronically absent and make up 91 percent of all excessively chronically absent students. Children who were ever held back or have disabilities compose a larger percentage of the chronically absent and excessively chronically absent population than the general population. In addition to the chronically absent and excessively chronically absent indicators, mean days missed can identify which populations have the highest absence rates. The entire population missed eight days, on average. The highest number of mean days missed are for children who were held back (14 days), Blacks (13 days), Native American (12 days). The lowest mean days missed were by Asian Americans (seven) and Whites (seven).

17
Chronic Absence and Math Scores
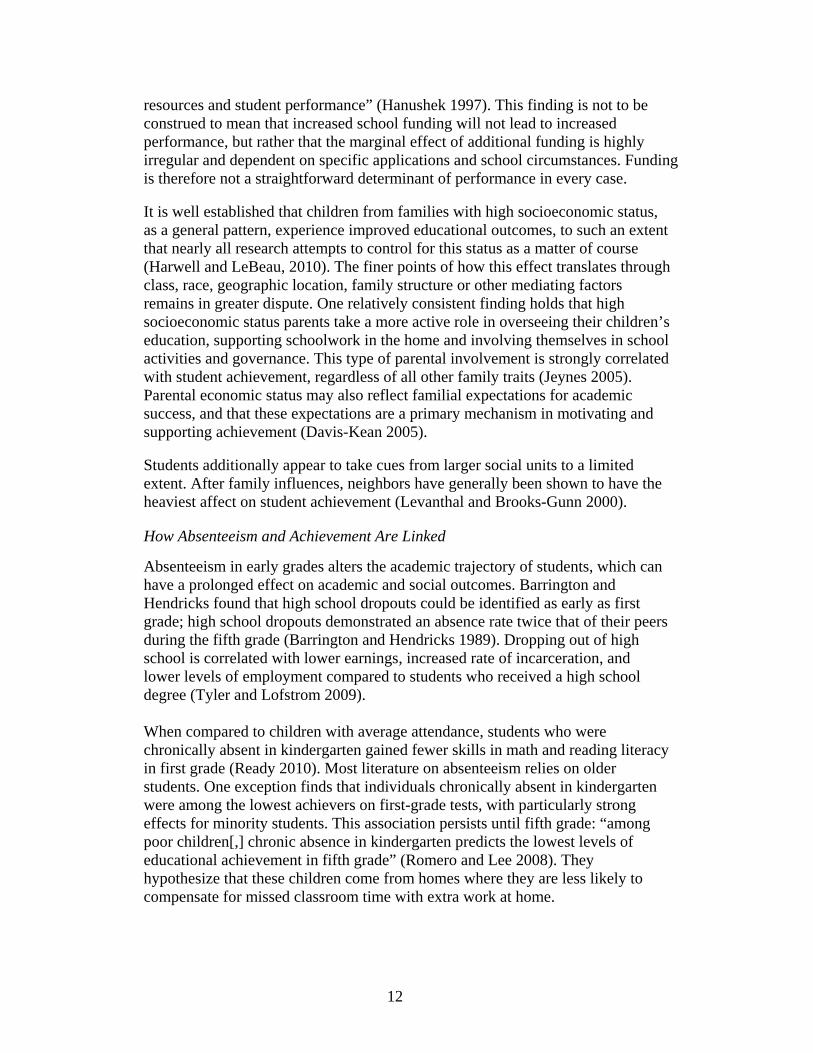
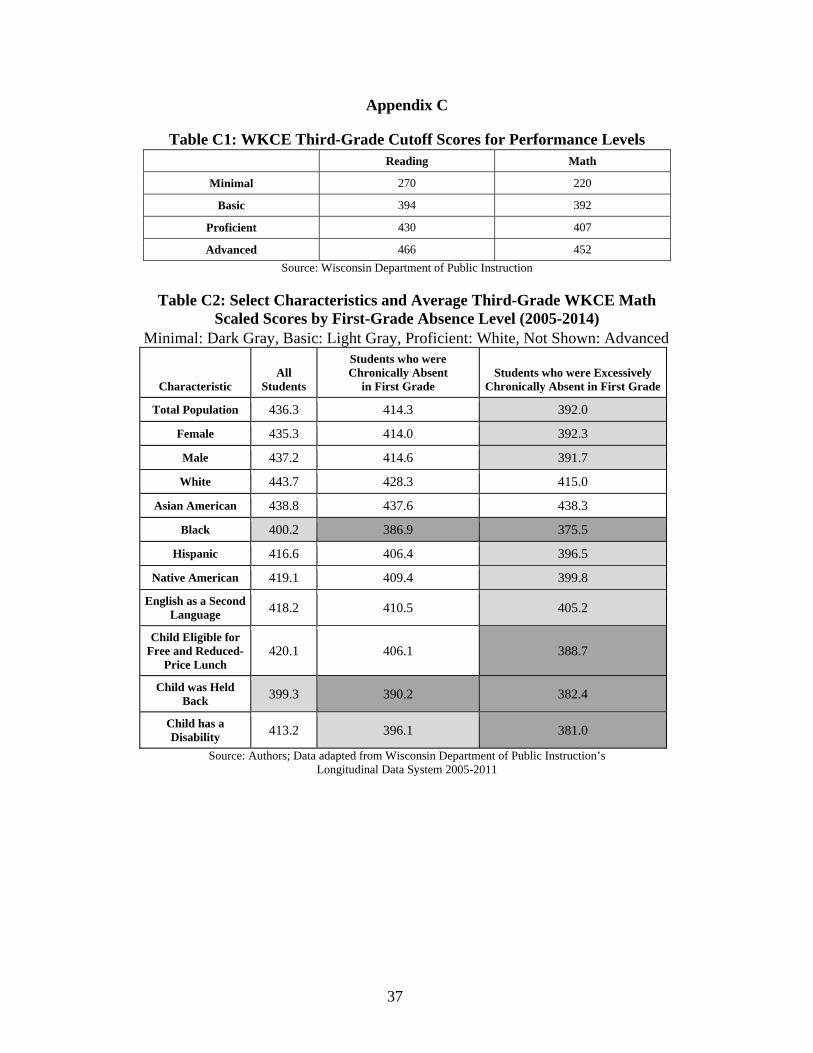
To give background on test scores across the population, we examined the mean math test score for subsets of the population, not controlling for any factors. On average, chronic absences in first reduced WKCE average third-grade math scores. The mean scale score for the sample was 436, but for chronically absent students, the average score was 414, and the mean score was even lower (392) for excessively chronically absent children (see Appendix C). For children with disabilities and those students who were held back, the mean for the excessively chronic absent student population dropped their average score from a proficient to a basic performance level (Appendix C). The mean math score for the entire population of Black students was in the basic level, but the mean for Black students with chronic and excessively chronic absences were in the minimal performance level (Figure 3). Apart from the Asian subgroup, all other subgroups’ mean test scores for chronically absent and excessively chronically absent students were significantly different from the mean test score of the total subgroups’ population (p<.001), with the exception of students who were held back and chronically absent, who still saw a statistically significant difference (p-value < .01).
Figure 3: WKCE Mean Math Scores by Select Characteristics
Source: Data adapted from Wisconsin Department of Public Instruction’s
Longitudinal Data System 2005-2011
350
370
390
410
430
450
English as aSecond Language
Child was Ever onFree or Reduced
Lunch
Child was HeldBack
Child has aDisability
Total Population
All Students
Students who were Chronically Absent in First Grade
Students who were Excessively Chronically Absent in First Grade

18
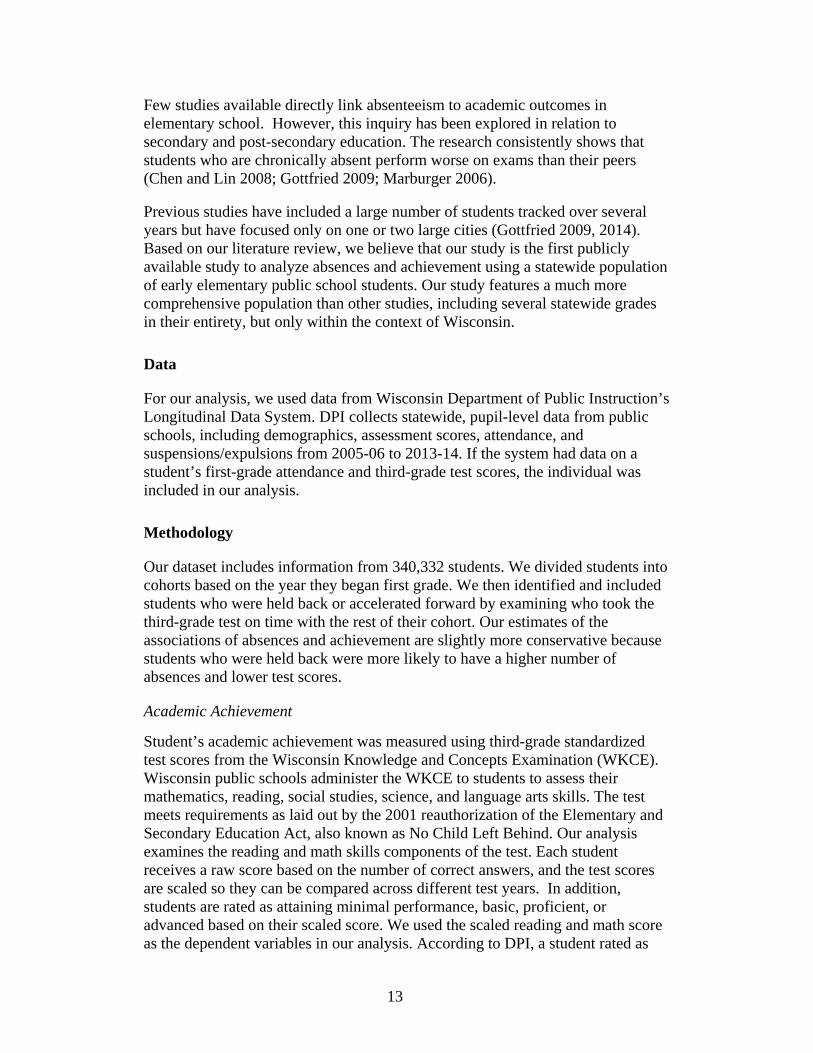
Figure 4: WKCE Mean Math Scores by Race/Ethnicity
Source: Data adapted from Wisconsin Department of Public Instruction’s
Longitudinal Data System 2005-2011
Chronic Absences and Reading Scores
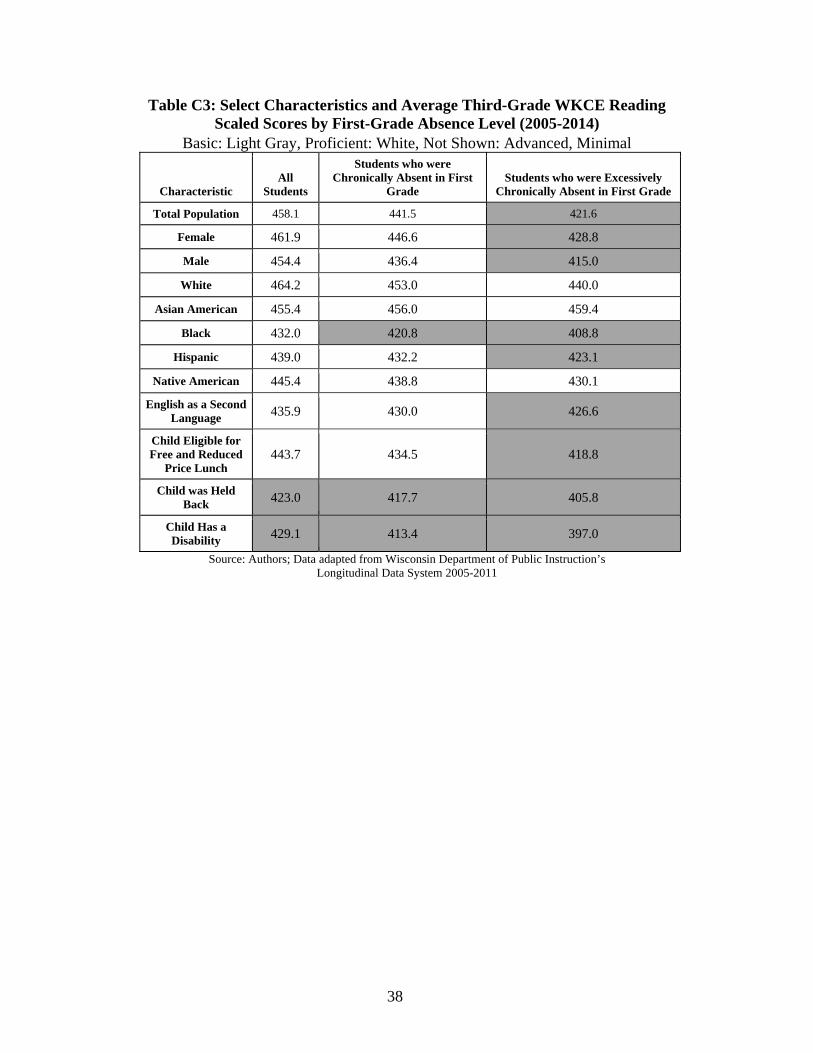
The same trends occur for reading scores as with math scores; students who were chronically or excessively chronically absent have lower mean scores than the total population. The mean reading scaled score for the total population was 458, which qualifies as proficient. The population of students who were chronically absent scored 16 points lower, on average, and the excessively chronically absent had a mean score 37 points lower than that. Apart from the Asian subgroup, all other subgroups’ chronically absent and excessively chronically absent mean test scores were significantly different from the mean test score of the total subgroups’ population (p<.001), with the exception of students who were learning English as a second language and excessively chronically absent who still saw a statistically significant difference (p-value < .01) (Figures 5 and 6; see Appendix C).
350
370
390
410
430
450
White Asian American Black Hispanic NativeAmerican
TotalPopulation
All Students
Students who were Chronically Absent in First or Second Grade
Students who were Excessively Chronically Absent in First or Second Grade

19
Figure 5: WKCE Mean Reading Scores by Select Characteristics
Source: Data adapted from Wisconsin Department of Public Instruction’s
Longitudinal Data System 2005-2011
Figure 6: WKCE Mean Reading Scores by Race/Ethnicity
Source: Data adapted from Wisconsin Department of Public Instruction’s
Longitudinal Data System 2005-2011
We ran a regression analysis to further explore the patterns observed in Table 1. Unlike the descriptive statistics, the regression controls for other predictive factors associated with absenteeism. However, the results of the analysis confirm the pattern shown here, with certain racial/ethnic groups, disability status, and poverty coinciding with a higher probability of being chronically or excessively chronically absent (Appendix B).
The Geography of Absence
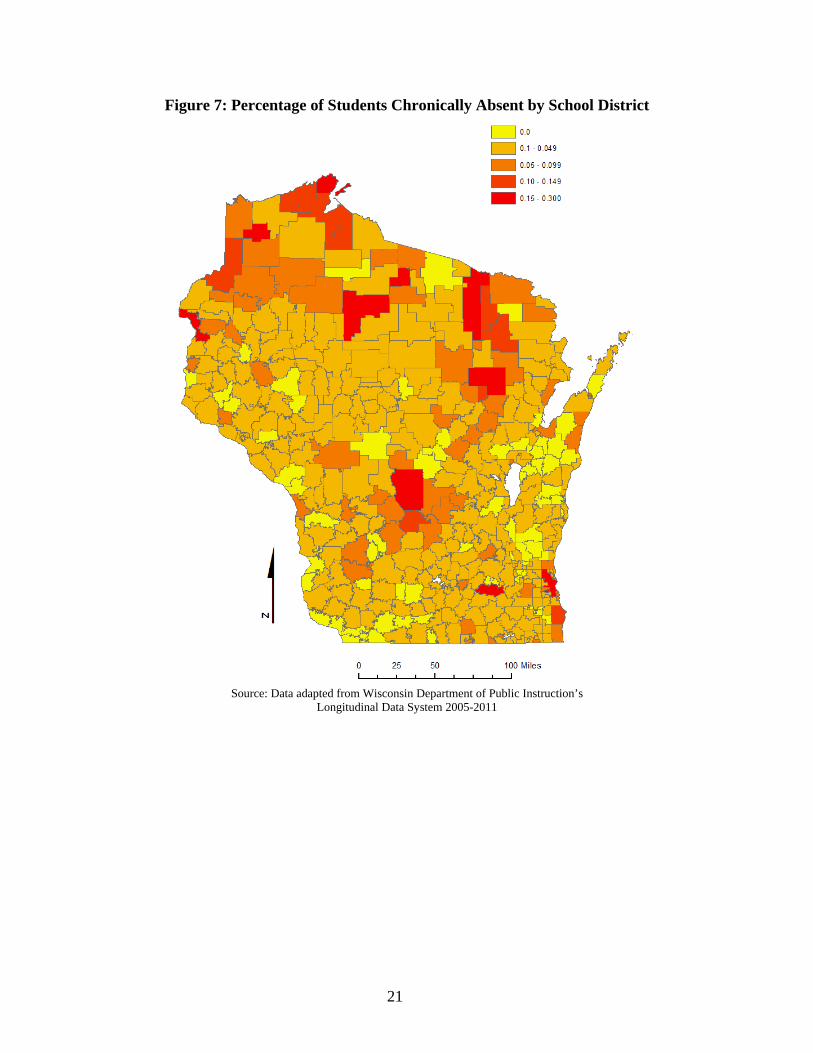
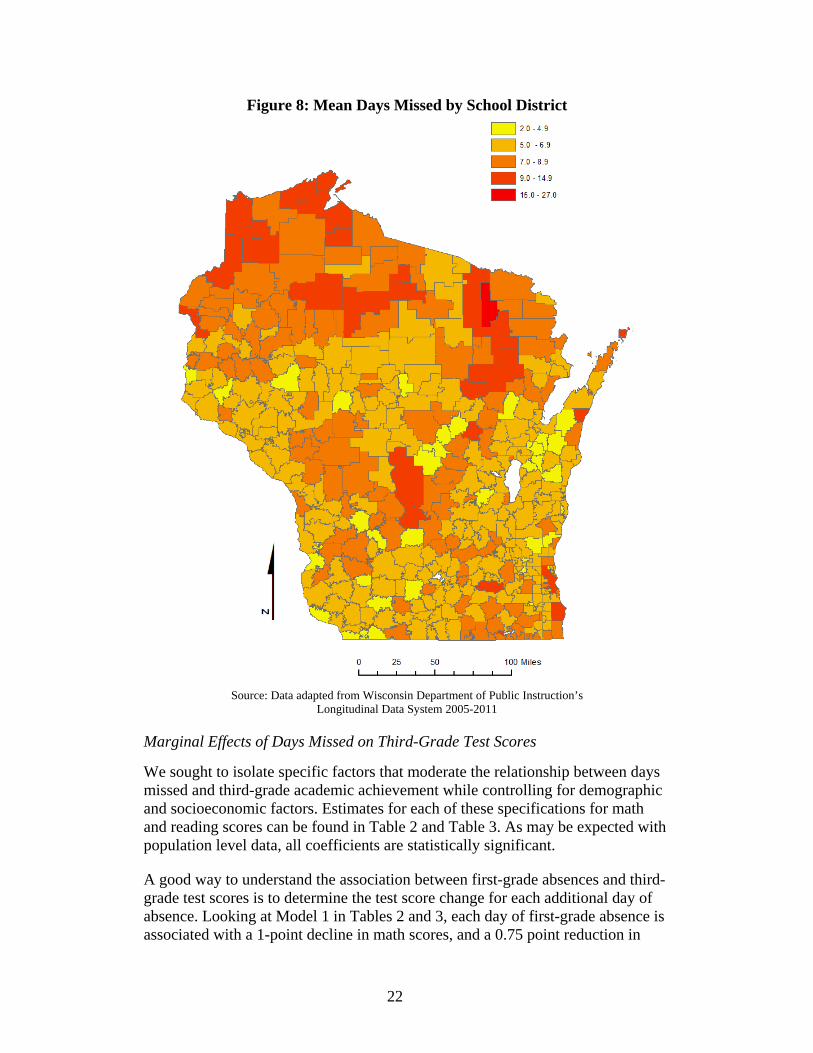
Figures 7 and 8 provide a geographic overview of absences in Wisconsin. In looking at the problem across Wisconsin’s school districts, it is possible to see
350
370
390
410
430
450
470
English as aSecond Language
Child was Ever onFree or Reduced-
Price Lunch
Child was HeldBack
Child has aDisability
Total Population
All Students
Students who were Chronically Absent in First Grade
Students who were Excessively Chronically Absent in First Grade
350
370
390
410
430
450
470
White Asian American Black Hispanic AmericanIndian
TotalPopulation
All Students
Students who were Chronically Absent in First Grade
Students who were Excessively Chronically Absent in First Grade

20
some broad trends. The areas colored dark red represent areas where absences are a distinct problem, with Figure 7 highlighting the percentage of students chronically absent and Figure 8 highlighting the mean days missed across Wisconsin’s 414 school districts. The maps clearly illustrate the geographic diversity of absences in Wisconsin, with rural and urban districts experiencing large percentages of students chronically absent and relatively high mean days missed. A listing of the 20 districts with the highest percentage of chronically absent students can be found in Appendix D. Of the 10 school districts with the highest rate of chronic absenteeism, defined as missing more than 18 days of school, seven are in northern Wisconsin. Two districts are in rural areas. One district, Milwaukee Public Schools, is in southeastern Wisconsin. However, most chronically absent students attend school in urban or suburban school districts. The geographic patterns observed for absences may largely overlap similar maps outlining the prevalence of poverty in these school districts.
21
Figure 7: Percentage of Students Chronically Absent by School District
Source: Data adapted from Wisconsin Department of Public Instruction’s
Longitudinal Data System 2005-2011
22
Figure 8: Mean Days Missed by School District
Source: Data adapted from Wisconsin Department of Public Instruction’s
Longitudinal Data System 2005-2011
Marginal Effects of Days Missed on Third-Grade Test Scores
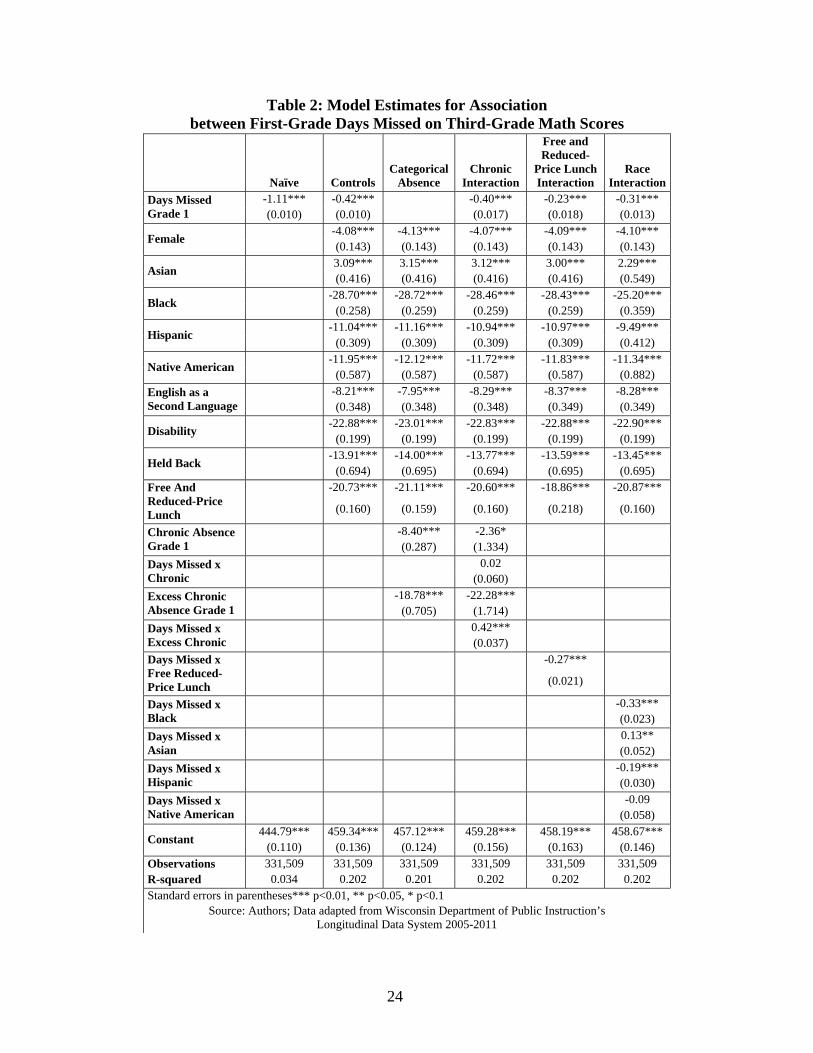
We sought to isolate specific factors that moderate the relationship between days missed and third-grade academic achievement while controlling for demographic and socioeconomic factors. Estimates for each of these specifications for math and reading scores can be found in Table 2 and Table 3. As may be expected with population level data, all coefficients are statistically significant.
A good way to understand the association between first-grade absences and third-grade test scores is to determine the test score change for each additional day of absence. Looking at Model 1 in Tables 2 and 3, each day of first-grade absence is associated with a 1-point decline in math scores, and a 0.75 point reduction in

23
reading scores. Model 2 adds controls for gender, race, disability, and English as a second language, the marginal effect of missing an additional days of school was a 0.4 point reduction in math scores, and a 0.22 point reduction in reading scores.
Another way to think about the substantive effect is to consider a doubling of the mean days missed in first grade. Average number of days missed in grade 1 is about 7.4 days. Students who miss twice the average number of school days see math test scores 4 to 7 points lower and reading scores 1 to 5 points lower.
Marginal Effects of Days Missed for Chronically Absent Students
The marginal effect of each day missed on performance declines as students experience higher levels of absenteeism. Models 3 and 4 in Tables 2 and 3 made it possible to isolate the test score reduction associated with each day missed for students who experienced chronic absence or excessive chronic absence in grade 1 or grade 2. Considering math scores, the marginal effects of each day missed is lower for students with a history of chronic absence, dropping from a 0.32 point reduction for students with average attendance compared to a 0.18 point reduction for chronic and a 0.21 point reduction for excessive chronic absence. A more interesting picture emerges when considering the association with reading scores. While the relationship is again weaker overall, the coefficient on the interaction between chronic absence and each day missed is statistically insignificant, suggesting no changes to the marginal affects. Model 3 used a categorical variable to capture chronic and excess chronic absence. We observe patterns previously discussed, with chronically absent students’ average math scores 6.2 points below their peers when controlling for several factors, and excessively chronically absent students scoring 9.3 points lower. This pattern holds with reading scores, with chronically absent students scoring on average 3.9 points lower and excessively chronically absent students 7.3 points lower than their peers.
24
Table 2: Model Estimates for Association between First-Grade Days Missed on Third-Grade Math Scores
Naïve Controls Categorical
Absence Chronic
Interaction
Free and Reduced-
Price Lunch Interaction
Race Interaction
Days Missed Grade 1
-1.11*** -0.42*** -0.40*** -0.23*** -0.31*** (0.010) (0.010) (0.017) (0.018) (0.013)
Female -4.08*** -4.13*** -4.07*** -4.09*** -4.10*** (0.143) (0.143) (0.143) (0.143) (0.143)
Asian 3.09*** 3.15*** 3.12*** 3.00*** 2.29*** (0.416) (0.416) (0.416) (0.416) (0.549)
Black -28.70*** -28.72*** -28.46*** -28.43*** -25.20***
(0.258) (0.259) (0.259) (0.259) (0.359)
Hispanic -11.04*** -11.16*** -10.94*** -10.97*** -9.49***
(0.309) (0.309) (0.309) (0.309) (0.412)
Native American -11.95*** -12.12*** -11.72*** -11.83*** -11.34***
(0.587) (0.587) (0.587) (0.587) (0.882)
English as a Second Language
-8.21*** -7.95*** -8.29*** -8.37*** -8.28*** (0.348) (0.348) (0.348) (0.349) (0.349)
Disability -22.88*** -23.01*** -22.83*** -22.88*** -22.90***
(0.199) (0.199) (0.199) (0.199) (0.199)
Held Back -13.91*** -14.00*** -13.77*** -13.59*** -13.45***
(0.694) (0.695) (0.694) (0.695) (0.695)
Free And Reduced-Price Lunch
-20.73*** -21.11*** -20.60*** -18.86*** -20.87***
(0.160) (0.159) (0.160) (0.218) (0.160)
Chronic Absence Grade 1
-8.40*** -2.36* (0.287) (1.334)
Days Missed x Chronic
0.02 (0.060)
Excess Chronic Absence Grade 1
-18.78*** -22.28*** (0.705) (1.714)
Days Missed x Excess Chronic
0.42*** (0.037)
Days Missed x Free Reduced-Price Lunch
-0.27***
(0.021)
Days Missed x Black
-0.33*** (0.023)
Days Missed x Asian
0.13** (0.052)
Days Missed x Hispanic
-0.19*** (0.030)
Days Missed x Native American
-0.09 (0.058)
Constant 444.79*** 459.34*** 457.12*** 459.28*** 458.19*** 458.67***
(0.110) (0.136) (0.124) (0.156) (0.163) (0.146)
Observations 331,509 331,509 331,509 331,509 331,509 331,509 R-squared 0.034 0.202 0.201 0.202 0.202 0.202 Standard errors in parentheses*** p<0.01, ** p<0.05, * p<0.1
Source: Authors; Data adapted from Wisconsin Department of Public Instruction’s Longitudinal Data System 2005-2011

25
Marginal Effects of Days Missed for Low Income Students
Another subgroup effect of interest is the difference in test score reductions associated with each day of absence on students eligible for free and reduced-price lunch. We explored the marginal affect for these students in Model 5 from Tables 2 and 3. On math scores, poor students lose 0.5 points for each day missed compared to 0.22 points for their peers. The analysis of reading scores suggests that there may be no reduction in reading scores associated with each day missed for students not eligible. For poorer students, there is a 0.32 point reduction in reading scores for each day missed. Figures 9 and 10 illustrate these patterns, with the contrasting slopes of the reading score lines highlighting the very different test score reductions experienced by poorer students.
Figure 9: Differences in Marginal Effect of Missed School Day by Free and Reduced-Price Lunch Status on Math Scores
Source: Data adapted from Wisconsin Department of Public Instruction’s
Longitudinal Data System 2005-2011
Figure 10: Differences in Marginal Effect of Missed School Day by Free and Reduced-Price Lunch Status on Reading Scores
Source: Data adapted from Wisconsin Department of Public Instruction’s
Longitudinal Data System 2005-2011
Free and Reduced-Price
Lunch
Peers
-8
-7
-6
-5
-4
-3
-2
-1
0
7 8 9 10 11 12 13 14
Tes
t S
core
Poi
nt
Red
uct
ion
Days Missed
Peers
-4.5
-4
-3.5
-3
-2.5
-2
-1.5
-1
-0.5
0
7 8 9 10 11 12 13 14
Tes
t S
core
Poi
nt
Red
uct
ion
Days Missed
Free and Reduced-Price Lunch

26
Table 3: Model Estimates for Association between First-Grade Days Missed on Third-Grade Reading Scores
Naïve Controls Categorical
Absence Chronic
Interaction
Free and Reduced-
Price Lunch Interaction
Race Interaction
Days Missed Grade 1
-0.83*** -0.26*** -0.14*** -0.01 -0.12***
(0.009) (0.009) (0.015) (0.016) (0.011)
Female 4.60*** 4.57*** 4.59*** 4.59*** 4.58***
(0.125) (0.125) (0.125) (0.125) (0.125)
Asian 1.61*** 1.67*** 1.67*** 1.49*** 1.27***
(0.365) (0.365) (0.365) (0.365) (0.482)
Black -20.26*** -20.10*** -19.97*** -19.91*** -15.82***
(0.226) (0.227) (0.227) (0.227) (0.314)
Hispanic -8.07*** -8.10*** -8.01*** -7.99*** -6.31***
(0.271) (0.271) (0.271) (0.271) (0.362)
Native American -8.30*** -8.31*** -8.15*** -8.14*** -7.24***
(0.514) (0.514) (0.514) (0.514) (0.773)
English as a Second Language
-15.38*** -15.27*** -15.40*** -15.59*** -15.47***
(0.307) (0.307) (0.307) (0.307) (0.308)
Disability -29.53*** -29.58*** -29.51*** -29.53*** -29.55***
(0.175) (0.175) (0.175) (0.175) (0.175)
Held Back -14.49*** -14.31*** -14.19*** -14.08*** -13.92***
(0.608) (0.609) (0.609) (0.608) (0.609)
Free and Reduced-Price Lunch
-16.44*** -16.64*** -16.46*** -14.04*** -16.64***
(0.140) (0.139) (0.140) (0.191) (0.140)
Chronic Absence Grade 1
-5.22*** 2.11*
(0.252) (1.170)
Days Missed x Chronic
-0.22***
(0.052)
Excess Chronic Absence Grade 1
-15.76*** -16.26***
(0.618) (1.503)
Days Missed x Excess Chronic
0.13***
(0.033)
Days Missed x Free Reduced Lunch
-0.35***
(0.019)
Days Missed x Black -0.41***
(0.020)
Days Missed x Asian 0.06
(0.046)
Days Missed x Hispanic
-0.21***
(0.026)
Days Missed x Native American
-0.14***
(0.051)
Constant 464.44*** 474.15*** 472.77*** 473.50*** 472.67*** 473.30***
(0.099) (0.119) (0.109) (0.137) (0.143) (0.128)
Observations 330,715 330,715 330,715 330,715 330,715 330,715
R-squared 0.024 0.223 0.223 0.223 0.224 0.224
Standard errors in parentheses*** p<0.01, ** p<0.05, * p<0.1 Source: Authors; Data adapted from Wisconsin Department of Public Instruction’s
Longitudinal Data System 2005-2011

27
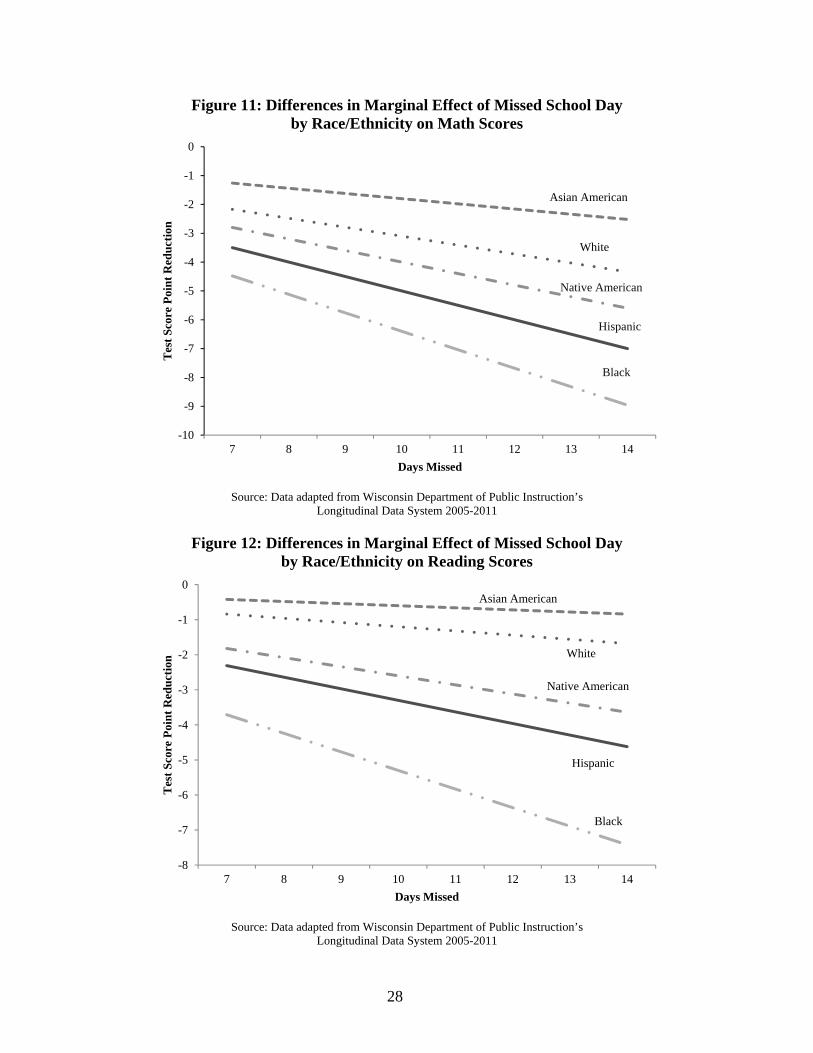
Marginal Effects of Days Missed for Students of Different Race/Ethnicity
We also sought to capture the differences in the marginal reduction in test scores for each day missed for students of different races and ethnicity. While race/ethnicity itself may not directly influence absence and test scores, it can serve as an appropriate stand-in for a number of other unobserved factors. In Model 6 of Tables 2 and 3, we control for disability and free and reduced-price lunch status, and observe differences in the marginal effect of each additional day of absence in math and reading scores. For math scores, there is a strong difference between white students and all other minority students. For each day missed, White students see a 0.29 drop in math scores while Hispanic students see a 0.5 point reduction, Asians see a 0.4 point reduction, Native Americans see a 0.39 reduction, and Black students see a 0.7 point reduction in math scores. A similar pattern holds when observing reading scores. While White students experienced a 0.1 point reduction in scores for each day missed, this effect was much smaller than found for students from other races and ethnicities, with the exception of Asian students. Hispanics see a 0.3 reduction, Native Americans see a 0.2 reduction, and Black students see a 0.5 point reduction for each day missed. Differences in the marginal associations can lead to significant differences in the affect of doubling average days missed. For White students, a doubling of days missed is associated with a 2-point reduction in math scores, while a similar doubling of days missed is associated with a 4.9-point reduction in scores for Black students. This is illustrated in Figures 11 and 12. This difference is even more apparent when looking at reading scores, where a doubling is associated with a 0.6 reduction in scores for White students, but a 3.8 point difference in scores for Black students. Having controlled for a number of factors, this marginal effect for Black students is the strongest test score reduction associated with absence seen for any group.
28
Figure 11: Differences in Marginal Effect of Missed School Day by Race/Ethnicity on Math Scores
Source: Data adapted from Wisconsin Department of Public Instruction’s
Longitudinal Data System 2005-2011
Figure 12: Differences in Marginal Effect of Missed School Day by Race/Ethnicity on Reading Scores
Source: Data adapted from Wisconsin Department of Public Instruction’s
Longitudinal Data System 2005-2011
Asian American
White
Native American
Hispanic
Black
-10
-9
-8
-7
-6
-5
-4
-3
-2
-1
0
7 8 9 10 11 12 13 14
Tes
t S
core
Poi
nt
Red
uct
ion
Days Missed
Asian American
White
Native American
Hispanic
Black
-8
-7
-6
-5
-4
-3
-2
-1
0
7 8 9 10 11 12 13 14
Tes
t S
core
Poi
nt
Red
uct
ion
Days Missed

29
Data Limitations
As with any research, our analysis has some limitations, which we outline below. Omitted Variable Bias The link between academic achievement and absenteeism cannot be exactly measured due to the problem of omitted variable bias. Omitted variable bias is defined as a situation where “the omitted variable is correlated with the regressor [variable of interest] and ... the omitted variable is a determinant of the dependent variable” (Stock and Watson 2011, 180). Our analysis was limited to available data in the Longitudinal Data System. A literature review suggests that there are many potential impacts on achievement that we could not measure or measure only imperfectly using our dataset. For instance, socioeconomic status plays a prominent role on academic achievement, however our dataset does not include information about family income. Therefore, we used eligibility for free and reduced-price lunch as a proxy for poverty. This measure may be crude, but was accessible for our analysis. Evidence suggests the physical condition of school buildings themselves influences student’s attendance and achievement (Duran-Narucki 2008). Department of Public Instruction data do not contain information reflecting the physical condition of Wisconsin’s schools, but we looked at specification of our models that included school and school district level fixed effects to capture this and other unobserved variables at these levels. The results are analogous, though because of issues with missing data for school districts, we utilize specifications that have the largest N. As with most observational data analysis, we undoubtedly omitted some important variables, but while this omission might bias the estimates, we do not think, based on other research, that inclusion of these variables would have rejected a relationship between absenteeism and school performance.
Endogeneity
Endogeneity refers to the possibility of a single element being influenced by multiple variables in the same system (Shadish, Cook, and Campbell 2002, 394). Unlike in omitted variable bias, we identified relevant factors and included them in in the statistical model. Problems with statistical endogeneity can arise when the relationships are not fully visible or understood, leading to spurious, or simply misleading, knowledge of causal effects. Educational research is rife with endogenous variables and resulting threats, and this larger problem is equally true of the relationship between achievement and absenteeism. For example, familial involvement can have direct impacts on both functions in addition to the functions affecting each other. However, our study has the advantage of a time gap between our dependent variable and independent variable of interest. Because we are measuring the impact of absences on test scores, poor test scores in third grade are
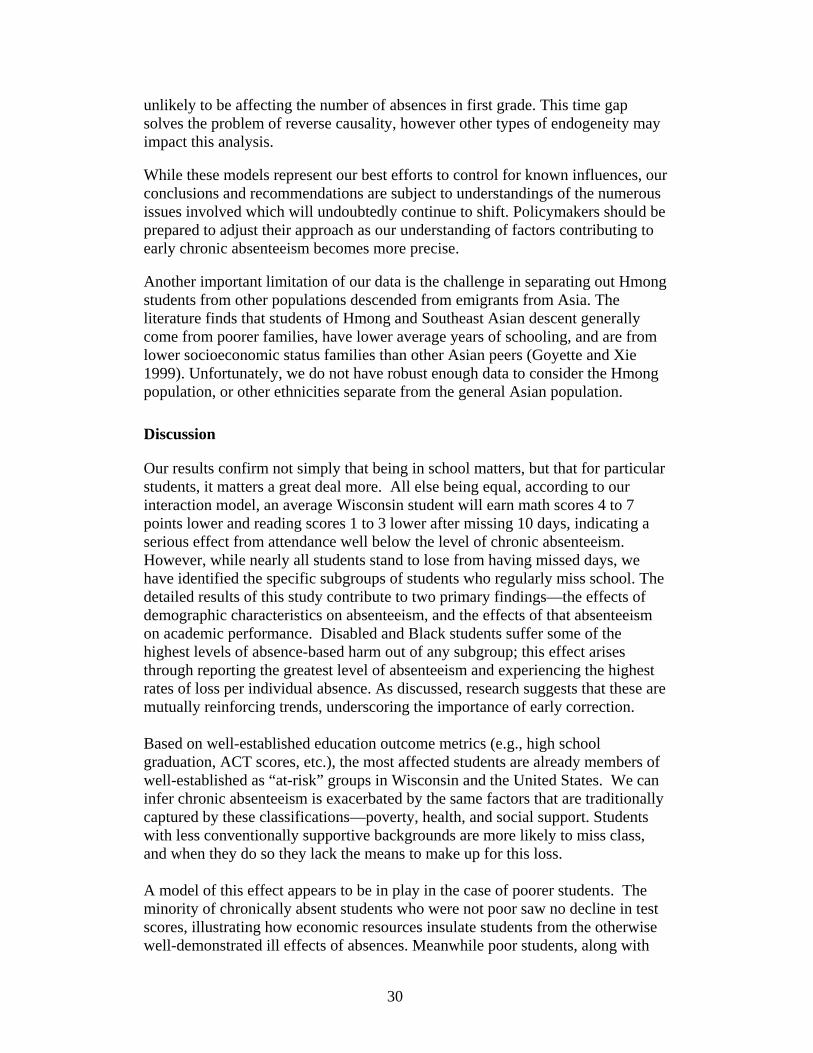
30
unlikely to be affecting the number of absences in first grade. This time gap solves the problem of reverse causality, however other types of endogeneity may impact this analysis. While these models represent our best efforts to control for known influences, our conclusions and recommendations are subject to understandings of the numerous issues involved which will undoubtedly continue to shift. Policymakers should be prepared to adjust their approach as our understanding of factors contributing to early chronic absenteeism becomes more precise. Another important limitation of our data is the challenge in separating out Hmong students from other populations descended from emigrants from Asia. The literature finds that students of Hmong and Southeast Asian descent generally come from poorer families, have lower average years of schooling, and are from lower socioeconomic status families than other Asian peers (Goyette and Xie 1999). Unfortunately, we do not have robust enough data to consider the Hmong population, or other ethnicities separate from the general Asian population.
Discussion
Our results confirm not simply that being in school matters, but that for particular students, it matters a great deal more. All else being equal, according to our interaction model, an average Wisconsin student will earn math scores 4 to 7 points lower and reading scores 1 to 3 lower after missing 10 days, indicating a serious effect from attendance well below the level of chronic absenteeism. However, while nearly all students stand to lose from having missed days, we have identified the specific subgroups of students who regularly miss school. The detailed results of this study contribute to two primary findings—the effects of demographic characteristics on absenteeism, and the effects of that absenteeism on academic performance. Disabled and Black students suffer some of the highest levels of absence-based harm out of any subgroup; this effect arises through reporting the greatest level of absenteeism and experiencing the highest rates of loss per individual absence. As discussed, research suggests that these are mutually reinforcing trends, underscoring the importance of early correction. Based on well-established education outcome metrics (e.g., high school graduation, ACT scores, etc.), the most affected students are already members of well-established as “at-risk” groups in Wisconsin and the United States. We can infer chronic absenteeism is exacerbated by the same factors that are traditionally captured by these classifications—poverty, health, and social support. Students with less conventionally supportive backgrounds are more likely to miss class, and when they do so they lack the means to make up for this loss. A model of this effect appears to be in play in the case of poorer students. The minority of chronically absent students who were not poor saw no decline in test scores, illustrating how economic resources insulate students from the otherwise well-demonstrated ill effects of absences. Meanwhile poor students, along with
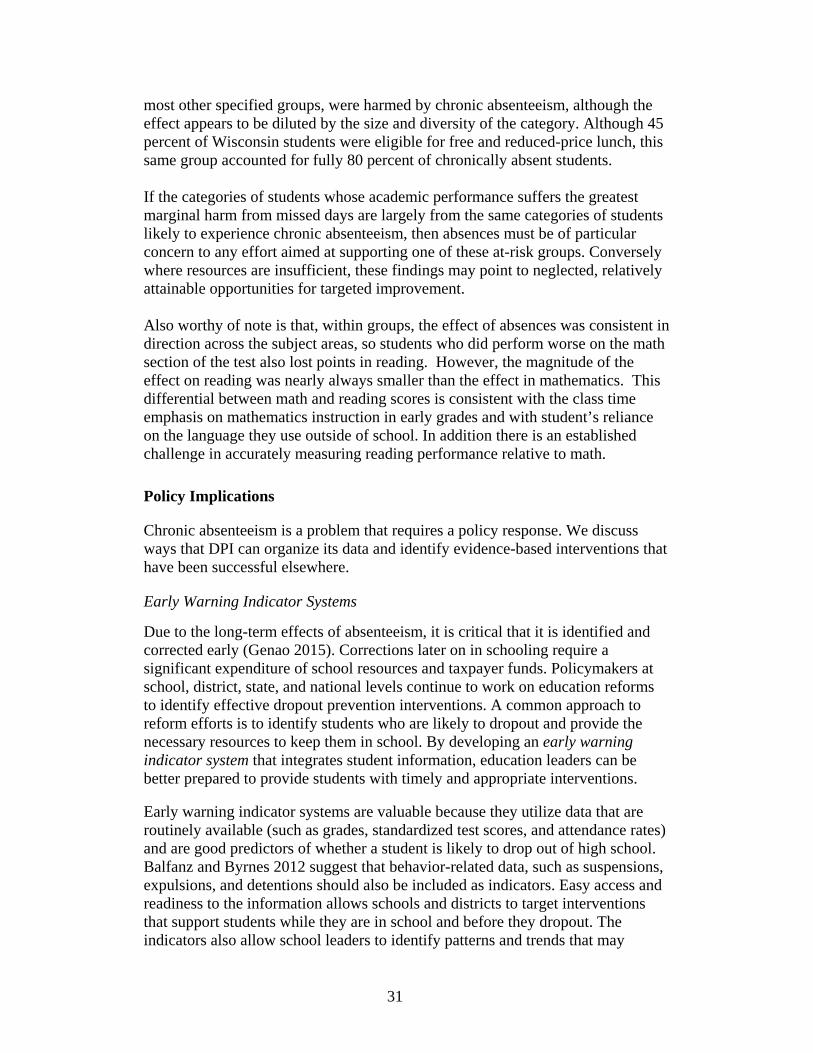
31
most other specified groups, were harmed by chronic absenteeism, although the effect appears to be diluted by the size and diversity of the category. Although 45 percent of Wisconsin students were eligible for free and reduced-price lunch, this same group accounted for fully 80 percent of chronically absent students. If the categories of students whose academic performance suffers the greatest marginal harm from missed days are largely from the same categories of students likely to experience chronic absenteeism, then absences must be of particular concern to any effort aimed at supporting one of these at-risk groups. Conversely where resources are insufficient, these findings may point to neglected, relatively attainable opportunities for targeted improvement. Also worthy of note is that, within groups, the effect of absences was consistent in direction across the subject areas, so students who did perform worse on the math section of the test also lost points in reading. However, the magnitude of the effect on reading was nearly always smaller than the effect in mathematics. This differential between math and reading scores is consistent with the class time emphasis on mathematics instruction in early grades and with student’s reliance on the language they use outside of school. In addition there is an established challenge in accurately measuring reading performance relative to math.
Policy Implications
Chronic absenteeism is a problem that requires a policy response. We discuss ways that DPI can organize its data and identify evidence-based interventions that have been successful elsewhere.
Early Warning Indicator Systems
Due to the long-term effects of absenteeism, it is critical that it is identified and corrected early (Genao 2015). Corrections later on in schooling require a significant expenditure of school resources and taxpayer funds. Policymakers at school, district, state, and national levels continue to work on education reforms to identify effective dropout prevention interventions. A common approach to reform efforts is to identify students who are likely to dropout and provide the necessary resources to keep them in school. By developing an early warning indicator system that integrates student information, education leaders can be better prepared to provide students with timely and appropriate interventions. Early warning indicator systems are valuable because they utilize data that are routinely available (such as grades, standardized test scores, and attendance rates) and are good predictors of whether a student is likely to drop out of high school. Balfanz and Byrnes 2012 suggest that behavior-related data, such as suspensions, expulsions, and detentions should also be included as indicators. Easy access and readiness to the information allows schools and districts to target interventions that support students while they are in school and before they dropout. The indicators also allow school leaders to identify patterns and trends that may

32
contribute to disproportionate dropout rates for subsets of schools or subpopulations of students (Heppen and Therriault 2008). Implementers of early warning indicator systems have focused primarily on high school students, with ninth grade being a critical year for determining the likelihood of dropping out. However, more recent research (Balfanz and Byrnes 2012; Chang and Romero 2010; Ready 2010) indicates that students who display characteristics of a high school dropout can be identified much earlier. We recommend that DPI communicate our findings to school administrators, and include first and second grades in their early warning indicator system for absence related metrics. School leaders should utilize this new information from DPI as well as the early warning indicator system to identify students who are chronically absent and find appropriate programs and interventions to prevent further absence. Examples of best practices of these interventions are discussed below.
Interventions
Addressing chronic absenteeism has been a priority in some urban school districts since 2010. Cities such as Washington, D.C., have established task forces and implemented policies to address the issue (Choice Research Associates 2014). The early returns on these policies have been positive enough to consider emulating. A crucial point to remember is that the students in our analysis are not older students engaging in truancy, but very young students for whom family factors rather than individual choice are the primary mechanisms associated with absenteeism. For this group, family-focused interventions are more relevant than interventions based on targeting the individual student. In the 2012-13 school year Washington, D.C., implemented a community based intervention program targeted at elementary and middle school students called “Show Up, Stand Out” (Choice Research Associates 2014). The program worked with community organizations to attempt to solve problems that families faced, such as unemployment or lack of transportation, or problems applying for government services. The overall goal was to lower barriers that prevent children from attending school. The one-year evaluation of the program delivered promising results, with a large majority of students (78 percent) whose families participated in the program showing improved attendance. However, due to the limited nature of the evaluation, we do not know what percentage of these students continue to qualify as chronically absent, or whether any academic gains resulted. Furthermore, the evaluation contained no comparison group, so it is not possible to attribute the increase in attendance solely to the program. This program was conducted in an urban environment with a heavily poor and minority population, therefore we might not see the same results if implemented throughout Wisconsin. However, this type of program could have a great impact in Milwaukee, Racine, and other urban areas in Wisconsin.

33
Recommendations
Our recommendations are broadly defined between two major categories: identification and remediation.
Identification
DPI collects absence data for every public school student in the state. This data include number of days absent as well as total possible days of attendance. While this information is useful for basic analysis, it is not readily available to school districts or other researchers. Further, it does not contain potentially useful metrics such as percentage of students chronically absent in a specific school or district, or classroom level absence/chronic absence rate. These metrics would provide a much clearer picture of the problem than data provide. As mentioned, just 15 percent of schools contribute to a majority of all student absences nationally (Balfanz & Byrnes 2012), and the identification of these schools will be essential for finding the right policy solutions. Data on absences are incomplete without a fuller picture of the school environment. The literature consistently finds that characteristics such as neighborhood poverty, school building condition, and household ownership rate are correlated with academic outcomes. To understand the relationship of absences to outcomes more clearly, DPI should collect or work with other agencies to collect this information to put together a more robust dataset on factors related to academic achievement. Once data are collected, they should be delivered to schools in readily understandable formats. First, the raw data for each district should be given to local administrators to help them create an early warning system. An early warning system could be housed at the school, district, or state level, as long as the pertinent leaders have the access to the data. Second, DPI should use the data to let districts know how they compare in terms of absenteeism, among other metrics, to their neighboring districts and the state as a whole. These rankings could be made publicly available through the DPI website, which would provide a clearer picture to the public of what can be an opaque issue. A measure of chronic absenteeism should be included on district and school report cards issued by DPI. We also urge schools to include the number of days absent on student report cards to make parents/ guardians more fully aware of their child’s absences. Finally, such data should continue to be made available to researchers for more sophisticated analysis.
Program Intervention and Policy Options
DPI is statutorily limited in its ability to make policy change in schools; much of its power is derived from its relationships and ability to persuade. Understanding this, we have determined several policy options for DPI to consider and communicate to school leaders.

34
First, DPI staff should work with the schools that they identify as having chronic absenteeism and coordinate with their local community organizations, (e.g., Boys and Girls Club, 4-H, Urban League, United Way, AmeriCorps etc.) to raise awareness of the problems and find appropriate interventions. Ideally, these organizations would match chronically absent students with peer and community mentors. To support these programs, schools may need to employ or solicit volunteers to fill positions such as social workers, guidance counselors, and program coordinators. Second, due to the young age of our target population, DPI should work with these organizations to deliver wrap-around services such as those piloted in Washington, D.C. These services could include providing rides to school and appointments, help filing taxes and applying for social services, and assistance with employment searches. These programs are effective at assisting families with young children more so than older students who are likely to miss school for different reasons (Choice Research Associates 2014). Programs like these should begin with a personal visit with families to determine family needs and tailor an individual plan with an emphasis on the child’s education.
Conclusion
Our analysis has shown that absences in first and second grade have a substantial effect on third-grade academic achievement. Children especially susceptible to the impact of early absence on achievement tend to be poorer, minority, disabled and non-native English speakers. Our research adds to the growing body of knowledge linking chronic absenteeism and academic achievement, and is the first study to use statewide, elementary school data to do so. We recommend that DPI communicate our finding to school leaders which demonstrate the associations between early elementary school absences and achievement.

35
Appendix A
Table A1: Descriptive Statistics of Regression Covariates
Variable Observations Mean Std. Dev. Min. Max
Days Missed Grade 1 319035 7.43 7.31 0 179
Days Missed Grade 2 380291 7.02 7.08 0 179
3rd Grade Math Scaled Score 374735 436.9 44.9 220 630
3rd Grade Reading Scaled Score 373586 459.1 39.73 270 640
Chronically Absent 382351 0.08 0.27 0 1
Excessively Chronically Absent 382351 0.02 0.13 0 1
Source: Data adapted from Wisconsin Department of Public Instruction’s Longitudinal Data System 2005-2011

36
Appendix B
Table B1: Probit Model Estimates of Probability of Experiencing Chronic Absence
Variables
Chronic Absences Female 0.03***
(0.006)
Asian American 0.18***
(0.017)
Black 0.50***
(0.009)
Hispanic 0.31***
(0.012)
Native American 0.51***
(0.020)
English as a Second Language -0.27***
(0.013)
Disability 0.27***
(0.007)
Free and Reduced-Price Lunch 0.57***
(0.007)
Constant -1.82***
(0.006)
Observations 382,351
Standard errors in parentheses
*** p<0.01, ** p<0.05, * p<0.1
Source: Authors; Data adapted from Wisconsin Department of Public Instruction’s Longitudinal Data System 2005-2011
37
Appendix C
Table C1: WKCE Third-Grade Cutoff Scores for Performance Levels Reading Math
Minimal 270 220
Basic 394 392
Proficient 430 407
Advanced 466 452
Source: Wisconsin Department of Public Instruction
Table C2: Select Characteristics and Average Third-Grade WKCE Math Scaled Scores by First-Grade Absence Level (2005-2014)
Minimal: Dark Gray, Basic: Light Gray, Proficient: White, Not Shown: Advanced
Characteristic All
Students
Students who were Chronically Absent
in First GradeStudents who were Excessively
Chronically Absent in First Grade
Total Population 436.3 414.3 392.0
Female 435.3 414.0 392.3
Male 437.2 414.6 391.7
White 443.7 428.3 415.0
Asian American 438.8 437.6 438.3
Black 400.2 386.9 375.5
Hispanic 416.6 406.4 396.5
Native American 419.1 409.4 399.8
English as a Second Language 418.2 410.5 405.2
Child Eligible for Free and Reduced-
Price Lunch 420.1 406.1 388.7
Child was Held Back 399.3 390.2 382.4
Child has a Disability 413.2 396.1 381.0
Source: Authors; Data adapted from Wisconsin Department of Public Instruction’s Longitudinal Data System 2005-2011
38
Table C3: Select Characteristics and Average Third-Grade WKCE Reading Scaled Scores by First-Grade Absence Level (2005-2014)
Basic: Light Gray, Proficient: White, Not Shown: Advanced, Minimal
Characteristic All
Students
Students who were Chronically Absent in First
GradeStudents who were Excessively
Chronically Absent in First Grade
Total Population 458.1 441.5 421.6
Female 461.9 446.6 428.8
Male 454.4 436.4 415.0
White 464.2 453.0 440.0
Asian American 455.4 456.0 459.4
Black 432.0 420.8 408.8
Hispanic 439.0 432.2 423.1
Native American 445.4 438.8 430.1
English as a Second Language 435.9 430.0 426.6
Child Eligible for Free and Reduced
Price Lunch 443.7 434.5 418.8
Child was Held Back 423.0 417.7 405.8
Child Has a Disability 429.1 413.4 397.0
Source: Authors; Data adapted from Wisconsin Department of Public Instruction’s Longitudinal Data System 2005-2011

39
Appendix D
Table D1: School Districts with Highest Percentage of Students Chronically Absent
School District Total
Students
Chronically Absent
Students
Excess Chronic Absence
Total Chronic
and Excess
% of Students Chronic
Mean Days
Missed
% of Low-
Income Students
Lac du Flambeau No. 1
308 77 16 93 30 15 90
Solon Springs 132 30 1 31 25 14 45
Milwaukee 34,018 5,941 2,073 8,014 25 13 80
Bayfield 224 40 9 49 20 14 65
Adams-Friendship Area
755 118 17 135 20 12 70
Crandon 426 77 14 91 20 12 55
Phillips 344 60 7 67 20 12 45
Menominee Indian 388 70 8 78 20 11 85
Jefferson 823 146 6 152 20 11 45
St. Croix Falls 479 87 8 95 20 11 35
Laona 127 9 13 22 15 27 50
Ashland 960 106 36 142 15 11 65
Webster 304 38 6 44 15 11 65
Wisconsin Dells 732 105 9 114 15 11 55
Mellen 165 24 2 26 15 11 45
South Shore 90 13 2 15 15 11 45
Gresham 124 14 2 16 15 10 65
Racine 8,893 1162 202 1364 15 10 65
Wabeno Area 214 26 3 29 15 10 50
Washburn 207 26 1 27 15 10 45
Source: Authors; Data adapted from Wisconsin Department of Public Instruction’s Longitudinal Data System 2005-2011
40
References
Balfanz, Robert, and Vaughan Byrnes. 2012. “The Importance of Being There: A Report on Absenteeism in the Nation’s Public Schools.” Baltimore, MD: Johns Hopkins University School of Education, Everyone Graduates Center, Get Schooled:1-46.
Balfanz, Robert, Liza Herzog, and Douglas J. Mac Iver. 2007. “Preventing Student Disengagement and Keeping Students on the Graduation Path in Urban Middle-grades Schools: Early Identification and Effective Interventions.” Educational Psychologist 42 (4):223-235.
Barrington, Byron L, and Bryan Hendricks. 1989. "Differentiating Characteristics of High School Graduates, Dropouts, and Nongraduates." The Journal of Educational Research 82 (6): 309-19.
Basch, Charles E. 2010. “Healthier Students Are Better Learners: A Missing Link in School Reforms to Close the Achievement Gap. Equity Matters.” Research Review 6. Teachers College, Columbia University, Campaign for Educational Equity.
Bowen, Natasha K., and Gary L. Bowen. 1999. “Effects of Crime and Violence in Neighborhoods and Schools on the School Behavior and Performance of Adolescents.” 14 (3):319-342.
Chang, Hedy, and Mariajose Romero. 2008. “Present, Engaged, and Accounted for: The Critical Importance of Addressing Chronic Absence in the Early Grades.” Report. National Center for Children in Poverty.
Chen, Jennjou, and Tsui-Fang Lin. 2008. “Class Attendance and Exam Performance: A Randomized Experiment.” The Journal of Economic Education 39 (3):213-227.
Choice Research Associates. 2014. “Show Up, Stand Out: Year 1 Top Line Evaluation Findings.” District of Columbia Justice Grants Administration:5.
Davis-Kean, Pamela E. 2005. “The Influence of Parent Education and Family Income on Child Achievement: The Indirect Role of Parental Expectations and the Home Environment.” Journal of Family Psychology 19 (2):294.
Duckworth, Angela L., and Martin E. P. Seligman. 2005. “Self-discipline Outdoes IQ in Predicting Academic Performance of Adolescents.” Psychological Science 16 (12):939-944.
Durán-Narucki, Valkiria. 2008. “School Building Condition, School Attendance, and Academic Achievement in New York City Public Schools: A Mediation Model.” Journal of Environmental Psychology 28 (3):278-286.
Epstein, Joyce L., and Steven B. Sheldon. 2002. “Present and Accounted for: Improving Student Attendance Through Family and Community Involvement.” The Journal of Educational Research 95 (5):308-318.

41
Fiester, Leila. 2010. “Early Warning! Why Reading by the End of Third Grade Matters.” Kids Count Special Report. Anne E. Casey Foundation.
Geier, Andrew B., Gary D. Foster, Leslie G. Womble, Jackie McLaughlin, Kelley E. Borradaile, Joan Nachmani, Sandy Sherman, Shiriki Kumanyika, and Justine Shults. 2007. “The Relationship Between Relative Weight and School Attendance Among Elementary School Children.” Obesity 15 (8):2157-2161.
Genao, Soribel. 2015. “Utilizing Data to Combat Absenteeism and Decrease Dropout Rates”. Education and Urban Society. 47 (4): 463-475.
Gottfried, Michael A. 2009. “Excused Versus Unexcused: How Student Absences in Elementary School Affect Academic Achievement.” Educational Evaluation and Policy Analysis 31 (4):392-415.
Gottfried, Michael A. 2010. “Evaluating the Relationship Between Student Attendance and Achievement in Urban Elementary and Middle Schools An Instrumental Variables Approach.” American Educational Research Journal 47 (2):434-465.
Gottfried, Michael A. 2014. “Can Neighbor Attributes Predict School Absences?” Urban Education 49 (2):216-250.
Goyette, Kimberly, and Yu Xie. 1999. “Educational Expectations of Asian American Youths: Determinants and Ethnic Differences.” Sociology of Education 72 (1): 22-36.
Greenwald, Rob, Larry V Hedges, and Richard D Laine. 1996. “The Effect of School Resources on Student Achievement.” Review of Educational Research 66 (3):361-396.
Hanushek, Eric A. 1997. “Assessing the Effects of School Resources on Student Performance: An Update.” Educational Evaluation and Policy Analysis 19 (2):141-164.
Harwell, Michael, and Brandon LeBeau. 2010. “Student Eligibility for a Free Lunch as an SES Measure in Education Research.” Educational Researcher 39 (2):120-131.
Heppen, Jessica B., and Susan Bowles Therriault. 2008. “Developing Early Warning Systems to Identify Potential High School Dropouts.” Issue Brief. National High School Center.
Hernandez, Donald J. 2011. “Double Jeopardy: How Third-Grade Reading Skills and Poverty Influence High School Graduation.” Annie E. Casey Foundation.
Jeynes, William H. 2005. “A Meta-Analysis of the Relation of Parental Involvement to Urban Elementary School Student Academic Achievement.” Urban Education 40 (3):237-269.
42
Kearney, Christopher A. 2008. “School Absenteeism and School Refusal Behavior in Youth: A Contemporary Review.” Clinical Psychology Review 28 (3):451-471.
Leventhal, Tama, and Jeanne Brooks-Gunn. 2000. “The Neighborhoods They Live In: The Effects of Neighborhood Residence on Child and Adolescent Outcomes.” Psychological Bulletin 126 (2):309.
Marburger, Daniel R. 2006. “Does Mandatory Attendance Improve Student Performance?” The Journal of Economic Education 37 (2):148-155.
Ready, Douglas D. 2010. “Socioeconomic Disadvantage, School Attendance, and Early Cognitive Development The Differential Effects of School Exposure.” Sociology of Education 83 (4):271-286.
Romero, Mariajose, and Young-Sun Lee. 2008. “The Influence of Maternal and Family Risk on Chronic Absenteeism in Early Schooling.” Columbia University. New York, NY. National Center for Children in Poverty.
Shadish, William, R., Thomas D. Cook, and Donald Thomas Campbell. 2002. Experimental and Quasi-experimental Designs for Generalized Causal Inference. Wadsworth: Cengage Learning.
Stock, James H, and Mark W Watson. 2011. Introduction to Econometrics. Pearson Education.
Tyler, John H, and Magnus Lofstrom. 2009. “Finishing High School: Alternative Pathways and Dropout Recovery.” The Future of Children 19 (1):77-103.
Uline, Cynthia, and Megan Tschannen-Moran. 2008. “The Walls Speak: The Interplay of Quality Facilities, School Climate, and Student Achievement.” Journal of Educational Administration 46 (1):55-73.