Embed Size (px)
Citation preview
Copyright (C) 2018 EdUHK APFSLT. Volume 19, Issue 2, Article 10 (Dec., 2018). All Rights Reserved.
Asia-Pacific Forum on Science Learning and Teaching, Volume 19, Issue 2, Article 10
(Dec., 2018)
Anisa O. S PRATAMA, Abdurrahman ABDURRAHMAN and Tri JALMO
The effect of science-technology-society approach-based worksheets on improving
Indonesian students' scientific literacy
The effect of science-technology-society approach-based
worksheets on improving Indonesian students'
scientific literacy
Anisa O. S PRATAMA1, Abdurrahman ABDURRAHMAN2 and Tri JALMO3
1Junior High School Science Teacher of Abung Selatan, Lampung,
INDONESIA 2,3
Graduate School of Science Education, University of Lampung,
INDONESIA
1Email: [email protected] 2Email: [email protected]
3Email: [email protected]
Received 1 May, 2017
Revised 3 Apr., 2018
Contents
Abstract
Introduction
o Student worksheets
o Science, Technology and Society (STS) Approach
o Scientific Literacy
Methodology
Result
Discussion
Conclusion
o Acknowledgements
References
Copyright (C) 2018 EdUHK APFSLT. Volume 19, Issue 2, Article 10 (Dec., 2018). All Rights Reserved.
Abstract
The aim of this study was to examine the effectiveness of science-technology-
society (STS) approach based worksheets on improving Indonesian students'
scientific literacy of ‘environmental pollution’ topic. Through quasi-experimental
research method (nonequivalent pre-post control group design), the sample of the
study comprised of 64 junior high school students in Lampung Province,
Indonesia. The sample was assigned to two groups, namely experimental and
control classes. An independent samples t-test and ANCOVA were rectruited to
reveal any difference between the experimental and control groups’ learning
effectiveness and effect sizes. The results showed that the STS approach-based
worksheets increased the students’ scientific literacy levels. Given the values of n-
Gain for the experimental (0.66) and control classes (0.48), the experimental class
performed a higher value than the control one. The experimental group’s eta square
value was found to be p.η2 = 0.767.
Keywords: scientific literacy, STS, worksheets
Introduction
Rapid development of science and technology, which calls for the 21st century
skills, challenges various fields of life. Therefore, a good learning process needs to
equip students with scientific literacy, which enhances their capabilities of science
and technology in comprehensively solving the real-life problems (Inzanah, et al.,
2014). Scientific literacy is very important for reflecting many national conditions.
If the number of qualified people is increased, the national quality also enhances.
In other words, the better people have scientific literacy levels, the better science
and technology determine the societal issues or quality of a society (Fensham,
2008).
The results of the 2015 PISA (Program for International Student
Assessment) indicated that 40 out of 70 countries gained lower scores in science
achievement than international average ones (493) (OECD, 2016). The 2011
TIMSS (Trends in International Mathematics and Science Study) revealed that the
Indonesian students' scientific literacy levels was on the 40th of 42 countries.
That is, Indonesia’s average score was 406, which was lower than the international
avarege score (500) (IEA, 2012). This means that Indonesia has failed in the
International Assessments even though many national efforts have been carried out
so far (Suprapto, 2016). Phrased differently, the results of the PISA and TIMMS
have pointed that the Indonesian students' abilities of science learning have still
been very low. This discrepancy seems to have stemmed from instructional
materials and the depth of science topic (Rahayuni, 2016).
Copyright (C) 2018 EdUHK APFSLT. Volume 19, Issue 2, Article 10 (Dec., 2018). All Rights Reserved.
Although the TIMMS and PISA require high-order thinking skills and scientific
literacy, the Indonesian science education or science learning process has still
included conventional learning processes. That is, teachers have grinnovative
learning strategies and integrating scientific literacy in science classes. As a matter
of fact, Sumarti et al. (2015), who studied with 10 Indonesian teachers at a Junior
High School in Lampung, reported that most of the teachers lacked of innovative
teaching ways to develop scientific literacy levels in the school. They also
addressed why many Indonesian students were very good at memorizing science
content/ knowledge and possessed very limited skills in transferring their
knowledge to novel issues (Sumarti, et al., 2015). Indeed, it is not suprising that
teachers tend to apply conventional learning process or teacher-centered instruction
(Lau, 2013) rather than inquiry-based learning and conceptual understanding
(Cheung, 2000). Because achieving scientific literacy emphasizes science content
knowledge (Chiappetta & Koballa, 2006), teachers need to look for effective
learning approaches in teaching science.
Student worksheets
Teaching materials can be classified under four categories: printing materials (i.e.,
handouts, books, modules, student worksheets, brochures, leaflets, wallcharts,
photos or pictures, and models), listening (audio) materials (e.g., cassettes, radio,
phonograph recordings, and compact discs), audio visual teaching materials (i.e.,
video compact discs, and movies) and interactive multimedia teaching materials
(e.g., computer Assisted Instruction (CAI), interactive multimedia compact disks,
web-based materials) (Prastowo, 2015).
Prastowo (2015) explains that worksheet, as a learning activity, has at least four
functions: (1) minimizing the role of an educator; (2) enabling students to
understand the provided instructional material; (3) engaging students in rich
practical duties; and (4) facilitating the instructional implementation.
Nyamupangedengu and Lelliot (2012) reveals that the worksheet, which focuses on
the topic, learning objectives, contains learning tasks/activities.
Science, Technology and Society (STS) Approach
The goal of STS approach is to give students with the opportunity to compare
science, technology and society with each other and to appreciate how science and
technology contribute to the latest knowledge/information construction (Yager,
1996). The National Science Teachers Association (2003) reveals that teachers and
educators are responsible for their educational outcomes. The STS approach has
emerged as a major movement in science education since the 1970s and remained
as a worldwide science education reform (Pedretti & Nazir, 2011). The STS
generally refers to discuss the relationships and cycles among science, technology,
society and the environment (Yager & Akcay, 2008). In contrast to the traditional
curriculum emphasizing mastery knowledge, the STS approach has a major role in
Copyright (C) 2018 EdUHK APFSLT. Volume 19, Issue 2, Article 10 (Dec., 2018). All Rights Reserved.
developing social responsibility for decision making procedure on socio-scientific
issues or science and technology-related issues (Lau, 2013).
The STS approach has recently been used for technology-centered and problem-
based instructional designs. Yet, conventional learning process or traditional
science employs teaching, demonstration and direct experimentation. In contrast,
the STS approach includes such various interactive learning activities as role
playing, discussion, simulation, game, decision making, debate and problem
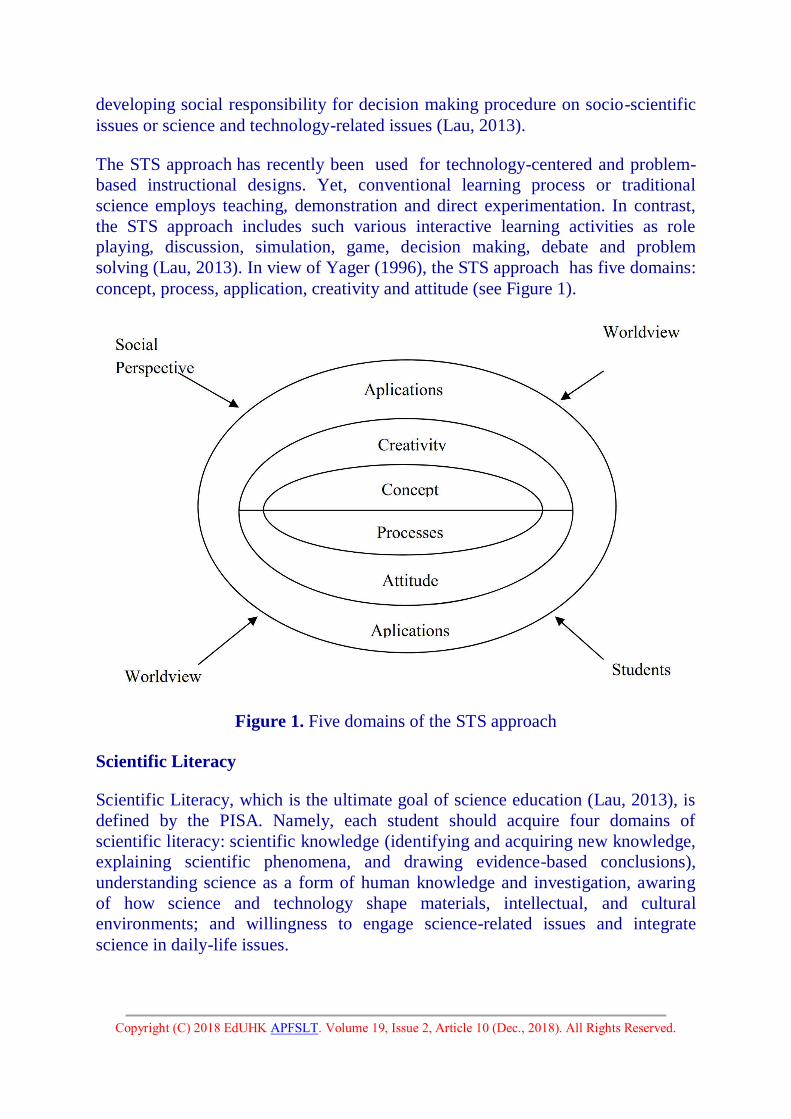
solving (Lau, 2013). In view of Yager (1996), the STS approach has five domains:
concept, process, application, creativity and attitude (see Figure 1).
Figure 1. Five domains of the STS approach
Scientific Literacy
Scientific Literacy, which is the ultimate goal of science education (Lau, 2013), is
defined by the PISA. Namely, each student should acquire four domains of
scientific literacy: scientific knowledge (identifying and acquiring new knowledge,
explaining scientific phenomena, and drawing evidence-based conclusions),
understanding science as a form of human knowledge and investigation, awaring
of how science and technology shape materials, intellectual, and cultural
environments; and willingness to engage science-related issues and integrate
science in daily-life issues.
Copyright (C) 2018 EdUHK APFSLT. Volume 19, Issue 2, Article 10 (Dec., 2018). All Rights Reserved.
Knowledge domain of scientific literacy reflects three indicators: the processes of
knowledge, attitudes toward science and awareness of the science-technology-
society cycle. This means that the PISA assessing scientific literacy focuses on
three competencies of science: content, process, and context.
Science literacy defined by the PISA emphasizes the real-life issues (OECD,
2013). This current research raises environmental pollution, which plays an
important role in increasing scientific literacy. Because environmental pollution
has become a natural phenomenon that we faced, students with good scientific
literacy skills may reduce any environmental pollution. Therefore, there is a need
for measuring the effect of the STS approach-based worksheets on improving the
Indonesian students' scientific literacy levels of ‘environmental pollution’ topic.
Methodology
Within a quasi-experimental research design, two grade 7 classes were
purposefully selected from junior high schools in Lampung, Indonesia. The same
topic (environmental pollution) was taught to both classes. The control group (n =
32 students) was exposed to the conventional instruction, whilst the experimental
group (n = 32 students) was instructed with the worksheets. Then, the experimental
and control groups’ scientific literacy levels were assessed and compared. Later,
independent samples t-test was employed to determine the effects of the teaching
interventions on their scientific literacy levels. The data were obtained through the
‘scientific literacy’ questionnaire. The indicators of scientific literacy were
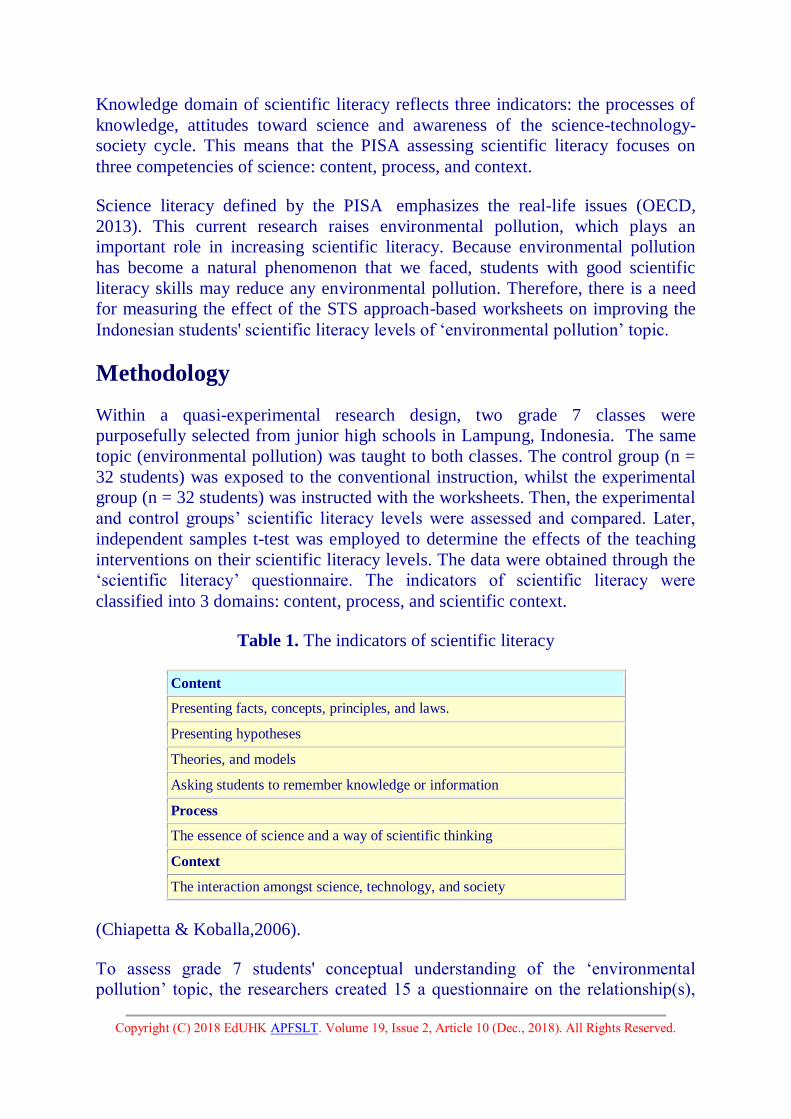
classified into 3 domains: content, process, and scientific context.
Table 1. The indicators of scientific literacy
Content
Presenting facts, concepts, principles, and laws.
Presenting hypotheses
Theories, and models
Asking students to remember knowledge or information
Process
The essence of science and a way of scientific thinking
Context
The interaction amongst science, technology, and society
(Chiapetta & Koballa,2006).
To assess grade 7 students' conceptual understanding of the ‘environmental
pollution’ topic, the researchers created 15 a questionnaire on the relationship(s),
Copyright (C) 2018 EdUHK APFSLT. Volume 19, Issue 2, Article 10 (Dec., 2018). All Rights Reserved.
understanding, and application(s) of the ‘environmental pollution’ topic. These
questions were suitable for Bloom's taxonomy (C3-C6) and the foregoing three
domains of scientific literacy. The researchers pilot-tested the ‘environment
pollution’ questionnaire with 32 students, who had previously taken the same
topic. Two groups firstly took a pre-test before the teaching intervention. Then,
they were treated and immediately given apost-test (see Table 2). Afterwards, their
results were compared (Sugiyono, 2010).
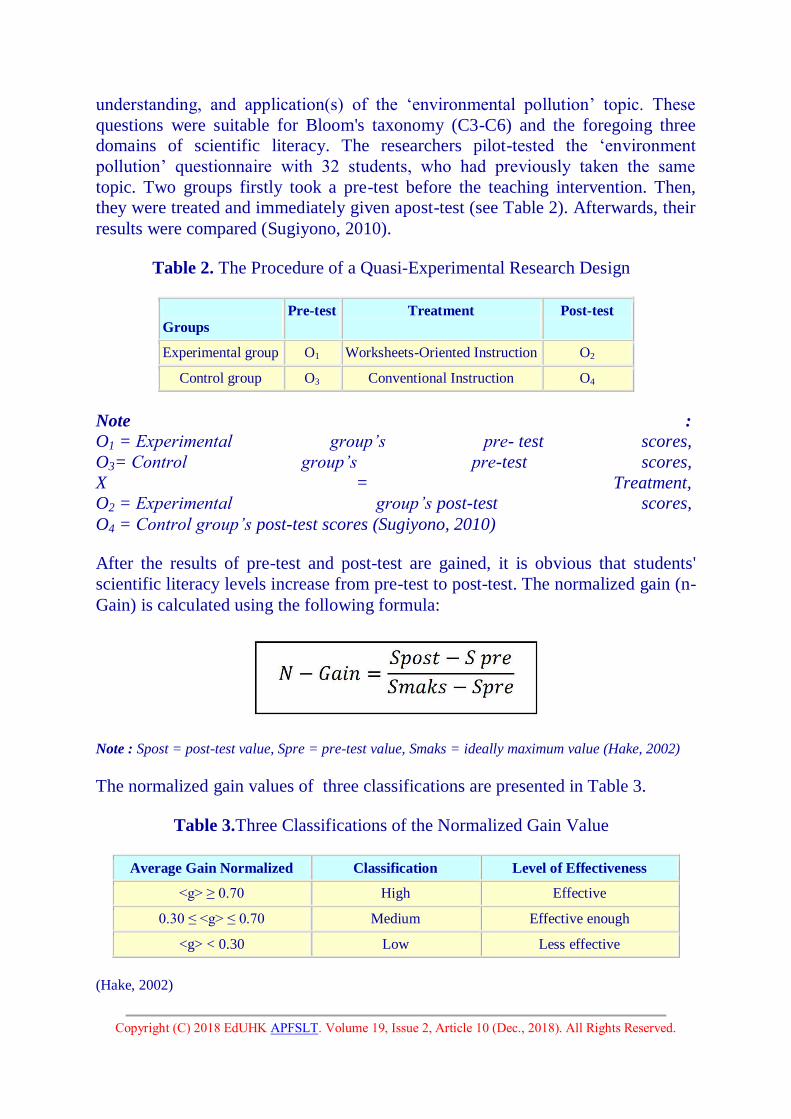
Table 2. The Procedure of a Quasi-Experimental Research Design
Groups Pre-test Treatment Post-test
Experimental group O1 Worksheets-Oriented Instruction O2
Control group O3 Conventional Instruction O4
Note :
O1 = Experimental group’s pre- test scores,
O3= Control group’s pre-test scores,
X = Treatment,
O2 = Experimental group’s post-test scores,
O4 = Control group’s post-test scores (Sugiyono, 2010)
After the results of pre-test and post-test are gained, it is obvious that students'
scientific literacy levels increase from pre-test to post-test. The normalized gain (n-
Gain) is calculated using the following formula:
Note : Spost = post-test value, Spre = pre-test value, Smaks = ideally maximum value (Hake, 2002)
The normalized gain values of three classifications are presented in Table 3.
Table 3.Three Classifications of the Normalized Gain Value
Average Gain Normalized Classification Level of Effectiveness
<g> ≥ 0.70 High Effective
0.30 ≤ <g> ≤ 0.70 Medium Effective enough
<g> < 0.30 Low Less effective
(Hake, 2002)
Copyright (C) 2018 EdUHK APFSLT. Volume 19, Issue 2, Article 10 (Dec., 2018). All Rights Reserved.
Independent samples t-test was used determine the effectiveness of the worksheets-
oriented instruction via IBM SPSS Statistics 21 program. Then, percentages of
the controls and experimental groups were counted on domains of scientific
literacy. Both of the groups took the same test after the teaching intervention.
Then, analysis of covariance (ANCOVA) was run for adjusting their learning
scores to compare the experimental and control groups with one another.
Result
Scientific literacy consists of content (science as knowledge), process (science as a
process of investigation and a way of thinking) and context (the interaction(s)
amongst science, technology, and society). The results of the normalized gain
scores (n-Gain) for each domain of the grade 7 students' scientific literacy levels
are displayed in Table 4.
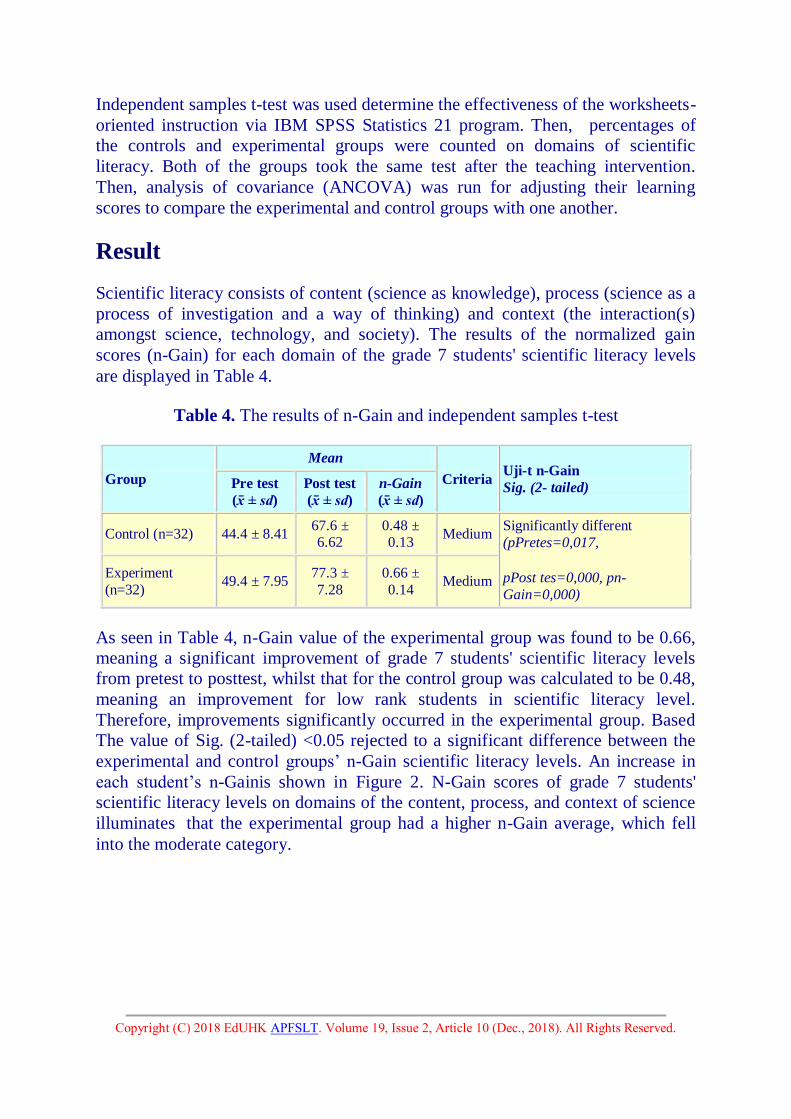
Table 4. The results of n-Gain and independent samples t-test
Group
Mean
Criteria Uji-t n-Gain
Sig. (2- tailed) Pre test
( ) Post test
( ) n-Gain
( )
Control (n=32) 44.4 ± 8.41 67.6 ± 6.62
0.48 ± 0.13
Medium Significantly different
(pPretes=0,017,
pPost tes=0,000, pn-
Gain=0,000)
Experiment
(n=32) 49.4 ± 7.95
77.3 ±
7.28 0.66 ±
0.14 Medium
As seen in Table 4, n-Gain value of the experimental group was found to be 0.66,
meaning a significant improvement of grade 7 students' scientific literacy levels
from pretest to posttest, whilst that for the control group was calculated to be 0.48,
meaning an improvement for low rank students in scientific literacy level.
Therefore, improvements significantly occurred in the experimental group. Based
The value of Sig. (2-tailed) <0.05 rejected to a significant difference between the
experimental and control groups’ n-Gain scientific literacy levels. An increase in
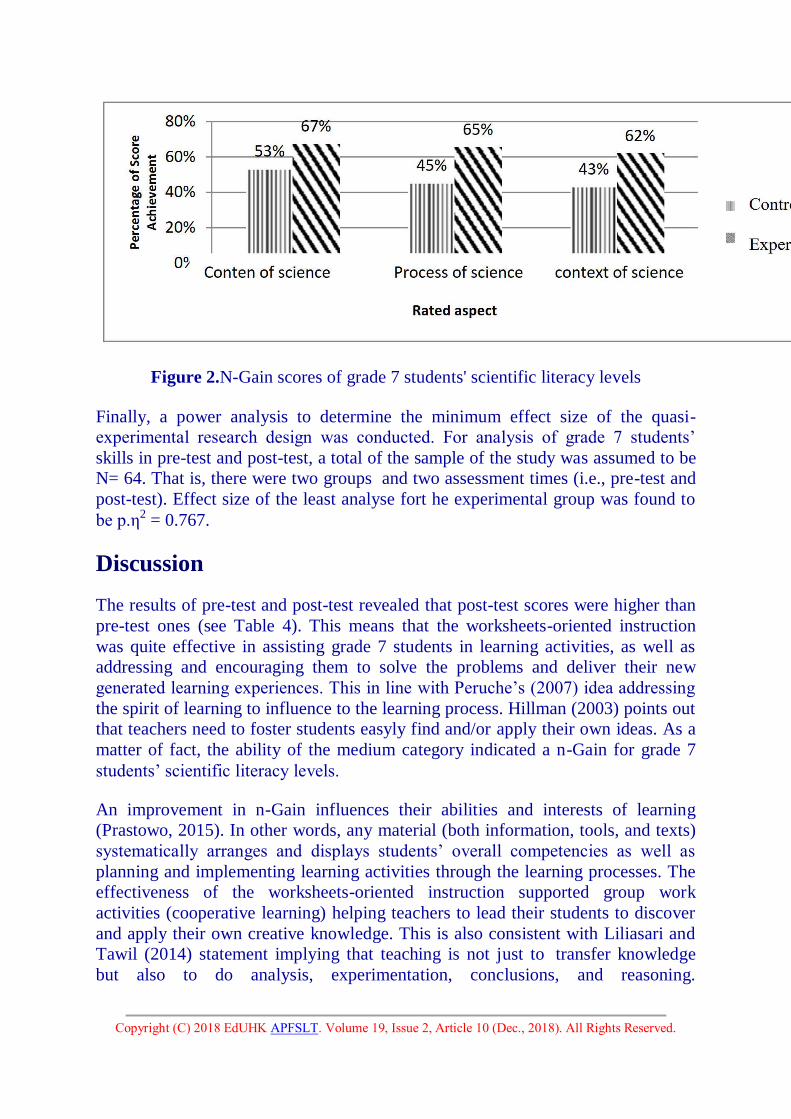
each student’s n-Gainis shown in Figure 2. N-Gain scores of grade 7 students'
scientific literacy levels on domains of the content, process, and context of science
illuminates that the experimental group had a higher n-Gain average, which fell
into the moderate category.
Copyright (C) 2018 EdUHK APFSLT. Volume 19, Issue 2, Article 10 (Dec., 2018). All Rights Reserved.
Figure 2.N-Gain scores of grade 7 students' scientific literacy levels
Finally, a power analysis to determine the minimum effect size of the quasi-
experimental research design was conducted. For analysis of grade 7 students’
skills in pre-test and post-test, a total of the sample of the study was assumed to be
N= 64. That is, there were two groups and two assessment times (i.e., pre-test and
post-test). Effect size of the least analyse fort he experimental group was found to
be p.η2 = 0.767.
Discussion
The results of pre-test and post-test revealed that post-test scores were higher than
pre-test ones (see Table 4). This means that the worksheets-oriented instruction
was quite effective in assisting grade 7 students in learning activities, as well as
addressing and encouraging them to solve the problems and deliver their new
generated learning experiences. This in line with Peruche’s (2007) idea addressing
the spirit of learning to influence to the learning process. Hillman (2003) points out
that teachers need to foster students easyly find and/or apply their own ideas. As a
matter of fact, the ability of the medium category indicated a n-Gain for grade 7
students’ scientific literacy levels.
An improvement in n-Gain influences their abilities and interests of learning
(Prastowo, 2015). In other words, any material (both information, tools, and texts)
systematically arranges and displays students’ overall competencies as well as
planning and implementing learning activities through the learning processes. The
effectiveness of the worksheets-oriented instruction supported group work
activities (cooperative learning) helping teachers to lead their students to discover
and apply their own creative knowledge. This is also consistent with Liliasari and
Tawil (2014) statement implying that teaching is not just to transfer knowledge
but also to do analysis, experimentation, conclusions, and reasoning.
Copyright (C) 2018 EdUHK APFSLT. Volume 19, Issue 2, Article 10 (Dec., 2018). All Rights Reserved.
Understanding science for all countries and state schools is seen as a major part of
achieving scientific literacy (Millar & Osborne, 1998; Norris & Phillips, 2003;
Toharudin, et al., 2011).
Worksheets also affect students’ emotional thinking, mental development levels,
and abilities to make decisions. Effective learning activities emphasize learning
scenarios to make learning meaningful and easier for students to understand.
Abdulrob and Daniel (2015) states that the teaching and learning processes
improve scienctific literacy. Akcay and Akcay (2015) depicts that using the STS
approach-based worksheets makes learning easier for students to understand the
presented material and to enable their progresses in decision-making for their lives
and communities. The use of worksheets including content, process, and context of
science may help students understand the materials taught in science classrooms.
Karsli and Sahin (2009) state that teachers’ worksheets facilitate students’ science
process skills to discover or prove the concept(s) of science.
A higher score in the experimental group than the control one (see Table 4)
denoted that the students in the experimental group were more active than those in
the control one. For example, the experimental group, who spoke more than the
control one in every learning activity, used language more effectively than the
control one. This advocates Noer’s (2016) statement on communicationrelated-
socialization. The language will lead to inaccuracy and uncertainty of the gained
messages. A lack of language skills may result in errors in translating the delivered
materials (misconceptions). In view of Hudson (2002), reading science text(s) is
more effective than recognizing all words and locates specific impormation.
Further, it also involves the ability to infer meaning(s) from the text.
Given science context, the experimental and control groups had the lowest scores
for n-Gain on the content and the process of science. Understanding science is
important for students as the successor of the nation's generation, who will face a
competition environment through the development of science and technology. The
STS approach-based worksheets seems to have made the students more active.
This may stem from the features of the worksheets (e.g., contextual learning) that
encourage students to easily understanding concepts/scientific knowledge. The
STS approach-based worksheets facilitated the students’ life applications to
naturally comprehend science learning processes (Lee, 2014).
Then, Liliasari and Tawil (2014) stress that the interaction amongst science,
technology, and society enhances technological development for human being.
Similarly, Yager and Akcay (2008) address that emphasizing the concepts of
science and technology in human life emerges a sense of students' social
responsibilities towards the roles of science and technology in society. In addition,
the STS approach improves students' learning outcomes and interests of science
learning in all educational levels (Yoruk, et al., 2009).
Copyright (C) 2018 EdUHK APFSLT. Volume 19, Issue 2, Article 10 (Dec., 2018). All Rights Reserved.
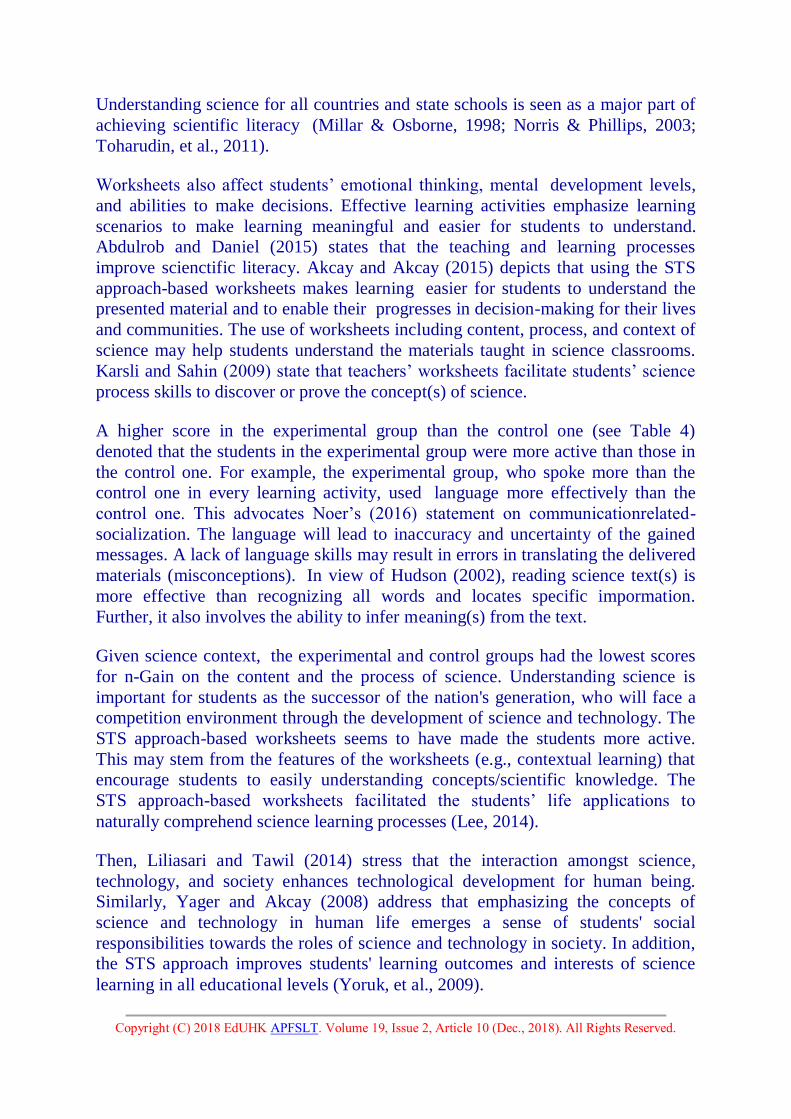
As seen in Figure 3, the grade 7 students with a high n-Gain score showed the
detailed pictural explanations, verbal arguments, and reasoning skills.
Figure 3.A sample response from the grade 7 students with a high n-Gain score
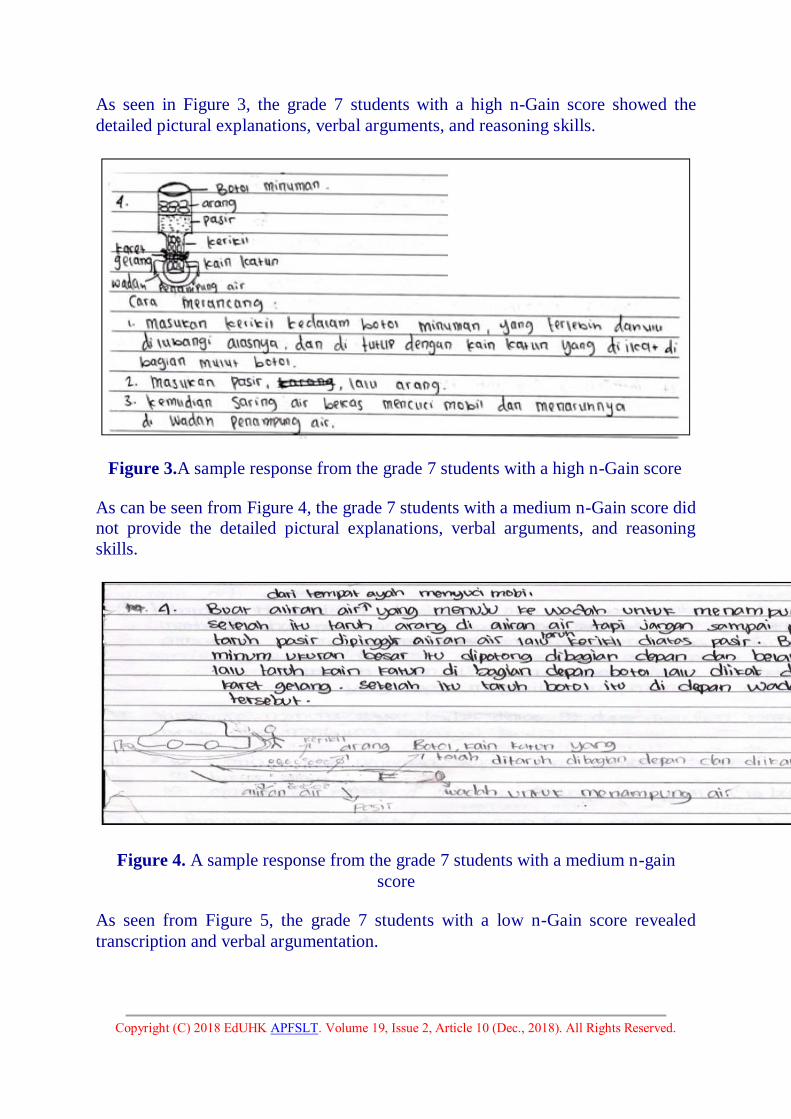
As can be seen from Figure 4, the grade 7 students with a medium n-Gain score did
not provide the detailed pictural explanations, verbal arguments, and reasoning
skills.
Figure 4. A sample response from the grade 7 students with a medium n-gain
score
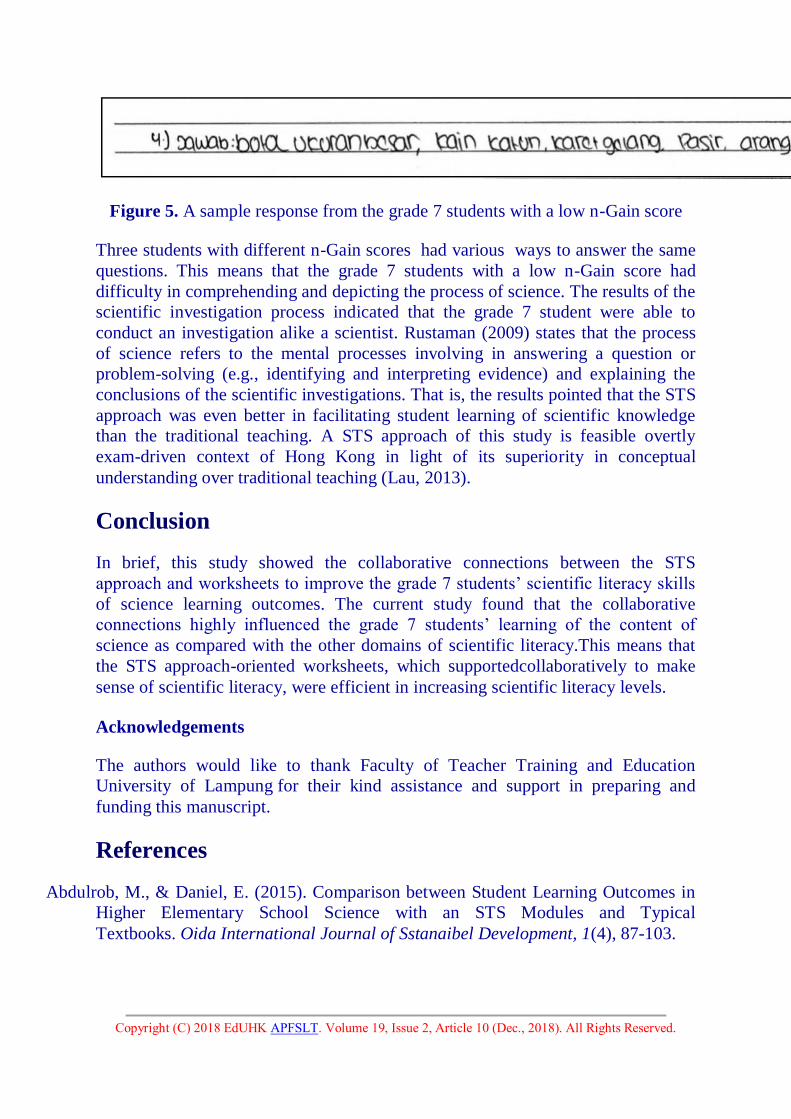
As seen from Figure 5, the grade 7 students with a low n-Gain score revealed
transcription and verbal argumentation.
Copyright (C) 2018 EdUHK APFSLT. Volume 19, Issue 2, Article 10 (Dec., 2018). All Rights Reserved.
Figure 5. A sample response from the grade 7 students with a low n-Gain score
Three students with different n-Gain scores had various ways to answer the same
questions. This means that the grade 7 students with a low n-Gain score had
difficulty in comprehending and depicting the process of science. The results of the
scientific investigation process indicated that the grade 7 student were able to
conduct an investigation alike a scientist. Rustaman (2009) states that the process
of science refers to the mental processes involving in answering a question or
problem-solving (e.g., identifying and interpreting evidence) and explaining the
conclusions of the scientific investigations. That is, the results pointed that the STS
approach was even better in facilitating student learning of scientific knowledge
than the traditional teaching. A STS approach of this study is feasible overtly
exam-driven context of Hong Kong in light of its superiority in conceptual
understanding over traditional teaching (Lau, 2013).
Conclusion
In brief, this study showed the collaborative connections between the STS
approach and worksheets to improve the grade 7 students’ scientific literacy skills
of science learning outcomes. The current study found that the collaborative
connections highly influenced the grade 7 students’ learning of the content of
science as compared with the other domains of scientific literacy.This means that
the STS approach-oriented worksheets, which supportedcollaboratively to make
sense of scientific literacy, were efficient in increasing scientific literacy levels.
Acknowledgements
The authors would like to thank Faculty of Teacher Training and Education
University of Lampung for their kind assistance and support in preparing and
funding this manuscript.
References
Abdulrob, M., & Daniel, E. (2015). Comparison between Student Learning Outcomes in
Higher Elementary School Science with an STS Modules and Typical
Textbooks. Oida International Journal of Sstanaibel Development, 1(4), 87-103.
Copyright (C) 2018 EdUHK APFSLT. Volume 19, Issue 2, Article 10 (Dec., 2018). All Rights Reserved.
Akcay, B. & Akcay H. (2015). The effectiveness of science-technology-society (STS)
instruction on student understanding of the nature of science and attitudes toward
science. International Journal of Education in Mathematics, Science and
Technology, 3(1), 37-45.
Cheung, D. (2000). Analyzing the Hong Kong junior Secondary Science Syllabus Using
the Concepts of Curriculum Orientations. Educatinal Research Kournal, 15(1), 69-
94.
Chiapetta & Koballa. (2006). Science Instruction in the Middle and Secondary Schools:
Developing Fundamental Knowledge and Skills for Teaching, sixth edition.
Pearson Education, Inc. New Jersey.
Chiappetta, E.L, Fillman, D.A, dan Sethna, G.H. (1991b). "A Quantitative Analysis of
High School Chemistry Textbooks for Scientific Literacy Themes and Expository
Learning Aids". Journal of Research in Science teaching, 28 (10), 939-951.
Fensham, Peter, J.(2008). Sceince Eduction Policy-Making Eleven Emerging issue:
UNESCO.
Hake, R. R. (2002). Analyzing Change/Gain Scores. November 2015. http://www.
physics. indiana. edu/~ sdi/AnalyzingChange-Gain.pdf.
Hillman, W. (2003). Learning How to Learn: Problem Based Learning. Australian
Journal of Teacher Education, 28 (2), 1-10.
Hudson, Derek. (2002). Some Thoughts in Scientific Literacy: Motivaties, Meanings and
Curriculum Impactions. Asia-Pacific Forum on Science Learning and Teaching,
3(1), foreword. 1-20.
IEA (International Association for the Evaluation of Educational Achievement).
(2012). TIMSS and PIRLS 2011 Achievement. Boston. TIMSS & PIRLS
International Study Center, Lynch School of Education, Boston College and
International Association for the Evaluation of Educational Achievement (IEA).
Inzanah, Ibrahim, M., & Widodo, W. (2014). Pengembangan Perangkat Pembelajaran
IPA Berbasis Kurikulum 2013 untuk Melatih Literasi Sains Siswa
SMP. Pendidikan Sains Pascasarjana UNESA, 4(1), 459-467.
Karsli & Sahin. (2009). Developing worksheet based on science process skills: Factors
affecting solubility. Asia-Pacific Forum on Science Learning and Teaching, 10(1),
15, 1-12.
Copyright (C) 2018 EdUHK APFSLT. Volume 19, Issue 2, Article 10 (Dec., 2018). All Rights Reserved.
Lau, K. C. (2013). Impact of STSE high school biology course on the scientific literacy of
Hong Kong students. Asia-Pacific Forum on Science Learning and Teaching,
14(1), 6,1-24.
Lee, Che-Di. (2014). Worksheet Usage, Reading Achievement, Classes' Lack of
Readiness, and Science Achievement: A Cross-Country Comparison. International
Journal of Education in Mathematics, Science and Technology, 2(2), 96-106.
Liliasari & Muh. Tawil. (2014). Keterampilan-Keterampilan Sains dan Implementasinya
dalam Materi IPA. Universitas Negeri Makassar. Makassar.
Millar R. & Osborne J.F. (1998). Beyond 2000: Science education for the future. King's
College. London.
National Science Teacher Association and Association (NSTA) for Education of Teachers
in Science. (2003). Standard for Science Teacher Preparation: Social Context.
Washington.
Noer, M. A. (2016). The Improvement On Reading Literacy (Competence) Students of
Chemistry Department-FKIP-Universitas Riau Through Students Worksheet
of English for Chemistry-Based Active Learning. Jurnal Pendidikan Kimia. 8(2),
14-19.
Norris, S. & Phillips. (2003). How Literacy In Its Fundamental Sense is Central to
Scientific Literacy. Science Education, 8(7), 224-240.
Nyamupangedengu, E. & Lelliot, A. (2012). An Exploration on Learners Use of
Worksheets During a Science Museum Visit. African Journal of Research in
Mathematics, Science and Technology Education, 16(12), 1-15.
OECD (Organisation for Economic Co-comperation and Development). (2013). Stong
Performers and Successful Reformers in Education. Paris. OECD Publishing.
Retrieved from http://www.pearsonfoundation.org/oecd/index.html
OECD (Organisation for Economic Co-comperation and Development). (2016). PISA
2015 Results: What Students Know and Can Do Student Performance in
Mathematics, Reading and Science Volume I. Paris. OECD Publishing. Retrieved
from http://www.oecd.org/pisa
Pedretti, E. & Nazir. J. (2011). Currents in STSE education: Mapping a complex field, 40
years on. Science Education, 95, 601-626.
Copyright (C) 2018 EdUHK APFSLT. Volume 19, Issue 2, Article 10 (Dec., 2018). All Rights Reserved.
Peruche, M. Babette. (2007). The Implications of Internal and External Motivation to
Respond without Prejudice for Interracial Interactions. Florida State University
Libraries.
Prastowo, Andi. (2015). Panduan Kreatif Membuat Bahan Ajar Inovatif. Diva Press.
Jogjakarta.
Rahayuni, Galuh. (2016). Hubungan Keterampilan Berpikir Kritis dan Literasi Sains pada
Pembelajaran IPA Terpadu dengan Model PBL dan STM. Jurnal Penelitian dan
Pembelajaran IPA, 2(2), 2, 131-146.
Rustaman, N., Y. (2009). Literasi Sains Anak Indonesia 2000 & 2003. Artikel
Ilmiah. Universitas Pendidikan Bandung. Bandung.
Sugiyono. (2010). Model Penelitian Pendidikan Pendekatan Kuantitatif Kualitatif dan R
& D. Alfabeta. Bandung
Sumarti, S., Rahayu, Y. S, & Madlazim. (2015). Pengembangan Perangkat Pembelajaran
Berbasis Inkuiri Terbimbing untuk Melatih Literasi Sains Siswa. Pendidikan Sains
Unesa, 5(1), 822-829.
Suprapto, Nudi. (2016). What should educational reform in Indonesia look like?-Learning
from the PISA science score of East-Asian countries and Singapore. Asia-Pasific
Forum on Science Learning and Teaching, 17(2), 8,1-19.
Toharudin, U., Hendrawati S., & Rustaman, A. (2011). Membangun Literasi Peserta
Didik. Humaniora. Bandung.
Yager, R. E. & Akcay, H. (2008). Comparison of Student Learning Outcomes in Middle
School Science Classes with an STS Approach and a Typical Textbook
Dominated Approach. Research in Middle Level Education, 31(7), 1-16.
Yager, R. E. (1996). Science/ Technology/ Society. Providing and Appropriate Science for
All. A-Paper- presentasented at the seminar on Science Education and the Graduate
School of IKIP Bandung.
Yoruk, N., Morgil, I., & Secken, N. (2009). The Effect of STSE Education on Student's
Career Planning. Un-China Education Review, 6(8), 68-74.

Copyright (C) 2018 EdUHK APFSLT. Volume 19, Issue 2, Article 10 (Dec., 2018). All Rights Reserved.