Embed Size (px)
Citation preview

THE EFFECT OF PIPE SPACING
0ON MARINE PIPELINE SCOUR
I0
A Thesis
by
JOSEPH HENRY WESTERBORSTMANN
Submitted to the Office of Graduate Studies ofTexas A&M University
in partial fulfillment of the requirements for the degree of
MASTER OF SCIENCE
December 1988
DTICMajor Subject: Ocean Engineering S ELE 1TE
. H
A 2 o 114D TRIB UTi©N .. ,,f T A
Approved f!r puzL c r~.e~z-,lt~~

THE EFFECT OF PIPE SPACING
ON MARINE PIPELINE SCOUR
A Thesis
by
JOSEPH HENRY WESTERHORSTMANN
Approved as to style and cont by:
L. Xachemnelal
air of Committee)
Robert E. Randall Way A.Du lap(Member) (Member)
Aubrey L. Anderson James ao(Member) (Head of Del ment)
December 1988

ABSTRACT
The Effect of Pipe Spacing On Marine Pipeline Scour
(December 1988)
Joseph Henry Westerhorstmann, B.S., University of Florida
Chair of Advisory Committee: Dr. Jerry L. Machemehl
Scour is a major threat to deep water pipelines. A study was performed to
determine the relationship between pipe geometry and scour depth, and examine
scour hole dimensions under multiple pipes. Model tests were conducted in
a two-dimensional wave-current flurne facility in which pipes were exposed to
unidirectional flow and unidirectional flow with oscillatory motion. The model
testing investigated pipes in contact with a sand bed and the effect of pipe
spacing on scour. Scour hole profiles were measured and plotted to show the
scour hole shape under multiple pipe systems. For two pipe systems, spacing
between pipes of 1/2 pipe diameter resulted in less scour depth than full diameter
spacing. Unidirectional flow with oscillatory motion resulted in less scour than
unidirectional flow. --...... ( -'
T710' Accession For
dOV NTIS GRA&I
, . "

iv
ACKNOWLEDGMENTS
The author is deeply indebted to Dr. J. L. Machemehl for his positive
encouragement and support throughout the duration of this study. Also, a note
of thanks to Dr. R. E. Randall for his help and advice during the model testing
and preparation of this report. A note of thanks is due to the U. S. Navy
Civil Engineer Corps and Naval Facilities Engineering Command for providing
the author the opportunity to pursue post graduate studies. A special note of
thanks to Captain D. R. Wells, his most valuable support made it possible for the
author to become a part of the Navys' Ocean Facilities Program. And finally, to
my wife Melinda, who stood by me throughout endless toil. Without her love,
patience and understanding, this would not have been possible.
TABLE OF CONTENTS
CHAPTER Page
I INTRODUCTION ................... 1
Purpose. .. ....... ....... ...... 1Problem. .. ...... ....... ....... 2
II LITERATURE REVIEW. ... ....... ....... 5
Definition of Scour. ... ........ ...... 5Incipient Motion. ... ....... ........ 8Scour Depth and Profile .. .... ....... .. 17Experimental Results .. ..... .......... 19
III PIPELINE SCOUR .. .. ........ ......... 25
Types of Pipeline Scour. .. ........ ..... 25
Contributing Factors. .... ....... .... 28Mechanics of Scour .. ..... ....... ... 29Scale Effects. .. ........ ....... .. 33
IV COMPUTER PROGRAM. .. ..... .......... 34
Program Development .... ....... .... 34
Program Flexibility .. .... ....... .... 37Execution. ... ....... ....... ... 39
V EXPERIMENTAL APPARATUS AND EQUIPMENT . .. 42
VI EXPERIMENTAL PROCEDURES .. .. ...... ... 48
11II ANALYSIS OF RESULTS. .. ..... .......... 56
Presentation of Data. .... ........ ... 56Data Verification .. ..... ....... ..... 60

vi
TABLE OF CONTENTS (Continued)
CHAPTER Page
Pipe Spacing Relationship. .. ....... .... 63Scour Rate ... ....... ........ .. 75
VIII SUMMARY OF CONCLUSIONSAND RECOMMENDATIONS. .. ........ ..... 78
REFERENCES .. .. ....... ....... .... 81
APPENDICES .. ... ....... ........ .. 83
Appendix I - SCOUR.FOR PROGRAM CODE . .. 84Appendix II - TEST PROFILES. .. ..... ... 86Appendix III - NOTATION .. .... ....... 159
VITA. .. ...... ........ .......... 161

Vii
LIST OF TABLES
Table Page
I. Test Numbers and Test Conditions .. ... ....... .. 50
II. 'Maximum Scour Depth. .. ...... ....... ... 57
III. Relative Scour Depth .. .. ........ ......... 58

viii
LIST OF FIGURES
Figure Page
1. Comparison between fixed or simplysupported beam and pipeline scour ........ ............. 4
2. Shields diagram (from Simons and Sentiirk 1977) ... ........ 11
3. Critical water velocities for quartz sedimentas a function of mean grain size .... ................ ... 16
4. Influence of pipe Froude Number (U1/\/gD) on scour.(Ibrahim and Nalluri 1986) .... ... ................. 22
5. Influence of sediment Froude Number (U/V9-gd.) on scour.(Ibrahim and Nalluri 1986) .... ... ................. 22
6. Influence of wave Ursell Number (HL 2 /y 3 ) on scour.(Ibrahim and Nalluri 1986) ... ..................... 23
7. Influence of wave steepness (H/IgT) on scour.
(Ibrahim and Nalluri 1986) .... .... ..... ..... 23
8. Types of pipeline scour (from Leeuwestein 1984) ............. 27
9. Initiation of scour (from Mao 1986) .... .............. ... 31
10. Definition sketch of scour under a pipe ................ ... 35
11. Scour hole profile, from Mao (1986) .... .............. ... 35
12. SCOUR.FOR flow chart ........ ................. ... 38
13. Graphic representation of SCOUR.FOR output ........... ... 41
14. Test facility ....... ......................... ... 43
15. Schematic layout of test facility .... ................ ... 44
16. Schematic layout of test section .... ................ ... 45
17. Sieve analysis ....... ........................ . 49
18. Velocity profiles ....... ....................... ... 53
19. Influence of pipe Froude Number (U//-D) on scour ......... 61
20. Influence of sediment Froude Number (U/V' ) on scour. . 61
21. Influence of wave Ursell Number (HL2 /y 3 ) on scour .......... 62

ix
LIST OF FIGURES (Continued)
Figure Page
22. Influence of wave steepness (H/gT2 ) on scour ............. ... 62
23. Single vs 2-pipe system; current only (U = 0.37rn/sec) . . . 65
24. Single vs 2-Pipe system; current and wave.(U = 0.37 m/sec, L = 1.0 m, H = 6.0 cm., T = 1.2 sec) ..... .... 66
25. Single vs 3 -pipe system; current only (U = 0.37m/sec) . . . 67
26. Single vs 3-pipe system; current and wave.(U = 0.37 m/sec, L = 1.0 m, H = 6.0 cm, T = 1.2 sec) ..... 68
27. Single vs 2-pipe system; current only (UT = 0.26m/sec) ......... 70
28. Single vs 2 -pipe system; current and wave.(U = 0.26 m/sec, L = 1.0 m, H = 6.0 cm, T = 1.2 sec) ..... 71
29. Single vs 3-pipe system; current only (U = 0.26m/sec) ......... 72
30. Single vs 3-pipe system; current and wave.(U = 0.26 m/sec, L = 1.0 m, H = 6.0 cm, T = 1.2 see) ..... 73
31. Test number 64: scour profile development.(U = 0.26 m/sec, L = 1.0 m, H = 6.0 cm, T = 1.2 see) 7.....76
32. Test number 70: scour profile development.(U = 0.26 rn/sec, L = 1.0 m, H = 6.0 cm, T = 1.2 see) .. ..... 77

CHAPTER I
INTRODUCTION
Purpose
The most economical method of transporting oil onshore from offshore
production facilities is through submarine pipelines. Submarine pipelines are also
used for the disposal of industrial and sanitary wastes. The stability of these
subsea pipelines is threatened by loss of bed support resulting from scour. This
thesis reviews pipeline scour and presents results of model testing on single and
multiple pipes in contact with a sand bed.
Few theoretical models exist which accurately describe or predict scour depth
beneath pipelines. The most widely accepted models predicting scour depth are
based on experimental research.
The objectives of this research are
(1) To determine the relationship between pipe geometry and scour depth,
and
(2) To examine scour hole dimensions under multiple pipes subject to
undirectional flow and unidirectional flow with oscillatory motion.
The citations on the following pages follow the style of the Journal ofWaterway, Port, Coastal and Ocean Engineering Division, ASCE.

2
Pipe spacing and scour depth were studied to determine the difference in scour
depth between a single pipe and multiple pipes subjected to similar conditions.
Single r.d multiple pipe systems were exposed to both currents and currents with
wvve action (oscillatory motion).
Problem
Pipelines are being placed in deeper waters over greater distances. Pipelines
on the ocean floor cause disruptions of the flow pattern and changes in the local
fluid velocity which create bed scour. Damage usually occurs during severe storms,
when large ocean waves increase bottom currents. Because of larger horizontal
drag and inertial forces as the storm intensifies, scour may uncover and expose a
buried pipeline. The exposed pipe may be damaged since pipelines generally are
not designed for conditions where spanning and vibrations due to vortex shedding
occur (Herbich et al. 1984).
In shallow depths, pipelines are usually buried, placed in trenches or undergo
self burial (Hulsbergen 1984). A severe storm generates combined current and
wave action on the seabed, producing higher than normal fluid velocities. The
combined current and wave action effect on the seabed results in additional
sediment transport, exposing buried pipelines. Once exposed, the pipe lays on
the surface of the seabed, and is further subjected to scouring currents.

3
Local and area scour threaten pipeline stability which may damage the pipe.
Scour holes endanger stability when large free spans create unacceptable stresses
due to static deformations, (Bruschi et al. 1986). During the development of the
scour hole under the pipeline, the stresses inside the wall of the pipe increase due
to the sagging of the pipe. The suspended part of the pipe deflects like a uniformly
loaded beam with fixed or simply supported ends, Fig. 1. The pipe will rupture
if the static bending stresses exceed the ultimate strength of the pipe.
Flow around the pipe creates a series of complex vortices which cause the
suspended section of the pipe to vibrate. This results in the development of a
deeper scour hole. Pipe vibrations cause pipe failure due to fatique. Scour is a
direct consequence of vortex shedding. As the scour hole deepens, the frequency of
vibrations may increase until the pipe ruptures. Vibrations may be caused by the
external fluid velocity on the pipe or the internal fluid transport, or a combination
of the two. A ruptured pipeline will discharge its product (such as oil) into the
environment. High repair costs, income loss from down time and shorter lifetime
are experienced.

a.-O4
-- 4f4
1 C 0
1:3: :03: IM:: :1:1:1 0 0:aIMu :13 :,:.S a uM:s~:()~
:::::m* Md :0:6~mm;:: -a d~~a a ::: ::::: o :1:: !5 :1:1:1 1: E
*mnIM: 7 eM: :1:5:1:1: *::$ 0:1 1. 5s::g m so ::i:::1:1:s g3 :1:1:1 -1:: A:61:1:1 :s: M
:111 .:1: 1: a:1::18:1:1: 0 :l: Sa 3
HIM: IM0MI :g1a1
1:1:1:8 0 HIM: 5 ::: 2~~
:13 0 :11W: :1:1:1 ~ ~ :1.1:: :'

5
CHAPTER II
LITERATURE REVIEW
Definition of Scour
The mechanism of scour is characterized by a fine balance between the
local flow condition, sediment transportation and sediment deposition. Based
on research conducted by Fredsoe et al. (1988), vortex shedding in the pipeline
wake is the the major cause of scour. Turbulence diffused from the leeward side of
the pipe wall allows sediment to remain in suspension, allowing for easy transport
by currents. Scour will occur if the rate of sediment transport upstream of the
pipe is less than the transport downstream.
Scour depth is a function of sediment characteristics, pipe geometry, flow
and wave properties. Among all the variables involved in the phenomenon of
equilibrium scour depth, scour depth (Sd) is the dependent variable and can be
expressed as a function of the following independent variables:
Mean fluid velocity (6),
Critical velocity of sediment motion (V),
Water depth (y),
Pipeline diameter (D),
Wave height (H),

6
Wave length (L),
Wave period (T),
Dynamic viscosity of water (A),
Fluid density (p),
Effective sediment size (d.),
Sediment density (p,),
Relative density of sediment in water (A = (P&P)), and
Gravitational acceleration (g).
Note that kinematic viscosity (v = I /p) replaces dynamic viscosity over
density of water.
Ibrahim and Nalluri (1986) developed the following dimensionless relation-
ships between variables:
Sd/D = f[ (UID/v), (Uy/v), (U/V/g), (H/gT 2 ), (UT/D), (1)
(HL 2 /V 3 ), (Ulv/), (HID), (LID), (01V.), (CT/UV )]
The most significant relationships from Eq. 1 which influence scour are the
following dimensionless parameters:

7
(UD/v) and (Uy/v) are pipe and flow Reynolds Numbers, measuring
turbulence,
(H/gT2 ) is wave steepness, which is the disturbing capability of the wave,
(HL2 /y) is the wave Ursell Number which defines the relative magni-
tude of wave motion and water depth.
(/7/hg ), (U/fJg) and (U/v/gA ) are the pipe, flow, and sediment
Froude Numbers, the prime force behind the movement of the seabed,
and
(UT/D) is the Keulegan-Carpenter number, describing the dominant
type of flow, (i.e., current or wave).
8
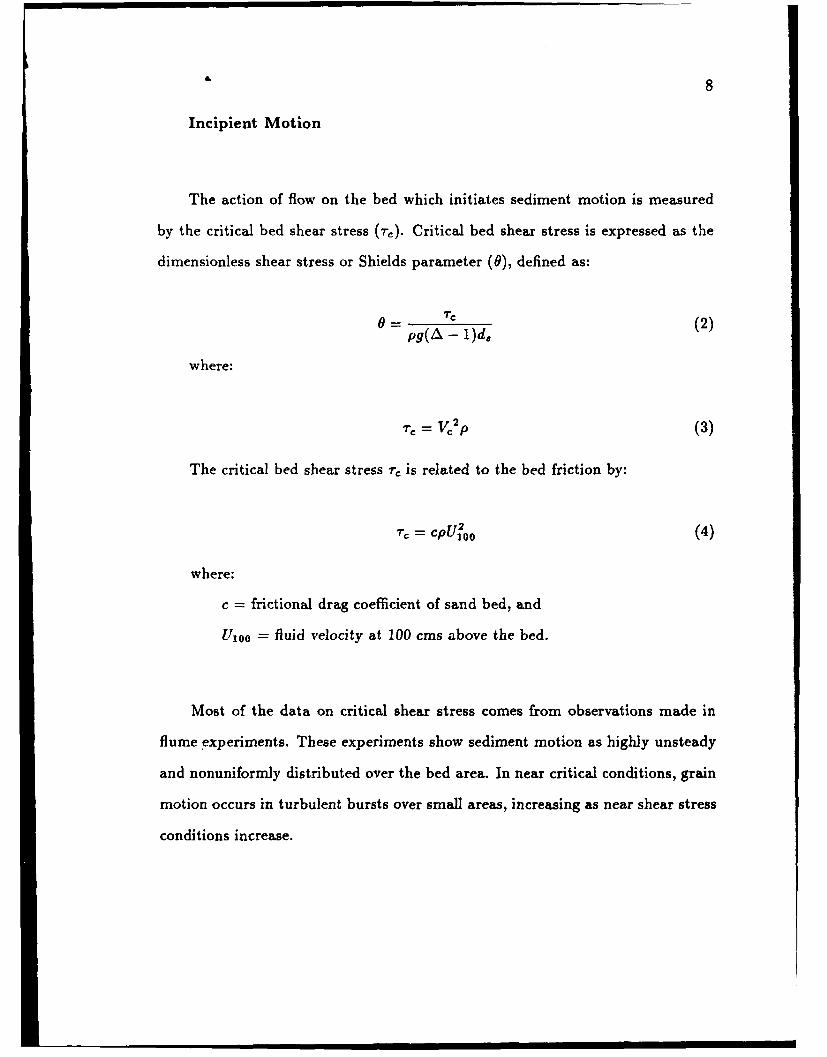
Incipient Motion
The action of flow on the bed which initiates sediment motion is measured
by the critical bed shear stress (r,). Critical bed shear stress is expressed as the
dimensionless shear stress or Shields parameter (0), defined as:
pg(A - 1)d (2)
where:
1r = VP (3)
The critical bed shear stress r, is related to the bed friction by:
- cpU oo (4)
where:
c = frictional drag coefficient of sand bed, and
U100 = fluid velocity at 100 cms above the bed.
Most of the data on critical shear stress comes from observations made in
flume experiments. These experiments show sediment motion as highly unsteady
and nonuniformly distributed over the bed area. In near critical conditions, grain
motion occurs in turbulent bursts over small areas, increasing as near shear stress
conditions increase.

9
When shear stress is near the critical value, gusts of sediment motion become
random in space and time. This was observed by Shields (1936), who described the
initiation of motion as statistical in nature. E'instein (1942) was first to develop
transport relations based on probabilistic concepts. Due to the statistical nature
of incipient motion, it is difficult to define a true condition for initiation of motion.
Critical shear stress data is based on arbitrary definitions of critical condi-
tions. Vanoni (1966) refers to the following three intensities of motion near the
critical or threshold condition:
(1) Weak movement- few or several of the smallest sand particles are in
motion in isolated spots in suffidently small quantities such that those
moving in one square centimeter of the bed can be counted.
(2) Medium movement- grains of mean diameter are in motion in numbers
too large to be counted. The movement is no longer local in character.
It is not sufficiently strong to affect the bed configuration and does not
result in appreciable sediment discharge.
(3) General movement- sand grains up to and including the largest are in
motion and movement is occurring in all parts of the bed at all times.

10
The definition of critical conditions varies widely among scientists and engi-
neers. This explains, in part, the variation in research results on sediment motion.
However, the weak movement described above agrees with most studies. It also
agrees with Shields critical condition (Shields 1936).
As the velocity of fluid flow over a bed of sediments is increased, the fluid
exerts a force or stress on the particles. Eventually this force becomes sufficient
for particle movement and results in transporting sediment from the bed. This
is known as the threshold of sediment movement, or the critical stage of erosion.
The fluid velocity which results in threshold movement is the critical velocity of
sediment movement, 14.
Threshold curves form the basis for predicting initial sediment motion.
Curves based on a combination of sediment grain diameter, density, velocity, stress
or friction are entered for values of sediment movement.
Shields diagram, shown in Fig. 2, is a relationship between the boundary
Reynolds number, (R.) and Shields parameter, (0). The Shields parameter 0 is
defined by Eq. 2.
The boundary Reynolds number is defined as:
R = d (5)V
where:

c~11
00 009-~ j J giw. moq waugsuu

12
ds= effective sediment diameter,
v = kinematic viscosity of water, and
U.= turbulent shear velocity.
Turbulent shear velocity U. is defined as:
. P- (6)
where:
= bed shear stress, and
p = density of water.
Bed shear stress r is defined as:
= Fd (7)
C1 d2,
where:
d,= effective sediment size,
C, = form coefficient defining the effective surface area of the particle,
and
Fd = drag force on the particle.

13
The effective surface is defined as the projection of the particle on a plane
perpendicular to the direction of fluid motion.
Drag force on a particle is defined as:
FD =1 (8)
where:
CD = drag coefficient,
A = projected area of particle on a plane perpendicular to the fluid flow
direction,
Ud = local velocity at distance d above bed, and
p = density of water.
Shields determined this relationship by measuring bed load transport for
values of 0. Values for 0 were measured at greater than twice the critical value. He
then extrapolated 8 to the point of the vanishing bed. This procedure was used to
avoid random orientation of grains and variations in flow conditions which result
in grain movement when 0 is smaller, Simons and $ent-trk (1977).
Shields diagram expresses the threshold of sedirhent movement as a function
of the following:
Sediment density (p.),
Effective grain size (d.),

14"
Bed shear stress (r,),
Critical bed shear stress (r,,),
Kinematic fluid viscosity (u), and
Fluid density (p).
The determination of incipient motion is important in the study of pipeline
scour. Incipient motion of sediment leads to scour. Shields published his diagram
for critical shear stress utilizing boundary layer theory and fluid mechanics.
Considerable dissatisfaction with this shear stress criterion is presented in the
literature, Liu (1958), Vanoni et al. (1966) and Yang (1973).
Yang (1973) summarizes this dissatisfaction with the following:
(1) By assuming the existence of a universal velocity distribution law,
shear velocity or shear stress is a measure of the intensity of turbulent
fluctuations. Knowledge of turbulence is limited mainly to model tests.
(2) Shields derived his criterion on incipient motion by using the concept
of laminar sublayer. According to that theory, the laminar sublayer
should not have any effect on the velocity distribution when the shear
Reynolds number is greater than 70. Shields diagram indicates that the
dimensionless critical shear stress still varies with shear velocity Reynolds
number greater than 70.

15
(3) Shields extends his curve to a straight line when the shear velocity
Reynolds number is less than 3. This means that when the sediment
particle is very small, the critical tractive force is independent of the
sediment size. It has been shown that the critical tractive force is
proportional to the sediment size.
(4) The critical shear stress cannot be determined directly from Shields
diagram. It must be determined through trial and error.
(5) SiLields simplifies the problem by neglecting the lift force and considers
tangential force. Lift force must be considered for high shear velocity
Reynoids number.
(6) Sediment transport cannot be uniquely determined by shear stress. Using
critical shear stress as the criterion for incipient motion for the study of
sediment transport is questionable.
Based on the preceding, it is doubtful that the Shields diagram is the best
criterion for incipient motion.
Fig. 3 shows curves on critical velocity plotted against mean sediment size
for quartz sediment in water (p, = 2.65g/crm3 ) as presented by Vanoni (1966).
The curves shown are for the upper and lower limit of the mean critical velocity

16
00-
or."
02 -
0S
IWO
00
-04
100
00
0
(o.s/wuo) A110oj.A 1,100M

17
taken from several sources. The curves are for depths of at least one meter. The
relationship was developed by fitting the curves with observed data. The bottom
velocities are obtained by extrapolating velocity measurements to the plane of the
bed.
Scour Depth and Profile
Kjeldsen (1973) proposed the following formula for scour depth:
Sd = 0.972(U 2 /g) 0 2 D ° ' 8 (9)
where:
Sd = maximum equilibrium scour depth,
U = mean local fluid velocity,
g = gravity, and
D = pipe diameter.
Bijker and Leeuwestein (1983) proposed the following modification to Kjeld-
sen's equation, which incorporates mean grain size:
Sd = 0.929(U 2 /2g)° . 6 D o 78 (ds 0)- 0 .0 4 (10)
where: dso = mean particle diameter.
18
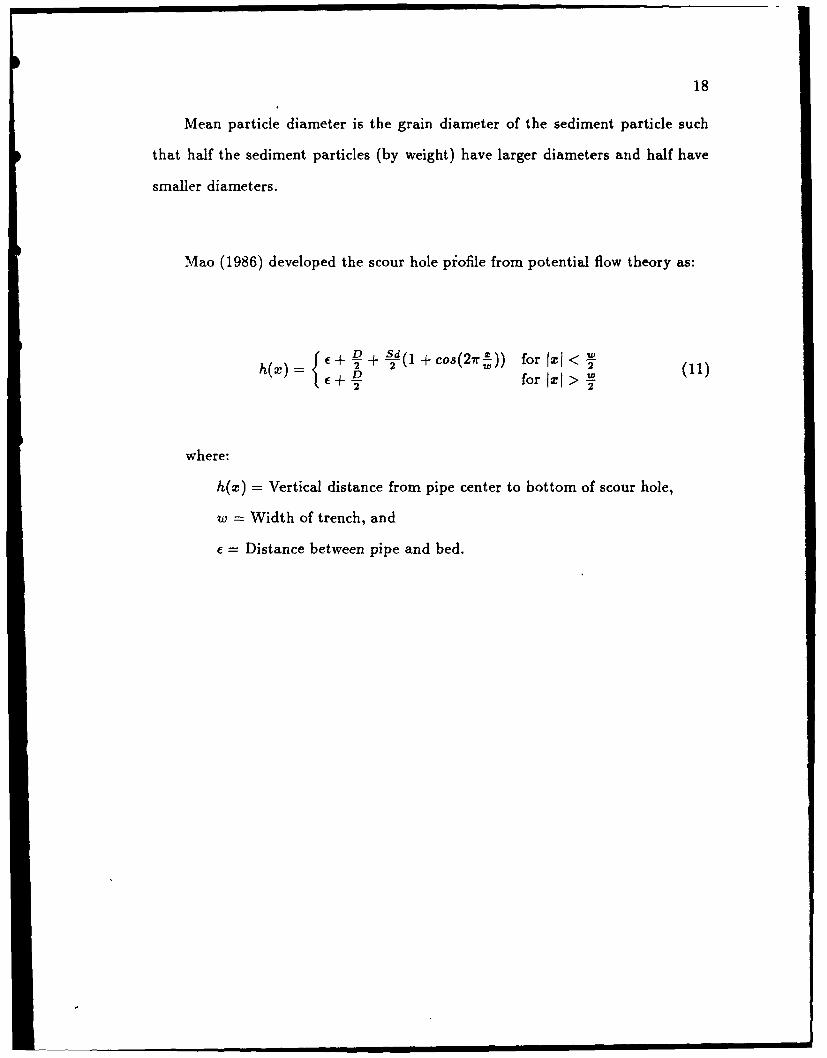
Mean particle diameter is the grain diameter of the sediment particle such
that half the sediment particles (by weight) have larger diameters and half have
smaller diameters.
Mao (1986) developed the scour hole piofile from potential flow theory as:
E+: d( +cos(27r ) o Ixl < T(1h~) + +yl ) forfxl<
h(x)= fo 2_ (11)IE+ 2 for IxI >2
where:
h(x) = Vertical distance from pipe center to bottom of scour hole,
w = Width of trench, and
= Distance between pipe and bed.

19
Experimental Results
The most recent significant model test on pipe scour is based on the inter-
action between a fixed pipeline and an erodible bed. Mao (1986) studied the
influence of a fixed pipe on an erodible sand bed under various wave and current
conditions. The experimental set-up was typical for model tests on pipes. Tests
were run on both a 5 cm pipe and a 10 cm pipe placed on a quartz sand bed.
The model test resulted in the following conclusions:
(1) The scour process consists of a jet period and a wake period,
(2) The flow stagnation point is on the upper part of the pipe,
(3) The scour rate is very high at an early stage, later on it decreases,
(4) In equilibrium, bed velocities are similar to mean current velocity,
(5) The bigger the initial gap, the shallower the scour depth,
(6) The scour depth is a weak function of Shields parameter, 0,

20
(7) The final scour depth Sd is usually less than the diameter of the pipe,
and
(8) The final scour depth is influenced by the wake behind the pipe.
Fredsoe et al. (1988) studied the interaction between a vibrating pipe and
erodible bed. The experimental set-up was similar to the preceding model test,
with the following difference: a spring supported rigid cylinder was used as the
model pipe, which was then vibrated.
The influence of pipe vibration on scour and the influence of scour on pipe
vibration results in the following conclusions:
(1) Pipe vibration induces additional erosion, which gives rise to relatively
larger scour depths and scour widths. This effect was found to be most
pronounced for smaller gaps between the pipe and the bed.
(2) Vibrations are dominated by vortex shedding due to this extra erosion.
Additional erosion occurs even if the pipe is placed very close to the
original undisturbed bed.
Ibrahim and Nalluri (1986) studied pipeline scour due to currents and currents
with waves. Tests were performed on three different grades of bed sand of sizes

21
d, = 0.425 mm, 0.80 mm, and 1.50 mm. Pipe sizes were 2.50 cm, 5.00 cm, and
7.50 cm. The pipes were fully exposed to flow, i.e. resting on a sand bed. They
also studied pipelines that were one-half and three-quarters buried. The action
between pipeline, seabed and flow due to the combined wave and current was more
intense compared to that due to unidirectional current.
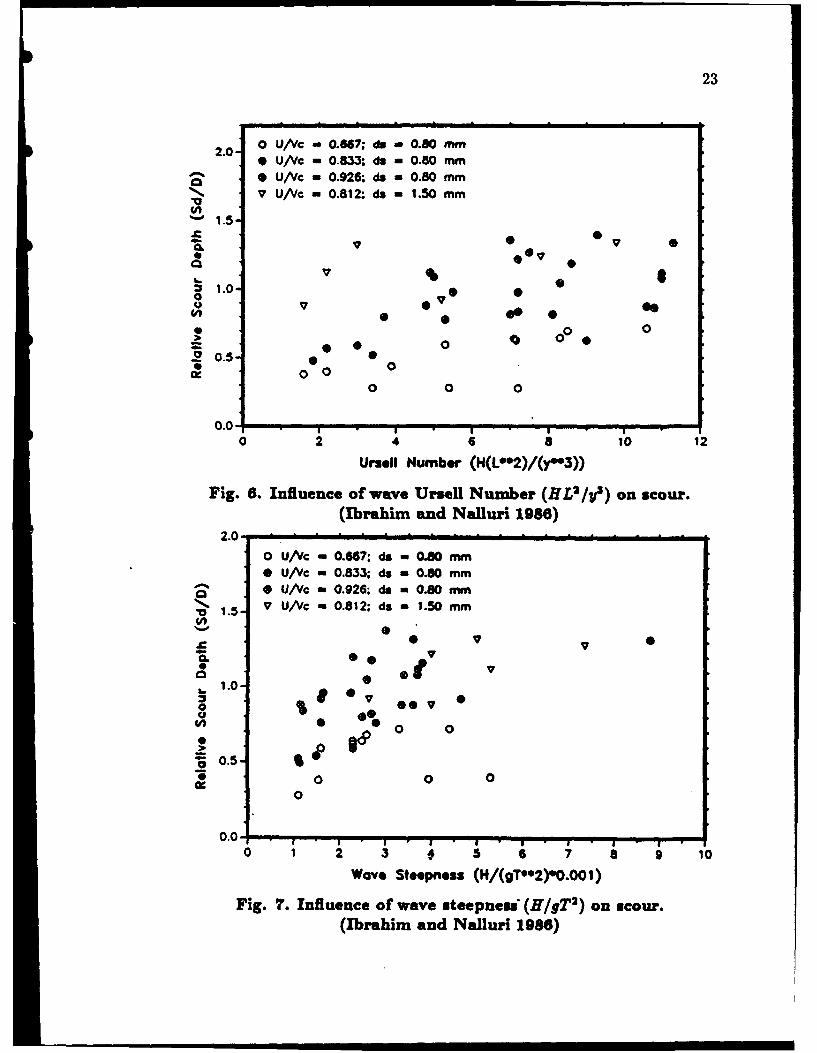
Ibrahim and Nalluri (1986) developed dimensionless plots between the relative
scour depth, Sd/D and the following dimensionless parameters:
(1) (Ul/Vg7f) - pipe Froude Number, (Nfp), Fig. 4,
(2) (U/v/g-,) - sediment Froude Number, (N)), Fig. 5,
(3) (HL 2/y 3 ) - wave Ursell Number, Fig. 6, and
(4) (H/gT2) - wave steepness, Fig. 7.
Figs. 4-7 attempt to identify the influence of several groupings in Eq. 1 on
relative scour depth, Sd/D. These plots become useful in comparing the data
obtained in this research to that of Ibrahim and Nalluri (1986).

22
1.4 i
0 Nallurd & Ibrahim Dota
1.2 0a 0
N01.0-
. O000.8 -0
o" I0 0 0o 0.6 00
qJ0 0
10.4 8_ o4. 0 0
* 00.2
0.0 0.1 0.2 0.3 0.4 0.5 0.6 0.7 0.8 0.9 1.0
Pipe Froude Number (Nfp)
Fig. 4. Influence of pipe F-oude Number (1/V/') on scour.(Ibrahim and Nalluri 1986)
2.0
a
1.5
00
V * ..
0 0
0.1'- 00
.O 0 U/Vc - 0.667: do a 0.80 mm
al O 0 U/Vc - 0.833; ds , 0.80 mm* U/Vc - 0.926; do - 0.80 mmV U/Vc - 0.812; do a 1.50 mm
0 .0 • , ' - , - . - ,0 2 4 6 8 10 12 14 16 18 20
Sediment Froude Number (Ns)
Fig. 5. Influence of sediment Pr'oude Number (OVlrv .) on scour.(Ibrahim and Nalluri 1986)
23
2.0 0 U/Vc - 0."7; de 0.80 MM0 U/Vc - 0.833; ds - 0.80 m
0 U/Vy - 0.926; ds w 0.80 mm7 U/Vc - 0.812: ds - 1.50 mm
*"1.5.
Z 0 0 0
:s0. 7 0
0: 00 0 020.5. •• 0
0.0
S0.0 ~ I I * , " 'I
0 2 4 6 8 10 12
Urs.li Number ((L*02)/(y"3))
Fig. 6. Influence of wave Ursell Number (HL2 /y) on scour.(Ibrahim and Nalluri 1986)
2.0.o U/Vc - 0.667; do , 0.80 mm* U/vc - 0.833; ds - 0.80 mm0 U/VC - 0.926; ds - 0.80 mm
V1.5 P U/Vc - 0.812; ds - 1.50 mm
V.
00o o
.5 -
0 0 00
0 .0 , I " I . I I . -I . I . I . I " I .
0 1 2 3 # . 6 7 a 9 10Wave Steepness (H/(gTO*2)O.O01)
Fig. 7. Influence of wave steepness (H/gT2 ) on scour.(Ibrahim and Na~luri 1986)

24
Despite the scatter of data points in Fig. 4 and 5, a trend reveals a
relationship between Sd/D and flow velocity. The flow velocity is part of the
Froude Number, which represents an inertia-gravity force ratio. The relative
scour depth Sd/D increases with increasing Froude Number. This is expected -
larger fluid velocity creates deeper scour.
Fig. 6 is the influence of the wave Ursell Number (HL2 /y) on scour. The
Ursell Number represents relative magnitude between HIL and y/L, where:
H = wave height,
L = wave length, and
y water depth.
The region where U,. < 1 corresponds to deeper water and a region where Stokes
wave theory is applicable. This group tends to reveal a non-interdependency of
data. According to Ibrahim and Nalluri (1986), the wave Ursell Number defines
the magnitude of energy generated by the wave and transmitted to the bed. The
data in Fig. 6 fall in a region where U,. > 1, signifying shallow water.
Fig. 7, the wave steepness, describes the disturbing capability of the wave
on the sediment. For shallow depths, the data indicates an increase in Sd/D for
steeper waves.

25
CHAPTER III
PIPELINE SCOUR
Types of Pipeline Scour
Two categories of scour are global and local. Global scour is an area erosion
of the bed in the vicinity of the disturbance. Generally, it is an elliptical shape
with the major axis in the direction of the dominant flow. Local scour develops
at the seabed immediately adjacent to the pipeline. Local pipeline scour results
in a scour hole below the pipeline (Dahlberg 1983).
When examining local scour, the two-dimensional case is considered. The
primary cross-sectional area is a transverse cut through the pipe and seabed.
Span analysis examines the cross-sectional area along the pipe axial length. Flow
parameters which influence scour are steady flow (current), oscillatory motion
(wave), or a combination of current with superimposed wave velocity. The net
effect is a pulsating mass transfer in one direction. The combined oscillatory
motion and current velocities yield the mean flow in one direction. The scour
due to a steady current is greater than the combined wave-current affect.
26
Leeuwestein (1984) describes three types of local scour based on relative
position to the pipe as tunnel, luff and lee erosion, Fig. 8. Lee erosion occurs while
the sediment remains in suspension in the wake. During lee erosion the sediments
are transported up by jet flow into the wake and then carried away by currents.
Total scour depth is larger for current-induced scour than for wave-induced scour.
Bijker and Leeuwestein (1983) found that wave induced scour is about 30% the
depth of current-induced scour. The reason for smaller wave-induced scour is
that the orbital nature of the flow results in some sediment remaining in the scour
hole.
Lee erosion extends further downstream, resulting in a wide trench around
the pipe, Fig. 8. Luff erosion generally appears just upstream of pipelines in
the absence of tunnel erosion, usually near partially buried pipelines. Luff erosion
is not of major concern because it generally does not result in free spans. The
primary influence on scour beneath a pipe is lee erosion. Tunnel erosion occurs
in the early stages of the scour process, then lee erosion takes over during the
growth phase of the scour hole. Tunnel erosion is the scour which occurs directly
beneath the pipe. Tunnel erosion leads to lee erosion which results in free spans.

27
l'4IID
'.0 1-
10 U
' ' m I I III I I I

28
Contributing Factors
Maximum equilibrium scour depth is a function of several factors. The major
cause of erosion is the vortex shedding in the wake. Vortex shedding is turbulence
diffused from the leeward side of the pipe wall, allowing sediment to remain in
suspension. Sediment is transported up by jet flow into the wake of the vortex
and then carried off by currents. Vortex shedding drives lee erosion.
The Keulegan-Carpenter number (KC) is the parameter which describes the
type of flow, being either steady flow (current), oscillatory motion (wave), or a
combination of the two. The KC number is a non-dimensional measure of the
flow, described earlier as:
KC = UT/D (12)
where:
U = local fluid velocity near pipe,
T = wave period, and
D = pipe diameter.
A low KC number (i.e. < 50) means that oscillatory flow dominates. As KC
increases, current flow dominates.

29
According to Fredsoe et aI.(1988), KC represents the effect of the lee-wake on
the scour and constitutes the most important parameter which governs equilibrium
scour.
Mechanics of Scour
Sediment transport conditions do not necessarily exist upstream of the pipe.
The presence of the pipe is responsible for generating enhanced flow conditions
that trigger the scouring process. A pipeline near an erodible bed is subjected to
constantly changing scour conditions. Pipe movement above the scour hole, from
sag and vortex shedding induced vibrations, also contributes to the variability of
flow regimes.
Sediment mechanics, incipient motion and pipeline/soil interaction are pri-
mary factors that influence scour. Sediment motion is determined by the bed
shear stress, which is defined as the tangential force exerted along the seabed by
the passing flow of water. Scour is effected by the leeward wake created by vortex
shedding of the pipe. Hydrodynamic forces on the pipeline may influence the
scour beneath a pipeline, but they are not the principle driving force. Lift forces
or pipe vibrations on the pipeline raise the pipe sufficiently for jet flow through a
gap between the pipe and bed. This is known as the nucleation phase or the jet
period. During this phase a small hole is created under the pipe.

30
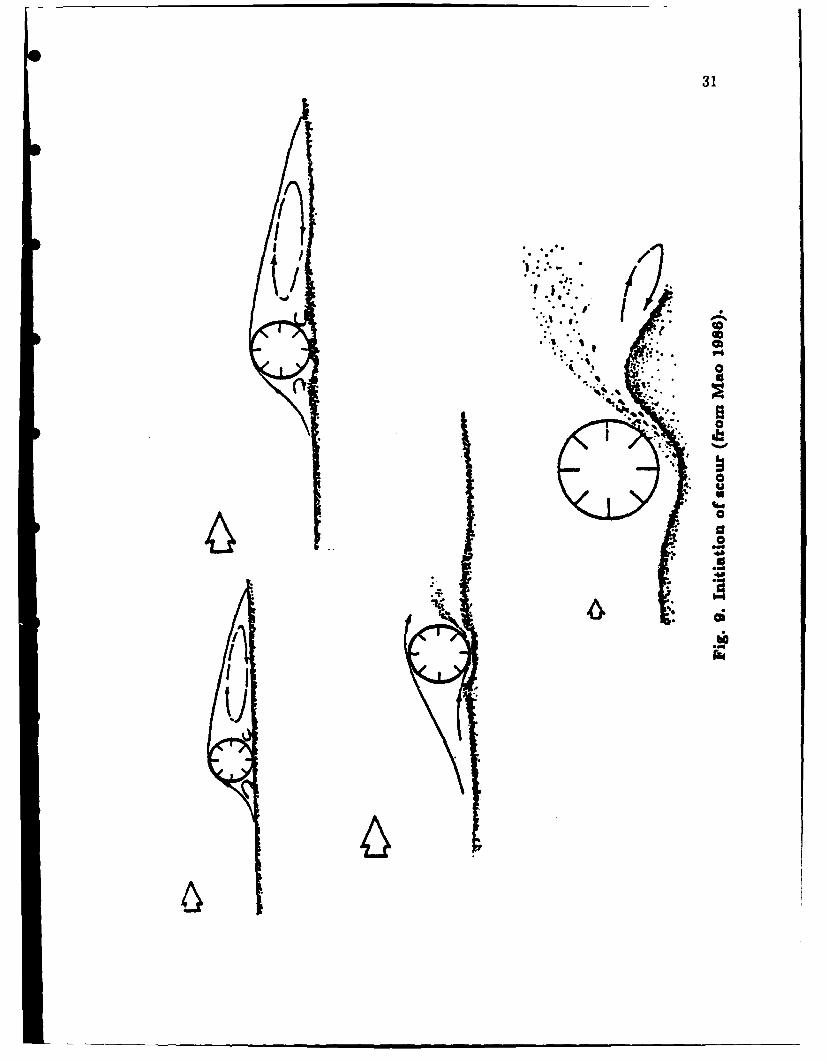
Incipient motion occurs when the jet velocity between the pipe and bed
exceeds the critical velocity needed to begin sediment movement, and tunnel
erosion is initiated, Fig. 9. Vortex shedding creates a turbulent wake leeward
of the pipe, which keeps the sediment suspended for sufficient time for current to
carry the sediment downstream. The growth phase or wake period of the scour
hole occurs while the vortex shedding creates a turbulent wake leeward of the
pipe.
The sediment in suspension is balanced against gravitational forces that tend
to pull it back into the bed. Lee erosion takes place while the sediment is carried
off in the wake of vortex shedding. Vortex shedding may be further enhanced by
pipe vibrations.
Equilibrium scour depth is reached when the velocity near the bed surface
is about equal to the current velocity. Sediment removal from the scour hole
continues as long as the critical velocity of sediment movement exists. Critical
velocity dominates as long as the the current velocity is greater than the threshold
value of sediment movement. The growing scour hole alters the flow until a new
dynamic equilibrium is reached between the erosion and deposition. The increase
in the scour hole size causes a decrease in the jet-like effect until it returns to
normal mean fluid velocity. This happens when the depth of the scour hole is
approximately one pipe diameter deep. At this point the scour process ceases.
' 31
* ." , I ,r *
b I ... -%
:. • *i. .
"S"* "-- - .
*
i.' ~ o0
0
4.6U
mmm m mm m' i

32
The presence of the pipeline causes vortex shedding Vortex shedding
complicates evaluation of boundary conditions for scour initiation. Boundary
conditions are determined by the type of soil. Boundary layer parameters are
the bed shear stress (-r) and bed friction coefficient (c), both parameters of the
sediment. Shear stress (T) due to current flow or oscillatory motion is determined
as a function of bed roughness and effective grain size. Critical shear stress (r,)
which contributes to initial movement, is a function of the immersed weight of a
0 grair of sediment, mean grain size and critical velocity.
Time scale effect on the formulation of scour rate is related to the dominant
type of flow through the Shields parameter (0). The scour rate is high at first, then
it decreases with time. The larger the Shields parameter (6), the higher the scour
rate in the early stages. The presence of superimposed waves greatly increases the
rate at which sediment is transported, which accelerates the formation rate of the
scour hole. However, the equilibrium scour depth is less in the combination flow
condition than in steady flow.
The shape of the scour hole will vary in symmetry, and is also a function of
the dominating type of flow. This is best described by the Keulegan-Carpenter
(KC) number. The width of the hole is a function of the sediment characteristics,
and the symmetry is a function of the type of flow. In a unidirectional flow, the
leeward side of the pipe will have less of a slope than the upstream side. In a
two-directional oscillatory flow, the profile is symmetrical. Both the symmetry
and dominating flow are closely related to the Keulegan-Carpenter (KC) number.

33
Scale Effects
One of the difficulties in conducting model tests is insuring that scale factors
are accurate. Scale effects are based on scaling laws for local scour and are related
to the similarity of sediment size, grain shape, and grain Froude number. The
limiting grain size for permissible reduction of sediment in a model is about 0.05
mm. Pipe sizes are a function of the test flume dimensions. Typical offshore oil
pipelines are one meter in diameter. In this case a model pipe of ten centimeters
represents a 1:10 scale.
Test conditions which govern the applicability of experiments are the
Reynolds (Re) number and Keulegan-Carpenter (KC) number. The R, num-
ber is a measure of the turbulence and the KC number describes the type of flow.
A high Re puts the flow in the turbulent range, representing typical field condi-
tions. A KC number greater than 50 describes a steady flow, whereas a lower
value takes into account the oscillatory flow contribution from the wave velocity.
For wave-current experiments the following R, and KC ranges are recommended:
(1) Reynolds number:= > 105
V
(2) Keulegan-Carpenter number:
UTKC = < 50
D

0&34
CHAPTER IV
COMPUTER PROGRAM
Program Development
The program SCOUR.FOR is a FORTRAN coded program which calculates
the maximum scour depth and scour profile based on equations defined earlier:
(1) Equilibrium scour depth, (see Fig. 10):
Sd = K°(U 2 /g) 0 .2 D"'
where: K, is a sediment factor taking into account effective sediment size
(d,) and density (ps,).
(2) Scour profile, Eq. 7, (see Fig. 11):
e(+)! + ed (1 + co(27r)) for IxI <€+5- for j>

35
UN
Fig. 10. Definition sketch of scour under a pipe.
) y.
Fig~*. 11 Scu oepoiefo a 18)

36
SCOUR.FOR inputs Stokes III wave theory as a subroutine, WAVE123.
Stokes V wave theory is the recommended guideline adopted by the American
Petroleum Institute (API) for use in offshore design problems. The theory has wide
applications in the coastal and offshore industry. For purposes of this program,
Stokes III will suffice.
The WAVE123 subroutine, modified for the SCOUR.FOR program, computes
the maximum wave velocity at a depth of interest near the pipe. The wave velocity
is combined with current, yielding the mean local fluid velocity (U) acting on the
pipe. The input wave height and period are for extreme events, resulting in the
highest bottom velocities. Extreme events are storm or hurricane conditions.
The program is governed by the following assumptions:
(1) The maximum wave velocity at the depth of interest is algebraically
summed with the current velocity, yielding mean fluid velocity acting on
the pipe.
(2) Although wave velocity is oscillatory, the net effect is a pulsating mass
transfer in one direction.
(3) A normal angle of attack on the pipe has the greatest effect on scour
depth, resulting in maximum scour depth.

37
(4) The computer program is based on a unidirectional flow from the
combined effect of current and wave velocities. The velocities are
algebraically added. The shape factor is determined by the width of
the scour hole in terms of pipe diameters.
(5) The program is designed for depths in the 100 meter range under extreme
storm conditions.
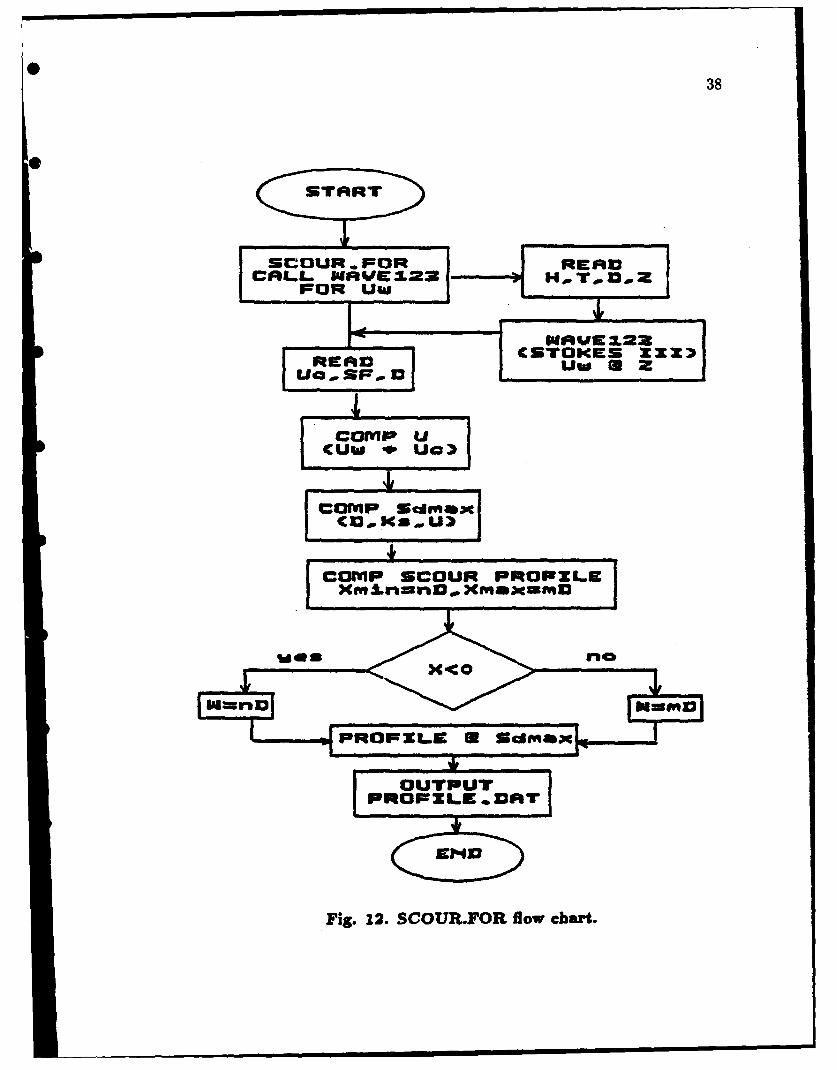
Program Flexibility
The SCOUR.FOR program flow chart, Fig. 12, is a visual representation
of the solution sequence. The flow chart depicts the flow of control, identifying
interrelationships and decision requirements of the program sequence. The flow
chart is adjustable to other computer languages and systems capable of executing
basic numerical computations.
The program accommodates any type of pipe Orientation to the bed. The
gap distance value f must be input if the pipe does not rest on the seabed. When
the pipe is in contact with the seabed, c = 0. The scour profile coordinate system
is measured from the center of the pipe if f > 0, otherwise the coordinate system
is adjusted to the seabed for E = 0.
38
START
SCOU. OUTREADCAL.LPNn OwZ2H, D T wWZ
Fig 1. COR.ORfl w art.

39
The effect of sediment characteristics is controlled by the sand factor (Sf)
*O and the sediment factor (K0). The sediment factor will influence the equilibrium
scour depth and is a function of the type of sediment. It is adjustable in the
program listing.
The inputed sand factor (Sf ) relates the pipe diameter to the scour hole width
(w), and is a function of Shields parameter (0). The symmetry of the scour hole
is controlled in the program list and is a function of the dominant type of flow,
being either oscillatory or unidirectional. The Keulegan-Carpenter (KC) number
governs the type of flow. The SCOUR.FOR FORTRAN program CODE list is
included in Appendix I.
Execution
SCOUR.FOR reads pipe diameter (D), sand factor (K.) and current velocity
(Uc), in metric units, from the input file MAIN.DAT. The program subroutine
WAVE123 input is wave height (H), period (T), water depth (d) and depth of
interest near the pipe (Z).
SCOUR.FOR program output creates an output file PROFILE.DAT, which
is easily plotted using any standard graphics package.

40
The program was designed on a Digital 8000 VAX/VMS mainframe com-
* puting system with FORTRAN compiler located at Texas A&M University. The
SCOUR.FOR and WAVE123 FORTRAN codes are loaded into the mainframe
and executed with the following commands:
(1) FOR SCOURWAVE123
(2) LINK SCOUR,WAVE123
(3) RUN SCOUR
The program is best demonstrated by varying the MAIN.DAT input data
(current velocity (Uc), pipe diameter (D) and sand factor (Sf)), while keeping the
WAVE123 data constant (except for depth of interest (y) when changing (D)), and
comparing the plotted results. The sample output, Fig. 13, was created from the
SCOUR.FOR output file, PROFILE.DAT, using the VAX/VMS graphics system
PICSURE package.

41
E0
00
C4C
0 00 U
E W
o 0 C.
IA 0>0B I: at
E E-
(WO 41e ino.

42
CHAPTER V
* EXPERIMENTAL APPARATUS AND EQUIPMENT
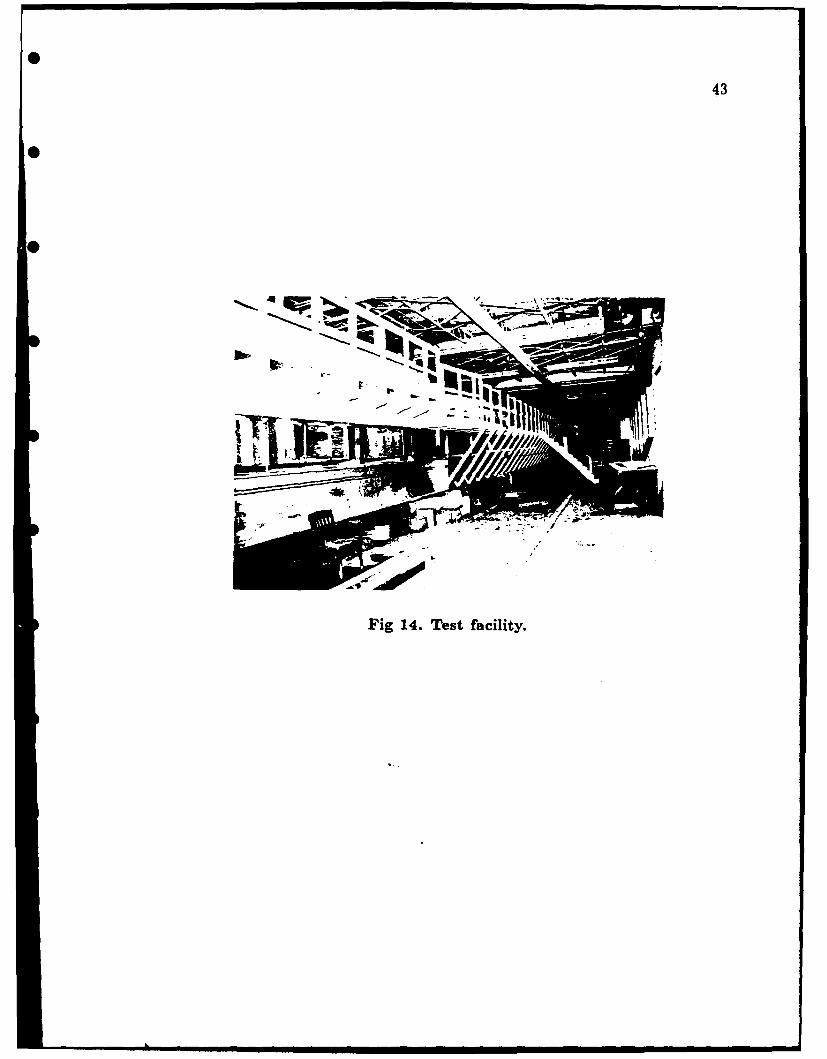
Model testing was conducted in a two-dimensional wave and flume facility as
shown in Fig. 14. The wave-flume is 45.72 m long, 0.46 m wide, and 1.22 m deep.
Oic side of th flume consists of a plexiglas side wall for observing tests. Fig. 15
is the schematic layout of the test facility.
A 6.0 m long ramp section consisted of a 3.0 m long gradual rise (1:15)
followed by a level 3.0 m long section, Fig. 16. The ramp preceded the sand test
section and provided for a smooth transition from the flume bottom to sand bed.
It also contributed to the development of the boundary layer.
A test cection located approximately 20.0 m from the wave generator con-
sisted of a 6.0 m long by 0.20 m deep sand bed. This test section was 12 m long,
including the ramp and sand bed section, shown in Fig. 16. Pipes were placed on
the bed at about 3.0 m downstream of the ramp. This allowed for development
of a boundary layer and equilibrium condition in the sand bed section before the
current reached the pipes.
43
Fig 14. Test facility.

44
Fft
w m r.".
0 m0
c a 40 =
00Zil 0

45
E0
ETGo E
0xIn
CLC
4-
Il 0
0.
E AN
E bE
0

46
Currents were produced by a pumping system capable of developing a flow
* velocity of 1.20 m/sec. The flow rate is controlled by two flow control valves.
Water depth is controlled by an adjustable weir located at the end of the tank.
Currents were controlled by adjusting the flow control valves and weir.
The wave generator produces a wave by the plunging motion of a wedge,
where the height of the wave is determined by the depth of the plunger and the
depth of water. Wave period and wave length were adjusted by a rheostat which
controls the plunger speed. The wave generator was preset for test conditions. A
wire mesh wave filter which dissipated the small surface ripples from the generated
waves was located 2.0 m from the plunger.
A wave absorber was placed at the end of the tank to reduce wave reflection.
The wave absorber design permits passage of large volumes of water. This allows
for significant currents and waves with undisturbed current flow and reduced wave
reflection.
Three sizes of pipes are utilized: 3.0, 6.0, and 9.0 cm. The pipes were secured
in the tank through compression springs and dowels placed inside each pipe. Each
pipe was placed in the tank under flow conditions, and set in place with the flow
direction normal to the longitudinal axis of the pipe. Proper pipe spacing was
achieved through the use of spacers. The pipe spacing is the clear width between
outer pipe diameters.

47
Current velocity was measured with a propeller current meter. Velocity
* measurements were taken at 5.0 cm from the bottom up to the water surface.
Velocity profiles were developed by measuring the current at 5, 10, 20, 30, 40, 50,
and 60 cm from the bottom.
0
A Seasim resistance type autocompensating wave gauge and Hewlett Packard
Model 17403A strip chart recorder were used to measure and record the wave
characteristics. The wave gauge consists of a 40.0 cm long stainless steel probe
with anodized aluminum calibration rod and clamp attachment. The maximum
recommended cable and circuit resistance is 1.0 ohm and frequency range in
autocompensation mode is 0.2 to above 10.0 Hz.
Scour profiles were measured with a point gauge profiler. The profiler was
manually operated with a precision of 5.0 mm.

48
CHAPTER VI
0 EXPERIMENTAL PROCEDURES
* Seventy-two test runs were conducted for this study. Pipe sizes of 3.0, 6.0,
and 9.0 cm were placed on a sand bed test section. Fig. 17 is the result of a
sieve analysis of the sand; it shows that d50 = 0.08 mm. Table I shows the test
I pipe configurations, flow conditions and test numbers. Each pipe configuration
was subjected to four flow conditions:
(1) Current only:
U = 0.37 m/sec
(2) Current with wave:
U = 0.37 m/sec
wave characteristics:
H=6.0 cm, L=1.0 m, T=1.2sec

0 ,
49
O. 4~ (5o@
- - a a
0 - - - -
S.'
U
, o Ma
• i
lilil ~~lll*,ll~ l~~l alhlll~ a.. ,l -i -iii~~ ill§l, l*l
8 o ,-.° ., .,° N° -°
Sm, ~cT ;KxX~cl ),,a-T
'"
0B a--a
,n n n n uI I I

& 50
Table 1. Test Numbers and Test Conditions.
I TES NUMBERS.ETU n M m/ IU n 0.2 M/s
CONFIGURATION PIPE DIAMET11 - D - (on)
*3 6 g 3 6 9-0 1 15 29 43 53 63
* -0 2 16.30 4454 64
-010 3 17 31 45 55 65
0 0 4 18 32 46 56166
-0 ° 0 5 19 33 47157 67
0 0 6 20.34 48 58 68
--OTOTO 7 21 35 4959 69
0101o0 8 22 36 50 60 70
-OOoO 9 23 37 51 61171
(0 0 a 0 10 24 38 52 6272- - -
0 11 25 39 NOTES:
0 13 27 41 -. 00 cuent & wave
- 14 28 421SpwsdO - 1.2 se

51
(3) Current only:
* U = 0.26 m/sec
(4) Current with wave:
U - 0.26 m/sec
wave characteristics:
H =6.0cm, L=1.0m, T=1.2sec
where: U = mean local velocity 5.0 cm above bed.
The pipe spacing is the clear width between outer pipe diameters. The flow
control valve, adjustable weir and wave maker were calibrated and preset for the
test conditions.
The critical velocity of incipient motion, V,, was determined experimentally:
Vc = 0.40 rn/sec
This was done by gradually filling the tank to the test depth of 0.60 m, which
developed the equilibrium bed. The current velocity was slowly increased until
weak movement was observed. A few sand particles just began to move in isolated
areas of the bed. The current velocity was measured with the current meter 5.0
cm above the bed. This procedure was repeated several times.

52
Comparison between the experimentally determined V, and the values in Fig.
* 3 reveal a close correspondence. The experimental value of V, = 0.40 m/sec is
slightly higher then that shown in Fig. 3. This may be due to:
0 (1) the precision of the current meter, and
(2) measuring the velocity at 5.0 cm above the bed.
Measurements less than 5.0 cm from the bed result in the current meter
disturbing the bed. The V profile is shown along with the velocity profiles of
each test condition in Fig. 18. Vc is determined under current only conditions. A
hypothetical tangent line from 5.0 cm above the bed on the velocity profile curve
on Fig. 18 to the plane of the bed (x-axis) gives theoretical values for velocity.
These values are in the boundary layer. Incipient motion occurs at velocities in
the boundary layer. For purposes of this study, the values used are measurable
quantities taken at 5.0 cm above the bed.
At U = V one may observe a slight movement in the bed. Close observation
revealed a few grains of sand rolling along the bed in the direction of the current.
At U < V, no sand moves. When the test wave was run with V, the measured
velocity at 5.0 cm was the same as the measured velocity for current only. But
with the wave, sediment is brought into suspension, and the sand bed mobilizes.

0 53
E Ic
- :0 -- r \%-
*4 E
E 3c a 0
(UU) 4d*] 104M IR

54
At the onset of each test, the sand bed was leveled and the tank slowly
* filled with water. Fresh sand was added to the bed between tests, and manually
compacted to a thickness of 0.2 m. This was an attempt to control the bed density
without taking compaction measurements, ensuring the same bed density for all
* tests and prevented bed liquefaction.
Equilibrium bed developed as the tank filled with water. The equilibrium
bed was characterized with small sand ripples, approximately 2-5 mm high, 2
mm wide and about 4-8 cm apart. The bed remained in equilibrium until the
pipes were placed on the bed. Once the test flow depth of 60 cm was reached, the
test current was established and measured.
Pipes were placed in the tank once the depth and current were established.
For tests with current and wave, the wave generator was preset and started
immediately after the pipes were in place. Pipe placement methodology was the
same for each test. Each pipe was placed in the tank sequentially; the first pipe
is the leading pipe. Scour began immediately.
Velocity profiles were measured and recorded for each test at about one meter
upstream of the leading pipe. The profiles shown on Fig. 18 represent averages of
all flow conditions for each applicable case. All the profiles shown in Fig. 18 are
measured values. The wave gauge was located downstream of the pipe test area.
Fig. 16 shows the typical test section layout.

01
55
Each test was run between 60 and 90 minutes. Initially, scour occurred at
* a high rate. Scour profiles were traced on sheets of acetate taped to the side
of the tank. These scour profiles were taken periodically, with color coded lines
representing different times. Generally, the maximum scour depth was reached
* within the first twenty minutes. The time profiles differ from the final measured
centerhne profiles because of side wall interference. These profiles indicate the
time when the scour hole was at maximum depth. Once the maximum depth
* was reached, the test was allowed to run for twenty minutes, ensuring equilibrium
scour.
A test run was stopped once it became apparent that the scour hole reached
its maximum equilibrium depth. The water slowly drained out of the tank once
the wave generator was shut down and the flow control valve closed. The pipes
were carefully removed from the tank, without disturbing the scoured bed. The
centerline profile was measured with the point gauge profiler at intervals of five
millimeters or one centimeter. The measured profile was plotted for each test.
The measured bed centerline profile and maximum scour depth for each test is
included in Appendix II.

56
CHAPTER VII
0 ANALYSIS OF RESULTS
* Presentation of Data
The Maximum equilibrium scour depths and relative scour depths which
were measured during the tests in this study are presented in Table II and III,
respectively. The data show greater scour depth for current when compared to
similar cases of current and wave action, (oscillatory motion). Table III shows the
relative scour depth Sd/D decreasing with increasing pipe diameter. The pipe
spacing is the clear width between outer pipe diameters.
With two pipes in contact with the bed, there were three cases of no scour.
Scour was not evident when 3.0 cm pipes were exposed to current and wave action.
The small pipe diameter and oscillatory motion allowed for the pipe to capture
sediment. The turbulence resulting from vortex shedding was influenced when
an additional pipe was placed in the wake of the leading pipe. Where no scour
occurred, little or no vortex shedding occurred behind the leading pipe. There
was insufficient turbulence in the space between the pipes to keep sediment in
suspension for transport. Thus, sediment was deposited between the cylinders.
The oscillatory motion contributes to deposition by moving sediment back between
the pipes. The sediment entrained between pipes settled out of suspension. In
currents, sediment was transported in the direction of the current.

57
Table TT. Maximum Scour Depth.
* MAXIMUM SCOUR DEPTH -Sd- (cm)
U = 0.37 /s IU 0.26 m/sCONFIGURATION PIPE DIAMETER - 0 - (em)
*3 6 9 3 6 9
" 0 2.15 3.75 4.60 1.55 2.20 2.25
-0 1.45 3.05 3.90 1.20 2.00 2.00
-0'0 1.75 3.25 &.95 1.05 2.15 2.25
5,-' no00 1.40 2.50 3.70 2.05 2.15
-0 0 2.40 3.80 5.l5 1.40 2.20 2.25
- Q 0 0 2.15 3.35 4.45 s.ow 2.30 .30
- 0 010 1.55 4.35 4.65 1.40 2.35 3.25
O I 0 10 1.40 3.50 3.60 0.55 1.50 2.25
- 0o0 os 2.65 4.65 5.10 1.45 2.00 3.75
... W 1.95 4.10 3.95 1.101.902.50
0.75 235 &.95 current only
- 2.40 3.90 4.35 0
current &wave0 n heigot em
0 , L 3.05 4.05 Ing. 1.o m0 eled - 1.2 Wed

58
Table III. Relative Scour Depth.
RELATIVE SCOUR DEPTH (Sd/D)T U a 0.37 m/s_ U n 0.25 r/a
TEST PIPE DIAME[TER - D -(ore)
* CONFIGURATION - - -__ _ _ 369 93 619
0 0.72 0.63 0.51 0.52 0.37 0.25-i
i Q 0 0.48 0.51 0.43 0.40 0.33 0.22
0 © 0.58 0.54 0.55 0.35 0.36 0.25
0 I 0 0.47 0.47 0.41 0 0.34 0.24
0 D 0 0.80 0.63 0.57 0.47 0.37 0.25
0 ) 0 0.72 0.56 0.49 0 0.38 0.261
--*010 0.62 0.73 0.52 0.47 0.39 0.36
,0--01010 0.47 0.63 0.40 0.28 0.30 0.25
-- 0 'oo 0 0.88 0.78 0.57 0.48 0.33 0.42
- 0 0 00 0.65 0.68 0.4 0.37 0.32 0.28-I -I
-- 00 0.50 0.51 0N4 NOTES ;0
%- 0.25 0.49 0.4 current only
0.80 0.r 0.48 0-0 current & wove-- 0 holsht m 6 orn
0 0.51 0.45 lonoth = 1.0 m0 perid m 1.2 ee
I I I I I I I

59
In most cases of multiple pipes, the vortex shedding from the leading pipe is
* influenced by the presence of additional pipes. This is seen in the scour profiles
presented in Appendix II. In most cases, sediment deposition occurs in the space
between multiple pipe configurations. The deposition of sediment between pipes
*0 is the result of reduced turbulence in the wake of the leading pipe. Interruption
of the vortex shedding by additional pipes results in less turbulence, or a smooth
wake. Thus, sediment deposition occurs in the space between pipes.
Subtle variations in scour profiles and relative scour depths are apparent
when comparing current only to current and wave action profiles of similar cases.
Compared with current only, current and wave action results in a more active bed
with less relative scour. This paradox is attributed to the oscillatory wave motion,
disturbing capability of wave and wave energy transmitted to the bed.
The disturbing capability of the wave is described by the wave steepness,
(H/gT2 ). In oscillatory motion, sediment is lifted into suspension and moved in
oscillatory motion. The pipe spacing reduces the vortex shedding, thus producing
less turbulence. The wave pushes a particle back into the scour hole where there
is less fluid motion. Sediment in suspension begins to settle, sediment deposition
results, and the scour profile develops. The developing scour profile influences the
flow streamlines.

0 60
Flow streamlines around multiple cylinders during scour is complex. Stream-
lines are in a dynamic state, influenced by the changing scour profile and cylinder
shape. The developing scour profile alters the flow streamlines. The streamlines
adjust to the scour profile. Equilibrium occurs when fluid velocity becomes less
than the critical velocity of sediment movement. In equilibrium, streamlines are
uniform and the scour hole profile is static.
0 Data Verification
Data verification is achieved by comparing the single pipe case test results
of this study with results presented by Nalluri and Ibrahim (1986), as shown in
Figs. 4-7 and Figs. 19-22. In Figs. 19-22 the single pipe results of this study
are plotted along with the data, of Nalluri and Ibrahim. These plots indicate good
correlation between the single pipe cases of this study and the study of Nalluri
and Ibrahim. "
Figs. 19 and 20 show the relative scour depth plotted against the pipe Froude
number and sediment troude Number, respectively. Flow velocity is part of the
Froude Numler, which represents an inertia-gravity force system. The relative
scour depth Sd/D increases with increasing pipe and sediment Froude Number.

61
1.4 .
0 Nulri & Ibrahim Data
1.2 V Current only (West. Data)A current w/ wov, (WeSt. Oato) 0
V 00 .6 0 00%_O
CL. 0.4 0
o.5aO~ A80.2v
0.00
*0.0 0.1 0.2 0.3 0.4 0.5 0.6 0.7 0.8 0.9 1.0
Pip* Froude Number (Nfp)
Fig. 19. Influence of pipe Froude Number (.7/vgD) on scour.
2.0-
C
• 1.5 . e0 0
Z.A V 0
0 .6.
o 0 A 0 U/Vc - 0.687; ds - 0.80 mm;o .5, 0* U/Vc -0.833; di - 0.80 mm
.a o 0 U/Vc - 0.926; do - 0.80 mm0 V U/Vy - 0.812; do - 1.50 mm
v U/Vc - 0.650; West. DoatA U/Vc - 0.925; West. Data
0.0 1 .10 2 4 6 8 10 12 14 16 18 20
Sediment Froude Number (Ns)
Fig. 20. Influence of sediment Froude Number (f/viM) on scour.

62
0 U/ - 0A67 d - GO mam2.0 * U/* a o., dg - .o0 m
* U/% = - do - O.80 mmUVY Utfca 0.812: do- 1.50 m
-"uA - .: W°L ate44 A Utc a 0.92% ws Data
1.5
0 0
.2 0.5- Is
oo
0.0 V 0 m S n0 0
0 0
0.00
* 0 2 4 6 8 10 12
Ursell Number (H(L°O2)/(y*3))
Fig. 21. Influence of wave Ursell Number (HL 2 /y 3 ) on scour.
0 U/V n 0667; de - 0.80 mm
2.0 * U/Vc - 0.833; " 0-0 mm
* U/Ve , 0=926;do - 0.00 wSU/c m 0.812: do - 1.50 mo
T U/Va - 0.650: West. ataCo A U/Va - 0.925; Wet Data
z) 1.5
0 0
J: 0 0
00
1.0
o 1 e2 4 00 090
0 0
0.0'0 1 2 .3 4 5 6 7 8 10
Wave Steepness (H/(gTe*2).0O 1)
Fig. 22. Influence of wave steepness (H/gT2 ) on scour.

F
63
Fig. 21 shows the influence of the wave Ursell Number, U,. = HL 2 /y 3 , which
* represents the relative magnitude between H/L and y/L. U, < 1 corresponds
to a region of intermediate to deep water. The data from this study represent
intermediate to deep water conditions. The data of Nalluri and Ibrahim (1986)
* are for shallow water conditions.
Fig. 22 shows wave steepness, H/gT2 , which represents the disturbing
capability of the wave. The waves used in this study are longer than the waves
used by Nalluri and Ibrahim (1986), and therefore plot at lower Sd/D values.
Pipe Spacing Relationship
The relationship between pipe spacing and scour depth achieved with the
data in this study are dimensionless plots of the product of pipe Reynolds Number
(Nrp) and sediment Froude Number (Ns) against relative scour depth (Sd/D).
Scour is a function of pipe geometry, sediment size and flow conditions. The
Reynolds Number and Froude Number represent applicable scaling laws.
The dimensionless product of pipe Reynolds Number and sediment Froude
Number account for the most significant parameters which influence scour. Plots
developed between Sd/D and (Nrp)(Ns) have a constant sediment Froude
Number (Ns) since the sediment is the same in all cases. The pipe Reynolds
Number is variable and contributes to the decreasing Sd/D.

64
Fig. 23-26 are plots of tests with U = 0.37 rn/sec. Fig. 27-30 are plots
* of tests with U = 0.26 rn/sec. These are plots of (Nrp)(Ns) against (Sd/D) .
The solid line in each figure is the single pipe case, representing a relative datum
line. The lines represent a linear least square fit for a set of three data points.
* Statistically speaking, more data points are required for definitive conclusions,
therefore, the lines represent only general trends.
0 Fig. 23 represents a trend where the 1/2 diameter pipe spacing results in less
scour than both the single pipe case and full diameter case. Similar results are
obtained in Fig. 24, current and wave. The 1/2 diameter pipe spacing results in
* less scour than the single pipe case and full diameter case. Comparing Fig. 23
with Fig. 24 shows a general trend for greater relative scour in the current only
case.
Fig. 25 represents a general trend where the 1/2 diameter pipe spacing results
in less relative scour than the full diameter pipe spacing. When compared to the
single pipe case, there is no apparent trend. The full diameter spacing results
in greater scour than both single pipe and 1/2 diameter spacing cases. In Fig.
26, the full diameter pipe spacing is about the same as the 1/2 diameter spacing.
Both the 1/2 and full diameter spacing result in greater relative scour than the
single pipe case. Comparing Fig. 25 with Fig. 26 shows a general trend for greater
relative scour in the current only case.

65
0 C
* Ses
*C/S 4;o4dn* AIOG

66
0V
a FAs
N 3i
0i 0 I 1(G/S)4;*C jo* OJJJI

067
4
I.3a*
**
0U 0
a0 a U
* g~.U
**0
b1 ~aII-~-
Z As- - ~ -* u
* I *~JI*
0 * I* I U* ToI* U.g ES U2
I.
qq- - - -
b. *. *.
~ii
'Ii- - IIhI..mm.hE..t...m.......O
0 '0 4 N 00 6 0 0 0
(a/ps) qId.~ ~noo~ *AI&otS~j

068
S4.
F,I.
S
***
q* PCI** g II
*61.:
'9*. I..
~jqI0 I ID
a.9 z
- - -- (.461
P0.
* a *
I, ~b'jSD)91454. E
Ne- - All
.3.
~j.1
1*1- - Euhm...Em.hmE...i.Em...E.~m..mEo
4 N 00 0 6 o o
(a/Ps) q4dsa .rnoo~ *AII0I*~

69
In Figs. 23-26, the general trend is that 1/2 pipe diameter pipe spacing results
* in less relative scour than the full diameter pipe spacing. The 1/2 diameter pipe
spacing for 2-pipe systems results in less relative scour than both the single pipe
case and the full diameter case. The 1/2 diameter spacing of the 3-pipe system
*O appears to result in greater relative scour than the single pipe case. The full
diameter spacing for a 3-pipe system results in greater relative scour than the
single case. This may be due to the wide profile characteristic of a 3-pipe system.
Figs. 27-30 are plots with U = 0.26 rn/sec. In these cases the bed was
less dynamic than in the set of tests with U = 0.37 m/sec. The general trend
is similar. The 1/2 diameter spacing results in less relative scour than the full
diameter spacing for 2-pipe systems. In Fig. 28 the trend lines connect two data
points. This is the case where there was no scour of the 2-pipe system, 3 cm
*l diameter pipes. The no scour points are plotted at (Sd/D = 0.0).
Figs. 23-30 show a trend for decreasing Sd/D with increasing (Nrp)(Ns).
Since Ns is constant, this trend is due to Nrp, which represents increased inertia.
Conceptually, inertia is the tendency of a body to resist acceleration. Reynolds
Number is an inertia-viscous force ratio. Increasing the pipe diameters increases
the pipe Reynolds Number (Nrp) and results in greater system inertia.
In the model test, pipe diameters varied while sediment size remained
constant. The larger. pipe diameters yield a higher pipe Reynolds Number. Table
II shows that Sd/D decreases as D increases for each set of test configurations.

07
07
* 114
CL
00
C-44
* 0
* I . II Ij
- U 6
(GP)4da jnoSOA#DO

71
C Ao.
a a a aa
Iw vV4 (0
a a a a NI+
(O/PS)_ 4S*]joS0IUO

72
*461
____ - -4
WI4
U 0
ini
in C4
(CPS N4oIjoSSICO

0 73
- ---
*
- -*1DI -W
*c 1
w 4 4 P
0 - -
(G/PS) 44*()joSOJDO

74
The trend for decreasing Sd/D as (Nrp)(Ns) increases is attributed to increasing
* pipe diameter, which is a function of Nrp.
The scour profiles presented in Appendix II show a variation in scour profiles
obtained between the two test currents. Although the 3-pipe system results in
greater relative scour depths, scour depth beneath additional pipes appears to be
less. This is especially true for the U = 0.26 rn/sec cases. The general trend for
the relative scour depth to be greater in the 3-pipe system is because the scour
hole profile is wider. Inspection of the 3-pipe configurations with U = 0.26 rn/sec
(Appendix II) reveals many cases where the third pipe behind the leading pipe
has minimal if any scour. When examining the profiles in Appendix II, note the
distortion of the axis scales.
The equilibrium bed consisted of ripple formations, discussed in Chapter
VI. The ripples migrate in tie direction of the current. The migration is not
visible, but apparent when comparing time profiles. Tests with current and wave
action resulted in a more active bed. In these cases, sediment is transported from
upstream of the leading pipe. As the sediment is transported through the pipe test
section, there is some sediment deposition. In some cases sediment was deposited
in the vicinity in front of the leading pipe. This combined with the migration of
bed ripples accounts for sediment deposition in front of the leading pipe in several
cases. The buried pipes had no apparent effect on stabilizing the bed.
75
Scour Rate
Initially, scour occurs at a high rate. Fig. 31 shows three time stages of
scour for test number 64. Test 64 was conducted on a single 9 cm pipe exposed to
current and wave action with U = 0.26m/sec. The maximum equilibrium scour
depth is established early, with equilibrium profile at a later time. In most tests
the maximum equilibrium scour depth was reached within twenty minutes, and
the equilibrium scour profile within ninety minutes.
• Fig. 32 shows three time stages for test number 70. Test 70 is a three
pipe system with 1/2 diameter spacing between pipes. Test 70 is exposed to the
same flow conditions as test 64. The maximum depth below the leading nipe is
established early. The third pipe experiences sediment deposition. This is due to
the reduced turbulence in the wake of the second pipe. The rate of scour may be
a function of the effective sediment size, as well as flow conditions. Fig. 31 and
Fig. 32 are typical examples of the scour rates observed in this study. Also note
that the direction of flow in Fig. 31 and 32 is from right to left.

716
(a) Scour profile after 10 minutes.
SU
(b) Scour profile after 40 minutes.
(c) Scour profile after 90 minutes.
Fig. 31. Test number 64: scour profile developrnent.(U = 0.26 m/sec, L = 1.0 m, H = 6.0 rm, T = 1.2 sec)
(Pipe diameter = 9 cm)

* 77
0
S m at i m
(a) Scour profile after 10 minutes.
(b) Scour profile after 40 minutes.
(c) Scour profile after 90 minutes.
Fig. 32. Test number 70: scour profile development.
(U = 0.26 m/sec, L = 1.0 m, H = 6.0 cm, T = 1.2 sec)(Pipe diameter = 9 cm; spacing = 4.5 cm)

78
CHAPTER VIII
SUMMARY OF CONCLUSIONS
AND RECOMMENDATIONS
One of the major problems of placing pipelines in the ocean is pipeline
scour, which is a threat to pipeline stability. As more pipelines are placed in
the ocean, many adjacent to one another, scour will continue to be a problem.
Research objectives of this study were to determine the relationship between pipe
geometry and scour depth, and examine scour hole dimensions under multiple
pipes. Pipeline scour was reviewed, followed by a theoretical and descriptive
presentation of pipeline scour.
* Seventy-two model tests were conducted on multiple pipelines in contact
with a sand bed. Model tests were conducted in a two-dimensional wave-current
flume facility. Multiple pipe systems were exposed to unidirectional flow and
unidirectional flow with oscillatory motion. The model testing investigated pipe
spacing and its relationship to scour. A major influence on scour was believed to
be vortex shedding in the wake of the pipe. Vortex shedding was disrupted by
placing additional pipes behind the leading pipe. A scour profile was developed
for each test.

79
Model testing resulting in the following conclusions:
(1) For two pipe systems, 1/2 pipe diameter pipe spacing between pipes
results in less scour depth than full diameter spacing. This is due to
interruption of the vortex shedding occurring behind the leading pipe.
At a full diameter spacing, the vortex shedding has enough space to
develop. The 1/2 diameter spacing blocks the vortex action, preventing
its full development.
* (2) Unidirectional flow with oscillatory motion results in less scour than
unidirectional flow. Oscillatory motion contributes to deposition by
moving sediment back into the scour hole, between pipes. Since there is
less turbulence between pipes, the sediment settles out of suspension.
(3) The scour rate is high initially, then decreases until equilibrium is
0 reached. Maximum scour depth was usually reached within twenty
minutes during the model tests, and equilibrium profile was attained
in about ninety minutes.
(4) A relationship exists between relative scour depth, Sd/D, and pipe
Reynolds Number, Nrp. Relative scour depth Sd/D decreases with
increasing pipe Reynolds Number Nrp.

80
(5) Wave characteristics affected scour by disturbing and mobilizing the bed.
* The effect was a. mass transfer in the direction of the current.
Following are recommendations for further research:
(1) A larger data base contributes in developing definitive conclusions.
Additional research should concentrate on one set of pipe configurations.
Collect additional data for one set of configur,,tions at various pipe
spacings for analysis.
(2) Conduct a series of tests on different sediment sizes and pipe configura-
tions. This may result in an improved relationship between pipe spacing
* and sediment size, and establish correlation between scour rate and sed-
iment size. This will also develop the relationship between the product
(Nrp)(Ns). By varying pipe Reynolds Number and sediment Froude
Number, a relationship between relative scour depth, pipe sizes and sed-
iment sizes will be determined.
(3) Investigate various waves and the effect of the Keulegan-Carpenter
number on multiple pipe systems. Varying wave characteristics will
develop stronger relationships on the affect of waves on scour.

81
REFERENCES
Bijker, E.W., and Leeuwestcin, W. (1983). "Interaction Between Pipelinesand the Seabed Under the Influence of Waves and Currents", SeabedMechanics, Symposium Proceedings, International Union of Theoreticaland Applied Mechanics and International Union of Geodesy and Geophysics,
* London, England, pp 235-242.
Bruschi, R., Cimbali, W., Leopardi, G., and Vincenzi, M. (1986). "ScourInduced Free Spans Analysis ", Proceedings of the 5th International Sympo-
* sium on Offshore Mechanics, American Society of Mechanical Engineering,New York, New York, pp 656-669.
Dahlberg, R. (1983). Geotechnical Aspects of Coastal and Offshore
* Structures, A.A. Balkema, Rotterdam, Netherlands, pp 166-168.
Einstein, H.A. (1942). "Formulas for Transportation of Bed Load",Transactions, ASCE, Vol. 107, pp 798-878.
Fredsoe, J., Mao, Y., and Summer, B.M. (1988). "Interaction BetweenVibrating Pipe and Erodible Bed", Journal of Waterway, Port, Coastal and
Ocean Engineering Division, ASCE, 114(1), pp 81-93.
Herbich, J., Dunlap, W., Schiller, R., and Watanabe, R. (1984). SeafloorScour, Design Guidelines for Ocean-Founded Structures, Marcel Dekker, Inc.,New York, New York, pp203-204 .
Hulsbergen, C.H. (1984). "Stimulated Self-Burial of Submarine Pipelines",Proceedings of the 16th Annual Offshore Technology Conference, OTC-paper4667, Dallas, Texas, pp 171-178.
Ibrahim, A., and Nalluri, C. (1986). "Scour Around Pipelines Under MarineEnvironment", Proceedings of the 5th International Symposium on Ofshore

82
Mechanics, American Society of Mechanical Engineering, New York, NewYork, pp 569-575.
Kjeldsen, S. (1973). "Local Scour Near Offshore Pipelines", Proceedings,Second Conference on Port and Ocean Engineering Under Arctic Conditions,Reykjavic, Iceland, pp 171-178.
Leeuwestein, W. (1984). "Scour Around Submarine Pipelines", PetroleInformations, No. 1602, pp 16-26.
Liu, H.K. (1958). "Mechanics of Sediment-Ripple Formation", Journal.of the Hydraulics Division, ASCE, Vol. 84, No. HY5, pp 1832-10-1832-12.
0 Mao, Y. (1986). "Interaction Between a Pipeline and an ErodibleBed", Dissertation, Institute of Hydromechanics and Hydraulic Engineering,Technical University of Denmark, Series Paper No. 39.
* Shields, A. (1936). "Anwendung der Aehnlichkeitsmechanik und Turbulenzforschung auf die Geshiebewegung", Mitteilung Preussischen VersuchanstaltWasser, Erd, Schiffbau, No. 26, Berlin, (in German).
Simons, D.R., and $entiirk, F., (1977). Sediment Transport Technology,Water Resources Publications, Fort Collins, Colorado, pp 409-411.
Vanoni, V.A. (1966). "Sediment Transportation Mechanics: Initiationof Motion, Progress Report of the Task Committee On Preparation of Sed-imentation Manual, Committee on Sedimentation", Journal of HydraulicsDivision, ASCE, Vol. 92, No. HY2, pp 291-315.
Yang, C.T. (1973). "Incipient Motion and Sediment Transport", Journalof the Hydraulics Division, ASCE, Vol. 92, No. HY10, pp 1679-1704.

83
APPENDICES

84
APPENDIX I
SCOUR.FOR PROGRAM CODE
scout. rORThis program calls subprogram WAVE123 which computesthe fluid velocity directly in front of the pipe.It then calculates the maximum scour depth and scourhole profile under the pipe. An output file, PROFILE.DAT,is created. PROFILE.DAT is plotted using the VAX/VHSPICSURE program.
* variables
*UZ3 wave velocity in ft/s*Material constant dimensionless*U wave -m/s*U current m/s
• *U-flow M/s*D-pipe mm*Gavity a/S**2*K S dimensionless*Sind factor dimensionless*H inTt mm*E;silon 0
* *Number of points Number of points to be outputed*Number-of-points*Sdmax i Maximum scour depth*X mm Position along the sea bed perpendicular to the pipe*X inc mm Sampling increment*w a Wave number*H ma Distance between the bottom of the pipe and the sea bed
* *PI Circumference constant
REAL Material-constant&,UZ3&,U wave&,U-current& ,U-flow&,D-pipe& ,Giavity& K s&,Sand factor&,K inTt&,Efsilon&,Number of points&,SdmaxS,X&,X inc&,W-& ,w&,Hf'F'

85
SCOUR.FOR PROGRAM CODE - CONTINUED
PARAMIETER (P!-3.14159265,Gravity-9.8l)
CALL WAVElZ3(UZ3)WRITE(6,*) 'WAvEl23 COMPLETED'
K S-0.972rfwave-UZ3*. 3048
C Open file MAIN.DAT an input to re-ad in the following parameters* OPEN(UNIT-l0,rILE-'IIAIN.DAT',STATUS-'UNKNOWN')
READ(lO.*)U currentREADC1 l*)D pipeREAD( l0.*)Sand factor
Epsilon-H mnit / Dpipe
* K) flow a U wave + U current
SdmaxKs*(Uflov**2/Gravity)**0.20*Dpipe**0.800
W-Sand factor*D-pipe
Number of_points- 30
OPEN(UNIT-20,FILE-'PROrILE.DAT' ,STATUS-'NEW')WRITEC 20,*) 'POSITION DEPTH'Xi-D pipe*4X incw2*ABS(X)/Nuber 0 f pointsXZX-X inc
00 I-1,INT(Number of points)X-X+X incIr ( XBS(X).LT.(W/2) ) TH3EN
H-Epsilon *D-Pipe/2 + Sdmax/2*(l~coa(2*PI*X/W))ELSEif-Epsilon *D-pipe/2
ENDIF
H-H-D pipe/2WRITET6. )X.HWRITE(20,*)X.U
ENDO
CALL EXITEND

86
APPENDIX II
TEST PROFILES
0
0

87
Lo)
LU
0
LU Cyj
ZiC~E CA)
0*zCO L06 C)
Z In
CJC)
I-I
LA)o
0 0Cl)j
't 0Y ~ ~ o L

88
10
Cf11
0Zz
*UL
o 10
CM,
.- V-
cic LO
3* 0-'U
.0 -4
* C? 00
0)0
0 10
Lo0 1- co Nr' co 0 - CJ C t 10Lu II
-j

89
C)
LOIC\-
d
*U C~
cc 0Iaj(N
Co4
LO
fto
LL i

90
LO)
C) LC)
IcW 0
*u 0H '-0
< C~j
F. 0
LU -4
Cc~ 0
0
LO
LuO

91
LaJ 10
10
CCJ
ZI 0
z 1Owcc0
z :5
doo
1- 0
10C\J
I-
Lij

92
0LO
C4'LU
>00
C4 0Col
Z LUJ LO
I.- 0
00
z LO60'* ~ EU
Cl)0
10
00 CO
-J 0
LUU-40
4j0

93
10
*c~ Lo
LU
ul 0.
-. 1 LO
Z 0
L~
CC C)
B 10
LUO
66.
0
10
Luu toI
LLC

94
~~0
Ix 0
ca 0
I -: 0 _
C, LD > I
0'0"C. L
N 0
I-I
C'.j
LO"tco (N- 0' (j co - t LO
tu

00
L95
___ ___ ft_ C
c 0
10
Coj
caN
* ccZ cc Z
z >'0
cco
00 0
10
I..-
0~
10
Lo -,t c- 0 N C'j Co -74 L0
Lu

& 96
0)
e LO)
co 0
IJJ U LO
0 ft.
0
0 C\J
0
D W3
S Ius
Cf) a0 0
LO)
0
LO
~LO 'st cs C\J 0 JC t LO
'U

97
______ _____ LO
C"j
C) 0
C)(Q.0C
co
zzac
LUU
a:*b
coo
LuO
LO -C-CDCq Y tL
uj~
4
LU I

98
C\J
Z -0-. C\j
w
ca LO)
Z 0
w -- o
LO
Y 0
E CL
C') a 0
oL
COO 0- o C1Cl 4ui'
I-4jq

99
____ ___ ___ 0
0Cf) -.
0
z IC)
Co~
0
E 'U
crC)
00 (a
CO T
LLU
I- -I
00*O -t mo 0~ -t
LLu

100
<02 LO
4~ 00
w QLIjJ C\I
t 0
0 C~0
<CM
LO
()..
00
CD 0
0c I\
LOCMj
0Co
I-
LU

10
10
10co
0
* C(D I
ELO~ ce)
-. I.-03 a.-X
60*o
CL CO
10
10
0
;-10
SK, L Co) e~J '-0' e- C t 10
LU

102 a
00
M CYO
10
o (o
<0
CJj
ZEI
coo
0z0
ciD CCL
C,
10
CO 0
10
Lo0 -:4 CO) (j ~-0~ N (Y) It 10I I I

103
C)Y
#00co
CU~
10(\j
z
Ecv)
60 i
0: 0*U -4
CO CL L-.
LUI0
10
10
Lo0 "t co N- 0r N co ,t 10o
Lu

104
LO)
00
o IC
1.- 0
w )
c'J
* CCD
00
Cf)
COL
0
10
Lo If t c~) (NJ - 0 c" () '-,7 1o
-4114J
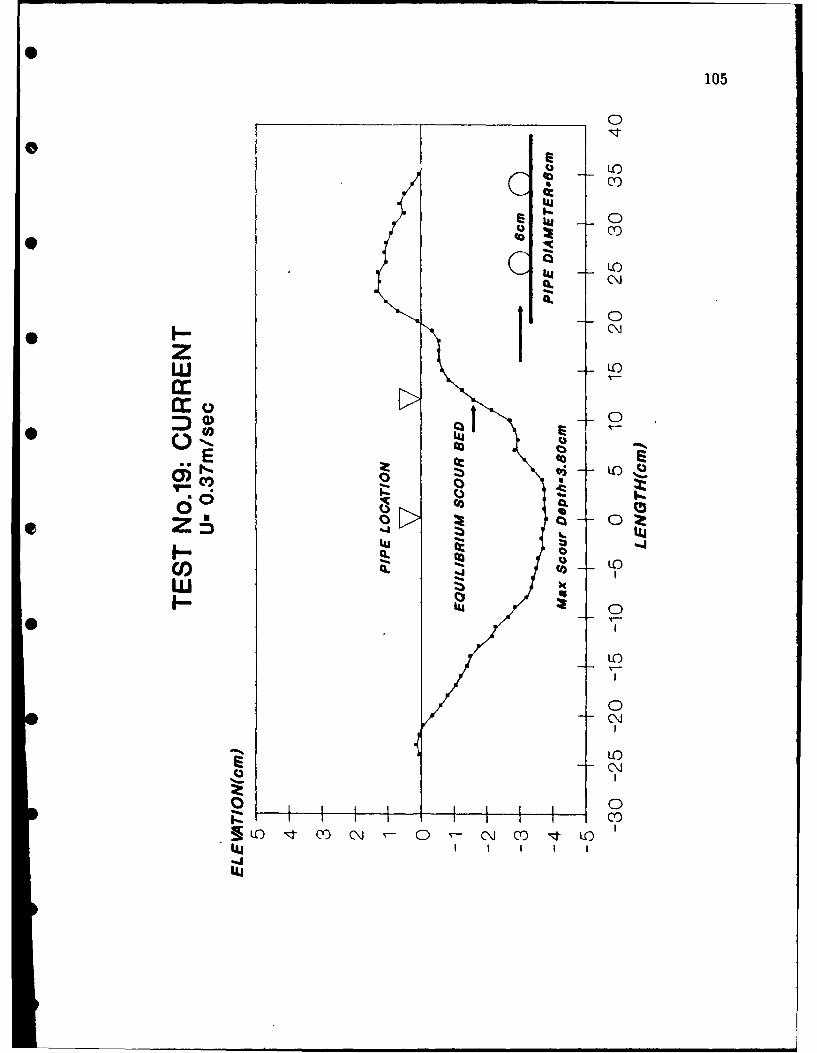
105
00
rt:10'CY
Coj
MiOcr.-
CCCo
0 00
600
ez I5
W 10
t 0
doo*o q c ~ ~ o -;-Lutj
Mi. '

106
00
LO)Co)
ty 0co
> E j LO
<0 C\j
U 0* C\j
ZO
0 LO.
00 I
Q) 1C\1 -4i
Ixf
CL
CC\
F-
LUO
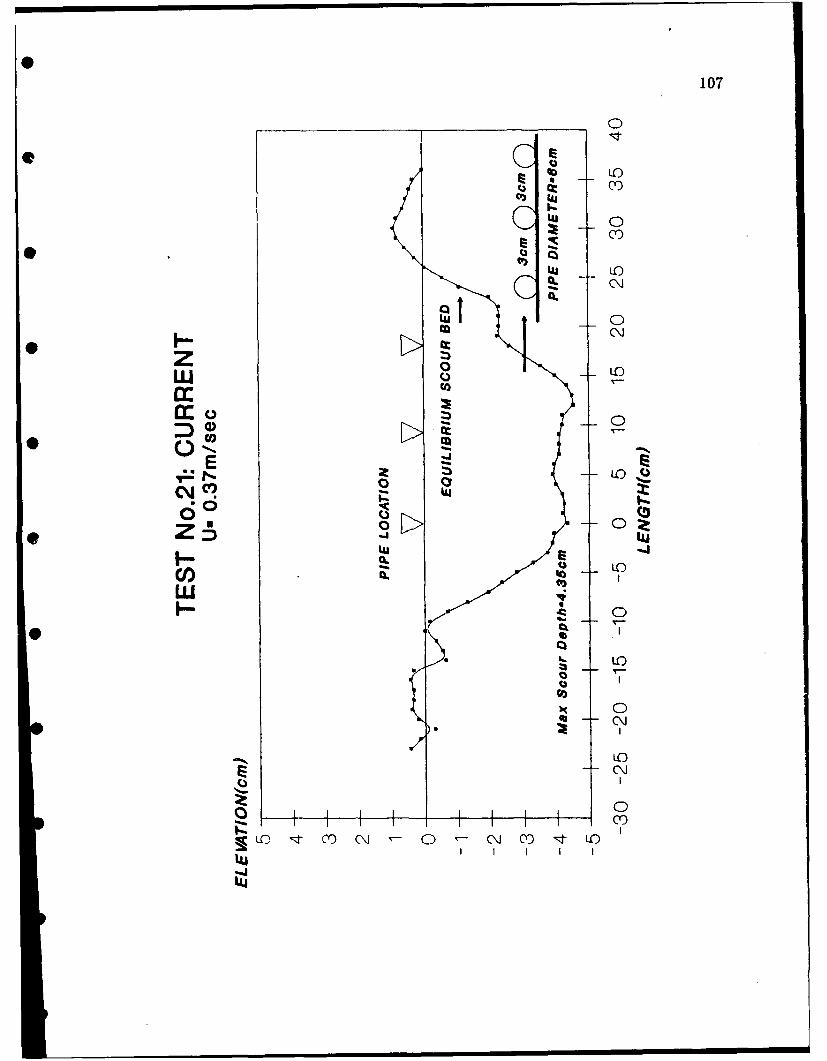
107
LO)
c* 0
C)jc CL
LU 0I-m (Nj
cc 0
L0CE 0z
60> 0 Z
w C?)I-1
0
C\)
0co
S Lo 'T m C~j C~jco -t 0tuC~

108
0)( LO)
Lu
uj 0:1 Cr)
C3C
0
Wu LO
E O%
C' ) LO a
600
LULU ILl
Cl) CL
0
00IC)
0
Ic)
0 f C\4JoC ~ ~ c t L
LU

109
10
c
c Ll 0
cy.1
> Cz
cooz cc
LLJ Z) 0aS
cc4
Ei 81 LoC
60- 0 0-0 ILl
oLL
I- 0
IC)
0c\J
LLO
LU

0
110
00O
S __ 0
00
• S© o
<0 CL
0
Cs
C4J
00
I - I I IJ
> Z
6%% 0
z r-Q)10
0 L0
10
00
(\jLO10 4t Cs) Cj 0 c o Cs t 1O

00
W 10
'C04. 0
6 10cco Coj
coo
CM z z CL
> 10
~mm/ 0
* 0
1-0 i 1 1 1 c
I- Lo- -,-1 om -t 0tC-

112
0 1 10
1- 0
w Lo
R o Q
0
0 O CO
00
6 E-
a0
10I-rn a.
Lo q ,t 0

113
00
I.-
00 C0
(00
QzQ LOCCD
CC 0CDj
wa CLcm i4600
0 0
Cl) LU
o 0
LO
0.0
LO I-CO C'J N- 0o 1:4- C LO
4UI I
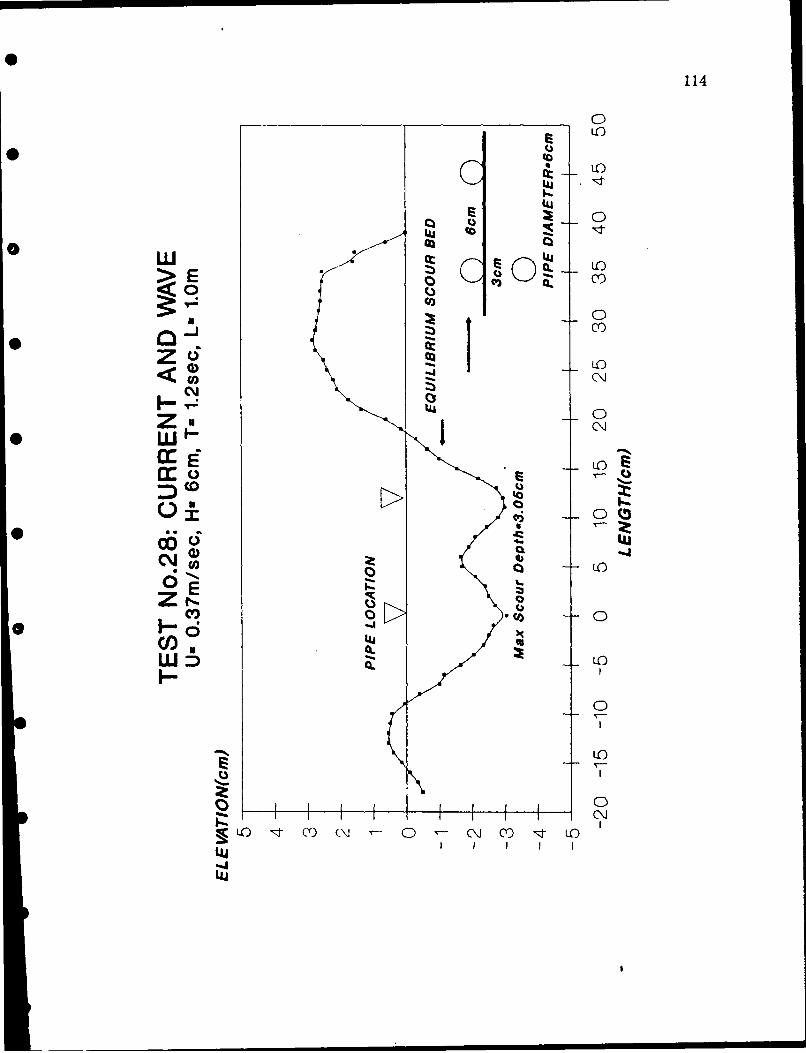
114
0LO)
Lo
UAU0 0
> E 0 a
0
c'cc
1-1- 0LLU
CO WI
00
00
coo.
LO
LuL
LU0
LU~

115
0
LO
I.* t0
C)u()Ii
CCL
to
r 0
SI t
LL
c)E
C
L
SI III0
0
CO)
) -;- co No\J o t L
tu f I
uil

116
0
LO
00
Lo
'U 0Im-
> Eto -<- oI 0<0O
w cc 0
w to
Lo
0 a -0
E CC )
c)F- 0 0
I- to
0090
C".'LO " Cl) N C~ CO t L
4tu(N

117
01O
II1
10
u I U$ 00
oLEj 0
10 c
oo 0
Cl) J'
W IIJ 1
I--4cr~LO
0C
VII
0
uCj

118
0 c0
0
Z I IC)
CCM
c1J
%( -- 0
o 0 L0
Zr. Zu LO
10
I-O
Z0
I o" c N co -I- o
4J

119
00LO)
'LO
~tAJ 0
z I)
ix 0 -
cc C\j
E (
6 C>
ZI 0 L
wIX-'Lio
S0
10
(DJ LO t COCN C It LO (D
u1j

120
10
to
LO
> LU
* IC)
W- CD)
CDj
z 0<0 0
cc LOW it
M E0 co
00
4)
0 t0
C)
0C\j
LOC"J
oC Lo __ -t__ 0y ~ o-I oc
44il C
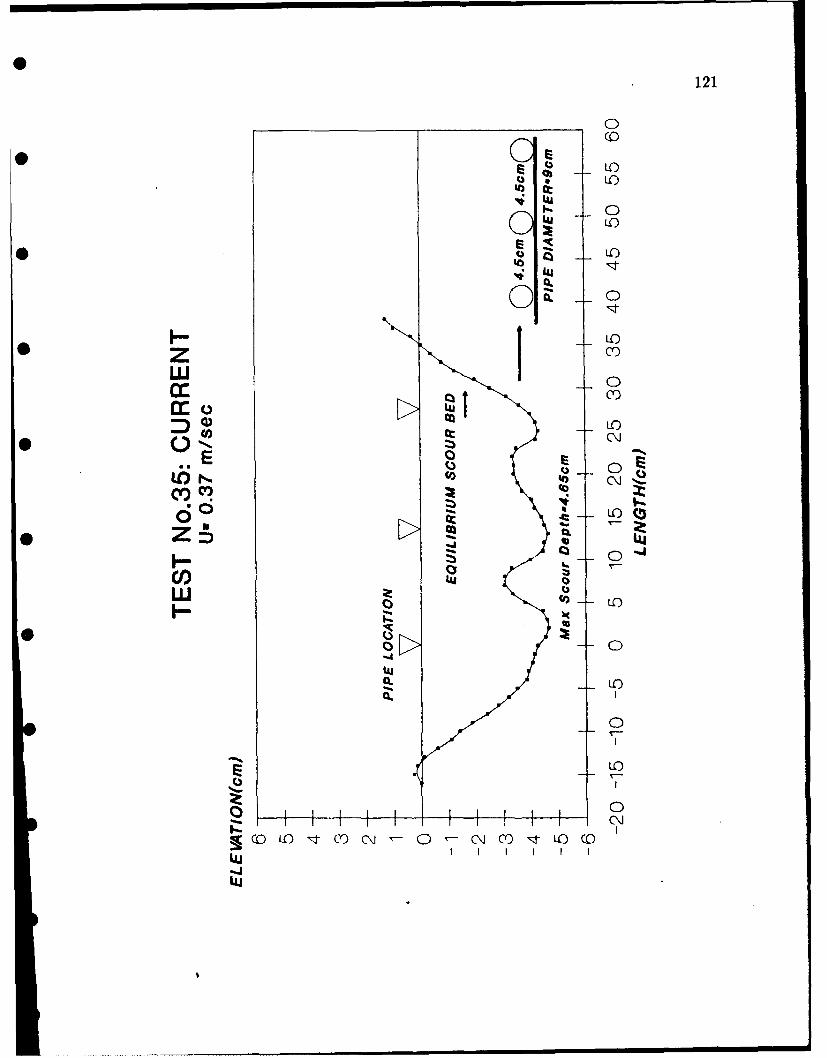
121
0
e IC'0Z'rtW q
01 C0
0i 0
0 1- 0o
zrm 0i
6 0
LC
w I-C 0 0)
Z 0tIJ
0. O
0.O
co_ __ 0 Z Y ~ N m O c
ui
I J I

122
100L
LO
wc tu
< If)
Co)
0
00Zc C"j
zfc 0 0O
CV) > 0
10
010* S .. I L
co -.
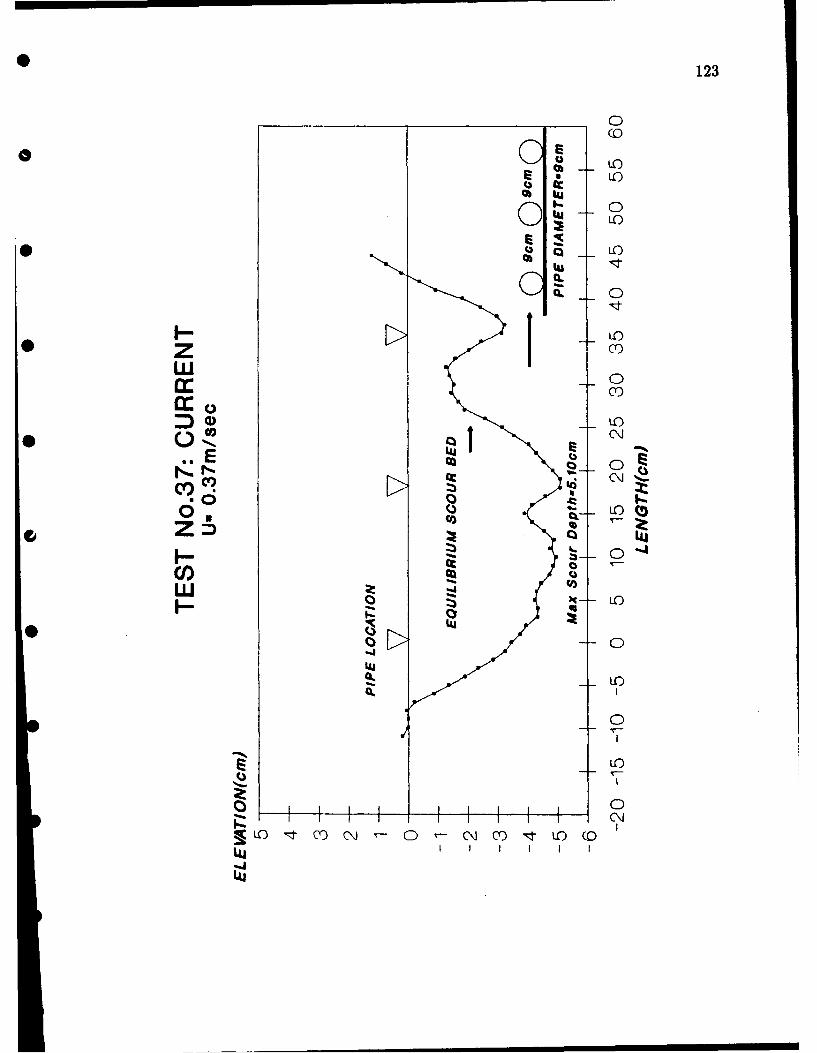
S 123
(0
*o 6
00
*0 Qu 1o
z ItwL 0
z ~Co
w 10
E M 0
600
Co o
* 0
CL
0
10jLO - c SjN.- t O (
ILU

124
F (0
LO)
U, 0
6 .1 LOLU u Z
<0o
aQ
Z LO
wI Coi
I-(A' Coj
OD 0) I)
01
wS'UO
E LO
00iV 4 -
Lo 'tco N ~ j co-I- L
*u I) I
4J0I-

0 125
LO
11 0
ICl
0
cc cr0C,,j
cf)
I..-
W 0
> 10
* 1~ I
10(Cj
-~ I
LU

126
0
10
0 Wu 10
o0 0
0
Z 10*Wi- C\j
cc o I l
a: 1w.WIX
,qt 4) T-
* LOz P0
10
C0 > A C 0
C)c
I u I I
iu

127
C 0)
BE LO
0
LO
0 ix Co
0
zU Coj
CI)to0
litj
6) 00(
LA'O
c L)
0)
I
(3O
4
u

128
0CD
0• inn )
Lo
> E>
• co
II
IJ
00
Z ,O
cc o
CO 0
UU
* QJ tLO
P:J Coj
N% WI O -, o N ( o ,-

129
0(D
LO9) L0
0
QU
1 10
z Co)
w 0
0 1.)C\J
(cfD co 0(eu
.00
w t
I-3I-O
C9)o 0
C to
a 0
§1 "t (Y) N\ 0 C'J C) I- 10
Luj

130
0
C') LOCD)
Z -0*K co
caa
w 0C\jcc)
COV
CMC
00
0- 4--s
w 0 0
3- IAo N B c I-* Q. 0
4V 1
uj0

131
0
I~LU
Z 0
IC)
0. CY)
cr LU
O\j
E
60J (5
* Lv-u
(/) I0w
>J 0
0..0-0) 10 L
Lo0 mf oDCJ~-0 C~j mD -t 10Lu II4U

132
00m~
< (Dw
C4U<0 -
Zn
~CO
Q L0 (
Z o AcmJ t
*- -J -
LO
0Z
iz i -I i i - --5 Lo ;I C - 0 C ~ -o C m ;I Lo
tu

133
00
LU
co I.-t0
coi
cc 0
W M
C0 IxLO
It.I
jCD

134
u LIJ
w IIZ U*w
cmo
0 0
0( 't LW)-J0
4uaj

00
CIO
LUO
cc kto
1*-
w 'U
cc0 >14a)
*E
OCD
so0*u
00
* LUL'U

136
0
0 Lw
LU
> EU
<0 00
C4J
Z
:D 0
01) CI)*6
Z coC4i
C %J L
CL
LI'O
LO coN N c t L

137
*c
C')j
LU LO
z
LLU
CJ-J
C4.
LUU
LLO
I~CL

138
cwcz 0)j
0 h C'\j
w>. 0
INIZN
C T ,
0J caj
ZDCD
C J a:.
"* rE0
110 0t > ~ C * 0cxJ C) t
LuL
Luo

139
0
LO)m
0 0
Iw CMj
z M 0
LO
Ccm
60
ui1~ CL 0
0 LO
0
LO
00
~Lo 't coC j NN '-0 "-M C t Lo)LU I I-JLU

140
00
LU Lu LOC
LIU
> E<0
(DU
zo L
I CIL
* WI-
LO w
00CO0
LO
0 0
Lo co N' o- 0~ co (N '~ t LoLu I-jul

141
00
ci CO
cc 0() c ci C
LCD7L C"j
z 0.
ccicc LOD
cm~
6O ci .
z:5 LOW-J
I- coCl) b0
0~ >.
LLC
00
o 'tCO (Ni C~- 0. ' Ot LoDIujI I I-JWj
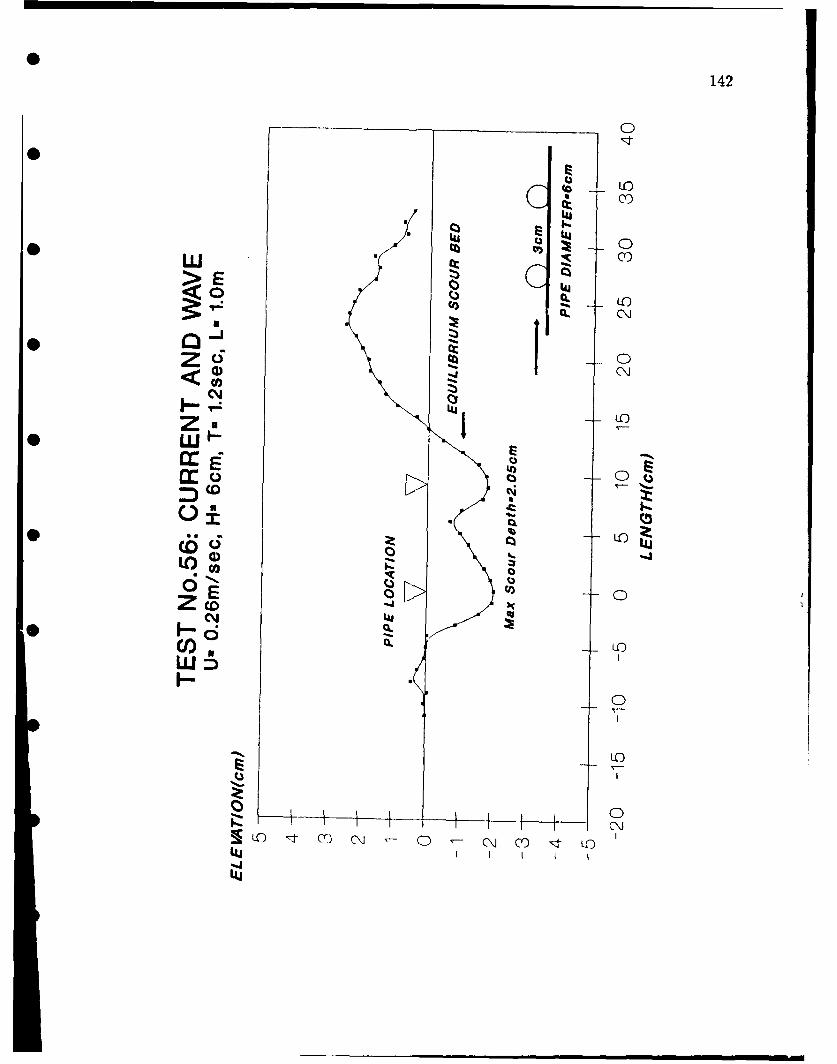
142
0
ILO
coj<0 IdJ
W.ca Z 0
w ct.. c*Qo
c~cc
UU 1O
COC
Et 0(.
~C4
LOG 0 C
CO CL L
10
I-rO
0c
LO 10 0Cj CO -t L
Llu

143
00
LO)
I-.
'LiLO)(NJ
W 0'Lij
cC.)-
60 (5
LC)
Co >
LO
o 0
Lo -,I cy- 07j (N co ,-A Lo

144
00
C3 LU
LU
Cl:)
<0 cc 10Z, !a C~j
UUL
ZO
000
(a (O
00
C3 0
-J cZco
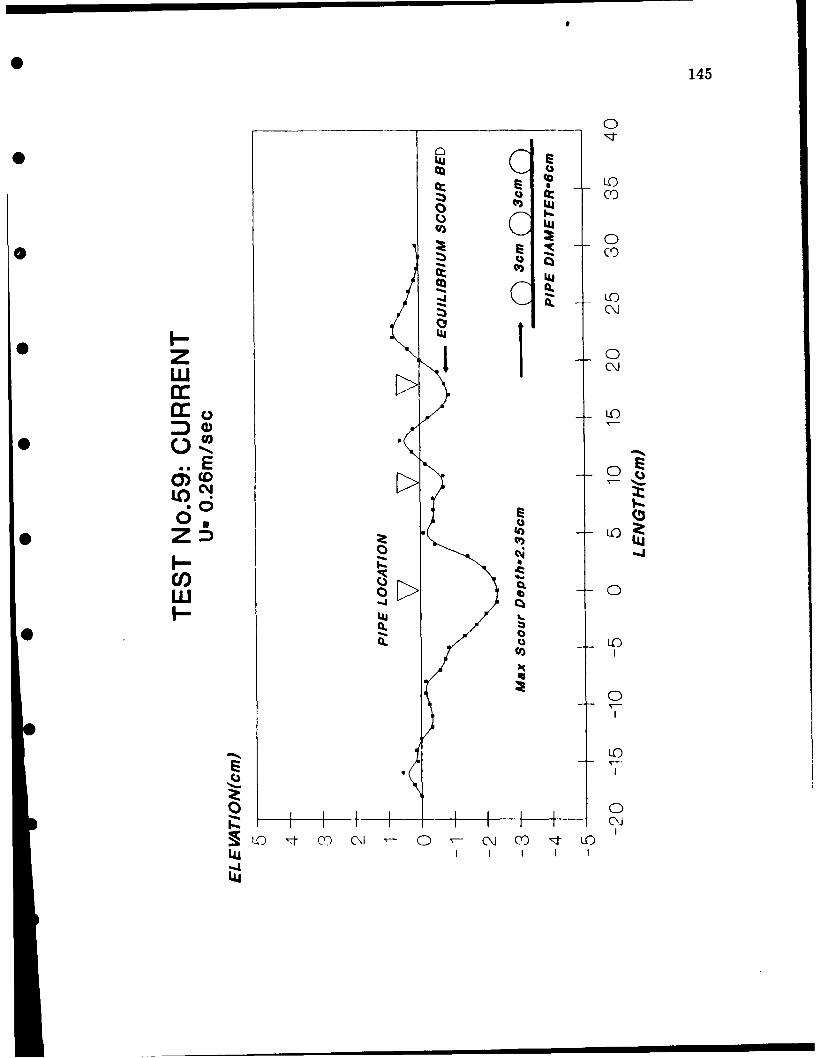
0 145
00
cc LOCo)
0 c LUI
0
* CtLC')l
LLUz 0.
0 co
LOZ
CO Co
LOC~LO
-t co C\ k-c t L
-j
LmU

146
00
0 c L
Q 0
ILO
:rU C~~)
a: o
CJ 0
z co LOZN
CD,
L0
C 0
Z 0
* UU
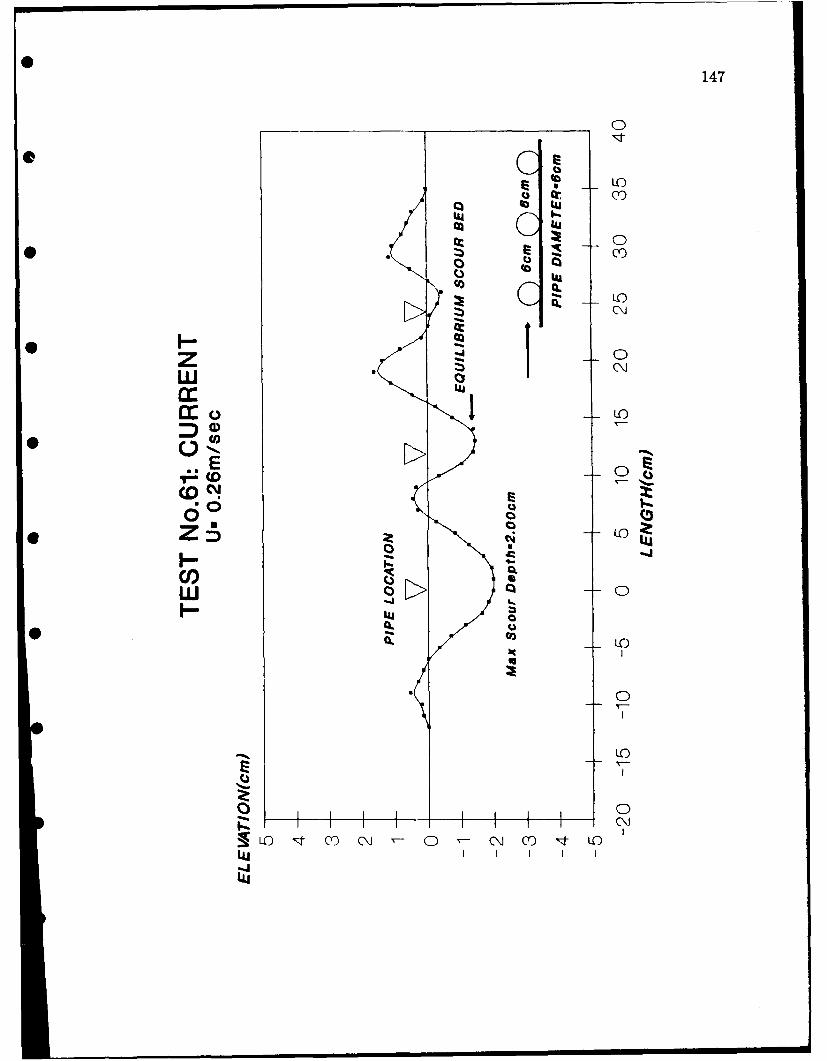
147
_____ ___x 0
Z )YC 3 C
co0 Iij
* CA#00
E- 0
60
0
C,, 0C)~*o q c ~ ~ Y t L

148
0
LO
0
ui tu
<0 Co
00U C) 0O
co Coj
zm 0 0
IL to'
O >0 E0
Z co0 4 k0
CLC
I-oCot0
0
1 0
Z0
LO ~~ m C m t LO
LLALU

149
0
SC
LU
us 0Coo
LOCL a)
c'J 0z CC)
LoLL
cr..
I- LO
* 0CO
0)) Lo
cm 0
1 40 LO
IL) C C ~ 0~-(N0C)~ LO
LA
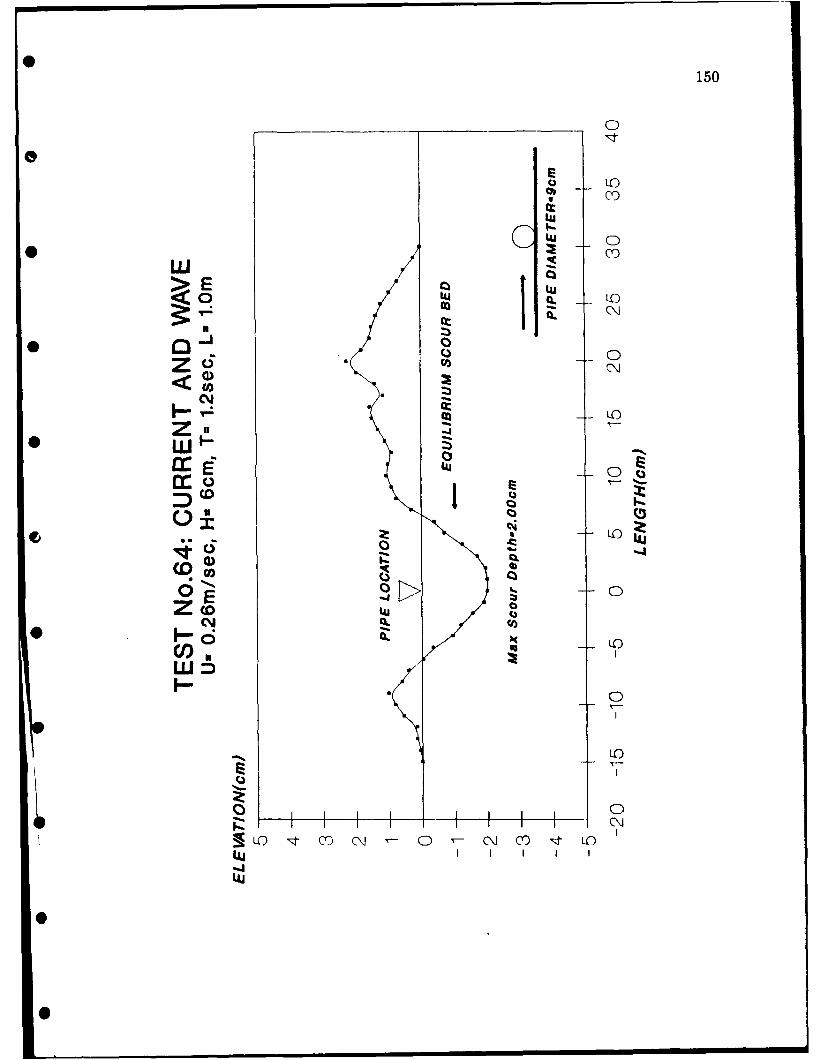
150
0
006 -
C4o
uIi
60 E
z -o
10
-j-C) 0 LOLL

00
0)Cs)
cLU
a. LU
* cc
z ri 0WU (a
ELO co0
60?3ci -)L
*L a 0
0
C~j~Lo -;4 Cs C~J - 0 - C~i Cs 't IC)
u
Sl

152
* C) L
coo
> E 0
Cr)
cc Clj
Zocoi
C 0
ZWI-
4- LL
CCa
CO* 0
C4 tO
Lto -,I CD C\j C- j co~ CD 't LoIuj I I I4J
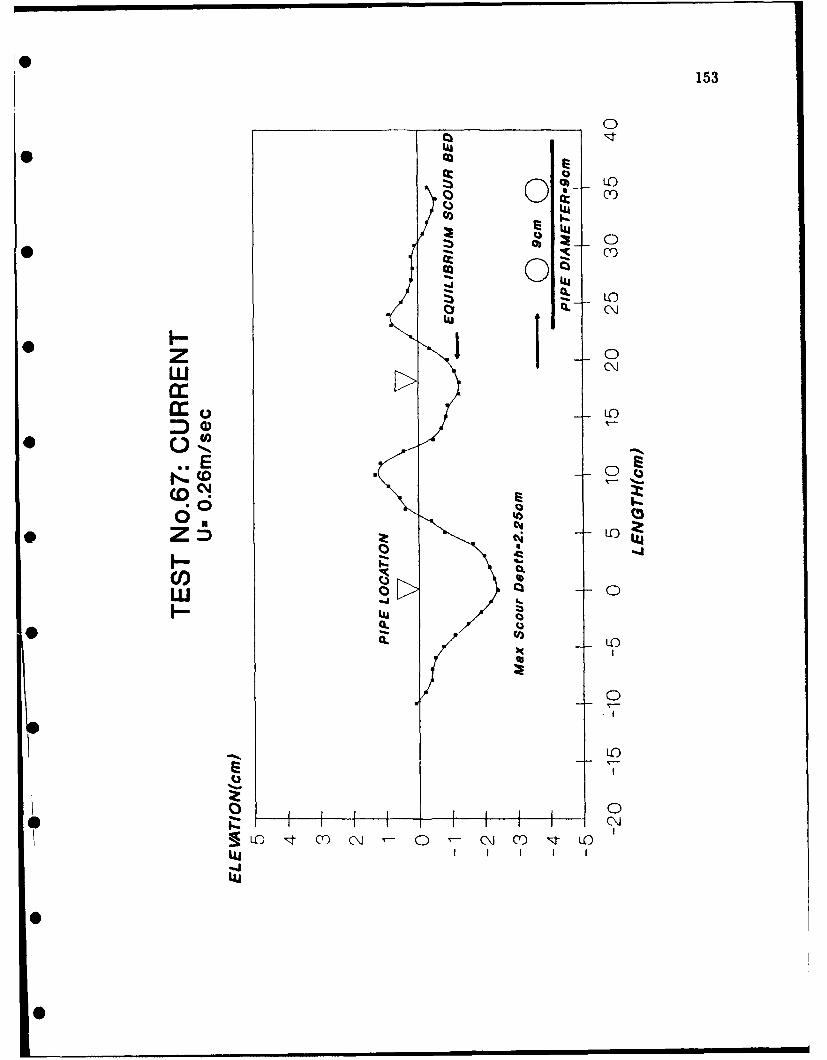
153
0
0 Lu)
0 0~CY)
0 IL C\jLU
* 0
E C.
S00
600
0 ft0
0.* CO
0
~Lo ,t coC~) Lo \ C C
LU

154
(0
0Uif) L
C)Uf
<0 kQ.
-7 0
Z 0 LO
-, I1 ~ 0
0o (5W)I- I 41
co LO
00Cl) 0
0
~Lo t Cr) (N ~-0 N co) '- if)tuJI-4LU

155
taj0
CA U
cc I
w c
6c
-- o
C/) c0
0o 060 oJ a
.
x0
0
~LO 4- mD N - N m- 3- Lo
LU

156
00Co
cc 0 11z - -
0
LlLO
0 ac
0 E0
LLC
F- 0
00Lo -t y) Co \J 0 \J c) "t Lo
LU

157
C3- 0
0 W
(D 0
1 0 o
Lo 't C) \ Jj m t L
U

158
0
LO
0
LLC
U Cs)
0
04
LI)
Zccc
co LO.4. 0 C
E 04
I--
00

0
159
APPENDIX III
* NOTATION
The following symbols are used in this paper:
A = projected area of particle on plane perpendicular to flow;
* c - frictional drag coefficient of sand bed;
Cd drag coefficient;
C, =form coefficient defining effective surface area of particle;
* D pipe diameter;
d, = effective sediment diameter;
ds0 = mean particle diameter;
* Fd drag force on particle;
g gravitational acceleration;
H = wave height;
* h(T) vertical distance from pipe center to bottom of scour hole;
KC = Keulegan-Carpenter Number;
KS = sediment factor;
* L - wave length;
Nfp = pipe Froude Number;
Nrp = pipe Reynolds number;
Ns = sediment Froude Number;
Re = Reynolds Number;
R. = boundary Reynolds Number;
Sd = maximum equilibrium scour depth;
Sf = sand factor:
T = wave period;

160
NOTATION - CONTINUED
C
U = mean local fluid velocity near pipe;
U, = current velocity;
Ud = local velocity at a distance d above the bed;
U, = wave Ursell Number;
= wave velocity;
U10o = fluid velocity at 100 cms above the bed;
C = mean fluid velocity;
[I = turbulent shear velocity;
V, - critical velocity of sediment motion;
w width of trench;
y = water depth;e
Z = depth of interest;
A = relative density of sediment in water;
= distance between pipe and bed;
IL = dynamic viscosity;
v = kinematic viscosity;
p = fluid density;
p, = sediment density;
8 = Shields parameter;
r = shear stress;
-, = critical shear stress; and
r = bed shear stress.
161
VITA
Joseph Henry Westerhorstmann was born in New York City on March 24,
* 1953. In 1980 he graduated from the University of Florida with a Bachelor of
Science in Civil Engineering degree. Upon graduation he was commissioned an
Ensign in the U.S. Navy Civil Engineer Corps, and has remained on active duty
* since that time. He was sent to Texas A&M University by the Navy to study
Ocean Engineering, receiving the Master of Science in Ocean Engineering degree
in December, 1988. He is a Registered Civil Engineer in California. His permanent
* address is Dolphin Point 201, Clear Water, Florida.
0
0
0 . m m .| t


![Backwater and river plume controls on scour …authors.library.caltech.edu/29140/1/Lamb2012p17013J...sediment transport dynamics. [8] Herein, we explore Lane’s [1957] hypothesis](https://img.dokumen.tips/doc/110x75/5f9e1c41dfa4123f593d16e3/backwater-and-river-plume-controls-on-scour-sediment-transport-dynamics-8.jpg)