Embed Size (px)
Citation preview

Wright State University Wright State University
CORE Scholar CORE Scholar
Browse all Theses and Dissertations Theses and Dissertations
2017
The Effect of Gram-Positive Staphylococcus aureus Cell Wall The Effect of Gram-Positive Staphylococcus aureus Cell Wall
Components Lipoteichoic Acid and Peptidoglycan on Cytokine Components Lipoteichoic Acid and Peptidoglycan on Cytokine
production, Cytoskeletal Arrangement, and Cell Viability on RAW production, Cytoskeletal Arrangement, and Cell Viability on RAW
264.7 Murine Macrophages 264.7 Murine Macrophages
Gabrielle String Wright State University
Follow this and additional works at: https://corescholar.libraries.wright.edu/etd_all
Part of the Immunology and Infectious Disease Commons, and the Microbiology Commons
Repository Citation Repository Citation String, Gabrielle, "The Effect of Gram-Positive Staphylococcus aureus Cell Wall Components Lipoteichoic Acid and Peptidoglycan on Cytokine production, Cytoskeletal Arrangement, and Cell Viability on RAW 264.7 Murine Macrophages" (2017). Browse all Theses and Dissertations. 1788. https://corescholar.libraries.wright.edu/etd_all/1788
This Thesis is brought to you for free and open access by the Theses and Dissertations at CORE Scholar. It has been accepted for inclusion in Browse all Theses and Dissertations by an authorized administrator of CORE Scholar. For more information, please contact [email protected].

THE EFFECT OF GRAM-POSITIVE STAPHYLOCOCCUS AUREUS CELL
WALL COMPONENTS LIPOTEICHOIC ACID AND PEPTIDOGLYCAN ON
CYTOKINE PRODUCTION, CYTOSKELETAL ARRANGEMENT, AND CELL
VIABILITY ON RAW264.7 MURINE MACROPHAGES
A thesis submitted in partial fulfillment
of the requirement for the degree of
Master of Science
By
GABRIELLE STRING
B.S., State University of New York at Oswego, 2015
2017
Wright State University

WRIGHT STATE UNIVERSITY GRADUATE SCHOOL
July 27, 2017
I HEREBY RECOMMEND THAT THE THESIS PREPARED UNDER MY SUPERVISION BY Gabrielle String ENTITLED The Effect of Gram-Positive Staphylococcus aureus Cell Wall Components Lipoteichoic Acid and Peptidoglycan on Cytokine Production, Cytoskeletal Arrangement, and Cell Viability on RAW 264.7 Murine Macrophages BE ACCEPTED IN PARTIAL FULFILLMENT OF THE REQUIREMENTS FOR THE DEGREE OF Master of Science.
Nancy J. Bigley, Ph.D. Thesis Director
Committee on Final Examination
Nancy J. Bigley, Ph.D. Professor of Microbiology and Immunology
Barbara E. Hull, Ph.D. Professor of Biological Sciences
Dawn P. Wooley, Ph.D. Associate Professor of Neuroscience, Cell Biology & Physiology
Robert E.W. Fyffe, Ph.D. Vice President of Research and Dean of Graduate School
Barbara E. Hull, Ph.D. Director of Microbiology and Immunology Program, College of Science and Mathematics

iii
ABSTRACT
String, Gabrielle. M.S. Microbiology and Immunology Graduate Program, Wright State University, 2017. The Effect of Gram-Positive Staphylococcus aureus Cell Wall Components Lipoteichoic Acid and Peptidoglycan on Cytokine production, Cytoskeletal Arrangement, and Cell Viability on RAW 264.7 Murine Macrophages.
In this study, gram positive Staphylococcus aureus cell wall components such as
lipoteichoic acid (LTA) and peptidoglycan (PGN) were used to study the potential
inflammatory and anti-inflammatory cytokine response, cytoskeletal arrangement and
cell viability on RAW264.7 murine macrophages over 24 hours. The effect of S.aureus
LTA and PGN (5 µg/mL) on RAW 264.7 macrophages was evaluated every six hours
for twenty-four hours. Inflammatory cytokine (TNF-α) production peaked at 6 hours
before decreasing over time. Anti-inflammatory cytokine (IL-10) production peaked
between 12 and 18 hours. During the first twenty-four hours, cytotoxicity of treated
macrophages, as defined as the release of lactate dehydrogenase, did not increase
suggesting the drop in inflammatory cytokine production was not due to cell death. As
exposure to S.aureus cell wall components increased over twenty-four hours, cells
transformed from a circular-profile M1 phenotype to a more elongated M2 phenotype.
The results of this study indicate that the inflammatory response to S.aureus peaks early
at 6 hours before being modulated by production of anti-inflammatory IL-10 later at 12 to
18 hours.
iv
TABLE OF CONTENTS INTRODCUTION………………….………….………………………………………… 1
HYPOTHESIS…………………………………………………………………………... 6
LITERATURE REVIEW ………………...…………......…………………………...….. 7
Gram-Positive Bacteria ……..…………………………………………………… 7
Course of Infection ………………...…………………………...……………….. 7
Peptidoglycan ……………………………………………………………………. 8
Lipoteichoic Acid ……………………………………………..…………………. 9
Cytokines ……………………………………………………...……………….. 10
Tumor Necrosis Factor-α …………………………………………...………..… 10
Interleukin-10 ………………………………………………………..…………. 11
Cytokine Secretion ………………………………………………………..……. 12
Intracellular Flow Cytometry ………….……………………………………….. 13
Cytoskeleton ………………………………………………………………...…. 15
Immunofluorescence ………...…………………………………………………..16
Cytotoxicity ……………………………………………………………….……..17
MATERIALS AND METHODS ……………………………………….…….…………19
Cell Culture ………………………………………………………………..…… 19
Cell Viability …………………………………………………………………… 19
Cell Treatments ……………………………………………………..………….. 20
Flow Cytometry ………………………………………………………………... 21
v
Histogram Analysis ……………………………………………………………. 23
Immunofluorescence Staining …………………………………………………. 23
Image Analysis …………………………………………………………………. 25
Cytotoxicity …………………………………………………………………….. 25
Statistical Analysis …………………………………………………………...… 26
RESULTS ……………………………………………………………………………… 27
DISCUSSION ……………………………………………………………………….…. 30
FUTURE STUDIES …………………………………………………………………… 34
CONCLUSION ………………………………………………………………………… 37
FIGURES…………………………………………….…………………………………. 38
REFERENCES ………………………………………………………………..……….. 52
APPENDIX …………………………………………………………………………….. 60

vi
LIST OF FIGURES
FIGURE 1: Structure of S.aureus peptidoglycan and lipoteichoic acid …………...….. 38
FIGURE 2: IL-10 Regulation ……………………………………………….……...…. 39
FIGURE 3: Peptidoglycan macrophage activation via NOD signaling ……………..... 40
FIGURE 4: Lipoteichoic acid activates macrophages via TLR-2 signaling ………….. 41
FIGURE 5: CD11b macrophage marker confirming cell type ……………………….. 42
FIGURE 6: Comparison of intracellular TNF-α production over 24 hours ………….. 43
FIGURE 7: Cell morphology of RAW264.7 macrophages after 6 hours of exposure to
S.aureus cell wall components ……………………………………………………….… 44
FIGURE 8: Cell morphology of RAW264.7 macrophages after 12 hours of exposure to
S.aureus cell wall components ……………………………………………………….… 45
FIGURE 9: Cell morphology of RAW264.7 macrophages after 18 hours of exposure to
S.aureus cell wall components ……………………………………………………….… 46
FIGURE 10: Cell morphology of RAW264.7 macrophages after 24 hours of exposure to
S.aureus cell wall components ……………………………………………………….… 47
FIGURE 11: Comparison of intracellular IL-10 production over 24 hours ……..….… 48
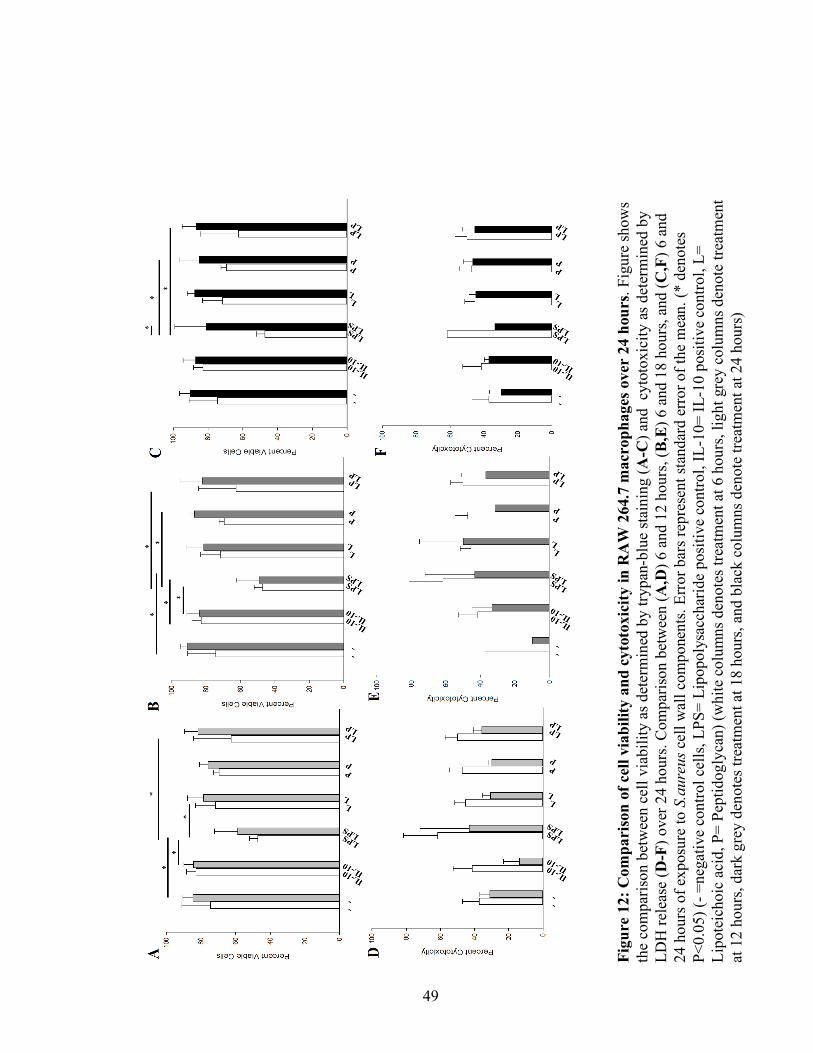
FIGURE 12: Comparison of cell viability and cytotoxicity in RAW264.7 macrophages
over 24 hours………………………………………………………….……..………….. 49
FIGURE 13: Comparison of α-β tubulin intensity in RAW264.7 macrophages over 24
hours …………………………………………………………………………………… 50

vii
FIGURE 14: Comparison of phallodin labeled F-actin intensity in RAW264.7
macrophages over 24 hours ……………………………………….…………………... 51
Appendix Figure 1: Cumulative intracellular TNF-α production in RAW264.7
macrophages over 24 hours ……………………………………………………….……60
Appendix Figure 2: Intracellular TNF-α production in RAW264.7 macrophages from 6
to 24 hours ……………………………………………………….…………………..… 61
Appendix Figure 3: IL-10 positive control cytokine production ……………...……… 62
Appendix Figure 4: IL-10 Cytokine production by RAW264.7 macrophages over 24
hours ……………………………………………………….…………………………… 63
Appendix Figure 5: Intracellular IL-10 Cytokine Production in RAW264.7 macrophages
from 6 to 24 hours ……………………………………………………….……………... 64
Appendix Figure 6: Cumulative F-Actin Intensity in RAW264.7 macrophages after
treatment of S.aureus components over 24 hours …………………………………...…. 65
Appendix Figure 7: Cumulative α-β Tubulin Intensity in RAW264.7 macrophages after
treatment of S.aureus components over 24 hours ……………………………………… 65
Appendix Figure 8: Cumulative Cytotoxicity in RAW264.7 macrophages after treatment
with S.aureus components over 24 hours ……………………………………………… 67
Appendix Figure 9: Cumulative cell viability in RAW264.7 macrophages after
treatment with S.aureus components over 24 hours …………………………………… 68

viii
LIST OF TABLES
TABLE 1: Table showing control and experimental treatment of S.aureus cell wall
components …………………………………………………………………………….. 21
TABLE 2: Table showing antibody concentration/dilutions for Flow Cytometry and
Immunofluorescence ……………………………………………………..………….…. 22
ix
LIST OF EQUATIONS
EQUATION 1: Equation used to determine the concentration of viable cells within a
culture …………………………………..……………………………………………… 20
EQUATION 2: Equation used to convert raw optical density to percent cytotoxicity... 26
x
List of Abbreviations
BFA - Bredeilden A solution
BSA - Bovine serum albumin
CA - Community-associated
CARMA1 - Caspase recruitment domain-containing membrane associated guanylate
kinase 1
CD – Cluster of differentiation
dADO – 2’ Deoxyadenosine
DMEM – Dulbecco’s modified eagle’s medium
DUSP1 – Dual-specificity protein phosphatase 1
ELISA – Enzyme-linked immunosorbent assay
FBS – Fetal Bovine Serum
HA – Healthcare-associated
IKKβ – Inhibitor of nuclear Factor-κB kinase Subunit β
IL-10 – Interleukin-10
JAK – Janus kinase
LDH – Lactate dehydrogenase
LPS – Lipopolysaccharide
LTA – Lipoteichoic acid
MHC – Major histocompatibility complex
MVs – Membrane vesicles

xi
MYD88- Myeloid differentiation primary response gene 88
NETs – Neutrophil extracellular traps
NK-κB – Nuclear factor–κB
NOD – Nucleotide-binding oligomerization domain-like receptors
PBS – Phosphate buffered saline
PGN – Peptidoglycan
RICK – Receptor-interacting serine/threonine kinase
S.aureus – Staphylococcus aureus
SCV – Small colony variants
STAT- Signal transducer and activator of transcription proteins
TAK-1 – Mitogen-activated protein kinase-kinase-kinase-7
TLR – Toll-like receptor
TNF-α – Tumor necrosis factor-α

xii
ACKNOWLEDGEMENT
I would like to thank Dr. Nancy Bigley for her support and advice in the completion of
my project. I would also like to thank Dr. Barbara Hull for her guidance and suggestions
in the completion of my project; I would also like to thank Dr. Dawn Wooley for her
advice in finishing my thesis. I greatly appreciate all of your advice and for being on my
committee. A very large thank you to my friends for their support, assistance, and
laughter when the stress appeared too great to handle. Lastly, I would like to thank my
family for supporting my decision to continue my education and move far away from
home to do so. I would not have been able to complete this thesis without the advice and
support from everyone.

1
I. INTRODUCTION
Staphylococcus aureus (S.aureus) is a gram-positive opportunistic pathogenic bacterium
found in nasal flora of approximately 60% of the human population. In a given
individual, S.aureus is able to exist as part of the normal flora without causing harm to its
host (Fournier and Philpott, 2005). The strain colonized in the individual neonates and
becomes part of that person's normal flora (Shinefeild & Ruff, 2009). S.aureus is also
found in skin (Shinefeild & Ruff, 2009). Unfortunately, transmission of S.aureus from its
typical flora environment to a new environment, such as a wound or surgical site, has
been known to cause severe infections, and possibly death. Originally, S.aureus
infections were treated using β-lactam antibiotics (Naimi et al., 2005). Unfortunately,
antibiotic resistance has greatly increased in S.aureus strains (Naimi et al., 2005). This
resistance makes understanding the body’s immune response to S.aureus infections
critical to combat infections and increase awareness.
Penicillin was widely used during World-War II to prevent infections from warfield
surgical sites (Ventola, 2015). Shortly following the introduction of penicillin, resistant
S.aureus strains were discovered (Ventola, 2015). New β-lactam antibiotics were
discovered, including methicillin in 1960 (Ventola, 2015). Unfortunately by 1962, the
first strain of S.aureus to be resistant to methicillin emerged in a hospital (Ventola, 2015).
Many other antibiotics, such as vancomycin and linezolid, have emerged as possible

2
treatments for resistant strains of S.aureus (Ventola, 2015). Scientists and antibiotic
resistant bacteria seem to be playing a game of cat and mouse, as a new antibiotic
emerges, a resistant strain emerges shortly after. The emergence of antibiotic resistance is
due to antibiotic resistant plasmids, such as Cmec, transferring from other resistant
bacteria via horizontal gene transfer (David & Daum, 2010). Recently, vancomycin
resistant strains of s.aureus have emerged, vancomycin was previously known as the drug
of last resort when it comes to treating staphylococcal infections (Ventola, 2015).
Staphylococcus aureus infections are classified in two ways: healthcare-associated (HA)
or community-associated (CA) (David & Daum, 2010). CA S.aureus strains are classified
as strains which cause infections in individuals who are not associated with the health
care system, such as people who are not immunocompromised (David & Daum, 2010).
HA S.aureus strains commonly cause infections in people who are immunocompromised,
for example after surgery or in a wound care facility (David & Daum, 2010). CA strains
typically infect younger individuals, while HA strains tend to infect older,
immunocompromised individuals (David & Daum, 2010). Virulence of HA and CA
strains differ; HA strains of S.aureus typically include an entire cassette of the methicillin
resistance gene, whereas CA strains typically carry smaller fragments (David & Daum,
2010).

3
Staphylococcus aureus possesses many features to evade the immune response triggered
in its host. Almost immediately following S.aureus infection, macrophages phagocytize
the bacteria and initiate the immune responses (Foster, 2005). However, select S.aureus
strains are resistant to phagocytosis by macrophages. Many staphylococcal anti-
phagocytic factors include Protein A, Clumping Factor A, and a capsule which make
phagocytosis by macrophages difficult (Foster, 2005). When phagocytosis of certain
strains occurs, S.aureus has the ability to survive inside macrophages as Small Colony
Variants (SCV) (Eiff et al., 2006). SCVs may lie dormant inside a cell, replicating
slowly, and may cause chronic (Eiff et al, 2006). SCVs are capable of moving into host
cells, and have caused chronic infections as well as several diseases such as osteomyelitis
(Eiff et al., 2006).
S.aureus secretes chemotaxic inhibitor proteins which prevent neutrophil migration from
the blood to the site of infection Foster, 2005). Approximately 60% of S.aureus strains
secrete chemotaxis inhibitory protein. Characterized by the binding of the formyl peptide
receptor and the C5a receptor, this binding is responsible for inhibiting chemotaxis
(Foster, 2005). C5a is essential to the complement innate immune response (Foster,
2005). Several strains of S.aureus also have the ability to produce toxins which can
destroy leukocytes (Foster, 2005). Cytolytic toxins have a high affinity for leukocytes.
Once the toxin finds a leukocyte, it forms a β-barrel in the cytoplasmic membrane which

4
will eventually cause the cell to burst (Otto, 2014). Recently, the cytolytic toxins have
been highly associated with CA S.aureus infections (Foster, 2005).
A macrophage is considered a professional phagocytic cell, meaning that the macrophage
surface expresses many different receptors which will assist in recognition of pathogens
(Duque and Descoteaux, 2014). The primary role of macrophages is to recognize and
engulf pathogens (Duque and Descoteaux, 2014). Essentially, macrophages display three
phenotypic subtypes: M0, M1, and M2 (Duque and Descoteaux, 2014). M0 macrophages
are un-polarized, meaning they are not yet inflammatory or anti-inflammatory (Duque
and Descoteaux, 2014). Typically, an M0 macrophage, also known as a monocyte, is
found as an inactivated cell in the blood of an individual (Duque and Descoteaux, 2014).
Depending upon the activating substance, a macrophage may polarize into either an M1
or an M2 phenotype. M1 macrophages are pro-inflammatory macrophages induced
activation by inflammatory cytokines such as Lipopolysaccharide and Interferon-γ
(Duque and Descoteaux, 2014). M2 macrophages are anti-inflammatory, induced
activation by Interleukin-10, Interleukin-4, and Interleukin-13 (Duque and Descoteaux,
2014). In the body, inflammatory cytokines attract more cells to the area to help combat
the infection, whereas anti-inflammatory cytokines prevent inflammation and are
involved in tissue repair (Duque and Descoteaux, 2014). The balance is important to
combat infection without causing further harm to the host.
5
In addition to tactics to evade the innate immune system, toxigenic strains of S.aureus
poses the capability to produce superantigens. Approximately 1 to 2 weeks after
infection, S.aureus produces superantigens that are capable of activating up to 30% of T
cells to induce a massive cytokine response (Lin and Peterson, 2010). The massive
cytokine response causes cell death as well as additional clinical symptoms such as fever,
rash, and multi-organ failure (Lin and Peterson, 2010). The emergence of multi-antibiotic
resistant S.aureus, highlights the importance of a vaccine to increase the innate clearance
of S.aureus prior to the production of superantigens.

6
II. HYPOTHESIS
RAW264.7 murine macrophages when exposed to gram-positive Staphylococcus aureus
cell wall components lipoteichoic acid and peptidoglycan will induce changes in cell
viability, cytokine production, and cytoskeletal arrangement over twenty-four hours. I
predict that as the exposure time to the S.aureus components increases, the anti-
inflammatory cytokine production will increase, whereas the pro-inflammatory cytokine
production will decrease. As exposure to S.aureus components increases, macrophages
will exhibit an elongated phenotype over time. Lastly, I predict that cytotoxicity will not
increase and cell viability will not decrease as S.aureus components lack a toxin and are
not known to cause cell death.
7
III. LITERATURE BACKGROUND
Gram Positive Bacteria
A Gram positive bacterium, like S.aureus, stains a bright purple color as the crystal violet
stain is held in by the thick peptidoglycan layer of the cell wall (Brown et al., 2015). As
reviewed by Brown et al., 2015, the cell wall of S.aureus is fairly simple. Essentially, the
cell wall of S.aureus consists of the gram positive thick layer of peptidoglycan with
teichoic acid, and lipoteichoic acids attached to the cell membrane via a diacylglycerol
linkage (Brown et al., 2015) as shown in figure 1. During infection, the cell wall of
S.aureus will be recognized by the immune system and allows it to be taken up by
macrophages.
Course of Infection
In the event of infection, the immune response is composed of two parts: the innate and
adaptive response. The first twenty-four hours are in part the most important in clearing a
pathogen from the host. Within the first few hours of infection, S.aureus are phagocytized
by phagocytic cells such as macrophages which are circulating in the bloodstream
(Wardenburg et al., 2006). Once the bacteria are phagocytized, macrophages secrete
inflammatory cytokines to recruit neutrophils and other phagocytic cells to the area to
help limit the spread of infection (Wardenburg et al., 2006). These signals are induced by
the binding of pathogen-associated molecule patterns (PAMPs) to receptors such as Toll-
like receptors (TLRs) or nucleotide-binding oligomerization domain-like receptors

8
(NOD) receptors which will then begin transcription of inflammatory cytokines and
chemokines to attract more cells to the area (Wardenburg et al., 2006). Unfortunately, the
inflammation caused by these cytokines may cause tissue damage. As a balance to the
inflammation, an anti-inflammatory response occurs throughout an infection to help
reduce excessive inflammation and reduce the production of inflammatory cytokines
(Frodermann et al., 2011).
Peptidoglycan
Peptidoglycan is the primary component of a gram positive bacterium cell wall. The
peptidoglycan layer of the cell wall defines S.aureus as a gram positive bacterium, as it is
very thick (Girardin et al., 2003). The main difference in gram positive peptidoglycan and
that of gram negative bacteria is in the amino acid makeup of the peptides: gram positive
bacteria have a lysine at the third position, whereas gram negative bacteria have a
diaminopimelic acid (Girardin et al., 2003). S.aureus peptidoglycan consists mostly of N-
acetylglucosamine and N-acetylmuramic acid that are linked together to form a thick,
rigid layer that protects the cell (Girardin et al., 2003).Throughout the life cycle of the
bacteria, the peptidoglycan wall is constantly degraded and synthesized as the cell divides
and persists throughout infection (Girardin et al., 2003).
It was previously believed that peptidoglycan activated the immune response via TLR-2
(Dziarski and Gupta, 2005). Recently, it was discovered that peptidoglycan activates a

9
macrophage via intracellular NOD receptors such as NOD1 and NOD2 (Dziarski and
Gupta, 2005) (Figure 3). Specifically, NOD2 receptors recognize muramyl dipeptide
(MP), whereas NOD1 receptors recognize meso-diaminopimelic acid- containing
peptides- each are peptides present in both gram positive and gram negative bacteria
peptidoglycan (Girardin et al., 2002). In order for a NOD receptor to recognize the
peptidoglycan of S.aureus, the peptidoglycan needs to be inside the cytosol as NOD
receptors are cytosolic (Ratner et al., 2007). As a macrophage degrades S.aureus, the
degraded peptidoglycan from the cell will be recognized by the cytosolic NOD receptor
and this will trigger a signaling cascade to begin transcription of cytokines to initiate an
immune response.
Lipoteichoic Acid
Teichoic acids are a class of gram positive cell wall components, lipoteichoic acid are
common throughout the cell wall of S.aureus (Morath et al., 2002). LTA is an
amphiphilic molecule that is linked to to the cell membrane of S.aureus, commonly
expressed during cell growth, especially during infection and causes a large immune
response in its pure form (Schroder et al., 2003). Generally, gram positive lipoteichoic
acids are composed of diacylgelyerol glycolipids that are covalently coupled to a
polymeric backbone (Schroder et al., 2003). The structure among gram positive LTA
differs slightly amoung species, S.aureus LTA is composed of repeating units of D-
10
alanine and α-D-N-Acetyl glucosamine that are linked to a linear 1-3-
polyglycerophophstae chain (Schroder et al., 2003).
Recently, the immunostimulatory effects of S.aureus LTA have been questioned (Morath
et al., 2002). Most studies were done using heat-killed LTA, and it has been shown to
induce TLR-2 response which activates the transcription factor nuclear factor- κB (NF-
κB) to begin transcription of cytokines and chemokines (Schroder et al., 2003) (Figure 4).
Unfortunately, it is very difficult to purify LTA from S.aureus without contamination by
an endotoxin (Morath et al., 2002). However, when done successfully, purified LTA has
been shown to induce production of both inflammatory and anti-inflammatory cytokines
such as TNF-α, IL-1β, IL-6, and IL-10 in whole blood models (Morath et al., 2002). LTA
exerts a very low immunostimulatory effect when compared to PGN and LPS (Morath et
al., 2002).
Cytokines
Tumor Necrosis Factor α
Once an antigen such as LTA or PGN binds to its receptor and the signaling cascade for
cytokine production occurs, inflammatory cytokines are typically produced first.
Inflammatory cytokines play an important role in the immune response as the cytokines
attract more cells to the area in order to combat infection (Sullivan et al., 2007). The main
inflammatory cytokine produced is tumor necrosis factor α (TNF-α); TNF-α plays a

11
crucial role in the acute response to infection by a pathogen as it is produced rapidly
(Sullivan et al., 2007). Macrophages, cluster of differentiation (CD)-4 T-helper-1, and
CD8 cells cells are the primary producers of TNF-α, which stimulate other cells
throughout an infection (Sullivan et al., 2007). TNF-α production is primarily studied
using LPS treatment as LPS is known to produce a strong inflammatory response
(Sullivan et al., 2007). The production of TNF-α is dependent on transcription and
specific splicing of regulatory elements such as the TNF-α-converting enzyme which
helps control the overexpression of the inflammatory cytokine (Sullivan et al., 2007).
Although the TNF-α-converting helps to regulate the expression of TNF-α, the
mechanism by which it does so is not very well understood (Sullivan et al., 2007). Other
factors that regulate the production of TNF-α include other cytokines such as the
inflammatory cytokine IL-10 (Pengal et al., 2006).
Interleukin 10
In order to balance the immune response, anti-inflammatory cytokines such as Interleukin
10 (IL-10) are produced to protect the host from tissue damage that may be caused by
excess inflammation (Frodermann et al., 2011). IL-10 is primarily produced by innate
immune cells such as macrophages and natural killer cells. However as infection persists,
it may be produced by T-cells and B-cells (Verma et al., 2016). IL-10 is important during
infection as it can regulate other cytokines. For example, it may inhibit the production of
inflammatory cytokines (Hasko et al., 1996).

12
IL-10 functions in an autocrine manner, regulating its own production. In macrophages,
IL-10 is recognized by the IL-10 receptor which then begins a signaling cascade for the
amplification of IL-10 production (Shinohara et al., 2014). The amplification of IL-10
involves transforming growth factor-β-activated kinase-1 (TAK1), inhibitor of nuclear
factor kappa-B subunit β (IKKB) and caspase recruitment domain-containing protein 11
(CARMA1) to act like an “on switch” for NF-KB signaling (Shinohara et al., 2014). One
molecule of IL-10 amplifies its own production, creating a positive feedback loop
(Shinohara et al., 2014). However, once the concentration of IL-10 is great enough,
negative feedback occurs. As reviewed by Saraiva and O’Garra, 2010, at a high
concentration of IL-10, dual-specificity protein phosphatase 1 (DUSP1) is induced which
regulates P38 phosphorylation and will inhibit IL-10 production (Saraiva and O’Garra,
2010) (Figure 2). This is a way for the immune system to regulate itself to prevent future
damage and disease.
Cytokine Secretion
After transcription of cytokines occurs, the synthesis and excretion of cytokines from the
cell is similar to how most cells produce proteins. After synthesis, cytokines are collected
in the Golgi complex before movement out of the cell (Murray et al., 2005). Unlike some
proteins, cytokines are not synthesized and stored into granules before being released
from the cell (Murray et al., 2005). Cytokines are released in a rapid process that is

13
limited by the expression of soluble N-ethylmaleimide sensitive fusion (NSF) attachment
proteins (SNAREs), which are involved in the fusion of vesicles to the macrophage cell
wall (Murray et al., 2005). As SNARE expression is increased, the rate of cytokine
secretion increases (Murray et al., 2005). Cytokines collect at the Golgi complex before
vesicles are formed to transport cytokines from the cell (Murray et al., 2005).
Intracellular Flow Cytometry
Flow cytometry is an efficient way to measure several characteristics of cells during a
S.aureus infection. In previous studies, intracellular cytokines such as TNF-α and
Interleukin-8 were measured after treatment with S.aureus LTA (Aulock et al., 2003).
Aulock and colleagues focused their study on monocytes isolated from female C57BL/6
mice (Aulock et al., 2003). In this study, flow cytometry was used to measure cytokine
levels in arbitrary units followed by quantification by ELISA (Aulock et al., 2003). In
initial experiments, Aulock and colleagues exposed monocytes to S.aureus LTA for a
time period of 30 minutes and 4 hours at a concentration of 10 µg/mL before examination
by flow cytometry (Aulock et al., 2003). 10 µg/mL of LPS and LTA induced similar
levels of TNF-α and IL-8 after five hours (Aulock et al., 2003). Using ELISA, TNF-α,
IL-8 and IFN-γ secretion was measured over 24 hours after exposure to various
concentrations of S.aureus bacteria, S.aureus LTA, E.coli bacteria, and E.coli LPS
(Aulock et al., 2003). The findings of this study suggests that S.aureus LTA has very
different qualities than E.coli LPS. Unlike suggestions of earlier studies, LTA may

14
induce large quantities of chemoattractants, but does not strongly activate neutrophils and
other innate immune cells (Aulock et al., 2003). Aulock and colleagues concluded that
S.aureus LTA plays an important role in recruitment of innate immune cells to the area of
infection, and it causes macrophages to secrete cytokines (Aulock et al., 2003).
In several previous studies, flow cytometry has been used to study phagocytosis of
S.aureus by macrophages (Deshmukh et al., 2008). Deshmukh and colleagues labeled
S.aureus with Alexa 344 before exposing them to bone-marrow macrophages for thirty
minutes (Deshmukh et al., 2008). Throughout infection, macrophages engulf bacteria,
such as S.aureus, before degrading the pathogens initiating a response via NOD signaling
inside the cell (Deshmukh et al., 2008). This study used wild-type and NOD knock out
mice to observe the role that NOD signaling plays in phagocytosis and cytokine
production (Deshmukh et al., 2008). Intracellular flow cytometry was used to measure
fluorescence intensity which corresponded to the amount of S.aureus that had been
phagocytized by each cell (Deshmukh et al., 2008). The phagocytosis assay showed that
NOD knockout mice had a significant decrease in S.aureus phagocytosis in both bone-
marrow derived neutrophils and macrophages (Deshmukh et al., 2008). Unfortunately,
Deshmukh and colleagues did not use flow cytometry to determine cytokine production.
An enzyme-linked immunosorbent assay (ELISA) was used to observe cytokine
production. The levels of TNF-α in NOD knockout mice were slightly increased, levels
of IL-10 did not differ from control mice (Deshmukh et al., 2008).
15
Cytoskeleton
The cytoskeleton of a macrophage plays a large role in cell mobility and function. When
macrophages are activated into either the M1 or M2, they express different degrees of
elongation (McWhorter et al, 2013). While both phenotypes are elongated, M2
macrophages were shown to have an increased elongation when compared to M1
(McWhorter at el., 2013). Macrophage microtubules are composed of alternating units of
α- and β-tubulin (Robinson and Vandre, 1995). Macrophage microtubules rapidly
depolymerize as most microtubules have a half life ranging from five to fifteen minutes
(Robinson and Vandre, 1995). Additionally, microtubules are regulated by extracellular
signals, such as inflammatory or anti-inflammatory cytokines which allow the
microtubules to respond by changing the cell morphology (Robinson and Vandre, 1995).
Microtubules are typically more stable once acetylated (Binker et al.,2007). When
macrophages are polarized to the M1 phenotype, more acetylated α-tubulin has been
observed (Binker et al., 2007). Increased acetylated tubules indicates that the macrophage
microtubules are more stable (Binker et al., 2007).
Another primary cytoskeletal component important in macrophages during infection is
actin. Actin is a primary component in many eukaryotic cells, including murine
macrophages (Dominguez and Holmes, 2011). As reviewed by Jiang and colleagues, the
structure of F-actin was shown to be two tightly twisted strands of pre-polarized F-actin
forming a helical polar filament (Jiang et al., 2016). In macrophages, actin plays a

16
primary role in phagocytosis, phagosome formation, as well as fusion events (McWhorter
et al., 2013).
When actin polymerization is inhibited by drugs, phagocytic function is also inhibited
(McWhorter et al., 2013). Actin plays a primary role in distinguishing M1 and M2
macrophages (McWhorter et al., 2013). In M1, inflammatory macrophages, F-actin has
been shown to cluster around the nucleus; whereas in M2, anti-inflammatory
macrophages, F-actin has been shown to be primarily located around the outer edge of
the cell (Vereyken et al., 2011). Additionally, M2 macrophages have been shown to have
more F-actin present than M1 macrophages, suggesting that actin must be important in
the elongation and adhesion proccesses of macrophages, properties induced by anti-
inflammatory cytokines (McWhorter et al., 2013).
Immunofluorescence
Macrophages are known to have three general phenotypes: M0, M1, and M2 which may
be determined by cytokine production as well as morphology (McWhorter et al., 2013).
In a previous study, levels of F-actin and α-tubulin were studied in both M1 and M2
macrophages (McWhorter et al., 2013). McWhorter and colleagues found that within 24
hours post stimulation, M1 macrophages exhibited a circular profile, whereas M2
macrophages appeared more elongated (McWhorter et al., 2013). Similar to this study,
immunofluorescent staining was done as well as Western blotting to evaluate polarization

17
(McWhorter et al., 2013). Characteristics such as inducible nitric oxide synthase and
arginase-1 were observed via immunofluorescence staining for inflammatory and anti-
inflammatory phenotypes, respectively (McWhorter et al., 2013). The cells which showed
elongation via immunofluorescent staining also exhibited very high inflammatory
cytokines, therefore the authors concluded that anti-inflammatory M2 macrophages
exhibit an elongated phenotype (McWhorter et al, 2013). When macrophages were
transformed into M1 and M2 macrophages, a western blot showed that M1 macrophages
exhibited more α-tubulin than M2 macrophages, whereas M2 macrophages exhibited
more polymerized F-actin (McWhorter et al., 2013). The study done by McWhorter and
colleagues concluded the change in phenotype by macrophages correlates to
inflammatory and anti-inflammatory states when stimulated by cytokines.
Cytotoxicity
S.aureus is known for several virulence factors, such as antibiotic resistance and toxin
production, which allows it to sustain an infection in a host. Several strains of S.aureus
are known to produce toxins which are toxic to host cells, especially S.aureus α-toxin
which is known to kill host immune cells (Valeva et al., 1997). α-toxin is known to form
spontaneous pores in a target cell's membrane (Valeva et al., 1997). In human and rabbit
lymphocytes, a transmembrane β-barrel was formed after exposure to α-toxin (Valeva et
al., 1997). However, human granulocytes are resistant to the pore-forming abilities of the
α-toxin (Valeva et al., 1997). Additionally, S.aureus secrete membrane vesicles (MVs)

18
containing a variety of proteins including Protein A to host cells (Jeon et al., 2016). In a
previous study, Jeon and colleagues had concluded that MVs are responsible for cell
cytotoxicity after treating a HeLA cell line with S.aureus membrane vesicles (Jeon et al.,
2016). As the concentration of MVs increased, the number of living cells decreased (Jeon
et al., 2016). Previous studies have shown that MVs exhibit varying levels of
cytotoxicity in different cell types (Jeon et al., 2016). The differing cytotoxicity levels
may be due to the variety of proteins present in MVs, some host cells may have a
resistance to proteins found in MVs (Jeon et al., 2016; Valeva et al., 1997).

19
IV. MATERIALS AND METHODS
Cell Culture
RAW264.7 murine macrophage cells (ATCC, Manassas, VA) were originally obtained
from Abelson murine leukemia virus-induced tumors in adult male BALB/c mice were
used in this study. The RAW264.7 cell growth pattern is adherent; in order to passage
cells, a small cell scraper (Fisher Scientific, Pittsburgh, PA) was used to remove cells
from the interior of a vented BioLite flask (Fisher Scientific, Pittsburgh, PA). Cells were
passaged three to four times weekly in a medium containing Dulbecco’s Modified
Eagle’s Medium (DMEM), 10% Fetal Bovine Serum (FBS), and 10mM Hepes buffer
before incubation at 5% Carbon dioxide and 37°C with 100% humidity until 60%
confluency is reached. Confluency is estimated via visual observation of the cells growth
on the flask. Macrophage cell type was confirmed by staining for CD11b macrophage
marker, observed by immunofluorescence microscopy (Figure 5).
Cell Viability
Cells were grown to approximately 60% confluency prior to treatment time period. After
each treatment period, cells were removed from the flask. Cells were then resuspended in
10% FBS in DMEM before 10 µL of cell suspension was added to 20uL of trypan blue
(Fisher Scientific, Pittsburgh, PA). To count cells, 10uL were placed onto a
hemacytometer and observed under a microscope at 10x magnification. Cells which are
dead are stained by trypan blue, whereas cells which are alive do not take up the dye. The
20
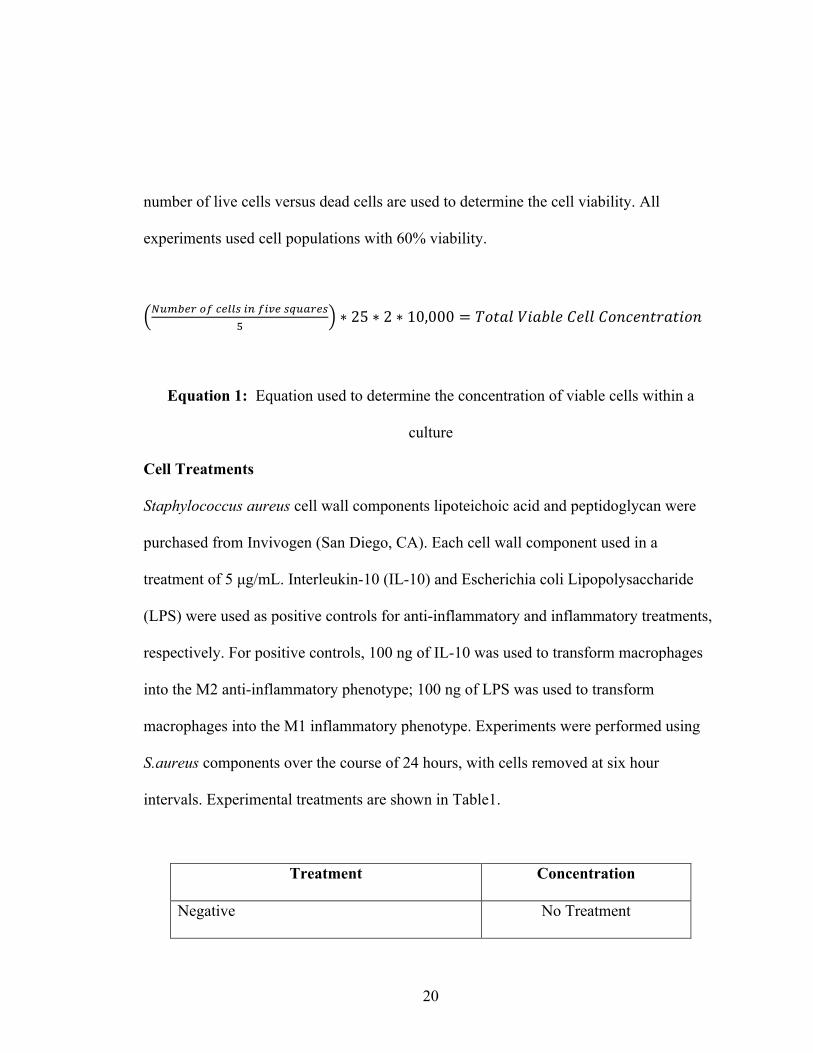
number of live cells versus dead cells are used to determine the cell viability. All
experiments used cell populations with 60% viability.
!"#$%&()*%++,-.)-/%,0"1&%,2
∗ 25 ∗ 2 ∗ 10,000 = 𝑇𝑜𝑡𝑎𝑙𝑉𝑖𝑎𝑏𝑙𝑒𝐶𝑒𝑙𝑙𝐶𝑜𝑛𝑐𝑒𝑛𝑡𝑟𝑎𝑡𝑖𝑜𝑛
Equation 1: Equation used to determine the concentration of viable cells within a
culture
Cell Treatments
Staphylococcus aureus cell wall components lipoteichoic acid and peptidoglycan were
purchased from Invivogen (San Diego, CA). Each cell wall component used in a
treatment of 5 µg/mL. Interleukin-10 (IL-10) and Escherichia coli Lipopolysaccharide
(LPS) were used as positive controls for anti-inflammatory and inflammatory treatments,
respectively. For positive controls, 100 ng of IL-10 was used to transform macrophages
into the M2 anti-inflammatory phenotype; 100 ng of LPS was used to transform
macrophages into the M1 inflammatory phenotype. Experiments were performed using
S.aureus components over the course of 24 hours, with cells removed at six hour
intervals. Experimental treatments are shown in Table1.
Treatment Concentration
Negative No Treatment

21
Interleukin-10 (Positive Control) 100 ng/mL
E.coli Lipopolysaccharide (Positive Control) 100 ng/mL
S.aureus Lipoteichoic Acid 5 µg/mL
S.aureus Peptidoglycan 5 µg/mL
S.aureus Lipoteichoic Acid & Peptidoglycan 5 µg/mL
Table 1: Table showing the treatments for each experimental group
Flow Cytometry
Cells were grown to approximately 60% confluency before treatment S.aureus
experimental groups and controls. Due to the negative feedback loop in the production of
IL-10, RAW264.7 macrophages were treated with 100 ng of IL-10 approximately thirty
minutes prior to running flow cytometry for the positive control treatment. In preliminary
experiments, cells treated with IL-10 for 6 hours or more did not have any intracellular
IL-10 present. Experimental groups had incubation times ranging from six to twenty-four
hours, the appropriate incubation period depended on the total time for the trial. In the
last four hours of incubation, Brefeldin A (BFA) (BioLegend,San Diego, CA) solution
was added to the cells at a concentration of 5 µg/mL. BFA solution inhibits cytokine
secretion out of the cell. After the appropriate treatment period, cells were harvested and
counted via a hemocytometer.

22
Approximately two million cells were placed in microcentrifuge tubes and pelleted via
centrifugation. Cells were fixed with Fixation Buffer (BioLegend,San Diego, CA) for
twenty minutes at room temperature. Following fixation, all samples were washed with
1X Permeabilization Wash Buffer (BioLegend,San Diego, CA) three times at room
temperature. Next, cells were stained with anti-IL-10, anti-TNF-α , or appropriate isotype
controls (Fisher Scientific, Pittsburgh, PA) (Table 2) for twenty minutes at room
temperature. Following staining, samples were washed before resuspension in Cell
Staining Buffer (BioLegend,San Diego, CA) and run on an Accuri C6 Flow Cytometer at
medium speed with a flow rate of 35 µL per minute, and a core size of 16 µm for 50,000
events.
Antibody Concentration/Dilution Company FITC Anti-IL-10 0.25 µg/mL Thermo Scientific, Pittsburgh, PA Rat/ IgG2bκ (IL-10 Isotype)
0.25 µg/mL
Thermo Scientific, Pittsburgh, PA
FITC Anti- TNF-α 0.06 µg/mL Thermo Scientific, Pittsburgh, PA Rat/ IgG1κ (TNF-α Isotype)
0.06 µg/mL Thermo Scientific, Pittsburgh, PA
α - β –Tubulin #2148 (Primary Tubulin Antibody)
1:50 Cell Signaling Technology, Danvers, MA
Anti-Rabbit IgG (H+L), F(ab’)2 Fragment (Alexa Fluor 488 conjugate) (Secondary Tubulin antibody)
1:250 Cell Signaling Technology, Danvers, MA
Texas Red-Phalloidin (F-actin tag)
1:300 Cell Signaling Technology, Danvers, MA

23
Anti- CD11B [M1/70] (Primary Antibody for Macrophage Marker)
5 µg/mL Abcam, San Francisco, CA
Goat Anti-Rat IgG H&L (Alexa Fluor 488) (Secondary Antibody for Macrophage Marker)
2 µg/mL Abcam, San Francisco, CA
Table 2: Table showing the concentration of antibodies used for flow cytometry and
immunofluorescence staining
Histogram Analysis
To analyze the histograms created from the Accuri C6 Flow Cytometer, FCS Express 6
Reader was used. Percent differences were calculated by overlaying each treatment
histogram onto the negative control histogram, using the histogram subtraction tool. This
positive percent difference represents the difference between the number of cytokines
produced by each treatment group and the negative control.
Immunofluorescence Staining
Cells were grown to 60% confluency before approximately 5,000 cells were transferred
to Ibidi 12-well chamber slides (Ibidi USA, Fitchburg, WI) in a final volume of 250 µL
of medium. Cells were incubated in the wells overnight at 37°C to allow attachment to
the slide. After incubation, the old medium was removed and cells treatment was applied
to cells for each experimental time period ranging from six to twenty-four hours (Table

24
1). After each experimental time period, the treatment solution was aspirated and cells
were washed with phosphate buffered saline (PBS) twice before fixation with 4%
paraformaldehyde for 15 minutes at room temperature. Cells which were used for
cytoskeletal staining underwent permeabilization with 0.2% Triton at room temperature
for ten minutes. Following permeabilization, cells were washed with PBS before
treatment with blocking buffer for an hour at room temperature.
Following blocking, cells were washed with 1% Bovine Serum Albumin (BSA) before
primary αβ-tubulin antibody was added to each well. The primary antibody was
incubated at room temperature for one hour. After this incubation, the secondary
fluorescent antibodies for αβ-tubulin was added and was incubated for one hour at room
temperature. After incubation, the cells were washed with 1% BSA. Next, the Texas-Red
phalloidin label for F-actin was added and incubated for one hour. After incubation, the
antibody solution was removed and cells were washed three times with 1% BSA. In
preparation for viewing, the cells were allowed to dry before the silicone well chambers
were removed. Once dry, the cells were imaged on the Olympus Epi Fluorescence Spot
microscope at 465 nm for αβ-tubulin and 565 nm for Phalloidin labeled F-actin at 40x
magnification.

25
Additionally, macrophage classification was determined using immunofluorescence
staining for CD11b (Figure 5), a known macrophage surface marker using the same
method to confirm cell type (Lumeng et al., 2007).
Image Analysis
Image analysis was done using ImageJ software. Raw black and white images were
uploaded into ImageJ. The background fluorescence was subtracted from the image
which allows for the overall mean intensity of the image to be calculated. This mean
fluorescence intensity was then divided by the number of cells in each image to
determine the mean fluorescence intensity per cell.
Cytotoxicity
Cells were grown to 60% confluency before approximately 200,000 cells were treated for
the appropriate experimental group and time point. After each experimental time period,
supernatants were collected from each group and then frozen at -80°C until plated. For
control groups, approximately 200,000 cells were transferred into a 96 well plate
(Corning Incorporated, Corning, NY) containing 200 µL of medium and incubated
overnight for cells to adhere. The maximum release group was treated with 20uL of 10%
Triton X-100 (Cayman Chemical, Ann Arbor, MI), LDH positive controls contained no
cells and only 20uL of LDH, and the spontaneous release group only contained cells with
no additional treatment. In a new 96 well plate, 100 µL of each treatment group was
26
added to each well followed by 100 µL of reaction solution (Cayman Chemical, Ann
Arbor, MI). Wells were incubated at 37°C for twenty minutes before being read on the
Softmax-Pro Plate Reader at 490 nm to determine the optical density of each group.
Percent cytotoxicity was determined using Equation 2.
𝐸𝑥𝑝𝑒𝑟𝑖𝑚𝑒𝑛𝑡𝑎𝑙𝑂𝐷 − 𝑆𝑝𝑜𝑛𝑡𝑎𝑛𝑒𝑜𝑢𝑠𝑂𝐷𝑀𝑎𝑥𝑖𝑚𝑢𝑚𝑅𝑒𝑙𝑠𝑒𝑎𝑠𝑒𝑂𝐷 − (𝑆𝑝𝑜𝑛𝑒𝑡𝑎𝑛𝑒𝑜𝑢𝑠𝑂𝐷)
∗ 100 = %𝐶𝑦𝑡𝑜𝑡𝑜𝑥𝑖𝑐𝑖𝑡𝑦
Equation 2: Equation used to convert raw optical density to percent cytotoxicity
Statistical Analysis
Statistical significance was calculated using a One-Way ANOVA (Sigmaplot13.0); all
experiments were done at least three times. Error bars were calculated using standard
error of the mean.

27
V. RESULTS
Polarized Macrophages Exhibited Morphological Differences and Higher Cytokine
Production When Compared to Control Macrophages
As inflammatory positive controls, RAW264.7 macrophages treated with LPS exhibited
high TNF-α production over each time period as exhibited as percent difference from the
negative control cells (Figure 6). TNF-α production was highest at six hours while
decreasing at each six-hour point over the twenty-four-hour period (Figure 6). The anti-
inflammatory positive control for cytokine production required treatment at a short time
period. RAW264.7 macrophages treated with IL-10 exhibited high IL-10 production after
treatment for thirty minutes (Appendix Figure 3).
When RAW264.7 macrophages were treated with LPS as an inflammatory positive
control, cells exhibited the M1 phenotype with more circular profile with few elongated
cells over 24 hours at 6 hour intervals (Figures 7, 8, 9, 10). When cells were treated with
IL-10 as an anti-inflammatory positive control, cells appeared more elongated as the
treatment time periods progressed (Figures 7, 8, 9, 10). M1 and M2 macrophages both
displayed visible vacuoles and F-actin accumulating around the outside of the cells
(Figures 7, 8, 9, 10).

28
Inflammatory Cytokine Production over 24 Hours
Production of the inflammatory cytokine, TNF-α, was measured by percent differences
from the negative control via flow cytometry. TNF-α production was highest at six hours
before decreasing over six hour intervals until the lowest production at twenty-four hours
(Figure 6). Macrophages treated with LTA produced less TNF-α production, cells treated
with a combination of LTA and PGN produced higher levels of TNF-α production when
compared to treatments with individual S.aureus cell wall components (Figure 6).
Anti-Inflammatory Cytokine Production over 24 Hours
Anti-inflammatory cytokine IL-10 production was measured by percent differences from
the negative control via flow cytometry. IL-10 production was lowest at six hours of
exposure to S.aureus components and increased overtime (Figure 11). Macrophages
treated with LTA produced less IL-10 compared to cells treated with a combination of
LTA and PGN (Figure 11). The highest production of IL-10 was observed between 12
and 18 hours (Figure 11).
Cytotoxicity and Viability of Macrophages After Exposure to S.aureus Components
RAW264.7 macrophages exhibited no significant difference in cytotoxicity over twenty-
four hours of exposure to S.aureus cell wall components when measured by an LDH
Cytotoxicity assay (Figure 12). Cells treated with LPS exhibited higher cytotoxicity but
the percentage was not significant when compared to other treatment groups (Figure 12).

29
When cell viability was measured via trypan-blue staining, LPS positive controls
exhibited a lower percent of viable cells when compared to other groups at each time
period over twenty-four hours (Figure 12). Macrophages when treated with S.aureus cell
wall components exhibited lower percentages of viable cells, however not at a significant
level when compared to negative controls (Figure 12).
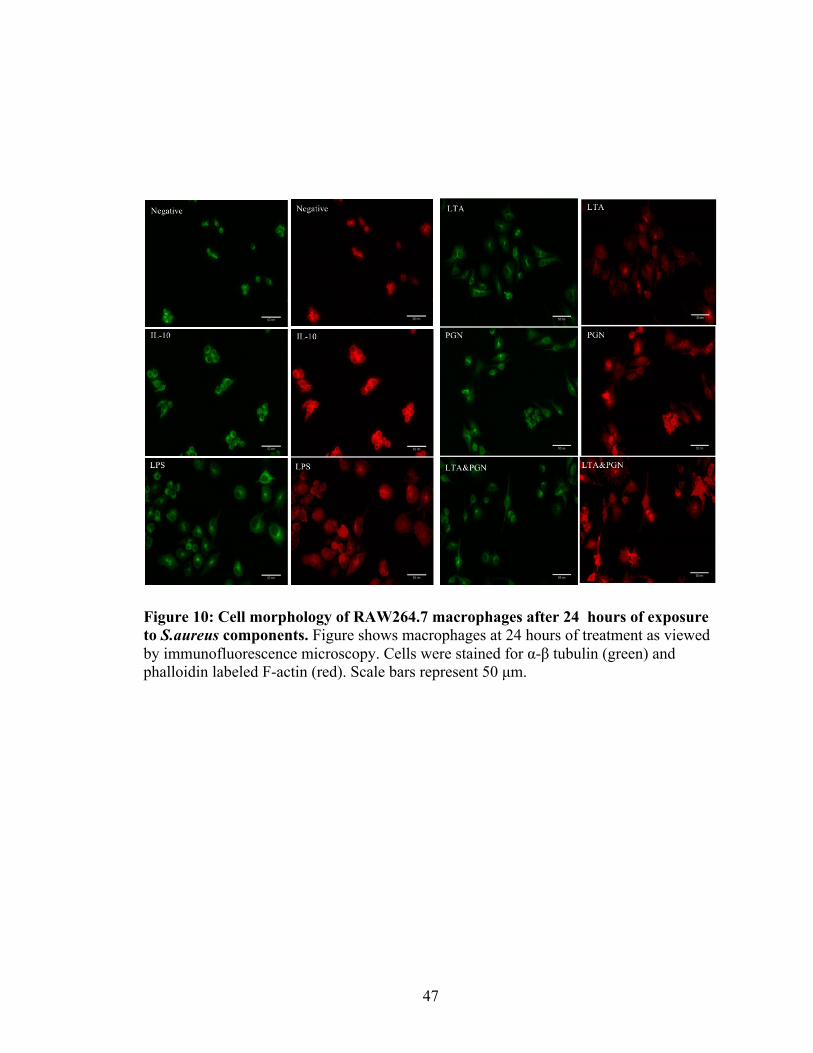
Morphological Changes Due to Exposure to S.aureus Components over 24 Hours
At six hours of exposure, macrophages appeared to be more rounded after treatment with
S.aureus components, exhibiting an M1 phenotype (Figure 7). As exposure time
progressed, cells appeared more elongated like the M2 phenotype at twenty-four hours
(Figures 7, 8, 9, 10).
Fluorescence intensity of α-β tubulin showed no significant increase or decrease over
twenty-four hours (Figure 13). However, cells treated with PGN only appeared in value
to have higher intensity of bound α-β tubulin antibody (Figure 13). Fluorescence intensity
of F-actin showed a significant increase of F-actin intensity. Similar to α-β tubulin, PGN
showed the highest amount of F-actin intensity (Figure 14). Cells treated with PGN
showed a significant increase in F-actin when intensity was compared between six and
twenty-four hours (Figure 14). At twenty-four hours, the mean fluorescence intensity of
F-actin was the greatest (Figure 14).

30
VI. DISCUSSION
In this study, RAW264.7 murine macrophages were exposed to S.aureus cell wall
components for exposure times ranging from six to twenty-four hours. When exposed
with S.aureus components, macrophages did not exhibit a significant decrease in cell
viability when compared to negative controls (Figure 12), nor a significant increase in
cytotoxicity (Figure 12). Consequently, any changes observed in macrophage cytokine
production or microfilament rearrangement were found in cells with greater than 60%
viability.
Inflammatory cytokine production was analyzed by the levels of intracellular TNF-α in
macrophages by flow cytometry. TNF-α production peaked at six hours before a large
decline at twelve hours, macrophage production of TNF-α then increased again at
eighteen hours before another decline at twenty-four (Figure 6). This pattern may be due
to the cells ability to phenotype-switch to produce IL-10 in order to balance the
inflammatory and anti-inflammatory response to prevent tissue damage (Frodermann et
al., 2011). When treated with S.aureus components, intracellular TNF-α production
appeared to be highest after treatment with PGN and a combination of both LTA and
PGN (Figure 6). Over each time period, macrophages treated with LTA exhibited lower
TNF-α production. If this experiment were to be done in a mouse model, the immune
cells would follow a similar pattern with a decrease in inflammatory cytokines after six
hours to prevent tissue damage from occurring (Frodermann et al., 2011). As the

31
cytotoxicity does not significantly increase, the decline in cytokines at twenty-four hours
is not due to cell death (Figure 6).
The anti-inflammatory positive control required analysis at thirty minutes after treatment.
In preliminary experiments, when cells were analyzed by flow cytometry after each
experimental time period, there was no difference between the treated and untreated cells
in cytokine production. While IL-10 does have a positive feedback loop where IL-10
induces the production of more IL-10, a negative feedback loop also exists (Saravia and
O’Garra, 2010) (Figure 2). As each flow cytometry experiment was run using
approximately two-million cells, the negative feedback loop was induced due to the
number of cells producing an exponential amount of IL-10 (Saravia and O’Garra, 2010).
As IL-10 is regulated in an autocrine manner, IL-10 produced by macrophages induced
more production resulting in an exponential amount of IL-10 present in the medium. The
large number of cells producing IL-10 induced the negative feedback loop, therefore the
positive control needed to be tested at a shorter time period. As the Positive control
(Appendix Figure 3) in this experiment was used to determine the specificity of the
antibody binding to IL-10, the shortened positive control time period was acceptable.
At six hours, the intracellular IL-10 production was the lowest when compared to all time
periods when TNF-α peaked. Intracellular IL-10 production peaked between at 12 and
18 hours before declining at 24 hours (Figure 11). S.aureus LTA induced the highest IL-

32
10 production at eighteen hours, whereas PGN induced the highest production at 12 hours
(Figure 11). Interestingly, the combination of LTA and PGN maintained similar levels at
both 12 and 18 hours before decreasing at twenty-four hours (Figure 11). Across all time
points, LTA induced the lowest IL-10 response (Figure 11). In previous studies, it was
found that S.aureus LTA did not have a strong immunostimulatory effect (Morath et al.,
2002). The findings of Morath and colleagues are consistent with the findings in this
study as LTA induced lower IL-10 production across each experimental time points.
Cell morphology was analyzed via immunofluorescence after staining for α-β tubulin or
phallodin detection of F-actin. There was no significant increase or decrease in the
intensity of α-β tubulin between cells treated with S.aureus components as determined by
an one-way ANOVA. At six hours, experimental cells displayed the M1 phenotype with
the majority of cells had a circular profile (Figure 77) As treatment time increased, each
experimental time group displayed M1 cell morphology however M2 morphology
increased over time (Figures 7, 8, 9, 10)
Macrophages imaged for Phalloidin detection of F-actin showed significance increases in
F-actin intensity with S.aureus PGN over time. The intensity in the phalloidin detection
of F-actin increased between 6 hours and 24 hours of exposure (Figure 14). McWhorter
and colleagues stated that M2 macrophages display more F-actin, and F-actin aggregates
towards the outside of the cell (McWhorter et al., 2013). When cells were stained for F-
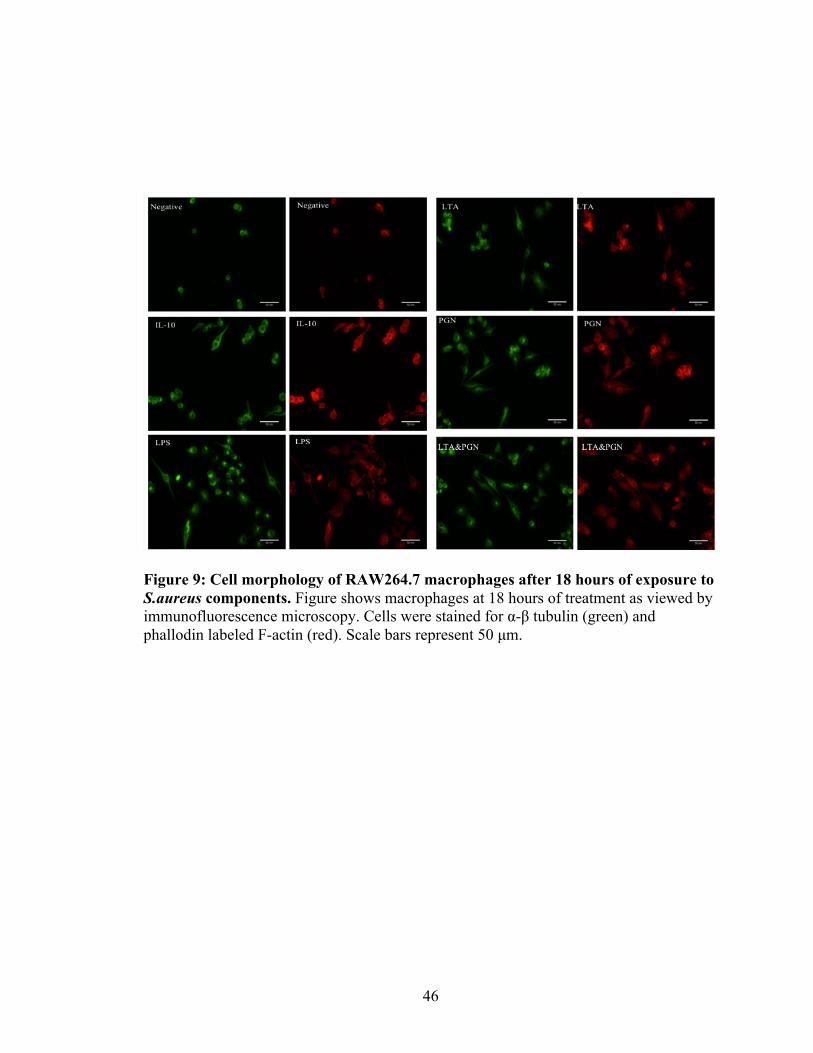
33
actin, cells appeared “fuzzy” as the active actin was elongated around the outside of the
cell. Individual cells appeared difficult to decipher as the actin was expanded around the
outside of the cell, however individual cells were able to be seen when the same cells
were viewed for α -β tubulin (Figures 7, 8, 9, 10) This difference in F-actin was only seen
in cells treated with PGN, a significant increase did not occur in cells treated with LTA or
a combination of LTA and PGN. The data suggests that as macrophages are transformed
into the M2 phenotype to produce IL-10, F-actin increases and aggregates towards the
outside of the cell.

34
VII. FUTURE STUDIES
As time progressed in this current study, RAW264.7 macrophages had a higher
inflammatory response at 6 hours followed by an anti-inflammatory response at 12 and 8
hours of exposure to S.aureus cell wall components. With the current data, it is not
possible to determine if cells had undergone a phenotype switch from M1 to M2
macrophages as time progressed, or if a second population of cells were activated at the
later time periods. Future studies should include observation and tracking individual
macrophages over 24 hours. Under constant observation, individual macrophages should
be tracked after treatment with S.aureus cell wall components. Cells should be assessed
for a circular phenotype or elongation for M1 and M2 phenotype, respectively. A
population of approximately 100 cells, tracking individual cells, should be observed for
phenotype over 24 hours by real-time microscopy. Results from tracked macrophages
should determine if cells were able to convert from an M1 to M2 phenotype or if the
increase in anti-inflammatory characteristics was due to two cell populations activating at
different time periods.
As the innate immune response to S.aureus cell wall components by macrophages was
observed in this study, future studies should focus on antigen-presenting cells and antigen
presentation to the adaptive immune system. When neutrophils capture S.aureus in
neutrophil extracellular traps (NETs) the compound 2’deoxyadenosine (dAdo) is toxic to

35
macrophages (Thammayongsa et al., 2013), causing apoptosis and disruption of the
cytoskeleton (Ceruti et al., 2000). Neutrophils are also known to form an aggregate
around S.aureus during an infection, therefore blocking additional cell migration to the
area (Miller and Cho, 2011). Additionally, S.aureus has been shown to directly kill
dendritic cells as a way to evade immune response (Wu and Wu, 2014). These studies
have shown the lack of immune response to S.aureus is due, in part, to the inability of the
adaptive immune system to be initiated.
Future experimentation to observe the effect of dAdo and inhibitors of dAdo on antigen
presenting cells, neutrophils, and dendritic cells is warranted. Macrophages and dendritic
cells could be evaluated for antigen-presenting structures such as major
histocompatibility complex (MHC) molecules for increases or decreases in expression in
vivo (Lin and Peterson, 2010). In vivo experiments involving S.aureus infection in mouse
skin are useful to evaluating the effect of inhibitors of dAdo as shown by protection from
cell death (Thammayongsa et al., 2013). Weekly evaluation, of mice serum and spleen
cells would be required for examination of protective adaptive immune responses from
S.aureus peptidoglycan and lipoteichoic acid. If successful, this may be a treatment for
individuals with chronic S.aureus infections as a vaccine so that they may develop their
own immune responses. A novel treatment using inhibitors of dAdo may be useful as
S.aureus strains are quickly acquiring resistant

36
An issue not addressed in the present study is the effect of superantigens produced by
toxigenic strains of S.aureus on cells. Superantigen removes up to 20% of an individuals
T-cell repertoire (Lin and Peterson, 2010). It would be interesting to determine, in future
studies, if inhibition of dAdo would provide enough immune protection to inhibit the
replication of S.aureus to inhibit the secretion of superantigens. As superantigen
production occurs approximately 10 to 14 days after infection (Lin and Peterson, 2010),
if it were possible to destroy the infection of S.aureus via an dAdo inhibitor this may be a
novel treatment to prevent superantigen production. Ideally, inhibiting dAdo would allow
cells to reach the area of infection without being killed. After approximately 10 to 14
days, S.aureus creates a large colony which produces lethal superantigens (Lin and
Peterson, 2010). DAdo inhibition would allow the infection to be cleared more quickly
by innate immune cells which would normally be destroyed. This treatment may lead to
the prevention of many severe infections and deaths of individuals.

37
VIII. CONCLUSION
The goal of this study was to determine the potential innate immune response by
RAW264.7 macrophages to S.aureus cell wall components within the first twenty-four
hours. The inflammatory response dominated within the first six hours of infection, while
the anti-inflammatory response dominated at 12 and 18 hours after exposure to S.aureus
cell wall components. The pattern of a marked inflammatory response as demonstrated
by TNF-α production followed by an anti-inflammatory response of IL-10 production is
similar to the in vivo response, as the body would protect itself from excessive
inflammation leading to tissue damage. The cells did not have a significant decrease in
cell viability measured by tyrpan-blue staining as well as no increase in cytotoxicity
measured by LDH secretion. Consequently, cell death was not likely responsible for
decreased cytokine production at 24 hours. This may be used as a basis for future studies
to determine if the phenotype of the macrophages switches from M1 to M2, as well as the
effects of dAdo on cell culture models of macrophage infection by S.aureus.

38
IX. FIGURES
Figure 1: Structure of S.aureus peptidoglycan and Lipoteichoic acid. Figure shows the structure of peptidoglycan and lipoteichoic acid, as adapted by Brown and colleagues (Brown et al., 2015). Triangles represent repeating units of N-acetylglucosamine and N-acetyl-acetylmuramic acid (Brown et al., 2015). Red ovals represent lipoteichoic acid (as adapted byBrown et al., 2015).

39
Figure 2: IL-10 Regulation Loop. Figure shows IL-10 positive and negative feedback loop as adapted from Saraiva and O’Garra (Saraiva and O’Garra, 2005). IL-10 positively regulates itself via JAK-STAT signaling, IL-10 is recognized by the IL-10 receptor, when JAK1 becomes phosphorylated, it activates STAT3 via phosphorylation (Saraiva and O’Garra, 2005). When STAT3 is properly phosphorylated, it travels into the nucleus and begins transcription of IL-10 (Saraiva and O’Garra, 2005). However, IL-10 production also activates DUSP-1 which blocks phosphorylation of STAT3 to inhibit IL-10 production (Saraiva and O’Garra, 2005).

40
Figure 3: Peptidoglycan macrophage activation via NOD signaling. Figure shows the activation of NOD signaling via S.aureus peptidoglycan as adapted by Strober and Colleagues (Strober et al., 2005). Peptidoglycan is brought into the cell, NOD2 recognizes gram-positive peptidoglycan components muramyl dipeptide (Strober et al., 2005). NOD2 recognizes muramyl dipeptide, NOD then recruits CARD12 (Strober et al., 2005). Together, NOD2 and CARD begins a signaling cascade activating RICK, NF- κB and MAPK which will go into the nucleus to begin transcription of cytokines (Strober et al., 2005).

41
Figure 4: Lipoteichoic acid activates macrophages via TLR-2 signaling. Figure shows the activation of TLR2 signaling via S.aureus lipoteichoic acid as adapted by Miller and Cho (Miller and Cho, 2011). Lipoteichoic acid binds to TLR2 which activates TIRAP and MYD88 (Miller and Cho, 2011). TLR2 activation begins a signaling cascade through NF-κB (Miller and Cho, 2011). P50 and P65, NF-ΚB components, are transported into the nucleus and begin transcription of cytokines (Miller and Cho, 2011).

42
Figure 5: CD11B macrophage marker confirming cell type. Figure shows macrophages as viewed by immunofluorescence microscopy when stained with CD11b (green), a known macrophage marker.

43
Figure 6: Comparison of intracellular TNF-α production over 24 hours. Figure shows comparison of TNF-α production between (A) 6 and 12 hours of treatment, (B) 6 and 18 hours of treatment, (C) 6 and 24 hours of treatment. Figure D shows mean fold increase from negative control cells in intracellular TNF-α production as observed via flow cytometry. Error bars represent standard error of the mean. (* denotes P<0.05) (- = Negative control, LPS= Lipopolysaccharide control, L= Lipoteichoic acid, P= Peptidoglycan) (white columns denotes treatment at 6 hours, light grey columns denote treatment at 12 hours, dark grey denotes treatment at 18 hours, and black columns denote treatment at 24 hours)

44
Figure 7: Cell morphology of RAW264.7 macrophages after 6 hours of exposure to S.aureus components. Figure shows macrophages at 6 hours of treatment as viewed by immunofluorescence microscopy. Cells were stained for α-β tubulin (green) and F-actin (red). Scale bars represent 50 µm.

45
Figure 8: Cell morphology of RAW264.7 macrophages after 12 hours of exposure to S.aureus components. Figure shows macrophages at 12 hours of treatment as viewed by immunofluorescence microscopy. Cells were stained for α-β tubulin (green) and F-actin (red). Scale bars represent 50 µm.
46
Figure 9: Cell morphology of RAW264.7 macrophages after 18 hours of exposure to S.aureus components. Figure shows macrophages at 18 hours of treatment as viewed by immunofluorescence microscopy. Cells were stained for α-β tubulin (green) and phallodin labeled F-actin (red). Scale bars represent 50 µm.
47
Figure 10: Cell morphology of RAW264.7 macrophages after 24 hours of exposure to S.aureus components. Figure shows macrophages at 24 hours of treatment as viewed by immunofluorescence microscopy. Cells were stained for α-β tubulin (green) and phalloidin labeled F-actin (red). Scale bars represent 50 µm.

48
Figure 11: Comparison of intracellular IL-10 production over 24 hours. Figure shows comparison of intracellular IL-10 production between (A) 6 and 12 hours of treatment, (B) 6 and 18 hours of treatment, (C) 6 and 24 hours of treatment. Figure D shows mean fold increase from negative control cells in intracellular IL-10 production as observed via flow cytometry. Error bars represent standard error of the mean. (* denotes P<0.05) (- = Negative control, LPS= Lipopolysaccharide control, IL-10 = IL-10 control, L= Lipoteichoic acid, P= Peptidoglycan) (white columns denotes treatment at 6 hours, light grey columns denote treatment at 12 hours, dark grey denotes treatment at 18 hours, and black columns denote treatment at 24 hours)
49
Figu
re 1
2: C
ompa
riso
n of
cel
l via
bilit
y an
d cy
toto
xici
ty in
RA
W 2
64.7
mac
roph
ages
ove
r 24
hou
rs. F
igur
e sh
ows
the
com
paris
on b
etw
een
cell
viab
ility
as d
eter
min
ed b
y try
pan-
blue
stai
ning
(A-C
) and
cyt
otox
icity
as d
eter
min
ed b
y LD
H re
leas
e (D
-F) o
ver 2
4 ho
urs.
Com
paris
on b
etw
een
(A,D
) 6 a
nd 1
2 ho
urs,
(B,E
) 6 a
nd 1
8 ho
urs,
and
(C,F
) 6 a
nd
24 h
ours
of e
xpos
ure
to S
.aur
eus c
ell w
all c
ompo
nent
s. Er
ror b
ars r
epre
sent
stan
dard
err
or o
f the
mea
n. (*
den
otes
P<
0.05
) (- =
nega
tive
cont
rol c
ells
, LPS
= Li
popo
lysa
ccha
ride
posi
tive
cont
rol,
IL-1
0= IL
-10
posi
tive
cont
rol,
L=
Lipo
teic
hoic
aci
d, P
= Pe
ptid
ogly
can)
(whi
te c
olum
ns d
enot
es tr
eatm
ent a
t 6 h
ours
, lig
ht g
rey
colu
mns
den
ote
treat
men
t at
12
hour
s, da
rk g
rey
deno
tes t
reat
men
t at 1
8 ho
urs,
and
blac
k co
lum
ns d
enot
e tre
atm
ent a
t 24
hour
s)

50
Figure 13: Comparison of α-β tubulin intensity over 24 hours in RAW264.7 macrophages. Figure shows the comparison in α-β tubulin intensity between (A) 6 and 12 hours, (B) 6 and 18 hours, and (C) 6 and 24 hours of exposure to S.aureus cell wall components as observed by immunofluorescence microscopy. No significant increase or decrease in α-β tubulin intensity occurred over 24 hours. Error bars represent standard error of the mean. (* denotes P<0.05) (- = Negative control, LPS= Lipopolysaccharide control, IL-10 = IL-10 control, L= Lipoteichoic acid, P= Peptidoglycan) (white columns denotes treatment at 6 hours, light grey columns denote treatment at 12 hours, dark grey denotes treatment at 18 hours, and black columns denote treatment at 24 hours)

51
Figure 14: Comparison of phalloidin F-actin intensity over 24 hours in RAW264.7 macrophages. Figure shows the comparison in phalloidin labelled F-actin between (A) 6 and 12 hours, (B) 6 and 18 hours, and (C) 6 and 24 hours of exposure to S.aureus cell wall components as observed by immunofluorescence intensity. Error bars represent standard error of the mean. (* denotes P<0.05) (- = Negative control, LPS= Lipopolysaccharide control, IL-10 = IL-10 control, L= Lipoteichoic acid, P= Peptidoglycan) (white columns denotes treatment at 6 hours, light grey columns denote treatment at 12 hours, dark grey denotes treatment at 18 hours, and black columns denote treatment at 24 hours)
52
X. REFERENCES
1. Aulock, S.V., Morath, S., Hareng, L., Knapp, S., Kessel, K.P.M.V., Strijp,
J.A.G.V., & Hartung, T., (2003)., Lipoteichoic acid from Staphylococcus
aureus is a potent stimulus for neutrophil recruitment, Immunobiology, 208,
413-422
2. Binker, M.G., Zhao, D.Y., Pang, S.J.Y., & Harrison, R.E., (2007), Cytoplasmic
linker protein-170 enhances spreading and phagocytosis in activated
macrophages by stabilizing microtubules, The Journal of Immunology, 170,
3780-3791, doi: 10.4049/jimmunolo.179.6.3780
3. Brown, L., Wolf, J.M., Rosalee, R.P., & Casadevall, A., (2015), Through the
wall: extracelular vesicles in gram-positive bacteria, mycobacteria and fungi,
National Reviews in Microbiology, 13 (10), 620-630, doi: 10.1038/nrmicro3480
4. David, M.Z., & Daum, R.S., (2010), Community-associated methicillin-
resistant Staphylococcus aureus: epidemiology and clinical consequences of
an emerging epidemic, Clinical Microbiology Reviews, 23 (3), 616-687, doi:
10.1128/CMR.00081-09
5. Deshmukh, H.S., Hamburger, J.B., Ahn, S.H., McCafferty, D.G., Yang, S.R., &
Fowler, V.G.Jr., (2009), Critical role of NOD2 in regulate the immune
response to Staphylococcus aureus, Infection and Immunity, 77(4), 1376-1382,
doi: 10.1128/IAI.00940-08

53
6. Dominguez, R., & Holmes, K.C., (2011), Actin structure and function, Annual
Reviews of Biophysics, 40, 169-186, doi: 10.1146/annurev-biophys-042910-
155359
7. Duque, G.A., & Descoteaux, A., (2014), Macrophage cytokines: involvement in
immunity and infectious diseases, Frontiers in Immunology, 5, 1-12, doi:
10.3389/fimmu.2014.00491
8. Dziarski, R., & Gupta, D., (2005), Peptidogylcan recognition in innate
immunity, The Journal of Endotoxin Research, 11(5), 304-310, doi:
10.1179/096805105X67256
9. Eiff, C.V., Peters, G., & Becker, K., (2006), The small colony variant (SCV)
concept- the role of staphylococcal SCVs in persistent infections, Injury:
International Journal of the Care of the Injured, 37, 526-533, doi:
10.1016/j.injury.2006.04.006
10. Foster, T.J., (2005), Immune evasion by staphylococci, Nature Reviews in
Microbiology, 3, 948-958, doi: 10.1038/nrmicro1289
11. Fournier, B., & Philpott, D.J., (2005), Recognition of Staphylococcus aureus by
the innate immune system, Clinical Microbiology Reviews, 18(3), 521-540,
doi:10.1128/CMR.18.3.521-540.2005
12. Frodermann, V., Chau, T.A., Sayedyahossein, S., Thoth, J.M., Heinrichs, D.E., &
Madrenas, J., (2011), A modulatory interleukin-10 response to staphylococcal

54
peptidoglycan prevents Th1/Th17 adaptive immunity to Staphylococcus
aureus, Journal of Infectious Disease, 204, 253-262, doi: 10.1093/infdis/jir276
13. Girardin, S.E., Boneca, I.G., Vinla, J., Chamillard, M., Labigne, A., Thomas, G.,
Philpott, D.J., & Sansonetti, P.J., (2003), Nod2 is a general sensor of
peptidoglycan through muramyl dipeptide (MDP) detection, The Journal of
Biological Chemistry, 278(11), 8869-8872, doi:10.1074/jbc.c200651200
14. Girardin, S.E., Travassos, L.H., Herve, M., Blanot, D., Boneca, I.G., Philpott,
D.J., Sansonetti, P.J., & Lexreuix, D.M., (2003), Peptidoglycan molecular
requirements allowing detection by Nod1 and Nod2, The Journal of Biological
Chemistry, 278(43), 41702-41708, doi:10.1074/jbc.m307198200
15. Hasko, G., Szabo, C., Nemeth, Z.H., Kvetan, V., Pastores, S.M., & Vizi, E.S.,
(1996), Adenosine receptor agonists differentially regulate IL-10, TNF-α, and
nitric oxide production in RAW264.7 macrophages and in endotoxemic mice,
The Journal of Immunology, 157, 4634-4640
16. Jeon, H., Oh, M.H., Jun, S.O, Kim, S.I., Choi, C.W., Kwon, H.I., Na, S.H., Kim,
Y.J., Nicholas, A., Selasi, G.N., & Lee, J.C., (2016), Variation among
Staphylococcus aureus membrane vesicle proteomes affects cytotoxicity of
host cells, Microbial Pathogenesis, 93, 185-193,
doi:10.1016/j.micpath.2016.02.014
17. Jiang, S., Ghoshdastider, U., Narita, A., Popp., D., & Robinson, R.C., (2006),
Structural complexity of filaments form from the actin and tubulin folds,

55
Communicative and integrative biology, 9(6), 1-6,
doi:10.1080/19420889.2016.1242538
18. Lin, Y.C., Peterson, M.L., (2010), New insights into the prevention of
staphylococcal infections and toxic shock syndrome, Expert Review in Clinical
Pharmacology, 3(6), 753-767, doi: 10.1586/exp.10.121
19. Lumeng, C.N., Bodzin, J., Saltiel, A.R., (2007), Obesity induces a phenotypic
switch in adipose tissue macrophage polarization, The Journal of Clinical
Investigation, 117(1), 176-184, doi:10.1172/JCI29881
20. McWhorter, F.Y., Wang, T., Nguyen, P., Chung, T., & Liu, W.F., (2013),
Modulation of macrophage phenotype by cell shape, PNAS, 110(43), 17253-
17258, doi:10.1073/pnas.1308887110
21. Miller, L.S., Cho, J.S., (2011), Immunity against Staphylococcus aureus
cutaneous infections, Nature Reviews Immunology, 11, 505-518, doi:
10.1038/nri3010
22. Morath, s., Geyer, A., Spreitzer, I., Hermann, C., & Hartung, T., (2002),
Structural decomposition and heterogeneity of commercial lipoteichoic acid
preparations, Infection and Immunity, 70(2), 938-944, doi:10.1128/IAI.70.2.938-
944.202
23. Murray, R.Z., Wylie, F.G., Khromykh, T., Hume, D.A., & Stow, J.L., (2005),
Syntaxin 6 and Vti1b form a novel SNARE complex which is up-regulated in
activated macrophages to facilitate exocytosis of tumor necrosis factor-α, The
56
Journal of Biological Chemistry, 280(11), 10478-10483,
doi:10.1074/jbx.M414420200
24. Naimi, T.S., LeDell., K.H., Sabetti, K.C., Borchardt, S.M., Boxrud, D.J., Etienne,
J., Johnson, S.K., Vandenesch, F., Fridkin, S., O’Boyle, C., Danila, R.N., &
Lynfield, R., (2003), Comparison of community- and health care-associated
methicillin-resistant Staphylococcus aureus infection, Journal of the American
Medical Association, 290(22), 2976-2984
25. Otto, M., (2014), Staphylococcus aureus toxins, Current Opinion in
Microbiology, (0), 32-37, doi:10.1016/j.mib.2013.11.004
26. Pengal, R.A., Ganesan, L.P., Wei, G., Fang, H., Ostrowski, M.C., &
Tridanadpani, S., (2006), Lipopolysaccharide-induced production of
interleukin-10 is promoted by the serine/threonine kinase Akt, Molecular
Immunology, 43, 1557-1564, doi:10.1016/j.molimm.2005.09.022
27. Ratner, A.J., Aguilar, J.L., Shchepetov, M., Lysenko, E.S., & Weiser, J.N.,
(2007), Nod1 mediates cytoplasmic sensing of combinations of extracellular
bacteria, Cell Microbiology, 9(5), 1343-1351
28. Robinson, J.M., & Vandre, D.D., (1995), Stimulus-dependent alterations in
macrophage microtubules: increased tubulin polymerization and
detyrosination, Journal of Cell Science, 106, 645-655
29. Saravia, M., & O’Garra, S., (2010), The regulation of IL-10 production by
immune cells, Nature Reviews, 10, 170-182, doi:10.1038/nri2711
57
30. Schroder, N.W.J., Morath, S., Alexander, C., Hamann, L., Hartung, T., Zahringer,
U., Gobel, U.B., Weber, J.R., & Schumann, R.R., (2003), Lipoteichoic acid
(LTA) of Streptococcus pneumoniae and Staphylococcus aureus activates
immune cells via toll-like receptor (TLR)-2, lipopolysaccharide-binding
protein (LBP), and CD14, whereas TLR-4 and MD-2 are not involved, The
Journal of Biological Chemistry, 278(18), 15587-15594,
doi:10.1074/jbc.M212829200
31. Shinefeild, H.R., & Ruff, N.L, (2009), Staphylococcal infections: a historical
perspective, Infectious Disease Clinics of North America, 23(1), 1-15,
doi:10.1016/j.idc.2008.10.007
32. Shinohara, H., Behar, N., Inoue, K., Hiroshima, M., Yasuda, T., Nagashima, T.,
Kimura, S., Sanjo, H., Maeda, S., Yumoto, N., Ki, S., Sako, Y., Hoffmann, A.,
Kurosaki,T., & Hatakeyama, M.O., (2014), Positive feedback within a kinase
signaling complex functions as a switch mechanism for NF-κB activation,
SCIENCE, 344, 760-766, doi:10.1126/science.1250020
33. Sullivan, K.E., Reddy, A.B.M., Dietzmann, K., Suriano, A.R., Kocieda, V.P.,
Stewart, R., & Bhatia, M., (2007), Epigenetic regulation of tumor necrosis
factor-α, Molecular and Cellular Biology, 27(14), 5147-5160,
doi:10.1128/MCB.02429-06
58
34. Thammavongsa, V., Missiaka, D.M., Schneewind, O., (2013), Staphylococcus
aureus degrades neutrophil extracellular traps to promote immune cell
death, Science, 15, 863-866, doi:10.1126/science.124455
35. Valeva, A., Walev, I., Pinkernell, M., Walker, B., Bayley, H., Pamer, M., &
Bhakdi, S., (1997), Transmembrane beta-barrel of staphylococcal α-toxin
forms in sensitive but not resistant cells, Proceedings of the National Academy
of Science, 94, 11607-11611
36. Ventola, C.L., (2015), The antibiotic resistance crisis, Pharmacy and
Therapeutics, 40(4), 277-283
37. Vereyken, E.J.F., Heijnen, P.D.A.M., Varon, W., Vires, E.H.E.D., Dijkstra, C.D.,
& Teunissen, C.E., (2011), Classically and alternatively activated bone
marrow derived macrophages differ in cytoskeletal functions and migration
towards specific CNS cell types, Journal of Neuroinflammation, 8, 58-74
38. Verma, R., Balakrishnan, L., Sharma, K., Khan, A.A., Advani, J., Gowda, H.,
Tripathy, S.P., Suar, M., Pandey, A., Ganotra, S., Prasad, T.SK., & Shankar, S.,
(2016), A network map of interleukin-10 signaling pathway, Journal of Cell
Communication Signaling, 10, 61-67, doi:10.1007/s12079-015-0303-x
39. Warenburg, J.B., Williams, W.A., & Missiakas, D., (2006), Host defenses
against Staphylococcus aureus infection require recognition of bacterial
lipoproteins, PNAS, 103(37), 13831-13836, doi:10.1073/pnas.0603072103
59
40. Wu, X., and Wu, F., (2014), Dendritic cells during Staphlyococcus aureus
infection: subtypes and roles, Journal of Translational Medicine, 12, 358-367
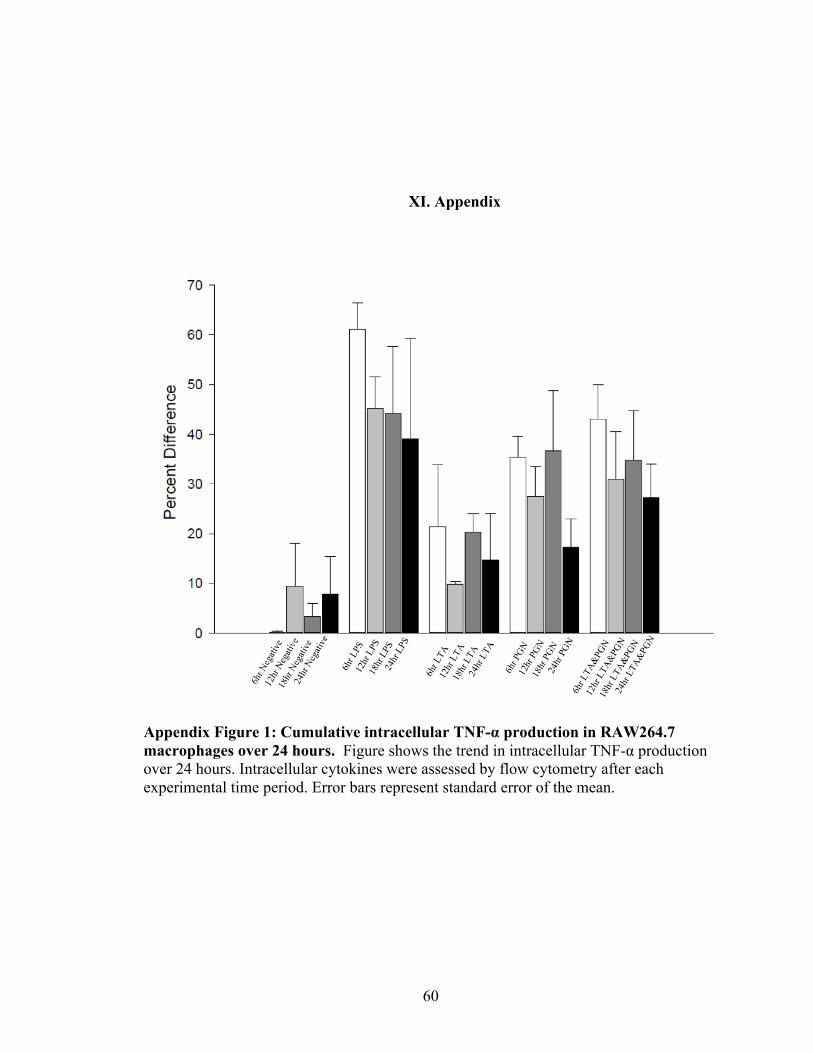
60
XI. Appendix
Appendix Figure 1: Cumulative intracellular TNF-α production in RAW264.7 macrophages over 24 hours. Figure shows the trend in intracellular TNF-α production over 24 hours. Intracellular cytokines were assessed by flow cytometry after each experimental time period. Error bars represent standard error of the mean.
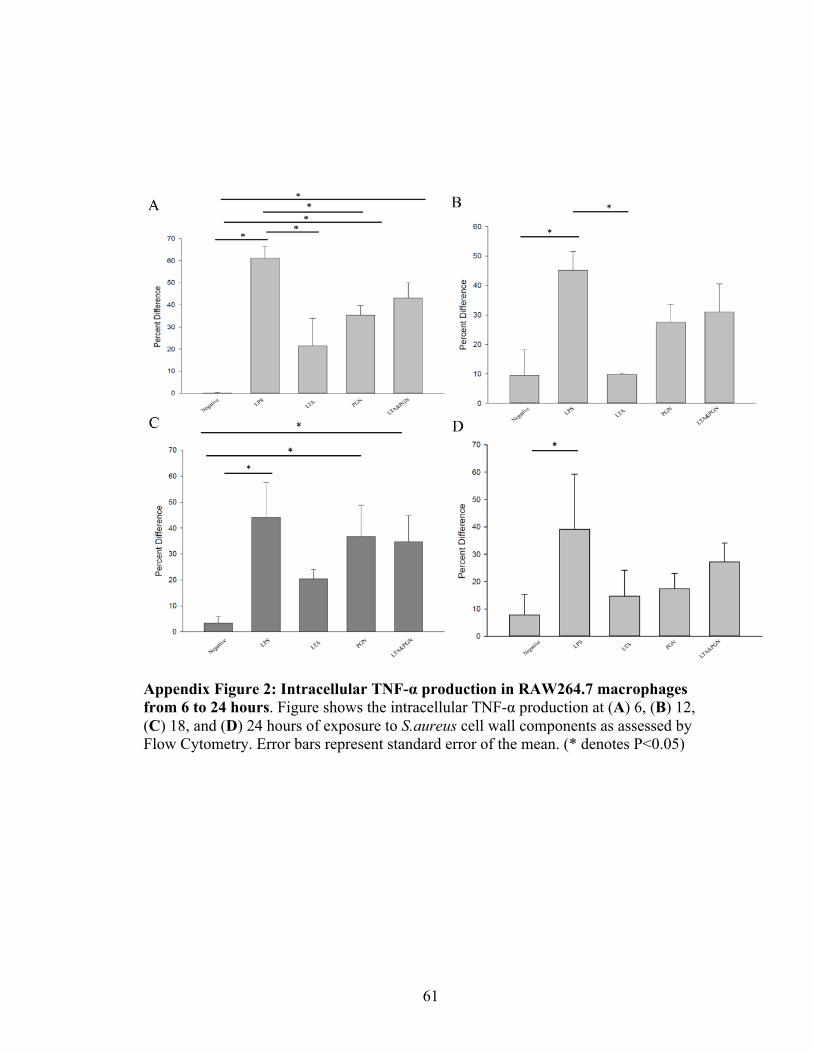
61
Appendix Figure 2: Intracellular TNF-α production in RAW264.7 macrophages from 6 to 24 hours. Figure shows the intracellular TNF-α production at (A) 6, (B) 12, (C) 18, and (D) 24 hours of exposure to S.aureus cell wall components as assessed by Flow Cytometry. Error bars represent standard error of the mean. (* denotes P<0.05)

62
Appendix Figure 3: IL-10 positive control cytokine production. Figure shows IL-10 production after treatment with 100 ng/mL of IL-10 as determined by flow cytometry. Positive control was used to determine antibody specificity. Error bars represent standard error of the mean. (* denotes P<0.05)
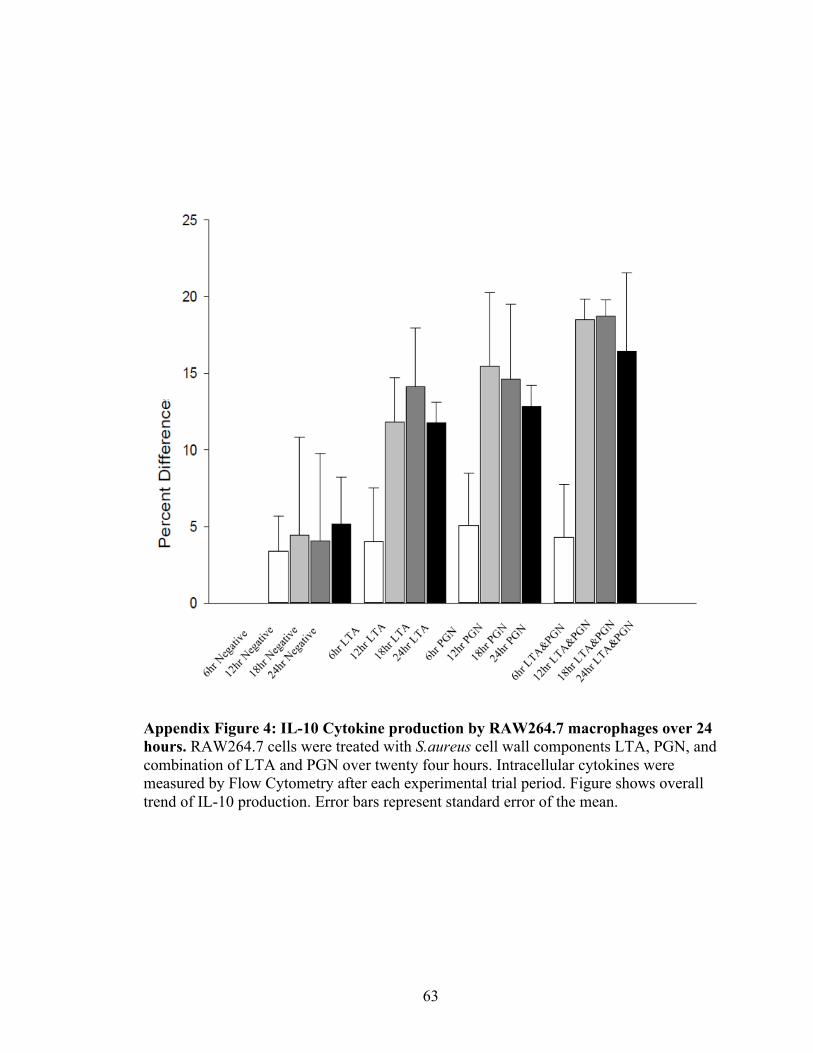
63
Appendix Figure 4: IL-10 Cytokine production by RAW264.7 macrophages over 24 hours. RAW264.7 cells were treated with S.aureus cell wall components LTA, PGN, and combination of LTA and PGN over twenty four hours. Intracellular cytokines were measured by Flow Cytometry after each experimental trial period. Figure shows overall trend of IL-10 production. Error bars represent standard error of the mean.

64
Appendix Figure 5: Intracellular IL-10 Cytokine Production in RAW264.7 macrophages from 6 to 24 hours. Figure shows intracellular IL-10 cytokines as assessed at (A) 6, (B) 12, (C)18, and (D) 24 hours via flow cytometry. Error bars represent standard error of the mean. (* denotes P<0.05)

65
Appendix Figure 6: Cumulative F-Actin Intensity in RAW264.7 macrophages after treatment of S.aureus components over 24 hours. Figure shows the mean F-actin fluorescence intensity per cell as observed by immunofluorescence microscopy over 24 hours. Error bars represent standard error of the mean. (* denotes P<0.05)

66
Appendix Figure 7: Cumulative α-β Tubulin Intensity in RAW264.7 macrophages after treatment of S.aureus components over 24 hours. Figure shows mean α-β tubulin intensity per cell over 24 hours as observed by immunofluorescence microscopy. Error bars represent standard error of the mean.
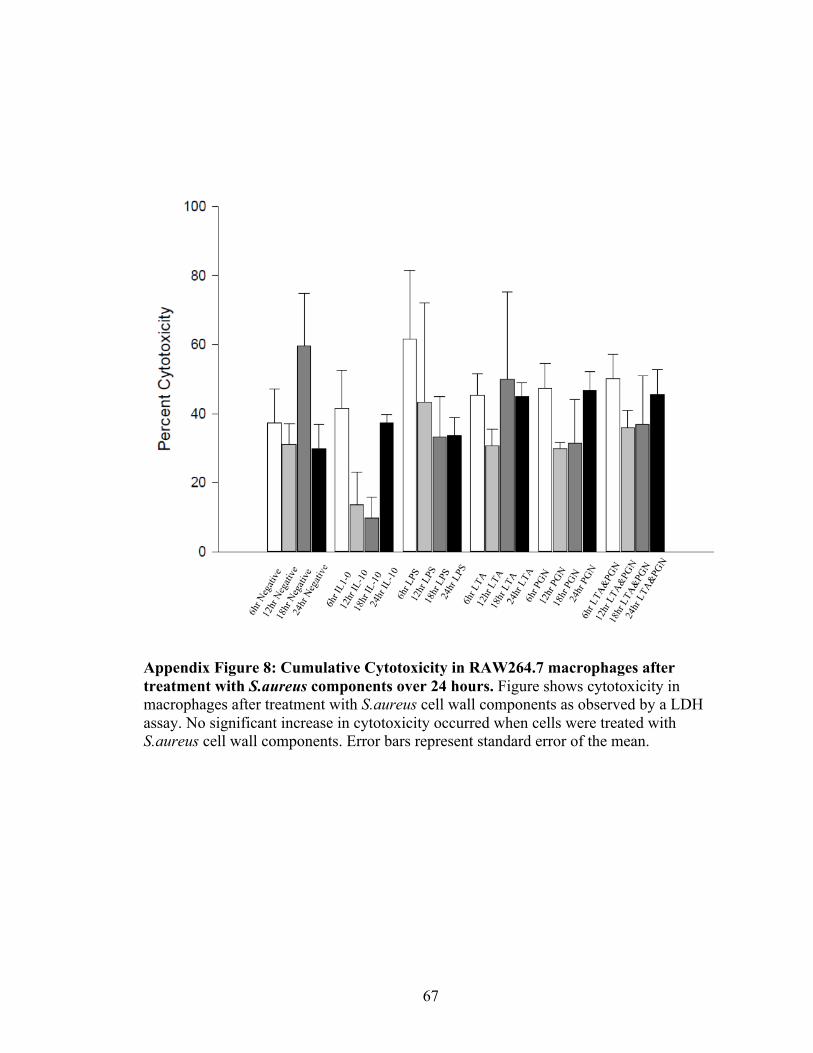
67
Appendix Figure 8: Cumulative Cytotoxicity in RAW264.7 macrophages after treatment with S.aureus components over 24 hours. Figure shows cytotoxicity in macrophages after treatment with S.aureus cell wall components as observed by a LDH assay. No significant increase in cytotoxicity occurred when cells were treated with S.aureus cell wall components. Error bars represent standard error of the mean.

68
Appendix Figure 9: Cumulative cell viability in RAW264.7 macrophages after treatment with S.aureus components over 24 hours. Figure shows macrophage cell viability over 24 hours as observed by trypan-blue staining. No significant decrease in cell viability occurred when cells were treated with S.aureus cell wall components. Error bars represent standard error of the mean.