Embed Size (px)
Citation preview

THE EFFECT OF DEVIANCE ON ACADEMIC PERFORMANCE
A Thesis by
Nanako Watanabe
B.A., Wichita State University, 2006
Submitted to the Department of Sociology
and the faculty of the Graduate School of
Wichita State University
in partial fulfillment of
The requirements for the degree of
Master of Arts
May 2008

© Copyright 2008 by Nanako Watanabe
All Rights Reserve

iii
THE FEEFCT OF DEVIANCE ON ACADEMIC PERFORMANCE
The following faculty members have examined the final copy of this thesis for form
and content, and recommended that it be accepted in partial fulfillment of the
requirement for the degree of Master of Arts with a major in Sociology.
David Wright, Committee Chair
Ron Matson, Committee Member
Brien Bolin, Committee Member

iv
DEDICATION
To my family and my dear friends

v
ABSTRACT
This research examined the relationship between deviance and academic
performance by combining three components 1) individual factors, 2) school
environmental factors, and 3) family factors, and how these three factors affect
students test scores. The data used for this study was from The Education Longitudinal
Study (ELS) base year of 2002. Mean Comparison Tests, and Ordinary Least Squares
Regression analysis were conducted, and the result supported most of hypotheses in
this study.
vi
TABLE OF CONTENTS
Chapter Page
1. INTRODUCTION…………………………………………………………………...1
2. LITERATURE REVIEW…………………………………………………………....2
2.1 Student Role Performance (SRP)…………………………………………….2
2.2 School.………………………………………………………………………..5
2.3 Family………………………………………………………………………...7
2.4 Conceptual Model………………………………………………………….....9
3. DATA AND MATHODOLOGY……….…………………………………………..11
3.1 Research Hypothesis………………………………………………………...11
3.2 Data………………………………………………………………………….12
3.3 Dependent Variable………………………………………………………….12
3.4 Independent Variable Student Role Performance Level…………………….12
3.5 Independent Variable Family Level…………………………………………13
3.6 Independent Variable School Level…………………………………………14
4. RESULTS…………………………………………………………………………...16
4.1 Univariate and Bivariate Analysis…………………………………………..16
4.2 Multivariate Analysis………………………………………………………..17
5. DISCUSSION………………………………………………………………............21
5.1 Conclusion…………………………………………………………………..21
5.2 Limitations…………………………………………………………………..22
5.3 Policy Implementation……………………………………………………....23
BIBLIOGRAPHY……………………………………………………………………..24
APPENDIX……………………………………………………………………………31

vii
LIST OF TABLES
Table Page
1A. Bivariate Analysis………………………………………………………………32
1B. Bivariate Analysis……………………………………………………………….33
2. Multivariate Analysis……………………………………………………………...34
viii
LIST OF FIGURES
Figure Page
1. Alternative Model…………………………………………………………………9
2. Shared of Unique Variance……………………………………………………….35

1
CHAPTER 1
INTRODUCTION
Educational attainment is very important to future opportunities and many students
look for much higher educational goals (Schneider and Stevenson, 1999). However,
inequality of chances to achieve educational goals (Hochchild and Scovronicity, 2003)
and the school achievement gap associated with race, ethnicity, and income are
continuing problems in American society (Teske et al., 2006). Students who have high
academic achievement are less likely to engage in delinquent behavior than those who
have lower academic achievement (Elliott and Voss, 1974; Henggeler, 1989). Students
who have unsuccessful experiences in school are more likely to be involved in
delinquent behavior such as dropping out of school (Voelkel, et al., 1999). School
grades are the most reliable predictors for student delinquency (Gottfredson, 1988).
Previous research about adolescent delinquent behavior focuses on 1) individual
factors such as race, gender, participation in extra-curricular activities, time spent on
homework, and class preparation, as well as 2) school environment factors such as
school rules and school problems, and on 3) family factors such as family
socioeconomic status, the influence of siblings, and family communication. This study
examines the relationship between deviance and academic performance by a
combining these three components. The data used for this study is from The National
Education Longitudinal Study (ELS) 2002.
2
CHAPTER 2
LITERATURE REVIEW
2.1 Student Role Performance (SRP)
Any behavior, belief, or condition that violates social norms in the society or
group is defined as deviance (Kendall 2005, P205). Control theory and social bonding
theory are often used to explain adolescent delinquency. These theories suggest that
deviant behavior increases because of weaken or broken social ties in the family and
school (Alexander & Lloyd 2003). These include attachment to another, commitment
to conformity, involvement in customary activities, and belief in legitimate values and
norms (Kendall 2005, P219). Lack of emotional closeness, involvement, support,
discipline, and supervision in family environment, and lack of educational commitment
(Herrenhohl et al., 2000), aspirations (Elliott & Voss, 1974), time spent doing
homework (Cernkovich & Flannery, 1997), and school involvement (Cernkovich &
Giordano, 1992) are the strong predictors for adolescent delinquency (Alexander &
Lioyd 2003). Deviant behavior in this study is defined by the school. Any behavior that
violates school roles such as physical fighting, skipping class, poor performance and
poor attendance are deviant behavior.
The Student Role Performance (SRP) is a measure of how successfully students
adapt to socially expected behavior (Leone & Richards, 1989) such as mastery of
beliefs, a high degree of task, involvement, persistence, generating, effective, and
strategies in the face of obstacles (Skaalvik, 1997). The gender of the student affects
SRP of the student. Generally, while girls earned better grades in reading and English
classes (Downey & Vogt, 2005), boys earned better grades in math and science than

3
girls (Pallas & Alexander, 1983; Hedges & Nowell. 1995) and the grade difference
significantly increased during their high school years (Klein, 1985; Feingold, 1988;
Hyde et al., 1990). According to the study by American Association of University
Women (1999), in school, boys receive more attention than girls and more encouraged
to study math and science. Also, boys spend more time on activities enhancing
quantitative skills, such as using the computer and joining the science club outside of
school. Whereas Girls are more likely to spend time on reading or attending art class
(Lever, 1978; Best, 1983). The study by Downey and Vogt reported that girls’ time
spent on reading helped to improve their reading skills, which means they receive
better reading grades. Boys’ time on computer improves their math and science skills,
and so they receive better grades on math and science (2005). Gender affects different
activities and it causes different educational achievement.
Race and ethnicity are also important factors in SRP. Many studies reported that
African American students have lower academic achievement than white (Mullis,
Owen & Philips, 1990). The average difference between African Americans’ math
scores is one half a full standard deviation lower than those of white students’ (Hedges
& Nowell, 1995). Pino and Smith found that although African American students and
their communities have much higher academic aspirations than white students, Blacks
still receive lower GPAs than whites (2004). African American students, compared to
white students, are attending less difficult classes (Oakes, 1990; Pink, 1982). The
attitude toward education and the actual educational achievement contradiction
continues among African American adolescents (Mickelson, 1990 p.44). Hallinan
(2001) argues that the gap between academic achievement of African American and
white students can be explained by the term of racial inequality (p.51). The US

4
Department of education reported that the population of African American adolescents
without a high school diploma, employment, and enrollment in postsecondary
education was double of the population of their white counterparts. In addition, the
median income of African Americans who dropped out at 8th
grade of school was about
half of the income of white dropouts (1996). Because of remaining racial inequality,
success in education and preventing dropout from school are very important
particularly, for African American communities (Voelkl et al., 1999). However,
historically disadvantaged minorities tend to look down on academic achievement
because they think that educational attainment would not raise their standard of living
(Ogbu, 1997. 2003). Also, they think that even if they work hard for academic success,
the benefits are limited after they complete school (Mickelson, 1990). The race
difference and the different attitudes on academic achievement highly influence SRP.
Other studies found that extracurricular programs such as sports have an effect on
educational achievement. Many studies in school sports have reported that
participation in sports improves academic performance and promotes educational
success (Coleman, 1961; Fejgin, 1994; Mirade & Rees, 1994; Hanson & Kraus, 1998,
1999). Total Extracurricular Activity Participation (TEAP) raises grade point average,
education aspiration, and attendance. Also, TEAP helps to prevent absenteeism and
dropping out of high school. The result was consistent even after race, socioeconomic
status, and employment factors were taken into account (McNeal. 1995). Snyder and
Spreitzer argued that students gain interest in school, self-concept, attention from
others, such as teachers and parents, through sports participation, and maintained good
grades in school (2002). However, other studies suggested that the effect of sports
participation on academic performance is a very complicated issue when the race and

5
gender variables are included. For example, high school girls’ participation in sports is
associated with higher achievement in math and science, but not for boys (Hanson &
Kraus, 1999). In addition, the positive effect of sports participation on academic
achievement is reported for white students, but not for African American students
(Hanks, 1979; Sabo et al., 1993). The research by Eitle and Eitle found that African
American students were more involved in sports than white students; also basketball
and football have a negative association with academic performance, regardless of the
race of the students, and playing other sports increases academic performance for
Whites but not for African Americans (2002).
Other factors that affect SRP of students are basic needs for student engagement
with homework, practice, and attendance. Finn argued that students who fail to follow
basic school regulations are more likely to have low academic performance, dropout of
school, and consequently engaged in delinquency (Voelkl et al., 1999). Homework
preparation style clearly indicates students’ effort because time spent on homework is
scheduled by the student, not by school staff (Natriello & McDill, 1986). The amount
of time spent on homework is associated with positive academic performance (Paschl
et al., 1984; Keith & Page, 1985). Also, doing homework with other persons present
enhances students’ motivation, promoting higher grades (Leona & Richards, 1989).
Attendance is also an important factor. Students who regularly attend school are less
likely to engage in delinquent behavior than students who are truant (Hellman &
Beaton, 1986; Voelkel et al., 1999).
2.2 School
School climate and school resources influence SRP. School climate is defined as
the academic orientation of school, SES, academic ability, racial demographic, and
6
teachers’ expectations. Also physical plant, science equipment, library books,
technology and other instructional tools are defined as school resources (Hallinan,
2001). Cleman and Hoffer found that Catholic school students have higher
achievement scores than public school students and the rates of dropping out of school
are lower because religious affiliation enforces to family values and functional
communities (1987). Bryk, Lee and Holland examined the climate of Catholic schools
and found a strong academic curriculum, communal organizations, decentralized
governance, and an emphasis on philosophy to inspire students to engage with
academic achievement (1993). Also, the majority of predominately white schools have
more resources than predominately African American schools, and the racial
composition of schools effects educational achievement. African Americans attending
academically strong schools receive higher SAT scores then African American
attending academically weaker schools, and African Americans attending schools with
a high white students ratio have higher educational achievement (Hallinan, 2001).
A study showed that students receive higher grades, not for just course work, but
also when they show interests in art, music and literature (Bourdieu, 1970; DiMaggio,
1982). Schools with low SES tend to have few resources available to students, and the
elimination of school extracurricular program such as clubs, artistic groups, athletics
and student government can play an important role in increasing the alienation and
subsequent delinquency of adolescents (Polk, 1984). These can constrain students from
the opportunity of rewarding academic success (Pink, 1984).
Several theories pointed that delinquent behavior is associated with quality of the
school itself (Henggeler 1974 p.54) because school curriculums are established by the
school site (Hallinan 1992, Useem 1991). Hellman and Beaton argued that a high

7
students-teacher ratio is associated with low class attendance, unstable student
population, and delinquent behavior (1986). Hallinam proposed that the formation of
smaller class size as one way to reform the academic curriculum and enhance social
bonds within schools (2001). Students have more opportunities to obtain information
that is useful for improving their grades when they have more opportunities to talk
with their teachers. Also, the more students communicate with their teachers, the more
chances students are encouraged to follow school expectation, norms, and create social
bonds, which help students receive higher grades (Broh 2002).
2.3 Family
Family is a primary site for social capital, thus family factors play an important
role in students’ academic achievement (Coleman, 1999; Parcel & Dufur, 1998).
Usually, adolescents from two-parent families have better academic achievement than
adolescents from shingle parent families (Cherlin, 1992; McLanahan & Sandefur,
1994; Zill, 1996). Adolescents who grow up in two-parent families also have lesser
drop out rates than those with stepparents (Astone & Mc Lanahan 1991, McLanahan &
Sandefur 1994). Parental family structure affects the grade point averages on math
scores for African American students, however, not for whites (Payne, 2003).
The numbers of siblings also affects academic performance. As the number of
sibling increases, individual academic performance decreases (Downey 1995). Hill and
Stafford studied that children receive less attention as their sib ship size increases
(1974), and less encouragement from parents (Blake 1981). Children who have many
siblings cannot receive a many parental resources, and it leads to lower educational
attainment (Downey 1995).
Parental involvement affects the SRP of children (Payne, 2003). Family

8
interaction is one of the factors enhancing or interfering with the effectiveness
homework (McDermott et al., 1984). Studies show that doing homework alone is not
rewarding and is associated with poor academic performance. Whereas doing
homework with a parent or with family member is associated with gaining attention
and better academic performance (Leona & Richards 1989). Students who have well
educated parents (Coleman 1988, Downey 1995, Hagan et al., 1996). and parents with
high educational expectations (Baumrind 1991, Clark 1983, Fegin 1995, Rumberger et
al., 1990) comprise the major determinants of educational attainment (Blau& Duncan
1961, Feathermam & Hauser 1978, Sewell & Hauser 1975). Specifically, a father’s
involvement in school has positive effect on children’s academic success (U.S.
Department of Education; 1998; Alderman-Swain, 2000). Several studies show that the
father’s education has a stronger impact than even sibling on educational attainment
(Blake 1989 P52-53). Also, adolescents who have fathers involved in school are less
likely to be expelled or suspended; even when father’s educational level, income, and
race variables are controlled (Alderman & Swain 2000). Adolescents rose in families
with close, open communication and trusting environments more likely perform better
in school (Scott-Jones, 1995), and complete more years of school (Dornbusch, 1989;
Rumberger et al., 1990) than adolescent who have the opposite family environment
(Lamborn et al., 1991). Also, parental monitoring and supervision increase children’s
academic outcomes (Astone & McLanahan, 1991; Scott-Jones, 1995). Other studies
indicated that parents’ involvement in school such as attending school, volunteering at
the school, and joining the school governing structure influence children’s academic
performance (Estein et al., 1997).
Family socioeconomic status (SES) also affects SRP. For both African American

9
and white adolescents, their family SES is highly associated with the differences in
math grades and grade point averages (Payne, 2003). Adolescents from families with
lower SES tend to have less schooling years than adolescents from families with high
SES (Entwisle et al., 1997; Hofferth et al., 1998). Reversibly, the U.S. Department of
Education reported in 1996 that students with lower academic achievement and more
likely attend high poverty schools. The difference between test scores develops during
the summer break when school is out (Entwisle et al., 1994), because adolescents from
high SES families have more access to join activities, gain resources, and increase their
intellectual development when school is not in session (Heyns, 1978).
2.4. Conceptual Model
Conceptual Model represents both direct and indirect effects of SRP, family, and
school factors on students’ test scores. SRP is behavior that measures how students
perform socially expected behaviors, such as gender roles, race relations, participation
in extracurricular programs, attendance, and time spent on homework. For example,
students who spend more time on their homework receive higher test scores than
students who do not.
School factors directory affects both SRP and student test scores. School is the
institution that gives social discipline for students and defines what socially expected
behaviors are. Another school factor, such as teacher-to-student ratio, racial
S choolFam ily S R P T est S core( A dapted from W right, 2007)

10
demographic, school climate, and school SES are part of the factors that affect SRP
and test scores. For example, students attending school that have conditions hindered
learning receive lower test scores than students attending school such conditions. Also,
because schools with high a SES can provide students more recourse to help increase
SRP, therefore students attending school with high a SES receive higher test scores.
Family is a primary site that provides children mental support and social
resources. Family factors also have indirect effects on test scores. Such things as
family structure, parental involvement in school activities, and parental monitoring
influence SRP. For example, students from families with open and trusting
relationships have higher academic achievement than students from families with the
opposite. Also, high SES families can provide their children with more resources,
which increase SRP, and then indirectly increase students’ test scores.
11
CHAPTER 3
DATA AND METHODOLOGY
3.1. Research Hypotheses
This study examines the relationships between deviance and the test scores of
tenth-grade students.
Student role performance factors: Hypothesis
1) Deviant students achieve lower test scores than non-deviant students net of
other factors.
2) Minority students are more likely to achieve lower test scores net of other
factors.
3) Students who attend extra-curricular activities achieve higher test scores net of
other factors.
4) Students who spend more time on homework are more likely achieve higher
test scores net of other factors.
5) Students who come to class prepared will achieve higher test scores net of
other factors.
School factors: Hypothesis
6) As school disruptions increase, test scores decreases net of other factors.
7) As school problems increase, test scores decrease net of other factors.
Family factors: Hypothesis
8) As SES increases, test scores increase net of other factors.
9) Students who have fewer numbers of siblings are more likely to receive
higher test scores net of other factors.

12
10) Students who communicate with their parents more often are more likely to
achieve higher test scores net of other factors.
3.2. Data
The data for this study came from The Educational Longitudinal Study (ELS)
base year of 2002, sponsored by The United States Department of Education’s National
Center for Educational Statistics (NCES). A national probability sample of 752 public
and private schools selected randomly participated in the study. 21,759 tenth-grade
students across the United States participated in the base year of 2002. The sample
restrictions were for only valid responses in student survey, parent survey, school
administrators’ survey, and also for only selected mathematics and reading test scores.
The samples size was reduced to 17,591 students.
ELS provides weights to compensate for oversampling and allow
generalizebility to the population. Use of weights in the statistical package creates
population parameter biases, and the biases increase the probability of type I errors.
Relative weights minimize the biases by dividing the weights by the mean weight.
Relative weights maintain sample size, but create a distribution of a weighted sample.
3.3. Dependent Variable
The dependent variable in this study is the composite score of mathematics and
reading scores of tenth-grade students. The range of the interval variable is from
minimum 20.19 to maximum 81.04 and, ranked into a centile scale.
3.4. Independent Variables: Student Role Performance Level
Student role performance is associated with how well students perform in
school. The variables included in “Student Role Performance” factors are the student’s
sex, race, ever held back grade status, homework preparation, class preparation, and

13
deviance status. The relationships between each of these variables and test scores are
examined in this study.
The female variable is (0, 1) binary, in which 0 is male and 1 is female. The
minority variable is (0, 1) binary, in which 0 is minority, and 1 is non-minority. The
class preparation variable measuring how often students came to class with pencil,
paper, books and homework is binary, in which 0 is prepared and 1 is not prepared.
The time spent on homework per week variable is measured by interval scale of how
many hours per week students spent on homework in school and out of school. The
students’ role performance variables measure how well students perform in
mathematics classes, reviewing, listening to lecture, note taking, use of calculators and
computer, and participating in class discussions create an index. The student deviance
variable is measured by six variables composed of how many times students skip class,
are absent, get in trouble, are put on probation, and also transferred for disciplinary
reasons. This variable creates a (0, 1) binary, in which 0 is non-deviant, and 1 is
deviant. The extra-curricula activity variable measuring students participation in sports
such as baseball, softball, basketball, football, soccer, intramural sport, individual
intramural sport, and drill team creates a (0,1) binary, in which 0 is “not participated”
and 1is “participate”.
3.5. Independent Variables: School Level
School factors also have an affect on student role performance and their test
scores. The variables include: the availability of school resources, school
environmental settings, and school demographics, degree of school problems, and
school rules and regulations. The relationships between each of these variables and test
scores are examined in this study.

14
The school resources are measured by the percentage of schools that provide
free lunch to students. This variable is an interval scale. The 11 variables related to
measure school environmental settings were selected to create school environmental
setting variables. The scale variables include learning hindered by poor condition of
building, poor heating, air conditioning, and lighting systems, poor science, arts,
library facilities, as well as lack of space, texts and supplies, computers, multi-media,
and inadequate security. The score has a Cronbach’s alpha of .993.
The school problem variable creates a scale (the Cronbach’s alpha.997) variable
composed of tardiness, physical conflicts, theft, vandalism, alcohol/drug use, weapons,
physical/verbal abuse of teachers, racial tension, disorder, disrespect for teachers, and
gang activities. The school rules and regulation variable is a scale (the Cronbach’s
alpha.994) composed of controlling access to buildings, grounds, requirement of metal
detector, random metal check, drug check, uniforms, ID badges, and security systems.
3.6. Independent Variables: Family Level
Family factors have an effect on student role performance and their test scores
as well as individual and school factors. The variables included in family factors are
socioeconomic status, family composition, availability of family resource, and family
communication level. The relationships between each of these variables and test score
are examined in this study.
The family socioeconomic status variable is an interval quartile variable. The
family resources variable is an index composed of availability of newspaper,
magazines, computers, DVD players, dishwashers, dryers, more than 50 books, own
room, and fax machine. The family composition variable is binary, in which 0 is dual-
parent and 1 is single parent. The siblings variable is an interval measure, 0 siblings to
15
6 or more siblings. The family communication variable is created into a scale (the
Cronbach’s alpha .993) composed of how often students discuss school courses,
activities, class material, grades, transferring, preparation for ACT/SAT, going to
college, current events, and troubling things with their parents. The parents help with
homework is a binary variable; in which 0 is parents help with homework, 1 is parent
never help with homework.

16
CHAPTER 4
RESULTS
4.1. Means Comparison Tests (Univariate and Bivariate Analysis)
Table 1A shows that the percentage of students who are labeled as deviant is
52.3%, and 47.7% of the population is non-deviant. Also, there is a statistically
significant difference in test score between non-deviant students and deviant students.
The mean test scores show that deviant students achieve lower test scores that
non-deviant students (49.2 vs. 52.7).
Under Students Role Performance factors, deviant students are less likely to be
female (52.5% vs. 49.2%), more likely to be minority students (31.0% vs. 40.5%),
more likely to have been held back a grade (0.1 times vs. 0.16 times), more likely to
take remedial classes (0.09 classes vs. 0.12 classes), more likely to show at least one
disability (9.7% vs. 14.5%), less likely to be unprepared for class (23.1% vs. 43.5%),
less likely to spend time in homework per week (11.47 hours vs. 9.75 hours), less
likely to be prepared in Math class (90.6% vs. 84.9%), more likely to have parents
contacted of the school ( 0.23 times vs. 0.52times), less likely to participate in
extracurricular activities at school (72.8% vs. 56.5%), less likely to participate in
college preparation (22.2% vs. 20.4%), and more likely to work (60.2% vs. 67.2%).
These differences are all statistically significant.
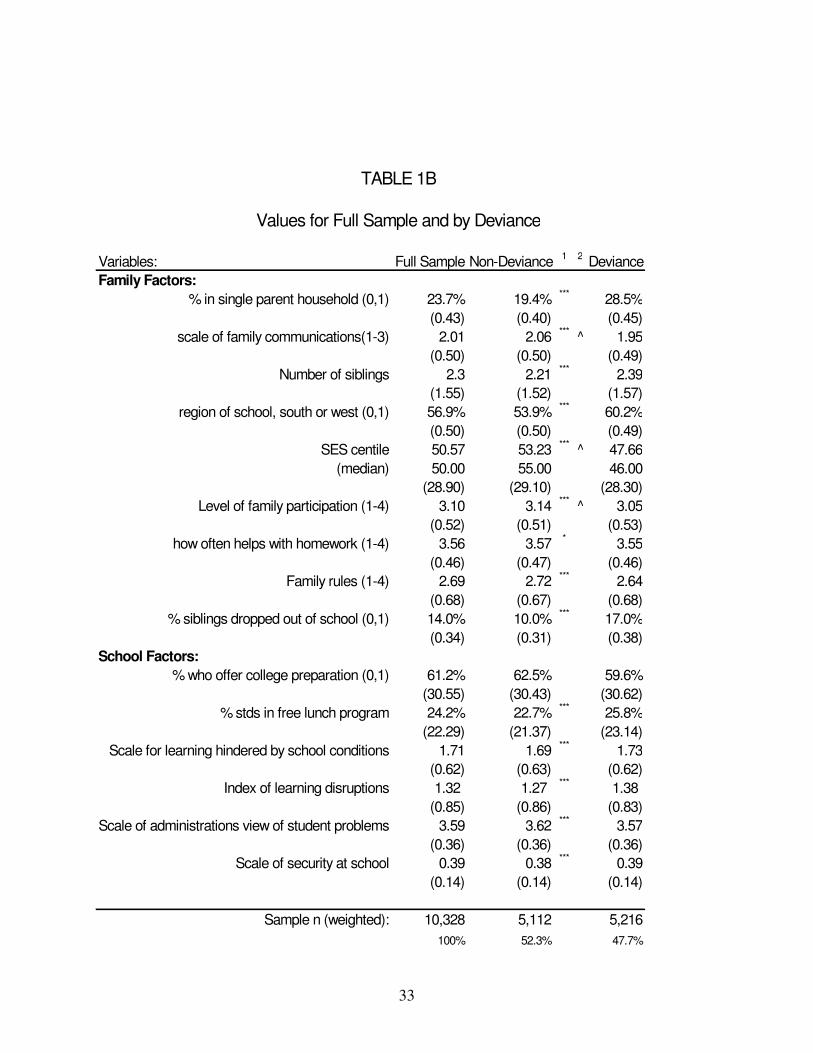
Table 1B shows family factors and school factors. Deviant students are less
likely to live in two parents household (19.4% vs. 28.5%), to have lower levels of
family communication (2.06 level vs. 1.95 level), to have more siblings (2.21 vs. 2.39),

17
have lower SES (53.23 centile vs.47.66 centile), to receive lower levels of family
participation in school (3.14 level v. 3.05 level), less likely to receive help on
homework (3.57 times vs. 3.55 times), to have less family roles (2.72 vs. 2.64), and
more likely to have siblings who dropped out of school (10% vs. 17%). All results are
statistically significant.
In school factors, deviant students are less likely to prepare for college (62.4%
vs. 59.6%), more likely to be enrolled in schools that provide free lunch (22.7% vs.
25.8%), more likely to attend schools with less than adequate school conditions (1.69%
vs. 1.73%), more likely to attend schools that disrupt learning (1.27 vs. 1.38), less
likely to attend schools that the administrations view of students problems (3.62% vs.
3.57%), and more likely to attend schools with more security ( 0.38 vs. 0.39). All of
these differences are shown statistically significant.
4.2. Ordinary Least Squares (OLS) Regression (Multivariate Analysis)
The Table 2 shows effects of each of independent variables on the dependent
variables, and test score differences for deviant students and non-deviant students
separately in students role performance, family, and school factors. Also it explains
that those three factors do not have the same effect on test scores.
In the full sample, the adjusted R-square is shown to be 0.518, with a constant
value of 64.267, this is significant at 0.001 levels. This also shows that there are
significant differences between the test scores of deviant (Adjusted R-sq 0.490***) and
non-deviant students (Adjusted R-sq 0.514***). Net of other factors, deviant students
achieve lower test scores (-0.56) than non-deviant students.
The other results show that, net of other factors, being female, being minority,
being held back a grade, attending at least one remedial class, having at least one

18
disability, coming to class unprepared, having parents contacted, working, living in
two parent household, having more siblings, region of school, less family participation,
less help on homework, fewer family rules, having sibling dropped out of school,
attending school with fee lunch, attending schools having a condition that hinders
learning, attending schools with learning disruptions, students whose administration
have a view of students problems, and attending school with security have negative
effects on test scores. On the other hand, living in English speaking households, hours
spent in homework, preparation for math class, participating in extracurricular
programs in school, SES composition, family communication level, and attending
school with college preparation programs have a positive effect on test scores.
The table 2 also shows the test score differences between deviant and
non-deviant students separately. In student role performance factors, being a female
will decrease test scores (-1.407), this relationship holds true for both deviant and
non-deviant students. Being a minority will decrease test score (-3.275), this
relationship holds true for both deviant and non-deviant students. Being held back a
grade also decreases test score (-4.352), this relationship holds true for both deviant
and non-deviant students, however, non-deviant students are imported more deviant
students (-4.870 vs. –4.015). Students living in English speaking households have
higher test scores (2.079), the relationship holds true for both non-deviant and deviant
students. Students not attending remedial classes where necessary will decrease test
scores (-2.656), this relationship holds true for both deviant and non-deviant students.
Coming to class unprepared decreases test cores (-1.203), this relationship holds true
for both deviant and non-deviant students, but non-deviant students are affected more
than deviant students (-1.777 vs. –0.713). More hour spent on homework will impose

19
test scores (0.082), the relationship holds true for both non-deviant and deviant
students. Math preparation increases test scores (1.114), the relationship holds true for
both non-deviant and deviant students. When schools contact parents, this will
decrease test scores (-2.262), the relationship holds true for both non-deviant and
deviant students, however, non-deviant students are affected more than deviant
students (-2.643 vs. –2.006). Student participating on extracurricular programs
increases test scores (0.716), the relationship holds true for both non-deviant and
deviant students. Taking college preparation courses will increase test scores (0.511),
the relationship holds true for both non-deviant and deviant students, however,
non-deviant students have an enhanced effect than deviant students.
In family factors, students living in single parent households will show lower
test scores (-0.487), the relationship holds true for both non-deviant and deviant
students. Having more communication in the family will impose test scores (0.936),
the relationship holds true for both non-deviant and deviant students. Larger numbers
of siblings lowers test scores (-0.313). The relationship holds true for both non-deviant
and deviant students. Attending school in southwest region decreases test scores
(-0.279). The relationship only holds true for non-deviant students. Higher SES
increases test scores (3.800). Having siblings drop out of school lowers test scores
(-0.459), but the relationship only holds true for non-deviant students.
In school factors, school conditions that hinder learning decreases test scores
(-0.030), the relationship holds true only for non-deviant students. Disruption of
learning decreases test scores (-1.174), the relationship holds true both for non-deviant
and deviant students. Administrations view of students as problems lower test scores
(-0.418), the relationship holds true only for non-deviant students. Poor school security

20
decreases test scores (-1.843), the relationship holds true only for non-deviant students.
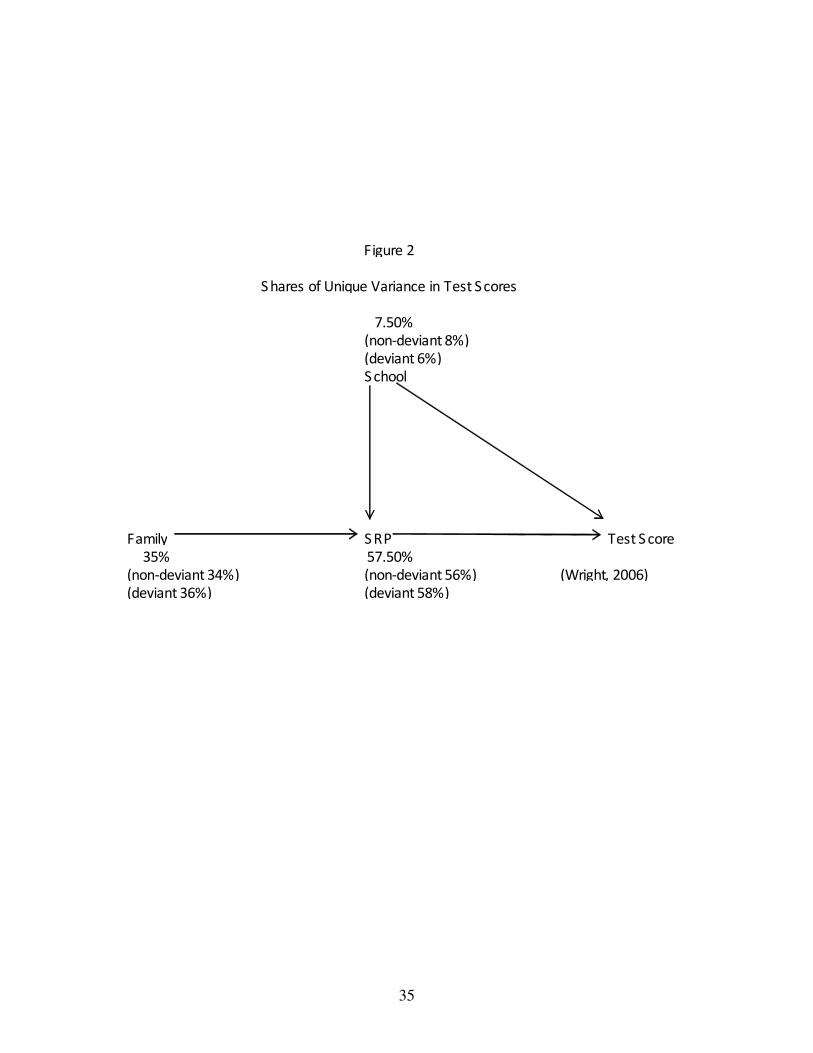
Figure 2 shows the percent of unique variance on test score explained by each
of the three factors, 1) student role performance, 2) family, and 3) school. Fifty-seven
and one-half percent of the variance in test scores is explained by the SRP variables,
with deviant students having slightly more of the variance explained. Family factors
account for 35 percent of the variance in test scores and again, slightly more is
explained for the deviant group. School factors explain 7.5 percent of variance in test
scores, and a more is explained for the non-deviant group in this variable set. Figure 2
shows that SRP has the great impact on test scores for both deviant and non-deviant
groups, family has a moderate impact on test scores, and school variables have, by far,
the least impact.

21
CHAPTER 5
DISCUSSION
5.1. Conclusion
The purpose of this study is to examine how individual, family, and school
factors affect student test scores. Test scores were predicted to be higher in non-deviant
students than in deviant students. Also, in individual factors, test scores were predicted
to be higher among non-minorities than minorities, among students who participate in
extracurricular programs as opposed to students who don’t, among students who spent
more time on homework as opposed to students who spent less time, among student
who come to class prepared than among students who come to class unprepared. In
school factors, test scores were predicted to be higher among students who attended
schools with more resources than among students who attended schools with less
resource, as well as, students who attended schools that had more rules and who
attended schools with more school problems. In family factors, test scores were
predicted to be higher among students whose families have more resources available
than among students whose families have less resources. Students who have more
family communication than in students who had less experience the same trends.
The results of this study show that there is a statistically significant
difference between deviant and non-deviant students in test scores, and most of all, the
independent variables of student role performance, school, and family factors are
shown to also have significant affects on test scores. The mean test scores show that
deviant students achieve lower test scores that non-deviant students (49.2 vs. 52.7), so

22
hypothesis #1 that deviant students achieve lower test scores than non-deviant students,
net of other factors is supported.
Multivariate analysis shows that minority students achieve lower test scores
than non-minority students (-3.275), students who participate in extracurricular
programs in school achieve higher test scores (0.716), students who spend more hours
on homework achieve higher test scores (0.082), and students coming to class
unprepared achieve lower test scores (-1.203). These results indicate that hypothesis #2,
#3, #4, and #5 are supported. In school factors, students who attend a school with
problems, such as disruptions of learning (-1.174) and inadequate condition that hinder
learning (-0.194), test scores decrease. These findings also support the hypothesis #6
and #7. In family factors, as family SES increases, test scores increase (3.800), with
students having more siblings achieving lower test scores (-0.313). With more family
communication, test scores increase (0.936). These findings also support the
hypothesis #8, #9 and #10.
5.2. Limitations
The limitations of this study include the definition of deviance. In this study,
deviance is defined as frequency of times students are late for class, skip classes, and
absent from school, get in trouble, are put on in-school suspension, are transferred for
disciplinary reasons. All are defined by the schools. It does not indicate a level of
social deviance. Lower test scores represent failure in school, thus representing
deviance. However, for further study, other explanations on lower test scores should be
considered. Also, the data used for the study was cross-sectional data. Students’ history
of deviance and their academic history are not known. Many of SRP factors used in
this study might have also measure school influences, for example, students who attend

23
school that have no extracurricular programs are not able to participate the programs
even though the students want to do so.
5.3. Policy Implementation
The results in this study indicate that student role performance factors are
more critical for both non-deviant and deviant students than family and school factors
to affect students’ test scores. Family and school factors should not be ignored, but
regarded as important factors that affect test scores. In order to achieve higher test
scores for both deviant and non-deviant students, policies including all three factors
need to be developed. Giving more support to programs for disable students,
encouraging students to participate extracurricular activities in school, and increasing
family communication with students, such as helping homework or participating
school activities, would be policies that might achieve higher test scores. Also, schools
should provide safe environments without any learning disruptions.

24
BIBLIOGRAPHY

25
BIBLIOGRAPHY
Alderman-Swain, Wanda and Juan Battle. 2000. “The Invisible Gender: Educational
Outcomes for African American Females in Fathers-Only Versus Mother-Only
Households.” Race & Society 3: 165-82.
Aunola, Kaisa, Hakan Stattin, and Jari-Erik Nurmi. 2000. “Parenting Styles and
Adolescents’ Achievement Strategies.” Journal of Adolescence 23: 205-222.
Barbarin, Oscar A., and Robin E. Soler. 1993. “Behavioral, Emotional, and Academic
Adjustment in a National Probability Sample of African American Children: Effects of
Age, Gender, and Family Structure. Journal of Black Psychology 9:423-46.
Brody, Linda E., and Camilla Persson Benbow. 1990. “Effects of High School
Coursework and Time on SAT Scores.” Journal of Educational Psychology 82:
866-75.
Broth, Beckett A. 2002. “ Linking Extracurricular Programming to Academic
Achievement: Who Benefits and Why?” Sociology of Education 75: 69-91.
“Changes in the Higher Education Commission’s Draft Report.” The Chronicle of
Higher Education 52:47.
Coleman, James S. 1961. The Adolescence Society. Glencoe, IL: Free Press.
Cureton, Steven R. 2003. “Race-Specific College Student Experiences on a
Predominantly White camps.” Journal of Black Studies 33:295-311.
Davenport, Ernest C., Jr., Mark L. Davison, Hailiang Kuang, Shaui Ding, Se-kang
Kim,and Nohoon Kwak. 1998. “High School Mathematics Course-Taking by Gender
and Ethnicity.” American Educational Research Journal 35:497-514.
Downey, Douglas. 1995b. “When Bigger is not Better: Family Size, Parental
Resources, and Children’s Educational Performance. American Sociological Review
60:746-61.
26
Dweck, Carol S., William Davidson, Sharon Nelson, and Bradley Enna. 1978. “ Sex
Differences in Learned Helplessness: II. The Contingencies of Evaluative Feedback in
the Classroom and III. An Experimental Analysis.” Developmental Psychology 14:
268-76.
Eitle, Tamela M., and David J. Eitle. 2002. “ Race, Cultural Capital, and The
Educational Effects of Participation in Sports.” Sociology of Education 75: 123-46.
Elliott, Delbert S. and Harwin L. Voss. 1974. Delinquency and Dropout. Baltimore:
Johns Hopkins University, Center for Social Organization of Schools.
Entwisle, Doris R., Karl L. Alexander and Linda S. Olson. 1997. Children, Schools,
and Inequality. Boulder, CO: Westview Press.
Epstein, Joyce L., Karen Clark Salinas, Mavis G. Sanders, and Beth S. Simon. 1997.
School, Family, and Community Partnerships: Your Handbook for Action. Thousand
Oaks, CA: Corwin Press, Inc.
Farkas, George, Robert P. Grabe, Daniel Sheehan, and Yuan Shuan. 1990. “ Cultural
Resources and School Success: Gender, Ethnicity, and Poverty Groups within an
Urban School District.” American Sociological Review 55:127-42.
Fejgin, Naomi. 1995. “ Factors Contributing to the Academic Excellence of American
Jewish and Asian Students.” Sociology of Education 68: 18-30.
Gray, Marjory R., and Laurence Steinberg. 1999. “ Unpacking Authoritative Parenting:
Reassessing a Multidimensional Construct. Journal of Marriage and Family 61:
574-587.
Hagan, John, Ross MacMillan, and Blair Wheaton. 1996. “ New Kid in Town: Social
Capital and the Life Course Effects of Family Migration on Children.” American
Sociological Review 61:368-85.
Hallinan, Maureen T. 2001. “Sociological Perspectives on Black-White Inequalities in
American Schooling.” Sociology of Education 74(Suppl.):50-70.

27
Hanson, Sandra L., and Rebecca S. Kraus. 1998. “Women, Sports and Science: Do
Female Athletes Have an Advantage?” Sociology of Education 71:93-110.
Hedges, Larry V. and Amy Nowell. 1995. “ Sex Differences in Mental Test Scores.
Variability, and Numbers of High-Scoring Individuals.” Science 269: 41-5.
Henggeler, Scott W. 1989. Delinquency in Adolescence. Newbury Park: CA: Sage
Pulications.
Higher Education: In Need of Reform. (National Conference of State Legislatures’
Blue Ribbon Commission on Higher Education). State Legislatures 33:6-7.
Hirschi, Travis. [1969] 2002. Causes of Delinquency. Berkeley: University of
California Press.
Hochschild, Jennifer L. and Nathan Scovronick. 2003. The American Dream and The
Public Schools. Oxford, UK: Oxford University Press.
Hofferth, Sandra L., Johanna Boisjly, and Greg J. Duncan. 1998. “Parents’ Extra
familial Resources and Children’s school Attainment.” Sociology of Education
71:246-68.
Hyde, Janet Shibley, Elizabeth Fennema, and Susan J. Lamon. 1990. “Gender
Differences in Mathematics Performance: A Meta-Analysis.” Psychological Bulletin
107: 139-55.
Jencks, Christopher and Meredith Philips. 1998. Explaining the Black/White Test Score
Gap. Washington, D.C: Brookings Institution Press.
Karabel, Jerome and A.H. Halsey. 1977. Power and Ideology in Education. New York,
NY: Oxford University Press.
Keith, Timthy Z., and Mark J. Benton. 1992. “ Effects of Manipulable Influences on
High School Grades Across Five Ethnic Groups. Journal of Educational Research 86:
85-93.
28
Lamborn, Susie D., Nina S. Mounts, Laurence Steinberg, and Sanford M. Dornbusch.
1991. “Patterns of Competence and Adjustment among Adolescents from
Authoritative, Authoritarian, Indulgent, and Neglectful Families.” Child Development
62: 1049-65.
Leone, Carla M., and Maryse H. Richards. 1989. “ Classwork and Homework in Early
Adolescence: The Ecology of Achievement.” Journal of Youth and Adolescence 18:
531-48.
MacLeod, Jay. 1987. Ain’t No Makin’ It: Leveled Aspirations in a Low-Income
Neighborhood. Boulder, CO: Westview Press.
Marsh, Harbert W. 1992. “Extracurricular Activities: Beneficaial Extension of the
Traditional Curriculum or Subversion of Academic Goals?” Journal of Educational
Psychology 84:553-62.
Melnick, Merrill J., Donald F. Sabo, and Beth Vanfossen. 1992. “Educational Effects
of Interscholastic Athletic Participation on African-American and Hispanic Youth.”
Adolescence 27:295-308.
Mickelson, Roslyn A.1990. “The Attitude-Achievement Paradox Among Black
Adolescents.” Sociology of Education 63: 44-61.
Muller, Chandra and Kathryn S. Schiller. 2000. “Leveling the Playing Field? Students’
Educational Attainment and States’ Performance Testing.” Sociology of Education 73:
196-218.
Murnane, Richard J., and Frank Levy. 1997. “A Civil Society Demands Education for
Good Jobs.” Educational Leadership 54:34-37.
Natriello, Gary, and Edward L. McDill. 1986. “Performance Standards, Student Effort
on Homework, and Academic Achievement.” Sociology of Education 59: 18-31.
Ogbu, John U. 2003. Black American Students in an Affluent Suburb: A study of
Academic Disengagement. Mahwah, NJ: Lawrence Erlbaum Associates,.Inc.

29
Pallas, Aaron M., and Karl L. Alexander. 1983. “Sex Differences in Quantitative SAT
Performance: New Evidence on the Differential Coursework Hypothesis.” American
Educational Research Journal 20:165-82.
Payne, Mnique R. 2003. “The Differential Impact of Family Characteristics on The
Academic Achievement of Black and White Youth.” Race & Society 6: 141-62.
Perkins, Peggy G., and Roberta M. Milgram. 1996. “Parent Involvement in
Homework: A Double-Edged Sword.” International Journal of Adolescence and Youth
6:195-203.
Peterson, Christopher and Martin E.P. Seligman. 1984. “Causal Explanations as a Risk
Factor for Depression: Theory and Evidence.” Psychological Review 91: 347-74.
Pino, Nathan W., and William L. Smith. 2004. “African American Students, The
Academic Ethic, and GPA.” Journal of Black Studies 35: 113-31.
Roscigno, Vincent J., and James W. Ainsworth Darnell. 1999. “Race, Cultural Capital,
and Educational Resources: Persistent Inequalities and Achievement Returns.”
Sociology of Education 72:158-78.
Schneider, Barbara and David Stevenson. 1999. The Ambitious Generation: America’s
Teenagers, Motivated But Directionless. New Haven, CT: Yale University Press.
Scott-Jones, Diane. 1995. Parent-Child Interactions and School Achievement.
Pp75-107 in Rayn, Breuce A., Gerald R. Adams, Thomas P. Gullotta, Roger P.
Weissberg, and Robert L. Hampton (Eds.), The family-School Connection: Theory,
Reserch, and Practice. Thousand Oaks, CA: Sage Publications.
Skaalvik, Einar M. 1997. “Self-Enhancing and Self-Defeating Ego Orientation:
Relations With Task and Avoidance Orientation, Achievement, Self-Perceptions, and
Anxiety.” Journal of Educational Psychology 89: 71-81.
Stevenson, David L., Kathryn S. Schiller, and Barbara Schneider. 1994. “Sequences of
Opportunities for Learning.” Sociology of Education 67:184-98.

30
Teske, Paul, Jody Fitzpatrick, and Gabriel Kaplan. 2006. “The Information Gap?” The
Review of Policy Research 23: 969-982.
U.S. Department of Education, National Center for Education Statistics. 1996. Urban
Schools: The Challenge of Location and Poverty. Washington, DC: U.S. Department of
Education, Office of Educational Research and Improvement.
Voelkl, Kristin E., John W. Welte, William F.Wieczorek. 1999. “Schooling and
Delinquency Among White and African American Adolescents.” Urban Education 34:
69-88.
Vogt Yuan, Anastasia S. 2005. “Sex Differences In School Performance During High
School: Puzzling Patterns and Possible Explanations.” The Sociological Quarterly 46:
299-321.
Wright, David W. 2007. Seminar in Sociological Theory. Spring. Wichita, KS: Wichita
State University.
Zill, Nicholas. 1996. Family change and student achievement: What we have learned,
What it means for schools. Pp139-174 in Booth, Alan and Judith F. Dunn (Eds.),
Family-School Links: How Do They Affect Educational Outcomes?. Mahwah, NJ:
Lawrence Erlbaum Associates, Inc.

31
APPENDIX

32
TABLE 1A
Values for Full Sample and by Deviance
Variables: Full Sample Non-Deviance1 2
Deviance
Standardize Test Score (mean) 51.0 52.7***
^ 49.2
Standardize Test Score (median) 51.38 53.51 49.08
(stddev) (9.48) (9.42) (9.18)
Student Role Performance:
%Female (0,1) 50.9% 52.5%***
49.2%
(0.50) (0.50) (0.50)
%Minority (0,1) 35.5% 31.0%***
40.5%
(0.48) (0.46) (0.49)
% Times students held back a grade (0,1) 12.6% 9.6%***
15.8%
(0.33) (0.29) (0.37)
Number of Remedial Classes (0.1) 0.11 0.09***
0.12
(0.31) (0.29) (0.33)
% At Least one disability (0,1) 12.0% 9.7%***
14.5%
(0.33) (0.30) (0.35)
% Student come Unprepared (0,1) 32.8% 23.1%***
43.5%
(0.47) (0.42) (0.50)
Hours Student Spends on Home Work per week 10.65 11.47***
^ 9.75
(8.81) (9.02) (8.49)
% of students prepared in Math Class (0,1) 87.9% 90.6%*
^ 84.9%
(0.33) (0.29) (0.36)
% school contact parent (0,1) 37.2% 23.5%***
52.1%
(0.48) (0.42) (0.50)
% Extracurricular participation at school (0,1) 65.0% 72.8%***
^ 56.5%
(0.48) (0.44) (0.50)
%Participated in college prep(0,1) 21.3% 22.2%*
20.4%
(0.41) (0.42) (0.40)
%Students who work (0,1) 63.6% 60.2%***
67.2%
(0.48) (0.49) (0.47)
Sample n (weighted): 10,328 5,112 5,216
100% 52.3% 47.7%
1=***p<0.001; **p<0.01; *p<0.05
2= ̂effect size greater=>.20
33
TABLE 1B
Values for Full Sample and by Deviance
Variables: Full Sample Non-Deviance1 2
Deviance
Family Factors:
% in single parent household (0,1) 23.7% 19.4%***
28.5%
(0.43) (0.40) (0.45)
scale of family communications(1-3) 2.01 2.06***
^ 1.95
(0.50) (0.50) (0.49)
Number of siblings 2.3 2.21***
2.39
(1.55) (1.52) (1.57)
region of school, south or west (0,1) 56.9% 53.9%***
60.2%
(0.50) (0.50) (0.49)
SES centile 50.57 53.23***
^ 47.66
(median) 50.00 55.00 46.00
(28.90) (29.10) (28.30)
Level of family participation (1-4) 3.10 3.14***
^ 3.05
(0.52) (0.51) (0.53)
how often helps with homework (1-4) 3.56 3.57*
3.55
(0.46) (0.47) (0.46)
Family rules (1-4) 2.69 2.72***
2.64
(0.68) (0.67) (0.68)
% siblings dropped out of school (0,1) 14.0% 10.0%***
17.0%
(0.34) (0.31) (0.38)
School Factors:
% who offer college preparation (0,1) 61.2% 62.5% 59.6%
(30.55) (30.43) (30.62)
% stds in free lunch program 24.2% 22.7%***
25.8%
(22.29) (21.37) (23.14)
Scale for learning hindered by school conditions 1.71 1.69***
1.73
(0.62) (0.63) (0.62)
Index of learning disruptions 1.32 1.27***
1.38
(0.85) (0.86) (0.83)
Scale of administrations view of student problems 3.59 3.62***
3.57
(0.36) (0.36) (0.36)
Scale of security at school 0.39 0.38***
0.39
(0.14) (0.14) (0.14)
Sample n (weighted): 10,328 5,112 5,216
100% 52.3% 47.7%

34
Table 2
OLS Regression Analysis(Dependent variables=Test score)
Full Sample Non-Deviance DevianceVariables: unstd. 1 std. unstd. 1 std. 2 unstd. 1 std.
Individual-level factors:Deviant (0,1) -0.557 *** -0.029Female (0,1) -1.407 *** -0.074 -1.473 *** -0.078 -1.302 *** -0.071Minority (0,1) -3.275 *** -0.165 -3.350 *** -0.164 -3.136 *** -0.168
English Speaking household (0,1) 2.079 *** 0.074 2.266 *** 0.079 1.897 *** 0.071 held back a grade(0,1) -4.352 *** -0.152 -4.870 *** -0.152 <> -4.015 *** -0.160
At Least one Remedial Classes (0.1) -2.656 *** -0.087 -2.686 *** -0.083 -2.534 *** -0.090At Least one disability (0,1) -6.210 *** -0.213 -6.452 *** -0.203 -5.953 *** -0.228
Student come Unprepared (0,1) -1.203 *** -0.060 -1.777 *** -0.080 <> -0.713 *** -0.038Hours Student Spends on Home Work 0.082 *** 0.076 0.087 *** 0.083 0.075 *** 0.070% of Student Prepared in Math Class 1.114 *** 0.038 0.926 0.029 1.274 *** 0.050
School Contacted Parent (0,1) -2.262 *** -0.115 -2.643 *** -0.119 <> -2.006 *** -0.109Extracurricular Participation at School (0,1) 0.716 *** 0.036 0.830 *** 0.039 0.642 *** 0.035
college preparation course (0,1) 0.511 *** 0.022 0.690 *** 0.030 <> 0.273 ** 0.012Students who work (0.1) -0.270 * -0.014 -0.439 -0.023 -0.094 -0.005
Family Factors:single parent household (0,1) -0.487 *** -0.022 -0.831 *** -0.035 -0.231 *** -0.011
scale of family communications(1-3) 0.936 *** 0.049 0.844 *** 0.045 1.026 0.055Number of siblings -0.313 *** -0.051 -0.257 *** -0.041 -0.371 *** -0.063
region of school south west -0.279 * -0.015 -0.345 * -0.018 -0.137 -0.007parent's SES 3.800 *** 0.292 3.651 *** 0.288 3.927 *** 0.302
Level of family participation (1-4) -1.134 *** -0.062 -1.385 *** -0.075 -0.899 *** -0.052how often helps with homework(1-4) -0.989 *** -0.048 -0.868 *** -0.043 -1.093 *** -0.055
Family rules (1-4) -0.539 *** -0.039 -0.696 *** -0.050 -0.340 * -0.025siblings dropped out of school (0,1) -0.459 * -0.017 -0.713 *** -0.023 -0.184 -0.007
School Factors:% stds in free lunch program -0.030 *** -0.071 -0.033 *** -0.075 -0.028 *** -0.071
Scale for learning hindered by school conditions -0.194 -0.013 -0.230 * -0.015 -0.154 -0.010Index of learning disruptions -1.174 *** -0.105 -1.255 *** -0.115 -1.077 *** -0.097
Scale of administrations view of student problems -0.418 * -0.016 -0.598 ** -0.023 -0.250 -0.010Scale of security at school -1.843 *** -0.028 -2.717 *** -0.041 -1.007 -0.016
(Constant): 64.267 *** 66.755 *** 60.910 ***
Adjusted R-sq. 0.518 *** 0.514 *** 0.490 ***
N= 10,328 5,112 5,2161=***p<0.001; **p<0.01; *p<0.05
2. Significant difference between not deviance and deviance at the .05 level or higher
35
Figure 2
S hares of Unique Variance in Test Scores
7.50%
(non-deviant 8%)
(deviant 6%)
S chool
Family S RP Test S core
35% 57.50%
(non-deviant 34%) (non-deviant 56%) (Wright, 2006)
(deviant 36%) (deviant 58%)