Embed Size (px)
Citation preview

The effect of Augmented Reality and Virtual Reality interfaces on Epistemic Actions and
the Creative Process
______________________________________
A Dissertation
Presented to
The Faculty of the Graduate School
at the University of Missouri-Columbia
_______________________________________________________
In Partial Fulfillment
of the Requirements for the Degree
Doctor of Philosophy
_____________________________________________________
by
TILANKA CHANDRASEKERA
Dr. So-Yeon Yoon, Dissertation Supervisor
December 2015
The undersigned, appointed by the dean of the Graduate School, have examined the
dissertation entitled
The effect of Augmented Reality and Virtual Reality interfaces on epistemic actions and
the Creative Process
presented by Tilanka Chandrasekera
a candidate for the degree of doctor of philosophy and hereby certify that, in their
opinion, it is worthy of acceptance.
Professor So-Yeon Yoon
Professor Newton D'Souza
Professor Bimal Balakrishnan
Professor Joi Moore

ii
ACKNOWLEDGEMENTS
I would like to express my deepest appreciation to Dr. So-Yeon Yoon, for guiding
me and providing advice in completing this dissertation. You have been a pillar of
strength and have supported me throughout. I would also like to thank my committee
members, Dr. Newton D’Souza, Dr. Bimal Balakrishnan and Dr. Joi Moore, for their
continuous support through this entire process.
I would also like to express my gratitude to all of my students who have been
inspirational and helped me with collecting data for this dissertation. I offer my sincere
appreciation to my uncle, Indrasiri Fernando, who has helped me in more ways than can
be mentioned here.
Finally my heartfelt thanks to my parents, loving wife, Kinkini and the joy of my
life, Thevjana. The encouragement, comfort, and relief received are immeasurable.

iii
TABLE OF CONTENTS
Acknowledgements .................................................................................................. ii
List of Tables ......................................................................................................... vii
List of Figures ......................................................................................................... ix
Abstract .................................................................................................................. xii
Preface ................................................................................................................... xiv
Chapter 1: Introduction .................................................................................................1
Factors Affecting the Design Process ......................................................................2
Purpose of the Study ................................................................................................7
Research Contributions and Significance of the Study ............................................8
Research Approach and Methodology ...................................................................11
Definition of Terms................................................................................................12
Chapter 2: Literature Review ....................................................................... 15
Creative Design Problem Solving: The Process ....................................................15
Creativity................................................................................................................16 Defining Creativity in Context...................................................................19
Fixation ..................................................................................................................20 Identifying and Measuring Fixation...........................................................24
Epistemic Action ....................................................................................................25 Identifying and Measuring Epistemic Action ............................................27
Cognitive Load.......................................................................................................29 Embodied Cognition and Cognitive Load Theory ......................................31 Measuring Cognitive Load .........................................................................33

iv
Effects of Media Interfaces on Fixation .................................................................36 Tangible versus Graphical Interaction .......................................................37 Embodiment and Tangibility ....................................................................39 Virtual Reality (VR) and Augmented Reality (AR) ..................................42 Virtual Reality (VR) ..................................................................................43 Augmented Reality (AR) ...........................................................................45
Effects of User Characteristics on the Design Process ..........................................49 Learning Styles .........................................................................................51 Learning Styles in Design Education .........................................................53 Creativity, Motivation, and Acceptance ...................................................54 Measuring Learning Styles: VARK Learning Styles Inventory ................56
Understanding Design Process via Protocol Analysis ...........................................57 Linkography ...............................................................................................58
Creativity, Entropy, and Fixation...........................................................................61
Chapter 3: Method ........................................................................................ 64
Research Questions and Hypotheses .....................................................................65 Hypothesis for RQ1.1-1.3 ..........................................................................65
Hypotheses for RQ2.1-2.2 .........................................................................66
Participants .............................................................................................................67
Experiment: Design Problem Solving Tasks .........................................................68 Design Narrative ........................................................................................70 Experimental Setting ..................................................................................72 Procedure for the Protocol Analysis ..........................................................79
Instruments ...........................................................................................................85 Demographic Information ..........................................................................85 VARK Learning Styles Inventory .............................................................86 NASA TLX Cognitive Load Tool .............................................................86 Technology Acceptance Model Questionnaire ..........................................87
Chapter 4: Part 1 - Design Process ............................................................... 89
Objectives and Hypotheses ....................................................................................89
Linkography ...........................................................................................................89 Analysis and Discussion ............................................................................90 Calculating Overall Entropy Levels .........................................................121

v
Cognitive Load.....................................................................................................124
Epistemic Action ..................................................................................................126 Summary of Findings ...........................................................................................131
Chapter 5: Part 2 – Tangibility in interfaces and Learning style ................ 134
Objectives and Hypotheses ..................................................................................134
Analysis and Discussion ......................................................................................135 Reliability and Validity of the Instrument ...............................................136 Comparison of the Dependent Variables between the Interface Types ........................................................................................................137 Comparison of the Dependent Variables between Interface Type
and Learning style ..............................................................................138 Relationships between Perceived Usefulness and Behavioral
Intention to Use, as well as Perceived Ease of Use and Behavioral Intention to Use ..................................................................................140
Summary of Findings ...........................................................................................140
Chapter 6: Discussion and Implications ...................................................... 143
Conclusion ...........................................................................................................143
Implications..........................................................................................................145 Theoretical Implications ..........................................................................146 Methodological Implications ...................................................................148 Practical Implications...............................................................................148
Limitations ...........................................................................................................151
Future Directions .................................................................................................153
References ........................................................................................................................155
Appendix ..........................................................................................................................179
Appendix A: VARK Questionnaire .....................................................................179
Appendix B: NASA TLX ....................................................................................181
Appendix C: Technology Acceptance Model Questionnaire ..............................182
Appendix D: Oklahoma State University Institutional Review Board ................185 Appendix E: Recruiting Letter .............................................................................186 Appendix F: Informed Consent Form for Social Science Research ....................187

vi
Appendix G: Demographic Survey ......................................................................190 Appendix H: AR and VR Operational Training Manual .....................................192
Appendix I: Workload Tally Sheet and Weighted Rating Worksheet .................198
Vita ...................................................................................................................................200

vii
LIST OF TABLES
Table 1. Hypothetical Linkographs, Interpretations, and Entropies ..................................60
Table 2. Demographics in the Two Groups .......................................................................68
Table 3. Demographics of the Participants Who Were Randomly Selected for Protocol Analysis ...................................................................................................80
Table 4. Excerpt of Coding Showing Consecutive Moves in One of the Protocols ..........81
Table 5. Coding for Epistemic Action ...............................................................................84
Table 6. Descriptive Statistics for Augmented Reality Participant 1 ................................91
Table 7. Descriptive Statistics for Augmented Reality Participant 2 ................................94
Table 8. Descriptive Statistics for Augmented Reality Participant 3 ................................97
Table 9. Descriptive Statistics for Augmented Reality Participant 4 ..............................100
Table10. Descriptive Statistics for Augmented Reality Participant 5 .............................104
Table 11. Descriptive Statistics for Virtual Reality Participant 1 ....................................106
Table 12. Descriptive Statistics for Virtual Reality Participant 2 ....................................109
Table 13. Descriptive Statistics for Virtual Reality Participant 3 ....................................113
Table 14. Descriptive Statistics for Virtual Reality Participant 4 ....................................116
Table 15. Descriptive Statistics for Virtual Reality Participant 5 ....................................119
Table 16. Overall Entropy Levels Across the Augmented Reality and Virtual Reality Interface Types ............................................................................122
Table 17. The Difference between Forelink Entropy and Backlink Entropy (FE-BE) ..................................................................................123
Table 18. Link Ratios in the Protocols.............................................................................124
Table 19. Overall Cognitive Load Measurement .............................................................125
Table 20. Proportion of Epistemic Actions in the Protocol .............................................127

viii
Table 21. Number and Proportion of Revisit Rotate Actions in Virtual Reality and Augmented Reality ..............................................................................................127
Table 22. Chi-Square Table for Revisit Rotate Actions ..................................................128
Table 23. Number and Proportion of Revisit Move Actions in Virtual Reality and Augmented Reality ..............................................................................................128
Table 24. Chi-Square Table for Revisit Move Actions ...................................................129
Table 25. Overall Epistemic Actions in Virtual Reality and Augmented Reality ...........129
Table 26. Chi-Square Table for Overall Epistemic Actions ............................................130
Table 27. Demographics in the Augmented and Virtual Reality Groups ........................135
Table 28. Descriptive Statistics for the Virtual and Augmented Reality Environments .......................................................................137
Table 29. ANOVA Summary Table for Interface Type ..................................................137
Table 30. Descriptive Statistics for Perceived Usefulness ...............................................138
Table 31. Two-Way ANOVA Summary Table for the Effect of Learner Preference and Interface Type on Perceived Usefulness .......................................................139
Table 32. Differences in Perceived Usefulness Between Augmented and Virtual Reality Interface by Learner preference ...........................................................................139
Table 33. Correlations Among Variables ........................................................................140

ix
LIST OF FIGURES
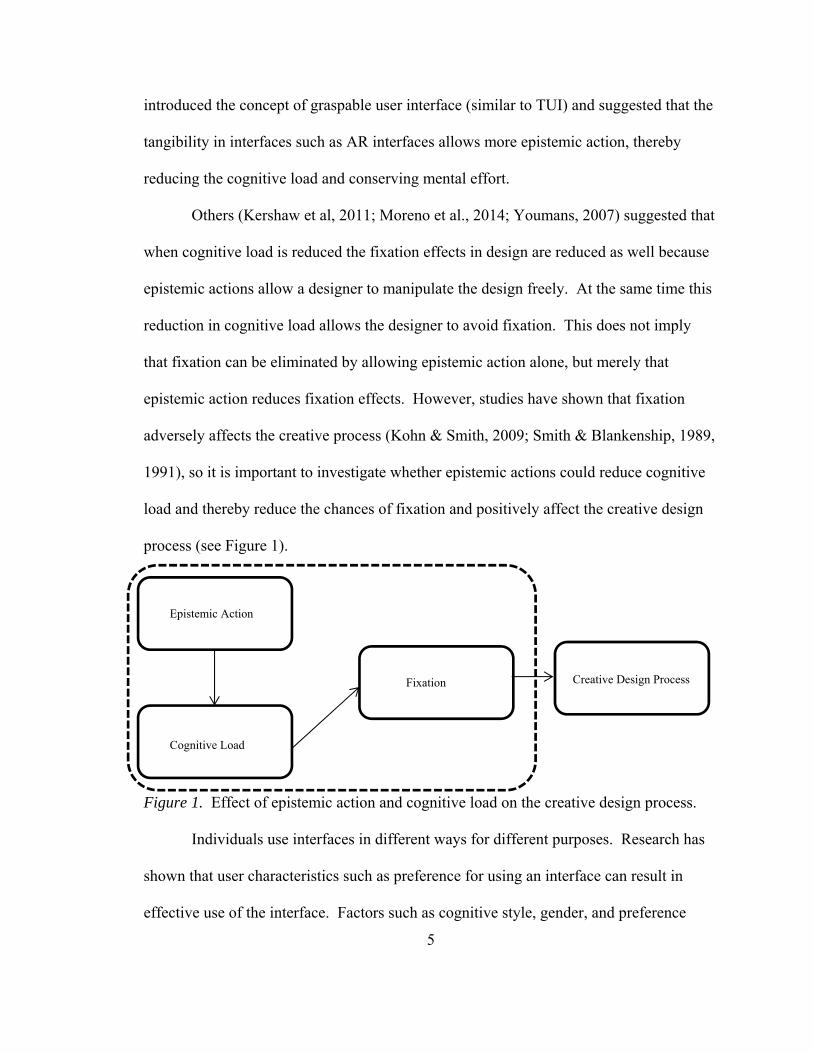
Figure 1. Effect of epistemic action and cognitive load on the creative design process .....5
Figure 2. Effect of learner preferences on using AR and VR in the creative design process......................................................................................................................7
Figure 3. The relationship between the physical environment, augmented reality, augmented virtuality, and virtual environment. Based on Miligram
and Kishino’s (1994) virtual-physical continuum diagram. ..................................46
Figure 4. Effect of motivation on the technology acceptance model (TAM). ...................55
Figure 5. Effect of learner preference through digital modalities. .....................................55
Figure 6. An example of a linkograph ...............................................................................59
Figure 7. An excerpt of a linkograph showing where fixation is occurring ......................61
Figure 8. Research variables ..............................................................................................64
Figure 9. Experimental design ...........................................................................................67
Figure 10. Task narrative presentation slide ......................................................................70
Figure 11. Floor plan of the office space ...........................................................................71
Figure 12. Office furniture .................................................................................................72
Figure 13. Workflow for augmented and virtual reality model generation .......................73
Figure 14. Moving, rotating, and scaling in Build AR for the virtual reality environment .....................................................................................74
Figure 15. Moving and rotating in Build AR for the augmented reality environment ................................................................................................74
Figure 16. Fiducial markers used in the AR environment: a is the marker; b is the image on the back of the marker; c is the AR model overlaid on the marker ....................................................................................................................75
Figure 17. AR furniture models .........................................................................................76
Figure 18. The augmented reality working environment ...................................................76

x
Figure 19. Screenshot of the augmented reality environment ...........................................77
Figure 20. Screenshot of the virtual reality environment ..................................................77
Figure 21. Markers printed on a single sheet .....................................................................78
Figure 22. The virtual reality working environment ..........................................................79
Figure 23. Equipment setup ...............................................................................................80
Figure 24. Linkograph for the design protocol of Augmented Reality participant 1 ........91
Figure 25. Horizon links entropy for Augmented Reality Participant 1 ............................93
Figure 26. Forelinks entropy for Augmented Reality Participant 1 ...................................93
Figure 27. Backlinks entropy for Augmented Reality Participant 1 ..................................93
Figure 28. Linkograph for the design protocol of Augmented Reality Participant 2 ........94
Figure 29. Horizonlinks entropy for augmented reality participant 2 ...............................96
Figure 30. Forelinks entropy for Augmented Reality Participant 2 ...................................96
Figure 31. Backlinks entropy for Augmented Reality Participant 2 ..................................96
Figure 32. Linkograph for the design protocol of Augmented Reality Participant 3 ........97
Figure 33. Horizonlinks entropy for Augmented Reality Participant 3 .............................99
Figure 34. Forelinks entropy for Augmented Reality Participant 3 ...................................99
Figure 35. Backlinks entropy for Participant 3 ..................................................................99
Figure 36. Linkograph for the design protocol of Augmented Reality Participant 4 ......100
Figure 37. Horizonlinks entropy for Augmented Reality Participant 4 ...........................102
Figure 38. Forelinks entropy for Augmented Reality Participant 4 .................................102
Figure 39. Backlinks entropy for Augmented Reality Participant 4 ................................103
Figure 40. Linkograph for the design protocol of Augmented Reality Participant 5 ......103
Figure 41. Horizonlinks entropy for Augmented Reality Participant 5 ...........................105
Figure 42. Forelinks entropy for Augmented Reality Participant 5 .................................105

xi
Figure 43. Backlinks entropy for Augmented Reality Participant 5 ................................105
Figure 44. Linkograph for the design protocol of Virtual Reality Participant 1 ..............106
Figure 45. Horizonlinks entropy for Virtual Reality Participant 1 ..................................108
Figure 46. Forelinks entropy for Virtual Reality Participant 1 ........................................108
Figure 47. Backlinks entropy for Virtual Reality Participant 2 .......................................109
Figure 48. Linkograph for the design protocol of Virtual Reality Participant 2 ..............109
Figure 49. Horizonlinks entropy for Virtual Reality Participant 2 ..................................111
Figure 50. Forelinks entropy for Virtual Reality Participant 2 ........................................111
Figure 51. Backlinks entropy for Virtual Reality Participant 2 .......................................112
Figure 52. Linkograph for the design protocol of Virtual Reality Participant 3 ..............112
Figure 53. Horizonlinks entropy for Virtual Reality Participant 3 ..................................114
Figure 54. Forelinks entropy for Virtual Reality Participant 3 ........................................114
Figure 55. Backlinks entropy for Virtual Reality Participant 3 .......................................115
Figure 56. Linkograph for the design protocol of Virtual Reality Participant 4 ..............115
Figure 57. Horizonlinks entropy for Virtual Reality Participant 4 ..................................117
Figure 58. Forelinks entropy for Virtual Reality Participant 4 ........................................118
Figure 59. Backlinks entropy for Virtual Reality Participant 4 .......................................118
Figure 60. Linkograph for the design protocol of Virtual Reality Participant 5 ..............119
Figure 61. Horizonlinks entropy for Virtual Reality Participant 5 ..................................120
Figure 62. Forelinks entropy for Virtual Reality Participant 5 ........................................121
Figure 63. Backlinks entropy for Virtual Reality Participant 5 .......................................121

xii
Abstract
The aim of the study is to investigate how VR and AR interfaces affect the
creative design process in design education. Theories from cognitive psychology,
information sciences, and design cognition are provide an explanatory mechanism to
indicate that epistemic action reduces cognitive load, thereby reducing fixation in the
design process and enhancing the creative design process.
Thirty undergraduate design students were randomly divided into two groups that
used AR or VR to complete a simple project that required students to design the interior
of an office. Mixed qualitative and quantitative methods were used. A linkography
protocol was used to understand the effect of different interfaces on the creative design
process and a questionnaire was administered to examine the effect of user characteristics
on the creative design process. Results of the study indicated that AR interfaces tend to
encourage more epistemic actions during the design process than the VR interfaces.
Epistemic actions were found to reduce the cognitive load thereby reducing fixation in
the creative design process. From calculating entropy of the design process, AR
appeared to provide a more conducive environment for creativity than VR.
The second part of the study focuses on how individual characteristics of the
students moderate the effect of technology traits in enhancing the creative design process.
Learner preferences were analyzed through learning styles and technology acceptance
was measured to understand how different learning styles affect technology acceptance of
the two media types of AR and VR. The theoretical background suggests that perceived

xiii
ease of use correlates with creativity. Hence, learner preferences were hypothesized to
affect the use of different types of media in the creative design process. The results did
not indicate that learner preferences affected the creative design process but did support
the conclusion that certain user preferences lead to higher acceptance levels for
technology.

xiv
Preface
I have been fortunate to teach design at three tertiary education institutions. This
study was inspired by my experience gained through teaching. Initially I was fascinated
with the design process and how students designed in a design studio environment. I saw
that sometimes the tools that students used were inefficient and at times even inhibited
them in reproducing their visions of design, which made me wonder if there were other
tools and methods that students could incorporate in their design process. My passion for
digital media led me to think that different digital media tools might be helpful in
enhancing the creative design process.
This study is a culmination of information and knowledge gained through
multiple studies conducted over a 5-year period. The studies focused on the design
process, intrinsic features of virtual (VR) and augmented reality (AR), and the effect of
these technologies on design education.
Chandrasekera, Vo, and D’Souza (2013) observed the design process and
identified episodes of high entropic value that they termed sudden moments of inspiration
(SMI) or A-Ha moments. Their study used think-aloud protocol analysis, which is
considered one of the best methods of analyzing the design process. Even though
Chandrasekera et al. examined SMIs as episodes of higher entropic values, they also
focused on fixation and how fixation affects the design process. Entropic values are
considered as the amount of information included in the design process and fixation is
considered as the process of following a limited set of ideas within the design process. In

xv
the current study the emphasis is on the design process and how fixation, which is
considered inherently a low entropic episode, affects the design process.
Chandrasekera, Yoon, & D’Souza (2015) and Chandrasekera (2015) focused on
inherent characteristics of VR and how certain types of VR can be used in design
education. Chandrasekera et al. explored the applicability of using VR as a tool in
environmental behavioral research. The objectives of their study were to eventually help
assist designers and researchers who are interested in alternate navigational methods for
virtual environments and to better understand how soundscapes can be used in creating
navigational tools for virtual environments. In Chandrasekera (2015) the purpose was to
develop the knowledge base to guide the planning and design of online virtual
collaborative environments that can achieve effective learning outcomes through a design
critique process by initiating a framework for online based design critiques. Both of
these studies contributed knowledge about using VR as a tool in environmental behavior
and design education.
Chandrasekera et al. (2012) and Chandrasekera and Yoon (2015) described how
AR affects the design process and design education by improving spatial skills. In both
of these studies the effectiveness of VR and AR were compared for design instruction
purposes, and AR instruction modalities were hypothesized to improve spatial abilities of
design students as compared with VR instruction modalities. Although these two studies
presented a means of adopting AR in design instruction, the conclusions suggested that
the differences between the two interfaces may have been due to the method of control
provided by each interface.

xvi
Chandrasekera (2014) described a method of using AR prototypes in design
education. The technology acceptance model was used to assess the students’ perceived
usefulness, perceived ease of use, and behavioral intention to use the technology. Even
though Chandrasekera (2014) speculated that AR would be a potential tool to be used in
design and design education because it may help alleviate fixation, he did not provide
empirical evidence to support this claim. Investigating the potential of AR in reducing
fixation was considered a future direction of the study.
Chandrasekera and Yoon (2014a) described a pilot of the current study using a
smaller number of participants and found similar outcomes and conclusions as the current
study. Similar to the current study, the main hypothesis of their study was that AR
interfaces offer epistemic action that reduces the cognitive load and reduces fixation
effects in the design process as compared with VR interfaces, thereby affecting the
creative design process. Fixation was identified in both AR and VR interfaces.
Observations from Chandrasekera and Yoon suggested that AR interfaces provide an
environment that is conducive for the design process to be more productive. Identifying
the differences in entropy levels and the stages in which entropy was high and low in
both interfaces lead to the conclusion that interface type affects the creative design
process.
The current study combines and makes inferences from the aforementioned
studies. The current study describes the differences in using AR and VR in the design
process by focusing on how the design process is affected by the characteristics of the
technology as well as the characteristics of the user.
1
Chapter 1. Introduction
The use of digital tools in design education has dramatically increased. These
tools have been commonly used as representational (Langenhan, Weber, Liwicki,
Petzold, & Dengel, 2011; Marcos, 2011; Shelden, 2002), collaborative (Engeli &
Mueller, 1999; Gül, 2011; Merrick & Gu, 2011), and communicative media (Chiu, 2002).
Among the various digital tools, Virtual Reality (VR) has been popular for all three
purposes (Frost & Warren, 2000; Whyte, 2003; Whyte, Bouchlaghem, Thorpe, &
McCaffer, 2000). More recently, the use of Augmented Reality (AR) has increased as
well (Fonseca, Villagrasa, Martí, Redondo, & Sánchez, 2013; Stouffs, Janssen,
Roudavski & Tunçer, 2013; Wang, 2007).
While VR can be interpreted as immersive three-dimensional computer-generated
environments (Bryson, 1995), AR can be conceptualized as overlaying virtual objects
over the physical environment (Fischer et al., 2006). Researchers have investigated how
AR and VR can be used in design and design education, but there is a gap in knowledge
about how these interfaces affect the cognitive process of designing. Interfaces such as
AR that allow interaction with digital information through the physical environment, also
referred to as tangible interaction (Ishii & Ullmer, 1997), allow more epistemic action
(Fitzmaurice, 1996). Epistemic actions, defined as exploratory or trial-and-error type of
actions (Kirsh & Maglio, 1994), enable a designer to manipulate the design freely,
reducing the cognitive load and conserving mental effort. Researchers have suggested
that the reduction in cognitive load reduces fixation effects (Kershaw, Hölttä-Otto, &
Lee, 2011; Moreno, Yang, Hernandez, & Wood, 2014; Youmans, 2007). Research

2
suggests that by reducing cognitive demand, cognitive resources can be used for other
activities, which allows moving away from a linear thought process, and reduce fixation
effects. Design fixation is often associated with negative effects on the design process
primarily during the design incubation and ideation stages (Moreno, Yang, Hernandez,
Linsey, & Wood, 2014). Reducing cognitive load has been shown to reduce fixation
effects in the design process (Chandrasekera & Yoon, 2014a; Youmans, 2011).
A few researchers have explored the differences between AR and VR. Milgram
and Kishino (1994) described the virtuality-reality continuum to compare and discuss the
digital interface within a continuum. Tang, Biocca, and Lim (2004) discussed the
differences between the two interfaces in more detail by considering technology traits of
the two types of media. However, few studies have specifically focused on these two
interfaces and analyzed how their traits affect the creative design process and design
education. The current study looks at how these two types of media affect epistemic
action, thereby affecting the cognitive load and fixation in the design process.
This study also examines how user characteristics affect the use of AR and VR.
Specifically, the user characteristic of learner preference using the VARK Learning
Styles Inventory was examined to test the hypothesis that learner preference correlates to
the acceptance of that particular technology, thereby affecting the creative design process
through intrinsic motivation.
Factors Affecting the Design Process
The process of designing is a complex problem-solving exercise. Some authors
suggest that design is more a process of problem framing (Gao & Kvan, 2004) than of

3
problem solving. Archea (1987) refers to the design process as puzzle-making, and
design is often described as a wicked problem (Buchanan, 1992; Rittel & Webber, 1984)
or an ill-defined/structured problem (Simon, 1973). The design process can also be seen
as a method of problem management in which the required function is fulfilled even
though an optimal solution is not realized.
The problem-solving process has been discussed extensively in a number of
studies (Ackoff, 1974; Broadbent, 1973; Lawson, 1983). Design problem solving has
been analyzed and explained using methods such as insight problem solving
(Chandrasekera, Vo, & D’Souza, 2013), trial and error problem solving (Youmans,
2011), and formal and logical processes (Dorst, 2011). The effect of prototyping (which
is essentially a trial and error method of problem solving) is discussed in a number of
studies with regard to design problem solving (Kershaw et al., 2011; Youmans, 2011;
Viswanathan, & Linsey, 2009). In most studies in which prototyping in the design
process is discussed, one recurring theme is its effect on fixation (Chandrasekera, 2014;
Viswanathan & Linsey, 2009; Youmans, 2011).
Gestalt psychologists have extensively studied mental blocks as a phenomenon
interchangeable with fixation found in design studies (Murty & Purcell, 2003). While a
mental block is defined as “a barrier in our minds preventing us from producing desired
information” (Kozak, Sternglanz, Viswanathan, & Wegner, 2008, p. 1123) design
fixation is described as the inability of the designer to move away from an idea in order
to resolve a problem (Jansson & Smith, 1991). Fixation is often identified as a process
that interferes with creative reasoning and leads one to become fixated on a small number
of unvaried solutions (Agogue & Cassotti, 2013). Fixation can become a hindrance in the

4
creative design problem solving process. Potential solutions to mitigate fixation effects
in the design process have been explored in previous studies, including encouraging
group work (Youmans, 2011) and introducing analogical inspiration sources (Casakin &
Goldschmidt, 1999). Even though in some instances prototyping has been identified as a
method of reducing fixation (Dow et al., 2010; Youmans, 2011), in other studies physical
prototyping increased fixation (Christensen & Schunn, 2007). Researchers have
explained the fixation caused through physical prototyping as a result of sunk-cost effect:
the time designers spend making the physical prototype of their initial ideas is when they
tend to fixate more (Viswanathan & Linsey, 2013). Digital prototyping can be
considered an approach to alleviate fixation effects caused by physical prototyping
because digital prototyping is a way of bypassing the sunk-cost effect.
AR is an interface that offers tangible interaction (Ishii, 2007) and is often
referred to as tangible user interface (TUI). Kim and Maher (2008) suggested that digital
prototyping using TUIs such as AR allowed users to make additional inferences from
visio-spatial features, freeing designers from fixation effects. Kim and Maher stated that
tangibility in these types of interfaces allows more opportunities for trial and error type of
problem solving through epistemic actions in prototyping.
Kirsh and Maglio (1994) introduced the concepts of epistemic action and
pragmatic action. They discussed how expert players of the popular video game Tetris
conserve their cognitive resources by trying different positions of the Tetris cubes rather
than trying to figure it out in their minds. These experimental moves, which they termed
epistemic actions, allow the players to use their cognitive resources for something else.
Fitzmaurice (1996) used the same terms in discussing tangibility in user interfaces. He
5
introduced the concept of graspable user interface (similar to TUI) and suggested that the
tangibility in interfaces such as AR interfaces allows more epistemic action, thereby
reducing the cognitive load and conserving mental effort.
Others (Kershaw et al, 2011; Moreno et al., 2014; Youmans, 2007) suggested that
when cognitive load is reduced the fixation effects in design are reduced as well because
epistemic actions allow a designer to manipulate the design freely. At the same time this
reduction in cognitive load allows the designer to avoid fixation. This does not imply
that fixation can be eliminated by allowing epistemic action alone, but merely that
epistemic action reduces fixation effects. However, studies have shown that fixation
adversely affects the creative process (Kohn & Smith, 2009; Smith & Blankenship, 1989,
1991), so it is important to investigate whether epistemic actions could reduce cognitive
load and thereby reduce the chances of fixation and positively affect the creative design
process (see Figure 1).
Figure 1. Effect of epistemic action and cognitive load on the creative design process.
Individuals use interfaces in different ways for different purposes. Research has
shown that user characteristics such as preference for using an interface can result in
effective use of the interface. Factors such as cognitive style, gender, and preference
Epistemic Action
Cognitive Load
Fixation Creative Design Process

6
have been shown to impact creativity and the ideation process (Baer, 1997; Baer &
Kaufman, 2008; Lubart, 1999; Pearsall, Ellis, & Evans, 2008; Shalley, Zhou, & Oldham,
2004; Wolfradt & Pretz, 2001). Furthermore, there is a relationship between learner
preference and creativity (Atkinson, 2004; Eishani, Saa’d, & Nami, 2014; Friedel &
Rudd, 2006; Kassim, 2013; Ogot & Okudan, 2007; Tsai & Shirley, 2013). The purpose
of this study is to explore how user characteristics (i.e. learner preference) affect the use
of AR and VR in the creative design process.
The VARK Learning Styles inventory was used to measure learner preferences
for visual, auditory, read/write, and kinesthetic learning styles. The VARK is considered
to be a valid learner preferences tool and it has been used by many researchers (Bell,
Koch, & Green, 2014;Drago, & Wagner, 2004; Lau, Yuen, & Chan, 2015). It was used
in this study because it focuses on kinesthetic and visual learning styles, which relate to
the characteristics of the interfaces that are investigated in this study. The hypothesis was
that learners with a preference for kinesthetic learning will prefer to use an interface that
provides more tactility, while those who have a preference for visual learning will prefer
to use an interface that provides more visual cues.
Learning styles are thought of as a user’s preference for using a certain modality
as a means to learn. The hypothesis of the study was that the learner preference
correlates to the acceptance of that particular technology, thereby affecting the creative
design process through intrinsic motivation (see Figure 2).

7
Figure 2. Effect of learner preferences on using AR and VR in the creative design process. Understanding how AR and VR provide opportunities for epistemic actions and
how these epistemic actions affect the creative design process is the primary focus of this
study. Furthermore, since the study focuses on the use of these interfaces in the context
of design education, the focus is appropriately on user characteristics such as learner
preferences and observing how these preferences affect the use of these technologies in
the creative design process.
Purpose of the Study
The context of this investigation is design education. The main objective of this
study is to examine the effects of using AR and VR digital interfaces in design and design
education. In particular, the study is focused on how these interfaces provide epistemic
actions that affect the creative design process. The study also focuses on learner
preferences and how learner preference affects the use of these technologies in the
creative design process.
Learner preferences Creative Design Process
Technology Acceptance
VARK Learning Style Inventory
Visual
Auditory
Read/Write
Kinesthetic

8
Even though AR has existed for several decades, there is a gap in the knowledge
about how human factors affect the use of AR (Huang, Alem, & Livingston, 2012).
Better understanding of user experience factors in AR environments is important for a
number of reasons. With the emergence of new hardware that has the capability of
supporting AR applications, interest in how to use this technology efficiently has been
increasing. Such studies are only currently becoming feasible because of the recent
maturation of the technology. Extensive studies of this type will allow the development
of specific and general design and usage guidelines for AR technology not only in design
education and design practice but in other fields of study as well. Moreover,
understanding human perception of AR will accelerate the introduction of such
technologies into mainstream use beyond the current novelty value of AR.
The results of this study provide a better understanding of how users are affected
by such interfaces and can be used to formulate a comprehensive structured pedagogical
agenda for digital design. Additionally, knowledge gained through this exercise can be
applied to design education and design practice in order to promote creativity in the
design process.
Research Contributions and Significance of the Study
The research provides a starting ground for discussing how user interfaces affect
the design process. Factors such as cognitive load and fixation are discussed as a result
of affordances in epistemic action. Given the current pace of technological innovation (in
terms of hardware as well as software), identifying an interface type that affords better
design ideation has become a critical need, and this research aims at fulfilling this need.

9
The contributions of the current study can be broadly categorized as theoretical,
methodological, and practical.
Although prior research has produced a body of knowledge that focuses on using
technologies such as AR and VR in various domains, few studies have focused on
empirical evidence for enhancing the design process by using AR and VR in design and
design education. More specifically, few studies focus on how these types of media
provide opportunities for epistemic actions that reduce cognitive load and thereby reduce
fixation effects in order to enhance the creative design process. Most researchers who
have explored these traits have looked at them in isolation and not as a continuous
process. This study bridges the gap in knowledge by combining theories adopted from
information theory, design theory, and cognitive psychology to empirically understand
the effect of tangibility in interfaces such as AR and VR on the creative design process.
Few studies have focused on cognitive load in the realm of design and design
education. The current study focuses on understanding the theoretical connections
between cognitive load and interface type by bridging theories of cognitive psychology,
information science, and design cognition theory.
The knowledge obtained in this study can contribute to multiple domains with
practical insights about using different interface types in the design process. The
theoretical links established in this study set a framework for future research specifically
in the domain of design education and AR and are also expected to affect research
conducted in the paradigm of tangible interface design.
This study contributes to methodology in the use of AR and VR technology for
design education as well as the use of linkography to analyze design protocols. Even

10
though technologies such as AR and VR have existed for over a half a decade, their use
in empirical research has been limited because of the cost associated with the hardware
and software for such technologies.
However, with the advent of new technologies and their adoption in design
education, understanding why and how these technologies can be used is important. This
study provides empirical evidence about the use of AR in design and design education as
well as a cost-effective method of using AR and VR in design research. The
methodology adopted in this study may be used by other researchers for the purpose of
obtaining cost-effective AR and VR solutions.
Even though protocol analysis is a popular method in analyzing the design
process, linkography in protocol analysis is not common. This study incorporates a
linkography method together with quantitative analysis methods to understand the impact
of media interfaces on the creative design process. This study methodology can be
replicated and used to understand the effect of other types of media on the creative design
process.
The results of the study have implications for practical application of AR and VR
in design and design education. Instructional design focuses on cognitive load and its
implication for the learning outcome of students. The current study also looks at the
cognitive load imposed by AR and VR; hence, it also provides validation for using AR
and VR in other areas of learning. Furthermore, the results of the study should contribute
towards the development and use of tangibility in interfaces and its application in other
domains.

11
Research Approach and Methodology
Two design problem-solving interfaces were employed: an AR interface and a VR
interface. Both interfaces used a tabletop webcam and fiducial marker-based system.
Thirty design students from a Midwestern university in the US were randomly assigned
to the two interface environments.
The design problem was formulated in consideration of three main factors. The
first was to provide a simple problem which would encourage the participants to focus on
object manipulation, spatial and logical iterations, context, and user-behavior issues,
while also keeping in mind visual appeal, composition, environmental considerations,
and ergonomic factors. The second consideration was to formulate a design project that
would allow the researcher to clearly identify epistemic actions. The selected design
problem was to arrange furniture within an office space; the selected interfaces of AR and
VR provided the ability to move and rotate these furniture pieces. The movement of
these pieces of furniture would allow clear coding for epistemic actions. The third
consideration was previous studies that were conducted for a similar purpose. These
three considerations are further elaborated in the methods section.
In the current study, the participants were provided with a design problem for
arranging furniture in an office room setting. The design processes of 10 randomly
selected participants were then recorded, coded, and analyzed through a protocol analysis
method that used linkography. All 30 participants responded to two questionnaires based
on the technology acceptance model (post-test) and the VARK learning styles inventory
(pre-test) to better understand how the interface affects the design process and human
perception. The participants also completed the NASA Task Load indeX (TLX)

12
questionnaire (post-test) in order to identify the cognitive load associated with the
interface.
In summary, the following experiment was designed to test the effect of digital
interfaces (AR and VR) on enhancing the creative design process by reducing fixation
effects. Tangibility in user interfaces such as AR was predicted to contain fewer fixation
features than design processes taking place using graphic-based interfaces such as VR.
Furthermore, the learner preferences of the user were predicted to affect the use of the
interface, ultimately affecting the creative design process.
Definition of Terms
Augmented Reality (AR). Azuma (1997) defined AR as a variation of VR
technology that supplements reality by superimposing virtual objects into it. AR is an
interface that allows tangible interaction through the use of fiducial markers. This is also
termed “desktop augmented reality” in the literature. In this study, fiducial marker-based
AR is used with a webcam.
Cognitive Load / Mental Workload. Cognitive load may be viewed as the level
of mental effort required to process a given amount of information (Cooper, 1990). In
this study, the perceived workload is considered the cognitive load imposed by the
interface.
Creative Design Process. Creativity has been defined in many ways. In this
study, the focus is on the creative process, more than on the creative end product. The
creative process embraces both integration and diversification of ideas (Kan, Bilda, &

13
Gero, 2007) and through a productivity aspect creativity is defined as making new
combinations of associative elements which are useful (Poincare ,1913)
Entropy. Entropy is defined as a measurement of the amount of information in
the text of the protocol (Shannon, 1948). Gero (2011) used the calculated dynamic
entropy of a linkograph to measure the fixation in a design process. In this study, the
same method is used to observe the creative design process.
Epistemic Action. Epistemic action is defined as “exploratory” motor activity to
uncover information that is hard to compute mentally (Kim & Maher, 2008). The term
“epistemic action” refers to trial-and-error types of exploratory actions in this study.
Fixation. Design fixation refers to the process of following a limited set of ideas
within the design process (Jansson & Smith, 1991). When the ideation process revolves
around a single idea, the designer is thought to be fixated on this idea.
Fiducial Marker. A fiducial marker consists of patterns that are mounted in the
environment (for example, printed on a paper) and automatically detected by a digital
camera with accompanying detection mechanism (Fiala, 2005).
Learning Style. There are many types of learning styles. In this study, learning
style refers to the mode of learner preference of the student, such as Visual, Aural,
Read/write, and Kinesthetic modes. An appropriate learning style inventory (i.e., the
VARK Learning Style Inventory) is used to identify learning style.
Linkography. Linkography is a method used to understand the links between
segments or moves in a protocol. Related segments or moves are linked together to form
a graph that shows the links among different segments or moves.

14
Protocol Analysis. In this study, think-aloud protocol analysis is used. The
designer is expected to verbalize his/her thoughts when designing. These verbalizations
are recorded, coded, and analyzed.
Segments and Moves. A segment, whether consisting of one sentence or many,
is defined as one coherent statement about a single item/space/topic (Suwa & Tversky,
1997, p. 391). A design move is “an act of reasoning which presents a coherent
proposition pertaining to an entity that is being designed,” and arguments are “the
smallest sensible statements which go into the making of a move” (Goldschmidt, 1991, p.
125). According to Suwa and Tversky (1997), a segment corresponds to a design move
in its granularity. In this study, the idea of a move is used to understand the protocol.
Virtual Reality (VR). VR is an artificial environment provided by a computer
that is experienced through sensory stimuli such as visual or auditory stimuli and in
which one’s actions partially determine what happens in the environment (Virtual
Reality, 2012). In this study, VR is identified as a windows, icons, menus, pointers
(WIMP)-based computer-simulated 3D environment experienced through a computer
monitor and interacted with through a control device such as a mouse. This is also
termed “desktop virtual reality” in the literature.

15
Chapter 2. Literature Review
Creative Design Process
In most of the studies that have been conducted on design and the design process,
the evolution of the design process was discussed as a step by step process, but the steps
prior to sketching are neglected. How does an architect begin to design? Does the
architect begin with arbitrary sketching? Lawson (1972) provided two contrasting styles
of operation: problem focused and solution focused. He stated that in solving design
problems, science students use a problem focus, which is much more analytical, while
architecture students use a solution focused approach in which they try out different
solutions and see what goes wrong. Hiller, Musgrove, and O’Sullivan (1972) provided a
conjecture-analysis model for the design process and stated that in order to make a
problem tractable it should be pre-structured, either explicitly or implicitly. Hiller et al.
further stated that design is essentially a matter of pre-structuring problems and argued
that this is the reason that design is resistant to empirical rationality. Even with a
complete account of the designer’s operations, gaps will still be apparent about the origin
of the solution. Understanding how a designer designs is important to understand the role
of creativity in the design process.
Dorst and Cross (2001) stated that creativity in the design process is often
characterized by the occurrence of a significant event. This event may manifest itself as a
sudden moment of inspiration (Chandrasekera et al., 2013), an increase in information
(Kan, Bilda, & Gero, 2007), or a rapid change of ideas (Goldschmidt, 1995). Researchers
have used protocol analysis methods to capture these creative moments in the design

16
process. Dorst and Cross further stated that creativity is found in every design project,
and many researchers have focused on identifying these creative moments.
Creativity
The term “creativity” has been used – or more precisely misused – especially in
the context of design and design education. Despite Torrance’s (1988, p. 43) statement
that “creativity defies precise definition,” many definitions of creativity have been
provided. Discussions and commentaries on creativity suggest that the definitions
provided may be categorized into multiple groups. Rhodes (1961) theorized that
creativity falls into four distinct categories: individual aspects (the individual who is
involved in the creative process), cognitive aspects (the creative process), the influence of
the context where the creative process is taking place (place), and the resulting creative
product. These are known as the four P’s of creativity (person, process, place/press, and
product).
As suggested by Rhodes (1961) creativity can be primarily discussed either in
terms of the product or in terms of the process (Rosenman & Gero, 1993). Rosenman
and Gero stated that a product can be considered to be the result of a creative process
depending on the innovativeness of the product and the value and richness of
interpretation and that the creativity of the process can be described from an information
processing standpoint. They discussed the creative aspects of the creative process
through entropy, efficiency, and richness. In some instances, creativity has been simply
defined as the ability to look at things differently (Keil, 1987) or as an act that produces
effective surprise (Brunder, 1962). The aspect of novelty has been central to a number of

17
definitions of creativity (Morgan, 1953). Hausman (1964) stated that “each appearance
of genuine novelty is a sign of creative activity” (p. 20). However these definitions of
creativity and its connection with novelty have been much debated. Poincare (1913)
deviated from the discussions of novelty and originality and focused on the productive
aspects of creativity: “to create consists of making new combinations of associative
elements which are useful” (p. 25).
Gero and Maher (2013) focused on the creative design process and stated that
creativity introduces new variables to the design process which were not originally
considered by the designer or design system; design and creative design are different
because reasoning plays a major role in creative design. The term “design creativity” has
been widely used (Daley, 1982; Goldschmidt & Tatsa, 2005; Taura & Nagai, 2010).
While the Vitruvian virtues of architecture (Bredeson, 2002) are utilitas (function),
firmitas (solidity/stability), and venustas (delight/aesthetics), design seldom stops at
aesthetics; it goes beyond mere aesthetics and becomes an artifact that makes people
think: from aesthetics to mindfulness. Taking this into consideration, design creativity
cannot only focus on novelty but must also focus on utility and value (Gero & Maher,
2013).
Different phases in the creative process have been examined. Csikszentmihalyi
(2006) stated that the creative process may include distinct phases that draw on different
psychological resources. Some of the common phases provided in different models of
the creative processes are summarized in Wallas’s (1926) creativity phase model. This
model originally consisted of seven steps that are discussed through the four phases of
preparation, incubation, illumination, and verification. These phases of creativity become

18
especially important in understanding where creative leaps in the creative process occur.
This creative leap in the design process is identified by measuring the entropy of the
process (Gero & Kazakov, 2001; Kan, Bilda, & Gero, 2007; Kan & Gero, 2005).
Creativity has been defined as an intersection of three psychological attributes:
intelligence, cognitive style, and motivation (Sternberg, 1998). In her model of
creativity, Amabile (1983) linked creativity with domain-relevant skills, creativity-
relevant skills, and task motivation, stating that without any one of these, creativity
cannot exist. In his multiple intelligence theory, Gardner (1983) takes a different
approach to creativity and observes multiple components that affect creativity and the
creative process: “the creative individual is a person who regularly solves problems,
fashions products, or defines new questions in a domain in a way that is initially
considered novel but that ultimately becomes accepted in a particular cultural setting” (p.
35). Csikszentmihalyi (1997) discussed creativity on a broader scale: creativity is the
cultural equivalent of the process of genetic changes that result in biological evolution
and the process by which a symbolic domain in the culture is changed. Furthermore, a
number of studies suggest that multiple components must converge for creativity to occur
(Amabile, 1983; Gruber, 1989; Perkins, 1984).
A challenge in creative design is to visualize alternate idea paths that are known
as divergent thinking processes. For various reasons, divergent thinking in creative
design gets inhibited and the process tends to take a linear path, which is termed
“fixation.” Fixation discourages creative design solutions because it inhibits alternate
solutions to a design problem.
19
Defining Creativity in Context
Identifying where and when creativity occurs is important in understanding how
creativity is enhanced or inhibited. Creativity assessments have included many factors
such as novelty, originality, utility value, and aesthetics. Creativity measurements may
be categorized according to the four p’s of creativity: person, process, press/place and
product.
The most widely accepted measurement of creativity, the Torrance Test of
Creative Thinking, focuses on the individual’s creative aptitude and uses verbal and
figural tests to assess creativity (Torrance, 1966). Similarly, Guilford’s (1968) model of
measuring creativity focuses on the individual’s creative aspects through looking at
divergent and convergent thinking to assess fluency, flexibility, originality, and
elaboration of ideas. Csikszentmihalyi and Getzels (1971) suggested that creativity
should be measured by observing the individual, the area, or the domain that the person
works in, and the people who engage with the work; creativity occurs when the person
generates the creative product and the respective domain changes as a result of the
product.
Creativity assessments in design and design education are often seen as a means
of assessing the design product, the design process, or both. Researchers have
emphasized the importance of assessing creativity in the design process as opposed to
assessing creativity in the design product. McAllister (2010) stated that design students
focus more attention on the end product and ignore the development process of the
design. Furthermore, Bashier (2014) stated that design instruction has become
problematic because instruction often tends to focus on the design product rather than the

20
creative design process. To assess the creative product, researchers have employed
several characteristics such as fluency, flexibility, elaboration, usefulness, innovation,
fulfilling goals and design requirements, considering the physical context, mastery of
skills, overall creativity, and alternative design solutions (Casakin & Kreitler, 2010). In
design education, students are encouraged to present their design process in the form of
diagrams and sketches in order for the jurors to evaluate the creative aspects of the final
product.
One method of empirically measuring the design process makes use of the
concept of entropy. Shanon (1948) defined entropy as a measurement of the amount of
information in in a communication source such as text of a protocol. Kan and Gero
(2005) used this idea in the context of the design process to identify the entropy in a
design protocol. They stated that a higher entropy level suggests a more creative design
process. Furthermore, they defined fixation as the reduction in entropy within the design
process.
Fixation
Different types of fixation identified by researchers include problem solving
fixation, conceptual fixation, cognitive fixation, knowledge fixation, operational fixation,
and design fixation (Moreno, Yang, Hernández, Linsey, & Wood, 2014). Design fixation
refers to the process of following of a limited set of ideas within the design process
(Jansson & Smith, 1991). Jansson and Smith suggested that design fixation is limiting,
can be counterproductive, and can lead to many barriers during the design process. They
showed that designers who were given an example before initiating a new design were

21
more likely to imitate the example. On the other hand, designers who were not shown an
example were more likely to come up with something more original. Fixation is often
shown to occur when using an example to inspire a new design, and the designer is
usually unaware of his or her fixation (Toh, Miller, & Kremer, 2012).
Studies have shown that while in the creative process, people are more likely to
run into obstacles when new solutions are not explored. This is known as the fixation
effect (Agogué, Poirel, Pineau, Houdé, & Cassotti, 2014). A number of studies have
explored reasons for fixation in the design process. Some researchers suggested that the
designer’s experience plays a major role in how fixation affects the design process
(Linsey et al., 2010). Studies have also shown that the designer’s personality type (Toh
et al., 2012) and inclination towards existing solutions also affect the occurrence of
fixation in the design process (Luchins & Luchins, 1959).
The study of fixation is not new to the field of design (Murty & Purcell; 2003;
Purcell & Gero, 1996; Sachs, 1999). Purcell and Gero in Cross (2001b) discussed how
specific education practices between designers and engineers could impact the way in
which fixation occurs. For designers specifically, this type of fixation focuses on the
notion of being “innovative” or “different.”
Prototyping was shown to be an integral part of the design process in a series of
experiments by Kershaw et al. (2011) in which students try to combat design fixation
using two different methods: prototyping and critical feedback. In the first experiment,
the prototyping method was administered to 50 non-engineering undergraduate students.
The students were divided into groups and asked to design and construct a structure to
solve a specific problem. The students were told to make a prototype before they built

22
the final structure. They were given materials to sketch with, followed by materials to
build their prototypes, and the session ended with feedback from instructors. After the
first feedback session, students were allowed to modify their design, followed by a
second feedback session. After the second feedback session, the majority made no
changes to the design, some changed their design but only a very few chose to come up
with an entirely new concept. There were students who completely ignored the feedback.
The results of this study show how strong design fixation is based on the number of
changes made after feedback was given.
The second experiment conducted by Kershaw et al. (2011) used the same design
problem and creative process with 29 non-engineering undergraduate students. The
difference in this experiment was the type of feedback given. Participants only drew
sketches of their design instead of making prototypes and were split into different
feedback groups. Those in the “no feedback” group were dismissed after they finished
the final build of their design, and were not given any feedback upon completion.
Participants in the “technical feedback” group followed the same method that was used in
the first experiment. The final group, labeled “full critique,” was given the same
technical feedback as in the first experiment and was then asked a series of questions in
order to encourage reflection about their design. After the first feedback session,
majority of the students made changes to the design. Some came up with a new concept
and a very few of them informed the feedback. When broken down among feedback
groups, majority of the participants in the “no feedback” group came up with a new
concept after feedback sessions; about half that number of the “technical feedback”
group made a new concept, and no one in the “full critique” group made a new concept.
23
The researchers concluded for both groups that prototyping before building the final
design helped to make changes necessary for improvement to the design. Participants in
the second experiment who did not prototype their designs before building their finished
products seemed to run into more problems than those in experiment 1.
Students of design, in particular, commonly have problems with design fixation as
a premature commitment to a solution for a problem (Purcell & Gero, 1996). However,
though problems are common, innovative and creative solutions can always be achieved.
To overcome design fixation, analogical operators as well as instructions can be given to
those who are learning the design process in addition to an example to be followed (Toh
et al., 2012). Another method proposed by Toh et al. to reduce design fixation is called
product dissection. Product dissection is the process of taking apart components and
subcomponents of a product in order to analyze its structure and function and understand
more about it. This opens opportunities for re-design by finding ways to improve the
product. This is an important way for design students to learn what goes on in their
future job industries and gives them a chance to take a hands-on approach to re-
constructing products, as it allows for an in-depth look at the design from the ground up.
Feedback is a large component of design education as well. Kershaw et al. (2011)
found that students who received more extensive feedback made fewer changes to their
designs. They found this surprising, as they had thought that providing a group with
detailed feedback would de-emphasize design fixation. One explanation was the
possibility that students may feel more validated in their original designs when feedback
is given, whereas the students who receive no or less feedback are forced to self-reflect
and are more likely to make changes.

24
While many methods have been proposed to reduce the effect of fixation in the
design process, it is important to note that prototyping has been shown to affect fixation
(Christiansen & Schunn, 2007; 2009). Given that prototyping is an integral part of design
and design education, a means to alleviate fixation effects in design prototyping is
pertinent. While prototyping is broadly defined as a representation of a design idea
before the final artifact exists (Lim, Stolterman & Tenenberg, 2008), various methods of
prototyping have been introduced in the field of design. To eliminate the sunk-cost effect
in physical prototyping, which can cause fixation, alternate methods of prototyping using
digital interfaces are often used in design and design education. However, to further
reduce fixation when using digital interfaces, understanding how fixation occurs in the
design process is essential.
Identifying and Measuring Fixation
A number of studies have identified fixation using different methods. To identify
functional fixedness (restricting the use of an object for a previously known function),
Maier (1931) provided a problem-solving exercise that required participants to use pliers
for something other than the typical use. Luchins and Luchins (1959) described another
type of fixation called mental set, which referred to blindly being fixated on one solution.
Jansson and Smith (1991) assessed fixation by providing their participants with an
example solution to observe if the example affected the problem-solving process. The
results suggested that providing such examples induced fixation. Chandrasekera et al.
(2013) observed fixation occurring because of subliminal stimulation. They stated that
subliminal stimulation not only was able to cause fixation but also affected the generation
of sudden moments of inspiration (sudden moments of insight or A-Ha moments) in the

25
creative design process. In a series of academic papers, Gero and associates (Gero &
Kazakov, 2001; Kan et al., 2007; Kan & Gero, 2005; Purcell & Gero, 1996; Purcell,
Williams, Gero, & Colbron, 1993) discussed fixation and methods of identifying fixation,
specifically describing how they calculated entropy values in the design process to
identify low and high values of entropy. They showed that low entropy values suggest
fixation in the design process. Unlike other observational techniques in identifying
fixation, the method proposed by Gero and associates provides an empirical means of
measuring and identifying fixation.
Epistemic Action
Kirsh and Maglio (1994) defined epistemic actions as physical, external actions
“that make mental computation easier, faster, or more reliable” (p. 513-514) or that are
intended to gather more information (Kastens, Liben, & Agrawal, 2008). The term
epistemic action, according to Kirsh and Maglio, is used to “designate a physical action
whose primary function is to improve cognition” (1994, p 514). Kirsh and Maglio (1994)
explained that this can be achieved by decreasing the memory involved in mental
computation, the number of steps involved in mental computation, and the likelihood of
error of mental computation. Epistemic actions differ from pragmatic actions, which
have the primary function of bringing an individual closer to a physical goal. Similar
terms were provided by Gibson (1962) who classified hand movements as “exploratory”
and “performatory.”
Kim and Maher (2008) expand on Gibsons classification and defined epistemic
actions as “exploratory” motor activity to uncover information that is hard to compute

26
mentally. They further elaborated that pragmatic actions refer to “performatory” and
goal-oriented motor activity that directs the user closer to the final goal.
Kirsh and Maglio (1994) explained epistemic action using the example of the
popular video game Tetris. The objective of Tetris is to complete full solid lines using
the bricks, or “zoids” that manifest within the game. If the lines reach to the top, the
player loses the game. While a novice player would mentally rotate the zoids in the game
before moving them to create a single row of bricks, an expert player would manipulate
the controls to rotate the zoid and then move the brick to the bottom layer to form a row
of bricks. These manipulations of the controls (without exerting mental resources) were
identified as epistemic actions.
The epistemic action hypothesis indicates that experts use tools more efficiently
than beginners do because experts take more physical actions that simplify or improve
mental computation (Maglio, Wenger, & Copeland, 2008). Maglio et al. showed that
Tetris players with more experience could more effectively and quickly place blocks
where they were supposed to go and more easily see the falling pieces in multiple
orientations than beginners.
Epistemic actions are often referred to as trial-and-error type actions (Sharlin,
Watson, Kitamura, Kishino, & Itoh, 2004) or exploratory motor activity. Trial-and-error
type of actions are considered to improve the creative design process and are the norm in
studio design education. Epistemic action in education involves hands-on projects, where
students will operate and control physical objects while using deep thinking skills
(Kastens, Agrawal, & Liben, 2008). Kastens et al. investigated how students and
professionals collected and recorded spatial information and then used that information to

27
form a mental model of a structure. They noted that most of their participants found their
assigned tasks difficult, and some inquired if they were allowed to move their models
around, showing examples of epistemic action.
Kim and Maher (2005) compared designers using GUIs and TUIs to arrange
furniture within a 3D space and observed more epistemic actions in the environments
where designers used a TUI such as an AR interface as compared to the environments in
which designers used a GUI. Building upon Kim and Maher’s (2005) findings, Fjeld and
Barendregt (2009) compared epistemic action in a graphical user interface (GUI),
tangible user interface (TUI), and physical modelling. They employed CAD software
called Modeler as the graphics-based GUI, an AR application called Build-It as the
tangibility-based TUI, and physical manipulation of blocks to solve a series of spatial
problems. They measured epistemic action by observing the average number of tested
blocks. While finding of both these studies attempt at making connections to cognitive
load and the creative design process by discussing the changes in epistemic actions, they
do not show direct connections not do they measure cognitive load and creativity in the
design process.
Identifying and Measuring Epistemic Action
Epistemic actions are often associated with the idea of tangibility or the physical
properties of an object or interface. Sharlin et al. (2004) stated that “a good physical tool
enables users to perform pragmatic, goal-oriented activity as well as trial-and-error
activity” (p. 6). Fjeld and Barendregt (2009) stated that epistemic action is related to the
level of physicality and tangibility in a user interface and provided three spatial planning

28
tools offering different levels of physicality to their participants, then measured epistemic
actions by observing the average number of tested blocks in the trial.
Kastens et al. (2008) defined epistemic actions as “actions in the physical
environment made with the intent of gathering information or improving cognitive
processes” (p. 202). They measured epistemic action by recording the number of non-
communicative gestures that participants used to manipulate objects. Kim and Maher
(2008) stated that tangibility in user interfaces offers opportunities for participants to
relocate objects and test moves to interact with the external representation. Furthermore,
they stated that interfaces with physical objects may offer more opportunities for
epistemic actions and that these epistemic actions have the potential to reduce the
cognitive load of a task carried out in such interfaces. They identified short actions
followed by perceptual activities as epistemic actions.
Antle (2013) and Antle and Wang (2013) used the terms direct placement (DP),
indirect placement (IP), and exploratory placement (EXP) to describe different actions
performed in spatial tasks. DP actions were similar to goal-oriented pragmatic actions,
where users already knew where to place an object before picking it up. IP actions, on
the other hand, occurred when the user was not initially certain of exact placement and
used movements and rotations to identify correct placements. EXP actions were
identified as actions by which pieces did not end in the correct destination. IP and EXP
actions were similar in characteristic to trial-and-error type actions or epistemic actions.
The same action categorization was adopted by Esteves et al. (2015), who elaborated on
Antle and Wang’s action categorization by expanding it according to different types of
epistemic actions.
29
Antle (2013) suggested that moving and rotating objects using a natural method
reduces cognitive load, which allows the opportunity to use cognitive resources for a
different task. Antle further stated that object rotation and translation are better supported
by interfaces that allow tangible interactions, such as AR interfaces. Therefore,
interfaces that afford tangible interaction will reduce cognitive load. Goldin-Meadow
(2005) stated that gestures such as epistemic actions provide a communicative purpose as
well as providing assistance to the thinking processes; people use gestures when
conducting difficult tasks in order to reduce cognitive load. For example, a child who is
learning addition will use fingers to add two digits without trying to compute the addition
mentally. This reduces the cognitive load imposed and helps the child visualize the
problem. Studies have also shown that some cognitive functions, such as the efficiency
of spatial memory, may be reduced when gestures are inhibited (Morsella & Krauss
2004). In the current study the way epistemic actions affect cognitive load is analyzed
and similar coding method employed by Antle (2013) and Antle and Wang (2013) is
used.
Cognitive Load
The cognitive load theory, an instructional theory, states that human working
memory is limited in the amount of information it can hold, as well as the number of
tasks it can perform using that information (Gerven, Paas, Merriënboer, Hendriks, &
Schmidt, 2003). Sweller (1994) acknowledged that new intellectual tasks can vary, and
that learning can be extremely simple or difficult depending on different factors.
30
Moreover, cognitive load can be defined as the total amount of mental activity forced on
working memory at an instance in time (Cooper, 1998).
According to Kirschner (2001), the need for competency-based education is
continuing to grow. Competencies can be defined as the abilities to work in a fluid
environment, deal with “non-routine and abstract work processes,” make decisions and
hold responsibilities, work successfully as a team, comprehend dynamic systems, and
work “within expanding geographical and time horizons” (p. 2). Kirschner explained that
competencies involved in design education are cognitively demanding for learners by
asking newly acquired skills to new situations. Students can demonstrate what they have
learned through performance changes, and learning requires working-memory capacity.
In order to achieve this type of education style, the limitations of the mind must
be understood, and that is where the cognitive load theory comes into play. The
cognitive load theory has led to the establishment of many instructional styles, including
goal-free problems, worked examples and completion problems (Kirschner, 2001). An
important objective of those who develop the curriculum and programs for design
education is to design innovative instructional methods and materials that will enhance
the ability of learners to comprehend lessons in a straightforward manner and increase the
likelihood that what they have learned will be successfully implemented in their work
(Abdul-Rahman & du Boulay, 2014).
Abdul-Rahman and du Boulay (2014) examined the effect of different learning
styles of students on cognitive load. They recruited 117 college students who were given
a pretest to evaluate each of their levels of programming knowledge. These participants
were then split into three groups based on the result of their pretests. Each group

31
included an equal, or close to equal as possible, proportion of students who used active or
reflective learning styles. Each group learned programming through different teaching
styles (paired-method, structure-emphasizing, or completion). After the programming
lesson, all participants took a posttest to assess the knowledge gained through each
method. Abdul-Rahman and du Boulay found no significant differences in learning
outcomes after the posttest was assessed but noted that the different learning styles may
have affected cognitive load.
Embodied Cognition and Cognitive Load Theory
Cognitive load theory was first defined by Sweller (1988); he described it with
regard to instructional design. Sweller suggested that the design of the instruction should
not overload the learner’s mental capacity. The working memory of an individual has
limited capacity, and overwhelming the working memory reduces the effectiveness of the
instruction. For example, if an interface is complicated and difficult to navigate, a higher
workload will be imposed on the learner, thereby reducing the effectiveness of the
learning process. Similarly, if an interface used in the design process imposes a higher
workload on a designer, the effectiveness of the design process is reduced.
In cognitive load theory, three types of cognitive loads are described. Intrinsic
cognitive load is defined as the level of difficulty associated with a specific task.
Extraneous cognitive load is described as unnecessary information presented during
instruction, and germane cognitive load is described as being related to the processes that
contribute to creating schemas and rule automation. Cognitive load theory suggests that
resources can be allocated to extraneous and germane loads only after allocating

32
resources for intrinsic cognitive load. Some researchers, such as de Jong (2010), have
used the term germane cognitive load to explain a type of cognitive load that is not
objectively measurable and that has no theoretical basis. In any case, the total
accumulated amount of these three types of cognitive loads cannot exceed the capacity
of working memory.
Cognitive load is often discussed in tandem with split-attention effect. Split
attention effect is described as the effort that a learner has to make to understand pictorial
and textual information. Slijepcevic (2013) stated that the split attention effect may be
reduced by interfaces such as AR because AR operates by “integrating multiple bits of
visual information into one view” (p. 2), thereby reducing cognitive load. Moreover,
many studies have suggested that cognitive load can be reduced by AR interfaces (Haniff
& Baber, 2003; Klatzky, Wu, Shelton, & Stetton, 2008; Tang, Owen, Biocca, & Mou,
2003).
Kirsh and Maglio (1994) stated that epistemic actions reduce cognitive load
because they are physical actions that improve cognition by reducing the memory
involved in computation, decreasing the number of steps involved in mental computation,
and reducing the probability of error of mental computation. Wilson (2002) stated that
cognitive processes are deeply rooted in the body’s interactions with the world and that
people off-load cognitive work onto the environment. Wilson explained that when
people off-load the cognitive task two strategies are used: preloading representation from
prior learning and reducing cognitive load by using epistemic actions to change the
working environment. By using interfaces that offer tangibility, the resulting epistemic
action can be hypothesized to reduce cognitive load.

33
Measuring Cognitive Load
Brunken, Plass, and Leutner (2003) stated that the methods for measuring
cognitive load can be divided into two main categories: measures of objectivity (objective
and subjective) and measures of causal relationships. Self-reports and objective
observations fall into the first category, while identifying and measuring cognitive load
through links with other variables fall in the latter category. Brunken, Plass, and Leutner
explained causal relationships with an example of navigation errors, which result from
cognitive load caused by an incomplete mental model of the high cognitive load-laden
learning environment. They elaborated on other methods such as indirect-subjective
measures, direct-subjective measures, indirect-objective measures, and direct-objective
measures.
The measurement of cognitive load could also be associated with the three types
of cognitive load (intrinsic, extraneous, and germane). Intrinsic cognitive load relates to
the difficulty of the subject matter (Cooper, 1998). Therefore, intrinsic cognitive load
can be considered to depend on the difficulty level of the subject matter rather than being
a property of other elements. Extraneous cognitive load is evoked by the instructional
material and does not directly contribute to learning. Germane cognitive load includes
processes required to learn the material such as interpreting, exemplifying, classifying,
inferring, differentiating, and organizing.
Cognitive load has also been measured by more physical means such as psycho-
physiological measures like pupillometry and eye tracking (Klingner, 2010) or
neuroimaging (Smith & Jonides, 1997).

34
While a number of similar methods and tools evaluate and measure cognitive
load, one of the more established is the NASA TLX, which assesses subjective mental
workload (Galy, Cariou, & Mélan, 2012). Mental workload can be defined as the
cognitive demand of a task (Miyake, 2001) and is a measurable dimension of cognitive
load (Kablan & Erden, 2008; Kirschner, 2002). The NASA TLX assesses workload on
five 7-point scales: Mental Demand, Physical Demand, Temporal Demand, Performance,
Effort, and Frustration. It is available in both a paper and pencil as well as a computer-
based version. Its reliability and validity have been evaluated (Hart, 2006; Xiao, Wang,
Wang, & Lan, 2005) and it has been established as a valid method for assessing cognitive
load.
In a follow-up study 20 years after introducing the NASA TLX, Hart (2006)
surveyed 550 research projects that had used the NASA TLX to calculate cognitive load.
She found that 6% of the studies were dedicated to measuring cognitive load of virtual or
augmented vision. Most of the studies on cognitive load in AR interfaces have focused
on its effect on learning (Shirazi & Behzadan, 2015; Slijepcevic, 2013) and task
performance (Biocca, Owen, Tang, & Bohil, 2007; Biocca, Tang, Owen, & Xiao, 2006;
Medenica, Kun, Paek, & Palinko, 2011; Tang et al. 2003).
Many studies have incorporated NASA TLX. Tracy and Albers (2006) used
multiple methods to assess the cognitive load in website design, including NASA TLX as
the standard method of measuring cognitive load, the Sternberg Memory Test, and a
tapping test. They did not compare these methods but simply suggested that measuring
cognitive load provides “an additional level of usability testing besides the normal
method of watching a user interact with a site” (p. 259). Windell and Wiebe (2007)

35
compared two methods of measuring cognitive load: NASA TLX and Paas’ self-report
instrument. They examined whether these two measurements were consistent with each
other and if both were equally sensitive across changes in levels of cognitive load and
concluded that the two measures provide different outcomes in terms of cognitive load of
a PC-based, multimedia-learning environment. Schmutz, Heinz, Métrailler, and Opwis
(2009) used the NASA TLX to measure cognitive load of e-commerce applications to
understand their effects on user satisfaction, while Jahn, Oehme, Krems, and Gelau
(2005) used it to measure the cognitive load in learning programming languages.
Even though the NASA TLX is widely used as a subjective measurement tool to
assess cognitive load (Haapalainen, Kim, Forlizzi, & Dey, 2010), Mital and Govindaraju
(1999) suggested that self-report measurements are not a reliable indicator of cognitive
load. However, the NASA TLX provides a robust and tested subjective measurement of
cognitive load by assessing six subscales which include the perceived levels of workload.
These subscales measure the perceived workload of physical activity such as perceived
physical demand. Especially when the focus is on understanding tangibility and its effect
on the work activity, these subscales provide a valid measurement for understanding the
cognitive load of interfaces.

36
Effects of Media Interfaces on Fixation
Media interfaces such as AR employ physical objects, instruments, surfaces, and
spaces as physical interfaces to digital information (Ishii & Ullmer, 1997). Such
interfaces combine physical representations with digital representations (Ullmer & Ishii,
2000). The current study explores how tangibility in interfaces such as AR can be used
in the design process to reduce cognitive load and fixation effects, thereby allowing AR
to be used as a tool to enhance the creative design process in design education as well as
the design practice.
AR has been defined in many ways. One of the more accepted definitions of AR
states that it is a variation of VR (Azuma, 1997). While VR immerses the user in an
artificially created digital environment that is disconnected from the surrounding physical
environment, AR provides the user with information about the surrounding physical
environment by overlaying the virtual over the physical. AR allows 2D and 3D
computer-generated objects to be overlain onto physical objects and space, thereby
creating a tangible experience for users. The physical interaction affords designers direct,
naïve manipulability and intuitive understanding (Kim & Maher, 2005) as well as tactile
interaction. This type of interface, in which real objects are enhanced digitally, has been
shown to reduce mental work load or cognitive load (Fitzmaurice, 1996; Tang et al.,
2003).
Forty years ago, very little was known about the design process, let alone how
digital interfaces might affect it. Knowledge about how designers think and work is still
being investigated through different viewpoints and methods. Some studies have
examined the functioning of the design process, while others have focused on designers’

37
individual traits and the way they design, and still others have examined how design tools
are being used in the design process. This study explores how designers use digital
interfaces in the design process and how the properties of the digital interface and user
perception of using these interfaces impact the design process. Recently there has been
much interest in the use of digital design interfaces that generate new skills and
viewpoints to create new architectural knowledge. However, there are few or no
theoretical frameworks to understand how designers use these interfaces. Understanding
how digital design interfaces work and provide support to the design process is essential
for the development of digital design interfaces as well as the development of a
comprehensive pedagogical agenda for digital design.
Tangible versus Graphical Interaction
For the past two decades, computer interfaces that allow direct interaction have
generated much excitement. With the advent of touch screens, little has changed except
for mobile device interaction. The WIMP (windows, icons, menus, pointer) interface that
people are accustomed to has been efficient in conducting day-to-day activities such as
word processing or balancing accounts using a spreadsheet. However, specialized tasks
such as graphic design and 3D modeling have required the adoption of alternate interface
solutions to use digital technology efficiently in their respective domains. For example,
the responsive screen of a Cintique tablet computer can be considered to provide a more
efficient means of enhancing a graphic artist’s creative process (Howe, 1992).
Different domains require different qualities in a user interface. For example,
despite the proliferation of advanced digital design tools, many contemporary designers
prefer to use physical models in the design process due to their tangibility. While

38
working with physical models has certain advantages, it also has disadvantages such as
the amount of time required to make physical models and the associated costs.
Moreover, other fundamental issues such as fixation have been shown to be induced by
physical models (Viswanathan & Linsey, 2011). Therefore, identifying what type of
interface works best in a particular domain is critical.
In the current study, both a VR interface and an AR interface are examined. The
VR interface is a primarily a graphics-based interface controlled through a mouse as an
interaction device and driven by the WIMP paradigm. The AR interface is a primarily
tactile or tangible interface controlled through physical interaction. Ishii (2007) stated
that in AR interfaces the user directly manipulates digital information through hand
movements and directly perceives digital information from the physical movement. By
contrast, in the VR interface information is manipulated by using controllers such as mice
and keyboards.
Direct manipulation (Shneiderman, 1982) is a fundamental concept in human-
computer interaction. Some characteristics of direct manipulation include “continuous
representation of the object of interest, physical actions or labeled button presses instead
of complex syntax, and rapid incremental reversible operations whose impact on the
object of interest is immediately visible” (Shneiderman, 1982, p. 251).
A number of studies have been conducted using alternate interfaces and
interaction methods for design and design education (Ishii et al., 2004; Ullmer & Ishii,
2000). Systems that use tangibility in interfaces such as URP (urban planning
workbench) have been primarily used for the final phase of design. However, researchers
have proposed that AR interfaces that use tangible interaction methods can affect design

39
cognition (Bekker, Olson, & Olson, 1995; Tang, 1991), and Kim and Maher (2005) found
that AR can be used as tangible design interfaces that affect the designer’s cognitive
processes.
Embodiment and Tangibility
Embodiment is a concept that is extensively discussed in relation to VR and AR.
Dourish (2001) stated that embodiment refers to “the property of our engagement with
the world that allows us to make it meaningful” (p. 126) and that people and their actions
are embodied elements of the everyday world. Therefore, embodiment is a way of being.
In VR and AR environments, a person’s feeling that he or she has a body image within
the spaces is important, and the level of embodiment becomes crucial in identifying the
space that a person occupies in real life. Wilson (2002) related the concept of
embodiment to embodied cognition, incorporating the idea that cognitive processes are
deeply dependent on the body’s interactions with the world. Wilson further stated that
cognitive processes are based on our physical interaction in the real world and that the
environment is part of the cognitive system. Similarly, Klemmer, Hartmann, and
Takayama (2006) stated that this physical interaction with the environment affects one’s
understanding of the real world. Interfaces with tangibility capitalize on people’s natural
means of interacting with the environment and provide familiarity, which in turn reduces
cognitive load when using those interfaces.
Kirsh (2013) stated that tools change the way people think and perceive, and
when tools are manipulated they are absorbed into the body schema, which changes the
way people perceive the environment. He further stated that these type of tools become
important in interacting with interfaces because people think not only with their minds
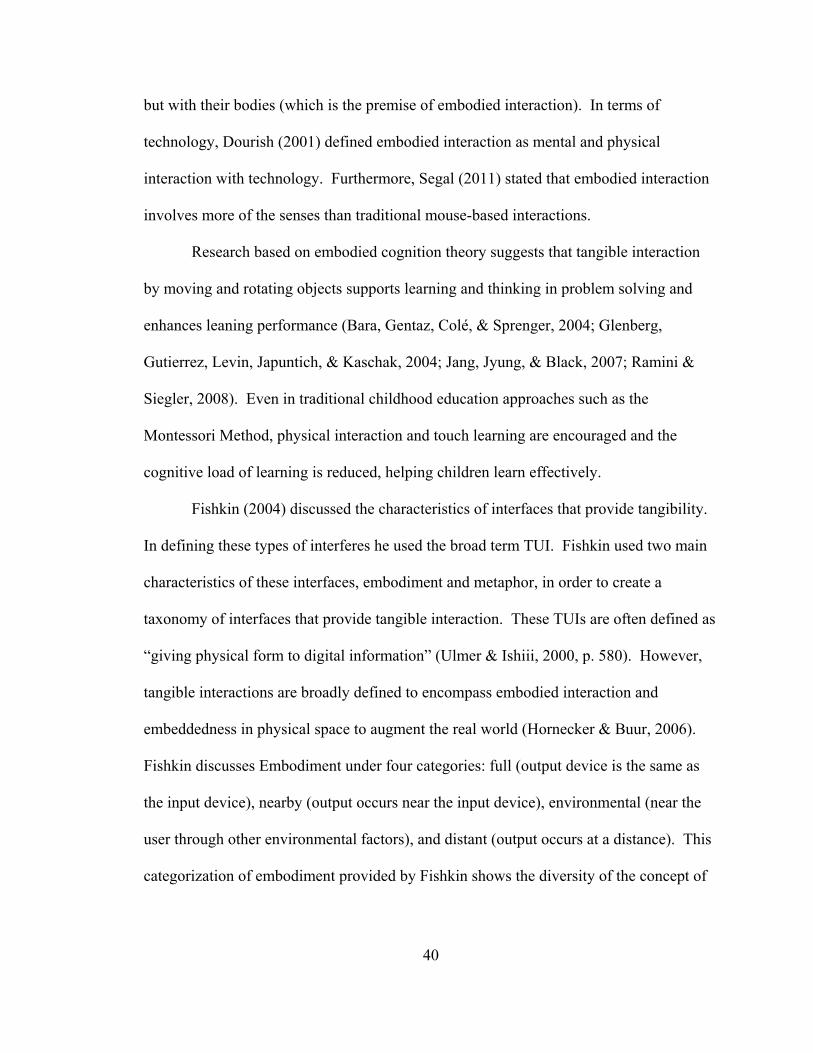
40
but with their bodies (which is the premise of embodied interaction). In terms of
technology, Dourish (2001) defined embodied interaction as mental and physical
interaction with technology. Furthermore, Segal (2011) stated that embodied interaction
involves more of the senses than traditional mouse-based interactions.
Research based on embodied cognition theory suggests that tangible interaction
by moving and rotating objects supports learning and thinking in problem solving and
enhances leaning performance (Bara, Gentaz, Colé, & Sprenger, 2004; Glenberg,
Gutierrez, Levin, Japuntich, & Kaschak, 2004; Jang, Jyung, & Black, 2007; Ramini &
Siegler, 2008). Even in traditional childhood education approaches such as the
Montessori Method, physical interaction and touch learning are encouraged and the
cognitive load of learning is reduced, helping children learn effectively.
Fishkin (2004) discussed the characteristics of interfaces that provide tangibility.
In defining these types of interferes he used the broad term TUI. Fishkin used two main
characteristics of these interfaces, embodiment and metaphor, in order to create a
taxonomy of interfaces that provide tangible interaction. These TUIs are often defined as
“giving physical form to digital information” (Ulmer & Ishiii, 2000, p. 580). However,
tangible interactions are broadly defined to encompass embodied interaction and
embeddedness in physical space to augment the real world (Hornecker & Buur, 2006).
Fishkin discusses Embodiment under four categories: full (output device is the same as
the input device), nearby (output occurs near the input device), environmental (near the
user through other environmental factors), and distant (output occurs at a distance). This
categorization of embodiment provided by Fishkin shows the diversity of the concept of

41
embodiment and how it can be used as a scale in categorizing user interfaces. In the
current study the output occurs through the same input mechanism.
Direct manipulation was defined by Shneiderman (1982) as the ability to
manipulate digital objects on a screen without the use of command-line commands. On a
broader scale, Heeter (1991, p. 2) stated that direct manipulation has the following
characteristics.
The objects and actions which can be applied to those objects are visible.
The interface is transparent.
The user interacts with objects instead of intermediaries.
Using the interface feels like driving a car.
Moreover, Wolf and Rhyne (1987) stated that direct manipulation is not a single interface
style but a characteristic that is shared by many different types of interfaces.
Millard and Soylu (2009) discussed the differences in direct manipulation in a
variety of interfaces, especially WIMP-based interfaces and interfaces that offer tangible
interaction. WIMP-based interfaces cause more difficulty due to their complexity, as
compared with interfaces that offer tangibility, which provide the user with “direct
manipulation in its purest form” (p. 468). Differences in direct manipulation were also
documented by Segal (2011), who adapted Shneiderman’s (1982) concept of direct
manipulation focused on keyboard- and mouse-based interfaces to interfaces that allow
natural interactions such as gestures. Segal explored different levels of direct
manipulation based on embodiment and how these different levels reduce cognitive load
and enhance performance.

42
The psychological literature confirms that transferring known skills to complete a
new task is easier than expending resources to acquire a completely new skill. Therefore,
using natural interaction methods provided by interfaces that afford tangible interaction
can be hypothesized to consume less cognitive resources than WIMP-based or mouse- or
keyboard-based interfaces. While direct manipulation may be the method of interaction
in both tangible interaction and WIMP-based interaction, the levels of embodiment in the
two types of interface are different. The current study focuses on a WIMP-based VR
interface and a tangible AR interface in order to investigate how these interfaces affect
the creative design process.
Virtual Reality (VR) and Augmented Reality (AR)
VR has been extensively used in educational environments. As AR technology is
becoming more accessible, it is being more often adapted for mainstream use. While VR
can generally be interpreted as an immersive three-dimensional computer-generated
environment, AR can be thought of as overlaying of the virtual over the physical
environment.
VR is a simulated three-dimensional environment which either emulates the real
world or acts as an imaginary world. Even though the majority of virtual environments
cater to the visual sense, virtual environments can cater to the auditory, haptic, olfactory,
and even the taste sense. VR is commonly used as an entertainment, education, and
research tool. It offers a wide variety of options and opportunities in conducting
research, especially in human behavior research, since virtual environments can be
controlled according to the need of the researcher.

43
AR has been defined as a variation of VR (Azuma, 1997). While VR completely
immerses the user inside a computer-generated environment where the user cannot relate
to the physical environment, AR allows the overlaying of virtual elements onto the
physical environment. AR can be considered a hybrid of virtual and physical
environments and therefore supplements reality rather than replacing it. Given the
similarities and overlapping of certain characteristics between these two interfaces (AR
and VR), there is a critical need to identify advantages or disadvantages of one over the
other for its use in a specific domain.
Virtual Reality (VR)
VR can be defined from a technology standpoint (associated hardware) as well as
from an experiential standpoint (focusing on experiences such as immersion and
presence). On a broader scale, VR is defined as “an alternate world filled with computer
generated images that respond to human movements. These simulated environments are
usually visited with the aid of an expensive data suit which features stereophonic video
goggles and fiber optic data gloves” (Greenbaum, 1992, p. 58) or as “three dimensional
realities implemented with stereo viewing goggles and reality gloves” (Krueger, 1991, p.
xiii).
Biocca and Levy (2013) provided multiple classifications of VR. One
classification was based on the technology used: Windows systems (a computer screen
providing a window to an interactive 3D virtual world), mirror systems (superimposing
video of the user on a projected system, mirroring his or her action and movements),
vehicle-based systems (simulation of a vehicle), and cave systems (room enclosures
surrounded by large screens). They also provided two categories of immersive VR

44
systems (Head Mounted Display-based) and AR systems (Head Mounted Display -
based). Other researchers have also categorized VR as non-immersive and immersive
(Kozhevnikov & Gurlitt, 2013; Mizell, Jones, Slater, & Spanlang, 2002; Robertson, Card,
& Mackinlay, 1993). Non-immersive VR systems are often described as computer-
simulated 3D environments that are viewed through a computer screen and are
manipulated through a mouse and keyboard and therefore belong in the WIMP paradigm.
According to Jacobson (1993), there are four types of VR: immersive, desktop,
projection, and simulation. One common denominator across these different types is
some form of a device that is used to manipulate the digital environment (such as a
mouse, controller, or keyboard). Thurman and Mattoon (1994) used a different approach
by identifying a “verity dimension” that they used to differentiate among types of VR.
Ultimately, VR environments provide an immersive experience in which users are free to
explore and interact in a 3-D world.
In comparison to traditional educational tools, VR offers a number of advantages,
including time-efficiency and cost-efficiency. (In some cases, cost-efficiency is highly
debatable because VR requires high-end equipment and expensive technology. However,
in the context of this study, what is meant here is desktop VR using cost-effective open
source or free software.) The use of desktop VR has been increasing through the years,
especially in the domain of education. A variety of open-source and cost-effective 3D
simulation software allows students the opportunity to create 3D VR simulation using a
WIMP-based interface. Even though the potential of using VR in education has been
elaborated by many researchers, the cost associated with the necessary hardware and
software initially prevented its use in classrooms and design studios that did not have the

45
necessary resources. Recently, however, desktop VR has provided a cost-effective
solution for creating VR environments and using them for educational purposes. Dobson
(1998) offered the theoretical framework for using desktop VR in design education and
stated that these types of VR systems provide about 80% of the functionality of full VR
systems.
When it is used in education, VR has also been known to facilitate knowledge
acquisition (Mikropoulos, 2001). Some studies suggest that VR offers motivation to
students to improve information encoding, retention, and later performance (Huang,
Rauch, & Liaw, 2010; Stone, 2001). Nevertheless, some researchers have raised
concerns about using virtual environments for educational purposes (Psotka, 2013).
Psychophysiological studies have shown that the attention spans of individuals increase
in computer-simulated environments (Mikropoulos, 2001). Researchers have also
discussed the use of desktop VR specifically in design and design education (Dobson,
1998; Schnabel, 2004). Dobson stated that the real-time immersive system allows
students to use it as an active design tool for conceptual design purposes. Chan (1997)
stated that VR can be used as a design instrument to increase creativity and as a research
tool in design and design education because properties of the interface such as
interactivity and representation allow designers to visualize and test design solutions
within these virtual environments.
Augmented Reality (AR)
AR has been defined as a variation of VR (Azuma, 1997). While VR completely
immerses the user inside a computer-generated environment where they cannot relate to
the physical environment, AR allows the overlaying of virtual elements onto the physical

46
environment. AR can be considered a hybrid of virtual and physical environments, and
supplements reality rather than replacing it. Azuma (1997) stated that the most common
characteristics of AR are that it combines real and virtual elements, it is interactive in real
time, and it registers real and virtual objects with each other. Milgram and Kishino (1994)
operationally defined AR as any instance in which an otherwise real environment is
“augmented” by means of virtual computer graphics and therefore as a middle ground
between virtual and physical environments. They described two types of “mixed
realities:” augmented reality, in which the physical world is enhanced using virtual
elements, and augmented virtuality, in which the virtual environment is enhanced using
physical (or real) elements (see Figure 3).
Figure 3. The relationship between the physical environment, augmented reality, augmented virtuality, and virtual environment. Based on Milgram and Kishino’s (1994) virtual-physical continuum diagram.
Another type of environment which also can be considered under the AR
categorization includes mediated reality systems (MRS), also called computer-mediated
reality (CMR). These environments include both diminished reality (certain elements are
taken out of the physical setting) and AR (certain elements are superimposed onto the
physical setting). Although not exactly a separate category, MRS is seen as another
taxonomic system to which AR belongs (Mann & Nnif, 1994). However, in some
instances the term MRS is used to exclusively describe diminished reality (Jarusirisawad,
Hosokawa, & Saito, 2010).
Physical Environment Virtual Environment
Augmented Reality Augmented Virtuality

47
Normand, Servieres, and Moreau (2012) stated that existing AR taxonomies can
be categorized as technique-centered taxonomies, user-centered taxonomies, information-
centered taxonomies, and taxonomy based on the target of augmentations. They refer to
Milgram and Kishino’s (1994) and Milgram and Colquhoun’s (1999) taxonomies to
explain technique-centered taxonomies based on technology characteristics such as
reproduction fidelity and egocentricness/exocentricness. Normand et al. (2012) provided
examples of user-centered taxonomies from Lindeman and Noma (2007), Wang and
Dunston (2006), and Hugues, Fuchs, Nannipieri (2011) that are based on how users
interact with the technology. They also offered examples of information-centered
taxonomies from Suomela and Lehikoinen (2004) and Tonnis and Plecher (2011) based
on how the technology uses information such as location-based data. Their final category
was based on the target of augmentations to classify interfaces in which neither the
technology nor the functionalities of the application domain were considered.
Milgram, Takemura, Utsumi, and Kishino (1995) provided a taxonomy of AR
similar to the ones that Normand et al. (2012) cited in their study on technique-centered
taxonomy. Milgram et al. based their taxonomy on extent of world knowledge (EWK),
reproduction fidelity (RF) and extent of presence metaphor (EPM). In this taxonomy
they observed the two main types of AR display systems, head-mounted see-through and
monitor-based video AR displays. Milgram et al. stated that head-mounted see-through
displays “are characterized by the ability to see through the display medium directly to
the world surrounding the observer, thereby achieving both the maximum possible extent
of presence and the ultimate degree of real space imaging” (p. 284). They further used
the terms “non-immersive” and “window-on-the-world” to describe display systems in

48
which computer generated content is overlaid on live video (webcam based) or stored
video sources.
Both, non-immersive” and “window-on-the-world” types of AR have been
extensively used in different contexts. Many studies have explored the use of AR in
education (Billinghurst, 2002; Chen, 2006; Kaufmann, 2003; Pasaréti et al., 2011;
Shelton, 2002), particularly why AR would be a good interface for design exploration
(Kim & Maher 2008; Seichter & Schnabel, 2005). Even though the use of VR has been
documented in design education (De Vries & Achten, 1998), studies focusing on the use
of AR in architectural and interior design education are scarce. Very simple AR tasks,
such as changing the color of a room in real time, to more complex tasks, such as
exploring how a building sits on a site, can be very helpful for designers. Software such
as Metaio Creator, which is used to create AR content, and Junaio, an AR browser,
allows designers to easily create convincing AR experiences without using any complex
coding.
A number of studies have explored desktop AR solutions for a variety of uses
including education, medicine, and design and design education (Burke et al., 2010;
Chen, 2006; Chandrasekera, 2014; Jeon, Shim, & Kim, 2006). Ibañez, Di Serio, Villaran,
and Kloos (2014) investigated the differences in student learning between an AR-based
application and a web-based application. Their participants who used the AR-based
application had more positive feelings afterward and showed higher levels of
concentration while completing their design task, leading to the conclusion that students
who used AR attained a deeper understanding of the task than those using a web-based
application. While similar studies have been conducted in other educational domains,
49
few attempts have been made to explore the possibilities of using AR in architecture and
interior design education.
A desktop AR system uses a webcam, a desktop or laptop computer, and a
fiducial marker. The virtual object is overlaid on the marker and displayed on the
computer screen. In most cases the webcam is facing the viewer. The cost-effective
nature of desktop AR has provided the opportunity for its use in many domains. The
number of open source and free or cost-effective software solutions that allow creating
these desktop AR experiences have also improved the accessibility of this technology.
Previous studies have shown that not only can these type of AR experiences be used in
design education but such experiences have been shown to be preferred by design
students as an instructional medium as and to improve their spatio-cognitive abilities
(Chandrasekera & Yoon, 2015; Martín-Gutiérrez et al., 2010).
Effects of User Characteristics on the Design Process
Digital interfaces affect the design process in a number of ways. It is important to
understand how these interfaces affect the design process and thereby the people using
them. The purpose of this study is to explore digital interfaces and user preferences for
learning.
Research on using digital media in design education has for the most part focused
on the development of the technology. Whatever user evaluation has been done has
focused on technical aspects rather than using a human-centered approach (Gabbard &
Swan, 2008). Nevertheless, both system and user performance measurements are
50
important aspects for AR because the technology coordinates the physical environment
and the computer-generated overlaid environment (Grier et al., 2012).
In his 10 books on architecture, Vitruvius (1960) stated that an architect should be
a good writer, a skillful draftsman, versed in geometry and optics, expert at figures,
acquainted with history, informed on the principles of natural and moral philosophy,
somewhat of a musician, not ignorant of the law and of physics, nor of the motions, laws,
and relations to each other, of the heavenly bodies (as cited in D’Souza, 2009, p. 173).
Apart from these basic technical skills, an architect is assumed to have or acquire
imagination and be creative and must gain artistic and intellectual abilities as well (Potur
& Barkul, 2007). Isham (1997, p. 2) stated, “The ability to concisely communicate a
highly complex and creative design solution has at its creative core visualization skills
(internal imaging) that allow designers to mentally create, manipulate and communicate
solutions effectively.”
These different characteristics that make a designer may depend on the designer’s
innate skills and intelligences as well as the learning method. Thurstone (1938) described
intelligence as a combination of factors such as associative memory, number facility,
perceptual speed, reasoning, spatial visualization, verbal comprehension, and word
fluency. He further identified three factors of spatial ability, mental rotation, spatial
visualization, and spatial perception. D’Souza (2006) stated that designers use the seven
types of intelligences which Gardener (1983) discusses – logical, kinesthetic, spatial,
interpersonal, intrapersonal, verbal, and musical intelligence – and suggested the addition
of graphical, suprapersonal, assimilative, and visual intelligences to the types of
intelligences so that the framework for design intelligence is more comprehensive.

51
According to Gardner’s multiple intelligences theory, individuals have a
distinctive capacity to succeed in a particular field, and the method of educating these
individuals should foster these intelligences. The idea of learning styles suggests that
individuals have a particular way of learning that works best for them. For example,
some individuals learn more easily from visual activities and some learn more easily
from hands-on activities. Educators should identify the learning style best suited for the
student.
Understanding the learner preferences of the individual is important when
selecting the instructional medium. In this study, emphasis is on learner preference
instead of intelligences because this study focuses on the modality through which
information is provided to the students (i.e., through the AR or VR interface).
Learning Styles
Researchers have attempted to identify how individuals learn and have provided a
number of categorizations. The term “learning styles” was first used in an article by
Thelen in 1954, and thereafter has been defined by many. Ausubel, Novak, and Hanesian
(1968) defined it as “self-consistent, enduring individual differences in cognitive
organization and functioning” (p. 203), while Keefe (1979) defined it as “cognitive,
affective, and physiological traits that serve as relatively stable indicators of how learners
perceive, interact with, and respond to the learning environment” (p. 2). A general
definition of learning styles was provided by James and Gardner (1995) as the different
patterns of how individuals learn.
A number of researchers have presented theoretical frameworks that explain these
learning styles. Curry’s (1983) onion model explores different learning style theoretical

52
frameworks and provides four main categories: personality learning theories, information
processing theories, social learning theories, and multidimensional and instructional
theories.
According to the onion model, some learning theories focus on the personality of
the individual (such as the Myers-Briggs indicator), information processing theories
describe how individuals perceive and process learning activities. Kolb’s (1984) model
of information processing is an example of this type of theory. Social learning theories
describe an individual’s interaction with the environment. The fourth type attempts a
more holistic view of learning through analyzing multiple dimensions. In his multiple
intelligence theory, Gardner described several dimensions of learning, such as inter
personal, intra personal, visual-spatial, bodily-kinesthetic, linguistic, and logical
(Gardner, 1983).
While many of these theories propose using learning styles as a mechanism to
better mold instructional modalities to cater to the individual, the rationale in identifying
learning styles in this study is to understand the user preference for digital interfaces and
the efficient use of that digital interface in the creative design process. Dunn (1993)
stated that
if individuals have significantly different learning styles, as they appear to have, is it not unprofessional, irresponsible, and immoral to teach all students the same lesson in the same way without identifying their unique strengths and then providing responsive instruction? (p. 30)
Therefore, the logical question that remains is not whether educators should instruct
students in different ways but which methods are best for which students.

53
Learning Styles in Design Education
Learning styles that are applicable to design are defined by the way designers
observe and solve design problems. Design educators have explored design students’
learner preferences and styles by observing learner preferences of design students
(Demirbas & Demirkan, 2003; Kvan & Jia, 2005). Newland, Powell, and Creed (1987)
identified four types of design learners by using Kolb’s learner styles as a starting
ground. Durling, Cross, and Johnson (1996) observed cognitive styles using the Myers-
Briggs type indicator (Briggs, 1976) to identify the connection between teaching and
learning in design schools.
Students of different disciplines have shown preferences for a certain type of
learning style. For example, using the VARK questionnaire, Lujan and DiCarlo (2006)
found that medical students prefer multiple learning styles. Felder and Silverman (1988)
stated that the learning styles of most engineering students are mismatched with teaching
styles of most engineering professors and recommended that professors use different
methods to facilitate the learner preference of the students. The learner preference of
students from a certain discipline may be similar for a number of reasons, such as shared
interests or similar aptitude. In design education, students tend to be more visual and to
enjoy working with physical objects such as building prototypes. These preferences and
aptitudes may predispose them to a certain learner preference.
Researchers have stated that the most important facet of design and design
education is self-reflection, in which a designer would revisit and reflect on the design
decisions that have been made (Newland, Powell, & Creed, 1987). Trial and error
problem solving encourages and facilitates this type of self-reflective design ideation in

54
enhancing the creative design process (Harnad, 2006). The fact that trial and error type
of problem solving plays a major role in a design students’ academic career might
influence their learner preference as well.
Creativity, Motivation, and Acceptance
Motivation is generally understood as a personal drive to accomplish. Motivation
can be intrinsic or extrinsic. Intrinsic motivation is defined as doing something for one’s
own satisfaction (Amabile & Gryskiewicz, 1987) and extrinsic motivation is defined as
“the motivation to work on something primarily because it is a means to an end”
(Amabile, 1987, p. 224).
Researchers have studied the connection between intrinsic motivation and
creativity (Amabile, 1985; Collins & Amabile, 1999; Hennessey, & Amabile, 1998;
Koestner, Ryan, Bernieri, & Holt, 1984) as well as motivation and creativity in the
context of design (Casakin & Kreitler, 2010; Kreitler, & Casakin, 2009) and found that
when motivation is less, creative output decreases (Collins & Amabile, 1999). Runco
(2005, p. 609) stated that “creative potential is not fulfilled unless the individual is
motivated to do so, and creative solutions are not found unless the individual is motivated
to apply his or her skills.”
The technology acceptance model (TAM) uses the perceived usefulness construct
to capture associated extrinsic motivation (Davis, 1989). Even though intrinsic
motivation was initially included, TAM does not directly capture this construct.
Venkatesh (2000) stated that intrinsic motivation affects perceived ease of use. Because
technology acceptance is affected by perceived ease of use and perceived ease of use is
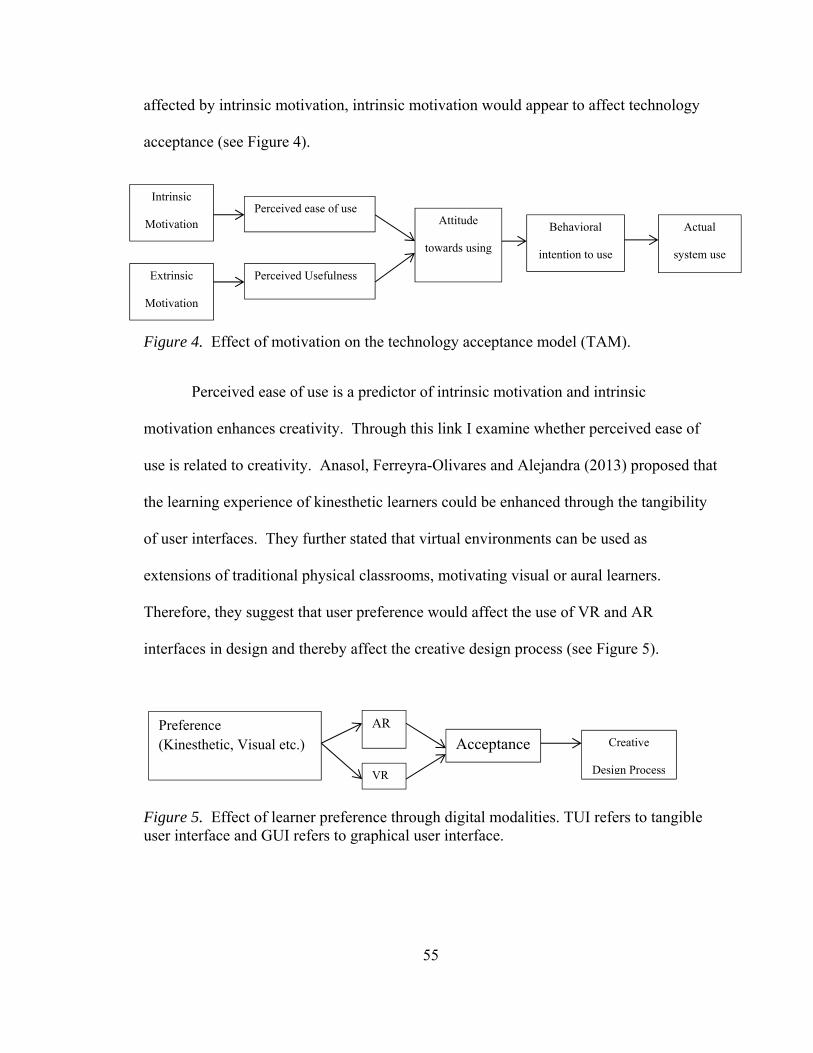
55
affected by intrinsic motivation, intrinsic motivation would appear to affect technology
acceptance (see Figure 4).
Figure 4. Effect of motivation on the technology acceptance model (TAM).
Perceived ease of use is a predictor of intrinsic motivation and intrinsic
motivation enhances creativity. Through this link I examine whether perceived ease of
use is related to creativity. Anasol, Ferreyra-Olivares and Alejandra (2013) proposed that
the learning experience of kinesthetic learners could be enhanced through the tangibility
of user interfaces. They further stated that virtual environments can be used as
extensions of traditional physical classrooms, motivating visual or aural learners.
Therefore, they suggest that user preference would affect the use of VR and AR
interfaces in design and thereby affect the creative design process (see Figure 5).
Figure 5. Effect of learner preference through digital modalities. TUI refers to tangible user interface and GUI refers to graphical user interface.
Perceived ease of use
Perceived Usefulness
Behavioral
intention to use
Actual
system use
Attitude
towards using
Extrinsic
Motivation
Intrinsic
Motivation
Preference (Kinesthetic, Visual etc.) Acceptance Creative
Design Process
AR
VR

56
Measuring Learning Styles: VARK Learning Styles Inventory
The VAK (visual, auditory, kinaesthetic) and VARK (visual, aural, reading and
writing, kinesthetic) learning style inventories have been used in many studies (Bell,
Koch, & Green, 2014; Drago, & Wagner, 2004; Lau, Yuen, & Chan, 2015; Marcy, 2001;
Wehrwein, Lujan, & DiCarlo, 2007).
Fleming (2006; Fleming & Mills, 1992) attempted to establish perceptual modes
as a measurable construct through the VARK inventory, which focuses on the individual
preferences of using different perceptive modalities in obtaining and retaining
information efficiently. Aural learners prefer receiving information through discussions,
seminars, lectures, and conversations. Visual learners obtain information efficiently
through pictures and other visual means such as charts, graphs, and other symbolic
devices instead of words. Learners who prefer obtaining information through text are
identified as readers/writers. These learners prefer textbooks, taking notes, readings, and
printed handouts. Kinesthetic learners prefer to learn through practical examples which
also may involve other perceptual modes. They prefer practical examples, hands-on
approaches in problem solving, and trial and error solutions to problems. Those who
prefer obtaining information through multiple sources are identified as multi-modal.
The VARK Learning styles inventory has gained immense popularity because of
its face validity and simplicity, which Leite, Svinicki, and Shi (2010) confirmed using
factor analysis to compare four multitrait-multimethod models to evaluate the dimensions
in the VARK. They stated that the estimated reliability coefficients were adequate.

57
Understanding the Design Process via Protocol Analysis
Think-aloud-protocol (TAP) is a research method that has been widely used to
analyze the design process and in usability testing as well as human computer interaction
research (McDonald, Edwards, & Zhao, 2012). More importantly, protocol analysis has
been adopted as a tool in identifying creativity in the design process (Nguyen & Shanks,
2007). In TAPs, participants are asked to verbalize their thoughts either during
(concurrent protocol) or after the design process (retrospective protocol).
The validity and reliability of protocol analysis has been a subject of study among
many scholars. Those who favor the retrospective protocol claim that participants may
not be able to perform two cognitive tasks (thinking and talking aloud) at the same time
without distorting the data. Those who prefer the concurrent protocol argue that as
participants recall their design process during a retrospective session, they tend to forget
and fabricate data. In a study to resolve this matter, Russo, Johnson, and Stephens (1989)
compared the reactivity and veridicality of concurrent protocol and retrospective
protocols. Reactivity measures whether verbalization changes the primary process and
veridicality measures whether the protocol accurately reflects the design process. Russo
et al. found that the concurrent protocol satisfied reactivity whereas retrospective protocol
was nonveridical. Kuusela and Pallab (2000) further studied the advantages and
disadvantages of the two protocols and found that concurrent data provided more
information about decision making, while the retrospective method provided more insight
about the final choice. McNeill, Gero, and Warren (1998) suggested that two factors
should be considered when analyzing protocol data: the adequacy in reflecting the
complexity of the data without distortion and the objectivity of the coding protocol. They

58
also indicated that the first issue can be addressed by incorporating coding categories
from previous studies and the second can be solved by adjusting for inter-coder
reliability.
While TAP studies are used to better understand the underlying cognitive
functions and to capture design decisions, the connection between these design decisions
are captured by a technique introduced by Goldschmidt (1990) known as linkography.
Focusing mainly on linkography, Pouhramadi and Gero (2011) identified the following
phases in conducting a complete protocol analysis:
1. Definition of a coding scheme,
2. Recording the activity of designers,
3. Transcription of the recordings,
4. Segmentation of the design discourse according to the coding scheme,
5. Analysis of coded protocols,
6. Definition of links between design steps, and
7. Analysis of the graph of links among design moves (linkography).
Kan and Gero (2008) stated that linkography has two main advantages in studying design
protocols. Because the method does not rely on the number of designers and because the
length of the linkograph can vary with any set duration, linkographs are said to be
scalable in two dimensions. Furthermore, since the design moves and how these moves
are linked can be coded separately, linkographs are said to be flexible.
Linkography
Goldschmidt (1990) initially developed the linkography technique to be used in
protocol analysis that focuses on designers’ cognitive activities. Later, Goldschmidt
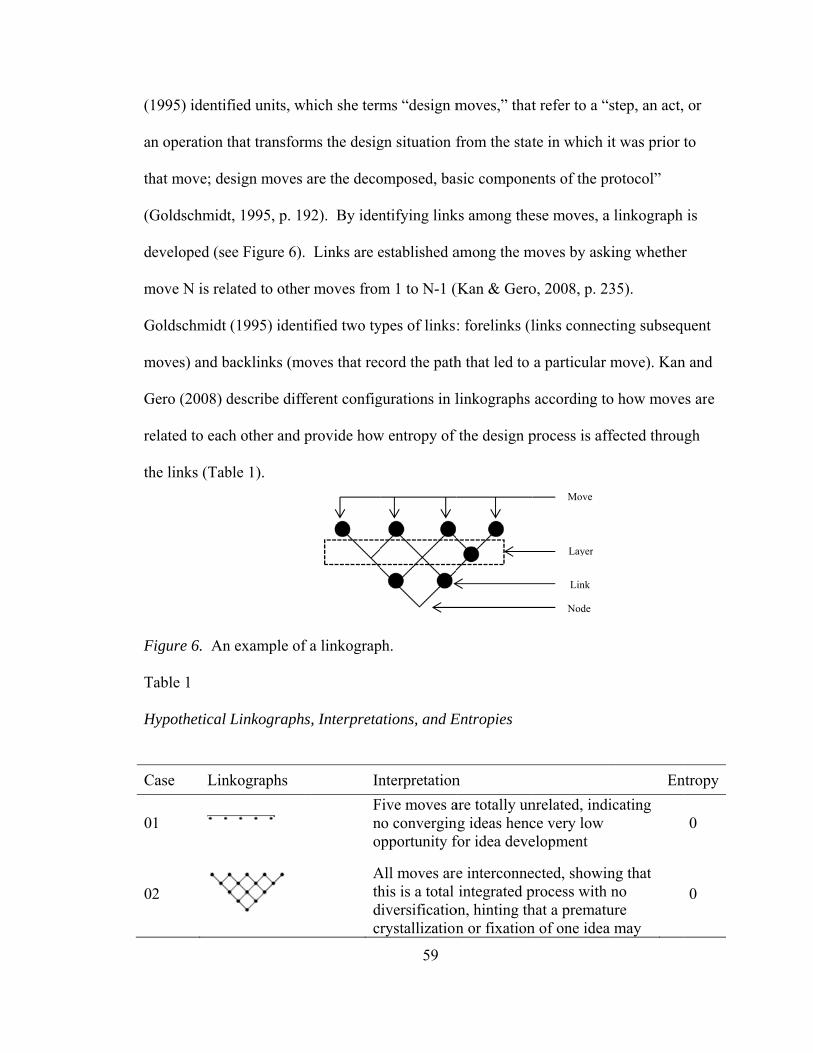
(1
an
th
(G
d
m
G
m
G
re
th
F
T H
C
0
0
1995) identif
n operation t
hat move; de
Goldschmidt
eveloped (se
move N is rel
Goldschmidt
moves) and b
Gero (2008) d
elated to eac
he links (Tab
Figure 6. An
Table 1
Hypothetical
Case Lin
1
2
fied units, w
that transfor
esign moves
t, 1995, p. 19
ee Figure 6).
lated to othe
(1995) ident
backlinks (m
describe diff
h other and
ble 1).
n example of
Linkograph
nkographs
which she term
rms the desig
are the deco
92). By iden
. Links are e
r moves from
tified two ty
moves that rec
ferent config
provide how
f a linkograp
s, Interpreta
In
Fno
Athdcr
59
ms “design m
gn situation f
omposed, ba
ntifying link
established a
m 1 to N-1 (
ypes of links
cord the path
gurations in l
w entropy of
ph.
ations, and E
nterpretation
Five moves ano convergin
pportunity f
All moves arehis is a total
diversificatiorystallization
moves,” that
from the stat
asic compone
ks among the
among the m
(Kan & Gero
: forelinks (l
h that led to
linkographs
f the design p
Entropies
n
are totally unng ideas hencfor idea deve
e interconneintegrated p
on, hinting thn or fixation
Move
Link
Node
Layer
t refer to a “
te in which i
ents of the p
ese moves, a
moves by ask
o, 2008, p. 2
links connec
a particular
according to
process is aff
nrelated, indice very low elopment
ected, showinprocess with hat a prematun of one idea
step, an act,
it was prior t
rotocol”
a linkograph
king whether
35).
cting subsequ
move). Kan
o how move
ffected throug
En
icating
ng that no
ure a may
or
to
is
r
uent
n and
s are
gh
ntropy
0
0

0
0
A
fi
an
in
m
(2
d
sy
ca
d
sy
en
ca
3
4
Adapted from
Linko
ixation. Kan
nd applied it
nformation in
more creative
2011) used th
esign proces
Accor
ymbol is bas
an be viewed
esign linkog
ymbol OFF
ntropy of a l
In this
alculating it.
m Kan and G
ography in de
n and Gero (
t to linkograp
n the text of
e process has
he calculated
ss.
rding to Shan
sed on the pr
d as a measu
graph are link
is used. Kan
linkograph:
H =
s study, the e
. Linkoder i
ho
Mcpwd
Mcod
Gero (2008, p
esign protoc
2009) emplo
phy. Entropy
f the protoco
s higher link
d dynamic e
nnon (1948)
robability of
ure of the po
ked, the sym
n and Gero (
= -p(ON)log(
emphasis is m
is a tool that 60
have occurredpportunity f
Moves are intonnected, inrogressing b
with some opdevelopment
Moves are intonnected, inpportunities
development
p. 336).
ols has been
oyed the idea
y is defined
l (Shannon,
kograph entro
entropy of a l
), the amoun
f the outcome
otential of the
mbol ON is u
(2005, p. 234
(p(ON)) - p(
more on iden
uses the Fun
d, therefore for novel ide
nter-related bndicating thabut not develpportunities f
nter-related bndicating thas for good id
n used to ana
a of entropy
as a measur
1948). Kan
opy than a le
linkograph t
nt of informa
e. Gero (20
e design acti
used and if th
4) provided
(OFF)log(p
ntifying fixa
nction, Beha
also very lowea
but also not tat the processloping, therefor idea
but also not tat there are lodeas with
alyze creativ
y from inform
rement of the
n and Gero sh
ess creative p
to measure th
ation carried
11) stated th
ivity. If two
hey are not l
the formula
p(OFF))
ation rather t
avior, Structu
w
totally s is efore 5
totally ots of
8
vity as well a
mation theory
e amount of
howed that a
process. Ge
he fixation i
by a messag
hat this entro
o moves in a
inked, the
to calculate
than on
ure (FBS)
5.46
8.57
as
y
a
ero
n a
ge or
opy
the
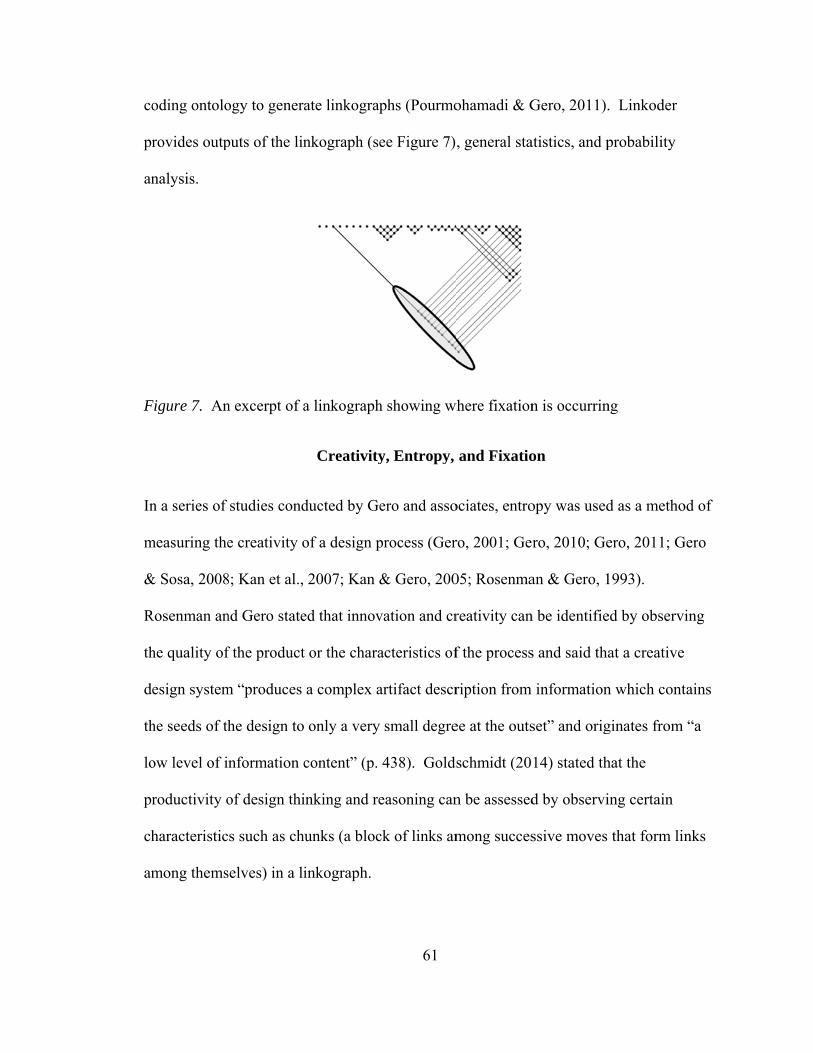
co
pr
an
F
In
m
&
R
th
d
th
lo
pr
ch
am
oding ontolo
rovides outp
nalysis.
Figure 7. An
n a series of
measuring the
& Sosa, 2008
Rosenman an
he quality of
esign system
he seeds of th
ow level of i
roductivity o
haracteristic
mong thems
ogy to genera
puts of the lin
n excerpt of a
studies cond
e creativity o
8; Kan et al.,
nd Gero state
f the product
m “produces
he design to
nformation c
of design thi
s such as ch
selves) in a li
ate linkograp
nkograph (se
a linkograph
Creativity
ducted by Ge
of a design p
2007; Kan &
ed that innov
t or the chara
a complex a
only a very
content” (p.
inking and re
unks (a bloc
inkograph.
61
phs (Pourmo
ee Figure 7)
h showing w
y, Entropy,
ero and asso
process (Ger
& Gero, 200
vation and cr
acteristics of
artifact descr
small degre
438). Golds
easoning can
ck of links am
ohamadi & G
, general sta
where fixation
and Fixatio
ociates, entro
ro, 2001; Ger
05; Rosenma
reativity can
f the process
ription from
ee at the outs
schmidt (20
n be assessed
mong succes
Gero, 2011).
atistics, and p
n is occurrin
on
opy was used
ro, 2010; Ge
an & Gero, 1
n be identifie
s and said tha
information
set” and orig
14) stated th
d by observi
ssive moves
. Linkoder
probability
ng
d as a metho
ero, 2011; G
1993).
ed by observ
at a creative
n which cont
ginates from
hat the
ing certain
that form lin
od of
Gero
ing
tains
“a
nks
62
In the current study, emphasis is laid on the creative design process, and
characteristics of the process are used to identify creativity. The information content that
is incorporated in the design process is the indicator of entropy. Kan and Gero (2009)
suggested using Shanon’s entropy construct as a tool to measure design creativity. They
analyzed the design outcome in terms of creativity as well as the entropy of the design
process and used linkography to identify creativity in the design process. They
concluded that the more creative sessions had higher entropy. Kan et al. (2007) used
linkography and Shanon’s entropy to measure creativity in 12 linkographs. The results of
the study suggested that the overall entropy of design conditions is different in each of
the design processes and that the change of entropy might reflect design outcomes.
Gero (2011) suggested that fixation in a design process can be studied by
calculating and evaluating the dynamic entropy of a design process. A verbal protocol of
a design session can be segmented, and thereafter the segments or moves can be used to
create a linkograph that is used to calculate the dynamic entropy. Gero suggested that
fixation should result in a sharp drop in information content. Goldschmidt (2014)
confirmed Gero’s findings on entropy and fixation and reiterated that when fixation
occurs in the design process it is signified by a sharp drop in information or dynamic
entropy level.
Researchers from different domains have used linkography and entropy
calculations in identifying creativity in the design process. Chou, Chou, and Chen (2013)
used linkography and its entropy calculations to evaluate creativity in animations. They
concluded that the entropy of the linkograph has a high correlation with the evaluation
scores on a questionnaire. Chou (2007) suggested a modified method of entropy

63
calculation which uses a pattern-matching algorithm to identify the existence of repetitive
pattern inside a layer. Lee (2014) used entropy calculations in the linkograph to measure
conditions of creative collaboration in the context of industrial engineering.
In summary, linkography has become an established method to calculate entropy
in the design process to identify characteristics such as fixation. The successful and
continued use of linkography in many domains makes it a robust tool for understanding
the creative design process.

64
Chapter 3. Method
This study employs a mixed method research design using protocol analysis of
qualitative data and quantitative analysis of survey data. The study explores the research
questions mainly by closely examining the responses of a small number of participants
using a protocol analysis methodology. A between-groups experiment was also
conducted to explore any potential difference in the design process between VR and AR
environments. The independent variable (i.e., the interaction environment) had two
levels: AR environment and VR environment. The design of the study also included
learner preference and the dependent variable of technology acceptance (see Figure 8).
Figure 8. Research variables. AR refers to augmented reality and VR refers to virtual reality.
Technology Characteristics
AR/VR
User Characteristics Learning Style
Epistemic Action
Cognitive Load
Perceived Ease of Use
Perceived Usefulness
Fixation
Acceptance
Creative Design Process
H1
H2 H3
H4 H5
H6
H7H8
H9 H1

65
Research Questions and Hypotheses
This research seeks to answer the following questions:
Research Question 1:
How does type of user interface (AR/VR) affect the creative design process?
RQ1.1: How does interface type affect epistemic actions?
RQ1.2: How does interface type affect cognitive load?
RQ1.3: How does interface type affect fixation?
Research Question 2:
How does type of user interface (AR/VR) and learner preference affect the creative
design process?
RQ2.1: How does interface type affect technology acceptance?
RQ2.2: How does learner preference interact with media type to affect technology
acceptance?
Hypotheses for RQ1
H1: The type of user interface used in design problem solving affects a designer’s
use of design action in ways of epistemic actions.
H2: The type of user interface used in design problem solving affects the
cognitive load required by the user interface.
H3: The type of user interface used in design problem solving affects fixation in
the design problem-solving process.
H4: The type of user interface used in design problem solving affects creativity in
the design process.

66
Hypotheses for RQ2.1-2.2
H5: The type of user interface used in design problem solving affects the
perceived ease of use (PEU) of the user interface.
H6: The type of user interface used in design problem solving affects the
perceived usefulness (PU) of the user interface.
H7: The type of user interface used in design problem solving affects the
behavioral intention to use (IU).
H8: The learner preference of the user moderates the PEU of the user interface.
H9: The learner preference of the user moderates the PU of the user interface.
H10: The learner preference of the user moderates the IU of the user interface.
The research procedure includes use of the following assessment tools:
Protocol analysis of the design process: identify fixation, epistemic action, and
cognitive load
Learning style/preference: VARK Learning Styles Inventory (see Appendix A)
Cognitive Load: NASA TLX (Hart & Staveland, 1988; see Appendix B)
Technology Acceptance Questionnaire (see Appendix C)
The design is illustrated in Figure 9.

67
Figure 9. Experimental design.
Participants
Thirty volunteers participated in the study. After approval by the institutional
review board (see Appendix C), the participants were chosen by purposeful sampling
(Gall, Gall, & Borg, 2007); the recruiting letter can be found in Appendix D. After
announcing the research opportunity to design students (juniors and seniors) at a
Midwestern university in the US, students were offered a chance to participate in the
study. They were informed that there would be monetary incentive of $25 for
Participant Recruitment
AR Group
VRGroup
(Pre‐test) Demographic Questionnaire and VARK Learning styles inventory
Design Task Narrative
Pre‐Experiment Testing Environment
Design Task (The Experiment)
(Post‐test)NASA TLX and TAM
Questionnaire

68
participating. Volunteers were provided with copies of the informed consent form (see
Appendix E). The participants were then randomly assigned to one of the two interaction
environments, AR/VR. Even though all 30 participants completed the entire study, only
10 randomly selected protocols were recorded, coded, and analyzed. Only one participant
was male; all other participants were female (The participants were representative of the
population and gender differences were not considered). One participant was in the age
group of 30-35; all other participants were in the age group of 18-25. In the VR group, 7
participants were juniors and 8 were seniors. In the AR group, 9 were juniors and 6 were
seniors (see Table 2).
Table 2
Demographics in the Two Groups
Gender Age Academic
M F 18-25 30-35 Senior Junior
AR 0 15 15 0 6 9
VR 1 14 14 1 8 7
Experiment: Design Problem Solving Tasks
The design project was intentionally selected to be simple and not strenuous for
the participants. The design problem was formulated by considering three main factors.
The first was to provide a simple problem which would encourage the participants to
focus on object manipulation, spatial and logical iterations, context, and user-behavior
issues, while also keeping in mind visual appeal, composition, environmental
considerations, and ergonomic factors. The intention was to keep the design problem as a

69
close simulation to a studio design problem but at a decreased level of difficulty. This
was done out of caution not to make the design problem akin to a formal logic test such
as puzzle solving or missing object identification. Design schools administer these kinds
of tests in admissions testing, but they may not reflect the reality of university-based
design education. Using a simple design problem also made the design sessions shorter
in order to allow comprehensive analysis using protocol analysis. When using protocol
analysis, appropriate design problems must be developed in order to make the protocol
more manageable (Cross, Dorst, & Christians, 1996; Jiang & Yen, 2009).
The second consideration was to formulate a design project that would allow clear
identification of epistemic actions. The selected design problem was to arrange furniture
within an office space. The interfaces of AR and VR provided the ability to move and
rotate these furniture pieces, and the movement of these pieces of furniture would allow
clear coding for epistemic actions.
Thirdly, previous studies that have explored traits such as epistemic actions were
used as case studies in developing the design problem. Kim and Maher (2008) used
similar design problems in their study to observe epistemic actions in TUIs and GUIs.
Similar to the current study, they operationalized TUI using an AR interface and focused
on creativity in the design process. Fjeld and Barendregt (2009) used a CAD program,
BUILD-IT (which is considered a TUI), and physical model-making exercises to identify
epistemic action. They employed a series of spatial planning tasks that required
participants to move and manipulate objects. These manipulations allowed clear
identification of epistemic actions. When describing graspable user interfaces,
Fitzmaurice (1996) described a physical handle attached to virtual objects and provided

an
in
ac
an
to
sp
d
it
co
D
in
pr
re
d
F
n application
n arranging f
ction and ho
nd Cho (201
o explore epi
In this
pace (Figure
oors. The p
terations, con
omposition,
Design Narra
Once
nformation s
rovided with
esearcher na
esign and th
Figure 10. T
n by using v
furniture wit
ow epistemic
14) used a de
istemic actio
s study, the t
e 11). The fl
articipants w
ntext, and us
environmen
ative
the participa
survey (see A
h the design
rrated. The
he expectatio
ask narrative
irtual furnitu
thin a layout
c action play
esign problem
ons and how
task was to a
loor plan wa
were asked to
ser-behavior
ntal consider
ants were bri
Appendix F)
narrative in
narration pr
ons for the de
e presentatio
70
ure objects a
t. In his thes
ys a crucial ro
m in which c
w they affect p
arrange furni
as rectangula
o consider ob
r issues while
ration, and er
iefed and ha
as well as th
a PowerPoin
rovided parti
esign problem
on slide.
attached to a
sis, Fitzmaur
ole in graspa
children mov
problem sol
iture within
ar and had op
bject manipu
e also keepin
rgonomic fa
ad completed
he VARK qu
nt slide show
icipants with
m.
physical han
rice discusse
able user inte
ved furniture
lving skills in
a small (15’
penings for w
ulation, spat
ng in mind v
actors.
d the demogr
uestionnaire
w (see Figur
h information
ndle that hel
ed epistemic
erfaces. Kim
e pieces in o
n children.
’ X 10’) offic
windows and
tial and logic
visual appeal
raphic
e, they were
re 10), while
n about the
lped
m
order
ce
d
cal
l,
e the

co
pr
or
th
fu
sp
d
sp
Howe
olor, orienta
rovided with
rder to main
he rugs were
urniture were
pecifically se
ecisions on t
pace, and ma
Figure 11.
ever, they we
ation, aesthet
h five types o
ntain conform
e selected fro
e downloade
elected so th
the functiona
aterial.
Floor plan
ere told to ta
tics and circu
of furniture
mity among t
om the Herm
ed from Goo
hat the partic
al and aesthe
of the office
71
ake fenestrati
ulation into c
(see Figure
the design so
man Miller of
ogle 3D ware
cipants woul
etic appropri
e space.
ions, space p
consideratio
12) with two
olutions. Al
ffice furnitur
ehouse. The
ld have to ma
iateness of a
planning the
on. The parti
o choices in
ll pieces of f
re collection
e furniture pi
ake consciou
aspects such
eories, daylig
icipants wer
each catego
furniture exc
n. Models of
ieces were
us design
as size, colo
ght,
re
ry in
cept
f the
or,

F
E
ex
A
fi
Figure 12. Of
Experimenta
The so
xperimental
AR scenes, it
iducial mark
ffice furnitur
al Setting
oftware Buil
environmen
can be used
kers in order
re.
ldAR (New
nt. Although
d to create bo
to overlay th
72
Zealand, Hit
h the primary
oth 3D AR a
he virtual ob
tlabs) was u
y use of Buil
and VR desk
bjects in phy
used in devel
ldAR is in c
ktop scenes.
ysical space.
loping the
reating Desk
BuildAR us
The screen
ktop
ses

73
transparency was set to 0 to simulate the VR environment and 100 to simulate the AR
environment.
Figure 13. Workflow for augmented and virtual reality model generation.
Object manipulation. In the AR environment, object manipulation was
accomplished by moving and rotating the fiducial markers upon which the virtual objects
were overlaid. In the VR environment, the participants were able to move, rotate, and
scale the objects using a regular PC mouse. However, participants were specifically
asked to only move the objects in the X and Y axis/planes and to only rotate around the Z
axis. They were also instructed not to scale the objects since all objects were already
proportionally scaled.
Training exercise. Participants were provided with a training environment for
both VR and AR interfaces, and training was provided for the assigned interface. In the
VR environment, they were trained to move and rotate a simple cube using a standard PC
3D models of downloaded furniture
3D models of the floor plan is extruded in sketchup
3D models converted to .3ds file format
Fiducial markers generated through BuildAR
3D models imported to BuildAR
3D models assigned to fiducial markers

m
en
w
m
A
F
F
u
d
3D
mouse as the
nvironment,
which the cub
minutes, or un
A training ma
Figure 14. M
Figure 15. M
Augm
sed for each
ownloaded f
D models w
controller w
they rotated
be was place
ntil the parti
anual was pr
Moving, rotat
Moving and r
mented reali
h piece of fur
from the Her
were opened i
within the Bu
d and moved
ed (see Figur
icipants conf
rovided for b
ting and scal
rotating in B
ity environm
rniture. 3D m
rman Miller
in SketchUp
74
uildAR progr
d the same cu
re 15). The t
firmed that t
both environ
ling in Build
uild AR for
ment. In this
models of th
furniture co
p and exporte
ram (see Fig
ube by movi
testing sessi
they were co
nments and is
d AR for the
the augmen
s setup, mul
he furniture w
ollection on G
ed as .3ds fil
gure 14). In
ing the fiduc
ion lasted ap
omfortable w
s included in
virtual envi
nted reality e
ltiple fiducia
were selecte
Google 3D W
les which ca
the AR
cial marker u
pproximately
with the contr
n Appendix G
ironment.
nvironment
al markers w
d and
Warehouse.
an be opened
upon
y 5
rols.
G.
were
The
d

u
m
w
fo
ru
m
se
1
le
Fon
m
id
fi
N
sing BuildA
markers were
were generate
or the AR en
unning the W
monitor, mou
et to 100. Pr
6). The mark
eft hand corn
Figure 16. Fin the back o
The m
marker on the
dentification
iducial mark
Natural light
AR. Each mo
e used in the
ed through th
nvironment i
Windows 7 o
use, and exte
rinted fiduci
ker for the fl
ner so not as
ducial markof the marker
marker block
e top and an
n as shown in
kers to locate
was minimiz
odel was assi
AR scene (1
he built-in m
included a D
operating sys
ernal webcam
ial markers w
loor plan wa
to affect oth
ers used in tr; and c is th
k was a 1” X
image of the
n Figure 17.
e the furnitur
zed by using
75
igned a fidu
10 for furnitu
marker gener
Dell OptiPlex
stem and con
m. In the AR
were used fo
as located an
her markers,
the AR envirhe AR model
1” X 0.4” S
e furniture p
The particip
re pieces in t
g blinds on th
ucial marker.
ure and one
rator of Build
x 9010 deskt
nnected to a
R interface, t
or tracking th
nd attached to
, or change p
ronment: a isl overlaid on
Styrofoam bl
piece on the b
pant merely
the space dem
he windows
A total of 1
for the plan
dAR. The e
top PC with
standard 22
the screen tr
he 3D object
o the base sh
position.
s the markern the marker
lock overlaid
bottom for e
moved and
marcated on
, and artifici
11 fiducial
n). The mark
equipment us
16GB RAM
” HD LED
ransparency
ts (see Figur
heet at the to
r; b is the im.
d with a fidu
easy
rotated the
n a blank she
ial lights wer
kers
sed
M,
was
e
op
mage
ucial
eet.
re

u
is
F
F
F
sed so that th
s illustrated i
igure 19.
Figure 17. A
Figure 18. T
here were no
in Figure 18
AR furniture
he augmente
o issues with
. A screensh
models.
ed reality wo
76
h marker rec
hot of the au
orking envir
cognition. Th
ugmented en
ronment.
he AR work
nvironment is
king environm
s shown in
ment
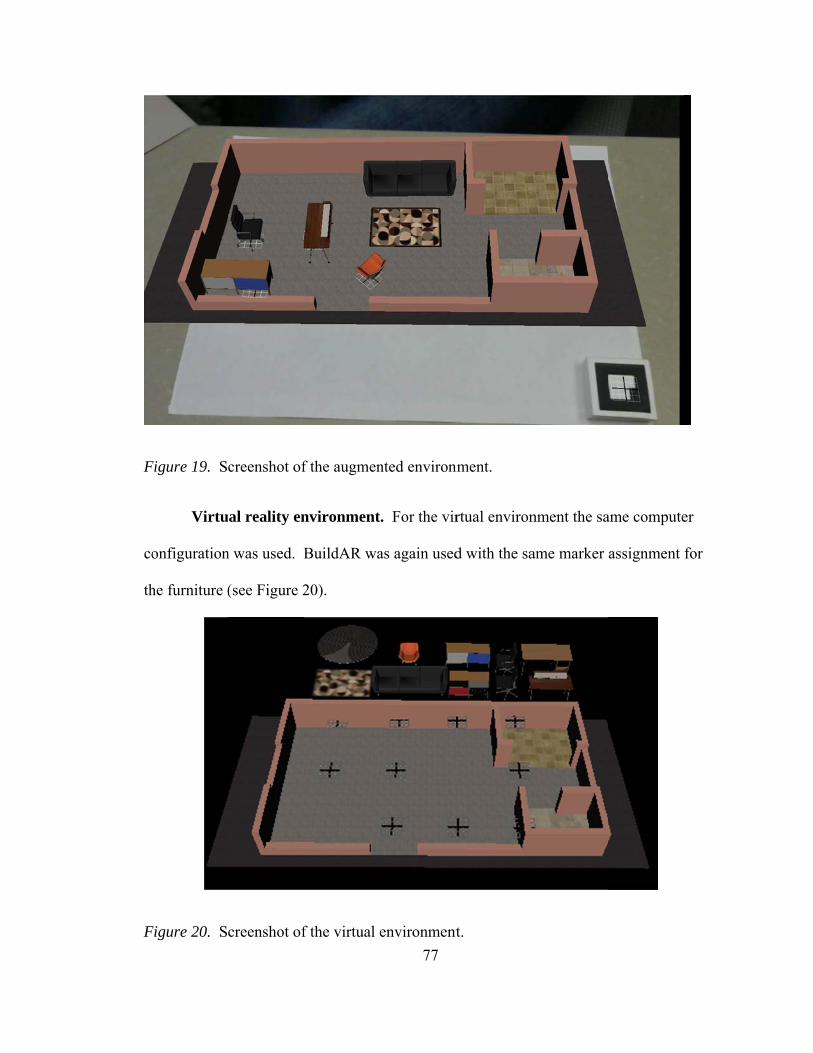
F
co
th
F
Figure 19. S
Virtu
onfiguration
he furniture (
Figure 20. S
creenshot of
al reality en
n was used. B
(see Figure 2
creenshot of
f the augmen
nvironment
BuildAR wa
20).
f the virtual e
77
nted environ
. For the vir
as again used
environment
nment.
rtual environ
d with the sa
t.
nment the sa
ame marker
ame compute
assignment
er
for
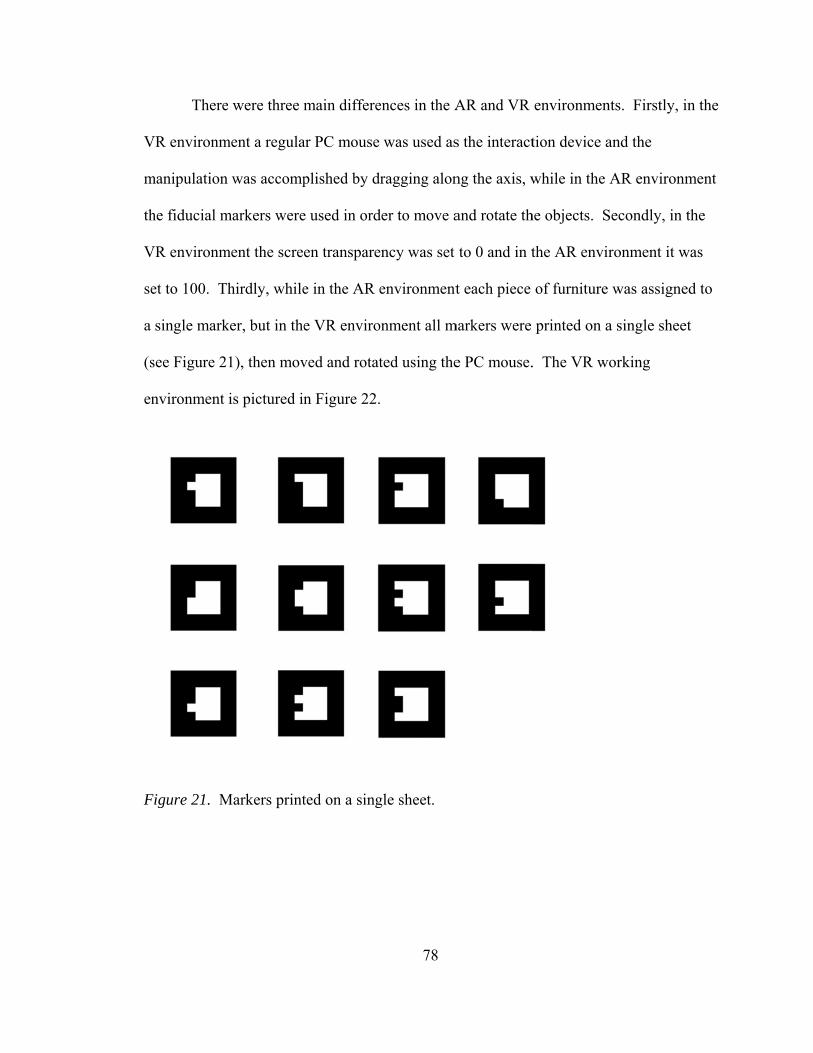
V
m
th
V
se
a
(s
en
F
There
VR environm
manipulation
he fiducial m
VR environm
et to 100. Th
single mark
see Figure 2
nvironment
Figure 21. M
were three m
ment a regula
was accomp
markers were
ment the scree
hirdly, while
ker, but in the
1), then mov
is pictured in
Markers print
main differe
ar PC mouse
plished by dr
e used in ord
en transpare
e in the AR e
e VR enviro
ved and rotat
n Figure 22.
ted on a sing
78
ences in the A
was used as
ragging alon
der to move a
ency was set
environment
onment all m
ted using the
gle sheet.
AR and VR
s the interact
ng the axis, w
and rotate th
to 0 and in t
t each piece
markers were
e PC mouse.
environmen
tion device a
while in the
he objects. S
the AR envir
of furniture
printed on a
. The VR w
nts. Firstly, i
and the
AR environ
Secondly, in
ronment it w
was assigne
a single shee
working
in the
ment
the
was
ed to
et

F
P
V
ex
pr
w
d
pr
p
b
nu
L
st
Figure 22. T
Procedure fo
All th
Visual quality
xperiment, p
rovided with
The p
were briefed
igital video
roblem (as s
articipant’s c
e used for pr
umber of pa
Lindekens, H
tudies, with
he virtual re
or the Protoc
e steps show
y in both VR
participants w
h test environ
articipants w
on the requir
cameras reco
shown in Fig
completion t
rotocol analy
articipants m
Heylighen, &
their empha
eality workin
col Analysis
wn in Figure
R and AR int
were instruct
nments for b
were introduc
rements. Th
orded the pa
gure 23). Th
time was rec
ysis. Their d
must be kept s
& Neuckerma
sis on large,
79
ng environm
13 were com
terfaces was
ted on how t
both media ty
ced to the de
he participan
articipant as
he think-alou
corded. Ten
demographic
small (Chand
ans, 2003) be
representati
ment.
mpleted prio
similar. Pri
to use the tw
ypes.
esign project
nts were instr
he or she wa
ud protocol w
n participants
c informatio
drasekera, V
ecause “in co
ive samples,
or to starting
ior to startin
wo types of m
t by the inve
ructed to thi
as solving th
was audio re
s were rando
n is shown i
Vo, & D’Sou
omparison to
, qualitative
the experim
ng the
media and w
estigator and
ink aloud. T
he design
ecorded. The
omly selected
in Table 3. T
uza, 2013;
o quantitativ
research foc
ment.
were
d
Two
e
d to
The
ve
cuses

on
(B
F
T
D
A
V
pr
un
se
G
n smaller gr
Borrego, Do
Figure 23. E
Table 3
Demographic
Gen
M
AR 0
VR 0
Codin
rotocol is div
nits are com
egment as on
Goldschmidt
oups (sampl
uglas, & Am
Equipment se
cs of the Par
nder
F
5
5
ng of the pro
vided into sm
mmonly used
ne coherent
(1995) as a
les) in order
melink, 2009
etup.
rticipants Wh
Age
18-25
5
5
otocol: Mov
maller units
: segments a
statement ab
step, an act,
80
to examine
9, p. 57).
ho Were Ran
30-35
0
0
ves and link
in order to b
and moves.
bout a single
and an oper
a particular
ndomly Selec
Academic
Senior J
2 3
4 1
ks. In protoc
be analyzed.
Suwa and T
e item/space/
ration which
context in g
cted for Pro
Junior
3
1
col analysis t
Two main
Tversky (199
/topic. Mov
h transforms
great detail”
tocol Analys
the recorded
types of suc
7) defined a
ves are define
the design
sis
d
ch
a
ed by

81
situation relative to the state it was in prior to that move. In this study, the units adopted
were similar to moves as defined by Goldschmidt (see Table 4).
Table 4
Excerpt of Coding Showing Consecutive Moves in One of the Protocols
Code Comment
9 I like that rug because it’s more colorful...
10 and now I’m going to choose a desk...
11
and I’m choosing this desk because it has more storage space
I’m going to place it on the rug
12 maybe...can I do that, oh I can’t place it on the rug can I?
Linkography has many advantages in design analysis. Because the method does
not rely on the number of designers and because the length of the linkograph can be in
accordance with any set duration, linkographs are said to be scalable in two dimensions.
Furthermore, because the design moves and how these moves are linked can be coded
separately, linkographs are said to be flexible. However, one of the main limitations of
protocol analysis as well as linkography is its lack of objectivity (Kan & Gero, 2005). In
protocol studies researchers use two or more coders to improve objectivity of the coding
(McNeill, Gero, & Warren, 1998). Following this example, two independent coders were
used in this study. Once the design moves were established, the two independent coders
reviewed the moves and assigned links among them.
Kan and Gero (2009) specifically stated that linkography has been criticized for
its lack of objectivity in the construction of links. Kan and Gero (2008, p. 319) stated
that there are “different levels of subjectivity: determining the moves (segmentation),

82
judging the links among moves (coding), and interpreting the meaning of the resulting
linkograph (analysis).” Previous studies have used different methods to assess links
between moves. Kan and Gero (2005) stated that links between the moves are
established by using common sense. Kan et al. (2007) used a two-step process in
identifying links in a protocol. In the first step they used a word search tool to search for
occurrence of similar terms, and then in the second process they manually analyzed to see
if the words were use in the appropriate context. In another study Kan and Gero (2009)
used WordNet, a tool that uses the concept of cognitive synonym (synset) to group words
into sets, in order to establish links between moves.
In the interest of enhancing objectivity in the linking process, the current study
employed a two-step process. In the first step the transcript of the verbal protocol was
analyzed and two coders independently established links among the moves. A word
search function was not used in part because the majority of the protocols were short. In
addition, the researchers assumed that a word search function would hinder the integrity
of the links because of similar words that belonged in different contexts. For example,
having two types of chairs (a visitor chair and an office chair) in the transcript might have
confused a word search system.
In the second step, the coders went through the video clips of the protocols to
confirm that the links were contextually appropriate, as well as to check whether
nonverbal cues or movements would suggests additional links. Then the two coders
compared the links that they had established independently and after discussion came to
an agreement on link placement. Cohen’s Kappa was not calculated because there were

83
no disagreements. Even though the two-step linking process consumed more time, the
end result was assumed to be more objective and rigorous.
Coding of the protocol: Epistemic action. Epistemic actions were coded using
protocol methods adopted from Antle (2013) and Antle and Wang (2013), who used the
codes/terms direct placement (DP), indirect placement (IP), and exploratory (EXP) to
describe different actions performed. DP actions were similar to goal-oriented pragmatic
action where users already knew where to place an object before picking it up, while in
IP actions the user was not initially certain of exact placement and used movements and
rotations to identify correct placements. EXP actions were identified as those in which
pieces did not end in the correct destination. IP and EXP actions were similar in
characteristic to trial-and-error type actions or epistemic actions. The same action
categorization was adopted by Esteves et al. (2015), who elaborated on the Antle and
Wang’s action categorization by expanding it according to different types of epistemic
actions. However, this falls beyond the scope of the current study in which the intention
is limited to identifying epistemic action.
The two independent coders who identified the links between moves coded the
recorded protocols to identify epistemic actions. This phase of coding was conducted
after the initial protocol was divided into moves and after links were established among
moves. Three codes for epistemic action identification were introduced: N-action, which
denoted new moves, Rm-action, which denoted Revisit Move moves, and Rr-action,
which denoted Revisit Rotate moves. Rm-actions were, distinct moves where the
participant changed the position of the furniture, by moving the marker, and Rr-actions
were moves where the participant changed the angle of the furniture, by rotating the

84
marker. The Rm and Rr codes were similar in characteristic to Antle and Wang’s IP and
EXP actions. The N-actions were not considered as epistemic actions as they were the
initiating move. In this study the adopted unit of analysis was the number of these moves
rather than number of participants. An example of the subsequent occurrence of the two
codes Rr and Rm in one of the protocols are presented below.
Move Number
Code
14 turning it to see which way I want it... Rr 15 and put it in the middle of the room... Rm
Table 5
Coding for Epistemic Action
Code Action
N New action
Rm Revisit move action Rr Revisit rotate action
In order to test the validity of the coding scheme, the Cohen’s kappa value
(Cohen, 1960) was calculated for the protocols using Cohen’s kappa formula:
K = (Po-Pc)/(1-Pc)
where Po is the proportion of observed agreement and Pc is the proportion of agreement
predicted by chance. Some researchers define poor reliability as a kappa of less than 0.4,
fair reliability as 0.4 to 0.6, good reliability as 0.6 to 0.8, and excellent reliability as
greater than 0.8 (Trickett & Trafton, 2007). In this study, inter-rater reliability was
calculated at 0.67. After negotiations between the coders it increased to 0.89.

85
Using the analyzed links, linkographs were constructed for the 10 participants
using LINKODER software. LINKODER is a tool to analyze coded moves and their
linkographs of design protocols (Gero, Kan, & Pourmohamadi, 2011; Pourmohamadi &
Gero, 2011).
In summary, the method of analyzing the design process of the participants was
protocol analysis using linkography. Think-aloud protocol analysis is a common method
used in analyzing the design process, and the linkography technique used in this study
allowed the identification of fixation in the design process.
Instruments
Apart from the protocol recording, additional data were obtained from the following
questionnaires:
Demographic information questionnaire (Appendix G)
VARK Learning styles inventory (Appendix A)
NASA TLX Cognitive Load Tool (Hart & Staveland, 1988; Appendix B)
Technology Acceptance Model Questionnaire (Appendix C)
Demographic Information
Basic demographic questions were provided by a paper-based questionnaire.
Questions on technology familiarity were also included in this questionnaire, which was
completed before the participants completed the design task. The complete instrument is
provided in Appendix F.
86
VARK Learning Styles Inventory
Copyright for Version 7.3 (2001) of the VARK learning styles inventory is held
by Neil D. Fleming, Christchurch, New Zealand, and permission for using the tool was
obtained from Mr. Fleming. For educational purposes the use of this tool is free;
however, under the copyright restrictions only a paper-based version was allowed. The
instrument that was used in the study was an unaltered version of the original VARK
paper-based questionnaire and consisted of 16 individual items with multiple choice
questions. The participants were instructed to mark one or multiple answers as they saw
necessary.
The VARK Learning Styles Inventory assesses the learner preference of students
through the four sensory modalities of visual, aural, read/write, and kinesthetic. Fleming
adapted the existing VAK learning style model into the VARK learning styles inventory.
This questionnaire was completed before the participants completed the design task.
NASA TLX Cognitive Load Tool
NASA TLX is a free tool available via download for non-commercial use. There
is a paper-based version as well as a digital version. The NASA TLX paper version was
used for this study. Because explicit instructions on copyright are not provided through
the tool’s website, a user agreement was obtained through NASA in order to use the tool.
The NASA TLX was administered after the design task was completed.
NASA TLX is a two-part evaluation procedure consisting of both weights and
ratings. By combining both a composite score is obtained. In the first part of the
evaluation the participants were provided with 15 possible pairs of combination of the six
sub scales: mental demands, physical demands, temporal demands, own performance,

87
effort, and frustration. The participants were instructed to circle one of the subscales in
each pair that contributed to the workload of the design task. The number of times each
subscale was circled was tallied (the scores ranged from 0 to 5). The numbers were
considered as the weight of each subscale and were entered in the Sources of Workload
Tally Sheet from the NASA Task Load Index tool (Appendix H). This was considered
the weight score for the subscale.
In the second part of the evaluation, the participants were provided a sheet with
the subscales and rating scales. Participants circled the scale based on the magnitude of
the effect of the particular subscale on the design task. This was considered the raw score
for the subscale. Using the Weighted Rating Worksheet (from the NASA Taskload Index
tool; Appendix H), the raw score was multiplied by the weight score for each subscale to
obtain an adjusted rating for each subscale. The sum of the adjusted ratings of each
subscale was then divided by 15 to give an absolute workload or the cognitive load of the
design task in the respective interface (AR and VR). Some researchers have stated that
the weighting procedure can be eliminated and have only used the raw test score to obtain
the workload for a specific task in order to simplify the process (Hoonakker et al., 2011).
However, even though this is a rigorous process and takes time to administer as well as to
calculate, for this study both parts of the procedure were necessary in order to obtain the
cognitive load imposed on the design task by the interface.
Technology Acceptance Model Questionnaire
The 16-item TAM questionnaire was based on previous TAM questionnaires
(Davis, 1989; Venkatesh, 2000) and was a modified version of previously used TAM

88
questionnaire (Chandrasekera & Yoon, 2015). The paper-based questionnaire was
administered after the design task was completed.

89
Chapter 4. Part 1- Design Process
Objectives and Hypotheses
The objective of this section is to analyze the effect of interface type on epistemic
action and cognitive load, which affects fixation in the design process. The study
investigates the following research questions and hypotheses using linkography within a
protocol analysis.
Type of user interface (AR/VR) and its effect on the creative design process
RQ1.1: How does interface type affect epistemic actions?
RQ1.2: How does interface type affect cognitive load?
RQ1.3: How does interface type affect fixation?
H1: The type of user interface used in design problem solving affects a designer’s
use of design action in ways of epistemic actions.
H2: The type of user interface used in design problem solving affects the
cognitive load required by the user interface.
H3: The type of user interface used in design problem solving affects fixation in
design problem solving process.
H4: The type of user interface used in design problem solving affects creativity in
the design process.
Linkography
The following analysis is based on the data collected in the protocol analysis
section of the study. The focus was on finding patterns of designers’ behaviors and

90
cognitive actions by interpreting information shifts, specifically looking for significant
differences between the data collected from the AR sessions and the data collected in the
VR sessions. The LINKODER tool was used to create and analyze the linkographs.
Kan, Bilda, and Gero (2006) stated that
If an idea is weak, it will not have many forelinks and this is represented by a low entropy. However, if an idea has too many forelinks, this might indicate fixation; this is also indicated by a low entropy. Backlink entropy measures the opportunities according to enhancements or responses. If an idea is very novel, it will not have backlinks, the resulting entropy is low. On the other end if an idea is backlinked to all previous ideas, it is not novel hence is represented by a low entropy. Horizonlink entropy measures the occurrence of incubated segments and low horizonlink entropy indicates complete cohesiveness. Horizonlink entropy measures the opportunities relating to cohesiveness and incubation. (10)
They also stated that intensive linking in design moves may yield good designs. Fixation
should not occur early in the design process. Kan and Gero (2007) suggested that
forelink entropy measures the idea generation opportunities in terms of new creations or
initiations.
The following design protocols were coded and analyzed using the design
protocol explained in Chapter 3.
Analysis and Discussion
Augmented Reality Participant 1. Linkographs and descriptive statistics from
the first participant are shown in Figure 24 and Table 6.

F
T
D
TT
LFBH
en
n
co
en
re
en
su
Figure 24. L
Table 6
Descriptive S
VariaTotal Moves Total Links
Link Ratio orelink Entr
Backlink EntrHorizonlink E
The o
ntropies and
either very h
ohesiveness
ntropies are
emain above
ntropy is ass
uggested ent
Linkograph fo
Statistics for
able
ropy ropy Entropy
verall forelin
d does not ind
high nor low
in the linkog
high when t
e the mean en
sociated with
tropy as a m
or the design
Augmented
Sta4
1
2.19 p161410
nk entropy (
dicate strong
w. The overa
graph. The
the design pr
ntropy level
h productivit
easure to an
91
n protocol of
Reality Part
atistic 47
103
per move 6.433 4.183 0.340
(Figure 26) i
g fixation. O
all low horizo
entropy grap
rocess started
for the most
ty in the desi
alyze the po
f augmented
ticipant 1
is higher than
Overall back
onlink entro
phs indicate
d, and the fo
t part of the
ign process.
otential of de
d reality parti
n backlink a
klink entropy
opy (Figure 2
that the hori
orelink entro
design proc
Kan and G
esign session
icipant 1.
and horizon
y (Figure 27)
25) suggests
izon and for
opy continue
cess. High
Gero (2005)
ns. Qualitati
) is
relink
es to
ively,

92
there are two dramatic drops in the forelink entropy graph shown in Figure 25. The first
drop occurs around moves 28 to 34 when the participant was trying different options
without any particular reasoning.
29 and add a visual appeal to it
30 Now I’m moving everything back
31 so that it is up against the wall
32 and not directly in the middle of the room
The second drop occurs at the end of the session. The linkograph protocol shows
that the participant is reviewing the design decisions without adding new information.
This is typical in most design sessions encountered during the study. The latter potion of
the design protocol tends to have low entropy and is shown as a drop in the entropy
graphs. Sharp increases in entropy are seen in the early design phase when there is a lot
of activity generating new ideas. This was observed in most of the protocols analyzed
and was expected because in the early design phase entropy is thought to be high because
the designer is using new information and ideas. The sharpest increase in entropy occurs
around moves 15 to 19. This is when the participant is compiling ideas that center on the
placement of the desk and how that connects to the pieces of furniture as well as the
layout.

F
F
F
Figure 25. Ho
Figure 26. F
Figure 27. B
orizonlinks e
orelinks entr
Backlinks ent
entropy for a
ropy for aug
tropy for aug
93
augmented r
gmented real
gmented real
reality partic
lity participa
lity participa
cipant 1.
ant 1.
ant 1.

A
F
T
D
T
T
L
F
B
H
ov
Augm
AR participan
Figure 28. L
Table 7
Descriptive S
Varia
Total Moves
Total Links
Link Ratio
orelink Entr
Backlink Entr
Horizonlink E
In this
verall backli
mented reali
nt 2 are show
Linkograph fo
Statistics for
able
ropy
ropy
Entropy
s protocol, th
ink (Figure 3
ity participa
wn in Figure
or the design
Augmented
4.0
he overall fo
31) and horiz
94
ant 2. The l
e 28 and Tab
n protocol of
Reality Part
Statistic
47
191
6 per move
17.301
25.085
25.756
orelink entrop
zon entropie
inkograph an
ble 7.
f augmented
ticipant 2
py (Figure 3
es (Figure 29
and descriptiv
d reality parti
30) appears t
9), which ind
ve statistics
icipant 2.
to be lower t
dicates fixati
for
than
ion

95
in the design process. Furthermore, the linkograph diagram has areas that can be
identified as saturated links (marked as “A”). Saturation is an indicator of fixation.
However, the total backlink entropy is lower than horizonlink entropy. Because
horizonlink entropy measures the opportunities for cohesiveness and incubation, this
suggests that there were opportunities for idea incubation. The forelink entropy
continues to be above the mean until move 24. Then there is a rapid reduction of
entropy.
23 as people walk in they will have a place to sit
24 as it would face the person they need to see most
25 And I believe that having this
26 Trying to figure out if this one would go better on the side
27 where it is able to be reached or if he wants an open plan
28 I feel like putting it with …
29 putting it right up to the desk will be a little bit better
30 as it will give more of a collaborative appeal to it
The contents of the design moves do not effectively relate to other concepts in the
design directly and therefore do not appear to have many forelinks with the other moves.
The entropy level increases until the design process nears the end, at which point it
decreases. This was seen in other protocols as well. The only difference is that the
horizonlink entropy level is higher between moves 17 and 24. These moves suggest that
opportunities were present for the incubation of ideas.

F
F
F
Figure 29. H
Figure 30. F
Figure 31. B
Horizonlinks
orelinks entr
Backlinks ent
entropy for
ropy for aug
tropy for aug
96
augmented r
gmented real
gmented real
reality partic
lity participa
lity participa
cipant 2.
ant 2.
ant 2.

A
F
T
D
TTLFBH
h
en
n
h
h
Augm
AR participan
Figure 32: Li
Table 8
Descriptive S
VariaTotal Moves Total Links Link Ratio
orelink EntrBacklink EntrHorizonlink E
The o
orizonlink (F
ntropy is nei
ot enough op
orizonlink a
owever, the
mented reali
nt 3 are show
inkograph fo
Statistics for
able
ropy ropy Entropy
verall forelin
Figure 33) e
ither very hi
pportunities
nd forelink e
forelink entr
ity participa
wn in Figure
or the design
Augmented
Stati42
112.76 per
20.417.29.9
nk entropy (
ntropies and
gh nor low.
for the incu
entropies are
ropy sudden
97
ant 3. The l
e 32 and Tab
n protocol of
Reality Part
istic 2 6 r move 467 233 35
(Figure 34) i
d does not in
The overall
ubation of ide
e high at the
nly drops as t
inkograph an
ble 8.
f augmented
ticipant 3
is higher tha
ndicate strong
l horizonlink
eas. The ent
beginning o
the design is
and descriptiv
reality parti
an backlink (
g fixation. T
k entropy is l
tropy graphs
of the design
s initiated. T
ve statistics
icipant 3.
(Figure 35) a
Total backlin
low and sug
s indicate tha
n process;
This drop is
for
and
nk
ggests
at the

98
because of the rapid changes from one idea to another without any cohesive explanation.
More than 50% of the moves remain above or close to the mean forelink entropy, which
suggests that the protocol was rich in information and few opportunities for fixation were
present. The first major drop occurs around moves 24 to 28 when the participant was
asking the researchers questions about the design. However, these questions did not
pertain to the design solution.
24 I have a question. Because there is only one side chair is that like his only option?
25 Is that like his only option?
26 He only gets one chair?
27 Hah well then I take that back and pick the sofa
28 for more options of chairs…there we go
Furthermore, from move 14 through 21 a series of sawtooth track patterns is seen
(marked as “A”). Sawtooth patterns are defined as a sequence of moves linking each to
the preceding move (Goldschmidt, 2014, p. 65). Kan and Gero (2008) stated that this type
of pattern is an indication that the process is moving forward but not developing. The
second drop occurs at the end of the session and the linkograph protocol shows that like
previous instances, the participant is reviewing the design decisions without adding new
information.

F
F
F
Figure 33. H
Figure 34. F
Figure 35. B
Horizonlinks
orelinks entr
Backlinks ent
entropy for
ropy for aug
tropy for par
99
augmented r
gmented real
rticipant 3.
reality partic
lity participa
cipant 3.
ant 3.

au
F
T
D
T
T
L
F
B
H
(F
w
Augm
ugmented re
Figure 36. L
Table 9
Descriptive S
Varia
Total Moves
Total Links
Link Ratio
orelink Entr
Backlink Entr
Horizonlink E
At firs
Figure 39) is
which sugges
mented reali
eality particip
Linkograph fo
Statistics for
able
ropy
ropy
Entropy
st glance, wh
s higher than
sts few oppo
ity participa
pant 4 are sh
or the design
Augmented
Stat
4
7
1.7 per
13.
15.
10.
hat is unique
n the forelink
rtunities for
100
ant 4. The l
hown in Figu
n protocol of
Reality Part
tistic
46
78
r move
715
854
581
e in this link
k (Figure 38)
novel ideas
inkograph an
ure 36 and T
f augmented
ticipant 4
kograph is tha
) and horizo
. However,
and descriptiv
Table 9.
d reality parti
at the backli
onlink entrop
the differen
ve statistics
icipant 4.
ink entropy
pies (Figure 3
nce between t
for
37),
the

101
backlink and forelink entropies is just two levels. This is also suggestive of fixation
occurring during the design process. However, the occurrence of fixation needs to be
analyzed within the design protocol to understand how and why it occurred. The
linkograph illustrates that only one-third of the entire protocol was in the range of the
mean entropy level.
The design process does not start with a high entropy level. This is probably
because the participant is trying to figure out how to correctly use the software, even
though she had the chance to test it prior to beginning the design problem.
2 ...trying to figure it out......
3 the couch keeps popping up by the way....oh...
4 which way am I going oh it’s the opposite...
5 oh yeah...
6 I’m trying to figure out where the blinds are...I meant the walls...of the building...
7 ok...I’m sorry I’m trying....ok.
Despite the low overall forelink entropy, high entropy surges can be observed on
the graph. One of the major increases in entropy occurs between moves 12 to 16, when
the participant is connecting these moves with other ideas during the design process.
Moves 24 to 30 also provide high forelink entropy.
24 and it’s away from the door
25 and I chose the couch so that more people can sit there now...
26 I want the desk chair...
27 Put behind the desk...

A
F
F
28 and
29 the
30 now
31 thi
After that the
Figure 37. H
Figure 38. F
d figure it ou
ere we go...
w for some s
s one has mo
forelink ent
Horizonlinks
orelinks entr
ut where it g
storage
ore shelving
tropy remain
entropy for
ropy for aug
102
goes...ok...
g....
ns below the
augmented r
gmented real
e mean entro
reality partic
lity participa
py level for
cipant 4.
ant 4.
the most parrt.

F
A
F
Figure 39. B
Augm
AR participan
Figure 40. L
Backlinks ent
mented reali
nt 5 are show
Linkograph fo
tropy for aug
ity participa
wn in Figure
or the design
103
gmented real
ant 5. The l
e 40 and Tab
n protocol of
lity participa
inkograph an
ble 10.
f augmented
ant 4.
and descriptiv
d reality parti
ve statistics
icipant 05.
for

104
Table 10
Descriptive Statistics for Augmented Reality Participant 5
Variable Statistic
Total Moves 23
Total Links 40
Link Ratio 1.74 per move
Forelink entropy 11.227
Backlink entropy 10.316
Horizonlink entropy 9.153
The entire design process for participant 5 was fairly short; she had the least
number of moves of all other participants. (This protocol, like the others, was randomly
selected for linkographing.) While the entropy levels are on the low side, the forelink
entropy (Figure 42) is high. This pattern suggests that even though fixation occurred
there are no prominent fixation episodes. The horizonlink entropy (Figure 41) is lower
than the forelink and backlink entropy (Figure 43) levels, which suggests few
opportunities for incubation of ideas. Except for two brief periods, one at initial stages
and one at the later stages, the forelink entropy tends to revolve around the mean.
A drop in entropy occurs during moves 13 through 16. Examination of the
protocol suggests that these drops occurred because of issues not necessarily pertaining to
the design process. Despite the low number of moves and the length of the protocol,
significant fixation appears to have occurred only in this area, symbolized by the
substantial drop in entropy.

F
F
F
Figure 41. H
Figure 42. F
Figure 43. B
Horizonlinks
orelinks entr
Backlinks ent
entropy for
ropy for aug
tropy for aug
105
augmented r
gmented real
gmented real
reality partic
lity participa
lity participa
cipant 5.
ant 5.
ant 5.

p
F
T
D
T
T
L
F
B
H
(F
w
w
th
Virtu
articipant 1
Figure 44. L
Table 11
Descriptive S
Varia
Total Moves
Total Links
Link Ratio
orelink Entr
Backlink Entr
Horizonlink E
At firs
Figure 47) is
which sugges
whole. This i
he occurrenc
al reality pa
are shown in
Linkograph fo
Statistics for
ble
ropy
ropy
Entropy
st glance, wh
s higher than
sts there wer
is also sugge
ce of fixation
articipant 1
n Figure 44 a
or the design
Virtual Real
Statist
65
264
4.06 per m
27.0
34.89
23.88
hat is unique
n the forelink
re few oppor
estive of fixa
n needs to be
106
. The linkog
and Table 11
n protocol of
lity Participa
tic
4
move
1
97
83
e in this link
k (Figure 46)
rtunities for n
ation occurri
e analyzed w
graph and de
1.
f virtual real
ant 1
kograph is tha
) and horizo
novel ideas t
ing during th
within the de
escriptive st
lity participa
at the backli
onlink (Figur
to occur in th
he design pro
sign protoco
atistics for V
ant 1.
ink entropy
re 45) entrop
he protocol
ocess. How
ol to understa
VR
pies,
as a
wever,
and

107
how and why it occurred. The linkograph illustrates that the majority of the design
process remains below the mean forelink entropy level. The design process does not start
with a high entropy level. Entropy levels drop from move 30 and remain below the mean
entropy level except for moves 51 to 55 and 61 to 64. After move 30, the discussion
appears to focus more on the visitor chair/couch, and the design is revolving around that
one particular idea.
21 Then place these…I’m gonna do the couch for the visiting seat
22 so if there is more than one person present for accounting services they will have an area to sit
23 I move it out to the center of the room and still in line with the desk
30 Move it over by the desk
31 And it looks pretty basic
32 I think it needs something else to make it look a little more interesting
34 that’s one of the problems or one of the things I’m not liking about it…
35 so if we put the cabinets back over by the desk,
36 if we scoot the couch back and put it more of an angle as well
37 Can I have more…the one orange chair? Just one
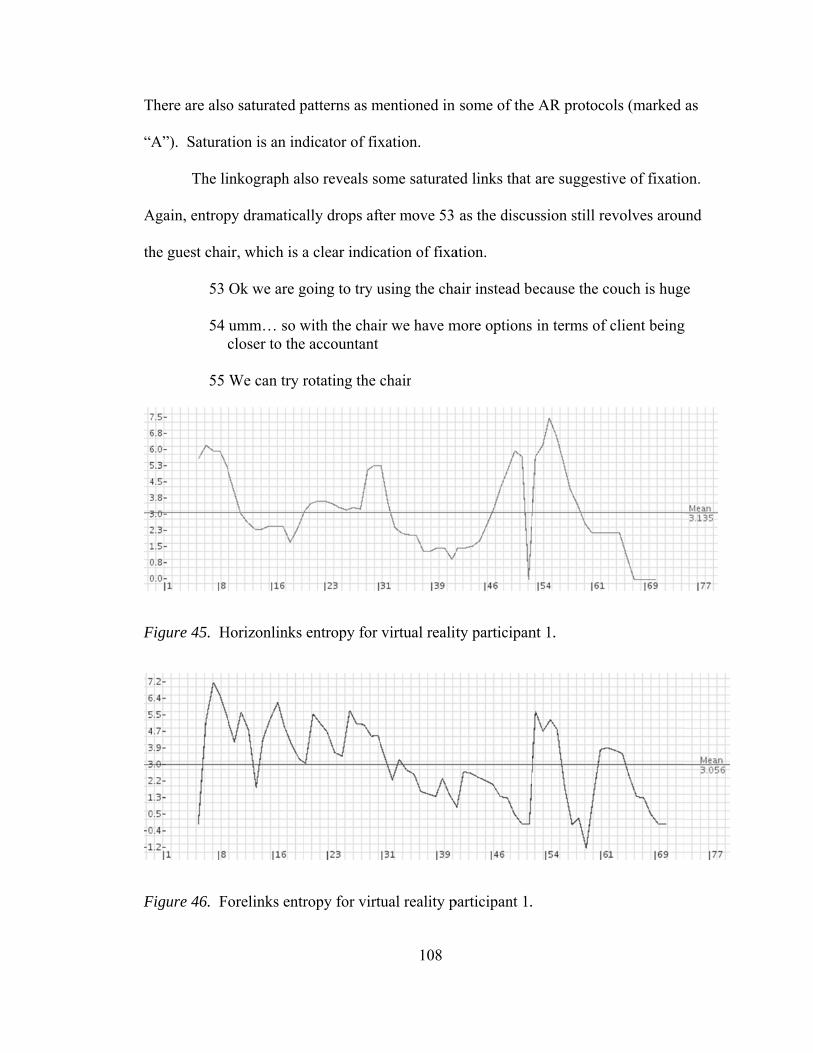
T
“A
A
th
F
F
There are also
A”). Saturat
The li
Again, entrop
he guest chai
53
54 c
55
Figure 45. H
Figure 46. F
o saturated p
tion is an ind
inkograph al
py dramatica
ir, which is a
Ok we are g
umm… so wcloser to the
We can try r
Horizonlinks
orelinks entr
patterns as m
dicator of fix
lso reveals so
ally drops aft
a clear indic
going to try u
with the chaie accountant
rotating the
entropy for
ropy for virt
108
mentioned in
xation.
ome saturate
fter move 53
ation of fixa
using the cha
ir we have m
chair
virtual realit
tual reality p
some of the
ed links that
as the discu
ation.
air instead b
more options
ty participan
participant 1.
e AR protoco
are suggesti
ussion still re
ecause the c
in terms of
nt 1.
ols (marked
ive of fixatio
evolves arou
couch is huge
client being
as
on.
und
e
g

F
p
F
T
D
T
TL
F
BH
Figure 47. B
Virtu
articipant 2
Figure 48. L
Table 12
Descriptive S
Variab
Total Moves
Total Links Link Ratio
orelink Entr
Backlink EntrHorizonlink E
Backlinks ent
al reality pa
are shown in
Linkograph fo
Statistics for
ble
ropy
ropy Entropy
A
tropy for virt
articipant 2
n Figure 48 a
or the design
Virtual Real
St
2.77
1
11
109
tual reality p
2. The linkog
and Table 12
n protocol of
lity Participa
tatistic
44
122 per move
3.724
5.050 1.077
participant 2
graph and de
2.
f virtual real
ant 2
B
2.
escriptive st
lity participa
B
atistics for V
ant 2.
VR

110
Again, in this linkograph the backlink (Figure 51) entropy is higher than the
forelink (Figure 50) and horizonlink (Figure 49)entropies which suggests that the
opportunity for novel ideas was low in the protocol as a whole. This is also suggestive of
fixation occurring during the design process. Multiple instances of saturated paterns
were observed in the linkograph (marked as A and B). The forelink entropy suggests that
only two-thirds of the entropy is above mean entropy levels. The horizonlink entropy is
lower than the forelink and backlink entropy levels, which suggests few opportunities for
incubation of ideas. However, the there are some prominent drops in entropy.
Despite the training, the participant was having difficulties with the control
mechanism.
9 Concentrating on rotating again
10 I was rotating the second storage solution to…
11 so I could see...them better to see…to see
12 which one is better to use…I am still working on that
13 I also keep clicking for the options to go away
14 What do you call those…the axiles
15 I keep clicking them off not on purpose though
The drops in entropy also may be affected by design ideas revolving around a single idea.
35 Do you have any more information about the desk chairs that he selected?
36 Like ergonomical features if they are easy to fit…adjust to fit the users need?
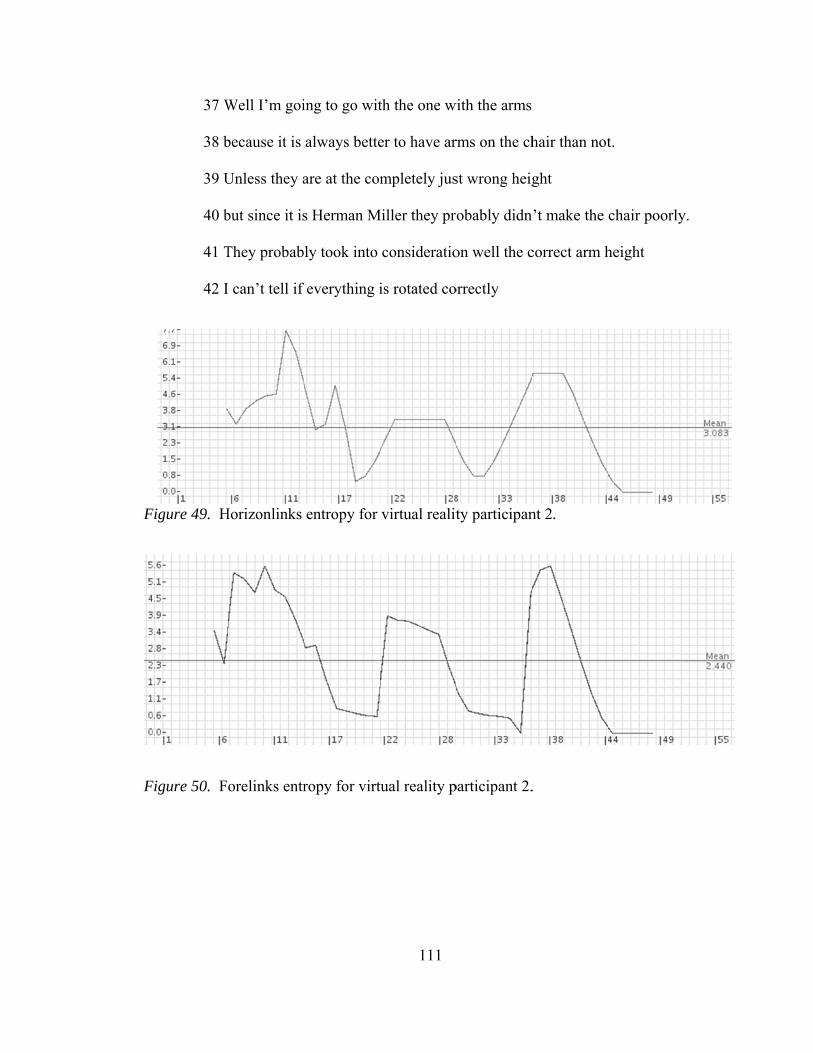
F
F
37 W
38 b
39 U
40 b
41 T
42 I
Figure 49. H
Figure 50. F
Well I’m goi
because it is
Unless they a
but since it is
They probab
can’t tell if
Horizonlinks
orelinks entr
ing to go wit
always bette
are at the com
s Herman M
ly took into
everything i
entropy for
ropy for virt
111
th the one w
er to have ar
mpletely jus
Miller they pro
consideratio
is rotated co
virtual realit
tual reality p
with the arms
rms on the ch
st wrong heig
obably didn
on well the c
orrectly
ty participan
participant 2.
hair than not
ght
’t make the
correct arm h
nt 2.
.
t.
chair poorly
height
y.

F
p
F
Figure 51. B
Virtu
articipant 3
Figure 52. L
Backlinks ent
al reality pa
are shown in
Linkograph fo
tropy for virt
articipant 3
n Figure 52 a
or the design
112
tual reality p
3. The linkog
and Table 13
n protocol of
participant 2
graph and de
3.
f virtual real
2.
escriptive st
lity participa
atistics for V
ant 3.
VR

113
Table 13
Descriptive Statistics for Virtual Reality Participant 3
Variable Statistic
Total Moves 35 Total Links 84
Link Ratio 2.4 per move Forelink Entropy 14.783
Backlink Entropy 15.956
Horizonlink Entropy 11.009
Again, in this linkograph the backlink entropy (Figure 55) is higher than the
forelink (Figure 54) and horizonlink (Figure 53) entropies, which suggests that the
opportunity for novel ideas was low in the protocol as a whole. This is also suggestive of
fixation during the design process through saturation. The forelink entropy suggests that
only half of the entropy is above mean entropy levels. The horizonlink entropy is lower
than the forelink and backlink entropy levels, which suggests few opportunities for
incubation of ideas. Unlike most other linkographs, the entropy level remains above the
mean level even at the end of the design process.
When the participant considers the overall design and relates it to other design
elements, the entropy levels seem to increase.
15 Ok I am rotating the desk
16 and I’m going to have it facing the doorway
17 but over a little bit so that he doesn’t…well I’m just kidding hmm
18 maybe I will rotate it this way and have it facing that wall.
There seem to be two major fixation periods in the design process. The larger
drop in entropy occurs after move 20.

F
F
21 T
22 be
23 oo
24 m
Figure 53. H
Figure 54. F
Then this offi
ecause that’s
ops…ok and
maybe along
Horizonlinks
orelinks entr
ice chair is g
s where offic
d we put that
the back wa
entropy for
ropy for virt
114
gonna go beh
ce chairs goe
t close to the
all facing his
virtual realit
tual reality p
hind because
es…
e desk
s desk…
ty participan
participant 3.
e the desk …
nt 3.
.
…

F
p
F
Figure 55. B
Virtu
articipant 4
Figure 56. Li
Backlinks ent
al reality pa
are shown in
inkograph fo
tropy for virt
articipant 4
n Figure 56 a
or the design
115
tual reality p
4. The linkog
and Table 14
n protocol of
participant 3
graph and de
4.
f virtual reali
.
escriptive st
ity participan
atistics for V
nt 4.
VR

116
Table 14
Descriptive Statistics for Virtual Reality Participant 4
Variable Statistic Total Moves 148 Total Links 226
Link Ratio 1.53 per move Forelink Entropy 25.293 Backlink Entropy 24.842
Horizonlink Entropy 7.372
In this linkograph, the backlink forelink entropy (Figure 58) is slightly higher than
the backlink (Figure 59) entropy (by 0.45). The overall horizonlink entropy (Figure 57)
is very low at 7.37, which again suggests few opportunities for incubation of ideas. The
protocol itself is lengthy compared to the other design protocols, with 148 moves.
There is a major drop in entropy appearing from move 33 to 46. During this time
period the participant appears to focus on single design elements.
34 are these lateral files over here?
35 do they have filing? ok then we are going to go with the clean look
36 and it matches the chairs,
37 I’m actually going to choose this one,
38 I feel the legs on this one match.
39 Ok this one’s better,
40 this one has a small circle around to rotate it
41 I find it easier to maneuver.
42 However I grabbed the outside circle...
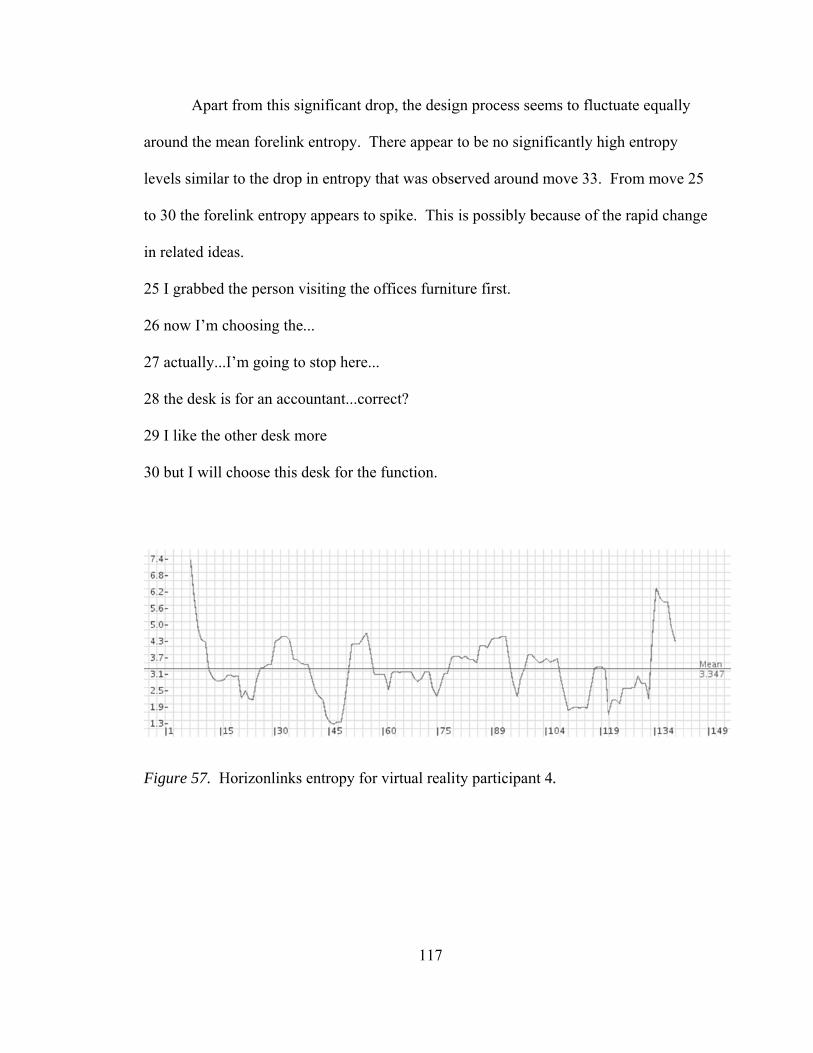
ar
le
to
in
2
2
2
2
2
3
F
Apart
round the m
evels similar
o 30 the fore
n related idea
5 I grabbed
6 now I’m c
7 actually...I
8 the desk is
9 I like the o
0 but I will c
Figure 57. H
from this si
ean forelink
r to the drop
elink entropy
as.
the person v
choosing the.
I’m going to
s for an acco
other desk m
choose this d
Horizonlinks
gnificant dro
k entropy. Th
in entropy th
y appears to
visiting the o
...
o stop here...
ountant...corr
more
desk for the
entropy for
117
op, the desig
here appear
hat was obse
spike. This
offices furnit
rect?
function.
virtual realit
gn process se
to be no sign
erved around
is possibly b
ture first.
ty participan
eems to fluct
nificantly hi
d move 33.
because of th
nt 4.
tuate equally
igh entropy
From move
he rapid cha
y
25
ange

F
F
V
Figure 58. F
Figure 59. B
Vi
VR participan
orelinks entr
Backlinks ent
rtual reality
nt 5 are show
ropy for virt
tropy for virt
y participan
wn in Figure
118
tual reality p
tual reality p
nt 5. The lin
e 60 and Tab
participant 4.
participant 4
nkograph and
ble 15.
.
4.
d descriptivee statistics fo
or
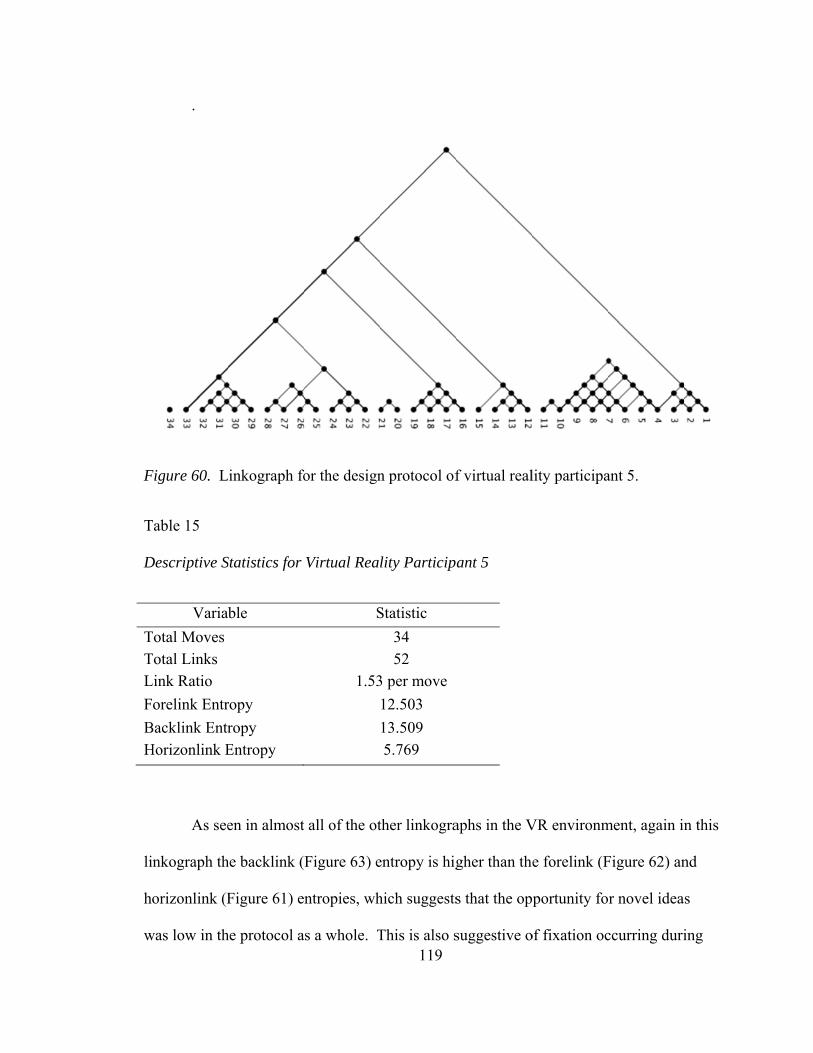
F
T
D
TTL
F
BH
li
h
w
.
Figure 60. L
Table 15
Descriptive S
Variab
Total Moves Total Links Link Ratio
orelink Entr
Backlink EntrHorizonlink E
As see
inkograph th
orizonlink (F
was low in th
Linkograph fo
Statistics for
ble
ropy
ropy Entropy
en in almost
he backlink (
Figure 61) e
he protocol a
or the design
Virtual Real
S
1.53
t all of the ot
Figure 63) e
ntropies, wh
as a whole. T119
n protocol of
lity Participa
Statistic
34 52
3 per move
12.503
13.509 5.769
ther linkogra
entropy is hig
hich suggests
This is also s
f virtual real
ant 5
aphs in the V
gher than the
s that the op
suggestive o
lity participa
VR environm
e forelink (F
portunity fo
of fixation oc
ant 5.
ment, again in
Figure 62) an
r novel idea
ccurring duri
n this
nd
s
ing

th
en
ot
d
se
el
fo
se
en
is
at
en
F
he design pro
ntropy level
ther linkogra
esign proces
egmented.
When
lements, the
orward entro
eventh move
nvironment
s a large drop
After
t the end of t
ntropy level
Figure 61. H
ocess. The h
s, which sug
aphs, the ent
ss. Inspectio
n the particip
entropy lev
opy level and
e when the p
without nece
p in entropy
move 14, th
the design pr
.
Horizonlinks
horizonlink e
ggests fewer
tropy level r
on of the link
pant consider
els seem to i
d continues t
participant be
essarily focu
, which indic
he forelink en
rocess the fo
entropy for
120
entropy is lo
opportunitie
emains abov
kograph sugg
rs the overal
increase. Th
to increase.
egins discuss
using on the
cates opport
ntropy levels
orelink entro
virtual realit
ower than the
es for incuba
ve the mean
gests that th
ll design and
he design pro
However, e
sing the char
design. Fro
tunity for fix
s fluctuate ar
opy level inc
ty participan
e forelink an
ation of idea
level even a
e design pro
d relates it to
ocess starts w
ntropy level
aracteristics o
om move nin
xation.
round the m
creases to ab
nt 5.
nd backlink
as. Unlike m
at the end of
ocess is
o other design
with a highe
ls drop after
of the
ne onwards t
mean. Unusu
ove the mea
most
the
n
er
the
there
ually,
an

F
F
C
V
in
tw
(K
Figure 62. F
Figure 63. B
Calculating O
Two s
VR interfaces
n each interf
wo interface
Kan et al., 20
orelinks entr
Backlinks ent
Overall Entr
strategies we
s. The first s
face type, and
s. Previous
007).The ov
ropy for virt
tropy for virt
ropy Levels
ere used to c
strategy was
d the second
studies on e
erall entropy
121
tual reality p
tual reality p
ompare over
s to compare
d was to com
ntropy comp
y levels in th
participant 5.
participant 5
rall entropy
e individual e
mpare the me
parisons hav
he two group
.
levels betwe
entropies of
ean entropies
ve used the s
ps are provid
een the AR a
the participa
s between th
ame method
ded in Table
and
ants
he
ds
16.

122
Table 16
Overall Entropy Levels across the Augmented Reality and Virtual Reality Interface Types AR VR Participant
Forelink Entropy
(FE)
Backlink Entropy
(BE)
Horizonlink Entropy
(HE)
Forelink Entropy
(FE)
Backlink Entropy
(BE)
Horizonlink Entropy
(HE)
1 16.43 14.18 10.34 27.01 34.9 23.88 2 17.30 25.08 25.76 13.72 15.05 11.08 3 20.47 17.23 9.93 14.78 15.96 11.01 4 13.71 15.85 10.58 25.29 24.84 7.37 5 11.23 10.32 9.15 12.50 13.51 5.77 Forelink entropy (FE) in three out of the five participants in the AR environment
is greater than backlink entropy. In the VR environment, one out of five participants’ FE
levels was greater than the backlink entropy. Overall horizonlink entropy levels were
low in both environments compared with the backlink entropy levels. The horizonlink
entropy levels are associated with the opportunity for incubation but because of the short
time span of the simple design problem, the horizonlink entropy does not provide
adequate opportunities for incubation of ideas.
When FE is greater than the backlink entropy (BE), the design process is
considered to have fewer fixation episodes and therefore is considered to be more
creative. In this study, 60% of the AR participants had larger FE as compared to BE,
while 20% of the VR participants had larger FEs as compared to BEs. The differences in
FE and BE (FE-BE) are provided in Table 17.

123
Table 17
The Difference between Forelink Entropy and Backlink Entropy (FE-BE)
Participant AR VR
1 2.25 -7.89 -1.33 2 -7.78
3 3.24 -1.18 4 -2.14 .45 5 .91 -1.01
Mean -.704 -2.192
If the overall entropy was considered for all five participants, then the above table
suggests that overall BE was higher in both groups. There is a clear difference in entropy
between the AR and VR environments. In the AR environment, overall FE was higher
than BE as compared to the VR environment.
Link ratio or link index is the ratio between the number of links and the number of
moves (Goldschmidt, 1992; Kan et al., 2007). Kan et al. (2007) stated that link ratios are
indicators of design productivity and are positively related to creativity. Cai, Do, and
Zimring (2010) stated that the linkographs of more creative design processes would
display higher link ratios. In this study, the link ratios of the design processes between
the two media types is shown in Table 18. The mean values of link indexes for the two
types of media show that AR has a higher link index. Even though the mean entropies do
not show so much of a difference, AR had more link ratios than VR except for case 1
which, suggests that the design processes of the participants that used the AR interface
were more creative.

124
Table 18 Link Ratios in the Protocols
Participant AR VR
1 2.19 4.06
2 4.06 2.77
3 2.76 2.4
4 1.7 1.53
5 1.74 1.53
Mean 2.49 2.46
Statistical tests are not conducted in most studies using entropy calculations and
this type of mean comparisons are used. For example, Kan et al. (2007) calculated the
entropy and link indexes between two groups and compared the averages between them.
Statistically significant tests are not conducted in protocol analysis mainly due to the low
number of participants. However in certain cases, the number of moves can be used as
the unit of analysis to conduct statistical tests, as shown in Chandrasekera et al. (2013).
Cognitive Load
The pencil and paper version of the NASA TLX was administered to all
participants. The participants were provided with a list of a series of pairs of rating scale
titles (e.g., effort vs. mental demand) and were asked to circle which of the items was
more important to their experience of workload in the design project task they had just
performed. The participants were given 15 such comparisons. The results were recorded
in front of each rating scale using the sources of workload tally sheet (see Appendix I).
The total count was checked to ensure that it was 15. Raw ratings were obtained from the
NASA TLX questionnaire presented to the participants. Using the weighted rating

125
worksheet, the weight obtained from the workload tally sheet was multiplied by the raw
rating to obtain the adjusted rating for each rating scale. These adjusted ratings were
summed to obtain a total adjusted rating and the total was divided by 15 to obtain the
weighted rating for each participant. The NASA TLX score is documented below in two
steps. First the cognitive load of the 10 subjects selected for protocol analysis (in two
groups) are documented (see Table 19), then the cognitive load of all subjects are
documented.
Table 19 Overall Cognitive Load Measurement
Participant VR Participant AR
1(VR) 3.0 1(AR) 2.33
2(VR) 3.4 2(AR) 3.06
3(VR) 2.67 3(AR) 2.46
4(VR) 5.67 4(AR) 2.2
5(VR) 2.27 5(AR) 2.4
Mean 3.402 Mean 2.49
For the 10 participants who were selected for protocol analysis the observed mean
cognitive load in the AR interface was lower compared to the VR interface. For
exploratory purposes, an independent samples t-test was conducted. The results revealed
that the differences were not significant between the two interfaces, VR (M = 3.4, SD =
1.334) and AR (M = 2.5, SD = 0.33); t(8) = 1.483, p = 0.176). Statistical significance
was not expected due to the low number of participants.

126
Because the measurement of cognitive load did not depend on the protocol
analysis, cognitive load of all 30 participants was calculated and compared between the
VR and AR interfaces. An independent samples t-test found a statistically significant
difference between the two interface types, VR (M = 3.06, SD = 1.32) and AR (M = 2.2,
SD = 0.83); t(28) = 2.096, p = 0.045). The results suggest that the cognitive load in the
AR interface was lower than in the VR interface.
Epistemic Action
The characteristics of the action were used to categorize epistemic actions in the
design process as N (New actions), Rr (Revisit rotate action), and Rm (Revisit move
action). The N-actions were not considered as epistemic actions as they were the
initiating move and were equal as well as pre-determined in both AR and VR interfaces.
Statistical analyses were conducted for the Rr and Rm actions. In all design sessions, the
N code was assigned to the first five moves of adopting a design element into the design.
Hence, in all design sessions there were five N codes. The unit of analysis was the
number of moves rather than number of participants; there were 205 moves for AR and
326 moves for VR. The proportion of the epistemic actions were calculated by dividing
the number of total moves with epistemic actions (Rr or Rm) by the total number of
moves in the media type (see Table 20).

127
Table 20
Proportion of Epistemic Actions in the Protocol
Revisit Rotate Revisit Move New Action Augmented Reality 0.14 0.19 0.19 Virtual Reality 0.05 0.14 0.08
Pearson chi-square tests were conducted to analyze the association between Rr
actions, Rm actions, and total epistemic actions within the design process. First, the
proportion of Rr actions based on the overall number of moves in the design process
between VR and AR was observed and analyzed (see Table 21).
Table 21
Number and Proportion of Revisit Rotate Actions in Virtual Reality and Augmented Reality
Media Type (AR/VR) * Y/N Crosstabulation
Media Type Count Y N Total .00 1.00
Virtual Reality
Observed 18 308 326 Expected 28.9 297.1 326.0 % within Virtual Reality
5.5% 94.5% 100.0%
Augmented Reality
Observed 29 176 205 Expected 18.1 186.9 205.0 % within Augmented Reality
14.1% 85.9% 100.0%
Total Observed 47 484 531 Expected 47.0 484.0 531.0 % within All Media 8.9% 91.1% 100.0%
The type of user interface and Rr actions were strongly associated (χ2 = 11.605, p
= 0.001; see Table 22). A significantly higher proportion of Rr actions were observed in
the AR environment (14.1%) than the VR environment (5.5%).

128
Table 22
Chi-Square table for Revisit Rotate Actions
Chi-Square Test Value df Asymp. Sig.
(2-sided) Exact Sig. (2-sided)
Exact Sig. (1-sided)
Pearson Chi-Square 11.605a 1 .001
Continuity Correction 10.560 1 .001
Likelihood Ratio 11.242 1 .001
Fisher's Exact Test .001 .001 Linear-by-Linear Association
11.583 1 .001
Note: The number of valid cases is 531. No cells have an expected count less than 5. The minimum expected count is 18.15. The continuity correction is for a 2X2 table.
Second, the proportion of Rm actions based on the overall number of moves in
the design process between VR and AR were also observed and analyzed. The results are
shown in Tables 23 and 24.
Table 23
Number and Proportion of Revisit Move Actions in Virtual Reality and Augmented Reality
Media Type (AR/VR) * Y/N Crosstabulation Media Type Count Y N Total
.00 1.00 Virtual Reality
Observed 47 279 326 Expected 52.8 273.2 326.0 % within Media 14.4% 85.6% 100.0%
Augmented Reality
Observed 39 166 205 Expected 33.2 171.8 205.0 % within Media 19.0% 81.0% 100.0%
Total Observed 86 445 531 Expected Count 86.0 445.0 531.0 % within Media 16.2% 83.8% 100.0%

129
Table 24
Chi-Square Table for Revisit Move Actions
Chi-Square Tests Value df Asymp. Sig.
(2-sided) Exact Sig. (2-sided)
Exact Sig. (1-sided)
Pearson Chi-Square 1.968a 1 .161
Continuity Correctionb 1.643 1 .200
Likelihood Ratio 1.940 1 .164
Fisher's Exact Test .183 .101 Linear-by-Linear Association
1.965 1 .161
Note: The number of valid cases is 531. No cells have an expected count less than 5. The minimum expected count is 33.20. The continuity correction is for a 2X2 table. The type of user interface and Rm actions were not associated (χ2 = 1.968, p =
0.161). Even though more Rm actions were observed in the AR environment (19%) than
in the VR environment (14.4%), the difference is not significant.
Third, the proportion of overall number of epistemic action moves (Rr actions
plus Rm actions) based on the overall number of moves in the design process between
VR and AR were observed and analyzed (see Tables 25 and 26).
Table 25
Overall Epistemic Actions in Virtual Reality and Augmented Reality
Media Type (AR/VR) * Y/N CrosstabulationMedia Type Count Y N Total
.00 1.00
Virtual Reality
Observed 65 261 326 Expected 81.7 244.3 326.0 % within Media 19.9% 80.1% 100.0%
Augmented Reality
Observed 68 137 205 Expected 51.3 153.7 205.0 % within Media 33.2% 66.8% 100.0%
Total Observed 133 398 531 Total Expected 133.0 398.0 531.0 % within All Media 25.0% 75.0% 100.0%

130
Table 26
Chi Square Table for Overall Epistemic Actions
Chi-Square Tests Value df Asymp. Sig.
(2-sided) Exact Sig. (2-
sided) Exact Sig. (1-
sided) Pearson Chi-Square 11.738a 1 .001
Continuity Correction 11.044 1 .001
Likelihood Ratio 11.535 1 .001
Fisher's Exact Test .001 .000 Linear-by-Linear Association
11.716 1 .001
Note: The number of valid cases is 531. No cells have an expected count less than 5. The minimum expected count is 51.35. The continuity correction is for a 2X2 table.
The type of user interface and overall epistemic action moves were strongly
associated (χ2 = 11.738, p = 0.001). There was a significantly higher proportion of
overall epistemic action moves in the AR environment (33.2%) than the VR environment
(19.9%).
As suggested by Kim and Maher (2008), the designers reduced the amount of
working memory by performing “revisited” modeling actions. The significance of these
epistemic actions supports the idea that the trial-and-error type movements seen in the
AR design sessions are an indicator of epistemic payoff. This result indicates that
designers’ cognitive load might have been reduced in the AR interface by their use of
epistemic actions.

131
Summary of Findings
In this section the following research questions were investigated:
How does interface type affect epistemic actions?
How does interface type affect cognitive load?
How does interface type affect fixation?
Hypotheses H1-H4 (Chapter 3) were tested.
H1: The type of user interface used in design problem solving affects a designer’s
use of design action in ways of epistemic actions. In all design sessions the “New action”
was assigned to the first five moves of adopting a design element into the design.
Therefore, there were five N codes in all design sessions. Pearson chi-square tests
analyzed whether the design process impacted the relative use of Rr actions (Revisit
rotate action), Rm actions (Revisit move action), and total epistemic actions. The Rr
epistemic actions occurred at a significantly higher proportion in the AR interface than
the VR interface. However, even though the mean value for Rm was higher in the AR
interface, the type of media did not significantly affect Rm epistemic actions. Total
epistemic actions occurred at a significantly higher rate in the AR interface as compared
to the VR interface.
The significance of these epistemic actions is that the trial-and-error type
movements seen in the AR design sessions are an indicator of epistemic payoff. The null
hypothesis for H1 was rejected. The conclusion is that AR provided a more conducive
environment for epistemic actions. This finding was statistically significant for the Rr
type of epistemic actions as well as the total epistemic actions. As suggested by Kim and
Maher (2008), the designers reduced the amount of exerted working memory by
132
performing “revisited” modeling actions. This result indicates that designers’ cognitive
load might have been reduced by epistemic actions in the AR interface.
H2: The type of user interface used in design problem solving affects the cognitive
load required by the user interface. The initial calculations of cognitive load of the 10
participants who were selected for protocol analysis revealed that the cognitive load
differences were not significant. However, the sample size of 10 did not provide enough
power in the experiment to yield significant results. Because the measurement of
cognitive load did not depend on the protocol analysis, the cognitive loads of all 30
participants were calculated and compared between the VR and AR interfaces.
Independent samples t-test found a statistically significant difference between the two
interface types. The results suggest that the cognitive load in the AR interface was lower
than in the VR interface. The null hypothesis for H2 was rejected and the conclusion is
that the cognitive load was significantly less in the AR interface as compared to the VR
interface.
H3: The type of user interface used in design problem solving affects fixation in
design problem solving process. Forelink entropy was greater than the backlink entropy
for three out of the five participants in the AR interface. In the VR interface, only one
participant’s forelink entropy level was greater than the backlink entropy. Overall
horizonlink entropy levels were low in both interfaces compared with backlink entropy
levels. In this study 60% of the AR participants had larger forelink entropies as
compared to backlink entropies, while 20% of the VR participants had larger forelink
entropies as compared to backlink entropies. When overall forelink and backlink
entropies were considered, there was a clear difference in entropy between the AR and

133
VR interfaces. In the AR interface, overall Forelink entropy was higher than backlink
entropy as compared to VR.
Furthermore, the mean value for link indexes in the AR interface was higher than
the link indexes in the VR interface, suggesting that the design processes of the
participants that used the AR interface were more creative. The null hypothesis for H3
was rejected and the conclusion is that the VR interface provided a more conducive
environment for fixation (as identified in the linkograph).
H4: The type of user interface used in design problem solving affects creativity in
design process. Considering all of the above findings, the overall conclusion is that
epistemic actions reduce fixation in the design process as signified by the high forelink
entropy level. Epistemic actions reduce cognitive load and fixation in the design process.
The null hypothesis for H4 was rejected.

134
Chapter 5. Part 2- Tangibility in interfaces and Learning Style
Objectives and Hypotheses
The main objective in this section is to identify the effect of interface type on the
learner preferences of the participants. Learner preferences of the participants were
assessed using the VARK learning styles inventory, which classifies user preferences as
visual, auditory, read/write, and kinesthetic.
Previous studies have shown that creativity is affected by intrinsic motivation.
Furthermore, intrinsic motivation has been shown to be driven by the Perceived Ease of
Use (PEU) of an assistive technology. PEU is one of the factors emphasized in the
Technology Acceptance Model (TAM). In order to determine how the interface type
affects learner preference, Perceived Ease of Use (PEU), Perceived Usefulness (PU), and
Intention to Use (IU) were compared between the two interface types for two learning
styles; visual and kinesthetic learning styles.
The following research questions and hypotheses were investigated with a series
of statistical tests.
RQ2: How does type of user interface (AR/VR) and learner preference affect the
creative design process?
RQ2.1: How does interface type affect technology acceptance?
RQ2.2: How does learner preference interact with type of user interface to affect
technology acceptance?
The hypotheses for this section are as follows.

135
H5: The type of user interface used in design problem solving affects the PEU of
the user interface.
H6: The type of user interface used in design problem solving affects the PU of
the user interface.
H7: The type of user interface used in design problem solving affects the IU.
H8: The learner preference of the user moderates the PEU of the user interface.
H9: The learner preference of the user moderates the PU of the user interface.
H10: The learner preference of the user moderates the IU of the user interface.
Analysis and Discussion
Prior to the design experiment, 30 junior and senior college students who
participated in the study completed a survey about their learner preferences. The 30
students were randomly assigned to the two interface types. The distributions of gender,
age, and academic background between the two interface types are shown in Table 27.
Table 27 Demographics in the Augmented and Virtual Reality Groups
Gender Age Academic Level M F 18-25 30-35 Senior Junior
AR 0 15 15 0 6 9 VR 1 14 14 1 8 7
VARK learning styles were used in this study to understand the students’ learner
preferences rather than to categorize them. The learning style questionnaire was based on
the VARK Learning Styles Inventory (Fleming & Mills, 1992), which analyzes students’
preferences for visual, aural, read/write and kinesthetic modes. All participants
completed the survey.

136
A posttest survey (see Appendix B) based on the TAM (Davis, 1989) was
administered to all 30 participants. The survey focused on comparing PEU, PU, and IU
between the interface types (AR and VR). The independent variables in this study were
interface type and learner preference. The dependent variables were PEU, PU, and IU.
Multivariate statistical software (SPSS version 20) was used to obtain descriptive
statistics and to perform statistical analyses. A series of statistical tests were performed
to test the research hypotheses. A one way analysis of variance (ANOVA) was
performed to compare the dependent variables (PU, PEU, and IU) between the two
interface types. A two-way ANOVA was performed to explain the interaction between
interface type and learner preference. To assess the relationship between PU and IU as
well as PEU and IU, bivariate correlation coefficients (Pearson’s r) were computed.
Reliability and Validity of the Instrument
The TAM instrument was adopted from an established TAM scale. The tool
measures the subjective perceptions of technology use and has been previously validated
in a number of studies (Davis, 1989; Davis, 1993; Dishaw & Strong, 1999; Igbaria, 1993;
Igbaria, Schiffman, & Weickowski, 1994). Internal consistency of the measures in the
TAM instrument was assessed by Cronbach’s alpha (α) computed using SPSS.
Cronbach’s alpha ranges between 1 and 0, and internal consistency is considered greater
as the value approaches 1. In the instrument used in this study, the PEU subscale
consisted of nine items (α = .813), and the PU subscale consisted of 5 items (α = .58). In
order to improve the α level for the PU subscale, one item was removed, which improved
the Cronbach’s α value to .65. DeVellis (1991) stated that an α value of 0.60 to 0.65 is
undesirable but acceptable. The IU subscale consisted of two items (α = .79).

137
The VARK questionnaire (Fleming & Mills, 1992) is an established learning style
evaluation tool and was used without any modification, so checking the reliability or
validity of the tool was not necessary.
Comparison of the Dependent Variables between the Interface Types
A one-way ANOVA analyzed the difference between interface type and the
dependent variables. Table 28 shows the descriptive statistics for PEU, IU, and PU by
interface type. ANOVA results for PU, IU and PEU are presented Table 29.
Table 28 Descriptive Statistics for the Virtual and Augmented Reality Interfaces
Dependent Variable
Independent Variable
Mean SD Skewness Kurtosis
Statistic Std.
Error Statistic Std.
Error Perceived Usefulness (PU)
VR 4.83 1.08 -.49 .58 .15 1.12
AR 5.90 0.60 .54 .58 -1.02 1.12
Behavioral Intention to Use (IU)
VR 4.70 1.33 .18 .58 -.77 1.12
AR 6.20 0.80 -.77 .58 -.24 1.12
Perceived Ease of Use (PEU)
VR 5.52 0.95 -.85 .58 .96 1.12
AR 6.23 0.26 .19 .58 -.89 1.12
Note: N = 15 Table 29 ANOVA Summary Table for Interface Type
Dependent Variable
Source SS df MS F p
Perceived Usefulness
Between Groups 8.533 1 8.533 11.213 .002 Within Groups 21.308 28 0.761 Total 29.842 29
Behavioral Intention to Use
Between Groups 16.875 1 16.875 13.979 .001 Within Groups 33.800 28 1.207 Total 50.675 29
Perceived Ease of Use
Between Groups 3.793 1 3.793 7.804 .009 Within Groups 13.608 28 0.486 Total 17.401 29

138
The difference between the two interface types was significant for all three
dependent variables: PU, F(1,28) = 11.21, p = .002); IU, F(1,28) = 13.979, p = .001); and
PEU, F(1,28) = 7.804, p = .009). All three dependent variable means were significantly
higher in the AR interface type, PU: M = 5.90, SD = 0.60; PEU: M = 6.23, SD = 0.26;
and IU: M = 6.20, SD = 0.80, compared to the VR interface type, PU: M = 4.83, SD =
1.08; PEU: M = 5.52, SD = .95; and IU: M = 4.70, SD = 1.33.
Comparison of the Dependent Variables between Interface Type and Learner
preference
In order to understand the interaction between interface type and learner
preference on the dependent variables (PU, PEU and IU), a two-way ANOVA was
performed for each of the dependent variables for exploratory purposes. See Table 31.
Table 30
Descriptive Statistics for Perceived Usefulness
Interface Type Learner
Preference Mean Std. Deviation N
VR
Visual 4.25 .50000 3
Aural 6.08 .52042 3
Read/Write 4.81 .42696 4
Kinesthetic 4.94 1.06800 4
Multimodal 2.50 . 1
AR
Visual 6.15 .54772 5
Aural 5.67 .14434 3
Read/Write 5.25 .00000 3
Kinesthetic 6.42 .80364 3
Multimodal 5.75 . 1
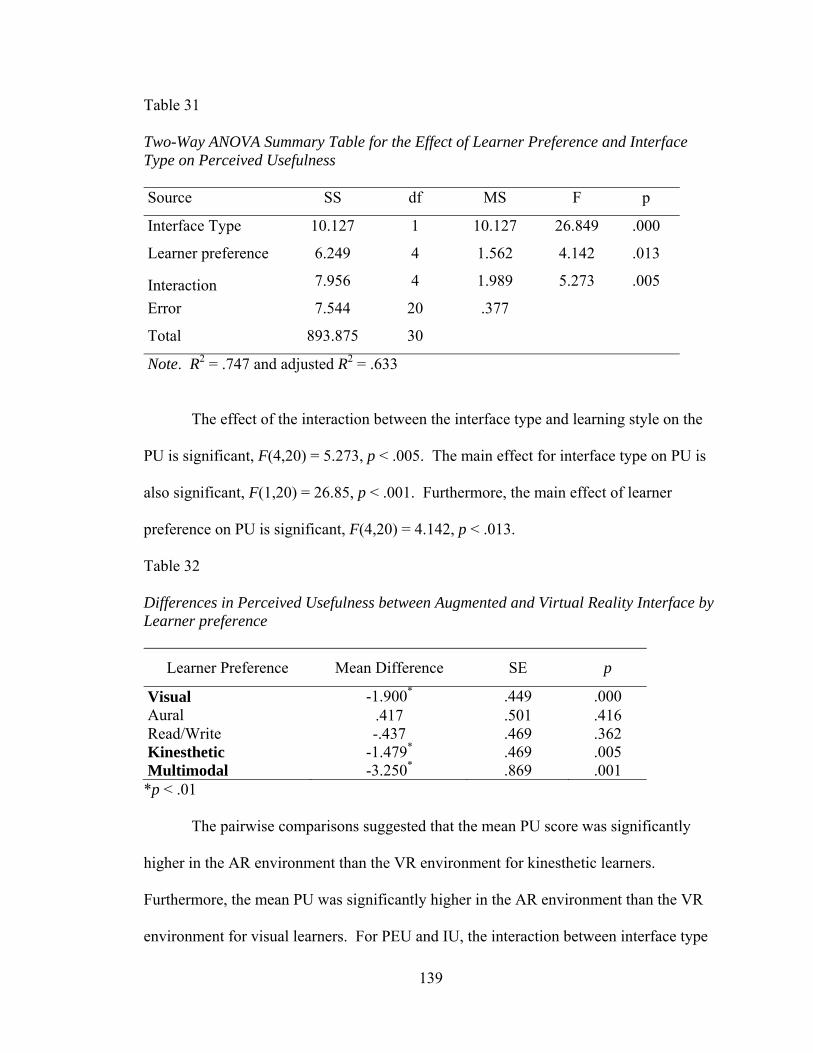
139
Table 31
Two-Way ANOVA Summary Table for the Effect of Learner Preference and Interface Type on Perceived Usefulness Source SS df MS F p
Interface Type 10.127 1 10.127 26.849 .000
Learner preference 6.249 4 1.562 4.142 .013
Interaction 7.956 4 1.989 5.273 .005
Error 7.544 20 .377
Total 893.875 30
Note. R2 = .747 and adjusted R2 = .633
The effect of the interaction between the interface type and learning style on the
PU is significant, F(4,20) = 5.273, p < .005. The main effect for interface type on PU is
also significant, F(1,20) = 26.85, p < .001. Furthermore, the main effect of learner
preference on PU is significant, F(4,20) = 4.142, p < .013.
Table 32
Differences in Perceived Usefulness between Augmented and Virtual Reality Interface by Learner preference
Learner Preference Mean Difference SE p
Visual Aural
-1.900* .449 .000 .417 .501 .416
Read/Write -.437 .469 .362 Kinesthetic -1.479* .469 .005 Multimodal -3.250* .869 .001 *p < .01
The pairwise comparisons suggested that the mean PU score was significantly
higher in the AR environment than the VR environment for kinesthetic learners.
Furthermore, the mean PU was significantly higher in the AR environment than the VR
environment for visual learners. For PEU and IU, the interaction between interface type

140
and learner preference was not significant (p = 0.092 and 0.074 for PEU and IU,
respectively).
Because the multimodal learner category only had two participants (one for each
interface type), the two participants were removed from the data set and the two-way
ANOVA was rerun to observe any difference in the results. Removing these two
participants made no difference in the results obtained for the interaction between learner
style and interface type on PU, PEU, or IU.
Relationships between Perceived Usefulness and Behavioral Intention to Use as well as
Perceived Ease of Use and Behavioral Intention to Use
To investigate the relationship of PEU and PU on the IU as suggested by the
TAM, bivariate correlations (Pearson’s r) were calculated. As expected and predicted by
the TAM, all PU, PEU, and IU were positively but not strongly correlated (see Table 33).
Table 33 Correlations among Variables Perceived Use Behavioral Intention to UseBehavioral Intention to Use (IU)
Pearson’s r .689** Sig. (2-tailed) .000
Perceived Ease of Use (PEU)
Pearson’s r .480** .589** Sig. (2-tailed) .007 .001
Note: N = 30 ** p < .001
Summary of Findings
In this section, two research questions were investigated: How does interface type
affect technology acceptance? And How does learner preference interact with the
interface type to affect technology acceptance? Hypotheses H5 through H10 were tested.

141
H5: The type of user interface used in design problem solving affects the
Perceived Ease of Use (PEU) of the user interface.
H6: The type of user interface used in design problem solving affects the
Perceived Usefulness (PU) of the user interface.
H7: The type of user interface used in design problem solving affects the Intention
to Use (IU).
According to results of the ANOVA, the difference between the two interface
types was statistically significant for all three dependent variables, PU, IU, and PEU. All
three variables had a higher value in the AR interface. The conclusion is that participants
found AR to be easier to use and more useful and were more inclined to use it in the
future than VR. Null hypotheses for H5-H7 were rejected.
H8: The learner preference of the user moderates the PEU of the user interface.
H9: The learner preference of the user moderates the PU of the user interface.
H10: The learner preference of the user moderates the IU of the user interface.
According to the results of the two-way ANOVA, the interaction between the
interface type and learner preference was significant for PU. As expected, the PU score
was significantly higher in the AR environment than the VR environment for kinesthetic
learners. Contrary to expectations, the mean PU was also significantly higher in the AR
environment than the VR environment for visual learners. The null hypothesis for H9
was rejected.
Research has shown that extrinsic motivation for using assistive technology is
captured by the PU construct in the TAM (Davis, 1989; Venkatesh & Davis 2000;

142
Venkatesh & Speier, 2000). Furthermore, Venkatesh, (2000) stated that intrinsic
motivation is related to PEU.
PEU is a measurement of intrinsic motivation that enhances the creative design
process. PU is a means of measuring extrinsic motivation. For PEU and IU, the
interaction between interface type and learner preference was not significant. From these
results the conclusion cannot be made that learner preference affects the creative design
process in a given interface type. Therefore, the null hypotheses for H8 and H10 were
not rejected.
As expected and as proposed in the TAM, this study found positive correlations
between IU and PU as well as IU and PEU. This result validates previous results and the
methodology used in this study.
Participants rated PU, PEU, and IU higher for the AR interface. The conclusion
is that kinesthetic and visual learners found the AR environment more useful than the VR
environment.

143
Chapter 6. Discussion and Implications
Conclusion
The main research question of the study focused on the effect of user interface
type (AR and VR) on the creative design process. Tangibility in user interfaces such as
AR offers epistemic action that reduces the cognitive load, thereby reducing fixation
effects in the design process as compared to other interfaces such as VR (which were
defined as WIMP-based interfaces in this study). The main hypothesis of the study was
that interface type affects the use of epistemic actions in the creative design process,
which in turn would affect fixation and thereby affect the overall creative design process.
Furthermore, a relationship was expected between user preference and creativity in the
design process when using AR and VR. The AR environment was operationalized as an
interface that offered tangible interaction, as compared to VR which functioned within
the WIMP paradigm.
Thirty design students participated in an experiment in which they were required
to design the interior of an office. Participants were randomly assigned to the AR and
VR conditions. Protocol analyses of 10 participants (five in each group) were conducted.
Verbal and visual protocols of the design process were recorded, coded, and analyzed.
Epistemic actions were identified by coding designers’ actions using protocol analysis.
Cognitive load of all 30 subjects was measured using the NASA TLX. The entropy
levels were calculated in each of the 10 design protocols.

144
The first important finding is that the number of epistemic actions was higher in
the AR interface as compared to the VR interface and that the difference was significant.
The higher tangibility of the AR interface as compared to the VR interface seemed to
offer more opportunity for epistemic actions when the participants were designing, which
may have reduced the cognitive load imposed by the interface.
Second, the study showed that the cognitive load was significantly lower in the
AR interface as compared to the VR interface.
Third, forelink entropy was higher than backlink entropy in the AR interface,
which indicates a more conducive environment for the creative design process.
Furthermore, the VR interface provided a more conducive environment for fixation than
the AR interface. In addition, AR had a higher link index than VR, suggesting that the
design processes were more creative in the AR interface.
These results suggest that AR interfaces provide a more conducive environment
for a productive design process. The differences in entropy levels and the stages where
entropy was noticeably high and low in both interfaces support the hypothesis that
interface type affects the entropy levels in the design process, thereby suggesting that
interface type affects the creative design process. Epistemic actions promoted (or
boosted) by the higher tangibility in AR interface appear to reduce cognitive load
imposed by the interface, thereby reducing fixation and enhancing the creative design
process. Furthermore, these conclusions are supported by results of previous studies in
which AR appeared to enhance the design process by reducing fixation (Chandrasekera &
Yoon, 2014a) as well as enhancing spatial cognitive skills (Chandrasekera et al., 2012).
The results of this study do not suggest that VR should be replaced by AR but do suggest

145
that certain aspects, such as reducing cognitive load of the design process can be
enhanced using AR technology.
This study also provided information on how user preference affects the use of
different interfaces. The results suggest that participants perceived AR to be easier to
use, more useful and were more inclined to use it in the future than VR. As expected,
kinesthetic learners found the AR environment more useful than the VR environment.
However, contrary to expectations, visual learners found the AR environment more
useful than the VR environment. The AR interface used in this study was similar to the
VR interface in every way except for the method of interaction and interface
transparency. However, the interaction in the AR interface was achieved by using a
fiducial marker, which may not be the ideal method of interaction for AR. This might be
a factor to explain the unexpected result that visual learners found AR to be more useful
than VR. True tangible interaction for AR may be achieved by using devices such as a
leap motion controller that provide tangible interaction with virtual objects. From these
results, the conclusion cannot be made that learner preference affects the creative design
process in a given interface type.
Implications
This study has theoretical, methodological, and practical implications. The results
of this study yielded some valuable information on how interface type affects the creative
design process. The implications of the study provide designers and design educators
with insights into the selection of different types of interfaces that affect the creative
design process. Furthermore, the results of the study offer suggestions to developers of

146
instructional and educational media and materials to create content for different types of
interfaces.
Theoretical Implications
The implications of the study bridge theories from cognitive psychology,
information science, and design theory to formulate explanations for the effect of
interface type on the creative design process. Furthermore, the study uses AR in design,
which is a relatively new area of design investigation, and the results of the study provide
information about potential use of AR in design instruction. The first section of the study
addressed technology traits and their effect on the creative design process.
Cognitive load theory (Sweller, 1988) has previously been applied to
understanding creativity in the design process. A number of researchers have studied the
relationship between performance and cognitive workload. Cognitive load theory
suggests that the working memory of an individual has limited capacity and that
overwhelming the working memory reduces the effectiveness of the instruction. The
current study provides theoretical implications along this line. The theoretical
implications can be listed as follows.
First, in the current study cognitive load and epistemic actions were correlated in
the two interface types. AR interfaces offered more epistemic action compared to VR
interfaces, thereby reducing the cognitive load imposed by the interface. This finding is
consistent with other studies that have compared the cognitive load of VR and AR
interfaces.
Second, a connection between cognitive load of a system and fixation in the
design process has been suggested (Kershaw et al., 2011; Moreno et al., 2014; Youmans,

147
2007). The results of these studies indicate that by reducing cognitive load, fixation in
the design process can be reduced as well. The current study measured fixation and
established that when cognitive load is less, the fixation caused by that particular
interface is reduced as well. Furthermore, the current study suggests a negative
correlation between epistemic actions and fixation in the design process; therefore, when
epistemic actions increase, fixation effects decrease in the design process.
Third, according to information science theory, Shannon’s construct of entropy is
an established method of calculating entropy or information in a process. In design
theory, a number of studies have incorporated Shannon’s entropy to identify fixation in
the design process as well as to calculate dynamic entropy levels to suggest the level of
creativity of the design process. These studies suggest that higher entropy levels mean a
more creative design process and that sudden drops in entropy suggest a fixation effect in
the design process.
Finally, the study establishes a theoretical connection between epistemic action
and creativity in the design process, filling a critical gap in knowledge – when epistemic
actions are increased, the creative design process is enhanced. Moreover, tangibility in
user interfaces such as AR appear to afford more epistemic actions that reduce cognitive
load, reduce fixation effects in the design process, and enhance the creative design
process, as compared to WIMP-based interfaces such as VR.
The second section of the study addresses user traits and their effect on the
creative design process. Specifically, the study identifies a connection between learner
preference and its effect on creativity in the design process. For this purpose, learner
preference was analyzed together with technology acceptance as measured by PU, PEU,

148
and IU. The theoretical framework established the connection between PEU and
creativity through intrinsic motivation. While learner preference did not significantly
affect creativity, technology acceptance was higher for the AR environment, and learner
preference affected PU. These theoretical implications can contribute practical insights
to multiple domains on using different interface types in the design process.
Methodological Implications
AR is gaining increased attention for varied uses in different domains. In this
study, AR and VR interfaces were used to validate their use in design and design
education. Understanding why and how these technologies can be used in design
education is crucial. The study provides empirical evidence for using AR in design and
design education. This study used linkography as a protocol analysis method and to
calculate entropy in the links to identify fixation and creativity in the design process. Ten
participants were randomly selected for protocol analysis. Even though protocol analysis
has been used to understand the effect of media interfaces such as AR and VR, few or no
studies have used linkography and entropy calculations to understand the effect of these
interface types on the creative design process. Moreover, this study incorporated a
linkography method together with quantitative analysis to understand the impact of media
interfaces on the creative design process. The methodology can be replicated and used to
understand the effect of other types of interfaces on the creative design process.
Practical Implications
From a practical standpoint, the findings of this study contribute to helping
designers and design educators use interfaces such as AR and VR in the design process.

149
The results suggest that by reducing the cognitive load the creative design process can be
enhanced. In terms of teaching, this not only suggests that AR interfaces offer less
cognitive load, it also confirms that decisions about using any instructional medium
should be made carefully and should consider the cognitive load of the chosen
instructional interface.
AR is being introduced to different fields and different education levels. One
such current trend is its adoption in K-12 education. Instructional design relies on
reducing cognitive load in order to improve learning efficiency. As the current study
suggests, AR imposes a relatively low cognitive load on the user and therefore can be
adopted efficiently in curricula.
This finding can be applied to areas other than education. For example, AR
devices such as the Epson Moverio BT200 are being introduced for use in operations and
maintenance in facility management. As more devices such as these become available,
knowing which technologies have less cognitive load is important. Chandrasekera (2014)
described a method of using AR in design critiques as an alternative to physical
prototyping and observed user perception of the technology. The results of the current
study provide additional justification for using AR in design education as well as in the
design process.
An information technology research and advisory company, Gartner (Fenn &
LeHong, 2011) suggested in their hype cycle for emerging technologies for 2014 that AR
is still continuing its journey through the third phase of technology maturation. In order
for technology to mature and reach its potential, research on how these technologies can

150
be useful in different domains is necessary. The current study fills a gap by showing how
AR can be useful not only in design and design education but in other domains as well.
Fixation is considered to be a negative aspect in design, in most cases hindering
the creative design process. Some researchers have identified factors that cause fixation
in the design process such as prior knowledge and external stimuli. Specifically, some
researchers have discussed the fixation effects that are caused by standard CAD software
used in design and design education (Crilly, 2015; Robertson, Walther, & Radcliffe,
2007; Veisz, Essam, Joshi, & Summers, 2012). In this study, the use of AR interfaces in
the design process reduced fixation as compared to VR interfaces. While CAD software
packages such as SketchUp and Solid Works have incorporated AR through plug-ins and
add-ons, a true AR CAD system does not exist yet. The findings of this study are
invaluable in justifying the development of such an AR CAD system to be used
effectively in the creative design process.
The results of the current study show how learner preference affects user
acceptance of different interface types and may affect the creative design process. Even
though there was no relationship between creativity in the design process and learner
preference under the AR and VR interfaces, the learners’ PU, PEU, and IU were all
significantly higher in the AR interface than in the VR interface. This finding is
consistent with previous findings on AR and user acceptance (Chandrasekera, et al.,
2012).

151
Limitations
The current study was designed with numerous methods of limiting errors and
enhancing the validity of the research protocol in investigating the effect of tangibility in
user interfaces on the design process. However, as in all research of an exploratory
nature, there are some unavoidable limitations.
First, the participants were college students in a design program at one
Midwestern college in the United States. Most of the students were living in the same
region. The study focused on design and the design process, and the students that were
recruited were design students who were in their junior and senior years of study. Even
though the participants were randomly assigned to the AR or VR group, six seniors and
nine juniors were in the AR group, while eight seniors and seven juniors were in the VR
group. This unequal distribution might have affected the results of the study because the
senior students are more experienced in the design process than the junior students.
Another major limitation was the unequal gender distribution: 29 out of 30 participants
were female.
The second limitation was the small number of participants recruited in the study
and the small number of participants randomly selected to be analyzed through protocol
analysis. One of the reasons for the small sample size was the applied experimental
methodology in which a limited portion of the sample was randomly selected for protocol
analysis. In addition, obtaining the required number of participants was difficult. The
entire data collection took place from December, 2014 to April, 2015. Although an
incentive was offered, the need to dedicate some time out of their busy and limited
schedules contributed to the students’ decision to refrain from participating in the study.

152
However, recruiting a small number of participants for protocol analysis is common
because the unit of analysis is the design move rather than the participant.
Thirdly, some limitations are associated with the protocol analysis method used in
this study. Despite the fact that protocol analysis is a widely used empirical research
method for studying cognitive processes in design studies, the method has some accepted
limitations. Protocol analysis is primarily criticized for creating an unnatural design
setting within a lab environment in which participants are instructed to verbalize their
thinking process while being observed. In addition, the linkography method adopted in
this study has been criticized for two main reasons: the procedure is time consuming and
cognitively demanding for the researchers and the subjective nature of the linking process
is questionable. In this study, several methods were used to improve the objectivity of
the analysis; these methods were discussed extensively in the methods section.
Fourthly, the design project that the participants worked on could have been
simplified or enhanced in order to identify epistemic actions clearly. For example, by
tightening the design criteria so that the participants were forced to design in a certain
way they would have been compelled to use more epistemic actions to explore different
possibilities.
The study incorporated desktop based VR and AR, in terms of technology these
can be seen as limitations. Using HMD based display systems for both VR and AR can
be a method in order to reduce this limitation.

153
Future Directions
This study provides a number of opportunities for further evaluation, given that
the subject matter focuses on a relatively new domain in the use of AR in design
education. As the technology is becoming available for use in schools, the need for such
research increases. Research in this area will not only encourage design schools to adopt
technology-based design education but also assist in the development of the technology.
First, the current study provides compelling evidence for the use of AR in design
education to enhance the creative design process. In future research, the same
methodology can be used to carry out design research with diverse populations to see if
individual and cultural factors affect the use of such technology. To this aim the author
of this dissertation has already focused on conducting virtual collaborative design studios
among different design schools in the United States. The use of virtual critiques has been
discussed in previous studies (Chandrasekera, 2015), and the current study provides
empirical evidence for using some of these tools in design studios. Using the framework
provided by Chandrasekera as well as the results from this study, I expect to develop an
AR platform to be used in the design critique process.
Second, I hope to replicate the current study and use neuroimaging technology to
understand the changes in brain function during the design process. When the pilot study
of the current study was conducted, a neuroimaging device was used to analyze the
changes in brain function (Chandrasekera & Yoon, 2014b). Even though a
comprehensive analysis was not performed, the preliminary results showed a connection
between brain function patterns and associated cognitive load. Slevitch, Chandrasekera,
Yang, and Chung (2015) used the method described by Anderson et al. (2011) to analyze
154
the cognitive load through neuroimaging data. Such a study will be helpful in validating
the effect of interface type on the cognitive load imposed on the user.
Third, this study should be replicated with the use of other types of AR and VR.
In this study, only one type of AR (operationalized as fiducial marker-based desktop AR)
and one type of VR (operationalized as WIMP-based desktop VR) were used. The effect
of different intensities of tangibility on the design process will be particularly interesting.
Fourth, I expect to describe specific characteristics that differentiate AR and VR
from each other using the results and knowledge gained from this study. Currently,
specific definitions that help distinguish these technologies as separate tools are lacking.
This is evident in the statement that Azuma (1997) made when he mentioned that AR is a
variation of VR. However, the current study clearly shows how these two technologies
affect human cognitive abilities. I expect to define these technologies by focusing on the
two characteristics of tangibility and interface transparency. Here, interface transparency
is defined as the awareness of the interface. Understanding these factors will also help in
defining the concept of “presence” in AR environments. In previous research
(Chandrasekera, 2014), I suggested that AR requires a different definition (relative
realism) for the concept of presence because the current definition was developed for VR.
Even though initial concepts were developed by Milgram et al. (1995), further research
has not been conducted.
Given the novelty of the research area, the current research provides a fertile
ground to further elaborate on the results obtained. The research conducted in this study
is expected to contribute not only to the field of design research but to technology-based
education and AR-related research as well.

155
References
Abdul-Rahman, S.-S. and B. Du Boulay (2014). Learning programming via worked-examples: Relation of learning styles to cognitive load. Computers in Human Behavior, 30, 286-298.
Ackoff, R. L. (1974). Redesigning the future. p 29, New York: John Wiley & Sons Inc.
Agogue, M. and M. Cassotti (2013). Understanding fixation effects in creativity: a design-theory approach. DS 75-2: Proceedings of the 19th International Conference on Engineering Design (ICED13), Design for Harmonies, Vol. 2: Design Theory and Research Methodology, August 22, Seoul, Korea.
Agogué, M., Poirel, N., Pineau, A., Houdé, O., & Cassotti, M.. (2014). The impact of age and training on creativity: a design-theory approach to study fixation effects. Thinking Skills and Creativity, 11, 33-41.
Amabile, T. M. (1983). The social psychology of creativity: A componential
conceptualization. Journal of Personality and Social Psychology, 45(2), 357-376. Amabile, T. M. (1985). Motivation and creativity: Effects of motivational orientation on
creative writers. Journal of personality and Social Psychology, 48(2), 393-399. Amabile, T. M. and S. S. Gryskiewicz (1987). Creativity in the R&D laboratory.
Greensboro, NC :Center for Creative Leadership.
Anasol, P.-R., Ferreyra-Olivares, E., & Alejandra, P. (2013). Stories of the virtual mind. In Proceedings of the Creative Science 2013 (CS'13), 18-27.
Anderson, E. W., Potter, K. C., Matzen, L. E., Shepherd, J. F., Preston, G. A., & Silva, C. T. (2011). A user study of visualization effectiveness using EEG and cognitive load. In Computer Graphics Forum (Vol 30, No. 3 pp. 791-800). Blackwell Publishing Ltd.
André, P., Teevan, J., & Dumais, S. T. (2009). Discovery is never by chance: Designing
for (un) serendipity. In Proceedings of the seventh ACM conference on Creativity and cognition, ACM (pp. 305-314).
Antle, A. N. (2013). Exploring how children use their hands to think: An embodied interactional analysis. Behaviour & Information Technology 32(9), 938-954.
Antle, A. N. & S. Wang (2013). Comparing motor-cognitive strategies for spatial problem solving with tangible and multi-touch interfaces. In Proceedings of the 7th International Conference on Tangible, Embedded and Embodied Interaction (pp.65-72). ACM.

156
Archea, J. (1987). Puzzle-making: What architects do when no one is looking. New York: Wiley-Interscience, pp. 37-52.
Atkinson, E. S. (2004). A comparison of the relationship between creativity, learning
style preference and achievement at GCSE and degree level in the context of design and technology project work. Paper presented at the DATA International Research Conference.
Ausubel, D. P., Novak, J. D., & Hanesian, H. (1968). Educational psychology: A cognitive view. New York: Holt, Rinehart and Winston.
Azuma, R. T. (1997). A survey of augmented reality. Presence-Teleoperators and Virtual
Environments, 6(4), 355-385.
Baer, J. (1997). Gender differences in the effects of anticipated evaluation on creativity. Creativity Research Journal, 10(1), 25-31.
Baer, J. (2014). Creativity and Divergent Thinking: A Task-specific Approach. New
York: Psychology Press.
Baer, J. & J. C. Kaufman (2008). Gender differences in creativity. Journal of Creative Behavior, 42(2), 75-105.
Bara, F., Gentaz, E., Colé, P., & Sprenger-Charolles, L. (2004). The visuo-haptic and haptic exploration of letters increases the kindergarten-children’s understanding of the alphabetic principle. Cognitive Development, 19(3), 433-449.
Bashier, F. (2014). Reflections on architectural design education: The return of rationalism in the studio. Frontiers of Architectural Research 3(4), 424-430.
Bekker, M. M., Olson, J. S., & Olson, G. M. (1995). Analysis of gestures in face-to-face
design teams provides guidance for how to use groupware in design. Proceedings of the 1st conference on Designing interactive systems: processes, practices, methods, & techniques. ACM.
Bell, B., Koch, J., & Green, B. (2014). Assessing Learning Styles of Pharmacy Students Using the VARK Questionnaire. Unpublished presentation, Butler University.
Billinghurst, M. (2002). Augmented reality in education. New Horizons for Learning, 12, 1-5.
Biocca, F. & Levy, M. R. (2013). Communication in the age of virtual reality. New York:
Routledge. Biocca, F., Owen, C., Tang, A., & Bohil, C. (2007). Attention issues in spatial
information systems: Directing mobile users' visual attention using augmented reality. Journal of Management Information Systems 23(4): 163-184.

157
Biocca, F., Tang, A., Owen, C., & Xiao, F. (2006). Attention funnel: omnidirectional 3D cursor for mobile augmented reality platforms. Proceedings of the SIGCHI conference on Human Factors in computing systems, ACM.
Borrego, M., Douglas, E. P., & Amelink, C. T. (2009). Quantitative, qualitative, and mixed research methods in engineering education. Journal of Engineering Education, 98(1), 53-66.
Bredeson, P. V. (2002). The architecture of professional development: Materials,
messages and meaning. International Journal of Educational Research, 37(8), 661-675.
Briggs, K. C. (1976). Myers-Briggs Type Indicator. Palo: Alto, CA: Consulting Psychologists Press.
Broadbent, G. (1973). Design in Architecture: Architecture and the Human Sciences. New York: John Wiley & Sons.
Brunken, R., Plass, J. L., & Leutner, D. (2003). Direct measurement of cognitive load in multimedia learning. Educational Psychologist, 38(1), 53-61.
Bryson, S. (1995). Approaches to the successful design and implementation of VR applications. Virtual Reality Applications, 3-15.
Buchanan, R. (1992). Wicked problems in design thinking. Design Issues, 8, 5-21.
Burke, J. W., McNeill, M., Charles, D., Morrow, P. J., Crosbie, J., & McDonough, S. (2010). Augmented reality games for upper-limb stroke rehabilitation. Games and Virtual Worlds for Serious Applications (VS-GAMES), 2010 Second International Conference on, IEEE.
Cai, H., Do, E. Y.-L., & Zimring, C. M. (2010). Extended linkography and distance graph in design evaluation: An empirical study of the dual effects of inspiration sources in creative design. Design Studies, 31(2), 146-168.
Casakin, H. & G. Goldschmidt (1999). Expertise and the use of visual analogy: Implications for design education. Design Studies, 20(2), 153-175.
Casakin, H. & S. Kreitler (2010). Motivation for creativity in architectural design and engineering design students: implications for design education. International Journal of Technology and Design Education, 20(4), 477-493.
Chan, C.-S. (1997). Virtual reality in architectural design. Paper presented at the CAADRIA.
Chandrasekera, T. (2014). Using augmented reality prototypes in design education. Design and Technology Education: an International Journal, 19(3), 33-42.

158
Chandrasekera, T. (2015). Towards an Online Based Design Critique Framework for Design Education. International Journal of Education and Information Technology, 1(3), 61-69.
Chandrasekera, T., Vo, N., & D'Souza, N. (2013). The effect of subliminal suggestions on Sudden Moments of Inspiration (SMI) in the design process. Design Studies, 34(2), 193-215.
Chandrasekera, T., Yoon, S.-Y., & D’Souza, N. (2015). Virtual environments with soundscapes: a study on immersion and effects of spatial abilities. Environment and Planning B: Planning and Design, 42, advance online publication, doi:10.1068/b130087p
Chandrasekera, T. & S. Y. Yoon (2013). Augmented reality based spatially related navigation system for internal navigation of healthcare environments. Paper presented at Environmental Design Research Association Conference, Providence, Rhode Island.
Chandrasekera, T., Yoon, S. Y., & Balakrishnan, B. (2012). Digital orthographic projections in architectural representation: Augmented reality based learning. Paper presented at the 16th Biannual Conference of the Design Communication Association Stillwater, Oklahoma.
Chandrasekera, T., Yoon, S.-Y (2014a). Using augmented reality tools to enhance design creativity. Paper presented at the Environmental Design Research Association Conference, New Orleans.
Chandrasekera, T., Yoon, S.-Y. (2014b). The effect of virtual reality and augmented reality in the design process. Paper presented at the 17th Biannual Conference of the Design Communication Association, Atlanta, Georgia.
Chandrasekera, T., Yoon, S.-Y (2015) Adopting Augmented Reality in Design
Communication: Focusing on Improving Spatial Abilities, The International Journal of Architectonic, Spatial, and Environmental Design, Volume 9, Issue 1, March 2015, Pages 1- 14
Chen, Y.-C. (2006). A study of comparing the use of augmented reality and physical
models in chemistry education. Proceedings of the 2006 ACM international conference on Virtual reality continuum and its applications, ACM.
Chiu, M.-L. (2002). An organizational view of design communication in design
collaboration. Design Studies, 23(2), 187-210. Chou, S.-B. (2007). A method of evaluating creativity in linkography. Paper presented at
the10th QMOD conference of quality management and organizational development. Our Dreams of Excellence.

159
Chou, S.-B., Chou, H.-W., & Chen, Y.-L. (2013). Entropy of Linkography: Evaluating the creativity of short animation. Creativity Research Journal, 25(1), 33-37.
Christensen, B. T. & C. D. Schunn (2007). The relationship of analogical distance to analogical function and preinventive structure: The case of engineering design. Memory & Cognition, 35(1), 29-38.
Christensen, B. T. & Schunn, C. D. (2009). The role and impact of mental simulation in design. Applied Cognitive Psychology, 23(3), 327-344.
Cohen, J. (1960). Kappa: Coefficient of concordance. Educational Psychology Measurement, 20, 37-46.
Collins, M. A. & T. M. Amabile (1999). Motivation and creativity. In R. J. Sternberg (Ed.), Handbook of creativity (pp. 297 – 312). Cambridge, England: Cambridge Univ. Press.
Cooper, G. (1990). Cognitive load theory as an aid for instructional design. Australasian Journal of Educational Technology, 6(2), 108-113.
Cooper, G. (1998). Research into cognitive load theory and instructional design at UNSW. Retrieved August 8: 2003. http://dwb4.unl.edu/Diss/Cooper/UNSW.htm
Craig, D. L. (2001). Stalking Homo Faber: A comparison of research strategies for studying design behavior, (pp. 13-36), Oxford, UK: Elsevier.
Crilly, N. (2015). Fixation and creativity in concept development: The attitudes and practices of expert designers. Design Studies, 38, 54-91.
Cross, N. (1977). The automated architect, London: Pion Press.
Cross, N., Dorst, K., & Christiaans, H. (1996). Analysing design activity, Chichester, UK: Wiley.
Csikszentmihalyi, M. (1997). Flow and the psychology of discovery and invention. (p. 39), New York: HarperPerennial.
Csikszentmihalyi, M. (2006). Developing creativity. In Developing creativity in higher education. London: Routledge.
Csikszentmihalyi, M. & J. Getzels (1971). Discovery-oriented behavior and the originality of creative products: a study with artists. Journal of Personality and Social Psychology, 19(1): 47.
Curry, L. (1983). An organization of learning styles theory and constructs. Paper presented at the 67th Annual Meeting of the American Educational Research Association (Montreal, Quebec, April 11-15).

160
D'Souza, N. (2009). Revisiting a vitruvian preface: The value of multiple skills in contemporary architectural pedagogy. Architectural Research Quarterly, 13(2), 173-182.
D'Souza, N. S. (2006). Design Intelligences: A Case for Multiple Intelligences in Architectural Design (Doctoral dissertation, University of Wisconsin--Milwaukee).
Daley, J. (1982). Design creativity and the understanding of objects. Design Studies, 3(3), 133-137.
Davis, F. D. (1989). Perceived usefulness, perceived ease of use, and user acceptance of information technology. MIS Quarterly, 319-340.
Davis, F. D. (1993). User acceptance of information technology: system characteristics, user perceptions and behavioral impacts. International Journal of Man-machine studies, 38(3), 475-487.
De Jong, T. (2010). Cognitive load theory, educational research, and instructional design: some food for thought. Instructional Science 38(2), 105-134.
De Vries, B. & H. H. Achten (1998). What offers Virtual Reality to the designer. Proceedings of the International Conference on Integrated Design & Process Technology, Berlin, Germany, July 6-9.
Demirbaş, O. & H. Demirkan (2003). Focus on architectural design process through learning styles. Design Studies, 24(5), 437-456.
DeVellis, R. F. (1991). Scale development: Theory and applications. Newbury Park, CA: Sage.
Di Serio, A., Ibáñez, M. B., & Kloos, C. D. (2013). Impact of an augmented reality system on students' motivation for a visual art course. Computers & Education 68, 586-596.
Dishaw, M. T. & Strong, D.M. (1999). Extending the technology acceptance model with task–technology fit constructs. Information & Management, 36(1), 9-21.
Dobson, A. (1998). Exploring conceptual design using CAD visualisation and virtual reality modelling. Paper presented at the Computerised Craftsmanship-16th Conference on Education in Computer Aided Architectural Design in Europe (eCAADe).
Dorst, K. (2011). The core of ‘design thinking’and its application. Design Studies, 32(6), 521-532.
Dorst, K. &Cross, N. (2001). Creativity in the design process: co-evolution of problem–solution. Design Studies, 22(5), 425-437.
Dourish, P. (2001). Where the action is. Cambridge: MIT Press.
161
Dow, S. P., Glassco, A., Kass, J., Schwarz, M., Schwartz, D. L., & Klemmer, S. R. (2010). Parallel prototyping leads to better design results, more divergence, and increased self-efficacy. ACM Transactions on Computer-Human Interaction (TOCHI) 17(4), 18.
Drago, W. A. & Wagner. R. J. (2004). VARK preferred learning styles and online education. Management Research News, 27(7), 1-13.
Dunn, R. (1993). Learning styles of the multiculturally diverse. Emergency Librarian, 20(4), 24-32.
Durling, D., Cross, N., & Johnson, J. (1996). Personality and learner preferences of students in design and design-related disciplines. Paper presented at the IDATER 1996 Conference, Loughborough, Loughborough University.
Eishani, K. A., Saa’d, E. A., & Nami, Y. (2014). The relationship between learning styles and creativity. Procedia-Social and Behavioral Sciences, 114, 52-55.
Engeli, M. & A. Mueller (1999). Digital environments for learning and collaboration, architecture, communication, and creativity. In Proceedings ACADIA’99. Pp. 40-52.
Esteves, A., Bakker, S., Antle, A. N., May, A., Warren, J., & Oakley, I. (2015). The ATB Framework: Quantifying and Classifying Epistemic Strategies in Tangible Problem-Solving Tasks. Proceedings of the Ninth International Conference on Tangible, Embedded, and Embodied Interaction, ACM.
Felder, R. M. & Silverman, L. K. (1988). Learning and teaching styles in engineering education. Engineering Education, 78(7), 674-681.
Fiala, M. (2005). ARTag, a fiducial marker system using digital techniques. Paper presented at the Computer Vision and Pattern Recognition, 2005. CVPR 2005. IEEE Computer Society Conference on, IEEE.
Fischer J., Cunninham, D., Bartz, D., Wallraven, C., Bulthoff, H., Stasser, W. (2006). Measuring the discernability of virtual objects in conventional and stylized augmented reality. In Proceedings of Eurographics Symposium on Virtual Environments (2006), pp. 53–61.
Fishkin, K. P. (2004). A taxonomy for and analysis of tangible interfaces. Personal and Ubiquitous Computing, 8(5), 347-358.
Fitzmaurice, G. W. (1996). Graspable user interfaces (Doctoral dissertation, University of Toronto).
Fjeld, M. & W. Barendregt (2009). Epistemic action: A measure for cognitive support in tangible user interfaces? Behavior Research Methods, 41(3), 876-881.

162
Fleming, N. & C. Mills (2001). VARK: A guide to learning styles. Retrieved July 7, 2015 from http://vark-learn.com/the-vark-questionnaire/?p=questionnaire
Fleming, N. D. (2001). Teaching and Learning Styles: VARK Strategies. Honolulu Community College, Honolulu, 2001, p. 128.
Fleming, N. D.& C. Mills, C. (1992). Not another inventory, rather a catalyst for reflection. To Improve the Academy, 11, 137–143.
Fonseca, D., Villagrasa, S., Martí, N., Redondo, E., & Sánchez, A. (2013). Visualization methods in architecture education using 3D virtual models and augmented reality in mobile and social networks. Procedia-Social and Behavioral Sciences, 93, 1337-1343.
Friedel, C., & Rudd, R. (2006). Creative thinking and learning styles in undergraduate agriculture students. Journal of Agricultural Education, 47(4), 102.
Fröst, P., & Warren, P. (2000). Virtual reality used in a collaborative architectural design process. Paper presented at the Information Visualization, 2000. Proceedings. IEEE International Conference.
Gabbard, J. L., & Swan, J. E. (2008). Usability engineering for augmented reality: Employing user-based studies to inform design. Visualization and Computer Graphics, IEEE Transactions, 14(3), 513-525.
Gall, M., Gall, J., & Borg, W. (2007). Collecting research data with questionnaires and interviews. In M. D.Gall, J. P. Gall, & W. R. Borg (Eds.), Educational research: An introduction (pp. 227-261). Boston, MA: Pearson.
Galy, E., Mélan, C., & Cariou, M. (2008). Investigation of task performance variations according to task requirements and alertness across the 24-h day in shift workers. Ergonomics, 51(9), 1338-1351.
Gao, S., & Kvan, T. (2004). An analysis of problem framing in multiple settings, in J. S. Gero (Ed.) Design computing and cognition’04, Amsterdam: Kluwer Academic Publishers (pp. 117-134).
Gardner, H. (1983). Frames of mind: The theory of multiple intelligences: NY: Basics.
Gero, J., & Kazakov, V. (2001). Entropic-based similarity and complexity measures of 2D architectural drawings. Paper presented at the Visual and Spatial Reasoning in Design.
Gero, J. S. (2001). Mass customisation of creative designs. Paper presented at the International Conference on Engeneering Design ICED’01, Glasgow.
Gero, J. S. (2010). Generalizing design cognition research. DTRS, 8, 187-198.

163
Gero, J. S. (2011). Fixation and commitment while designing and its measurement. Journal Creative Behavior, 45(2), 108-115.
Gero, J. S., Kan, J. W., & Pourmohamadi, M. (2011). Analysing design protocols:
Development of methods and tools. Paper presented at the ICORD 11: Proceedings of the 3rd International Conference on Research into Design Engineering, Bangalore, India, 10.-12.01. 2011.
Gero, J. S., & Maher, M. L. (2013). Modeling creativity and knowledge-based creative
design. Hillsdate, NJ:Lawrence Erlbaum. Gero, J. S., & Sosa, R. (2008). Complexity measures as a basis for mass customization of
novel designs. Environment and Planning. B Planning and Design, 35(1), 3-15. Gerven, P. W., Paas, F., Merriënboer, J. J., Hendriks, M., & Schmidt, H. G. (2003). The
efficiency of multimedia learning into old age. British Journal of Educational Psychology, 73(4), 489-505.
Gibson, J. J. (1962). Observations on active touch. Psychological Review, 69(6), 477. Glenberg, A. M., Gutierrez, T., Levin, J. R., Japuntich, S., & Kaschak, M. P. (2004).
Activity and Imagined Activity Can Enhance Young Children's Reading Comprehension. Journal of Educational Psychology, 96(3), 424-436.
Goldin-Meadow, S. (2005). Hearing gesture: How our hands help us think. Cambridge,
MA: Harvard University Press.
Goldschmidt, G. (1990). Linkography: assessing design productivity. Paper presented at the Cyberbetics and System'90, Proceedings of the Tenth European Meeting on Cybernetics and Systems Research.
Goldschmidt, G. (1991). The dialectics of sketching. Creativity Research Journal, 4(2),
123-143. Goldschmidt, G. (1992). Criteria for design evaluation: a process-oriented paradigm.
Evaluating and predicting design performance, 67-79. New York: Wiley. Goldschmidt, G. (1995). The designer as a team of one. Design studies, 16(2), 189-209. Goldschmidt, G. (2014). Linkography: unfolding the design process: Cambridge MA:
MIT Press.
Goldschmidt, G., & Tatsa, D. (2005). How good are good ideas? Correlates of design creativity. Design Studies, 26(6), 593-611.
Greenbaum, P. (1992). The lawnmower man. Film and video, 9(3), 58-62.

164
Grier, R., Thiruvengada, H., Ellis, S., Havig, P., Hale, K., & Hollands, J. (2012). Augmented Reality–Implications toward Virtual Reality, Human Perception and Performance. Proceedings of the Human Factors and Ergonomics Society Annual Meeting.
Gruber, H. E. (1989). Creativity and Human Survival. In D. B. Wallace and H. E. Gruber
(Eds.), Creative people at work: Twelve cognitive case studies. New York: Oxford University Press.
Guilford, J. P. (1968). Intelligence, creativity, and their educational implications: San Diego: RR Knapp.
Haapalainen, E., Kim, S., Forlizzi, J. F., & Dey, A. K. (2010). Psycho-physiological
measures for assessing cognitive load. Proceedings of the 12th ACM international conference on Ubiquitous computing.
Haniff, D. J., & Baber, C. (2003). User evaluation of augmented reality systems. Paper presented at the Information Visualization, 2003. IV 2003. Proceedings. Seventh International Conference.
Harnad, S. (2006). Creativity: method or magic? Hungarian Studies, 20(1), 163-177. Hart, S. G. (2006). NASA-task load index (NASA-TLX); 20 years later. Proceedings of
the human factors and ergonomics society annual meeting. Hart, S. G., & Staveland, L. E. (1988). Development of NASA-TLX (Task Load Index):
Results of empirical and theoretical research. Advances in Psychology, 52, 139-183.
Hausman, C. R. (1964). Spontaneity. International Philosophical Quarterly, 4(1), 20-47.
Heeter, C. (1991). The look and feel of direct manipulation. HYPERNEXUS: Journal of Hypermedia and Multimedia Studies Retrieved July 7, 2015 from http://www.myholler.com/dai427/directmanipulation.pdf
Hennessey, B. A., & Amabile, T. M. (1998). Reality, intrinsic motivation, and creativity. American Psychologist, 53, 674–675.
Hillier, B., Musgrove, J., & O'Sullivan, P. (1972). Knowledge and design. Environmental
Design: Research and Practice, 2, 3-1.
Hoonakker, P., Carayon, P., Gurses, A. P., Brown, R., Khunlertkit, A., McGuire, K., & Walker, J. M. (2011). Measuring workload of ICU nurses with a questionnaire survey: the NASA task load index (TLX). IIE transactions on healthcare systems engineering, 1(2), 131-143.

165
Hornecker, E., & Buur, J. (2006). Getting a grip on tangible interaction: a framework on physical space and social interaction. In Proceedings of the SIGCHI conference on Human Factors in computing systems, ACM.
Howard, T. J., Culley, S. J., & Dekoninck, E. (2008). Describing the creative design
process by the integration of engineering design and cognitive psychology literature. Design Studies, 29(2), 160-180.
Howe, R. P. (1992). Uncovering the creative dimensions of computer‐graphic design products. Creativity Research Journal, 5(3), 233-243.
Huang, H.-M., Rauch, U., & Liaw, S.-S. (2010). Investigating learners’ attitudes toward
virtual reality learning environments: Based on a constructivist approach. Computers & Education, 55(3), 1171-1182.
Huang, W., Alem, L., & Livingston, M. (2012). Human factors in augmented reality environments. New York: Springer Science & Business Media.
Hugues, O., Fuchs, P., & Nannipieri, O. (2011). New augmented reality taxonomy:
Technologies and features of augmented environment Handbook of augmented reality (pp. 47-63), New York: Springer.
Ibáñez, M. B., Di Serio, Á., Villarán, D., & Kloos, C. D. (2014). Experimenting with
electromagnetism using augmented reality: Impact on flow student experience and educational effectiveness. Computers & Education, 71, 1-13.
Igbaria, M. (1993). User acceptance of microcomputer technology: an empirical test.
Omega, 21(1), 73-90. Igbaria, M., Schiffman, S. J., & Wieckowski, T. J. (1994). The respective roles of
perceived usefulness and perceived fun in the acceptance of microcomputer technology. Behaviour & Information Technology, 13(6), 349-361.
Isham, D. D. (1997). Developing a computerized interactive visualization assessment. The Journal of Computer-Aided Environmental Design and Education 3(1). Online. Scholarly Communications Project, University Libraries, Virginia Tech. Retrieved July 7, 2015 from: http://scholar.lib.vt.edu/ejournals/JCAEDE/v3n1/
Ishii, H. (2007). Tangible user interfaces. In A. Sears & J.A. Jacko (Eds.), The human-computer interaction handbook. Fundamentals, evolving technologies, and emerging applications (pp. 469–487). Hillsdale, NJ: Lawrence Erlbaum Associates.
Ishii, H., Ratti, C., Piper, B., Wang, Y., Biderman, A., & Ben-Joseph, E. (2004). Bringing clay and sand into digital design—continuous tangible user interfaces. BT Technology Journal, 22(4), 287-299.

166
Ishii, H., & Ullmer, B. (1997). Tangible bits: towards seamless interfaces between people, bits and atoms. Proceedings of the ACM SIGCHI Conference on Human factors in computing systems, ACM.
Jacobson, L. (1993). Welcome to the virtual world. In: Richard Swadley (Ed.). On the
cutting edge of technology (69–79). Carmel, IN: Sams Jahn, G., Oehme, A., Krems, J. F., & Gelau, C. (2005). Peripheral detection as a
workload measure in driving: Effects of traffic complexity and route guidance system use in a driving study. Transportation Research Part F: Traffic Psychology and Behaviour, 8(3), 255-275.
James, W. B., & Gardner, D. L. (1995). Learning styles: Implications for distance
learning. New Directions for Adult and Continuing Education, 1995(67), 19-31.
Jang, S., Jyung, R., & Black, J. (2007). How direct interaction in a virtual reality program aids in developing an internal representation of a complex 3-d structure. In C. Montgomerie & J. Seale (Eds.), In Proceedings of world conference on educational multimedia, hypermedia and telecommunications 2007 (pp. 4214–4218). Vancouver, Canada: AACE.
Jansson, D. G., & Smith, S. M. (1991). Design fixation. Design Studies, 12(1), 3-11. Jarusirisawad, S., Hosokawa, T., & Saito, H. (2010). Diminished reality using plane-
sweep algorithm with weakly-calibrated cameras. Progress in Informatics, 7, 11-20.
Jeon, S., Shim, H., & Kim, G. J. (2006). Viewpoint Usability for Desktop Augmented Reality. IJVR, 5(3), 33-39.
Jiang, H., & Yen, C. (2009). Protocol Analysis in Design Research: A Review, in
"Design | Rigor & Relevance", International Association of Societies of Design Research (IASDR) 2009 Conference, Seoul, Korea, Oct 18-22.
Kablan, Z., & Erden, M. (2008). Instructional efficiency of integrated and separated text with animated presentations in computer-based science instruction. Computers & Education, 51(2), 660-668.
Kan, J. W., Bilda, Z., & Gero, J. S. (2006). Comparing entropy measures of idea links in
design protocols Design Computing and Cognition’06 (pp. 265-284). Newyor, NY: Springer.
Kan, J. W., Bilda, Z., & Gero, J. S. (2007). Comparing entropy measures of idea links in design protocols: Linkography entropy measurement and analysis of differently conditioned design sessions. AI EDAM: Artificial Intelligence for Engineering Design, Analysis, and Manufacturing, 21(04), 367-377.

167
Kan, J. W., & Gero, J. S. (2005). Design behaviour measurement by quantifying linkography in protocol studies of designing. HumanBehaviour in Designing, 5, 47-58.
Kan, J. W., & Gero, J. S. (2007). Can an objective measurement of design protocols reflect the quality of a design outcome. Paper presented at the International Conference On Engineering Design.
Kan, J. W., & Gero, J. S. (2008). Acquiring information from linkography in protocol
studies of designing. Design Studies, 29(4), 315-337.
Kan, J. W., & Gero, J. S. (2009). Using the FBS ontology to capture semantic design information in design protocol studies. in J. McDonnell & P. Lloyd (Eds.) About: Designing. Analysing design meetings (pp. 213–229). CRC Press.
Kan, W., & Gero, J. S. (2005). Can entropy indicate the richness of idea generation in
team designing. CAADRIA05, 1, 451-457.
Kassim, H. (2013). The relationship between learning styles, creative thinking performance and multimedia learning materials. Procedia-Social and Behavioral Sciences, 97, 229-237.
Kastens, K. A., Agrawal, S., & Liben, L. S. (2008). Research methodologies in science
education: The role of gestures in geoscience teaching and learning. Journal of Geoscience Education, 56(4), 362-368.
Kaufmann, H. (2003). Collaborative augmented reality in education. Institute of Software Technology and Interactive Systems, Vienna University of Technology.
Kaufmann, H., & Schmalstieg, D. (2003). Mathematics and geometry education with
collaborative augmented reality. Computers & Graphics, 27(3), 339-345.
Keefe, J. (1979). Learning style: An overview. NASSP's Student learning styles: Diagnosing and proscribing programs (pp. 1-17). Reston, VA. National Association of Secondary School Principle. Retrieved July 7, 2015, from http://www.nwlink.com/~donclark/hrd/styles.html#sthash.SbepFXmt.dpuf
Keil, J. M. (1987). The creative corporation. Dow Jones-Irwin, Homewood, IL.
Kershaw, T. C., Hölttä-Otto, K., & Lee, Y. S. (2011). The effect of prototyping and critical feedback on fixation in engineering design. Boston, MA: CogSci.
Kim, M., & Maher, M. (2005). Comparison of designers using a tangible user interface &
graphical user interface and impact on spatial cognition. In Proceedings of International Workshop on Human Behaviour in Designing, Key Centre of Design Computing and Cognition, pp. 81–94. University of Sydney, Australia.

168
Kim, M. J., & Cho, M. E. (2014). Studying children's tactile problem-solving in a digital environment. Thinking Skills and Creativity, 12, 1-13.
Kim, M. J., & Maher, M. L. (2008). The impact of tangible user interfaces on spatial
cognition during collaborative design. Design Studies, 29(3), 222-253.
Kirschner, P. A. (2001). Using integrated electronic environments for collaborative teaching/learning. Learning and Instruction, 10, 1-9.
Kirschner, P. A. (2002). Cognitive load theory: Implications of cognitive load theory on
the design of learning. Learning and Instruction, 12(1), 1-10. Kirsh, D. (2013). Embodied cognition and the magical future of interaction design. In P.
Marshall, A. N. Antle, E. v.d. Hoven, & Y. Rogers (Eds.), The theory and practice of embodied interaction in HCI and interaction design [Special issue]. ACM Transactions on Human–Computer Interaction, 20(1), 3:1-30.
Kirsh, D., & Maglio, P. (1994). On distinguishing epistemic from pragmatic action. Cognitive Science, 18(4), 513-549.
Klatzky, R. L., Wu, B., Shelton, D., & Stetten, G. (2008). Effectiveness of augmented-
reality visualization versus cognitive mediation for learning actions in near space. ACM Transactions on Applied Perception (TAP), 5(1), 1-23.
Klemmer, S. R., Hartmann, B., & Takayama, L. (2006). How bodies matter: five themes
for interaction design. Proceedings of the 6th conference on Designing Interactive systems, ACM.
Klingner, J. M. (2010). Measuring Cognitive Load During Visual Tasks by Combining
Pupillometry and Eye Tracking. (Doctoral dissertation, Stanford University, Department of Computer Science).
Koestner, R., Ryan, R. M., Bernieri, F., & Holt, K. (1984). Setting limits on children's
behavior: The differential effects of controlling vs. informational styles on intrinsic motivation and creativity. Journal of Personality, 52(3), 233-248.
Kohn, N., & Smith, S. M. (2009). Partly versus completely out of your mind: Effects of
incubation and distraction on resolving fixation. The Journal of Creative Behavior, 43(2), 102-118.
Kolb, D. A. (1984). Experiential learning: Experience as the source of learning and
development. Englewood Cliffs, NJ: Prentice-Hall. Kounios, J., & Beeman, M. (2009). The Aha! Moment the cognitive neuroscience of
insight. Current Directions in Psychological Science, 18(4), 210-216.
169
Kozak, M., Sternglanz, R. W., Viswanathan, U., & Wegner, D. M. (2008). The role of thought suppression in building mental blocks. Consciousness and Cognition, 17(4), 1123-1130.
Kozhevnikov, M., & Gurlitt, J. (2013). Immersive and non-immersive virtual reality
system to learn relative motion concepts. Paper presented at the Interdisciplinary Engineering Design Education Conference (IEDEC), 2013 3rd.
Kreitler, S., & Casakin, H. (2009). Motivation for creativity in design students. Creativity Research Journal, 21(2-3), 282-293.
Krueger, M. W. (1991). Artificial reality II. Reading, MA: Addison-Wesley. Kuusela, H., & Pallab, P. (2000). A comparison of concurrent and retrospective verbal
protocol analysis. The American Journal of Psychology, 113(3), 387. Kvan, T., & Jia, Y. (2005). Students' learning styles and their correlation with
performance in architectural design studio. Design Studies, 26(1), 19-34. Langenhan, C., Weber, M., Liwicki, M., Petzold, F., & Dengel, A. (2011). Sketch-based
methods for researching building layouts through the semantic fingerprint of architecture. In Proceedings of the CAADfutures 2011, Liege, 85–102.
Lau, W. W., Yuen, A. H., & Chan, A. (2015). Variable-Centered and Person-Centered
Approaches to Studying the VARK Learning Style Inventory New Media, Knowledge Practices and Multiliteracies (pp. 207-216). NY: Springer.
Lawson, A. E. (1983). Predicting science achievement: The role of developmental level,
disembedding ability, mental capacity, prior knowledge, and beliefs. Journal of Research in Science Teaching, 20(2), 117-129.
Lawson, B. R. (1972). Problem solving in architectural design. (Doctoral dissertation,
Aston University-UK). Lee, E. (2014). Factors for Creative Collaboration of Industrial Designers and Engineers.
디자인학연구, 27(4), 135-147. Leite, W. L., Svinicki, M., & Shi, Y. (2010). Attempted validation of the scores of the
VARK: Learning styles inventory with multitrait–multimethod confirmatory factor analysis models. Educational and Psychological Measurement, 70(2), 323-339.
Lim, Y.-K., Stolterman, E., & Tenenberg, J. (2008). The anatomy of prototypes:
Prototypes as filters, prototypes as manifestations of design ideas. ACM Transactions on Computer-Human Interaction (TOCHI), 15(2), 7.

170
Lindekens, J., Heylighen, A., & Neuckermans, H. (2003). Understanding architectural redesign. Paper presented at the 3rd International Postgraduate Research Conference in the Built and Human Environment.
Lindeman, R. W., & Noma, H. (2007). A classification scheme for multi-sensory
augmented reality. Proceedings of the 2007 ACM symposium on Virtual reality software and technology, ACM.
Linsey, J., Tseng, I., Fu, K., Cagan, J., Wood, K., & Schunn, C. (2010). A study of design
fixation, its mitigation and perception in engineering design faculty. Journal of Mechanical Design, 132(4), 1-12.
Lubart, T. I. (1999). Creativity across cultures. In R. J. Sternberg (Ed.), Creativity research handbook (pp. 339–350). Cambridge, England: Cambridge University Press.
Luchins, A. S., & Luchins, E. H. (1959). Rigidity of behavior: A variational approach to
the effect of Einstellung. Eugene, OR: University of Oregon Books. Lujan, H. L., & DiCarlo, S. E. (2006). First-year medical students prefer multiple
learning styles. Advances in Physiology Education, 30(1), 13-16.
Maglio, P. P., Wenger, M. J., & Copeland, A. M. (2008). Evidence for the role of self-priming in epistemic action: Expertise and the effective use of memory. Acta Psychologica, 127(1), 72-88.
Maier, N. R. (1931). Reasoning and learning. Psychological Review, 38(4), 332. Mann, S., & Nnlf, S. M. (1994). Mediated reality.
Marcos, C. L. (2011). New materiality: ideation, representation and digital fabrication. Marcy, V. (2001). Adult learning styles: How the VARK Learning Styles Inventory can
be used to improve student learning. Perspectives on Physician Assistant Education, 12(2), 117-120.
Martín-Gutiérrez, J., Luís Saorín, J., Contero, M., Alcañiz, M., Pérez-López, D. C., & Ortega, M. (2010). Design and validation of an augmented book for spatial abilities development in engineering students. Computers & Graphics, 34(1), 77-91.
Mc Neill, T., Gero, J. S., & Warren, J. (1998). Understanding conceptual electronic
design using protocol analysis. Research in Engineering Design, 10(3), 129-140. McAllister, K. (2010). The design process - making it relevantfor students. M. Ashraf,
Salama, Micheal J. Crosbie (Eds.), Archnet-IJAR, International Journal of Architectural Research, vol. 4 (2010), pp. 76–89 (July and November 2010).

171
McDonald, S., Edwards, H. M., & Zhao, T. (2012). Exploring think-alouds in usability testing: An international survey. Professional Communication, IEEE Transactions, 55(1), 2-19.
Medenica, Z., Kun, A. L., Paek, T., & Palinko, O. (2011). Augmented reality vs. street
views: a driving simulator study comparing two emerging navigation aids. In Proceedings of the 13th International Conference on Human Computer Interaction with Mobile Devices and Services.
Merrick, K., & Gu, N. (2011). Supporting collective intelligence for design in virtual worlds: A case study of Lego Universe. Proceedings of CAAD Futures 2011.
Mikropoulos, T. A. (2001). Brain activity on navigation in virtual environments. Journal of Educational Computing Research, 24(1), 1-12.
Milgram, P., & Colquhoun, H. (1999). A taxonomy of real and virtual world display
integration. In Y. Ohta & H. Tamura (Eds.), Mixed reality: Merging real and virtual worlds (pp. 5-28). New York: Springer.
Milgram, P., & Kishino, F. (1994). A taxonomy of mixed reality visual displays. IEICE
TRANSACTIONS on Information and Systems, 77(12), 1321-1329. Milgram, P., Takemura, H., Utsumi, A., & Kishino, F. (1995). Augmented reality: A class
of displays on the reality-virtuality continuum. Paper presented at the Photonics for Industrial Applications.
Millard, M. O., & Soylu, F. (2009). An embodied approach for engaged interaction in ubiquitous computing Human-Computer Interaction. Ambient, Ubiquitous and Intelligent Interaction (pp. 464-472). NY: Springer.
Mital, A., & Govindaraju, M. (1999). Is it possible to have a single measure for all work?
International Journal of Industrial Engineering Theory Applications and Practice, 6(3), 190-195.
Miyake, S. (2001). Multivariate workload evaluation combining physiological and
subjective measures. International Journal of Psychophysiology, 40(3), 233-238. Mizell, D. W., Jones, S. P., Slater, M., & Spanlang, B. (2002). Comparing immersive
virtual reality with other display modes for visualizing complex 3D geometry. University College London, technical report.
Moreno Grandas, D. P., Yang, M. C., Hernandez, A. A., Linsey, J. S., & Wood, K. L. (2014). A step beyond to overcome design fixation: A design-by-analogy approach. Paper presented at the Fifth International Conference on Design Computing and Cognition DCC14.

172
Morgan, D. N. (1953). Creativity today: A constructive analytic review of certain philosophical and psychological Work. Journal of Aesthetics and Art Criticism, 12, 1-24.
Morsella, E., & Krauss, R. M. (2004). The role of gestures in spatial working memory
and speech. The American Journal of Psychology, 411-424. Murty, P., & Purcell, T. (2003). Discovery methods of designers. Proceedings of the 5th
European Academy of Design Conference, Barcelona, Spain Retrieved July 7, 2015, from http://www.ub.edu/5ead/PDF/8/MurtyPurcell.pdf
Nguyen, L., & Shanks, G. (2007). Using protocol analysis to explore the creative requirements engineering process. Information Systems Foundations, 133.
Newland, P., Powell, J. A., & Creed, C. (1987). Understanding architectural designers' selective information handling. Design Studies, 8(1), 2-16.
Normand, J.-M., Servières, M., & Moreau, G. (2012). A new typology of augmented
reality applications. Proceedings of the 3rd Augmented Human International Conference.
Normand, J., Servieres, M., & Moreau, G. (2012). Typology of augmented reality
applications based on their tracking requirements. Paper presented at the Location Awareness for Mixed and Dual Reality. LAMDa workshop. Lisbon, Portugal.
Ogot, M., & Okudan, G. E. (2007). Systematic creativity methods in engineering
education: a learning styles perspective. International Journal of Engineering Education, 22(3), 566-576.
Pan, Z., Cheok, A. D., Yang, H., Zhu, J., & Shi, J. (2006). Virtual reality and mixed
reality for virtual learning environments. Computers & Graphics, 30(1), 20-28. Pasaréti, O., Hajdú, H., Matuszka, T., Jámbori, A., Molnár, I., & Turcsányi-Szabó, M.
(2011). Augmented Reality in education. In Proceedings of INFODIDACT 2011 Informatika Szakmódszertani Konferencia.
Pearsall, M. J., Ellis, A. P., & Evans, J. M. (2008). Unlocking the effects of gender
faultlines on team creativity: Is activation the key? Journal of Applied Psychology, 93(1), 225.
Perkins, D. (1984). What else but genius. Paper presented at the Six dimensions of the
creative mind. Paper presented for the symposium on creativity in science, Los Alamos National Laboratory, Los Alamos, NM, USA.

173
Poincaré, H. (1913). Mathematical creation. The foundations of science, 1946. NY: Science Press.
Potur, A., & Barkul, O. (2007). Rethinking the entrance to architectural education: A
critical overview. Proceedings of the DesinTrain Congress, Amsterdam, The Netherlands.
Pourmohamadi, M., & Gero, J. S. (2011). Linkographer: An analysis tool to study design
protocols based on FBS coding scheme. In Proceedings of the 18th International Conference on Engineering Design (ICED 11), Impacting Society through Engineering Design, Vol. 2: Design Theory and Research Methodology, Lyngby/Copenhagen, Denmark.
Psotka, J. (2013). Educational games and virtual reality as disruptive technologies.
Journal of Educational Technology & Society, 16(2), 69-80. Purcell, A., Williams, P., Gero, J., & Colbron, B. (1993). Fixation effects: Do they exist
in design problem solving? Environment and Planning B, 20, 333-333. Purcell, A. T., & Gero, J. S. (1996). Design and other types of fixation. Design Studies,
17(4), 363-383.
Ramani, G. B., & Siegler, R. S. (2008). Promoting broad and stable improvements in low‐income children’s numerical knowledge through playing number board games. Child Development, 79(2), 375-394.
Rhodes, M. (1961). An analysis of creativity. Phi Delta Kappan, 42, 305-310. Rittel, H., & Webber, M. (1984). Planning Problems are Wicked Problems:
Developments in Design Methodology, Corss (Ed.), Chichester: John Wiley & Sons.
Robertson, B. F., Walther, J., & Radcliffe, D. F. (2007). Creativity and the use of CAD
tools: Lessons for engineering design education from industry. Journal of Mechanical Design, 129(7), 753-760.
Robertson, G. G., Card, S. K., & Mackinlay, J. D. (1993). Three views of virtual reality:
nonimmersive virtual reality. Computer, 26(2), 81-83. Rosenman, M. A., & Gero, J. S. (1993). Creativity in Design Using a Prototype
Approach. In J. S. Gero, and M. L. Maher (Eds.), Modeling Creativity and Knowledge-Based Creative Design (pp. 119–145). Lawrence Erlbaum, Hillsdale, NJ, 1992.

174
Runco, M. A. (2005). Motivation, competence, and creativity. In A. J. Elliot & C. S. Dweck (Eds.), Handbook of competence and motivation (pp. 609–623). New York: Guilford
Russo, J. E., Johnson, E. J., & Stephens, D. L. (1989). The validity of verbal protocols.
Memory & Cognition, 17(6), 759-769. Sachs, A. (1999). Stuckness' in the design studio. Design Studies, 20(2), 195-209.
Schmutz, P., Heinz, S., Métrailler, Y., & Opwis, K. (2009). Cognitive load in ecommerce
applications: measurement and effects on user satisfaction. Advances in HumanComputer Interaction, 3, 1–3:9. Retrieved July 7, 2015, from http://www.hindawi.com/journals/ahci/2009/121494.html
Schnabel, M. A. (2004). Architectural Design In Virtual Environments. The University of
Hong Kong. Segal, A. (2011). Do gestural interfaces promote thinking? Embodied interaction:
Congruent gestures and direct touch promote performance in math. (Doctoral Dissertation, Columbia University).
Seichter, H., & Schnabel, M. A. (2005, 2005). Digital and tangible sensation: An
augmented reality urban design studio. In Proceedings of the 10th International Conference on Computer Aided Architectural Design Research in Asia (CAADRIA 2005), pp. 193-202.
Shalley, C. E., Zhou, J., & Oldham, G. R. (2004). The effects of personal and contextual
characteristics on creativity: Where should we go from here? Journal of Management, 30(6), 933-958.
Shannon, C. (1948). A mathematical theory of communication, Bell System technical
Journal 27: 379-423 and 623–656. Mathematical Reviews (MathSciNet): MR10, 133e.
Sharlin, E., Watson, B., Kitamura, Y., Kishino, F., & Itoh, Y. (2004). On tangible user
interfaces, humans and spatiality. Personal and Ubiquitous Computing, 8(5), 338-346.
Shelden, D. R. (2002). Digital surface representation and the constructibility of Gehry's
architecture. (Doctoal Dissertation, Massachusetts Institute of Technology). Shelton, B. E. (2002). Augmented reality and education: Current projects and the
potential for classroom learning. New Horizons for Learning, 9(1), 1-5.

175
Shirazi, A., & Behzadan, A. H. (2015). Content Delivery Using Augmented Reality to Enhance Students’ Performance in a Building Design and Assembly Project. Advances in Engineering Education, Retrieved July 7, 2015, from http://advances.asee.org/wp-content/uploads/vol04/issue03/papers/AEE-15-Shirazi.pdf
Shneiderman, B. (1982). The future of interactive systems and the emergence of direct
manipulation†. Behaviour & Information Technology, 1(3), 237-256. Simon, H. A. (1973). Does scientific discovery have a logic? Philosophy of Science, 40,
471-480. Slevitch, L., Chandrasekera, T., Yang, J., & Chung, Y. (2015). Application of virtual
visualization techniques in understanding users’ perceptions of lodging interior environments. Paper presented at the Asia-Pacific Council on Hotel, Restaurant, and Institutional Education Conference, New Zealand.
Slijepcevic, N. (2013). The effect of augmented reality treatment on learning, cognitive
load, and spatial visualization abilities. (Doctoral Dissertation, University of Kentucky).
Smith, E. E., & Jonides, J. (1997). Working memory: A view from neuroimaging.
Cognitive Psychology, 33(1), 5-42. Smith, S. M., & Blankenship, S. E. (1989). Incubation effects. Bulletin of the
Psychonomic Society, 27(4), 311-314. Smith, S. M., & Blankenship, S. E. (1991). Incubation and the persistence of fixation in
problem solving. The American Journal of Psychology, 61-87. Stone, R. (2001). Virtual reality for interactive training: an industrial practitioner's
viewpoint. International Journal of Human-Computer Studies, 55(4), 699-711. Stouffs, R., Janssen, P., Roudavski, S., & Tunçer, B. (2013). Computer Vision and
Augmented Reality Technologies in Experimental Architectural Design Education at the AA. Paper presented at the Conference on Computer-Aided Architectural Design Research in Asia (CAADRIA 2013).
Suomela, R., & Lehikoinen, J. (2004). Taxonomy for visualizing location-based
information. Virtual Reality, 8(2), 71-82.
Suwa, M., & Tversky, B. (1997). What do architects and students perceive in their design sketches? A protocol analysis. Design Studies, 18(4), 385-403.
Sweller, J. (1988). Cognitive load during problem solving: Effects on learning. Cognitive
Science, 12(2), 257-285.

176
Sweller, J. (1994). Cognitive load theory, learning difficulty, and instructional design.
Learning and Instruction, 4(4), 295-312. Tang, A., Biocca, F., & Lim, L. (2004). Comparing differences in presence during social
interaction in augmented reality versus virtual reality environments: An exploratory study. Proceedings of PRESENCE, 204-208.
Tang, A., Owen, C., Biocca, F., & Mou, W. (2003). Comparative effectiveness of
augmented reality in object assembly. Proceedings of the SIGCHI conference on Human factors in computing systems.
Tang, J. C. (1991). Findings from observational studies of collaborative work. International Journal of Man-machine Studies, 34(2), 143-160.
Taura, T., & Nagai, Y. (2010). Design creativity. London: Springer. Thelen, H. A. (1954). Dynamics of groups at work. Chicago: University of Chicago. Thurman, R. A., & Mattoon, J. S. (1994). Virtual Reality: Toward Fundamental
Improvements in Simulation-Based Training. Educational Technology, 34(8), 56-64.
Thurstone, L. L. (1938). Primary mental abilities. Psychometric Monographs. Chicago:
Unviersity of Chicago Press. Toennis, M., & Plecher, D. A. (2011). Presentation principles in augmented reality-
classification and categorization guidelines. Institut fur Informatik der Technischen UniversitÂat MÂunchen.
Toh, C. A., Miller, S. R., & Kremer, G. E. O. (2012). The impact of product dissection
activities on the novelty of design outcomes. Paper presented at the ASME 2012 International Design Engineering Technical Conferences and Computers and Information in Engineering Conference.
Torrance, E. P. (1966). Torrance Test of Creative Thinking: Figural Form A. Princeton,
NJ: Personnel Press. Torrance, E. P. (1988). The nature of creativity as manifest in its testing. In R. J.
Sternberg (Ed.), The nature of creativity (pp. 43-75). New York: Cambridge University Press.
Tracy, J. P., & Albers, M. J. (2006). Measuring cognitive load to test the usability of web sites. Paper presented at the Annual Conference-society for technical communication.

177
Trickett, S., & Trafton, J. G. (2007). A primer on verbal protocol analysis. Handbook of virtual environment training. Westport, CT: Praeger Security International.
Tsai, K. C., & Shirley, M. (2013). Exploratory Examination of Relationships between
Learning Styles and Creative Thinking in Math Students. International Journal of Academic Research in Business and Social Sciences, 3(8), 506-519.
Ullmer, B., & Ishii, H. (2000). Emerging frameworks for tangible user interfaces. IBM
Systems Journal, 39(3.4), 915-931. Veisz, D., Namouz, E. Z., Joshi, S., & Summers, J. D. (2012). Computer-aided design
versus sketching: An exploratory case study. Artificial Intelligence for Engineering Design, Analysis and Manufacturing, 26(03), 317-335.
Venkatesh, V. (2000). Determinants of perceived ease of use: Integrating control,
intrinsic motivation, and emotion into the technology acceptance model. Information Systems Research, 11(4), 342-365.
Venkatesh, V., & Davis, F. D. (2000). A theoretical extension of the technology
acceptance model: Four longitudinal field studies. Management Science, 46(2), 186-204.
Venkatesh, V., & Speier, C. (2000). Creating an effective training environment for
enhancing telework. International Journal of Human-Computer Studies, 52(6), 991-1005.
Viswanathan, V., & Linsey, J. (2009). Enhancing student innovation: Physical models in
the idea generation process. Paper presented at the Frontiers in Education Conference, 2009. FIE'09. 39th IEEE.
Viswanathan, V., & Linsey, J. (2011). Design fixation in physical modeling: an
investigation on the role of sunk cost. Paper presented at the ASME 2011 International Design Engineering Technical Conferences and Computers and Information in Engineering Conference.
Viswanathan, V. K., & Linsey, J. S. (2013). Design fixation and its mitigation: a study on
the role of expertise. Journal of Mechanical Design, 135(5), 051008. Vitruvius Pollio, M. (1960). Vitruvius: The Ten Books on Architecture.
Wallas, G. (1926). The art of thought. In P.E. Vernon (Ed. 1970) Creativity (pp. 91-97). Middlesex, England: Penguin.
Wang, X. (2007). Mutually augmented virtual environments for architectural design and
collaboration. Computer-Aided Architectural Design Futures (CAADFutures) 2007, 17-29.

178
Wang, X., & Dunston, P. S. (2006). Groupware concepts for augmented reality mediated human-to-human collaboration. Proceedings of the 23rd Joint International Conference on Computing and Decision Making in Civil and Building Engineering.
Wehrwein, E. A., Lujan, H. L., & DiCarlo, S. E. (2007). Gender differences in learning
style preferences among undergraduate physiology students. Advances in Physiology Education, 31(2), 153-157.
Whyte, J. (2003). Virtual Reality and the Built Environment. Presence: Teleoperators
and Virtual Environments, 12(5), 550-552. Whyte, J., Bouchlaghem, N., Thorpe, A., & McCaffer, R. (2000). From CAD to virtual
reality: modelling approaches, data exchange and interactive 3D building design tools. Automation in Construction, 10(1), 43-55.
Wilson, M. (2002). Six views of embodied cognition. Psychonomic Bulletin & Review, 9(4), 625-636.
Windell, D., & Wiebe, E. (2007). Measuring cognitive load in multimedia instruction: A
comparison of two instruments. Paper presented at the Annual meeting of the American Educational Research Association.
Wolf, C. G., & Rhyne, J. R. (1987). A taxonomic approach to understanding direct
manipulation. In Proceedings of the Human Factors and Ergonomics Society 31st Annual Meeting.
Wolfradt, U., & Pretz, J. E. (2001). Individual differences in creativity: Personality, story
writing, and hobbies. European Journal of Personality, 15(4), 297-310. Wu, H.-K., Lee, S. W.-Y., Chang, H.-Y., & Liang, J.-C. (2013). Current status,
opportunities and challenges of augmented reality in education. Computers & Education, 62, 41-49.
Xiao, Y., Wang, Z., Wang, M., & Lan, Y. (2005). [The appraisal of reliability and
validity of subjective workload assessment technique and NASA-task load index]. Zhonghua lao dong wei sheng zhi ye bing za zhi= Zhonghua laodong weisheng zhiyebing zazhi= Chinese journal of industrial hygiene and occupational diseases, 23(3), 178-181.
Youmans, R. J. (2007). Reducing the effects of fixation in creative design. (Doctoral
Dissertation, University of Chicago). Youmans, R. J. (2011). The effects of physical prototyping and group work on the
reduction of design fixation. Design Studies, 32(2), 115-138.

VA
179
Appendix
ARK Questio
A
onnaire

180

181
Appendix
NASA TL
B
LX

182
Appendix C
Technology Acceptance Model Questionnaire
1. It was easy to understand the instructions
Strongly Disagree Neither Strongly Agree
1 2 3 4 5 6 7
2. It took a long time to learn to use the system
Strongly Disagree Neither Strongly Agree
1 2 3 4 5 6 7
3. This system is difficult to use
Strongly Disagree Neither Strongly Agree
1 2 3 4 5 6 7
4. I felt in control over the system
Strongly Disagree Neither Strongly Agree
1 2 3 4 5 6 7
5. My interaction with the system is clear and understandable
Strongly Disagree Neither Strongly Agree
1 2 3 4 5 6 7
6. Interacting with the system does not require a lot of my mental effort
Strongly Disagree Neither Strongly Agree
1 2 3 4 5 6 7
7. I find the system to be easy to us
Strongly Disagree Neither Strongly Agree
1 2 3 4 5 6 7

183
8. This system is fun to use
Strongly Disagree Neither Strongly Agree
1 2 3 4 5 6 7
9. I find it easy to get the system to do what I want it to do
Strongly Disagree Neither Strongly Agree
1 2 3 4 5 6 7
10. I would like to use this type of system to receive instructions in my profession.
Strongly Disagree Neither Strongly Agree
1 2 3 4 5 6 7
11. I would like to use this system in other contexts than my profession.
Strongly Disagree Neither Strongly Agree
1 2 3 4 5 6 7
12. I feel confident that the system is giving me correct instructions.
Strongly Disagree Neither Strongly Agree
1 2 3 4 5 6 7
13. I would prefer to receive instructions from a person (teacher/tutor)
Strongly Disagree Neither Strongly Agree
1 2 3 4 5 6 7
14. The system does not have any apparent shortcomings
Strongly Disagree Neither Strongly Agree
1 2 3 4 5 6 7
15. I experienced nausea, dizziness or discomfort while using the system
Strongly Disagree Neither Strongly Agree
1 2 3 4 5 6 7

184
16. I would have difficulty explaining why using the system may or may not be beneficial.
Strongly Disagree Neither Strongly Agree
1 2 3 4 5 6 7

185
Appendix D

186
Appendix E
Recruiting Letter
Dear students, We are currently seeking volunteers to take part in a design research project which will take place during November 2014-January 2015. At the moment we require thirty volunteers and any additional volunteers will be kept on file for future studies. You will be compensated with $25 for your participation in this study
In this study you will complete three work sessions. The first session will introduce you to the AR/VR
interface including various techniques for moving within and interacting with different icons, after which they
will be taught to create basic design interventions and to blend different skills in the interface. You will also
answer a basic demographic survey and a learner typology questionnaire. In the second session, you will
work on an interior design of a small office space. At the end of the session, you should provide an idea of
the 3-dimensional form for the small office space and a schematic layout. As and when you are doing the
task you will think-aloud about the conceptual process of design. In the third session, you will be asked to
express your experience in assessing the capabilities and limitations of the AR and VR tools through a
survey.
The design project itself will be a short span project (lasting about one hour) in which we will test digital technology and its impact on design. We will be trying to examine the impact of AR and VR tools in design creativity. Your design process and products will be documented in video by our research assistant and we will analyze it later on. We will also analyze your brain wave patterns using a small brain cap which is noninvasive. From a teaching perspective, as instructors, we will be able to better understand your interaction with the digital media and how technology helps or disrupts the design process. From a learning perspective, as students, you will have the opportunity to interact with some of the state-of-the-art technology. You don’t have to be technically savvy to do this project but some basic software skills will be helpful. This participation is purely on voluntary basis. If you are interested to learn further or explore this option please contact Tilanka Chandrasekera Tilanka Chandrasekera
429D, Human Sciences
405-744-9524

187
Appendix F
Informed Consent Form for Social Science Research
Title of Project: Using Augmented Reality and Virtual Reality in Design education
Principal Investigator: Tilanka Chandrasekera
429D, Human Sciences
405-744-9524
Student Investigator: Noriel Grey
1. Purpose of the Study: The purpose of this research is to explore the efficacy of using
digital tools in the design process. Specifically the study will examine how Augmented
Reality (AR) and Virtual Reality (VR) tools are used by design students in the design
process
2. Procedures to be followed: The study will consist of three work sessions, which are
elaborated below.
a. Session-1: Training
The first session will introduce you to the AR/VR interface including various techniques
for moving within and interacting with different icons, after which they will be taught to

188
create basic design interventions and to blend different skills in the interface. You will
also answer a basic demographic survey and a learner typology questionnaire
b. Session-2: Design Task
In the second session, you will work on an interior design of a small office space. At the
end of the session, you should provide an idea of the 3-dimensional form for the small
office space and a schematic layout. As and when you are doing the task you will think-
aloud about the conceptual process of design. While in the design task, you will be fitted
with a headset that measures brainwave activity while you are completing your assigned
task.
c. Session-3: Conclusion
In the third session, you will be asked to express your experience in assessing the
capabilities and limitations of the AR and VR tools through a survey.
3. Discomforts and Risks: There are no risks in participating in this research beyond
those experienced in everyday life.
4. Duration/Time: approximated 1 hour.
5. Benefits and compensation: You will be compensated $25.00 for participating in this
study. Additionally, you will benefit by receiving free training on state of the art design
tools similar to ones used in professional firms. You also gain valuable practical
experience as part of the training during your participation.

189
6. Statement of Confidentiality: Your interactions while using the AR/VR tools will be
electronically recorded directly from the computer screen. This recording will not include
any personal information and you are requested not to enter any personally identifiable
information on the computer during the sessions. Your actions will be video recorded and
your voice will be audio recorded while designing. No personal information will be
collected and only the researchers will have access to the information collected. Your
participation in this research is therefore confidential. The data will be stored and secured
at 429D, Human Sciences in a locked and password-protected file. The Oklahoma State
University’s Institutional Review Board may review records related to this research
study.
7. Right to Ask Questions: Please contact Tilanka Chandrasekera 405-744-9524 with
questions about this research. If you have any questions, concerns, problems about your
rights as a research participant, please contact the Oklahoma State University’s Review
Board. Attn: Dr. Hugh Crethar, IRB Chair, 219 Cordell North, 405-744-3377, or
[email protected]. Questions about research procedures can be answered by the research
team.
8. Voluntary Participation: Your decision to be in this research is voluntary. You can
stop at any time. You do not have to answer any questions you do not want to answer.
Refusal to take part in or withdrawing from this study will involve no penalty. You must
be 18 years of age or older to consent to take part in this research study. You will be
given a copy of this consent form for your records.

190
Appendix G
Demographic Survey
We greatly appreciate your taking the time to complete this simple questionnaire. All
answers are confidential and you will not be able to be identified from the information
you provide.
Please mark the appropriate answer by either underlining or circling the correct answer.
Some questions may ask you to mark all answers that apply.
Section - One
1. What is your gender?
A. Male
B. Female
2. What is your race and ethnicity background?
A. White
B. Black or African American
C. American Indian and Alaska Native
D. Indian or South Asian
E. Asian
F. Native Hawaiian and other Pacific Islanders
G. Hispanic, Latino or Spanish origin
H. Other (Please specify: )

191
3. How old are you?
A. 18-25
B. 25-30
C. 30-35
D. Above 35
4. Where is your home town?
5. What’s your academic level?
A. Freshman
B. Sophomore
C. Junior
D. Senior
For question 6-7: Note- the more frequent the activity the higher the numerical rating. Please circle the numerical that you feel most correctly correlates with the value that you assign.
6. I play/have played, video/computer games…
Not at all Moderately Frequently
1 2 3 4 5 6 7
7. I use computers …
Not very much Moderately Frequently
1 2 3 4 5 6 7
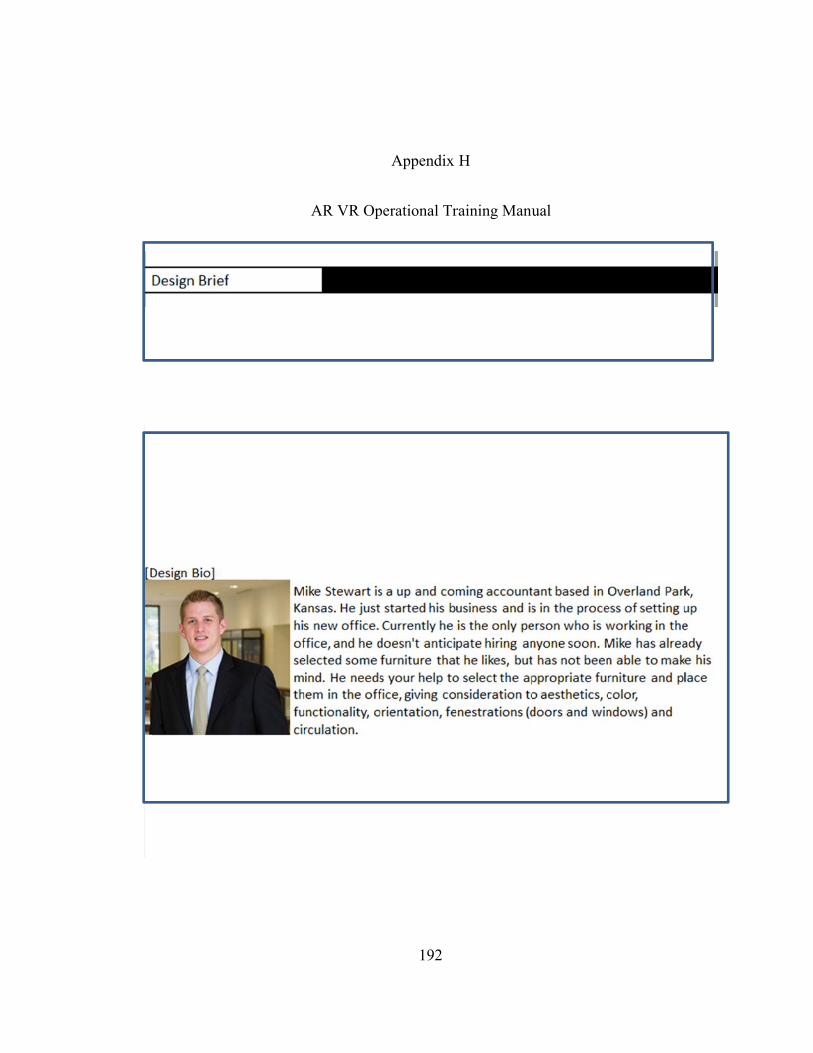
AR VR Op
192
Appendix
perational Tr
H
raining Manuual

193

194

195

196

197
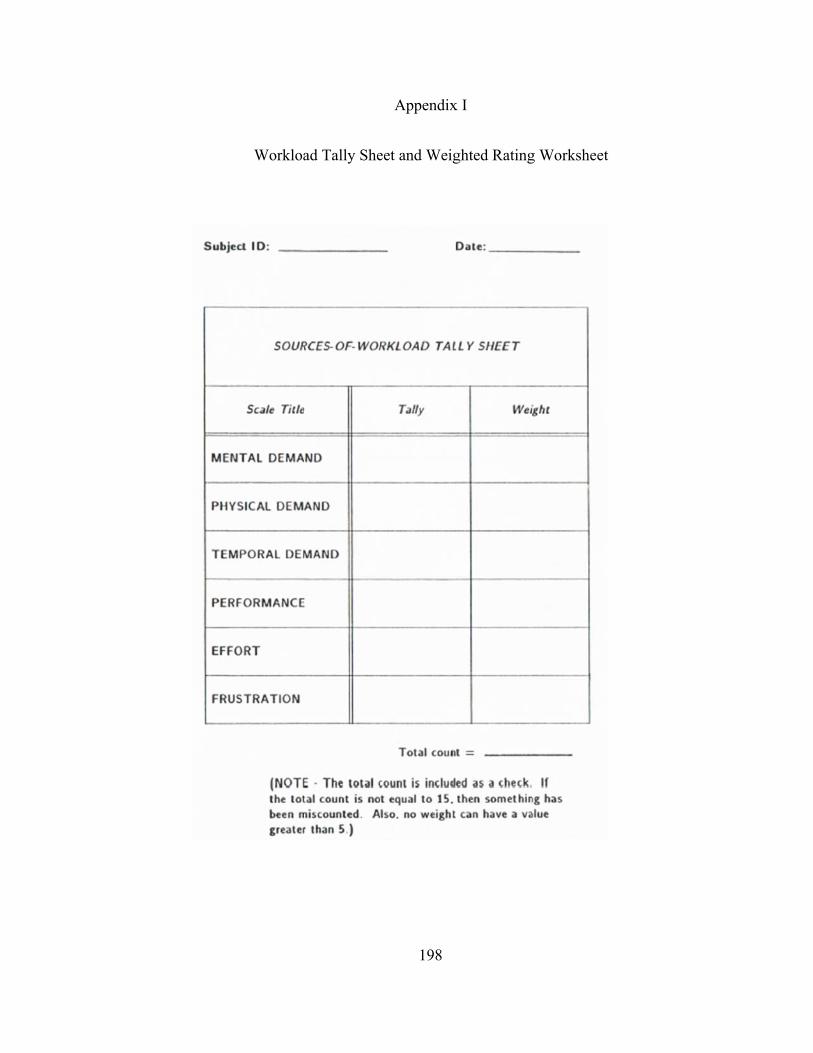
Workloaad Tally She
198
Appendix
eet and Weig
x I
ghted Ratingg Worksheet

199
200
VITA
Tilanka Chandrasekera is a licensed Architect who has practiced Architecture in Sri
Lanka. He has a Bachelors and Masters degrees in Architecture (RIBA Accredited) from
the University of Moratuwa, Sri Lanka. He has worked as an individual consultant as
well as in several different Architectural firms in Sri Lanka. As an Architect, Tilanka has
worked in projects ranging from Highrise designs, Wild life parks, Zoo's, Hotels and
personalized housing.
He has taught in the Department of Architectural studies at the University of
Missouri-Columbia and has also been a visiting lecturer and a design tutor at the
University of Moratuwa, Sri Lanka. He has been working as an Assistant Professor at the
Department of Design, Housing and Merchandising at Oklahoma State University since
August 2013.
With regard to research, Tilanka is interested in the nexus of Digital Media and
Design education. Some of his current research interests include Application of Tangible
User Interfaces in Design Education, Application of digital technology for geriatric
design practices (Gerontechnology), Design Computing and Cognition, Navigation and
wayfinding research in interior environments.
Tilanka has won numerous awards for his teaching and research including The
Council for Interior Design Accreditation (CIDA) Innovative Education Award- 2013
and Architecture Research Centers Consortium (ARCC) King Student Medal for
Excellence in Architectural & Environmental Design Research-2012.


![State of Augmented Reality, Virtual Reality and Mixed Reality · State of Augmented Reality, Virtual Reality and Mixed Reality [Microsoft Hololen] [Ready Player One] Augmented Reality](https://img.dokumen.tips/doc/110x75/5f82ab6da2d89130b90d78c7/state-of-augmented-reality-virtual-reality-and-mixed-reality-state-of-augmented.jpg)