Embed Size (px)
Citation preview

The Effects of Work Load and Heart Rateon Filling of The Isolated Right Ventricle
of The Dog HeartBy N. M. BUCKLEY, M.D., ERIC OGDEN, M.R.C.S., L.R.C.P. AND DONALD S. LINTON, JR., M.D.
Ventricular filling in the isolated right ventricle was studied. Mechanical impedance of the ven-tricle was estimated from simultaneous ventricular pressure and inflow nieiisurements. Changes inwork load or heart rate were accompanied by l'eproducible and characteristic changes in impedanceand intraventricular pressure-curve contour. These were discussed in relation to changes in ven-tricular relaxation, elasticity, and viscosity. The right ventricle fills according to a pattern fixedby hemodynamic factors which affect the mechanical properties of the ventricle. The physicalstate of the ventricle early in diastole appeiirs to be a determinant of stroke output.
THE dependence of ventricular strokeoutput upon ventricular filling has beengenerally recognized since Starling's
early observations.1 One of the interestingquestions implicit in subsequent studies is thenature of the relationship between rate andextent of filling and the physical properties ofthe ventricle in diastole.2"8
Preliminary experiments with the Starlingheart-lung preparation in our laboratory hadreminded us that (a) the ventricles maintain aconstant pattern of filling and emptying underconditions of fixed filling pressure, centralartery pressure, and heart rate; and, (b) suddenchanges in work load or heart rate resulted inimmediate changes in the pattern of filling andemptying, beginning with the next heartbeat.The reproducibility of behavior in the presenceof fixed external conditions, and the rapidityof adjustment to changes in external conditions,suggested that the physical properties of theventricle wall were involved. We thereforebegan an investigation of factors that affect therate and extent of ventricular filling.
In order to study these properties that might
From the Department of Physiology, Ohio StateUniversity, Columbus, O.
Supported bjr grunts from the Central Ohio HeartAssociation and the Xutional Heart Institute (grunt*H 1407) of the National Institutes of Health, U. S.Public Health Service.
A preliminary report of this work was presentedat a mooting of the American Physiological Societyat Atlantic City, X. J. in April, 1954.
Received for publication March 2S, 1955.
determine ventricular behavior during filling,and yet obtain results with more direct physio-logic applicability than muscle strip prepara-tions permit, we modified the heart-lung prepa-ration of Evans7 for functional isolation of oneventricle. The present paper reports observa-tions made on the isolated right ventricle atdifferent work loads and heart rates; a secondpaper8 reports observations on the effect ofinotropic drugs.
The behavior of the working ventricle duringfilling might be described by the use of theengineer's concept of mechanical impedance. Asystem subjected to stress opposes that stressthrough the combined effects of mass, elastic-ity, and viscosity, that is, through mechanicalimpedance. During diastole, the isolated rightventricle is subjected to the stress of a hydro-static pressure. The rate and extent of fillingwill depend not only on the hydrostatic pres-sure and the duration of diastole, but also onthe mass, elasticity, and viscosity of theventricle wall and moving blood. This changein the ventricular pressure-inflow relationship,expressed as changes in mechanical impedance,would indicate changes in the physical proper-ties of the ventricle wall during filling.
Since Henderson2 thought that the rate ofventricular relaxation could independentlyaffect systolic behavior, we have also attemptedto evaluate this factor. Some investigators haveused the rate of intraventricular pressure fallafter ejection as a measure of the rate of ten-sion loss during relaxation.9-12 Of special interest
434 Circulation Research, Volume III, September IMS
by guest on June 30, 2018http://circres.ahajournals.org/
Dow
nloaded from

BUCKLEY, OGDEN AND LINTON 435
are the right ventricular pressure curve con-tours obtained by Opdyke from the emptybeating heart." Using a similar approach, wehoped to obtain information which wouldsupplement the data on ventricular impedance.
METHODS
The Isolated Right Ventricle Preparation: The rightventricle of a small dog heart is functionally isolatedby filling it directly from a venous reservoir throughan inflow cannula tied into the right atrium closeto the atrio-ventricular ring. The ventricle emptiesthrough a pulmonary artery cannula. The externalcircuit consists of a collapsible rubber reservoir in awater bath of large surface area, a Starling peripheralresistance unit, and a pump to return the pulmonaryoutflow. The coronary system of this heart is sup-plied at a constant mean pressure by back-perfusionthrough the aorta with oxygenated blood fromanother heart-lung preparation. Blood reaching theleft ventricle either by coronary drainage or byleakage through the aorta is drained from theventricle by a siphon tube. The work of the rightventricle is determined by the variable hydrostatichead of blood and the variable pulmonary arteryresistance. The left ventricle performs no externalwork.
Figure 1 is a diagram of the completed prepara-tion. The details of the procedure are as follows:Standard heart-lung preparations are fiist madeseparately in two dogs. One is approximately twicethe weight of the other, and serves as a source ofoxygenated blood and of coronary perfiision pi'essurefor the smaller heart. Next, the venous inflow can-nula in the superior vena cava to the smaller heart isre-tied so as to obliterate the right atrium almostcompletely. A drainage tube (closed) is then insertedthrough the left auricle into the left ventricle.With venous return minimal, back-perfusion throughthe aorta is begun by switching its outflow tubefrom the peripheral resistance unit to the coronaryperfiision circuit with the connections partly opento exclude air bubbles. The pulmonary artery is thencannulated, and the left ventricle drainage tubeopened. The hilus of each lung is ligated. Venousinflow and peripheral resistance for the isolated rightventricle are adjusted, and a pump set to return thepulmonary outflow to the venous reservoir of thedonor dog. The venous inflow and peripheral re-sistance for the donor dog are adjusted to keep thecoronary perfiision pressure at 90-100 mm. Hg., anda full venous reservoir for the isolated ventriclepreparation. Blood temperature was kept at 35-37 C.variation during a given experiment.13
The preparation offers the following advantagesfor the study of right ventricular rilling: (1) Thehj'drostiitic head of pi'essure for filling is independentof the changes in the volume of blood in the reservoiroccurring at different flow rates, and is constant
FIG. 1. The isolated right ventriclo preparation.The circuit includes: (1) collapsible venous reser-voirs; (2) hydrostatic head of pressure available forfilling the ventricle, controlled by the level of ii waterbath surrounding the reservoirs; (3) peripheral re-sistance units; (4) coronary perfiision circuit, con-taining a windkessel; (5) siphon drainage tube in tholeft ventricle; (6) electromagnetic Howmeter; (7)intraventricular pressure gage; (S) pulmonaryarter3" pressure gauge; (9) pulmonary outflow, to apump which returns blood to the reservoir of thedonor heart; (10) the donor heart-lung preparation.
throughout the cycle. (2) Effects of auricular fillingand emptying are excluded. (3) The left ventricleperforms no external work. (4) Ventricular volumechanges registered by a cardiometer reflect changesin the right ventricle alone.
Technics of Measurement: Simultaneous recordswere made of changes in right ventricular volumeand pi'essure, and pulmonary pressure and outflow,on a Hathaway oscillograph at a paper speed of 50or 100 mm. per second with time lines every .01second (fig. 2). Corrections were made for lag in thesimultaneously recording systems.
Right ventricular pressure and pulmonary arterypressure were registered by Statham venous pres-sure transducers, using a 10 cm length of Cournandno. 7 cardiac catheter inserted into the right ventriclethrough an auricular tag, and a 35 mm. IS gageneedle pushed down into the pulmonary arterycannula. Zero pressure in each case was recorded as
by guest on June 30, 2018http://circres.ahajournals.org/
Dow
nloaded from

•430 FILLING OF ISOLATED RIGHT VENTRICLE
atmospheric, after the gage was in the position ofuse, and each gage was calibrated against a mercurymanometer at each experiment.
The hydrostatic head of pressure (H) availableto fill the right ventricle was measured from a zerocorresponding to the tip of the inflow cannula, tothe level of the blood in the venous reservoir.
Instantaneous or integrated pulmonary outflowwas measured by an electromagnetic flowmeterespecially designed for the measurement of flow indog heart-lung preparation, based on the originalwork of Clark and Randall.M It has a linear calibra-tion for the continuous flow of blood, and a negligibleBero drift when used continually for two or threehours. Stroke volume was computed from theserecords. Since pulmonary outflow and strokevolume were not used in calculations concerningventricular relaxation and impedance, but only inour evaluation of the performance of the isolatedventricle preparation, no further comment will bemade about this flowmeter or its records.
Changes in the volume of the right ventricle wereregistered by a Henderson cardiometer and a Palmerpiston recorder moving a flag in a photoelectriccircuit. The cardiometer record, especially as aquantitative index of rates of change, is subject towell-known limitations. However, it was used inview of the following considerations: (a) The re-sponse time of the aluminum piston of low mass andfriction was constant at .01 seconds up to frequenciesof 200 movements |>er minute, (b) Since the lungswere not in use, errors due to respiratory displace-ments of the cardiometer were obviated, (c) Ratemeasurements were made only during periods wherethe cardiometer record had a constant slope, (d)The empty left ventricle permits volume changes ofthe right ventricle to be closely approximated. Thediastolic volume (DV) reported in the Tables refersto the ventricular content at end-diastole, as com-puted from a zero established by allowing the heartto empty itself as completely as possible.
Plan of Experiments: The rate of inflow into theright ventricle was varied by changing the hydro-static head within the upper end of the normal rangeof right ventricular filling pressures found for open-chest dogs (5-13 mm. Hg). Records were taken atconstant pulmonary artery pressure and heart rateafter the ventricle had attained equilibrium withrespect to each new input load.
The duration of filling was shortened by increasingthe heart rate from spontaneous rates of 70-S0 torates of 100-150, by electric stimulation in theregion of the sino-auricular node. Monophasicsquare-wave stimuli were delivered at different fre-quencies from a Gmss Physiologic Stimulator (Model3C). Electrocardiograph records showed no inter-ference with the normal conduction pattern.
The pulmonary artery pressure was altered byvarying the air pressure in the Starling peripheral
resistance unit, over a range above and below meanpulmonary artery pressures reported for normal oropen-chest dogs (5-40 mm. Hg). Records were takenat constant hydrostatic head and heart rate afterthe ventricle had attained equilibrium with respectto each new output load.
Adaptation to sudden changes in work load wasobserved by recording beats immediately before,,during and after the change. In each heart studied,sudden changes in both input and output loads wereproduced separately.
Records of typical "equilibrium" and "adapta-tion" experiments are shown in figure 2.
Analysis of Records: The performance of the right-ventricle was evaluated from calculations of strokevolume and the stroke work done to developpressure on the volume of blood in the ventricle.
Right ventricular pressure curves from the iso-lated right ventricle have systolic contours similarto those published by other workers. The fall inpressure is followed, however, by an unchangingpressure level until the sudden rapid increase at"end-diastole." In the absence of timing of theonset and end of diastole, the ventricular fillingperiod has been divided into three phases on thebasis of these curves. (See sample curves, fig. 2 inwhich an ink line has been drawn at the level ofhydrostatic pressure head.) "Early filling" (e)begins when the falling intraventricular pressureno longer exceeds the hydrostatic head and allowsthe atrioventricular valve to open. "Mid-filling"(m) begins when the intraventricular pressure be-comes constant, and corresponds to the durationof the unchanging pressure level. "Late filling" (I)begins at the instant that the intraventricular pres-sure begins to rise, and continues until the risingpressure exceeds the hydrostatic head and closes theatrioventricular valve. The cardiometer recordsduring this last phase contain artifacts such that theend of inflow is impossible to determine. Thus"late filling" may represent diastasis in late diastole(the pressure rise being then due to distention of afull ventricle) or in early systole (the pressure risebeing then due to the onset of systolic activity).
The following measurements were made from thepressure curves: Cardiac cycle length (c), durationof filling (/) and each of its phases (e, m, I), and theaverage rate of pressure fall during early filling(AP/e). Since we were unable to time the onset ofisometric relaxation, we estimated rate of relaxationfrom this rate of intraventricular pressure fall fromthe opening of the atrioventricular valve.
The intraventricular-pressure-inflow relationshipwas examined for the mid-filling period. Only duringthis phase of filling were cardiometer records ap-parently free of artifacts, and during this phase theslope of the record was constant. Because theintra ventricular-pressure-inflow relationship dependsupon the opposition offered by the ventricle to dis-
by guest on June 30, 2018http://circres.ahajournals.org/
Dow
nloaded from

BUCKLEY, OGDKX AND LLNTON 437
tention, we calculated
PvF
(where Pv is the pressure inside the ventricle, F isthe flow into the ventricle), and termed this ratioan expression of the mechanical impedance of theventricle. Although records could be read to threesignificant figures, we considered that calculationsof impedance to other than two had no furtherphysiologic significance. We consider that dataobtained in the type of preparation used in ourexperiments are not suitable for statistical analysis.
RESULTS
The applicability of the isolated right ven-tricle for studies of this kind was examined bycomparing the general performance of 15 suchpreparations with that of 5 Evans and 7Starling heart-lung preparations using thesame equipment. A total circulating bloodvolume of 500 to 800 cc. was used. Undersimilar work loads and at similar heart rates,the range of stroke work was similar for heartsof the same size. In none of these experimentsdid the pulmonary or aortic flow exceed 760cc. per minute. This is lower than the flows com-puted for resting intact dogs, but no attemptwas made to produce larger flows. It wasthought that approaching failure clue to highinput loads might produce changes that couldnot be quickly reversed. Experiments on theisolated right ventricle were completed in V/ito 2Yi hours after the artificial circulation wasbegun, and were usually terminated by thedevelopment of pulmonary edema in the donordog.
Intraventricular pressure curves obtainedfrom heart-lung and isolated right ventriclepreparations were found to have a markedlydifferent contour during diastole. In thestandard heart-lung preparation within thesame range of filling we found the usual slowrise in pressure throughout diastole. This riseis absent in curves obtained when the rightauricle has been obliterated and when the leftventricle is performing no external work in theisolated right ventricle preparation. The dura-tion of the level diastolic pressure seen thenmay be short, however, at rapid heart rates.
The isolated ventricle preparation does not
differ from those of Evans and Starling in itsability to perform work, nor in any of ouranalyses of its diastolic behavior, except for thepersistence of an unchanging intraventricularpressure into late diastole. Therefore, conclu-sions based on the use of this-preparation maybe expected to add to those obtained fromheart-lung preparations, but should be appliedto the physiology of the intact animal with the1
usual reservations. The particular advantageof the isolated ventricle is in obtaining datathat bi-ventricular studies have not yielded.Work comparisons assured us that the addi-tional dissection had not significantly impairedthe performance of the ventricle.
Ventricular Filling at Work Equilibrium:Analysis of records taken during work equi-librium at constant heart rate reveals theuniformity of ventricular behavior during aseries of consecutive beats. Figure 2B illustratesthese observations, and table 1 shows theanalysis of several equilibrium states. Ven-tricular pressure curves are superimposable forthese beats, as are volume curves, implyingthat the ventricle is following a fixed patternof filling and emptying set by filling pressure,pulmonary artery pressure, and heart rate.Each beat is strikingly characterized by theoccurrence of a steady intraventricular pressureand constant inflow rate during the relativelylong mid-filling period, that is, a constantmechanical impedance throughout mid-fillingfrom beat to beat. This suggests a constantresponse of the ventricle wall toward theexternal conditions imposing the constant workload.
Ventricular Filling during Adaptation toChanging Work Load: The attainment of workequilibrium after a sudden change in workload is illustrated in figure 2A, showing adapta-tion beginning in the next beat. Table 2 showsthe analysis of eight representative experi-ments.
When the inflow was suddenly increasedfrom zero to any fixed rate, the ventricle re-quired about 8 beats to develop a reproducibleintraventricular pressure curve. Usually fillingwas continuous throughout the first two beats,
by guest on June 30, 2018http://circres.ahajournals.org/
Dow
nloaded from

438 FILLING OF ISOLATED RIGHT VENTRICLE
RV I2C"REC 2«
INFLOW CLAMPSOPENED)
SUDDENLY
* VENTRICULAR VOLUME
BASELINE
R VENTRICULAR PRESSURE
(A)
L R v aNEC • IT
R VENTRICULAR VOLUME
PULMONARY ARTERY PRESSURE
Fig. 2. Specimen records of right ventricular pressure and volume, and pulmonary pressure andoutflow, from a functionally isolated right venticle. (A) Adaptation to a sudden increase in venousreturn from zero to 420 cc. per minute. At work equilibrium: systolic RVP = 34 mm. Hg., diastolicRVP •» 4.9 mm. Hg., diastolic 11VV - 23.5 cc , systolic RVV = IS cc , mean PAP = 6.1 mm. Hg.,PAF = 420 cc. per minute, and cycle length = 0.68 seconds. (B) Work equilibrium at filling pressure =8.2 mm. Hg., mean PAP = 4 mm. Hg., and cycle length = 0.54 seconds. Systolic RVP — 20 mm. Hg.,diastolic RVP = 3.4 mm. Hg., diastolic RVV = IS cc , systolic RVV - 16 cc. and PAF - 160 cc. perminute. One cycle in (B) has been marked to illustrate the division of the filling period into its charac-teristic phases: early (.05 sec), middle (.45 sec), and late (.04 sec). The horizontal ink line in thesecond complete diastole is at the level of hydrostatic pressure head. Pulmonary artery flow recordsare included, but are not discussed in this paper.
during which there was little or no output,since intraventricular pressure did not becomegreat enough to open the pulmonary valve norclose the atrioventricular valve until thesystole of the second beat. By the fifth andsixth beats, the increased diastolic and strokevolumes had become constant, but the diastolicintraventricular pressure level varied until
about the eighth beat. The pattern of adapta-tion to sudden increases from zero inflow is thesame for a given heart regardless of the magni-tude of the inflow change, as illustrated byexperiments 5 (a and c) in table 2.
When pulmonary artery pressure was sud-denly increased, the right ventricle required 5or 6 beats to attain a constant intraventricular
by guest on June 30, 2018http://circres.ahajournals.org/
Dow
nloaded from

BUCKLEY, OGDEN AND LINTON 439
TABLE
6a
i9A
11B
19A
21A
24E
25A
26C
27C
(
6a8
PQ
123
1
23
123
1
23
1
23
123
1
23
123
L.—Analysts of ComecutiveConstant Work Load
~H
g)
I2.032.032.03
2.432.432.43
3.383.383 38
2.962.962.98
4.04.04.0
3.023.023.02
1.501.601.60
2.02.02.0
'sec.
)
u
J -
2.12.1
2.1
5.25.25.2
13.013.013 0
151616
252525
19.819.810.8
1212
12
303030
aX
:.sec
.)
3
a
B>-
12.812.812.8
6.26.26.2
3.63.63 5
2.62.62 6
2.12.12.1
2.02.0
2.0
1.81.8
1.8
0.90.90.9
p
18.018.0
18.0
21.721.721.7
16.016.016 0
14.814.814.8
13.613.613.6
26.826.826.S
24.224.2
24.2
19.719.819.7
ind
63.7
69.363.7
61 261.251.2
46.843.245. S
44.444 444.4
31.831.831.8
43.84043.8
38.738.741
58.862.262.2
HeartbeatsHeart Rate
(sec
.
u
.79
.79
.79
.92
.92
.92
.87
.87
.88
.61
.60
.60
.66
.56
.65
.6685
.66
.71
.71
.71
.73
.74
.73
(sec
.;
-
.59
.58
.58
.71
.70
.69
.35
.36
.35
.22
.21
.22
.25
.26
.26
.33
.33
.32
.41
.41
.40
.37
.37
.37
.10
.09
.10
.12
.12
.12
.16
.17
.16
.10
.10
.10
.06
.06
.00
.10
.11
.10
.09
.09
.09
.086
.OS
.08
(sec
a.18.17.17
.18
.19
.18
.23
.24
.23
.17
.15
.16
.10• It.11
.16
.16
.16
.15
.14
.136
.12
.12
.11
at
-
.08
.08
.07
.06
.07
.08
.07
.07
.07
.07
.06
.06
.04
.06
.06
.06
.05
.06
.06
.06
.06
.036
.04
.03
P — Intmventriculur pressure during mid-filling.F — Rate of inflow into right ventricle during mid-filling.I — Meclwnical impodanoe during mid-fillinf.
DV ™ Diastolic content cluinging from an approximate xero.P/e — Rate of intraventricular prewure fall during early
filling.o — Cyclo length,f — Duration of filling,
e, m, 1 — Duration of early, middle, and late pliasea of filling.
pressure contour. By this time, the largerdiastolic volume has become constant, and thestroke output returned to its previous volume.
The immediate onset and constant durationof the process of adaptation to sudden changesin work load, regardless of the magnitude ofchange for a given heart, suggests that thephysical properties of the ventricle are in-volved. Calculations of mechanical impedancemade from these experiments showed widefluctuations until the new work equilibriumwas reached (see table 2). Variations incoronary flow during adaptation might accountfor such fluctuations, as two experiments per-
formed with a clamp on the coronary perfusionline indicated.
Effects of Work Load and Heart Rale Varia-tions on Medianical Impedance and Intraven-tricular Pressure Contour: Mechanical im-pedance was calculated from data obtained on13 dog hearts (47-117 Gm.). The effects ofincreases in work load and heart rate ("equi-librium" experiments) are reported in table 3,and representative intraventricular pressurerecords are shown in figure 3 (see p. 442).
Increasing the venous return to the rightventricle, at constant heart rate and pulmonarypressure, was accompanied by a decrease inmechanical impedance during mid-filling anda faster rate of intraventricular pressure fall inearly filling.
Increasing the heart rate, at constant fillingpressure and pulmonary artery pressure, wasaccompanied by an increase in mechanicalimpedance during mid-filling, and a faster rateof intraventricular pressure fall in early filling.At the fastest heart rates, the duration offilling is so short that the mid-filling phase dis-appears. Under these circumstances, im-pedance was calculated at the time of minimumintraventricular pressure.
Increasing mean pulmonary artery pressure,at constant filling pressure and heart rate, wasaccompanied by both increases and decreasesin mechanical impedance during mid-filling.The rate of intraventricular pressure fall inearly filling was slower in 5, faster in 1 andunchanged in 1 of the 7 experiments.
It is apparent that changes in input load orheart rate are accompanied by reproducibleand characteristic combinations of changes inthe intraventricular pressure-inflow relation-ship in the beating ventricle during diastole.Increases in the rate of early pressure fall ob-served in these experiments may reflect moresynchronous relaxation of individual fibers ormore rapid relaxation of the ventricle as a unit.
Pressure-Volume Plots. The observations re-ported as pressure-volume plots in figure 4were obtained from a typical series of beatsrecorded as the input (A) or output (B) loadwas increased. Any relationship between pres-
by guest on June 30, 2018http://circres.ahajournals.org/
Dow
nloaded from
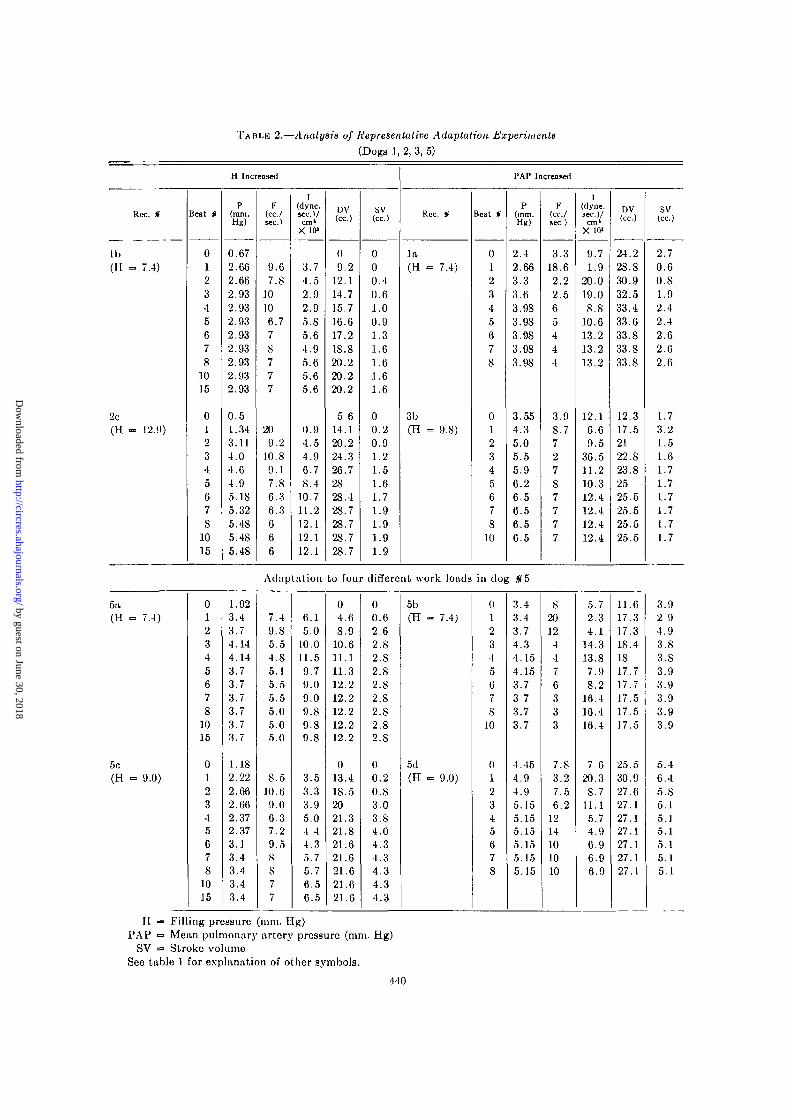
TABLE 2.—Analysis of Representative Adaptation Experiments(Dogs 1,2, 3, 5)
H Increased
Rcc. «
1b(H = 7.4)
2c(H » 12.9)
Beat *
012345678
1015
012345678
1015
P(mm.Hg)
0.672.662.662.932.932.932.932.932.932.932.93
0.51.343.114.04.64.95.IS5.325.485.4S5.4S
F(cc./sec.)
9.67.S
10106.77S777
209.2
10.S9.17.S6.36.3666
I(dyne.sec.Vcm'
X 10>
3.74.52.92.95.85.64.95.65.65.6
0.94.54.96.78.4
10.711.212.112.112.1
DV(cc.)
09.2
12.114.715.716.617.218.S20.220.220.2
5 614.120.224.326.72828.428.728.728.728.7
SV(cc.)
000.40.61.00.91.31.61.61.61.6
00.20.91.21.51.61.71.91.91.91.9
PAP Increased
Rec. *
l a(H «= 7.4)
3b(H => 9.8)
Beat §
012345678
012345678
10
p(mm.Hg)
2.42.663.33.63.9S3.9S3.983.9S3.98
3.554.35.05.55.96.26.56.56.56.5
F(cc./sec)
3.318.62.22.565444
3.98.772787777
l(dyne,sec.)/cm*
X 10"
9.71.9
20.019.08.8
10.613.213.213.2
12.16.69.5
36.511.210.312.412.412.412.4
DV(cc.)
24.228.S30.932.533.433.633.S33.833.8
12.317.52122.S23.S2525.525.525.525.5
sv(cc.)
2.70.60.81.92.42.42.62.62.6
1.73.21.51.61.71.71.71.71.71.7
5a7.4)
5c(H 9.0)
Adaptation to four different work loads in dog $5
012345678
1015
012345678
1015
1.923.43.74.144.143.73.73.73.73.73.7
1.182.222.662.662.372.373.13.43.43.43.4
7.49.85.54.S5.15.55.55.05.05.0
8.510.69.06.37.29.5S
s77
6.15.0
10.011.59.79.09.09.89.89.8
3.53.33.95.04 44.35.75.76.56.5
04.68.9
10.611.111.312.212.212.212.212.2
013.418.52021.321.S21.621.621.621.621.6
00.62.62.82.82.S2.82.S2.S2.82.S
00.20.83.03.84.04.34.34.34.34.3
5b(H 7.4)
5d(H 9.0)
012345678
10
01234567S
3.43.43.74.34.154.153.73 73.73.7
4.454.94.95.155.155.155.155.155.15
S20124476333
7.83.27.56.2
1214101010
5.72.34.1
14.313.87.9S.2
16.416.416.4
7 620.3S.7
11.15.74.96.96.96.9
11.617.317.318.41817.717.717.517.517.5
25.530.927.627.127.127.127.127.127.1
H — Filling pressure (mm. Hg)PAP = Mean pulmonary artery pressure (mm. Hg)
SV =» Stroke volumeSee table 1 for explanation of other symbols.
440
3.92 94.93.83.S3.93.93.93.93.9
5.46.45.S5.15.15.15.15.15.1
by guest on June 30, 2018http://circres.ahajournals.org/
Dow
nloaded from

BUCKLEY, OGDEN AND LINTOX 441
TABLE 3.—Effects of Changes in Work Load or Heart Rate
Rec. »
9B
UB
12B
15A
J9A
25A
2SB
P/e(mm. HR/
KC.)
49.655.861.2
51.253.276.7
65.367.281.1
2539.143
21.42S.337.1
18.728.34S.7
16.547.675.8
H Increasing
P(mm. Hg)
3.102.962.96
2.433.02.43
3.423.74.0
3.13.13.4
3.G43.13.64
3.023.023.02
5.926.857.OS
F(cc./scc.)
9.513.215.2
5.27.67.7
5.09.5
13.0
2.557
132539
14.718.519.8
101525
I(dyne.
sec.)/cm>x io>
4.33.02.6
6.25.34.2
9.15.24.1
16.58.26.5
3.71.71.2
2.72.22.0
7.96.13.S
Rec. «
21A
2IB
22
23
IOC
24
2SA
HP
P/e(mm.
Hg/sec)
24.53S.540.7
41.4
46.647
50.664.193 S
36.S49.752.2
22.S27.149.3
50.653.S62.3
67.269.2
112.5
* Increasing
P(mm.Hg)
1.4S3.553.S5
3.264.154.5S
1.543.3S3.7S
1.7S2.223.25
3.383.644.73
2.362.663.4
2.743.653.S6
F(cc./MC.)
22.525.52S
4 1 . 6
23.318.7
101010
147.45.0
2015S
17.412S
I(dyne,sec.)/cm'
X 10"
0.91.4l.S
1.02 33.2
2.04.55.0
1.74.08.6
2.33.27.9
l .S2.95.6
no data
Rec. *
9A
11A
I2A
13A
19B
27A
2SC
PAP Increasing
P/e(mm.Hg/sec.)
53. S62.296.8
53.841.S47.7
5S51.230.2
20.716.511.4
20.620.620.6
51.247.343.6
96.167.273.0
P(mm.Hg)
0.951.352.56
1.S62.143.5S
2.953.44.SS
5.026.56.95
3.383.3S3.3S
0.330.841.32
2.513.083.42
F(cc./BCCj
3.36.57.S
10.S5.95.0
5.37.76.0
4.57.0
2S
1017.512.5
20IS10
[(dyne,sec)/cm'
X 10"
3.S4.S4.4
2.34.S9.5
7.45.9
10. S
10.912.43.3
4.52.63.6
0.20.6l .S
no dahi
H — Filling pressure (mm. Hg)HR =• Heart rate
PAP = Mean pulmonary artery pressure (mm. Hg)See table 1 for explanation of other symbols.
sure and volume in the working ventricle iscomplicated by the fact that the relationshipchanges with time during the cardiac cycle.Since we were interested chiefly in the mid-filling period, we made simultaneous pressureand volume measurements at the same timeintervals in each beat of the series studied.
Each horizontal line in figure 4 connectspoints taken at equal time intervals from thebeginning to end of the mid-filling period of asingle beat. These lines emphasize that thepressure and volume are independent variablesthroughout this period. Each curve in figure 4connects points from the series of beats, at thesame time during mid-filling. Each curve has aconstant positive slope (work load increasing
from left to right). The series of curves shownin figure 4 emphasizes that the pressure-volumerelationship known to exist at end-diastolealso obtains the entire mid-filling period. Theseobservations support the others which indi-cated that (a) the behavior of the ventriclewall is fixed throughout the mid-filling period,and (b) the physical properties of the ventriclewall may respond to work load differently as theload increases.
Comparison of plots (A) and (B) of figure 4illustrates a difference noted in all right ven-tricles studied: The pressure-volume relation-ship throughout mid-filling is a steeper onewhen the output load is increased. This ob-servation suggests that the physical properties
by guest on June 30, 2018http://circres.ahajournals.org/
Dow
nloaded from

442 FILLING OF ISOLATED RIGHT VENTRICLE
\
(B)
|7 30
20
10
FIG. 3. Specimen records of right ventricular pres-sure curves from a functionally isolated right ven-tricle, showing the effects of: (A) increasing thevenous return from 350 to 550 ec/minute, at meanPAP - 22 mm. Hg, and HR - 136. (B) increasing theheart rate from 130 to 150, at rilling pressure = 7.5mm. Hg, and mean PAP = 15 mm. Hg. (C) increasingthe mean pulmonary artery pressure from IS to 25mm. Hg, at filling pressure •= 7.5 mm. Hg, HR •= 15S.
Note the short duration of the mid-filling periodat these rapid heart rates (m •» .02 to .05 sec.) ascontrasted with rates in fig. 2 (m = .15 to .38 sec.).The horizontal line at IS mm. Hg was a baseline forthe volume records not included in this figure. Thehorizontal ink lines at 5 to 10 mm. Hg are at the levelof the hydrostatic pressure head.
of the ventricle wall are affected differently byinput and output loading. In the beatingventricle, output loads behaved uncertainly bycomparison with input loads as noted previ-ously.
It is interesting to compare the data ob-tained from working ventricles with those fromquiescent ventricles. Figure 5 shows pressure-volume plots for the right ventricles of two ofthe freshly excised hearts and two of theworking hearts of the same weight. The ex-cised hearts still fibrillated occasionally duringthe 15-minute period of measurements. Nopressure developed during the addition of the
V O L U M E ( C O
FIG. 4. Pressure-volume plots for the mid-fillingperiod in the working right ventricle, when diastolicvolume is increased by (A) increasing venous return,and (B) increasing mean pulmonary artery pressure.Horizontal lines represent the mid-filling period ofindividual beats at increasing work loads (uppemiostline is for highest work load). Sloping lines connectpoints at corresponding times during these beats.
SEATING HIART EXCISED HEAKT
0 5 10 IS t o IB 30 19 «O 43 SO S3 f O
VOLUME ( C O
FIG. 5. Pressure-volume plots for the quiescentright ventricle, compared with those for the workingright ventricle. The plots for the working heart wereconstructed from typical experiments in whichdiastolic volume was increased by a sudden increasein venous return. Since the minimum heart volumesrecorded in such experiments may not be zero, theplots for working and quiescent ventricles cannot beaccurately superimposed. Data from smaller hearts(S9.5 and S7 Gm.) are shown by solid circles. Datafrom larger hearts (104 and 117 Gm.) are shown bysolid triangles.
by guest on June 30, 2018http://circres.ahajournals.org/
Dow
nloaded from

BUCKLEY, OGDEN AND LINTOX
first 25 or 35 cc. of blood to the artificiallyemptied ventricle. Continued addition of bloodresulted in a pressure-volume plot with a con-tinuously increasing positive slope. Since thefreshly excised heart is static, the slope of itspressure-volume plot probably describes theelasticity of the ventricle wall (see Discussion).Although the pressure-volume plots from thebeating ventricle cannot be used to describeany single property of the ventricle wall, theydo provide another indication of the uni-formity of ventricular behavior during filling.
DISCUSSION
The Role of Physical Properties of the Ven-tricle Wall during Filling. Under conditions ofconstant work load and heart rate, the isolatedright ventricle exhibits an equilibrium char-acterized by uniformity of ventricular volumeand pressure curve contours for an indefinitenumber of beats. Any sudden change in workload is followed immediately, in the next beat,by the onset of pressure and volume changesleading to a new equilibrium within five toeight beats. Successive changes in filling pres-sure or heart rate are accompanied by char-acteristic changes in rate and extent of filling,intraventricular pressure-inflow relationship,and intraventricular pressure curve contour.The results of changing pulmonary artery pres-sure arc also characteristic except for theeffects on the pressure-inflow relationship.
Using the concept of mechanical impedance,the ventricular pressure-inflow relationship de-pends upon the mass, elasticity, and viscosityof the ventricle wall and moving blood. It wasassumed that the ventricular mass remainedconstant during an experiment. The accelera-tion and increasing mass of blood within theventricle have been neglected because adequatedata were not available for the calculations.Thus we have attempted to relate changes inmechanical impedance to elasticity and viscos-ity of the ventricle wall only.
Elasticity may be defined as the ratio of thestress applied to the distortion developed inthe stressed system. Being independent of therate of application of the stress, elasticity ismost easily studied in a static system such asthe quiescent ventricle. Comparison with the
filling period of the working ventricle might bemade as follows (figs. 4 and 5). The mid-fillingperiod of individual cardiac cycles (denotedby horizontal lines, fig. 4) might be superim-posed upon the initial flat portion of the pres-sure-volume plot for the quiescent ventricle.The end-diastolic points for a series of beatsat increasing work load might be superimposedupon the middle portion of the pressure-volume plot for the quiescent ventricle. Thusthe behavior of the isolated right ventricleduring filling could be explained in terms of itselasticity. Even at the slowest heart rates(thirty to fifty) observed in the isolated rightventricle, during a single beat there was nevera gradual increase in impedance towards latediastole. This implies that, over the range offilling pressure studied, there was no elasticlimit to filling; the only limit was that im-posed by the onset of the next systole.
Since the intact ventricle exhibits bothelastic and viscous properties and sometimesbehaves like a plastic,' we must also discussthe role of viscosity. This is a frictional forcedeveloped in a stressed system, depending onthe rate of application of the stress. The levelintraventricular pressure during mid-filling inall but the most rapidly beating hearts, andthe decreased impedance which occurs whenvenous return is increased, suggest that thetime-dependent property of viscosity may bean important component of the mechanicalimpedance of the ventricle. Support for thisconclusion is found in Lundin's observationsof the markedly viscous behavior of cardiacmuscle bundles,16 and Rushmer's demonstra-tion that ventricle layers may slide across oneanother during filling.17 Although viscosimetricstudies on extracted myocardial fibers haveshown that variations in viscosity may occurthroughout the cardiac cycle,18 it should benoted that the complex stnicture of the intactventricle in our experiments precludes discus-sion of other than the "apparent viscosity."
Due to the complex stnicture and geometryof the working ventricle, we are still unable toseparate the roles of the elastic and viscouscomponents of the mechanical impedanceduring filling.
Effects of Changes in Work Load and Heart
by guest on June 30, 2018http://circres.ahajournals.org/
Dow
nloaded from

444 FILLING OF ISOLATED RIGHT VENTRICLE
Rale on Ventricular Filling. On the basis of theresults presented, we have related the fixedpattern of ventricular filling at constant workload and heart rate, and the rapidity of adapta-tion to sudden changes in work load, to funda-mental physical properties of the ventriclewall. We have shown that changes in rateand extent of filling, mechanical impedance,and ventricular relaxation accompany in-creases in work load and heart rate. Similarchanges were found in experiments usingdrugs.8 Since it seems likely that these resultswould be due to some direct action of thedrugs on the properties of the ventricle wall, weconsidered that the similar effects of hemo-dynamic factors might also be due to directaction on the properties of the ventricle wall.The unanswered question is: by what mecha-nisms could such effects occur?
In experiments in which the filling pressurewas increased, and records made at each workequilibrium, the output load and duration offilling were constant. The only variables in-volved during the filling period were the fillingpressure and the physical properties of theventricle wall. The rate of filling depended uponboth of these variables, as did the extent offilling. As filling pressure was increased, inflowrate and diastolic volume increased, and themid-filling impedance decreased. This may bedue to a change in properties of the ventricle.It is possible that both elastic and viscouselements participate in this response, especiallyas the geometry of the ventricle changes atlarger diastolic volumes. That some directeffect on the ventricle may have occurred isshown by the faster rate of intraventricularpressure fall as filling pressure was increased.Bozlcr has shown that relaxing muscle fibersare very extensible when external force isapplied,19 so that the higher pressure to whichthe ventricle wall is suddenly subjected whenthe atrioventricular valve opens might dis-tend the wall more quickly and more com-pletely. Unfortunately, Lnndin16 did not reporton the effects of changes in rate of extension onthe visco-elastic behavior of cardiac muscle.
In experiments in which heart rate was in-creased, at constant input and output loads,the variables operating during filling were the
duration of filling and the physical propertiesof the ventricle wall. Changes in the rate offilling depended only upon changes in ventricu-lar properties, while extent of filling dependedon both. As heart rate was increased, inflowrate and diastolic volume decreased, and mid-filling impedance increased. A shortened dura-tion of filling could simply limit the extent offilling at a constant filling pressure, in whichcase impedance would not be expected toincrease as the ventricle wall was subjected tothis filling pressure for a shorter time. We con-clude that the observed increases in intra-ventricular pressure and impedance reflect achange in the properties of the ventricle. Theincreased impedance may be related to a higherapparent viscosity of the ventricle wall atfaster heart rates. This is supported by Lun-din's observations that an increased rate ofoscillatory vibration passed through a musclebundle resulted in an increase in the "stiffness"of the muscle." It is also possible that thethe increased mid-filling impedance reflects lesscomplete relaxation at the very fast heartrates. This is supported by the observations ofLuisada and Weiss that ventricular stripssubjected to rapid electric stimulation hadmarkedly shortened resting diastolic lengths.20
In experiments in which pulmonary arterypressure was increased, and records made ateach work equilibrium, the input load andduration of filling were constant. Only thephysical properties of the ventricle wall werevariable during filling, and changes in rateand extent of filling depended on these alone.The results obtained included increases anddecreases in mid-filling impedance and usuallya slower rate of intraventricular pressure fall inearly filling. The fluctuations observed mayreflect the uncontrolled factor of interferencewith coronary drainage as intraventricularpressure is increased, although they may alsoreflect random variations that might occurwith different quantities of residual blood.Therefore discussion of these results is de-ferred. It would seem that a work load oper-ating during systole might well affect sub-sequent diastolic behavior, but we have noevidence for this.
The steady impedance observed during the
by guest on June 30, 2018http://circres.ahajournals.org/
Dow
nloaded from

BUCKLEY, OGDEN AND LINTON 445
mid-tilling phase of a single cardiac cyclecould be determined by changes in the geom-etry of the rilling ventricle, or by the dominanceof viscous properties of the ventricular wall.The variations in mid-filling impedance ob-served with changes in venous return andheart rate are possibly due to changes ingeometry or apparent viscosity.
The variations in mid-filling impedance ob-served with changes in venous return or heartrate indicate that the alteration in strokeoutput resulting from changes in rate andextent of filling ultimately depend upon thephysical properties of the ventricle throughoutdiastole. The constant impedance observedthroughout the mid-filling period of any onebeat, and the constant slope of pressure-volume plots constructed throughout thisperiod for a series of beats at increasing workloads, emphasize that the mechanical behaviorof the next systole is already partly determinedearly in diastole.
SUMMAHY AND CONCLUSIONS
An isolated right ventricle preparation wasdesigned to investigate the relationship betweenrate and extent of filling and the mechanicalproperties of the ventricle wall during filling.The intraventricular pressure-inflow ratio,termed mechanical impedance, was used toindicate the visco-elastic behavior of theworking ventricle under controlled externalconditions. Pressure-volume plots for workingand quiescent ventricles permitted furtherdescription of this behavior. The rate of intra-ventricular pressure fall in early filling wasused to express the rate of ventricular relaxa-tion.
During work equilibrium at constant heartrate, a consecutive series of heart beats de-velops uniform ventricular pressure and volumecurves characterized by steady intraventricularpressure and inflow during the relatively longmid-filling period. Either elastic or viscousbehavior could account for the constant me-chanical impedance throughout the mid-fillingperiod.
Adaptation to sudden changes in work loadsof different magnitude begins in the next beatafter the work change, and is accomplished in
a fixed number of beats by a given heart. Therapidity and uniform duration of these adjust-ments toward a new work equilibrium suggeststhat the physical properties of the ventriclewall are changing during the adaptation.
Increasing venous return at constant heartrate and pulmonary artery pressure was ac-companied by a decreased impedance duringmid-filling and a faster rate of intraventricularpressure fall in early filling. Such results .suggestphysical changes in the ventricle wall, con-tributing to the increase in rate and extent offilling.
Increasing heart rate at constant hydro-static pressure and pulmonary artery pressurewas accompanied by increased impedanceduring mid-filling and a faster rate of intra-ventricular pressure fall in early filling. Theseresults suggest physical changes in the ventriclewall, contributing to the decrease in rate andextent of filling.
Pressure-volume plots for the beating ven-tricle show that pressure and volume arc inde-pendent variables throughout mid-filling in agiven cardiac cycle. The pressure-volume rela-tionship known to exist at end-diastole wasfound to obtain throughout the entire mid-filling period. These observations indicate thatthe mechanical behavior of the next systole isalready partly determined by the time thatintraventricular pressure becomes level indiastole. Thus the increasing stroke outputaccompanying increases in extent of filling,and the decreasing stroke output accompanyingshortening of filling time, appear to be deter-mined by the physical properties of the ven-tricle in early diastole.
ACKNOWLEDGMENTS
The authors wish to acknowledge the efficienttechnical assistance of P. H. McFnrlancl, M.D.,and Jean Atanosoff.
REFERENCES1 PATTERSON, S. W., PIPER, H. AND STARLING,
E. H.: The regulation of the heart beat. J.Physiol. 48: 467, 1914.
'HENDERSON, Y.: The volume curve of the ven-tricles of the mammalian heart, and the sig-nificance of this curve in respect to the me-chanics of the heart beat and the filling of theventricles. Physiol. Rev. 3: 165, 1923.
by guest on June 30, 2018http://circres.ahajournals.org/
Dow
nloaded from

446 FILLING OF ISOLATED RIGHT VENTRICLE
3 JOHNKON, V. AND KATZ, L. X.: Tone in the mam-
malian ventricle. Am. J. Physiol. 118: 26, 1937.4 KABAT, H. AND VIHHCHER, M. B.: Elastic proper-
ties of the Ideating tortoise ventricle, withparticular reference to hysteresis. Am. J.Physiol. 126: 437, 1939.
6 WIOGERS, C. J.: Determinants of cardiac per-formance. Circulation 4: 485, 1951.
6 GONTHER, B. AND LANDIK, E. M.: Cardiac re-
sistance to flow; pressure-flow relationships inthe quiescent and beating turtle heart. Am. J.Physiol. 169: 412, 1952.
7 EVANS, C. L.: TWO simple heart-oxygenator cir-cuits. Quart. J. Exper. Physiol. 24: 2S3, 1934-35.
8 BUCKLEY, X. M., OGDEN, E. AND MCPHERSON,
R. C : The effects of inotropic drugs on fillingof the right ventricle in the clog heart. Circula-tion Research 3: 447, 1955.
9 WIGOKRS, C. J.: The interpretation of the intra-ventricular pressure curve on the basis ofrapidly summated fractionate contractions.Am. j . Physiol. 80: 1, 1927.
10 HORWITZ, 0. : Contraction of cardiac muscle withrespect to time and its probable relation to theejection curve. Am. J. Physiol. 166: 2S5, 1951.
11 OPDYKE, D. F.: Effect of changes in initial ten-sion, initial volume, and epinephrine on the
ventricular relaxation process. Am. J. Physiol.169: 403, 1952.
11 REMINGTON, J. W. AND HUGGINS, R. A.: Ven-
tricular pressure changes as indicators ofmyocarditil condition. Federation Proc. 12:114, 1953.
13 BADEER, H.: Influence of temperature on S-Arate of the dog heart in the denervated heart-lung preparation. Am. J. Physiol. 167: 76,1951.
14 CLARK, J. \V. AND RANDALL, J. E.: An electro-
magnetic flowmeter. Rev. Scient. Instr. 20:951, 1949.
16 VANHAAREVELD, A. AND SHADLE, 0 . W.: On
hemodynamics. Arch, intermit, de physiol.69:166, 1951.
18 LUNDIN, G.: Mechanical properties of cardiacmuscle. Acta physiol. scandinav. 7: Suppl. 20,1944.
17 RUSHMER, R. F. AND THAL, X.: The mechanics
of ventricular contraction. Circulation 4:219, 1951.
18 LAKI, K. AND CLARK, A. M.: The effect of myosinand ATP on the polymerization of actin. Arch.Biochem. 30: 187, 1951.
18 BOZLER, E.: The mechanism of muscular relaxa-tion. Experientia 9: 1, 1953.
10 LursADA, A. A. AND WEISS, M.: Experiments ondiastolic and resting lengths of cardiac strips.Am. J. Physiol. 176: 123, 1954.
by guest on June 30, 2018http://circres.ahajournals.org/
Dow
nloaded from

N. M. BUCKLEY, ERIC OGDEN and DONALD S. LINTON, JR.Dog Heart
The Effects of Work Load and Heart Rate on Filling of The Isolated Right Ventricle of The
Print ISSN: 0009-7330. Online ISSN: 1524-4571 Copyright © 1955 American Heart Association, Inc. All rights reserved.is published by the American Heart Association, 7272 Greenville Avenue, Dallas, TX 75231Circulation Research
doi: 10.1161/01.RES.3.5.4341955;3:434-446Circ Res.
http://circres.ahajournals.org/content/3/5/434World Wide Web at:
The online version of this article, along with updated information and services, is located on the
http://circres.ahajournals.org//subscriptions/
is online at: Circulation Research Information about subscribing to Subscriptions:
http://www.lww.com/reprints Information about reprints can be found online at: Reprints:
document. Permissions and Rights Question and Answer about this process is available in the
located, click Request Permissions in the middle column of the Web page under Services. Further informationEditorial Office. Once the online version of the published article for which permission is being requested is
can be obtained via RightsLink, a service of the Copyright Clearance Center, not theCirculation Research Requests for permissions to reproduce figures, tables, or portions of articles originally published inPermissions:
by guest on June 30, 2018http://circres.ahajournals.org/
Dow
nloaded from