Embed Size (px)
Citation preview

NeuroImage 83 (2013) 120–134
Contents lists available at ScienceDirect
NeuroImage
j ourna l homepage: www.e lsev ie r .com/ locate /yn img
The EEG correlates of the TMS-induced EMG silent period in humans
Faranak Farzan a,⁎, Mera S. Barr b, Sylco S. Hoppenbrouwers c, Paul B. Fitzgerald d, Robert Chen e,Alvaro Pascual-Leone a,f, Zafiris J. Daskalakis b,⁎⁎a Berenson-Allen Center for Non-invasive Brain Stimulation, Department of Neurology, Beth Israel Deaconess Medical Center, Harvard Medical School, Boston, MA, USAb Temerty Centre for Therapeutic Brain Intervention, Centre for Addiction and Mental Health, University of Toronto, Toronto, Ontario, Canadac Department of Experimental Psychology, Helmholtz Institute, Utrecht University, The Netherlandsd Monash Alfred Psychiatry Research Centre, The Alfred and Monash University Central Clinical School, Victoria, Australiae Division of Neurology, Toronto Western Research Institute, University of Toronto, Toronto, Ontario, Canadaf Institut Universitari de Neurorehabilitació Guttmann, Universidad Autónoma de Barcelona, Badalona, Spain
⁎ Correspondence to: F. Farzan, Berenson-Allen Center forBeth Israel Deaconess Medical Center, Harvard Medical SchBuilding KS 423, Boston, MA 02215, USA. Fax: +1 617 975⁎⁎ Correspondence to: Z.J. Daskalakis, Centre for Therapfor Addiction andMental Health, University of Toronto, 250Ontario, M5T 1R8, Canada. Fax: +1 416 979 6936.
E-mail addresses: [email protected] (F. Far(Z.J. Daskalakis).
1053-8119/$ – see front matter © 2013 Elsevier Inc. Allhttp://dx.doi.org/10.1016/j.neuroimage.2013.06.059
a b s t r a c t
a r t i c l e i n f oArticle history:Accepted 16 June 2013Available online 22 June 2013
Keywords:Cortical inhibitionMotor cortexTranscranial magnetic stimulationElectroencephalographyElectromyographyGABACortical oscillations
Application of magnetic or electrical stimulation to the motor cortex can result in a period of electromyography(EMG) silence in a tonically active peripheralmuscle. This period of EMG silence is referred to as the silent period(SP). The duration of SP shows intersubject variability and reflects the integrity of cortical and corticospinalpathways. A non-invasive technique for assessing the duration of SP is the combination of Transcranial MagneticStimulation (TMS) with EMG. Utilizing TMS–EMG, several studies have reported on the shortening or lengthen-ing of SP in neuropsychiatric disorders such as schizophrenia, bipolar disorder, depression, obsessive compulsivedisorder, epilepsy, Parkinson's disease, and stroke. However, cortical, corticospinal and peripheral componentsare difficult to disentangle from EMG alone. Here, we use the multimodal neuroimaging technique of TMS–EMG combined with concurrent electroencephalography (EEG) recording to further examine the cortical originof SP and the cortical oscillatory activity that underlies SP genesis. We demonstrate that the duration of SP isrelated to the temporal characteristics of the cortical reactivity and the power of delta to alpha oscillations inboth local and remote areas ipsilateral and contralateral to the stimulation site, and beta oscillations locally.We illustrate that, compared to EMG, the EEG indices of the SP provide additional information about the braindynamics and propose that the EEG measures of SP may be used in future clinical and research investigationsto more precisely delineate the mechanisms underlying inhibitory impairments.
© 2013 Elsevier Inc. All rights reserved.
Introduction
Cortical inhibition in non-human species was originally identifiedthrough direct electrical stimulation of the cortical surface and it wasindexed by assessing the time period during which the probability ofneuronal firing was significantly diminished (Krnjevic et al., 1966).Through such methods, the latency, duration and spatial distributionof cortical inhibition were examined across brain regions in severalnon-human species (Krnjevic et al., 1966). Since it is introduced byBarker in the 1980s (Barker et al., 1985), the non-invasive activationof the human cortex through transcranial magnetic stimulation(TMS) has provided an invaluable means for investigating cortical
Non-invasive Brain Stimulation,ool, 330 Brookline Ave, Kirstein5322.eutic Brain Intervention, CentreCollege Street, 7th Floor, Toronto,
zan), [email protected]
rights reserved.
inhibitory processes in humans across the life span, in health and dis-ease, and without the need for invasive recordings. Several TMS proto-cols have been formulated to evaluate the integrity of the inhibitory,excitatory, and plasticity processes in the human motor cortex, bycapitalizing on the coupling of TMS with peripheral electromyography(EMG) recording and monitoring the modulation of TMS-inducedmotor evoked potentials (MEPs). One such TMS protocol suggested toasses cortical inhibition is the cortical silent period (CSP) (Fuhr et al.,1991; Inghilleri et al., 1993). In CSP, suprathreshold stimulation ofthe contralateral motor cortex during voluntary contraction of a targetmuscle results in a period of EMG silence for up to several hundredmilliseconds.
Converging lines of evidence suggest that the TMS-induced silentperiod (SP) has both a peripheral and a cortical origin. The first demon-stration of cortical stimulation leading to a period of muscle activitycessation was in the 1980s, when Marsden et al. demonstrated thattranscranial electrical stimulation (TES) applied to the intact scalpover themotor cortex resulted in anMEP followed by a transient periodof EMG silence in a tonically active muscle (Marsden et al., 1983).A decade later, application of TMS to the motor cortex was shown toinduce a similar suppression of background EMG in the activated target

121F. Farzan et al. / NeuroImage 83 (2013) 120–134
muscle (Fuhr et al., 1991; Inghilleri et al., 1993). The SP produced by TESand TMSwas suggested to be different from the SP that can be observedfollowing peripheral nerve stimulation (Marsden et al., 1983). Theduration of SP was longer in response to TMS with an average of300 ms, compared to 200 ms in TES and 100 ms following peripheralnerve stimulation (Inghilleri et al., 1993). To further examine the contri-bution of spinal versus corticalmechanisms to SP genesis, the amplitudeof spinal reflexes (e.g., H-reflex) and descending volleys was examinedat different time points during SP. H-reflex, or Hoffmann's reflex, isa muscle reaction in response to the electrical stimulation of the nerveinnervating a particular muscle. The H-reflex has a latency of 25to 35 ms with respect to electrical nerve stimulation onset. Changes inspinal reflexes provide a means by which the modulation of spinalinhibitory and excitatory mechanisms could be systematically studied(Knikou, 2008). In these investigations, a change in H-reflexes wouldbe indicative of a spinalmechanism, and a change in descending volleysis reflective of the contribution of supraspinal mechanisms. H-reflexeswere found to be suppressed only during the initial part of SP andrecovered after 75 ms (Fuhr et al., 1991). Corticospinal volleys duringSP were recorded in a limited number of studies in which participantshad epidural electrodes implanted for various clinical purposes (Chenet al., 1999). Previously, similar studies in patients at rest or duringanesthesia had been conducted to examine the effect of a TMS pulseon the corticospinal pathway. Through these studies, it was postulatedthat a TMS pulse activates pyramidal neurons trans-synaptically andthrough activation of excitatory interneurons as evident by the TMS-induced generation of multiple indirect descending volleys referred toas I-waves (Ziemann and Rothwell, 2000). When descending volleyswere recorded during SP, the TMS-induced I-waves were unchangedduring the early phase and suppressed in the late part of SP. Collectively,the recovery of H-reflexes and the suppression of cortically evokedI-waves during the late part of SP support the involvement of segmentalinhibition in the early phase and cortical mechanisms in the late phaseof SP.
The results of pharmacological interventions and the comparisonbetween TMS markers of inhibition suggest that SP is, in part, relatedto the activity of the gamma-aminobutyric acid (GABA)ergic neuro-transmitter system. In this regard, Siebner et al. reported a significantprolongation of the SPdur following the continuous intrathecal admin-istration of baclofen, a GABAB agonist, in a patient with generalizeddystonia (Siebner et al., 1998). Baclofen was shown to prolong theTMS-induced SP, while it did not affect the cutaneous SP, which isa spinal inhibitory reflex (Stetkarova and Kofler, 2013). Similarly,tiagabine, a GABA re-uptake inhibitor, was shown to prolong SP dura-tion (Werhahn et al., 1999). Furthermore, the duration of SP is consis-tent with the peak of GABAB receptor activation that is reportedby in vitro studies to be 100 to 300 ms (McCormick, 1989). While SPis postulated to reflect the duration of GABAB mediated intracorticalinhibition, the paired pulse TMS paradigm long interval cortical in-hibition (LICI) is suggested to reflect the magnitude of GABAB medi-ated intracortical inhibition (Kapogiannis and Wassermann, 2008;McDonnell et al., 2006; Sanger et al., 2001). In LICI, a suprathresholdconditioning stimulus delivered within 50 to 200 ms prior to asuprathreshold test stimulus, suppresses the response to the teststimulus (Valls-Sole et al., 1992). Although previous studies haveoften failed to find a direct association between SP and LICI (Benwellet al., 2007; Inghilleri et al., 1996; McDonnell et al., 2006), we haverecently demonstrated that SPdur correlates with the magnitude ofEMG suppression in LICI (Farzan et al., 2010c). Epidural recordingshave demonstrated that LICI suppresses the late I-waves at interstimulusinterval of 100 to 200 ms (Chen et al., 1999; Di Lazzaro et al., 2002;Nakamura et al., 1997), consistent with the peak activity of GABAB
receptors.Paralleling the above-mentioned proof-of-concept studies, several in-
vestigators have utilized TMS–EMG techniques to examine the integrityof SPdur in patients with neurological or psychiatric disorders. The results
of these endeavors have shown pathological prolongation or reduction ofSPdur in a variety of neurological and psychiatric conditions. For example,reduction of SPdur has been reported in schizophrenia (Daskalakis et al.,2002; Fitzgerald et al., 2002, 2004), bipolar disorder (Levinson et al.,2007), unipolar major depression (Bajbouj et al., 2006b; Levinson et al.,2010), obsessive compulsive disorder (Richter et al., 2012), Alzheimer'sDisease (Alagona et al., 2001), borderline personality disorder (Barnowet al., 2009), Parkinson's disease (Nakashima et al., 1995; Priori et al.,1994a), fibromyalgia (Salerno et al., 2000), and chronic neuropathicpain (Lefaucheur et al., 2006). Pathological prolongation of SP has beenreported in conditions such as stroke (Braune and Fritz, 1995; Classenet al., 1997), cerebellar ataxia (Oechsner and Zangemeister, 1999;Tamburin et al., 2004; Teo et al., 2008), sport related concussion (DeBeaumont et al., 2007, 2009; Tremblay et al., 2011), Huntington's disease(Priori et al., 1994b), generalized seizure (Macdonell et al., 2001), partialseizure during periods with high chance of relapse (Cincotta et al., 2002),unilateral cerebellar stroke with damage of dentate nucleus (Battagliaet al., 2006), abstinent cocaine-dependence (Gjini et al., 2012), and agen-esis of corpus callosum (Fecteau et al., 2006). In addition to these efforts,several studies have further examined the effect of rehabilitation, neuro-modulation and pharmacological interventions on restoration of SPdur. Asexamples, in Parkinson's disease, repetitive TMS (Siebner et al., 2000),eight weeks of intense exercise (Fisher et al., 2008), and dopaminergic(Lefaucheur, 2005) treatment resulted in prolongation of SP. In depres-sion, ten sessions of unilateral ECT prolonged SP (Bajbouj et al., 2006a).In schizophrenia, patients who were treated with clozapine had longerSPdur compared to unmedicated patients (Daskalakis et al., 2008a).Cognitive behavioral therapy prolonged SP in problematic perfectionists(Radhu et al., 2012). Finally, low frequency TMS over premotor cortexbut not motor cortex prolonged SP and improved the hand writingscore in focal dystonia (Murase et al., 2005).
Reviewing the wealth of experimental evidence on the neuro-physiology of SP and the long list of pathological states that lead toSP impairments, as well as the potential therapeutic strategies thatmay restore such impairments, several questions remain: first, withthe duration of the EMG silence as the primary outcome measure,the exact origin of SP (spinal versus cortical) remains unclear. Second,the degree to which local versus remote cortical processes contributeto SPdur remains elusive as it appears that brain areas that are notdirectly stimulated have significant impacts on SPdur (e.g., prolongationof SP in cerebellar stroke and corpus callosum agenesis). Consequently,it remains unclear whether SP merely reflects the impairment of theinhibitory processes of the stimulatedmotor cortex, or whether deficitsin the other motor-related areas and non-motor regions contributesignificantly to SPdur. Thus, more sensitive neurophysiological tech-niques and markers are desirable through which future clinical studiescould further classify and more selectively restore inhibitory impair-ments based on the exact origin and neurophysiology of the underlyingmechanisms.
The combination of concurrent electroencephalography (EEG) withTMS has provided a new way to study the effects of non-invasive brainstimulation and appears particularly suited to address these questions.TMS–EEG complements the H-reflexes and the invasive epiduralrecordings and permits revisiting the classical TMS–EMG paradigmsand delineating, with more precision, neural processes that underliethe MEP modification at the periphery. Thus, a growing number ofTMS–EEG studies have begun to document the EEG correlates ofsingle and paired pulse TMS paradigms in the motor cortex atrest (Farzan et al., 2010a, 2010b, 2010c; Ferreri et al., 2011;Ilmoniemi et al., 1997; Komssi and Kahkonen, 2006; Nikulinet al., 2003; Paus et al., 2001; reviewed in Farzan et al., 2011).However, the EEG correlates of the TMS-induced SP have notbeen described. In this study, we combine TMS–EMG with concurrentEEG to further explore the features and characteristics of local as wellas remote cortical reactivity during the period of EMG silence in healthysubjects.

122 F. Farzan et al. / NeuroImage 83 (2013) 120–134
Methods
Subjects
We studied 18 right-handed healthy subjects (age range = 21–41 years; 13 males and 5 females, age = 31.1 ± 7.0 years, pleasenote that throughout the manuscript descriptive values are reportedas mean ± standard deviation, unless indicated otherwise). Subjectswere recruited through advertisement and psychopathology wasruled out through the personality assessment screener (PsychologicalAssessment Resources, Inc). Exclusion criteria also included a self-reported medical illness or a history of drug or alcohol abuse. In allsubjects, handedness was confirmed using the Oldfield HandednessInventory (Oldfield, 1971). All participants gave their written informedconsent and the protocol was approved by the local ethics committeeat the Centre for Addiction and Mental Health in accordance with theDeclaration of Helsinki.
Data recording
Transcranial magnetic stimulationMonophasic TMS pulses were administered using a Magstim 7 cm
figure-of-eight coil and one Magstim 200 stimulator (Magstim Compa-ny Ltd, UK). At the beginning of each experiment, restingmotor thresh-old was determined by applying single pulses of TMS to the left motorcortex while the coil was placed at the optimal position for elicitingMEPs from the right abductor pollicis brevis (APB) muscle. Restingmotor threshold was defined as the minimum stimulus intensity thatelicited an MEP of more than 50 μV in at least five out of ten trials(Rossini et al., 1994). We determined resting motor threshold onceprior to positioning the EEG cap on the head, and once after. This inten-sity corresponded to an average of 42.2 ± 8.0% of maximum stimulatoroutput without the EEG cap, and 56.6 ± 10.0% with the EEG cap across18 subjects. The optimal positionwasmarked on the EEG capwith a feltpen to ensure identical placement of the coil throughout the experi-ment, and the handle of the coil pointed backward, perpendicular tothe presumed direction of the central sulcus, approximately 45° to themidsagittal line. The direction of the TMS-induced current in the braintissue was posterior–anterior.
ElectromyographyThroughout the experiment, the subjects were seated in a com-
fortable armchair with their hands positioned on a pillow placedover their laps, and they were asked to maintain relaxation as EMGwas monitored on a computer screen, unless instructed to contracttheir muscle. Two disposable surface disc electrodes were placed ina tendon–belly arrangement over the right APB muscle, a groundelectrode was placed over the right forearm, and EMG activity wasacquired through Signal software (Cambridge Electronics Design,UK). The EMG signals were amplified (Intronix Technologies Corpo-ration Model 2024F, Bolton, Ontario, Canada), filtered (band-pass2 Hz to 5 kHz), digitized at 5 kHz (Micro 1401, Cambridge Electron-ics Design, Cambridge, UK), and stored in a laboratory computer foroffline analysis.
Silent period. The SP was recorded during voluntary contraction ofthe right APB muscle by stimulation of the left motor cortex at 140%of resting motor threshold. This corresponded to 79.2 ± 14.0%of stimulator output. A total of fifty stimuli were delivered with aninterstimulus interval of 10 s, while the APB muscle was contractedat 20% of maximum muscle contraction measured by a strain gagemeter. It should be noted that, while in our previous reports we deliv-ered 80–100 pulses (Daskalakis et al., 2008b), in this study we adminis-tered 50 pulses to minimize the possibility of inducing muscle fatigueassociated with repetitive muscle contraction.
ElectroencephalographyEEG signals were acquired through a 64-channel Synamps2 EEG
system (Neuroscan, Compumedics, USA). A 64-channel EEG cap waspositioned on subjects' head and for all electrodes impedance waslowered to ≤5 KΩ. The 64-channel EEG cap included 62 electrodes,one ground electrode, and one reference electrode. Four additionalelectrodes were placed on the outer side of each eye, and above andbelow the left eye to monitor eye movement artifacts. All electrodeswere referenced to an electrode placed over the vertex posterior tothe CZ electrode. EEG signals were recorded with filters set at DC to200 Hz at 20 kHz sampling rate, which was shown to avoid satura-tion of amplifiers and minimize the TMS-related artifact (Daskalakiset al., 2008b). It should be noted while this amplifier setting was effec-tive in this setup, it is recommended that the use of online filters beavoided if possible (Ilmoniemi and Kicic, 2009). Throughout the exper-iments, EEG and EMG were recorded simultaneously.
Data analysis
EMG measures of silent period
Peripheral motor activity. EMG trials were reviewed and trials contam-inated with physiological and TMS artifact were deleted using the com-mercially available software Signal (Cambridge Electronics Design, UK).All trials were also imported into MATLAB (The MathWorks. Inc.Natick, MA, USA) for further analysis as well as visual representationof the data (Fig. 1A).
Duration of silent period. The SPdur was measured from the onset ofMEP to the reoccurrence of any background EMG activity accordingto previously described methods (Farzan et al., 2010c; Saisanenet al., 2008). We also measured the onset of the absolute SP definedas the onset of the period with no EMG activity after the TMS-inducedMEP (Fig. 1A).
Amplitude of motor evoked potentials. For each subject, the meanpeak-to-peak amplitude of MEPs and the maximum amplitude ofthe rectified MEPs were measured.
EEG measures of silent period
TMS-evoked potentials. The EEG recordings were first processed offlineby the commercially available software (Neuroscan, Compumedics,USA). The EEG data were down sampled to 1 kHz sampling frequencyand segmented with respect to the TMS stimulus such that each epochincluded 1000 ms pre-stimulus baseline and a 1000 ms post-stimulusactivity. Epochs were baseline corrected with respect to the TMS-freepre-stimulus interval (−1000 ms to −110 ms). EEG waveformswere then imported into MATLAB R2012a (The MathWorks. Inc.Natick, MA, USA) and further analyses were carried out by the opensource signal processing functions available in the EEGLAB toolboxversion 11b (Delorme and Makeig, 2004). Using EEGLAB ‘scroll’ func-tion, each epoch was manually reviewed and trials and electrodes con-taminated with muscle activity, EOG artifact, and TMS-related artifacts(amplitude N50 μV) contaminatingmore than 60 ms of post TMS stim-ulus were excluded from further analysis. Approximately 13.0 ± 15.0%of trials were excluded in each subject, and the average number ofclean trials per subject was 43 ± 9 trials. The TMS-related artifactsmight have been due to short-lived high voltage TMS-induced artifact(Ives et al., 2006), TMS-induced activation of the peripheral nervesand cranial muscles near the coil (Korhonen et al., 2011; Maki andIlmoniemi, 2011; Mutanen et al., 2012), the movement of the EEGsensors due to the electromotive forces (Sekiguchi et al., 2011) or theTMS-induced nerve andmuscle activation, the TMS-induced accumula-tion of charges and their slow decay at every interface with capacitiveproperties such as the skin-electrodes interface (Veniero et al., 2009) or

123F. Farzan et al. / NeuroImage 83 (2013) 120–134
even the interface between several deeper epithelial layers of the skin(Julkunen et al., 2008). The time window contaminated by the large-amplitude TMS-related artifacts (36 ± 10 ms) was replaced by inter-polating the last artifact-free data point from the pre-stimulus periodand the first artifact-free post-stimulus data point using cubic inter-polation. It should be noted that although the duration of the TMSartifact is relatively long, this does not affect our study since wehave chosen not to include the early brain response. A notch filter(band-stop: 55–65 Hz) was used to remove the 60 Hz noise. EEGsignals were band passed filtered for the frequency range of 1–50 Hzto further minimize contamination by muscle artifact. The infinite im-pulse response (IIR) Butterworth filter of second order was employed
and both forward and backward filtering was applied (MATLAB func-tion ‘filtfilt’) to maintain a zero phase shift. The data was then averagere-referenced. To examine the EEG–EMG correlation across subjects,all clean trials were averaged for each channel (Fig. 1B). The averageof cleaned trials for each channel is referred to as TMS-evoked potentials(TEPs) throughout the manuscript (Figs. 1C and 2A).
Global Mean Field Amplitude. The Global Mean Field Amplitude(GMFA) was calculated for each subject using Eq. (1) adapted fromLehmann and Skrandies (1980). GMFA represents the root of themean of the squared TEP differences at all K electrodes (i.e., Vi(t))from the mean of instantaneous TEP across electrodes (i.e., Vmean(t))(Lehmann and Skrandies, 1980). GMFA identifies the maximumamplitude of the evoked field (Lehmann and Skrandies, 1980) and hasbeen used in previous TMS–EEG literature (Komssi et al., 2004) tomea-sure the global brain response to TMS. For each subject, the amplitudeand latency of peaks in GMFA (i.e., local maxima) were obtained(Fig. 2B).
GMFA ¼ffiffiffiffiffiffiffiffiffiffiffiffiffiffiffiffiffiffiffiffiffiffiffiffiffiffiffiffiffiffiffiffiffiffiffiffiffiffiffiffiffiffiffiffiffiffiffiffiffiffiffiffiffiffiffiffiffiffiffiXK
i
Vi tð Þ−Vmean tð Þð Þ2 !
=K
vuut ð1Þ
Amplitude of TMS-evoked potentials. The maximum amplitude of local(i.e., TEPamp at each electrode) and global (i.e., GMFAamp) TEPs wasobtained by measuring the maximum amplitude of cortical activityduring the absolute SP (Fig. 1C). To more closely approximate thetime window during which cortical activity may correspond to SPgeneration at the periphery the following method was employed.For each subject, the MEP latency (19.21 ± 2.6 ms) was used as anestimate of transmission time to approximate the time it takes forthe cortical activity to reach the APB muscle. The onset and offset ofabsolute SP were used and the offset of SP was leftward shifted bythe MEP latency. We employed the onset of absolute SP to minimizethe confounding contribution of cortical activity corresponding tothe TMS-induced MEP generation. While we leftward shifted the SPoffset by MEP latency, we did not leftward shift the absolute SP onset(latency ~67.1 ms) by MEP latency as TMS artifact contaminates theearly brain response (average 36 ± 10 ms post TMS) and, therefore,
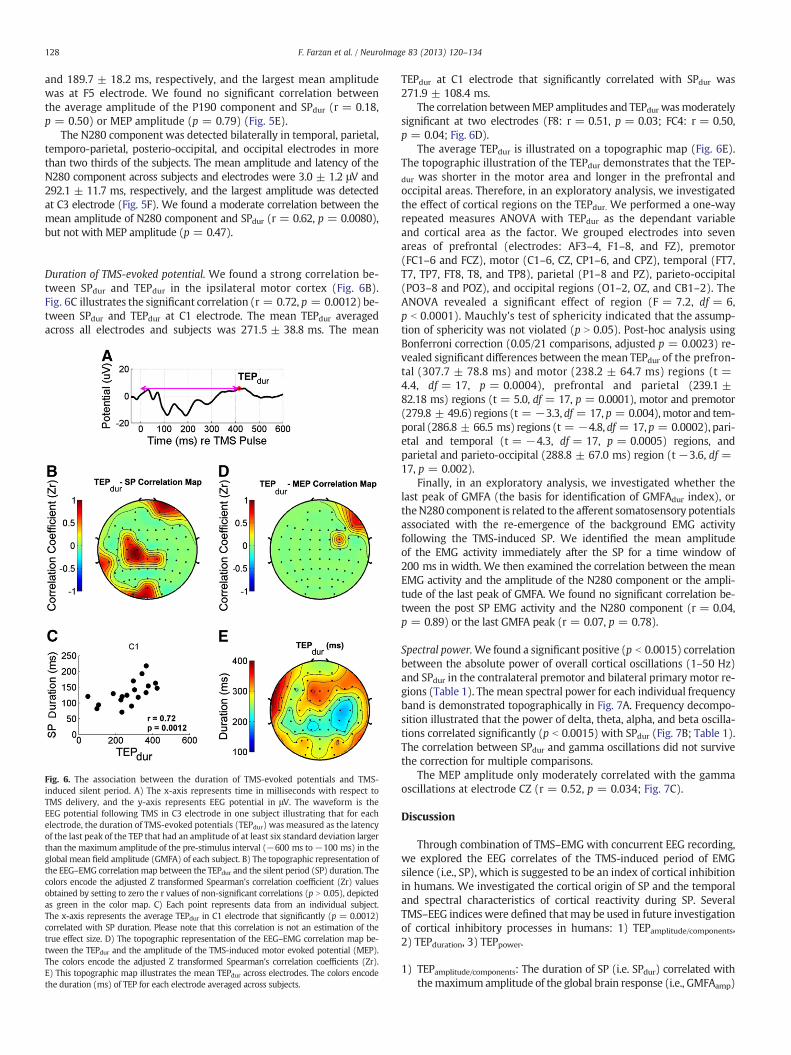
Fig. 1. Illustration of peripheral and cortical components of silent period in a representativesubject. In all figures, the x-axes represent time relative to the onset of TMS administration.The data presented in all panels are taken from the same subject. A) Waveforms representthe rectified EMG recording form theabductor pollicis brevis (APB)muscle for all trials (col-ored waveforms) and averaged across the trials in one subject (the blue bold waveform).The y-axis represents EMG potential in mV. The first solid vertical black line representsthe onset of MEP (MEP latency) which is often marked as the onset of silent period in pre-vious TMS literature. The second vertical black line marks the emergence of backgroundEMG activity and the end of the silent period. The first solid vertical pink line representsthe onset of absolute silent period defined as the beginning of cessation of muscle activity.In B to D, y-axes represent EEG potential in μV. B) Waveforms represent the averageTMS-evoked potentials (TEPs) for each channel. The head plots are the topographic repre-sentation of TEPs at several time points corresponding to previously published peaks iden-tified in TMS–EEG studies (N45, P60, N100, P190, N280) and also 400 ms following TMSdelivery, illustrating the temporal evolution of TEPs. In C–D, the waveform represents theaverage TEP from one electrode (i.e., C3). C) This panel illustrates TEP amplitude (TEPamp)defined as themaximum amplitude of TEP during SP for each channel. The pink lines illus-trate the time interval during which TEPamp was obtained. The first pink line demonstratesthe onset of absolute silent period the second pink line represents the offset of absolutesilent period (black line) shifted by theMEP latency (about 20 ms). D) This panel illustratesTEP duration (TEPdur) for each channel. The red circle illustrates the last peak of TEP thathad an amplitude at least six standard deviation larger than the maximum potential inthe pre-stimulus interval (−600 ms to −100 ms) of the global mean field amplitude(GMFA) in each subject. The arrow illustrates the duration of TEP, defined as the latencyof this last peak with respect to the TMS onset. E) This figure shows the time–frequencyrepresentation of TEP in one electrode. The y-axis represents frequency in Hz. The colorsrepresent absolute power in μV2/Hz. Time–frequency representations were obtained byFast Fourier Transform (FFT) and a sliding window size of 200 ms. FFT was carried out byEEGLAB toolbox (Delorme and Makeig, 2004) and through the function ‘newtimef’ usinghanning FFT tapering.

Fig. 2. Mean temporal characteristics of cortical activity across subjects. A, B) In both figures, x-axes represent time in milliseconds with respect to TMS delivery, and y-axesrepresent EEG potential in μV. A) Waveforms represent mean TMS-evoked potentials (TEPs) for each electrode averaged across subjects. Head plots are topographic illustrationof TEPs amplitude at 60, 100, 190, and 280 ms time points following TMS, which correspond to components reported in previous TMS–EEG literature. B) The waveform demonstratesthe Global Mean Field Amplitude (GMFA) averaged across subjects. The red circles mark the peaks. In C–E, points represent data from individual subjects, and the y-axes represent thesilent period (SP) duration in millisecond. C) The x-axis represents the maximum GMFA amplitude during SP in μV. This figure illustrates the correlation between the SP duration andthe maximum GMFA amplitude during SP. D) The x-axis represents the GMFA duration measured as the latency of last peak that had an amplitude at least six standard deviation largerthan themaximumpotential in the pre-stimulus interval (−600 ms to−100 ms) of the GMFA of each subject. This figure illustrates the correlation between the SP and GMFA duration.E) The x-axis represents the number of GMFA peaks. This figure illustrates the correlation between the number of GMFA peaks and SP duration.
124 F. Farzan et al. / NeuroImage 83 (2013) 120–134
the TEP response within the first 50 ms are not reliably recorded forall subjects. Although not our intention, this procedure may also inpart reduce the confounding contribution of the afferent somatosensorypotentials due to proprioceptive feedback related to the TMS-inducedMEP. In addition, the mean latency of TEPamp was calculated for eachelectrode.
Finally, we investigated the presence, amplitude, and the latencyof TEP components P60, N100, P190 and N280 which have been pre-viously reported in single pulse TMS–EEG studies and which we couldidentify across several channels in this dataset. The P60 componentwas defined as a positive deflection that occurredwithin a timewindowof 50 to 70 ms post TMS pulse. Similarly, N100, P190, and N280 compo-nents were defined as negative, positive, and negative deflections thatoccurred within a time window of 75 to 130 ms, 150 to 230 ms, and250 to 350 ms post TMS pulse, respectively.
Duration of TMS-evoked potentials. The duration of local (i.e., TEPdur ateach electrode) and global (i.e. GMFAdur) cortical responses wereidentified for each subject. In each subject, the duration of TEP andGMFA were defined as the latency of the last peak of the corticalresponse, within the time interval of 50 to 500 ms post TMS, that hadan amplitude at least six standard deviation larger than the peakamplitude in the pre-stimulus interval (−600 ms to −100 ms) of
each subject's GMFA. In addition, for each subject we also identifiedthe total number of peaks in GMFA to further examine the shape ofthe cortical response. Peaks were identified semi-automatically inMATLAB.
Time–frequency representation and spectral power of TMS-evoked poten-tials. The time–frequency representation of cortical activity for eachsubject and electrode was calculated by means of hanning Fast FourierTransform (FFT) tapering using the ‘newtimef’ function in EEGLAB(Fig. 1E). We calculated the absolute time–frequency power withoutbaseline correction and by setting ‘baseline’ in ‘newtimef’ to NaN. Weapplied a sliding window size of 200 ms in width to the average cleandata over a 2-second time interval (−1000 ms to 1000 ms post TMS)to optimally separate out both the low and high frequency components.We then used post-hoc frequency binning to quantify the absolutespectral power (i.e., μv2/Hz) for individual frequency bands of delta(1–3.5 Hz), theta (4–7 Hz), alpha (8–11 Hz), beta (12–28 Hz), andgamma (30–50 Hz) oscillations for a time window starting from 50 mspost TMS to 500 ms post TMS presentation. A time window width of450 ms was chosen as it is long enough to include the mean power ofat least one half cycle of the lowest frequency analyzed but not toolong relative to the mean SPdur. However, it should be noted that thesliding window size of 200 ms used here does not include a full cycle

125F. Farzan et al. / NeuroImage 83 (2013) 120–134
of frequencies less than 5 Hz, and therefore delta frequency may notbe accurately detected.
Statistics
For each variable, descriptive values are reported asmean ± standarddeviation. Using Spearman's rank correlation coefficient, the cortical–peripheral (i.e., EEG–EMG) correlationmapswere obtained to investigatethe relationship between: 1) SPdur and the ‘amplitude’ of cortical activityby examining the correlations between SPdur and GMFAamp and TEPamp
for each electrode (Figs. 1A and C); 2) SPdur and TEP ‘components’ by ex-amining the correlations between SPdur and TEPcomponents of P60, N100,P190 and N280 (Fig. 5), and between SPdur and the number of peaks ofthe GMFA (Fig. 3); 3) SPdur and ‘duration’ of cortical activity by examiningthe correlations between SPdur andGMFAdur and TEPdur for each electrode(Figs. 1A and D); 4) SPdur and the ‘spectral power’ of TEP by examining thecorrelations between SPdur and the overall spectral power (1–50 Hz) andthe spectral power for each frequency band for each electrode (Figs. 1Aand E); 5) Finally, the correlation between the possible confounding con-tribution ofMEP responsewas examined by obtaining the correlation be-tween the maximum peak of the rectified MEP amplitude and TEPamp,
TEPcomponents, TEPdur, the spectral power for each frequency band, aswell as GMFAamp GMFAdur and the number of peaks of the GMFA. Foranalyses 1 through 4, partial correlation was employed controlling forthe MEP amplitude.
For cortical–peripheral correlation maps, correlation coefficientswere presented as head plots and by setting non-significant (p N 0.05)Spearman's r values to zero, depicted as green color in topographicplots (Figs. 4B, D, 6B, D, and 7B, C). The Spearman's r values were Fisherz transformed (i.e., z = 0.5xln[(1 + r)/(1 − r)]) to visually depictthe localization of maximal EEG–EMG correlation across cortical re-gions. Furthermore, to control for multiple comparisons (i.e., 6 GMFA–EMG comparisons + 62 electrodes × 16 TEP–EMG comparison + 8TEPcomponents–EMG comparisons = 1006 comparisons) we used theBenjamini and Hochberg (1995) procedure for controlling for falsediscovery rate (FDR). This method is suggested to be best suited forexploratory studies of focally and broadly distributed effects (Groppeet al., 2011a, 2011b). The names of the electrodes that survived thiscorrection (adjusted p = 0.0015) are highlighted and listed for eachEEG metrics in Table 1. For the purpose of the topographic EEG–EMGcorrelation maps, however, we chose to represent all correlations withp b 0.05 to illustrate also the areas that were moderately correlatedwith SPdur. As such, we refer to correlations with p value between0.0015 and 0.05 as moderately significant correlations. Furthermore,to examine the effect of cortical regions on TEPdur, a one-way repeated
Table 1Summary of EEG–EMG correlation maps corrected for multiple comparisons.
P b 0.0015
SP MEP
TEPamp (FC3), (C3, CP1,CP3), (FT8), (TP8), (C6), (PO8)(r = 0.83), (r = 0.78, r = 0.71, r = 0.74), (r = 0.80),(r = 0.73), (r = 0.77), (r = 0.74)
–
TEPdur C1(r = 0.72)
–
TEPpower
All (FC3), (C3), (FT8), (C6)(r = 0.85), (r = 0.84), (r = 0.78), (r = 0.75)
–
Delta (FC3), (C3, CP1), (FT8), (C6)(r = 0.76), (r = 0.84, r = 0.75), (r = 0.76), (r = 0.74)
–
Theta (FC3), (C3, CP1), (FT8), (C6)(r = 0.81), (r = 0.83, r = 0.74), (r = 0.77), (r = 0.76)
–
Alpha (FC3), (C3), (FT8), (C6, CP4)(r = 0.90), (r = 0.83), (r = 0.76), (r = 0.72, r = 0.71)
–
Beta FC3(r = 0.76)
–
Gamma – –
measure analysis of variance (ANOVA) was employed. Post-hoc pair-wise comparisons were performed using Bonferroni correction toaccount for multiple comparisons, and Mauchly's test of sphericitywas used to determine if the assumption of sphericity was met. Finally,to test the difference between two correlations, we used the methodproposed by Meng et al. This method is based on the Fisher z trans-formation and provides a test and confidence interval for comparingtwo correlated correlations (Meng et al., 1992). Statistical analyses wereperformedusingMATLAB statistical toolbox (TheMathWorks. Inc. Natick,MA, USA) and SPSS 15.0 (SPSS Inc., Chicago, IL, USA).
Results
EMG response to TMS
The mean onset, duration and offset of SP averaged across subjectswere 19.2 ± 2.6 ms, 132.3 ± 38.2 ms and 153.4 ± 37.8 ms, respec-tively. The onset of the absolute SP (i.e., the onset of EMG silenceafter MEP) was 67.1 ± 2.7 ms. The mean peak-to-peak MEP ampli-tude and the mean maximum amplitude of the rectified MEP were26.6 ± 7.6 mV and 14.2 ± 3.4 mV, respectively, averaged acrosssubjects. Please note that our EMG amplitudes seem to be higherthan the average EMG amplitudes reported in other studies. This islikely due to our EMG amplifier setting such as the gain. However,this setting does not affect our results as we used the same amplifiersetting in all subjects.
EEG response to TMS
Global EEG response to TMS
Amplitude of Global Mean Field Amplitude. The average maximumamplitude of the global cortical activity (i.e., GMFAamp) during SPwas 8.8 ± 3.2 μV across subjects. The SPdur correlated moderately(r = 0.63, p = 0.0067) with the GMFAamp (Fig. 2C). We did notfind a correlation between the MEP amplitudes and the GMFAamp
(p = 0.42). The mean latency of GMFAamp was 94.6 ± 21.3 ms acrosssubjects.
Duration of Global Mean Field Amplitude. The mean GMFAdur acrosssubjects was 253.7 ± 118.2 ms. There was a moderately significantcorrelation between SPdur and GMFAdur (r = 0.66, p = 0.0036;Fig. 2D). We did not find a correlation between the MEP amplitudesand the GMFAdur (p = 0.12). The SPdur and the corresponding GMFAdur
in subjects with short (less than one SD below themean SPdur) and longSPdur (more than one SD above the mean SPdur) are illustrated in Fig. 3.
Local EEG response to TMS
Amplitude of TMS-evoked potentials. The correlations between SPdurand TEPamp were significant (p b 0.0015) at multiple electrodes over-laying the bilateral motor, contralateral fronto-temporal, and contra-lateral parieto–occipital cortices (Fig. 4B; Table 1). Fig. 4C illustratesthe strong correlation (r = 0.83, p = 0.00004) between SPdur andthe TEPamp at FC3 electrode. The mean amplitude and latency of theTEPamp averaged across significant electrodes were 9.3 ± 2.2 μV and93.2 ± 6.8 ms, respectively, across subjects.
The correlation betweenMEP amplitudes and TEPampwasmoderatelysignificant at two electrodes (F1: r = 0.50, p = 0.04; CB1: r = 0.49p =0.04 Fig. 4D).
The average TEPamp latency is illustrated on a topographic map(Fig. 4E). The topographic illustration of TEPamp latency demonstratesthat the TEPamp latency was shorter in the ipsilateral hemisphere, inelectrodes closer to the site of stimulation, and longer for the contra-lateral cortex. Therefore, in an exploratory analysis, we compared theTEPamp latency between ipsilateral and contralateral hemisphere.

Fig. 3. Single subject data demonstrating the global brain response to TMS in the silentperiod paradigm. In all figures, the x-axes represent time in milliseconds relative toTMS pulse. In the left column, waveforms represent the Global Mean Field Amplitude(GMFA), the y-axes represent EEG potential in μV, and the red circles represent theGMFA peaks. The right column demonstrates the peripheral EMG silent period (SP),the y-axis represents EMG potential in mV, and waveforms represent the rectified EMGrecording from the abductor pollicis brevis muscle for all trials (colored waveforms) andaveraged across trials (the blue bold waveform). The first solid vertical black line repre-sents the onset of MEP which is often marked as the onset of silent period. The secondvertical black line marks the emergence of background EMG activity and the end of silentperiod. The three rows illustrate the GMFA and the corresponding EMG silent period ofrepresentative subjects with short SP duration (subject #7: SPdur = 90 ms which is ≤one standard deviation from the mean SP duration across subjects), average SP duration(subject #1; SPdur = 133 ms which is approximately the same as mean SP duration)and long SP duration (subject#5: SPdur = 218 ms which is ≥ one standard deviationfrom the mean SP duration).
Fig. 4. The amplitude of TMS-evoked potentials during TMS-induced silent period.A) The x-axis represents time in milliseconds with respect to TMS pulse, and y-axisrepresents EEG potential in μV. The waveform is TMS-evoked potential (TEP) in one elec-trode (i.e., C3) in a subject. Thisfigure illustrates that for each electrode themaximumam-plitude of the TMS-evoked potential (TEPamp) wasmeasuredwithin the time interval thatcorresponded to the peripheral EMG silent period (SP) as illustrated in Figs. 1C and B) Thetopographic representation of the EEG–EMG correlation map between the TEPamp andthe SP duration. The colors encode the adjusted Z transformed Spearman's rank correla-tion coefficient (Zr) values obtained by setting to zero the r values of non-significantcorrelations (p N 0.05), depicted as green in the color map. C) Each point representsdata from an individual subject. The x-axis represents the average TEPamp in FC3 electrodethat significantly (p = 0.00004) correlated with the peripheral SP duration. Please notethat this correlation is not an estimation of the true effect size. D) A topographic represen-tation of the EEG–EMG correlation map between the TEPamp and the amplitude of theTMS-inducedmotor evoked potential (MEP). Similar to panel C, colors encode the adjustedZ transformed Spearman's rank correlation coefficients (Zr). E) The colors encode themeanlatency (ms) of TEPamp relative to TMS delivery for each electrode averaged across subjects.Thismap represents the temporal evolution of the TEPamp that seems to have shorter laten-cies near the stimulation site (i.e., blue colors over the left motor cortex) compared to distalinterconnected cortical regions such as the homologous contralateral hemisphere (i.e., redcolors).
126 F. Farzan et al. / NeuroImage 83 (2013) 120–134
We performed a two-tailed paired-t test comparison between theTEPamp latency in the ipsilateral motor area (mean latencies at elec-trodes FC5, FC3, FC1, C5, C3, C1, CP5, CP3, and CP1) and the contralat-eral motor area (electrodes FC6, FC4, FC2, C6, C4, C2, CP6, CP4, andCP2). We found that the TEPamp latency was slightly (t = −1.8,df = 17, p = 0.08) longer in the contralateral (103.3 ± 26.9 ms)compared to the ipsilateral motor area (93.3 ± 18.04 ms). Furthermore,there was a strong significant correlation between the TEPamp latencyof the contralateral motor area and SPdur (r = 0.84, p = 0.00001)whichwas slightly (p = 0.089, one-tailed (Meng et al., 1992)) strongerthan the correlation between the TEPamp latency in the ipsilateralmotorarea and SPdur (r = 0.69, p = 0.002).
Finally,we found a strong correlation between SPdur and the numberof peaks of GMFA (r = 0.82, p = 0.00005, Fig. 2E). The number of peaksof GMFA did not correlate with MEP amplitudes (p = 0.34).
Components of the TMS-evoked potentials. Following the TMS pulseseveral negative (i.e., N100, N280) and positive (i.e., P60, P190) deflec-tions were seen at the vertex (Figs. 5A–B). We did not consider the ear-lier TEP components (e.g., N15, P30, and N45) since the TMS-related
artifacts contaminated this time window in several subjects. The P60component was observed posterior to the stimulation site (Fig. 5C) inelectrodes corresponding to the ipsilateral motor cortex (i.e., CP1, CP3and C1) in more than two thirds of the subjects. The mean amplitudeand latency of P60 component across subjects and electrodes were5.0 ± 2.1 μV and 58.8 ± 2.5 ms, respectively, and the largest meanamplitude of the P60 component was at electrode T7 (Fig. 5C). Wefound no significant correlation between the average amplitude ofthe P60 component and SPdur (r = 0.36, p = 0.16) or MEP amplitude(p = 0.10) (Fig. 5C).
The N100 component was detected in electrodes corresponding tothe fronto-central, and ipsi- and contralateral motor cortices (i.e. F1,FZ, FC1, FCZ, FC2, FC4, C1, CZ, and C2) in more than two thirds ofthe subjects. The mean amplitude and latency of N100 componentacross subjects and electrodes were 8.6 ± 2.5 μV and 94.3 ± 9.5 ms,respectively, and the largest average amplitude was at FCZ electrode.We found a significant correlation between the average absolute

Fig. 5. The association between TEP components and the TMS-induced silent period. A) This panel shows the average TMS-evoked potentials (TEPs) across subjects in all electrodes.B) This figure illustrates TEP components P60, N100, P190, and N280 in CZ electrode for all subjects (represented by waveforms of different colors) and the average across subjects(solid black waveform). In C–E, the top topographic plots show for each electrode the number of subjects in whom the corresponding TEP component could be identified. Theseplots, therefore, illustrate the average spatial distribution of TEP components across subjects. The bottom topographic plots illustrate the average absolute amplitude of each TEPcomponent across subjects, depicting the location of the maximum amplitude of TEP components. In the scatter plots, each point represents data from an individual subject.These plots illustrate the correlation between the mean absolute amplitude of the TEP components across electrodes and the silent period (SP) duration.
127F. Farzan et al. / NeuroImage 83 (2013) 120–134
amplitude of the N100 component and the SPdur (r = 0.71, p = 0.0014)but not with MEP amplitude (p = 0.66) (Fig. 5D).
The P190 component was detected at FC4 electrode in all subjects,and in more than two thirds of the subjects it was detected at
electrodes corresponding to the ipsilateral and contralateral prefron-tal cortex and contralateral motor cortex (i.e., FP2, AF4, F1, FZ, F2, F4,F6, FC2, FC4, FC6, C2, and C4). The mean amplitude and latency ofP190 component across subjects and electrodes were 6.2 ± 2.5 μV
128 F. Farzan et al. / NeuroImage 83 (2013) 120–134
and 189.7 ± 18.2 ms, respectively, and the largest mean amplitudewas at F5 electrode. We found no significant correlation betweenthe average amplitude of the P190 component and SPdur (r = 0.18,p = 0.50) or MEP amplitude (p = 0.79) (Fig. 5E).
The N280 component was detected bilaterally in temporal, parietal,temporo-parietal, posterio-occipital, and occipital electrodes in morethan two thirds of the subjects. The mean amplitude and latency of theN280 component across subjects and electrodes were 3.0 ± 1.2 μV and292.1 ± 11.7 ms, respectively, and the largest amplitude was detectedat C3 electrode (Fig. 5F). We found a moderate correlation between themean amplitude of N280 component and SPdur (r = 0.62, p = 0.0080),but not with MEP amplitude (p = 0.47).
Duration of TMS-evoked potential. We found a strong correlation be-tween SPdur and TEPdur in the ipsilateral motor cortex (Fig. 6B).Fig. 6C illustrates the significant correlation (r = 0.72, p = 0.0012) be-tween SPdur and TEPdur at C1 electrode. The mean TEPdur averagedacross all electrodes and subjects was 271.5 ± 38.8 ms. The mean
Fig. 6. The association between the duration of TMS-evoked potentials and TMS-induced silent period. A) The x-axis represents time in milliseconds with respect toTMS delivery, and the y-axis represents EEG potential in μV. The waveform is theEEG potential following TMS in C3 electrode in one subject illustrating that for eachelectrode, the duration of TMS-evoked potentials (TEPdur) was measured as the latencyof the last peak of the TEP that had an amplitude of at least six standard deviation largerthan the maximum amplitude of the pre-stimulus interval (−600 ms to−100 ms) in theglobal mean field amplitude (GMFA) of each subject. B) The topographic representation ofthe EEG–EMG correlation map between the TEPdur and the silent period (SP) duration. Thecolors encode the adjusted Z transformed Spearman's correlation coefficient (Zr) valuesobtained by setting to zero the r values of non-significant correlations (p N 0.05), depictedas green in the color map. C) Each point represents data from an individual subject.The x-axis represents the average TEPdur in C1 electrode that significantly (p = 0.0012)correlated with SP duration. Please note that this correlation is not an estimation of thetrue effect size. D) The topographic representation of the EEG–EMG correlation map be-tween the TEPdur and the amplitude of the TMS-induced motor evoked potential (MEP).The colors encode the adjusted Z transformed Spearman's correlation coefficients (Zr).E) This topographic map illustrates the mean TEPdur across electrodes. The colors encodethe duration (ms) of TEP for each electrode averaged across subjects.
TEPdur at C1 electrode that significantly correlated with SPdur was271.9 ± 108.4 ms.
The correlation betweenMEP amplitudes and TEPdur wasmoderatelysignificant at two electrodes (F8: r = 0.51, p = 0.03; FC4: r = 0.50,p = 0.04; Fig. 6D).
The average TEPdur is illustrated on a topographic map (Fig. 6E).The topographic illustration of the TEPdur demonstrates that the TEP-dur was shorter in the motor area and longer in the prefrontal andoccipital areas. Therefore, in an exploratory analysis, we investigatedthe effect of cortical regions on the TEPdur. We performed a one-wayrepeated measures ANOVA with TEPdur as the dependant variableand cortical area as the factor. We grouped electrodes into sevenareas of prefrontal (electrodes: AF3–4, F1–8, and FZ), premotor(FC1–6 and FCZ), motor (C1–6, CZ, CP1–6, and CPZ), temporal (FT7,T7, TP7, FT8, T8, and TP8), parietal (P1–8 and PZ), parieto-occipital(PO3–8 and POZ), and occipital regions (O1–2, OZ, and CB1–2). TheANOVA revealed a significant effect of region (F = 7.2, df = 6,p b 0.0001). Mauchly's test of sphericity indicated that the assump-tion of sphericity was not violated (p N 0.05). Post-hoc analysis usingBonferroni correction (0.05/21 comparisons, adjusted p = 0.0023) re-vealed significant differences between themean TEPdur of the prefron-tal (307.7 ± 78.8 ms) and motor (238.2 ± 64.7 ms) regions (t =4.4, df = 17, p = 0.0004), prefrontal and parietal (239.1 ±82.18 ms) regions (t = 5.0, df = 17, p = 0.0001), motor and premotor(279.8 ± 49.6) regions (t = −3.3, df = 17, p = 0.004),motor and tem-poral (286.8 ± 66.5 ms) regions (t = −4.8, df = 17, p = 0.0002), pari-etal and temporal (t = −4.3, df = 17, p = 0.0005) regions, andparietal and parieto-occipital (288.8 ± 67.0 ms) region (t −3.6, df =17, p = 0.002).
Finally, in an exploratory analysis, we investigated whether thelast peak of GMFA (the basis for identification of GMFAdur index), ortheN280 component is related to the afferent somatosensory potentialsassociated with the re-emergence of the background EMG activityfollowing the TMS-induced SP. We identified the mean amplitudeof the EMG activity immediately after the SP for a time window of200 ms in width. We then examined the correlation between the meanEMG activity and the amplitude of the N280 component or the ampli-tude of the last peak of GMFA. We found no significant correlation be-tween the post SP EMG activity and the N280 component (r = 0.04,p = 0.89) or the last GMFA peak (r = 0.07, p = 0.78).
Spectral power.We found a significant positive (p b 0.0015) correlationbetween the absolute power of overall cortical oscillations (1–50 Hz)and SPdur in the contralateral premotor and bilateral primary motor re-gions (Table 1). The mean spectral power for each individual frequencyband is demonstrated topographically in Fig. 7A. Frequency decompo-sition illustrated that the power of delta, theta, alpha, and beta oscilla-tions correlated significantly (p b 0.0015) with SPdur (Fig. 7B; Table 1).The correlation between SPdur and gamma oscillations did not survivethe correction for multiple comparisons.
The MEP amplitude only moderately correlated with the gammaoscillations at electrode CZ (r = 0.52, p = 0.034; Fig. 7C).
Discussion
Through combination of TMS–EMG with concurrent EEG recording,we explored the EEG correlates of the TMS-induced period of EMGsilence (i.e., SP), which is suggested to be an index of cortical inhibitionin humans. We investigated the cortical origin of SP and the temporaland spectral characteristics of cortical reactivity during SP. SeveralTMS–EEG indices were defined thatmay be used in future investigationof cortical inhibitory processes in humans: 1) TEPamplitude/components,2) TEPduration, 3) TEPpower.
1) TEPamplitude/components: The duration of SP (i.e. SPdur) correlated withthemaximum amplitude of the global brain response (i.e., GMFAamp)
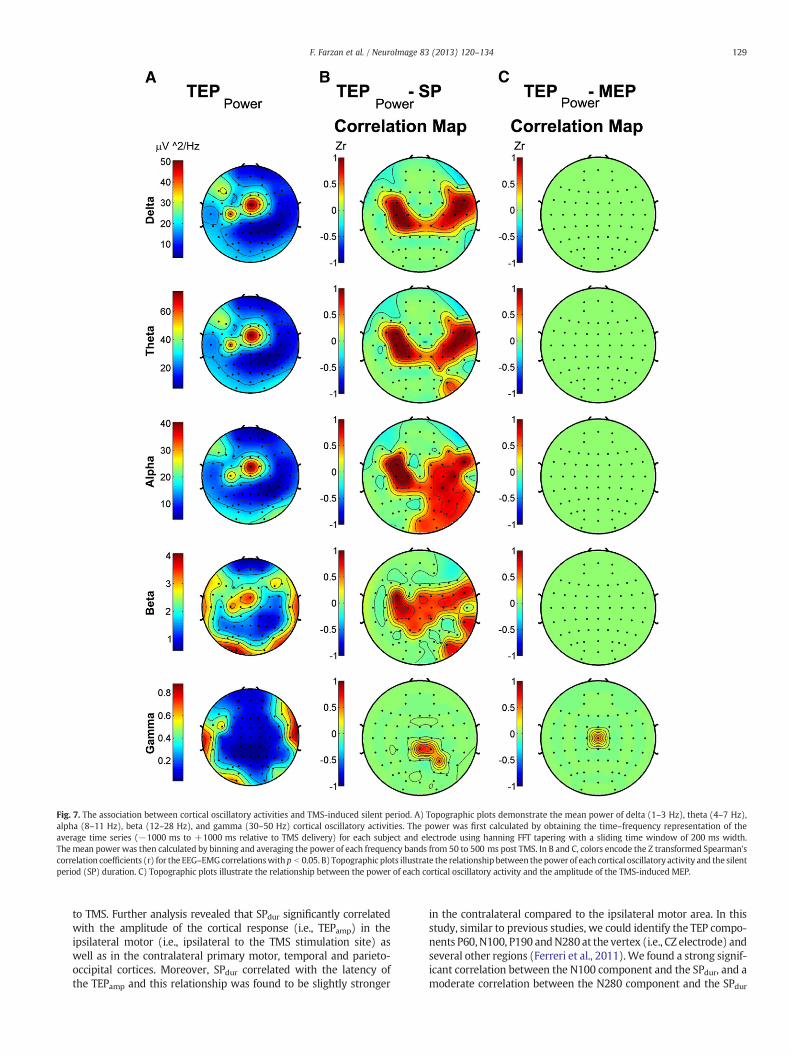
Fig. 7. The association between cortical oscillatory activities and TMS-induced silent period. A) Topographic plots demonstrate the mean power of delta (1–3 Hz), theta (4–7 Hz),alpha (8–11 Hz), beta (12–28 Hz), and gamma (30–50 Hz) cortical oscillatory activities. The power was first calculated by obtaining the time–frequency representation of theaverage time series (−1000 ms to +1000 ms relative to TMS delivery) for each subject and electrode using hanning FFT tapering with a sliding time window of 200 ms width.The mean power was then calculated by binning and averaging the power of each frequency bands from 50 to 500 ms post TMS. In B and C, colors encode the Z transformed Spearman'scorrelation coefficients (r) for the EEG–EMGcorrelationswith p b 0.05. B) Topographic plots illustrate the relationship between thepower of each cortical oscillatory activity and the silentperiod (SP) duration. C) Topographic plots illustrate the relationship between the power of each cortical oscillatory activity and the amplitude of the TMS-induced MEP.
129F. Farzan et al. / NeuroImage 83 (2013) 120–134
to TMS. Further analysis revealed that SPdur significantly correlatedwith the amplitude of the cortical response (i.e., TEPamp) in theipsilateral motor (i.e., ipsilateral to the TMS stimulation site) aswell as in the contralateral primary motor, temporal and parieto-occipital cortices. Moreover, SPdur correlated with the latency ofthe TEPamp and this relationship was found to be slightly stronger
in the contralateral compared to the ipsilateral motor area. In thisstudy, similar to previous studies, we could identify the TEP compo-nents P60, N100, P190 andN280 at the vertex (i.e., CZ electrode) andseveral other regions (Ferreri et al., 2011).We found a strong signif-icant correlation between the N100 component and the SPdur, and amoderate correlation between the N280 component and the SPdur
130 F. Farzan et al. / NeuroImage 83 (2013) 120–134
which was not found for any other peaks or between the TEPcomponents and MEP amplitude.
2) TEPduration: SPdur was moderately associated with the duration ofthe global brain response to TMS (i.e., GMFAdur). It was furtherfound that the SPdur significantly correlated with the duration ofthe cortical response (i.e., TEPdur) in the ipsilateral motor cortex.The mean TEPdur was found to be longer in the prefrontal, temporaland occipital regions relative to motor and parietal cortices.
3) TEPpower: Spectral analyses illustrated that SPdur correlated with theabsolute power of cortical oscillations (1–50 Hz). Frequency decom-position revealed that SPdur was associated with the power of deltato alpha oscillations in the bilateral motor and contralateral motor,fronto-temporal and parietal areas, and correlated with the powerof beta oscillations in the ipsilateral motor area. There were onlymoderately significant and spatially sparse correlations betweenthe amplitude of the TMS-induced MEP and the temporal andspectral EEG indices of SP.
The origin of silent period
The relationship between the peripheral and cortical responses toTMS provides further evidence for the significant contribution ofcortical mechanisms, as contrasted with spinal, in the genesis of theTMS-induced SP. We found a weak and non-significant correlationbetween the MEP amplitude and the EEGmetrics presented here, pro-viding evidence that the TEPs measured 50 ms after the TMS pulse areunlikely to beprimarily related to the afferent somatosensory potentialsassociated with the TMS-induced MEPs. This is consistent with theresults of a previous TMS–EEG study that also found no correlation be-tween the amplitude of TMS-evoked cortical response approximately100 ms post TMS and MEP amplitude (Bender et al., 2005). Instead,the amplitude of the TMS-induced MEP has been shown to correlatewith the amplitude of the early N15–P30 EEG response (Maki andIlmoniemi, 2010). We suggest that the previously described TMS-induced N15–P30 complex and the EEG metrics presented here(i.e., N100 component, TEPamp, and TEPdur) may be regarded as theTMS–EEG markers of the fast excitatory and slow inhibitory corticalmechanisms, respectively, consistent with the results of in vitro andanimal studies as discussed next.
Cortical indices of silent period: temporal characteristics
The temporal characteristics of the cortical response in the CSPparadigm provide further evidence for the involvement of GABAergicneurotransmission in the generation of SP. The mean duration ofcortical reactivity (e.g., GMFAdur: 253.7 ± 118.2 ms) is consistentwith the duration of GABAB receptor neurotransmission (Adrian andMoruzzi, 1939; Deisz, 1999; Krnjevic et al., 1964, 1966; McCormick,1989; Sanger et al., 2001). In the earlier studies of mammalian motorpathways, electrical stimulation applied to an exposed area of cats'motor cortex resulted in an excitatory response followed by a periodof complete inactivity of the pyramidal tract (Adrian and Moruzzi,1939). The excitatory response was reported to last 20 ms followed bya silent period of 150 to 300 ms in duration (Krnjevic et al., 1964).Furthermore, intracellular recordings from slices of the human temporallobe demonstrated three distinct response phases of fast excitatory, fastinhibitory, and slow inhibitory post synaptic potentials (McCormick,1989). Pharmacological assessments associated the slow inhibitoryresponse with the activation of GABAB receptors (McCormick, 1989)which has been documented to have a mean latency-to-peak durationof 135 ms and a mean duration of about 250 ms (Deisz, 1999) consis-tent with the mean TEPdur observed in this study.
The mean latency of cortical response (e.g., GMFAamp latency:99.0 ± 31.5 ms) is consistent with the latency of the TMS-evokedN100 component. Furthermore, the observation that the amplitudeof the N100 component is strongly and selectively related to SPdur
provides further evidence that the TMS–EEG N100 component mayin fact be related to inhibitory mechanism. Previous TMS–EEG studieshave shown that a single TMS pulse applied to the motor cortex atrest generates a prominent EEG peak at a latency of about 100 ms(i.e., N100) relative to the TMS onset. Several investigators have pro-posed that the TMS-evoked N100 component may reflect the activityof GABAergic neurotransmission (Bender et al., 2005; Bonnard et al.,2009; Kicic et al., 2008; Nikulin et al., 2003). In this regard, Nikulinet al. demonstrated that following visually triggered hand movement,the N100 component of EEG response was suppressed while the MEPamplitudes were increased (Nikulin et al., 2003). Similarly, the ampli-tude of the TMS-evoked N100 appears to be reduced when a motorperformance is required at the onset of TMS delivery (Kicic et al.,2008). Furthermore, the N100 component has a larger amplitudeand a longer latency in 7–10 year old children (Bender et al., 2005)and has been suggested to go through maturational changes. A recentTMS–EEG study proposed that N100 may be a marker of abnormalbrain maturation in children with attention deficit hyperactive dis-order (Bruckmann et al., 2012). Therefore, the correlation betweenSPdur and the N100 component and the TEPamp(which has a latencyaround 100 ms) may also provide further support that TMS-evokedN100 response may be partly related to the magnitude of intracorticalinhibitory mechanisms. We suggest that TEPamp (or N100 component)and TEPdur may reflect themagnitude and the duration of GABAB recep-tor activity, respectively, as previously indexed through EMG in LICIand CSP paradigms. Future studies may seek to test this hypothesis bycorrelating LICI with TEPamp and TEPdur, and examining the effects ofpharmacological modulators or specific pathologies.
Cortical indices of silent period: spectral characteristics
The spectral properties of cortical reactivity provide experimentalevidence for the differential involvement of cortical oscillatory activ-ities in SP genesis. The SPdur was related to the power of delta to betacortical oscillations, while gamma oscillations were moderately butnot significantly related to SPdur. The prominent contribution of lowversus high frequency cortical oscillations to SPdur (e.g., alpha versusgamma oscillations) is in line with the proposed functional rolesof cortical oscillations. The cortical alpha oscillations are presentthroughout the cortex, more dominantly in the occipital cortex butalso in the parietal and frontal cortices, and are suggested to reflecta state of lowered excitability and heightened inhibitory processesin the cortex (Brignani et al., 2008; Mathewson et al., 2011). The ob-served strong correlation between SPdur and the TMS-evoked alphaoscillations in both local and remote cortical areas may further reflectthe role of alpha oscillations in mediating inhibitory processes withinand in-between brain regions. Cortical activities within beta-rangefrequency, however, are more dominant in the central region of thecortex, and are associated with movement execution and control. Ithas been hypothesized that the functional role of beta oscillationsmay be related to the maintenance of status quo, such as maintenanceof sensory-motor state (Engel and Fries, 2010), and prolongation ofbeta oscillations may result in the deterioration of flexible behavior(Engel and Fries, 2010). Consistently, the correlation between SPdurand TMS-evoked beta oscillations was confined to the motor cortex.Finally, high frequency gamma oscillations, which were not signifi-cantly related to SPdur, are more prominently observed during higherorder cognitive processing (Fries et al., 2007). Therefore, given thedifferential association of cortical oscillations to SPdur, deficits inspecific cortical oscillatory activities may lead to SPdur impairments.Consequently, SPdur might be a valuable index of the state of thebrain oscillatory activity. This can be further investigated in futurestudies by examining the correlation between pre-stimulus sponta-neous or TMS-induced oscillations (versus TMS-evoked oscillationspresented here) and SPdur. It should also be noted that while we dem-onstrate a correlation between selective cortical oscillations (as well

131F. Farzan et al. / NeuroImage 83 (2013) 120–134
as other EEG indices presented in this manuscript) and SPdur, correla-tion does not imply causality and there is not enough evidence to con-firm that SPdur is a downstream effect of a specific cortical oscillatoryactivity. Future studies could directly test this notion by assessing theimpact of selectively potentiating or suppressing specific cortical oscil-latory activities on SPdur.
Cortical indices of silent period: spatial characteristics
The spatial characteristics of the cortical–peripheral correlationmaps (e.g., Figs. 4B, 6B, and 7B) and the TEPamp latency and TEPdur(Figs. 4E and 6E) provide experimental evidence for the impactof both local and remote cortical areas on the TMS-induced SP, andare consistent with several previous studies. The cortico–peripheralcorrelation maps illustrate that the propagation of TEPs seems to re-sult in engagement of inhibitory mechanisms of not only the stimu-lated region but also the interconnected cortices. Interestingly, therewas a slightly stronger correlation between the SPdur and the TEPamp
latency in the motor regions contralateral to the TMS stimulation site.It has been previously shown that application of a single TMS pulse tothe primary motor cortex at rest results in local neuronal activationthat spreads from the ipsilateralmotor cortex to premotor, contralateralmotor and parietal regions (Ilmoniemi et al., 1997). Similarly, in ourstudy, the spatial characteristics of the TEPamp latency may suggestthat TEPs originate from the ipsilateral motor cortex and reach and en-gage the inhibitory or excitatorymechanisms of the homologousmotorareas at a longer latency. Future studiesmay seek to examine the impactof stimulation intensity on the extent of this propagation. For example,the stimulus–response curve for the EMGmeasures of the SP in a givenindividual can be fitted by a sigmoid function demonstrating a linearincrease of SPdur with increases in stimulation intensity and thenreaching a plateau (Kimiskidis et al., 2005). Future TMS–EEG studiesmay obtain the stimulus–response curve for the EEG indices of SPdurto further characterize the impact of stimulation intensity on the TEPpropagation and the engagement of the inhibitory or excitatory pro-cesses of the remote cortical areas.
In addition, the finding that the mean TEPdur differed across corti-cal areas, with the shortest duration in the motor and the longest inthe prefrontal and temporal regions could be explained in severalways. First, these differences may be attributed to the differences inthe activation threshold across cortical lobes. Since the stimulationintensity was chosen based on the motor tissue threshold, it is con-ceivable that the signal that originated in the motor cortex did notproduce the same level of cortical reactivity across regions. Similarly,head morphology and the non-homogeneity of the skull to cortexdistancemay lead to fluctuations in themagnitude of the brain responserecorded over the skull surface. Another plausible explanation, however,may be related to the natural properties of different cortical regions. In aTMS–EEG study, Rosanova et al. demonstrated that frontal, parietal andoccipital cortices each exhibited their own natural frequency whenstimulated with a single pulse of TMS (Rosanova et al., 2009). Similarly,we have demonstrated that LICI modulates cortical oscillations differen-tially in themotor and prefrontal cortices (Farzan et al., 2009) and therewas no association between the EEG indices of LICI in the dorsolateralprefrontal cortex and motor cortex (Farzan et al., 2010c). Analogouswith these studies, it is possible that TEPdur, that herein we suggestedto be reflective of the duration of GABAB receptor activity, may differacross cortical regions due to factors such as the composition of theunderlying neuronal population, ion channels or concentration of pre-synaptic GABA available for release in the synaptic cleft. However,it should be noted that unlike the studies conducted by Farzan et al.(2009) and Rosanova et al. (2009), only themotor cortexwas stimulatedin the current study, and thus the differential responses across regionsare not in response to direct cortical stimulation of these regions.
The spatially distributed effect of TMS is also consistent withthe working mechanism of TMS as discussed in the Introduction.
Unlike TES that primarily activates the axon initial of the pyramidal neu-rons, TMS is suggested to activate pyramidal neurons transynapticallythrough activation of excitatory and inhibitory interneurons (Day et al.,1989). The horizontal orientation of interneurons may facilitate theactivation and propagation of evoked activity across cortical regionsrecruiting excitatory and inhibitory circuitries along the propagationpathway. This may also, in part, explain the longer duration of TMS(as compared to TES)-induced SP as discussed in the Introduction.
Based on these observations, therefore, one may propose that thecortical component of the TMS-induced SP is a net result of interac-tion among several cortical areas and their excitatory and inhibitorycircuitries. That is, a suprathreshold TMS, capable of activating theslow acting GABAB receptor mediated neurotransmission, wouldinitially activate the cortical tissue closest to the stimulation site leadingto generation of both excitatory and inhibitory post synaptic potentialsnear the stimulation site. This initial perturbation, if strong enough,maybe followed by indirect and secondary activation of the interconnectedneighboring and remote cortical tissues, thereby eliciting a cascadeof interaction within a distributed network. Consequently, the netoutcome of this interaction, rather than the local inhibitory circuitryexclusively, may shape the EMG silent period at the periphery. If true,the integrity of the connectivity between cortical areas should influenceSPdur and the modification of cortico-cortical connectivity should resultin shortening or prolongation of SP.
Indeed, there are converging lines of evidence in support of thisproposal. Consistent with this view, a recent fMRI study demonstrat-ed that the duration of ipsilateral SP was related to the coupling ofprimary motor cortex and supplementary motor area (Sarfeld et al.,2012). Ipsilateral SP is a period of EMG silence that is obtainedwhen a suprathreshold TMS is applied to the motor cortex ipsilateralto the target muscle and is suggested to be mediated by transcallosalinhibition (Wassermann et al., 1991). Furthermore, the contraction ofthe lower limb muscles was shown to reduce the TMS-induced SPdurof the upper limb muscle (Tazoe et al., 2007). The modulatory influ-ence of remote muscles on SPdur was suggested to have a corticalorigin and was proposed to be related to a decrease in the excitabilityof the cortical inhibitory pathways (Tazoe et al., 2007). Moreover, SPwas prolonged in patients with focal cortical dysgenesis outside theprimary motor cortex (Cincotta et al., 2000). Finally, previous studiesreported on the prolongation or reduction of SP in the primary motorcortex following perturbation of non-motor regions through repeti-tive TMS (Furukawa et al., 2010; Munchau et al., 2002; Rollnik et al.,2000). As examples, it was shown that low frequency TMS appliedto the midline prefrontal cortex (FZ electrode), but not to the motorcortex, resulted in significant prolongation of SP in the motor cortex(Furukawa et al., 2010). In another study, repetitive TMS over thepremotor, but not motor cortex, shortened the SP in the motor cortex(Munchau et al., 2002). The involvement of a distributed network inSP genesis may provide a mechanistic explanation for several clinicalobservations. This can be explored in future studies by concurrentlyrecording EEG when exploring the impairment of SP in patientpopulations.
Some limitations should be carefully considered when interpretingthe findings of this study. First, correlation does not imply causalityand future studies should more directly examine the causal relation-ships between the EEG metrics presented here and the TMS-inducedSP andMEP. Similarly, it should benoted thatwhilewe found a selectivecorrelation between specific TEP components and SP duration, andalthough we did not find an associate between the late TEP (GMFA)peaks and the background EMG, we cannot still fully disentangle thecontribution of excitatory versus inhibitory mechanisms to the lateTEP components. Similarly, althoughwe did notfind strong associationsbetween the TMS-induced MEP amplitude and the EEG metrics, wecannot fully rule out the possibility that the earlier EEG responses(e.g., b90 ms) are contaminated by the proprioceptive feedback relatedto the TMS-induced MEPs. In this regard, due to the relatively large

132 F. Farzan et al. / NeuroImage 83 (2013) 120–134
duration of the TMS-related artifacts (~36 mspost TMS pulse), wewerenot able to examine the early TEP components that might have beenlinked to MEP generation and hence more strongly associated withthe TMS-induced MEP amplitude. Another limitation of this study isthe limited number of TMS stimuli. While in our previous studies werelied on 80–100 pulses, we administered 50 pulses in this study toavoid muscle fatigue. Future TMS–EEG studies should more systemati-cally examine the minimum number of stimuli that are required toobtain reliable results. Finally, we evaluated the EMG–EEG correlationmaps at the group level. Future studies should more carefully examinethe EMG–EEG correlation map within each subject and at the single-trial level to also comment on the association between the EEG versusEMG variability.
Conclusions
In this study, we explored the local and distributed corticaldynamics that may underlie TMS-induced SP. In particular, we presentnew EEG measures of TMS-induced SP (e.g., TEPamp/component, TEPdur,and TEPpower) that provide important insights about the mechanismsthat may underlie cortical inhibition, and may offer more sensitiveinvestigative tools for cortical reactivity in neuropsychiatric disorders.While EMG measures provide an index for the peripheral componentof cortical stimulation, EEG markers permit examination of the corticalsubstrates that contribute to SP generation. Future TMS–EEG studies arewarranted to explore the EEG measures of SP in patients with bothprolonged and reduced SP to further evaluate the validity, reliabilityand sensitivity of these indices as neurophysiological underpinningsof GABAmediated inhibitory processes. However, we should emphasizethat correlation does not imply causality and the results of the currentstudy should be used as a guide to design future hypothesis-drivenstudies aimed at examining the casual relationships between severalof these EEGmarkers and the TMS-induced SP generation. For example,neuromodulatory interventions such as repetitive TMS or transcranialalternative current stimulation (tACS) may be employed to enhancethe power of specific cortical oscillatory activity and examine theeffect of this intervention on the duration and amplitude of theTMS-induced SP versus TMS-induced MEP, respectively. Furthermore,neuromodulatory interventions, such as repetitive TMS, may be usedto modify the connectivity and the excitability of the local and remotecortical regions to further evaluate the impact of cortico-cortical con-nectivity on cortical inhibitory processes. Finally, future studies shouldalso investigate the EEG features prior to or at the time of TMS deliverythat can predict the duration and the amplitude of the TMS-induced SPversus MEP, respectively. Such endeavors would enhance our under-standing of inhibitory mechanisms in health and disease and could aidin the design of disease specific and individually tailored therapies.
Acknowledgments
FF was supported by the Canadian Institute of Health Research(CIHR) fellowship award (201102MFE-246635-181538). This studywas supported in part by the Harvard-Thorndike Clinical ResearchCenter at Beth Israel Deaconess Medical Center integrated in theHarvard Clinical and Translational Science Center (grants M01-RR-01066 and UL1 RR025758 from the National Center for ResearchResources, National Institutes of Health). PBF is supported by anNHMRC Practitioner Fellowship. This work was also supported inpart by the Ontario Mental Health Foundation (OMHF), the Brain andBehavior Research Foundation and the Temerty andGrant Family throughthe Centre for Addiction and Mental Health (CAMH) Foundation.
References
Adrian, E.D., Moruzzi, G., 1939. Impulses in the pyramidal tract. J. Physiol. 97, 153–199.
Alagona, G., Bella, R., Ferri, R., Carnemolla, A., Pappalardo, A., Costanzo, E., Pennisi, G., 2001.Transcranial magnetic stimulation in Alzheimer disease: motor cortex excitability andcognitive severity. Neurosci. Lett. 314, 57–60.
Bajbouj, M., Lang, U.E., Niehaus, L., Hellen, F.E., Heuser, I., Neu, P., 2006a. Effects of rightunilateral electroconvulsive therapy on motor cortical excitability in depressivepatients. J. Psychiatr. Res. 40, 322–327.
Bajbouj, M., Lisanby, S.H., Lang, U.E., Danker-Hopfe, H., Heuser, I., Neu, P., 2006b.Evidence for impaired cortical inhibition in patients with unipolar major depression.Biol. Psychiatry 59, 395–400.
Barker, A.T., Jalinous, R., Freeston, I.L., 1985. Non-invasive magnetic stimulation of humanmotor cortex. Lancet 1, 1106–1107.
Barnow, S., Volker, K.A., Moller, B., Freyberger, H.J., Spitzer, C., Grabe, H.J., Daskalakis, Z.J.,2009. Neurophysiological correlates of borderline personality disorder: a transcranialmagnetic stimulation study. Biol. Psychiatry 65, 313–318.
Battaglia, F., Quartarone, A., Ghilardi, M.F., Dattola, R., Bagnato, S., Rizzo, V., Morgante, L.,Girlanda, P., 2006. Unilateral cerebellar stroke disrupts movement preparation andmotor imagery. Clin. Neurophysiol. 117, 1009–1016.
Bender, S., Basseler, K., Sebastian, I., Resch, F., Kammer, T., Oelkers-Ax, R., Weisbrod, M.,2005. Electroencephalographic response to transcranial magnetic stimulation inchildren: evidence for giant inhibitory potentials. Ann. Neurol. 58, 58–67.
Benjamini, Y., Hochberg, Y., 1995. Controlling the false discovery rate: a practical andpowerful approach to multiple testing. J. R. Stat. Soc. 1, 289–300.
Benwell, N.M., Mastaglia, F.L., Thickbroom, G.W., 2007. Differential changes in long-interval intracortical inhibition and silent period duration during fatiguing handexercise. Exp. Brain Res. 179, 255–262.
Bonnard, M., Spieser, L., Meziane, H.B., de Graaf, J.B., Pailhous, J., 2009. Prior intentioncan locally tune inhibitory processes in the primary motor cortex: direct evidencefrom combined TMS–EEG. Eur. J. Neurosci. 30, 913–923.
Braune, H.J., Fritz, C., 1995. Transcranial magnetic stimulation-evoked inhibition ofvoluntary muscle activity (silent period) is impaired in patients with ischemichemispheric lesion. Stroke 26, 550–553.
Brignani, D., Manganotti, P., Rossini, P.M., Miniussi, C., 2008. Modulation of corticaloscillatory activity during transcranial magnetic stimulation. Hum. Brain Mapp.29, 603–612.
Bruckmann, S., Hauk, D., Roessner, V., Resch, F., Freitag, C.M., Kammer, T., Ziemann, U.,Rothenberger, A., Weisbrod, M., Bender, S., 2012. Cortical inhibition in attentiondeficit hyperactivity disorder: new insights from the electroencephalographic responseto transcranial magnetic stimulation. Brain 135 (Pt 7), 2215–2230.
Chen, R., Lozano, A.M., Ashby, P., 1999. Mechanism of the silent period following trans-cranial magnetic stimulation. Evidence from epidural recordings. Exp. Brain Res.128, 539–542.
Cincotta, M., Borgheresi, A., Guidi, L., Macucci, M., Cosottini, M., Lambruschini, P.,Benvenuti, F., Zaccara, G., 2000. Remote effects of cortical dysgenesis on the primarymotor cortex: evidence from the silent period following transcranial magnetic stimu-lation. Clin. Neurophysiol. 111, 1340–1345.
Cincotta, M., Borgheresi, A., Benvenuti, F., Liotta, P., Marin, E., Zaccara, G., 2002. Corticalsilent period in two patients with meningioma and preoperative seizures: a pre-and postsurgical follow-up study. Clin. Neurophysiol. 113, 597–603.
Classen, J., Schnitzler, A., Binkofski, F., Werhahn, K.J., Kim, Y.S., Kessler, K.R., Benecke, R.,1997. The motor syndrome associated with exaggerated inhibition within theprimary motor cortex of patients with hemiparetic. Brain 120 (Pt 4), 605–619.
Daskalakis, Z.J., Christensen, B.K., Chen, R., Fitzgerald, P.B., Zipursky, R.B., Kapur, S.,2002. Evidence for impaired cortical inhibition in schizophrenia using transcranialmagnetic stimulation. Arch. Gen. Psychiatry 59, 347–354.
Daskalakis, Z.J., Christensen, B.K., Fitzgerald, P.B., Moller, B., Fountain, S.I., Chen, R.,2008a. Increased cortical inhibition in persons with schizophrenia treated withclozapine. J. Psychopharmacol. 22, 203–209.
Daskalakis, Z.J., Farzan, F., Barr, M.S., Maller, J.J., Chen, R., Fitzgerald, P.B., 2008b. Long-interval cortical inhibition from the dorsolateral prefrontal cortex: a TMS–EEGstudy. Neuropsychopharmacology 33, 2860–2869.
Day, B.L., Dressler, D., Maertens de Noordhout, A., Marsden, C.D., Nakashima, K.,Rothwell, J.C., Thompson, P.D., 1989. Electric and magnetic stimulation of humanmotor cortex: surface EMG and single motor unit responses. J. Physiol. 412, 449–473.
De Beaumont, L., Lassonde, M., Leclerc, S., Theoret, H., 2007. Long-term and cumulativeeffects of sports concussion on motor cortex inhibition. Neurosurgery 61, 329–336(discussion 336–7).
De Beaumont, L., Theoret, H., Mongeon, D., Messier, J., Leclerc, S., Tremblay, S.,Ellemberg, D., Lassonde, M., 2009. Brain function decline in healthy retired athleteswho sustained their last sports concussion in early adulthood. Brain 132, 695–708.
Deisz, R.A., 1999. GABA(B) receptor-mediated effects in human and rat neocorticalneurones in vitro. Neuropharmacology 38, 1755–1766.
Delorme, A., Makeig, S., 2004. EEGLAB: an open source toolbox for analysis of single-trial EEG dynamics including independent component analysis. J. Neurosci. Methods134, 9–21.
Di Lazzaro, V., Oliviero, A., Mazzone, P., Pilato, F., Saturno, E., Insola, A., Visocchi, M.,Colosimo, C., Tonali, P.A., Rothwell, J.C., 2002. Direct demonstration of long latencycortico-cortical inhibition in normal subjects and in a patient with vascular parkin-sonism. Clin. Neurophysiol. 113, 1673–1679.
Engel, A.K., Fries, P., 2010. Beta-band oscillations—signalling the status quo? Curr. Opin.Neurobiol. 20, 156–165.
Farzan, F., Barr, M.S., Wong, W., Chen, R., Fitzgerald, P.B., Daskalakis, Z.J., 2009. Suppressionof gamma-oscillations in the dorsolateral prefrontal cortex following long intervalcortical inhibition: a TMS–EEG study. Neuropsychopharmacology 34, 1543–1551.
Farzan, F., Barr, M.S., Levinson, A.J., Chen, R., Wong, W., Fitzgerald, P.B., Daskalakis, Z.J.,2010a. Evidence for gamma inhibition deficits in the dorsolateral prefrontal cortexof patients with schizophrenia. Brain 133, 1505–1514.

133F. Farzan et al. / NeuroImage 83 (2013) 120–134
Farzan, F., Barr, M.S., Levinson, A.J., Chen, R., Wong, W., Fitzgerald, P.B., Daskalakis, Z.J.,2010b. Reliability of long-interval cortical inhibition in healthy human subjects:a TMS–EEG study. J. Neurophysiol. 104, 1339–1346.
Farzan, F., Barr, M.S., Levinson, A.J., Chen, R., Wong, W., Fitzgerald, P.B., Daskalakis, Z.J.,2010c. Reliability of long interval cortical inhibition in healthy human subjects:a TMS–EEG study. J. Neurophysiol. 104 (3), 1339–1346.
Farzan, F., Barr, M.S., Fitzgerald, P.B., Daskalakis, Z.J., 2011. Combination of transcranialmagnetic stimulationwith electromyography and electroencephalography: applicationin diagnosis of neuropsychiatric disorders. EMG Methods for Evaluating Muscle andNerve Function, InTech Open Access.
Fecteau, S., Lassonde, M., Theoret, H., 2006. Intrahemispheric dysfunction in primarymotor cortex without corpus callosum: a transcranial magnetic stimulation study.BMC Neurol. 6, 21.
Ferreri, F., Pasqualetti, P., Maatta, S., Ponzo, D., Ferrarelli, F., Tononi, G., Mervaala, E.,Miniussi, C., Rossini, P.M., 2011. Human brain connectivity during single and pairedpulse transcranial magnetic stimulation. NeuroImage 54, 90–102.
Fisher, B.E., Wu, A.D., Salem, G.J., Song, J., Lin, C.H., Yip, J., Cen, S., Gordon, J., Jakowec, M.,Petzinger, G., 2008. The effect of exercise training in improving motor performanceand corticomotor excitability in people with early Parkinson's disease. Arch. Phys.Med. Rehabil. 89, 1221–1229.
Fitzgerald, P.B., Brown, T.L., Daskalakis, Z.J., Kulkarni, J., 2002. A transcranial magneticstimulation study of inhibitory deficits in the motor cortex in patients with schizo-phrenia. Psychiatry Res. 114, 11–22.
Fitzgerald, P.B., Brown, T.L., Marston, N.A., Oxley, T., De Castella, A., Daskalakis, Z.J.,Kulkarni, J., 2004. Reduced plastic brain responses in schizophrenia: a transcranialmagnetic stimulation study. Schizophr. Res. 71, 17–26.
Fries, P., Nikolic, D., Singer, W., 2007. The gamma cycle. Trends Neurosci. 30, 309–316.Fuhr, P., Agostino, R., Hallett, M., 1991. Spinal motor neuron excitability during the
silent period after cortical stimulation. Electroencephalogr. Clin. Neurophysiol.81, 257–262.
Furukawa, T., Toyokura, M., Masakado, Y., 2010. Suprathreshold 0.2 Hz repetitivetranscranial magnetic stimulation (rTMS) over the prefrontal area. Tokai J. Exp.Clin. Med. 35, 29–33.
Gjini, K., Ziemann, U., Napier, T.C., Boutros, N., 2012. Dysbalance of cortical inhibitionand excitation in abstinent cocaine-dependent patients. J. Psychiatr. Res. 46,248–255.
Groppe, D.M., Urbach, T.P., Kutas, M., 2011a. Mass univariate analysis of event-related brain potentials/fields I: a critical tutorial review. Psychophysiology48, 1711–1725.
Groppe, D.M., Urbach, T.P., Kutas, M., 2011b. Mass univariate analysis of event-relatedbrain potentials/fields II: Simulation studies. Psychophysiology 48, 1726–1737.
Ilmoniemi, R.J., Kicic, D., 2009. Methodology for combined TMS and EEG. Brain Topogr.22, 233–248.
Ilmoniemi, R.J., Virtanen, J., Ruohonen, J., Karhu, J., Aronen, H.J., Naatanen, R., Katila, T.,1997. Neuronal responses to magnetic stimulation reveal cortical reactivity andconnectivity. Neuroreport 8, 3537–3540.
Inghilleri, M., Berardelli, A., Cruccu, G., Manfredi, M., 1993. Silent period evokedby transcranial stimulation of the human cortex and cervicomedullary junction.J. Physiol. 466, 521–534.
Inghilleri, M., Berardelli, A., Marchetti, P., Manfredi, M., 1996. Effects of diazepam,baclofen and thiopental on the silent period evoked by transcranial magnetic stimula-tion in humans. Exp. Brain Res. 109, 467–472.
Ives, J.R., Rotenberg, A., Poma, R., Thut, G., Pascual-Leone, A., 2006. Electroencephalographicrecording during transcranial magnetic stimulation in humans and animals.Clin. Neurophysiol. 117, 1870–1875.
Julkunen, P., Paakkonen, A., Hukkanen, T., Kononen, M., Tiihonen, P., Vanhatalo, S.,Karhu, J., 2008. Efficient reduction of stimulus artefact in TMS–EEG by epithelialshort-circuiting by mini-punctures. Clin. Neurophysiol. 119, 475–481.
Kapogiannis, D., Wassermann, E.M., 2008. Transcranial magnetic stimulation in ClinicalPharmacology. Cent. Nerv. Syst. Agents Med. Chem. 8, 234–240.
Kicic, D., Lioumis, P., Ilmoniemi, R.J., Nikulin, V.V., 2008. Bilateral changes inexcitability of sensorimotor cortices during unilateral movement: combinedelectroencephalographic and transcranial magnetic stimulation study. Neuroscience152, 1119–1129.
Kimiskidis, V.K., Papagiannopoulos, S., Sotirakoglou, K., Kazis, D.A., Kazis, A., Mills, K.R.,2005. Silent period to transcranial magnetic stimulation: construction and proper-ties of stimulus–response curves in healthy volunteers. Exp. Brain Res. 163, 21–31.
Knikou, M., 2008. The H-reflex as a probe: pathways and pitfalls. J. Neurosci. Methods171, 1–12.
Komssi, S., Kahkonen, S., 2006. The novelty value of the combined use of electro-encephalography and transcranial magnetic stimulation for neuroscience research.Brain Res. Brain Res. Rev. 52, 183–192.
Komssi, S., Kahkonen, S., Ilmoniemi, R.J., 2004. The effect of stimulus intensity on brainresponses evoked by transcranial magnetic stimulation. Hum. Brain Mapp. 21,154–164.
Korhonen, R.J., Hernandez-Pavon, J.C., Metsomaa, J., Maki, H., Ilmoniemi, R.J., Sarvas, J.,2011. Removal of large muscle artifacts from transcranial magnetic stimulation-evoked EEG by independent component analysis. Med. Biol. Eng. Comput. 49,397–407.
Krnjevic, K., Randic, M., Straughan, D.W., 1964. Cortical inhibition. Nature 201,1294–1296.
Krnjevic, K., Randic, M., Straughan, D.W., 1966. An inhibitory process in the cerebralcortex. J. Physiol. 184, 16–48.
Lefaucheur, J.P., 2005. Motor cortex dysfunction revealed by cortical excitability studiesin Parkinson's disease: influence of antiparkinsonian treatment and cortical stimulation.Clin. Neurophysiol. 116, 244–253.
Lefaucheur, J.P., Drouot, X., Menard-Lefaucheur, I., Keravel, Y., Nguyen, J.P., 2006. Motorcortex rTMS restores defective intracortical inhibition in chronic neuropathic pain.Neurology 67, 1568–1574.
Lehmann, D., Skrandies, W., 1980. Reference-free identification of componentsof checkerboard-evoked multichannel potential fields. Electroencephalogr.Clin. Neurophysiol. 48, 609–621.
Levinson, A.J., Young, L.T., Fitzgerald, P.B., Daskalakis, Z.J., 2007. Cortical inhibitorydysfunction in bipolar disorder: a study using transcranial magnetic stimulation.J. Clin. Psychopharmacol. 27, 493–497.
Levinson, A.J., Fitzgerald, P.B., Favalli, G., Blumberger, D.M., Daigle, M., Daskalakis, Z.J.,2010. Evidence of cortical inhibitory deficits in major depressive disorder. Biol.Psychiatry 67, 458–464.
Macdonell, R.A., King, M.A., Newton, M.R., Curatolo, J.M., Reutens, D.C., Berkovic, S.F.,2001. Prolonged cortical silent period after transcranial magnetic stimulation ingeneralized epilepsy. Neurology 57, 706–708.
Maki, H., Ilmoniemi, R.J., 2010. The relationship between peripheral and early cortical ac-tivation induced by transcranial magnetic stimulation. Neurosci. Lett. 478 (1), 24–28.
Maki, H., Ilmoniemi, R.J., 2011. Projecting out muscle artifacts from TMS-evoked EEG.NeuroImage 54, 2706–2710.
Marsden, C.D., Merton, P.A., Morton, H.B., 1983. Direct electrical stimulation ofcorticospinal pathways through the intact scalp in human subjects. Adv. Neurol.39, 387–391.
Mathewson, K.E., Lleras, A., Beck, D.M., Fabiani, M., Ro, T., Gratton, G., 2011. Pulsedout of awareness: EEG alpha oscillations represent a pulsed-inhibition of ongoingcortical processing. Front. Psychol. 2, 99.
McCormick, D.A., 1989. GABA as an inhibitory neurotransmitter in human cerebralcortex. J. Neurophysiol. 62, 1018–1027.
McDonnell, M.N., Orekhov, Y., Ziemann, U., 2006. The role of GABA(B) receptorsin intracortical inhibition in the human motor cortex. Exp. Brain Res. 173, 86–93.
Meng, X., Rosenthal, R., Rubin, D.B., 1992. Comparing correlated correlation coeffi-cients. Psychol. Bull. 111, 172–175.
Munchau, A., Bloem, B.R., Irlbacher, K., Trimble, M.R., Rothwell, J.C., 2002. Functionalconnectivity of human premotor andmotor cortex exploredwith repetitive transcranialmagnetic stimulation. J. Neurosci. 22, 554–561.
Murase, N., Rothwell, J.C., Kaji, R., Urushihara, R., Nakamura, K., Murayama, N., Igasaki, T.,Sakata-Igasaki, M., Mima, T., Ikeda, A., Shibasaki, H., 2005. Subthreshold low-frequency repetitive transcranial magnetic stimulation over the premotor cortexmodulates writer's cramp. Brain 128, 104–115.
Mutanen, T., Maki, H., Ilmoniemi, R.J., 2012. The effect of stimulus parameters onTMS–EEG muscle artifacts. Brain Stimul. 6 (3), 371–376.
Nakamura, H., Kitagawa, H., Kawaguchi, Y., Tsuji, H., 1997. Intracortical facilitation andinhibition after transcranial magnetic stimulation in conscious humans. J. Physiol.498 (Pt 3), 817–823.
Nakashima, K., Wang, Y., Shimoda, M., Sakuma, K., Takahashi, K., 1995. Shortened silentperiod produced by magnetic cortical stimulation in patients with Parkinson'sdisease. J. Neurol. Sci. 130, 209–214.
Nikulin, V.V., Kicic, D., Kahkonen, S., Ilmoniemi, R.J., 2003. Modulation of electroencepha-lographic responses to transcranial magnetic stimulation: evidence for changes incortical excitability related to movement. Eur. J. Neurosci. 18, 1206–1212.
Oechsner, M., Zangemeister, W.H., 1999. Prolonged postexcitatory inhibition aftertranscranial magnetic stimulation of the motor cortex in patients with cerebellarataxia. J. Neurol. Sci. 168, 107–111.
Oldfield, R.C., 1971. The assessment and analysis of handedness: the Edinburgh inventory.Neuropsychologia 9, 97–113.
Paus, T., Sipila, P.K., Strafella, A.P., 2001. Synchronization of neuronal activity inthe human primary motor cortex by transcranial magnetic stimulation: an EEGstudy. J. Neurophysiol. 86, 1983–1990.
Priori, A., Berardelli, A., Inghilleri, M., Accornero, N., Manfredi, M., 1994a. Motor corticalinhibition and the dopaminergic system. Pharmacological changes in the silent periodafter transcranial brain stimulation in normal subjects, patients with Parkinson'sdisease and drug-induced parkinsonism. Brain 117 (Pt 2), 317–323.
Priori, A., Berardelli, A., Inghilleri, M., Polidori, L., Manfredi, M., 1994b. Electro-myographic silent period after transcranial brain stimulation in Huntington's disease.Mov. Disord. 9, 178–182.
Radhu, N., Daskalakis, Z.J., Guglietti, C.L., Farzan, F., Barr, M.S., Arpin-Cribbie, C.A.,Fitzgerald, P.B., Ritvo, P., 2012. Cognitive behavioral therapy-related increases incortical inhibition in problematic perfectionists. Brain Stimul. 5, 44–54.
Richter, M.A., de Jesus, D.R., Hoppenbrouwers, S., Daigle, M., Deluce, J., Ravindran, L.N.,Fitzgerald, P.B., Daskalakis, Z.J., 2012. Evidence for cortical inhibitory and excitatorydysfunction in obsessive compulsive disorder. Neuropsychopharmacology 37,1144–1151.
Rollnik, J.D., Schubert, M., Dengler, R., 2000. Subthreshold prefrontal repetitive transcranialmagnetic stimulation reduces motor cortex excitability. Muscle Nerve 23, 112–114.
Rosanova, M., Casali, A., Bellina, V., Resta, F., Mariotti, M., Massimini, M., 2009. Naturalfrequencies of human corticothalamic circuits. J. Neurosci. 29, 7679–7685.
Rossini, P.M., Barker, A.T., Berardelli, A., Caramia, M.D., Caruso, G., Cracco, R.Q.,Dimitrijevic, M.R., Hallett, M., Katayama, Y., Lucking, C.H., et al., 1994. Non-invasiveelectrical andmagnetic stimulation of the brain, spinal cord and roots: basic principlesand procedures for routine clinical application. Report of an IFCN committee.Electroencephalogr. Clin. Neurophysiol. 91, 79–92.
Saisanen, L., Pirinen, E., Teitti, S., Kononen, M., Julkunen, P., Maatta, S., Karhu, J., 2008.Factors influencing cortical silent period: optimized stimulus location, intensityand muscle contraction. J. Neurosci. Methods 169, 231–238.
Salerno, A., Thomas, E., Olive, P., Blotman, F., Picot, M.C., Georgesco, M., 2000. Motor corticaldysfunction disclosed by single and double magnetic stimulation in patients withfibromyalgia. Clin. Neurophysiol. 111, 994–1001.

134 F. Farzan et al. / NeuroImage 83 (2013) 120–134
Sanger, T.D., Garg, R.R., Chen, R., 2001. Interactions between two different inhibitorysystems in the human motor cortex. J. Physiol. 530, 307–317.
Sarfeld, A.S., Diekhoff, S., Wang, L.E., Liuzzi, G., Uludag, K., Eickhoff, S.B., Fink, G.R.,Grefkes, C., 2012. Convergence of human brain mapping tools: neuronavigatedTMS parameters and fMRI activity in the hand motor area. Hum. Brain Mapp. 33,1107–1123.
Sekiguchi, H., Takeuchi, S., Kadota, H., Kohno, Y., Nakajima, Y., 2011. TMS-inducedartifacts on EEG can be reduced by rearrangement of the electrode's lead wire beforerecording. Clin. Neurophysiol. 122, 984–990.
Siebner, H.R., Dressnandt, J., Auer, C., Conrad, B., 1998. Continuous intrathecal baclofeninfusions induced a marked increase of the transcranially evoked silent period ina patient with generalized dystonia. Muscle Nerve 21, 1209–1212.
Siebner, H.R., Mentschel, C., Auer, C., Lehner, C., Conrad, B., 2000. Repetitive trans-cranial magnetic stimulation causes a short-term increase in the duration ofthe cortical silent period in patients with Parkinson's disease. Neurosci. Lett.284, 147–150.
Stetkarova, I., Kofler, M., 2013. Differential effect of baclofen on cortical and spinalinhibitory circuits. Clin. Neurophysiol. 124, 339–345.
Tamburin, S., Fiaschi, A., Andreoli, A., Marani, S., Manganotti, P., Zanette, G., 2004.Stimulus–response properties of motor system in patients with cerebellar ataxia.Clin. Neurophysiol. 115, 348–355.
Tazoe, T., Endoh, T., Nakajima, T., Sakamoto, M., Komiyama, T., 2007. Disinhibitionof upper limb motor area by voluntary contraction of the lower limb muscle.Exp. Brain Res. 177, 419–430.
Teo, J.T., Schneider, S.A., Cheeran, B.J., Fernandez-del-Olmo, M., Giunti, P., Rothwell, J.C.,Bhatia, K.P., 2008. Prolonged cortical silent period but normal sensorimotor plasticityin spinocerebellar ataxia 6. Mov. Disord. 23, 378–385.
Tremblay, S., de Beaumont, L., Lassonde, M., Theoret, H., 2011. Evidence for the specificity ofintracortical inhibitory dysfunction in asymptomatic concussed athletes. J. Neurotrauma28, 493–502.
Valls-Sole, J., Pascual-Leone, A., Wassermann, E.M., Hallett, M., 1992. Human motorevoked responses to paired transcranial magnetic stimuli. Electroencephalogr.Clin. Neurophysiol. 85, 355–364.
Veniero, D., Bortoletto, M., Miniussi, C., 2009. TMS–EEG co-registration: on TMS-induced artifact. Clin. Neurophysiol. 120, 1392–1399.
Wassermann, E.M., Fuhr, P., Cohen, L.G., Hallett, M., 1991. Effects of transcranialmagnetic stimulation on ipsilateral muscles. Neurology 41, 1795–1799.
Werhahn, K.J., Kunesch, E., Noachtar, S., Benecke, R., Classen, J., 1999. Differentialeffects on motorcortical inhibition induced by blockade of GABA uptake in humans.J. Physiol. 517 (Pt 2), 591–597.
Ziemann, U., Rothwell, J.C., 2000. I-waves in motor cortex. J. Clin. Neurophysiol. 17,397–405.