Embed Size (px)
Citation preview

The Economics of Water
Infrastructure Investment
Timing and Location under
Climate Change
David Corderi Novoa*, J. R. Lund#, J. Williams#
* Inter-American Development Bank#University of California - Davis
Outline
• Introduction
• Analytical Framework
• Investment Timing Analysis
• Investment Location Analysis
• Conclusions

Introduction

Agriculture, Salinity and Climate
Change- Agricultural production is important in the
Dong Nai Delta.
- Salinity is main limiting factor to agriculture in the delta
- Climate change will increase salinity gradually over time
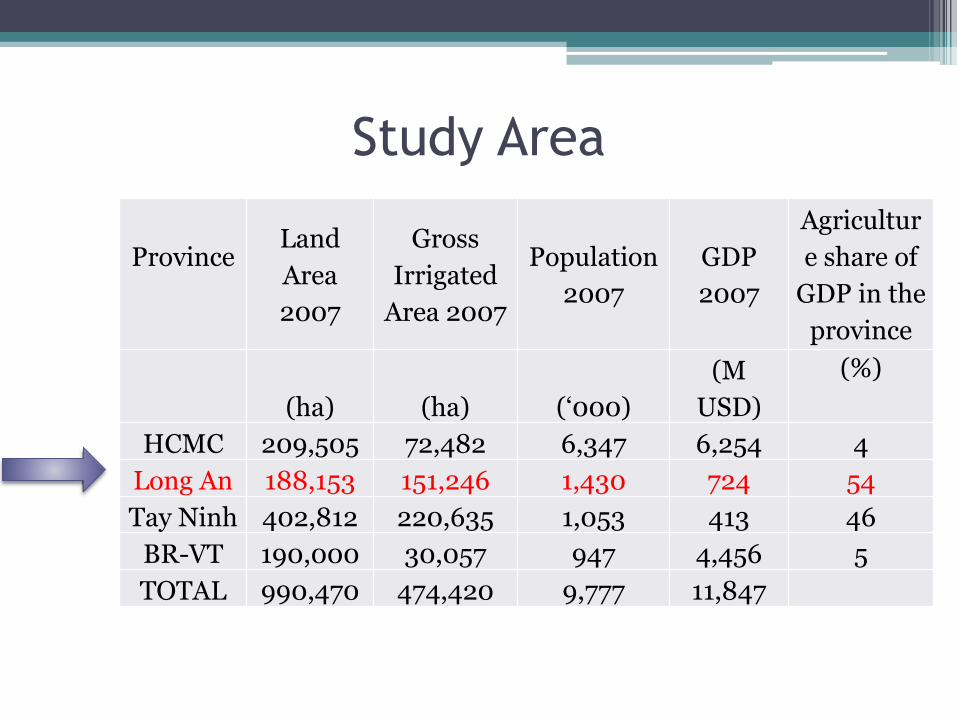
Study Area
ProvinceLand
Area
2007
Gross
Irrigated
Area 2007
Population
2007
GDP
2007
Agricultur
e share of
GDP in the
province
(ha) (ha) (‘000)
(M
USD)
(%)
HCMC 209,505 72,482 6,347 6,254 4
Long An 188,153 151,246 1,430 724 54
Tay Ninh 402,812 220,635 1,053 413 46
BR-VT 190,000 30,057 947 4,456 5
TOTAL 990,470 474,420 9,777 11,847

Projected Salinity for 2050

Water Infrastructure Investment
Plans
Investments inWaterInfrastructure tocontrol salinity

Analytical Framework

Main Research Question
• How do investment decisions of water infrastructure affect its value:
▫ What is the optimal timing of investment given gradual increase in salinity (when)?
▫ What is the optimal location of investment given the characteristics of the delta (where)?
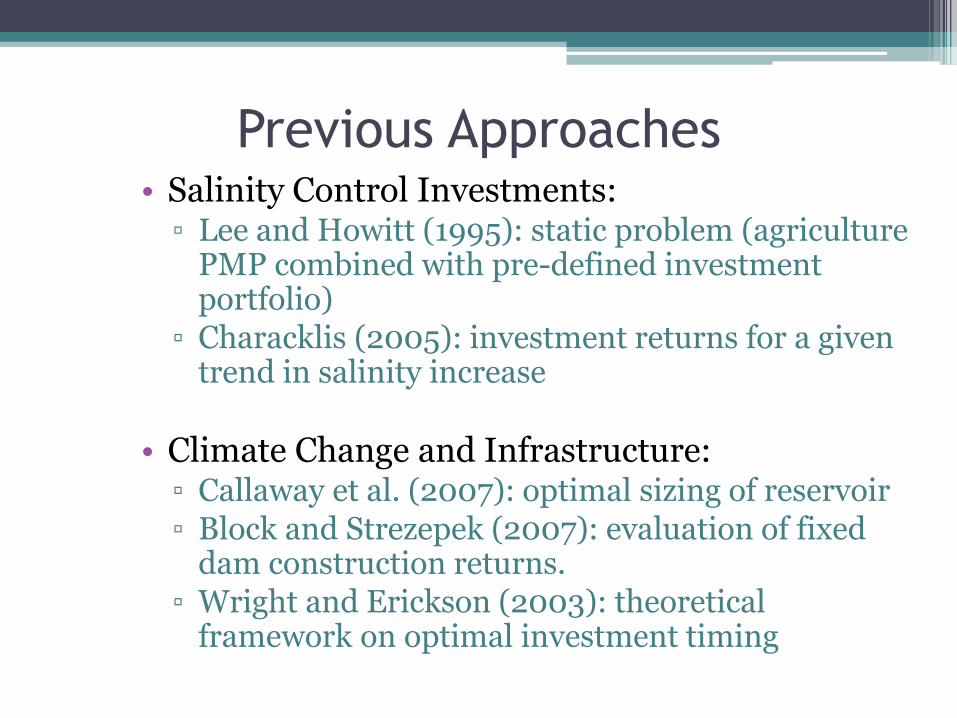
Previous Approaches• Salinity Control Investments:▫ Lee and Howitt (1995): static problem (agriculture
PMP combined with pre-defined investment portfolio)
▫ Characklis (2005): investment returns for a given trend in salinity increase
• Climate Change and Infrastructure:▫ Callaway et al. (2007): optimal sizing of reservoir▫ Block and Strezepek (2007): evaluation of fixed
dam construction returns.▫ Wright and Erickson (2003): theoretical
framework on optimal investment timing
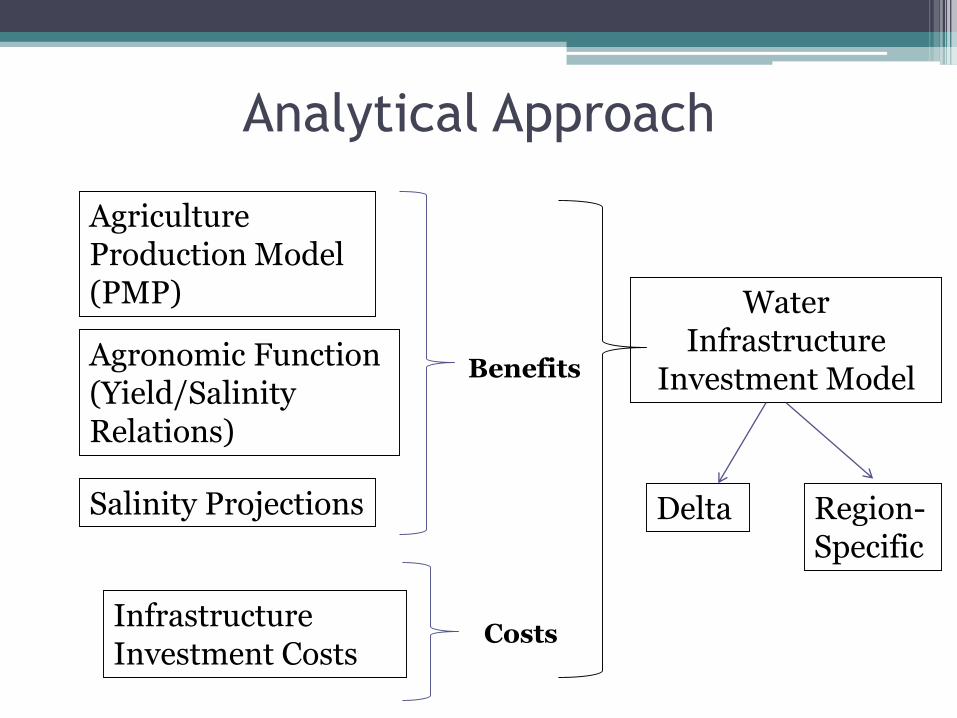
Analytical Approach
Agriculture Production Model(PMP)
Agronomic Function (Yield/Salinity Relations)
Infrastructure Investment Costs
Salinity Projections
Water Infrastructure
Investment Model
Delta Region-Specific
Benefits
Costs

Investment Timing

Model Formulation I
Equation of Motion of Salinity
Payoff Function
Payoff if Infrastructure is constructed
Salinity level if Infrastructure is constructed
Dynamic Programming Model ◦ State Variable: Salinity level (St)
◦ Control Variable: Decision to Invest (Xt)

Model Formulation II
Model is solved using the Bellman Equation as follows:
▫ Solved numerically in Matlab (optimal policy rule)
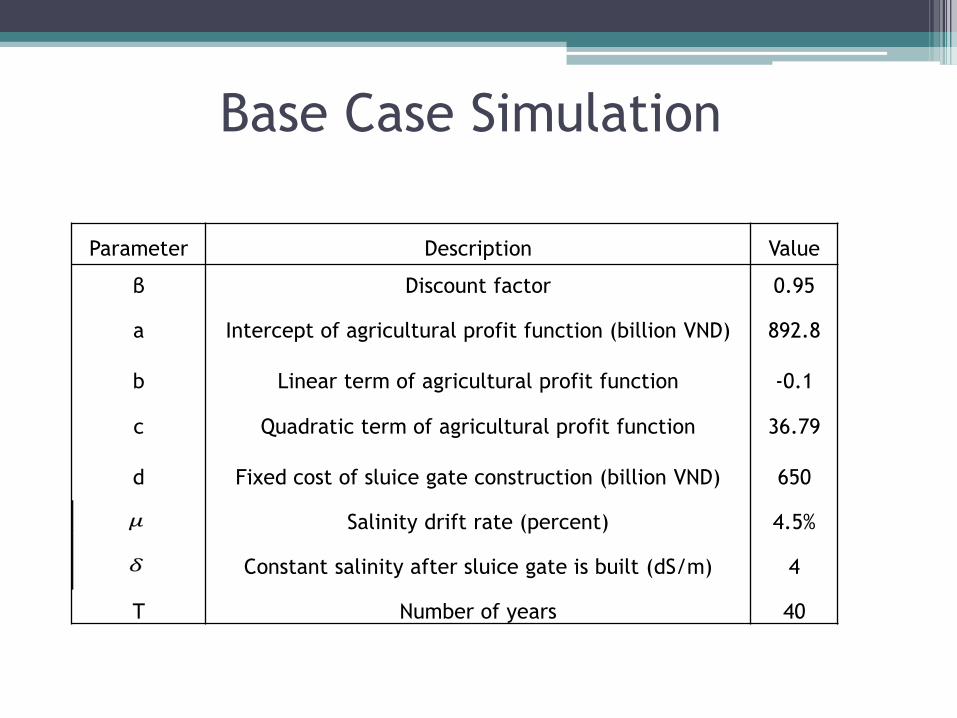
Base Case Simulation
Parameter Description Value
β Discount factor 0.95
a Intercept of agricultural profit function (billion VND) 892.8
b Linear term of agricultural profit function -0.1
c Quadratic term of agricultural profit function 36.79
d Fixed cost of sluice gate construction (billion VND) 650
Salinity drift rate (percent) 4.5%
Constant salinity after sluice gate is built (dS/m) 4
T Number of years 40
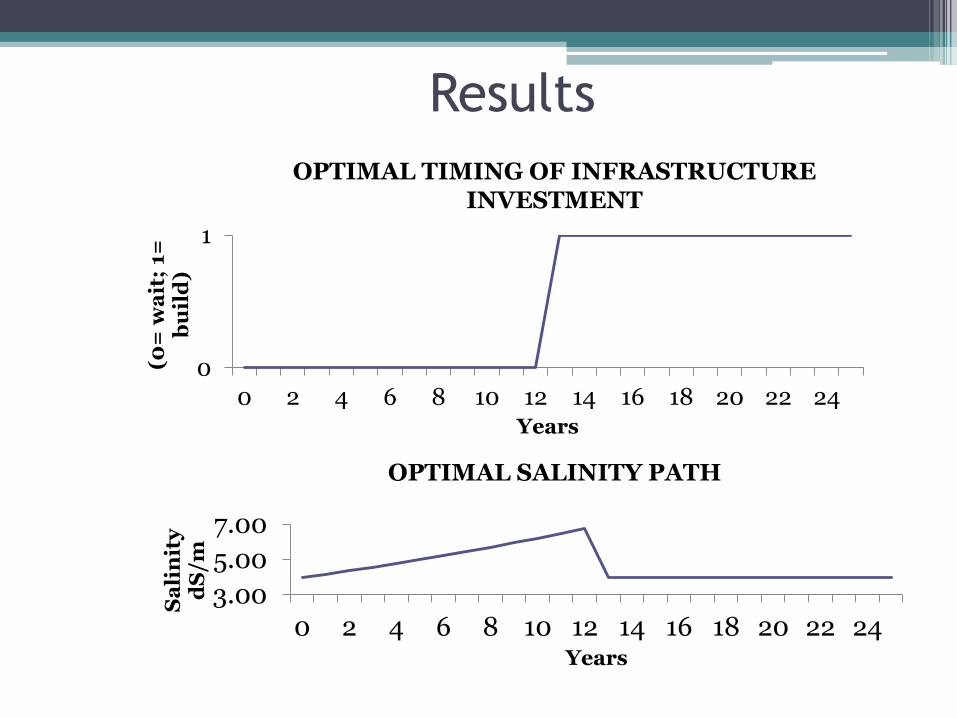
Results
0
1
0 2 4 6 8 10 12 14 16 18 20 22 24
(0=
wa
it;
1=
b
uil
d)
Years
3.00
5.00
7.00
0 2 4 6 8 10 12 14 16 18 20 22 24
Sa
lin
ity
d
S/m
Years
OPTIMAL TIMING OF INFRASTRUCTURE INVESTMENT
OPTIMAL SALINITY PATH

Sensitivity Analysis IOPTIMAL TIMING OF INFRASTRUCTURE
INVESTMENT
OPTIMAL SALINITY PATH
0
1
0 2 4 6 8 10 12 14 16 18 20 22 24(0=
wa
it;
1=
b
uil
d)
Years
Crop Substitution No Crop Substitution New Variety
3.00
8.00
0 2 4 6 8 10 12 14 16 18 20 22 24
Sa
lin
ity
dS
/m
Years
Crop Substitution No Crop Substitution New Variety
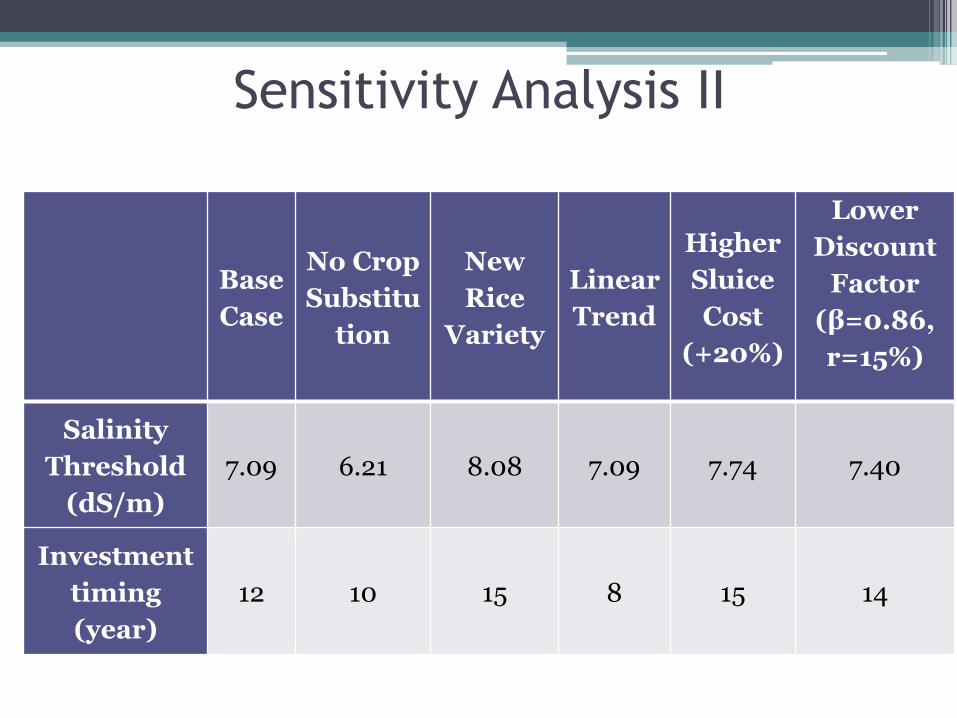
Sensitivity Analysis II
Base
Case
No Crop
Substitu
tion
New
Rice
Variety
Linear
Trend
Higher
Sluice
Cost
(+20%)
Lower
Discount
Factor
(β=0.86,
r=15%)
Salinity
Threshold
(dS/m)
7.09 6.21 8.08 7.09 7.74 7.40
Investment
timing
(year)
12 10 15 8 15 14

Investment Location
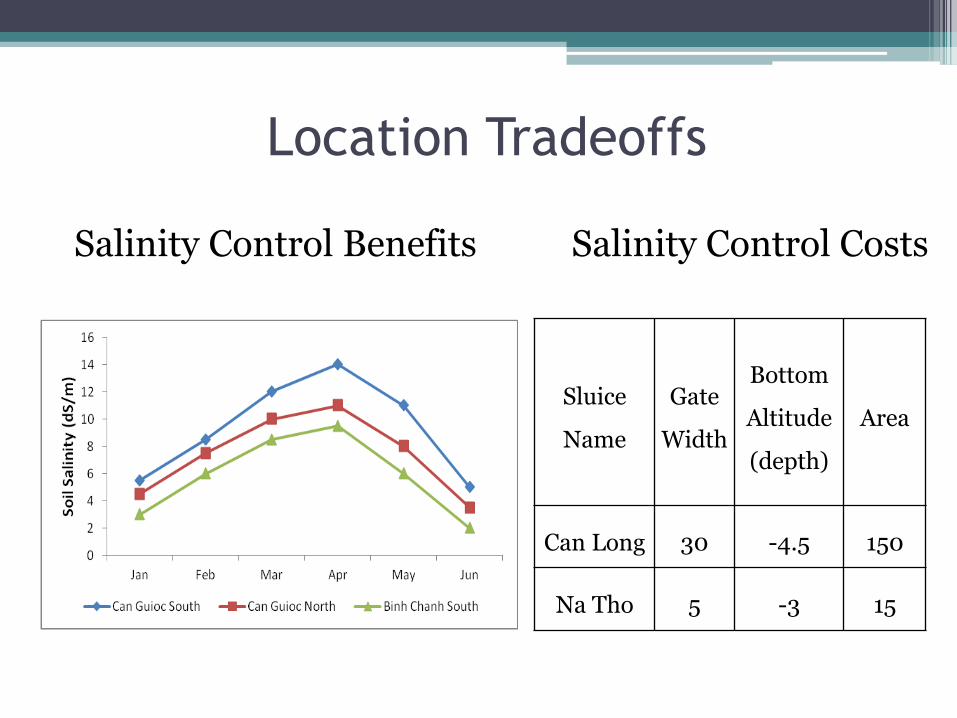
Location Tradeoffs
Sluice
Name
Gate
Width
Bottom
Altitude
(depth)
Area
Can Long 30 -4.5 150
Na Tho 5 -3 15
Salinity Control Benefits Salinity Control Costs
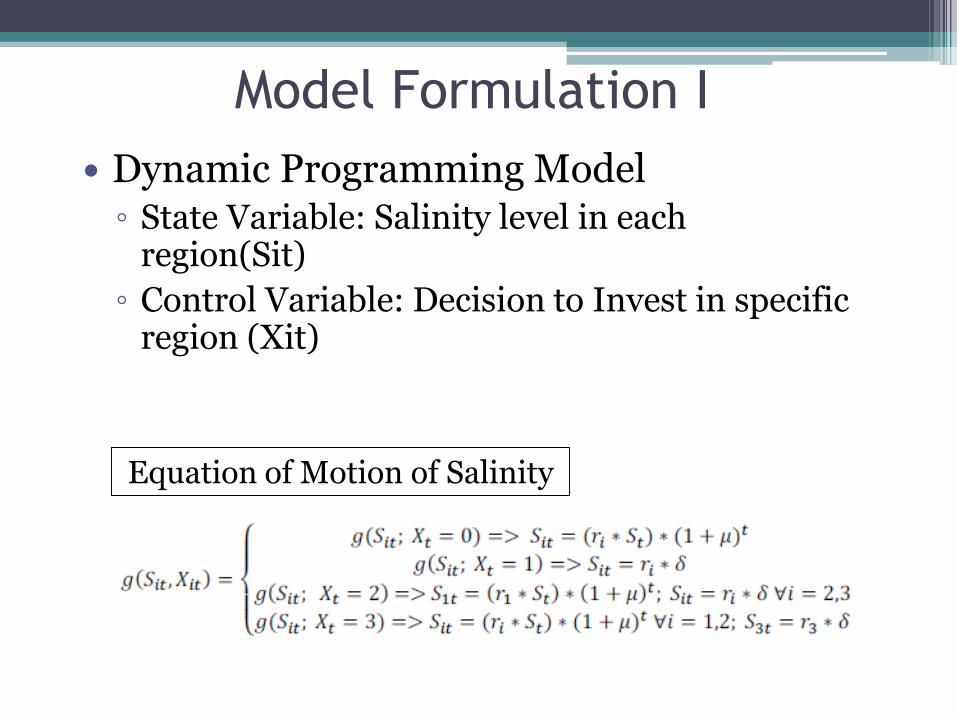
Model Formulation I
Equation of Motion of Salinity
Dynamic Programming Model ◦ State Variable: Salinity level in each
region(Sit)
◦ Control Variable: Decision to Invest in specific region (Xit)
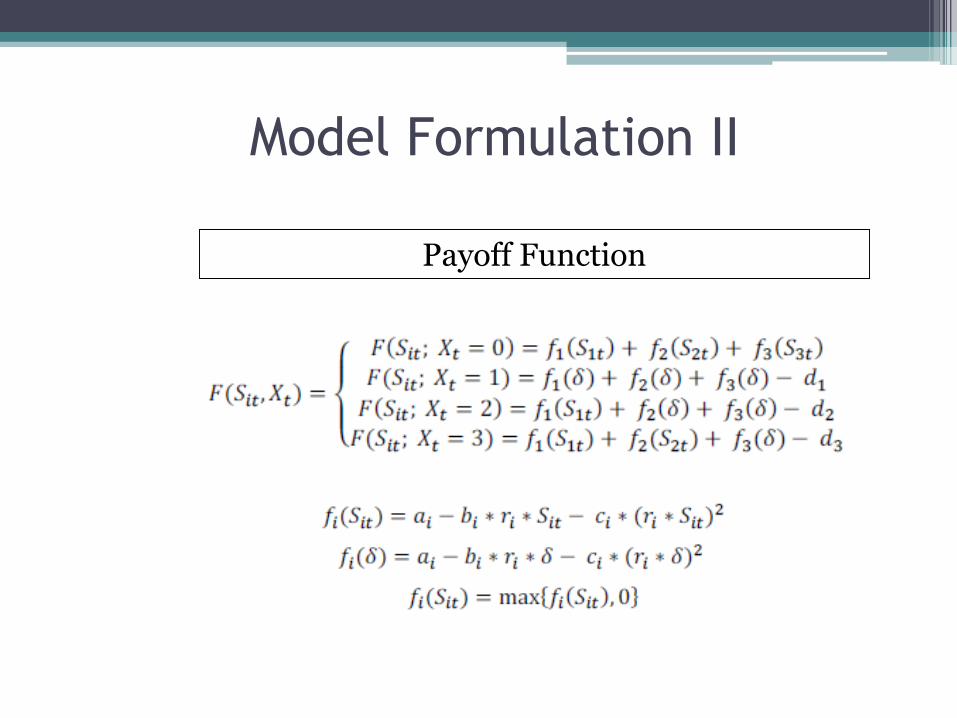
Model Formulation II
Payoff Function

Base Case SimulationParameter Description Value
β discount factor 0.95
salinity drift rate (percent) 5%
constant salinity after sluice gate is built (dS/m) 4
T number of years 40
Region-Specific Parameters
a b c d r
Reg. 1: Can
Giuoc South148.45 -7.58 0.02 650 1.3
Reg. 2: Can
Giuoc North520 -26.5 0.07 520 1
Reg. 3: Binh
Chanh
North
391.7 -5.48 -0.18 430 0.9

ResultsOPTIMAL TIMING & LOCATION OF INFRASTRUCTURE
INVESTMENT
OPTIMAL SALINITY PATH
0
1
2
3
0 2 4 6 8 10 12 14 16 18 20 22 24 26 28 30 32 34 36 38 40
Slu
ice
Ga
te
Lo
ca
tio
n (
0=
no
p
ro
tec
tio
n,
1=
Ca
n G
uio
c S
, 2
=C
an
Gu
ioc
N,
3=
Bin
h C
ha
nh
)
Years
0.00
20.00
40.00
1 3 5 7 9 11 13 15 17 19 21 23 25 27 29 31 33 35 37 39 41
Sa
lin
ity
(d
S/m
)
Years
Can Giuoc South Can Giuoc North Binh Chanh South

Conclusions

Water Infrastructure Investment • Value of investment depends on design
decisions (when, where to construct)
• Given the gradual increase in salinity and thecost of the infrastructure, other less expensiveoptions to adapt are more optimal in theshort-term
• Given the spatial characteristics of the delta,it is not economical to protect all regions
David Corderi Novoa

Agricultural Production Model
0
100,000
200,000
300,000
400,000
0 2 4 6 8 10 12 14 16 18 20
Pr
ofi
t in
Mil
lio
n V
ND
Salinity (dS/m)
Binh Chanh Can Giuoc
Ben Luc Tan Tru
Can Duoc
0
200,000
400,000
600,000
800,000
0 2 4 6 8 10 12 14 16 18 20
Pr
ofi
t i
n m
illi
on
VN
D
Salinity (dS/m)
New Variety
Crop Substitution
No crop substitution