Embed Size (px)
Citation preview

The Economics of Quality in the Specialty Coffee Industry:
Insights from the Cup of Excellence Auction Programs
Adam P. Wilson THRIVE Farmers International Headquarters
215 Hembree Park Drive, Suite 100 Roswell, Georgia 30076 [email protected]
and
Norbert L. W. Wilson Associate Professor Auburn University
Department of Agricultural Economics & Rural Sociology 100 C Comer Hall
Auburn, AL USA 36849 [email protected]
Selected Paper prepared for presentation at the Agricultural & Applied Economics Association’s 2013 AAEA & CAES Joint Annual Meeting, Washington, DC, August 4-6, 2013.
Copyright 2013 by Adam P. Wilson and Norbert L. W. Wilson. All rights reserved. Readers may make verbatim copies of this document for non-commercial purposes by any means, provided that this copyright notice appears on all such copies.

The Economics of Quality in the Specialty Coffee Industry:
Insights from the Cup of Excellence Auction Programs
Abstract
This study estimates price determinants for specialty green coffee auctions using records
from the 2004-2010 Cup of Excellence programs hosted by the Alliance for Coffee Excellence.
While most recent literature on coffee has focused on certifications and sustainability labels, the
discussion of price determinants has been limited in the literature. This paper replicates one of
the first publications on price determinants (Donnet, et al., 2008) and formulates a new model to
more accurately describe the market. We include the necessary additional variables and estimate
the model using a truncated maximum likelihood estimation technique. While sensory quality
has a strong effect on price, the highest premiums stem from obtaining a top rank compared to
other coffees from the same country, and North American buyers are more responsive to sensory
quality than buyers in Asian and European markets.

1
The Economics of Quality in the Specialty Coffee Industry:
Insights from the Cup of Excellence Auction Programs
1. Introduction
The coffee industry has recently received increased attention from economic researchers.
Since the crisis period of the early 1990’s, coffee has been on the leading edge of economic,
social and environmental development schemes that now reach many major industries. As
programs like Fair Trade, Rainforest Alliance and Organic certification have matured,
researchers have increasingly endeavored to test the claimed price premiums and increased
welfare for coffee producers. Unfortunately, the verdict is far from unanimous. Some studies
find positive effects on producer welfare (Bacon, 2005, Calo and Wise, 2005, Bolwig, et al.,
2009), yet most rigorous studies provide a more critical view (Bacon, et al., 2008, Barham, et al.,
2011, Beuchelt and Zeller, 2011, Ruben and Fort, 2012). The focus given to such studies is in
many ways necessary: the modern paradigm of sustainability labels faces a kairos as it becomes
simultaneously more popular and more skeptically viewed by researchers (Daviron and Ponte,
2005) . However, while understanding the dynamics of certifications is critical, it is only one
aspect of the coffee economy.
In this paper we devote our attention to a more fundamental question. Nearly every paper
on coffee published within the past decade discusses price premiums for different certifications
or marketing channels, but thorough research into the primary determinants of coffee prices is
nearly nonexistent in the literature. To our knowledge, only small group of papers have been
published in this area: Donnet, Weatherspoon, and Hoehn (2008, 2010), Teuber (2009, 2010)
and Teuber and Herrmann (2012) published studies on price determinants for specialty coffee
using a hedonic model. Their studies, and indeed the subject of coffee price determinants in

2
general, has been mostly ignored and not critiqued by the community of economists despite its
fundamental nature.
Tomek (1993) has pointed out the critical importance of replicating existing studies in
order to insure the reliability of economic and econometric analysis. With this in mind, we
accomplish two goals in this paper: first, we revisit Donnet et al. (2008)’s study and replicate
their model with an updated and expanded data set; second, we use a new model specification,
with influence from Teuber and Herrmann (2012), and an estimation method to more accurately
describe the market. We focus on Donnet et al. (2008) because it is one of the first papers
published on this topic and it provides a frame upon which we can build the current study.
The paper is structured as follows: section 2 describes the specialty and boutique coffee
markets, section 3 presents the Cup of Excellence programs, section 4 describes the basics of the
hedonic method, section 5 presents the data and replication of previous work, and section 6
presents a new model specification and estimation method. Section 7 presents the results of the
new estimation. We conclude with a discussion of the paper’s implications in section 8.
2. Specialty and Boutique Coffee Markets
The term “specialty coffee” was originally used to classify the market niche where
coffees are valued for their distinctive individual characteristics rather than their ability to be
blended into a standardized product (Daviron and Ponte, 2005, Pendergrast, 2010). As this
market has grown in popularity, what was once a niche market is becoming mainstream and
increasingly hard to classify (Petkova, 2006) . Ponte (2002) defines specialty coffees as those
distinguished from “industrial blends” by their high quality, limited availability, or added
flavorings and special packaging. Other researchers add coffees with sustainability labels to this
group (e.g. Wollni and Zeller, 2007). Broadly speaking, “specialty coffee” has transitioned from

3
referring to a reasonably unique market segment into a term describing any coffee that is set
apart from the norm. In this paper, we use the term to refer strictly to those coffees distinguished
on the basis of quality and uniqueness of origin, thus agreeing with the definition proposed by
the Specialty Coffee Association of America (SCAA) (Rhinehart, 2007).
Some specialty firms have felt it necessary to adopt another term to further distinguish
their coffee from what is now the norm of specialty coffee. These firms constitute a niche
market within specialty coffee referred to as “boutique” coffee. Boutique coffees are the modern
equivalent of the specialty coffees of the late 1980s and early 1990s, i.e., they are distinguished
and valued for their refined flavor, unique growing region, and especially their limited
availability (cf. Roseberry, 1996, Kubota, 2010). For roasters desiring to participate in this
niche, procurement of such unique and high quality coffees is often very difficult. Likewise the
farmers who grow these coffees must seek out buyers willing to pay adequate premiums for
quality. The proliferation of the Internet has provided a solution to this, and many boutique
coffees are now purchased through online auctions (Donnet et al., 2011). These auctions are
sometimes hosted by individual farms, but are most often hosted by marketing organizations
such as the Association for Coffee Excellence.
3. The Cup of Excellence Programs
The Cup of Excellence (CoE) programs are competitions designed to allow farmers the
opportunity to test their best quality lots against those of other farmers from the same country.
The Association for Coffee Excellence (ACE) hosts these programs each harvest season and
entry is free to any farm or cooperative within the participating country. Lots submitted to CoE
go through a rigorous elimination process where coffees are “cupped” by recognized national
and international coffee graders and scored based on quality (Cupping refers to the process of

4
roasting, grinding, brewing, and tasting coffees according to exact and standardized parameters
to ensure consistent results). Submitted coffees must pass three rounds of elimination—any
coffee discovered to have a defect in any round is dropped from the competition. Those
obtaining a quality score of 84 or above out of 100 in the final round are given the prestigious
Cup of Excellence Award, and the award-winning coffees are then ranked according to score (i.e.
the highest scoring coffee in a given program is awarded first place, the next highest quality
score receives second place, etc.). The winning coffees are then entered into an online auction1.
The CoE programs constitute a top-tier market for quality coffee, and prices in these
auctions are on average 4.5 times higher than the International Coffee Organization (ICO)
composite price. The resulting benefit of these prices to producers is clear, especially
considering that participation in the program carries little opportunity cost—submitted lots are
small, and any lots that fail to win the CoE competition are returned to the farmer who can then
sell them through existing channels. Moreover since ACE is a non-profit organization and
predominantly funded by roaster/importer members, they are able to transmit the vast majority of
auction prices directly to the producer (cf. Talbot, 1997).
The auctions are of eBay style, where bidders’ identities are secret and bids are
ascending. Bidders have access to complete information for each coffee including
farm/cooperative name, growing altitude, and processing methods as well as quality score,
cupping notes, and rank. They may also purchase small samples to cup before bidding. Bidders
in these auctions are roasters and importers from around the world.
1 For more information on the competition and auction, visit the Cup of Excellence website at “http://www.cupofexcellence.org/WhatisCOE/FAQs/tabid/178/Default.aspx”

5
4. The Hedonic Method
Consuming coffee is a predominately sensory experience. As discussed in section 2, the
specialty coffee industry places primary focus on the beverage’s flavor as a determinant of value,
and industry organizations increasingly draw comparisons between specialty coffee and fine
wine. It is therefore natural that the existing efforts to analyze specialty coffee prices have
employed a hedonic price framework, a practice well established in the wine industry (cf.
Oczkowski, 2001, Donnet, et al., 2008, Teuber, 2009, Donnet, et al., 2010, cf. Oczkowski, 2010,
Teuber, 2010, Teuber and Herrmann, 2012). We continue and seek to improve upon this trend.
The theoretical background for hedonic price models is extensive, with seminal efforts by
Rosen (1974) and subsequent applications to vastly diverse subject areas such as housing (Smith
and Huang, 1995, Hite and et al., 2001), wages (Hwang, et al., 1998), and agricultural
commodities (Bowman and Ethridge, 1992, Buccola and Iizuka, 1997, Chang, et al., 2010).
Hedonic price theory stipulates that a good be viewed as a composite of its utility-bearing
characteristics;
(1.1) 𝑧 = (𝑧1, 𝑧2, … , 𝑧𝑛)
where 𝑧𝑖 is the amount of characteristic i present in good 𝑧. The price of 𝑧 is thus given as
(1.2) 𝑝(𝑧) = 𝑝(𝑧1, 𝑧2, … , 𝑧𝑛),
and the implicit or hedonic price of characteristic i is defined as
(1.3) 𝜕𝑝𝜕𝑧𝑖
= 𝑝𝑖(𝑧1, 𝑧2, … , 𝑧𝑛).
This framework gives us the ability to isolate the effects on price of individual
characteristics while holding all other variables constant. In the present context of specialty
coffee, the hedonic method gives us tremendous insight into the value placed on characteristics
such as cup flavor or tree variety. It also gives us the ability to quantify the value of reputation

6
characteristics such as altitude, lot size, and country of origin. This knowledge is of paramount
importance to growers who must constantly estimate the returns of investment in quality control,
planting locations, or new harvesting methods.
Since this study is concerned with discovering consumer preferences for certain
characteristics of coffee, potential complications of differing markets in the same data set may
arise. Sixteen percent of the coffees were purchased by multiple buyers; buyers in Norway and
Finland purchased over eleven percent; the U.S. and Canada account for another twenty-two
percent; Japanese and Chinese buyers purchased over fifty percent. Assuming these buyers can
be pooled into a single market without this consideration would be unwise due to the differences
in coffee consumption culture between the regions2. However, these buyers are still functioning
in the same markets so dividing them is inconsistent with the functioning of the auctions. We
discuss the inclusion of this information in section 6.2.
5. Data and Replication of Previous Model
The CoE records for each lot include the final auction price (before shipping costs),
quality score, cupping notes, extensive farm data including growing conditions and processing
methods, and the buyers’ names. Donnet et al. (2008) use a similar data set to estimate hedonic
prices in coffee, spanning the 2003-2006 CoE auctions. Teuber and Herrmann (2012) use a
similar data set to Donnet et al. (2008), spanning 2003-2009. We update the data to include
auctions through 2010. In 2003, the lower limit on quality score for entrance into the program
was 80, not 84, and only three countries participated in that year. We thus elected to drop
observations from 2003 and analyze data from 2004-2010. To these data we add the ICO
composite price index at time of auction and the region in which each buyer is located (obtained 2 This insight comes from Susie Spindler at the Alliance for Coffee Excellence and is supported by discussions found in Daviron, B., Ponte, S., 2005. The Coffee Paradox: Global Markets, Commodity Trade and the Elusive Promise of Development. Zed books, New York.(2005).

7
from business directories or the firm’s individual website). Since the data span seven years,
including periods of both low and very high international commodity prices, we correct all prices
in the data set for inflation using the Producer Price Index. Like Donnet et al. (2008) and Teuber
and Herrmann (2012), we divide the variables into sensory, reputation, and “macro” correction
variables. The tastes and aroma sensory aspects of each coffee are captured in the quality score.
Like Teuber and Herrmann (2012) we include country of origin and tree variety. However, we
extend the group of reputation variables to include, growing area and altitude. We evaluate
potential non-linear effects of quality on price. Correction variables are ICO composite price,
year, and buyer location. Summary statistics are presented in Table 1.
Worthy of note is the small number of certified coffees in the data set, which may be due
to a number of reasons. Fieldwork in Nicaragua leads us to believe that many farms become
Organic or Rainforest Alliance certified at the request of buyers3, thus implying an existing
relationship between buyer and producer. Since a primary benefit of participation in the CoE is a
direct transaction between producer and roaster/importer, producers already satisfied with their
buyer relationships may choose not to seek out new ones through CoE. Fair Trade certifications
do not appear in the data set since that label is meant to insure the equitable sale of coffee. In
other words, some farms in the data set may be members of Fair Trade certified cooperatives, but
since CoE is an independent market, the label does not apply and is not observed.
We estimate 5 models on these data. Model 1 replicates the previous study. Model 2
uses OLS to estimate a new model specification. Model 3 uses a truncated maximum likelihood
3Though we are unaware of any empirical studies directly observing this tendency (or lack thereof), a strong theoretical justification exists in the global value chain literature for the buyer-initiated certifications. See Gereffi, G., Humphrey, J., Sturgeon, T., 2005. The Governance of Global Value Chains, Review of International Political Economy. 12, 78-104.et al. , Ponte, S., Gibbon, P., 2005. Quality Standards, Conventions and the Governance of Global Value Chains, Economy and Society. 34, 1-31.(2005), and McEwan, C., Bek, D., 2009. The Political Economy of Alternative Trade: Social and Environmental Certification in the South African Wine Industry, Journal of Rural Studies. 25, 255-266.

8
method to estimate the same specification in model 2. Model 4 adds additional interaction
variables, and model 5 inspects the stability of the new model and estimation method by
restricting the data set to 2004-2008.
5.1 Model to be Replicated
As in Wilson (2012), we first replicate one of the first hedonic models applied to
specialty coffee. Donnet et al. (2008) regresses auction price on quality score, rank, country of
origin, tree variety, number of bags, ICO price, and year via OLS. For ease of comparison, we
transform variables as in the previous study. We mentioned in Section 3 that coffees in each
auction are ranked according to quality score. Thus, if treated as continuous variables, quality
score and rank would be almost-perfectly collinear. To avoid this, we include dummies for 1st,
2nd, 3rd, and 4th ranked coffees, making 5th and lower ranked coffees the base category. The
dependent price variable is in natural logs, as are number of bags and ICO price. Quality score is
left in linear form for ease of interpretation. Donnet et al. (2008)’s model can be formally
written as
(2) ln (𝑃𝑖) = 𝛽0 + 𝛽1𝑄𝑢𝑎𝑙𝑖𝑡𝑦𝑖 + ∑ 𝛽𝑗𝑅𝑒𝑝𝑢𝑡𝑎𝑡𝑖𝑜𝑛𝑖𝑗𝑗 + ∑ 𝛽𝑘𝑀𝑎𝑐𝑟𝑜 𝐶𝑜𝑟𝑟𝑒𝑐𝑡𝑖𝑜𝑛𝑖𝑘𝑘 + 𝜀𝑖
where 𝑃𝑖 is the auction price of the ith coffee, 𝑄𝑢𝑎𝑙𝑖𝑡𝑦𝑖 is the quality score, the 𝑅𝑒𝑝𝑢𝑡𝑎𝑡𝑖𝑜𝑛𝑖𝑗 are
the j reputation variables, and the 𝑀𝑎𝑐𝑟𝑜 𝐶𝑜𝑟𝑟𝑒𝑐𝑡𝑖𝑜𝑛𝑖𝑘 are the k macro correction variables.
Donnet et al. (2008)’s results4 are presented in Table 2, Column 1. We estimate their model
using the updated data set and report the results in Table 2, Column 2.
4 Thanks to the detailed methodological descriptions in Donnet, M. L., Weatherspoon, D. D., Hoehn, J. P., 2008. Price Determinants in Top-Quality E-Auctioned Specialty Coffees, Agricultural Economics. 38, 267-276., we were able to duplicate their model with the 2003-2006 data and obtain identical results.

9
5.2 Replication Results
Donnet et al. (2008) concludes that while sensory quality has a significant positive
influence on price, the effect is somewhat overshadowed by the quality ranking. They point out
that this is consistent with the “winner-take-all” nature of high-end auction markets. We will
refine this idea in Section 6, but the initial replication reveals highly similar estimates to the
original study. We also find highly similar estimates for lot size and country of origin variables.
Generally speaking, we confirm Donnet et al. (2008)’s conclusions that buyers value high quality
(especially quality ranking), exclusive coffees and find their estimates for these variables to be
fairly stable under the new data. In the replication, we find similar results to Teuber and
Herrmann (2012) with two notable exceptions; the tree variety variables are not statistically
significant in our replication nor in Donnet et al. (2008). However, a prominent difference
exists between the previous study and our estimation—the estimates for year and ICO price
variables. Differences in the year variables are likely explained by our correction for inflation.
Donnet et al. (2008) use 2003 as the base year and find only 2005 to be different in nominal
price. We use 2004 as the base and observe real prices to be increasingly higher through 2010.
Teuber and Herrmann (2012) document a similar result. The coefficient for ICO price is
significantly negative in our estimation, which is the opposite of Donnet et al. (2008). Our result
indicates that coffees traded in commodity markets are complements to CoE coffees. This is
intuitive, since CoE coffees constitute only a small portion of the coffees purchased by any given
roaster, and the rest are often purchased in commodity markets. In other words, when global
coffee prices are high, roasters have less cash available and lower willingness-to-pay for
extreme-high-end coffees. Teuber and Herrmann (2012) does not control for the ICO price. As
suggested here, this price plays an important role in these early specifications.

10
With the exception of the ICO price variable, our replication shows Donnet et al. (2008)’s
model to be consistent as the data set is updated over time; however, we find the model to be
generally mis-specified. Kolgomorov-Smirnov tests reveal non-normal residual distributions
regardless of whether the restricted or full data set was used. Ramsey RESET tests also show the
model to be mis-specified in both cases. We discuss the reasons for this and our corrections for
it in Section 6.
6. New Model
In the previous section we replicated the model used in Donnet et al. (2008) with an
expanded data set. This is, however, only an initial step toward adding understanding of price
determinants in specialty coffee. We now focus on developing a new model to more accurately
describe the market at hand. This is necessary for two reasons. First, finding similar conclusions
with a new model specification will add considerable weight to the conclusions of previous
research. Second, as mentioned in section 5, we have found the original model to be mis-
specified and therefore suspect the estimates to be biased. We, as does Teuber and Herrmann
(2012), suspect the original model to be missing important explanatory variables; we discuss this
in Sections 6.1 and 6.2. We also suspect incidental truncation of auction prices to cause bias; we
discuss this in Section 6.3.
6.1 Inclusion of Additional Variables
We first turn our attention to missing variables that may bias the results of the model in
Section 5. The model assumes a linear relationship between quality score and price; we expect
the relationship to be nonlinear. The high-end quality of CoE coffees implies buyers would
obtain noticeably decreasing marginal returns from quality score. Thus we expect a nonlinear
relationship and henceforth include a squared term for quality score. We also include growing

11
altitude in the following models. Altitude has been used as a proxy for coffee quality (Wollni
and Zeller, 2007), but we expect altitude to be a reputation variable in its own right, as coffees
are often marketed by roasters and importers to be “mountain” or “high grown” coffees
(Roseberry, 1996, Daviron and Ponte, 2005).
Donnet et al. (2008) consider the number of bags in a given lot as a proxy for the
exclusivity of owning that coffee, and in that sense consider it a reputation characteristic. We
note another possibility: since CoE coffees constitute the boutique niche, we must remember that
most buyers are predominantly active in more mainstream channels. Thus they may have a
lower willingness to pay for boutique offerings through CoE. This is to say that a roaster,
wishing to add a unique coffee to their product line, may prefer to buy a smaller quantity and still
retain the marketing advantage of offering CoE award-winning coffees. That being said, Donnet
et al. (2008) are insightful in their recognition that buyers highly value exclusivity and
availability in niche markets. To further investigate this concept we include the coffee growing
area in the regressions, hypothesizing that buyers prefer coffees from smaller farms because of
their unique and exclusive nature.
In a more economics-oriented interpretation, Teuber and Herrmann (2012) use the
pounds of coffee exchanged, derived from the lot size, as a quantity demanded. Thus they
hypothesize and provide evidence that the larger amounts of coffee lower the price of the coffee.
Both the Donnet et al. (2008) and the Teuber and Herrmann (2012) interpretations support a
negative sign on the lot size or pounds of coffee sold. To further investigate this concept we
include the coffee growing area in the regressions, hypothesizing that buyers prefer coffees from
smaller farms because of their unique and exclusive nature.

12
Also missing from Model 1 are the variables for Organic and Rainforest Alliance
certifications. We assume this is because so few coffees in the data available to Donnet et al.
(2008) carried such certifications. From 2004-2006 only 1.3% of all coffees were Certified
Organic and less than 0.5% were certified through Rainforest Alliance. Teuber and Herrmann
(2012) report 2.6% organic and 2.1% Rainforest Alliance certificates. In the updated data we
have over 3% Certified Organic and nearly 2% Rainforest Alliance Certified; thus we include the
variables in models 2-5. Clearly, if the newer data have more certified coffees, we should
investigate if the value of these certifications has increased over time; however, we are still
limited by the small number of observations for these coffees and cannot adequately measure the
interaction of time and certifications here.
6.2 Buyer Location as a Correction variable
We now discuss a class of variables sometimes considered to be outside the realm of
hedonic models: buyer characteristics. Indeed the defining aspect of hedonic theory is that the
observed price of a good can be disentangled to reveal the implicit prices of its characteristics
(Rosen, 1974). Including buyer information in the model, then, would seem to assume that
buyer characteristics are in fact characteristics of the good itself. To make such a connection
would be nonsensical, and we argue that including buyer location into this model does not
violate the assumptions of hedonic theory.
First, recall from section 3 that buyers in this market are not the end users of the good and
therefore do not derive utility from consuming the sensory and reputation qualities. Rather they
purchase coffees as production inputs and receive returns from providing those qualities to their
customers. In this sense the good for which roasters and importers pay is the resulting profit,

13
which is generated by their ability to match the coffees’ characteristics with the preferences of
their customers.
Correspondingly, modeling a market with a single equation, regardless of the context, is
to assume a homogeneous market. In this case, if a large group of buyers values a certain
characteristic more than other groups, the resulting estimate reflects the proportional size of the
group as well as the extent to which that group values the characteristic. This is a form of
selection bias, and including buyer variables as corrections is well established in the literature
(Pollak and Wales, 1981, Bowden, 1992, Ekeland, et al., 2004).
Correspondence with ACE’s Executive Director leads us to believe that the data may
suffer from this selection bias. Asian, predominantly Japanese, roasters and importers account
for over half of all coffees in the data set. In this region coffees are often marketed under the
CoE brand in order to communicate quality. North American roasters, however, typically
purchase high quality coffees such as those in the CoE in order to increase the quality of their
own brands (Spindler, 2012). This is to say that Asian roasters value the CoE award itself more
than North American roasters—Asian roasters are self-selecting into the market.
Based on these assumptions, we counter the modeling of Teuber and Herrmann 2012 that
divide the data by importing country. Though they indicate statistical modeling that suggests
dividing the data, the markets are not separate. North Americans, Asians, Europeans and others
and engaging these markets collectively and simultaneously, dividing the markets by buyer
country of origin perpetuates the aforementioned sample selection bias.
To correct for these effects and those discussed in section 6.1, we write our second model
as follows:
14
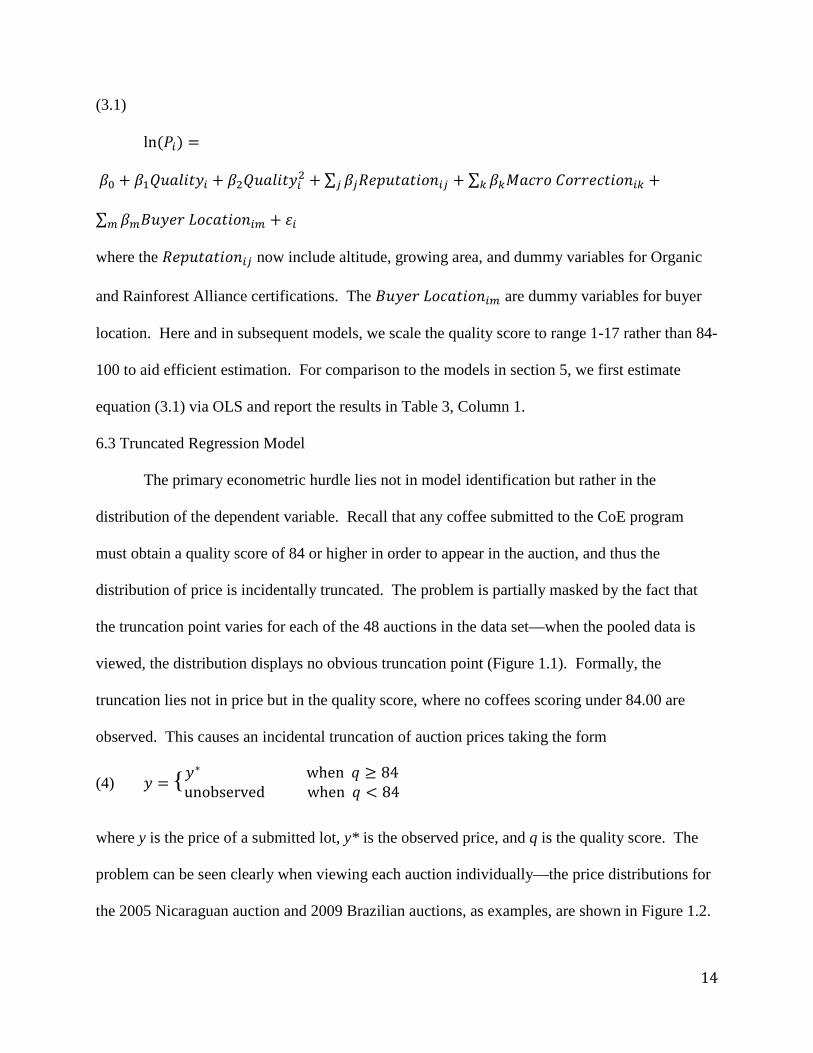
(3.1)
ln (𝑃𝑖) =
𝛽0 + 𝛽1𝑄𝑢𝑎𝑙𝑖𝑡𝑦𝑖 + 𝛽2𝑄𝑢𝑎𝑙𝑖𝑡𝑦𝑖2 + ∑ 𝛽𝑗𝑅𝑒𝑝𝑢𝑡𝑎𝑡𝑖𝑜𝑛𝑖𝑗𝑗 + ∑ 𝛽𝑘𝑀𝑎𝑐𝑟𝑜 𝐶𝑜𝑟𝑟𝑒𝑐𝑡𝑖𝑜𝑛𝑖𝑘𝑘 +
∑ 𝛽𝑚𝐵𝑢𝑦𝑒𝑟 𝐿𝑜𝑐𝑎𝑡𝑖𝑜𝑛𝑖𝑚𝑚 + 𝜀𝑖
where the 𝑅𝑒𝑝𝑢𝑡𝑎𝑡𝑖𝑜𝑛𝑖𝑗 now include altitude, growing area, and dummy variables for Organic
and Rainforest Alliance certifications. The 𝐵𝑢𝑦𝑒𝑟 𝐿𝑜𝑐𝑎𝑡𝑖𝑜𝑛𝑖𝑚 are dummy variables for buyer
location. Here and in subsequent models, we scale the quality score to range 1-17 rather than 84-
100 to aid efficient estimation. For comparison to the models in section 5, we first estimate
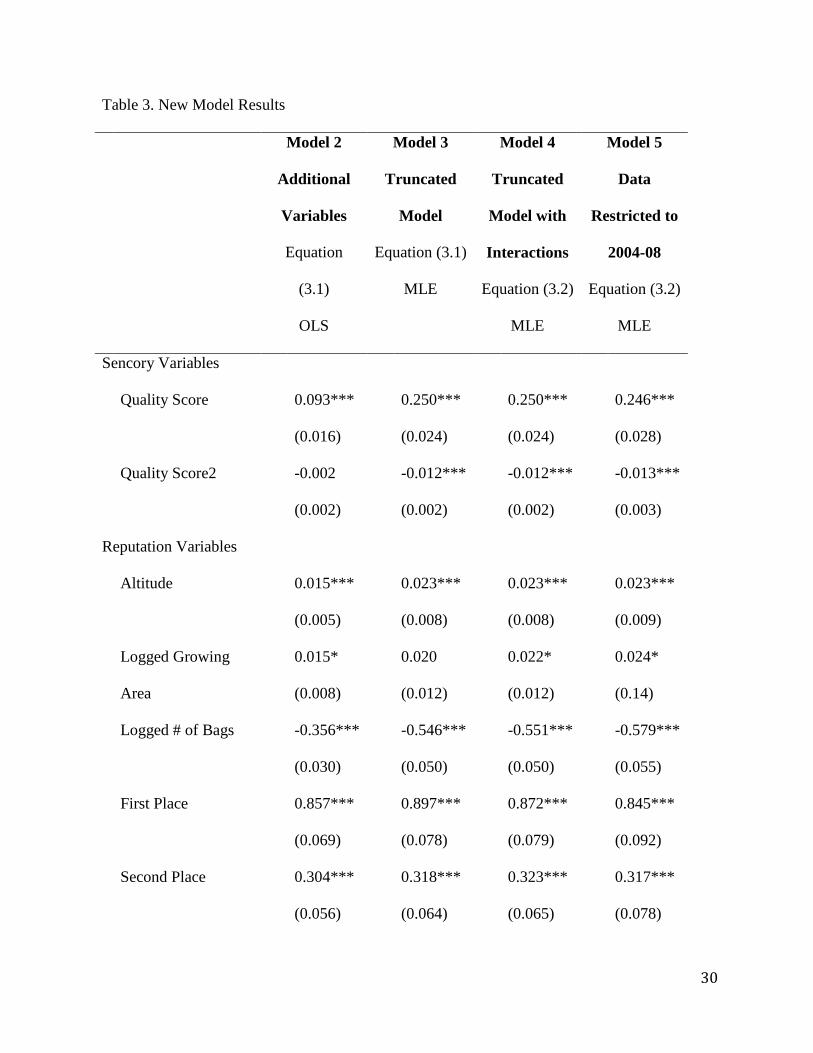
equation (3.1) via OLS and report the results in Table 3, Column 1.
6.3 Truncated Regression Model
The primary econometric hurdle lies not in model identification but rather in the
distribution of the dependent variable. Recall that any coffee submitted to the CoE program
must obtain a quality score of 84 or higher in order to appear in the auction, and thus the
distribution of price is incidentally truncated. The problem is partially masked by the fact that
the truncation point varies for each of the 48 auctions in the data set—when the pooled data is
viewed, the distribution displays no obvious truncation point (Figure 1.1). Formally, the
truncation lies not in price but in the quality score, where no coffees scoring under 84.00 are
observed. This causes an incidental truncation of auction prices taking the form
(4) 𝑦 = {𝑦∗ when 𝑞 ≥ 84
unobserved when 𝑞 < 84
where y is the price of a submitted lot, y* is the observed price, and q is the quality score. The
problem can be seen clearly when viewing each auction individually—the price distributions for
the 2005 Nicaraguan auction and 2009 Brazilian auctions, as examples, are shown in Figure 1.2.
15
Since the point of truncation varies, we have a situation similar to the New Jersey Income
Tax Experiment where the income truncation point depended on the number of people in the
household (Hausman and Wise, 1976). We therefore expect all OLS estimates to be biased
toward zero and estimate the model using a truncated maximum likelihood method (Hausman
and Wise, 1977, Maddala, 1983). We estimate equation (3.1) using this method and report the
results in Table 3, Column 2.
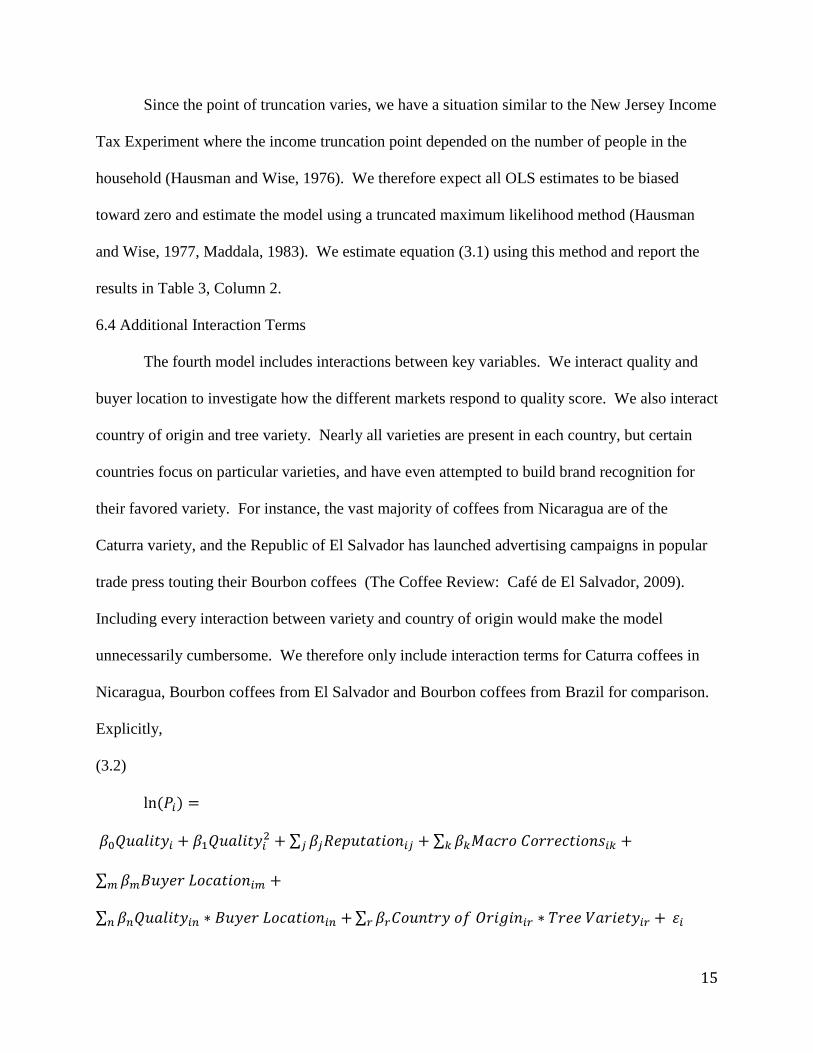
6.4 Additional Interaction Terms
The fourth model includes interactions between key variables. We interact quality and
buyer location to investigate how the different markets respond to quality score. We also interact
country of origin and tree variety. Nearly all varieties are present in each country, but certain
countries focus on particular varieties, and have even attempted to build brand recognition for
their favored variety. For instance, the vast majority of coffees from Nicaragua are of the
Caturra variety, and the Republic of El Salvador has launched advertising campaigns in popular
trade press touting their Bourbon coffees (The Coffee Review: Café de El Salvador, 2009).
Including every interaction between variety and country of origin would make the model
unnecessarily cumbersome. We therefore only include interaction terms for Caturra coffees in
Nicaragua, Bourbon coffees from El Salvador and Bourbon coffees from Brazil for comparison.
Explicitly,
(3.2)
ln (𝑃𝑖) =
𝛽0𝑄𝑢𝑎𝑙𝑖𝑡𝑦𝑖 + 𝛽1𝑄𝑢𝑎𝑙𝑖𝑡𝑦𝑖2 + ∑ 𝛽𝑗𝑅𝑒𝑝𝑢𝑡𝑎𝑡𝑖𝑜𝑛𝑖𝑗𝑗 + ∑ 𝛽𝑘𝑀𝑎𝑐𝑟𝑜 𝐶𝑜𝑟𝑟𝑒𝑐𝑡𝑖𝑜𝑛𝑠𝑖𝑘𝑘 +
∑ 𝛽𝑚𝐵𝑢𝑦𝑒𝑟 𝐿𝑜𝑐𝑎𝑡𝑖𝑜𝑛𝑖𝑚𝑚 +
∑ 𝛽𝑛𝑄𝑢𝑎𝑙𝑖𝑡𝑦𝑖𝑛 ∗ 𝐵𝑢𝑦𝑒𝑟 𝐿𝑜𝑐𝑎𝑡𝑖𝑜𝑛𝑖𝑛 +𝑛 ∑ 𝛽𝑟𝐶𝑜𝑢𝑛𝑡𝑟𝑦 𝑜𝑓 𝑂𝑟𝑖𝑔𝑖𝑛𝑖𝑟 ∗ 𝑇𝑟𝑒𝑒 𝑉𝑎𝑟𝑖𝑒𝑡𝑦𝑖𝑟 +𝑟 𝜀𝑖

16
where 𝑄𝑢𝑎𝑙𝑖𝑡𝑦𝑖𝑛 ∗ 𝐵𝑢𝑦𝑒𝑟 𝐿𝑜𝑐𝑎𝑡𝑖𝑜𝑛𝑖𝑛 and 𝐶𝑜𝑢𝑛𝑡𝑟𝑦 𝑜𝑓 𝑂𝑟𝑖𝑔𝑖𝑛𝑖𝑟 ∗ 𝑇𝑟𝑒𝑒 𝑉𝑎𝑟𝑖𝑒𝑡𝑦𝑖𝑟 are the
interaction terms for each coffee i of the quality score and the buyer and the country of origin of
production and tree variety. Results are presented in Table 3, Column 3. Unlike Teuber and
Herrmann (2012), we do not investigate the interaction of quality score and country of origin, as
they provide evidence that the interactions have an effect in only two cases and the effects tend
to be small.
6.5 Replication of Preferred Model
We began our analysis in this paper with a replication of previous research. We would be
remiss not to test our own model for stability as we have done with the model in Donnet et al.
(2008). As we will discuss in section 7, equation (3.2) is our preferred model specification. We
therefore restrict the data set to include only 2004-2008 and re-estimate the equation using the
same method described in section 6.4. Results are presented in Table 3, Column 4.
7. Results
Comparing the four models in Table 3 reveals much about the proper estimation of these
data. The two most prominent effects are that Donnet et al. (2008)’s model lacks important
variables and that OLS estimates in model 2 are uniformly biased toward zero when compared to
the truncated MLE in model 3. Most notably the quality score is three times larger with the
truncated MLE model version the OLS model. The difference in performance between the OLS
and truncated MLE techniques is even more obvious when inspecting the residuals. OLS models
1 and 2 have significantly non-normal residual distributions, revealing a violation of the Gauss-
Markov assumptions, whereas the truncated maximum likelihood estimations produce
considerably more normal residuals—Kolgomorov-Smirnov tests fail to reject a normal
distribution at 95% confidence for model 3 and at 99% confidence for model 4. Beyond this, a

17
clear trend in residual values exists for model 2, as can be seen in Figure 2.1. The truncated
MLE technique produces considerably more random residuals, displayed in Figure 2.2. With
these econometric issues settled, the hedonic prices of each characteristic can now be analyzed.
7.1 Explanatory Variable Estimation Results
In models 3 and 4 the relationship between quality score and price is nonlinear and
consistent with the theory of diminishing marginal returns. About the mean score of 87 (or 4
given the adjustment), model 3 predicts an additional quality point increases price by 15.4%.
This estimate is nearly double the value of Donnet et al. (2008) 2008 (7.7%) and Teuber and
Herrmann (2012) (6.9%). Because we include the squared quality, we find diminishing returns
to an additional unit of the quality score. For example, coffees that score in the 90s (90.00-
90.99) receive a 5 to 8% increase for an additional increase in the quality score. A surprising
result is that the effect of a one unit increase in the score goes negative after a quality score of
93.42. This result is supported by examples in the data where higher scoring coffees (above
93.42) in one auction garnered a lower price than lowered scoring coffees in other auctions. This
outcome mostly occurs in the earlier years of the data.
In light of this surprising result we find interesting evidence of the effect of rank.
Obtaining the highest rank carries the highest premium at well over 100%5 more than coffees not
ranked in the top four. By contrast, obtaining second place only carries a premium of just over
30%. Initially, this result is surprising, considering the average difference in quality score
between first and second ranked coffees is only 1.21 points. This result suggests that the relative
5 Since the dependent variable is logged, the percentage impact of dummy variable i is calculated as 𝑒𝛽𝑖−0.5∗𝑣𝑎𝑟(𝛽𝑖) − 1, multiplied by 100% Kennedy, P. E., 1981. Estimation with Correctly Interpreted Dummy Variables in Semilogarithmic Equations Am. Econ. Rev. 71.

18
score, a higher rank, particularly being number one, is more important than having the highest
possible score.
Altitude has a significantly positive effect on price, confirming the expectation that
buyers view altitude as an important reputation characteristic. Farm size (growing area) has a
positive coefficient at 90% confidence, possibly indicating that buyers prefer larger farms rather
than smaller, more exclusive, farms, which is a result counter to our hypothesis However, the
statistical relationship is fairly weak.
Country-of-origin variables also perform similarly across models, with all countries
except Guatemala taking equal or lesser prices compared to the base group of Brazil. This may
be due to the fact that the CoE programs originated in Brazil in the late 1990s and thus may carry
more brand recognition. It may also be the case that, given Brazil’s historical reputation for
lower quality production, ultra-high-quality coffees from this nation appear more unique and
interesting to buyers (Chaddad and Boland, 2009).
The variables for year exhibit a strong and significant positive trend. This indicates an
increasing demand for CoE coffees and is perhaps a result of continuing marketing efforts from
ACE. It is also likely that the year variable estimates are influenced by the increasing popularity
of specialty coffees in general, an effect not captured by the other macro correction variable of
ICO composite price.
It should be noted, however, that the effects of the year, country, and ICO price variables
cannot be perfectly disentangled. Auctions generally occur within a 4-hour period, and thus the
ICO price does not vary during the auction since it is a general market composite. Thus for any
given year and country in the data, variation in ICO price only occurs when there is more than
one auction during that year. While this prevents perfect multicollinearity, it may cause the ICO

19
price variable to appear insignificant as the effects of commodity market conditions are mostly
captured in the year variables.
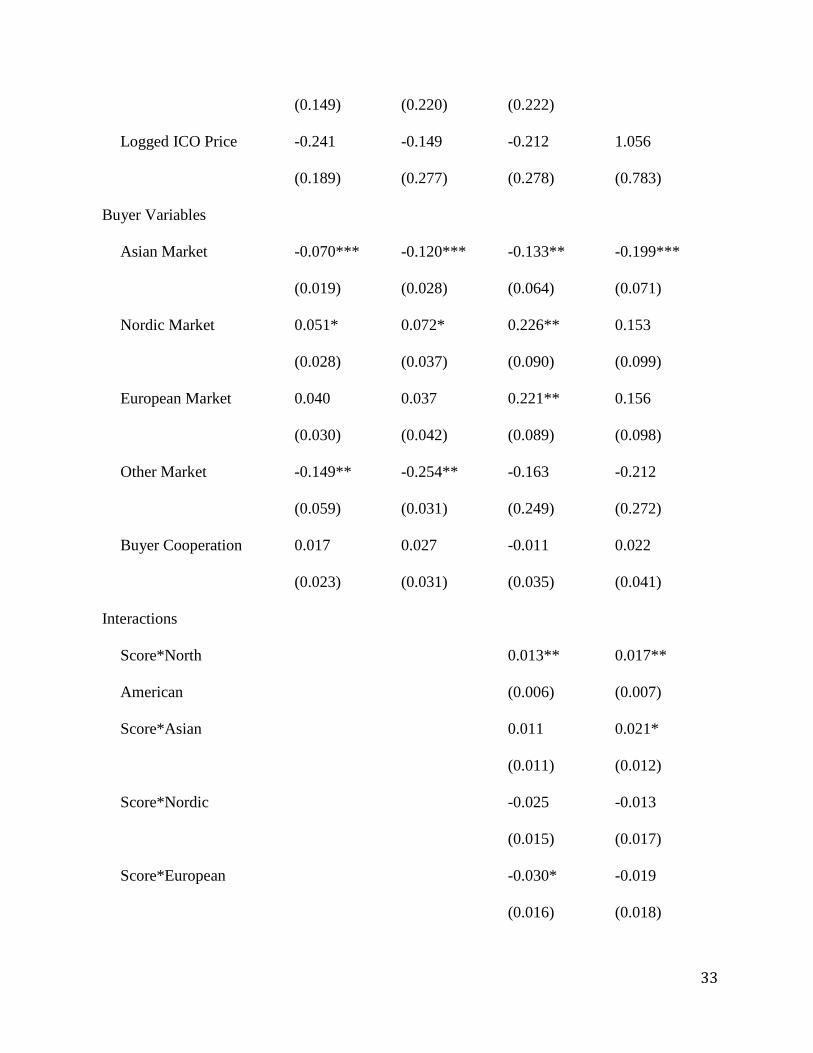
Buyers value small lots sizes considerably more than previously realized, with a 1%
increase in number of bags in a lot causes a 0.546% reduction in price per pound according to
model 3. This indicates that buyers value either or both the exclusivity of small lots and the
convenience of a smaller overall monetary commitment while retaining the prestige of buying
these award-winning coffees. The minimum price elasticity is -1.83, which is the reciprocal of
this price flexibility estimate (Tomek and Robinson, 2003). This elastic demand is expected for
a high end coffees (Teuber and Herrmann, 2012)
Another prominent result in all models is that tree variety has very little effect on price.
This presents an important difference between the coffee industry and the wine industry to which
it is often compared. Hedonic analyses of wine prices show that consumers consider some
varieties such as Cabernet Sauvignon to be superior to others (Schamel and Anderson, 2003).
Coffee consumers do not share this preference for tree variety. This is not to say that variety is
irrelevant, as we find the less-common varieties to jointly carry slightly higher prices than the
base variety of Bourbon. However, we consider this to be confirmation that buyers value
uniqueness rather than the varieties themselves.
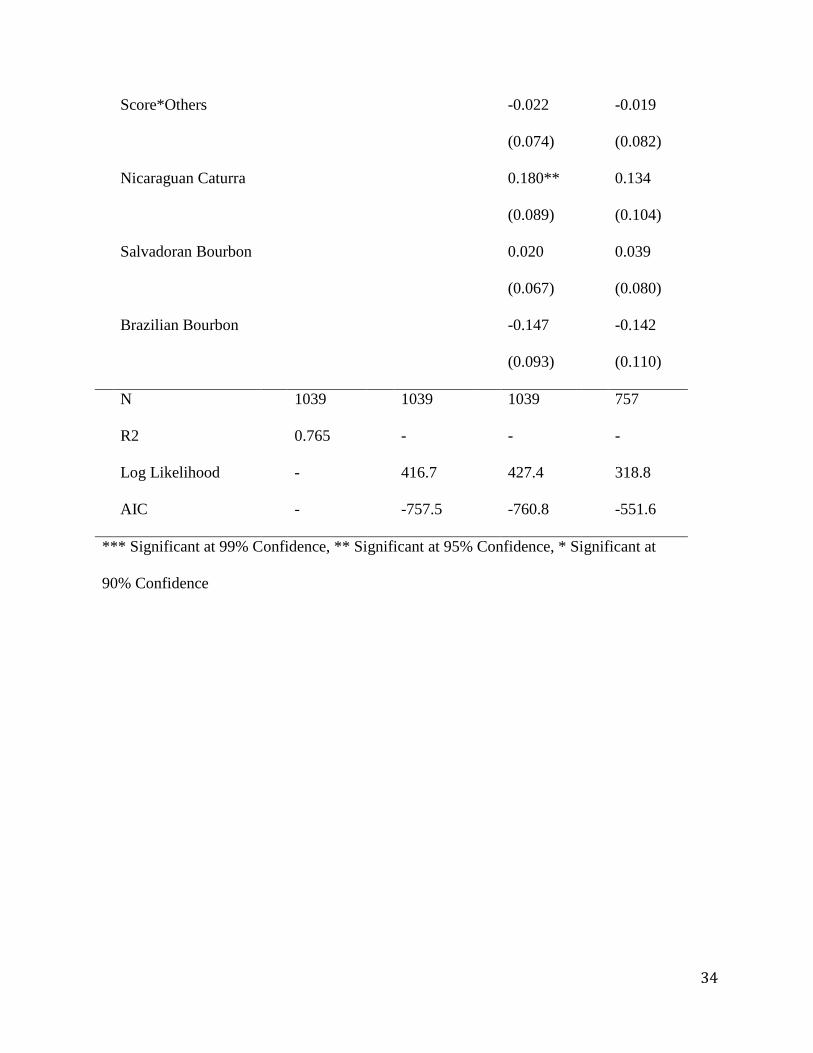
Interactions between country of origin and tree variety offer additional insight to the
industry. While individual varieties may not significantly influence price, we have supposed that
country-specific varieties may carry a reputation for being of high quality. This seems to be the
case for Caturra coffees in Nicaragua, which carry a 19.24% premium over Caturras from other
countries. However, we find no price premiums for Bourbon coffees from El Salvador despite
advertising efforts to the contrary.

20
We also observe no relationship between auction price and certification labels. The
small number of coffees so labeled in the data set perhaps affects the statistical significance of
the estimates for Certified Organic and Rainforest Alliance Certified labels. Our result
counters Teuber and Herrmann (2012) who find statistically significant and positive effects of
these certifications. As such we cannot ignore the implication that in high-priced, high quality
markets like the CoE, certification labels offer the producer no price premiums. Beuchelt and
Zeller (2011) support the conclusion that premiums are smaller in high price conditions.
Perhaps the most significant difference between this study and others is the inclusion
of buyer location as a correction variable. While the primary purpose of including these
variables is to properly isolate the effects of quality on price, additional information can be
gleaned. Model 3 shows Asian buyers pay an average of 13% less than the base group of
North American buyers. This supports the argument in Section 6.2 that Asian buyers are self-
selecting into the market due to their higher value for the CoE brand itself.
Model 4 allows us to account for differences in how buyers in each market respond to
changes in quality. The additional insight, however, comes at the cost of Model 3’s ease of
interpretation. From equation (3.2) and the values given in Table 3, Column 3, the marginal
implicit price of quality is given as
(4) 𝜕(ln(𝑃))𝜕(𝑄𝑢𝑎𝑙𝑖𝑡𝑦)
∗ 1𝑃
= 0.250∗∗∗ − 2 ∗ 0.012∗∗∗(𝑄𝑢𝑎𝑙𝑖𝑡𝑦) + 0.013∗∗∗(𝑁𝑜𝑟𝑡ℎ 𝐴𝑚𝑒𝑟𝑖𝑐𝑎) +
0.011(𝐴𝑠𝑖𝑎) − 0.025(𝑁𝑜𝑟𝑑𝑖𝑐) − 0.030∗(𝐸𝑢𝑟𝑜𝑝𝑒) − 0.022(𝑂𝑡ℎ𝑒𝑟𝑠)
where ln𝑃 is the logged price, 𝑄𝑢𝑎𝑙𝑖𝑡𝑦 is the quality score, and 𝑁𝑜𝑟𝑡ℎ 𝐴𝑚𝑒𝑟𝑖𝑐𝑎, 𝐴𝑠𝑖𝑎,
Nordic, 𝐸𝑢𝑟𝑜𝑝𝑒 and 𝑂𝑡ℎ𝑒𝑟𝑠 denote the binary variables for buyers in North American, Asian,
Nordic, European and other markets, respectively. The asterisks denote statistical
significance as in Table 3. About the mean quality score of 87, equation (4) shows that North

21
American buyers pay 16.7% higher prices for an additional point in quality score. Asian
buyers pay only 15.4% higher for an equivalent increase in quality. Nordic and buyers in
other markets pay similar premiums to Asian buyers, and European buyers pay 12.4% for
higher quality. This supports the effect discussed in Section 6.2, namely that Asian roasters
rely more on the CoE award itself as a marker of quality while North American roasters rely
more on quality score.
Even though Model 4 is more complicated to interpret, the insights it offers are
substantial. Furthermore, the Likelihood Ratio test and Akaike Information Criterion statistics
show the added variables do not diminish the model’s overall performance as compared to the
nested Model 3. We therefore consider Model 4 to be our preferred model.
7.2 New Model Replication Results
In Model 5 we restricted to the data set to years 2004-2008 in order to test the stability of
our results under changes in the data. In general, the estimates are highly similar regardless of
restrictions on the data. The Model 5 estimates for the key explanatory variables of quality
score, altitude, lot size, and first and second rank are all within 10% of Model 4; estimates for
third and fourth rank are within 15%.
The relationship between country of origin and price is stronger in years 2004-2008, but
the sign and significance of the estimates are the same in both models. We posited in Section 7.1
that differences between prices for Brazilian coffees and those from other nations could be a
result of increased CoE brand recognition in Brazil. The results of Model 5 are consistent with
this: as the CoE programs have matured, differences in brand recognition between participating
countries should diminish, and thus withholding the latter two years from the data set would
show greater price differences between Brazil and other countries. Our second hypothesized

22
reason for these price differences is that Brazil has historically been associated with lower-
quality coffee (Chaddad and Boland, 2009). The results of Models 4 and 5 are consistent with
this idea as well. The years 2004-2008 were a post-crisis period for coffee prices (Ubilava,
2012); in such a period, it is intuitive that ultra-high quality coffees from a lower-quality
producer would garner even higher prices because of their exclusivity. Likewise, as time
progressed and specialty coffee became more of a standard (Petkova, 2006), high-quality coffees
in the world’s largest producer would appear somewhat less rare and price differences between
countries would diminish.
While the models are consistent with the trends mentioned above, we must recall the
limitation of the data set mentioned in Section 7.1, namely that country of origin, year, and ICO
price cannot be perfectly separated. In Model 5 the estimates from year are all insignificant,
indicating that the effects of time are captured in the country of origin estimates. ICO price is
also insignificant, as in Model 4.
The buyer location variables perform similarly in Models 4 and 5, confirming the
assumption that Asian buyers are self-selecting into the CoE market. An exception to this is that
Nordic and European buyers do not appear to be paying higher prices in years 2004-2008. This
indicates that the high demand for boutique coffees in these regions is a more recent trend and
was not the case in earlier years.
8. Implications and Conclusion
The main goals of this paper are two-fold: first, we seek to add understanding to the
literature on coffee price determinants by accurately estimating hedonic prices of boutique green
coffee. Second, it is our desire to provide coffee professionals, especially producers, with
information that allows them to make informed investment decisions. With this in mind,

23
consider a farmer wishing to sell her coffee in the CoE market. Based on our analysis, what
might she do to maximize profit?
First and foremost, the sensory quality of the coffee determines price. Indeed extremely
high quality is not only associated with price premiums, but is the primary requirement for
entrance into the market. Once the level of quality required for entrance has been obtained,
increases in quality pay off in two ways. First, increases in the quality score itself pay off
noticeably, but the effect diminishes as quality gets farther from the average. Once in this range,
however, the comparative quality (the ranking) becomes increasingly valuable. The single
greatest impact on price observed in this data set comes from winning first place in the auction.
Perhaps most surprisingly, the models show that, ceteris paribus, the farmer will
maximize profit by keeping quantities small. To illustrate this, assume the farmer has an average
quantity of coffee, 25 bags. Each bag is 70kg and the average auction price is $6.63 per pound.
After the necessary conversions, this means the total price the farmer could expect is $25,578.
Now assume she increases the number of bags in the lot in hopes of higher gross income. An
increase of 1% in lot size, ceteris paribus, would mean 25.25 bags sold at $3.01 (54.6% less than
$6.63) per pound. This translates to a total price of $11,728—a reduction of more than $10,000
in revenue.
Since this market favors small quantities, the farmer must choose how to separate the
CoE submission from the rest of the coffee produced on her land. The taste and aroma attributes
of the coffee are of primary importance, and her primary concern should naturally be placed
there. However, the non-sensory aspects of quality should not be neglected. Given equal levels
of sensory quality, the farmer should submit a lot from the highest-altitude plot on her farm and
work to ensure only one tree varietal is included. Rare or new varieties such as Geisha may

24
garner premiums, but major varieties all bring equivalent prices. It is only important that the
submission be of a single variety, as those that are mixed receive 13% lower prices on average.
At first glance, it may seem strange that consumers value unmixed varieties of trees over
mixed lots of equivalent quality. To understand this, recall that the very definition of a specialty
coffee is one that is differentiated from the norm. Historically, coffees were blended to produce
uniformity (Daviron and Ponte, 2005). As argued in previous literature and seen empirically in
our analysis, specialty and boutique markets assign value to coffees that are as unique and
“unblended” as possible. This cannot be over emphasized.

25
Table 1. Summary Statistics
Variable Obs. Mean Std Dev Min Max
Auction Price (2011 US$/pound) 1039 5.993 4.733 1.200 80.22
ICO Composite Price (2011 US$) 1039 1.323 0.324 0.805 2.300
Quality Score (0-100) 1039 87.00 2.413 84.00 95.69
Growing Altitude (Meters) 1039 1471 234.3 600 22100
Growing Area (Hectares) 1039 30.56 60.88 0.280 893
Lot Size (70kg Bags) 1039 24.35 13.40 9 145
Brazil 1039 0.086 0.280 0 1
Bolivia 1039 0.109 0.311 0 1
Colombia 1039 0.194 0.396 0 1
Costa Rica 1039 0.024 0.153 0 1
El Salvador 1039 0.189 0.391 0 1
Guatemala 1039 0.078 0.268 0 1
Honduras 1039 0.140 0.347 0 1
Nicaragua 1039 0.181 0.385 0 1
Bourbon Variety 1039 0.213 0.409 0 1
Caturra Variety 1039 0.476 0.500 0 1
Catuai Variety 1039 0.003 0.054 0 1
Typica Variety 1039 0.071 0.257 0 1
Pacamara Variety 1039 0.001 0.031 0 1
Other Variety 1039 0.228 0.420 0 1
Mixed Varieties 1039 0.126 0.126 0 1

26
Certified Organic 1039 0.035 0.183 0 1
Rainforest Alliance Certified 1039 0.024 0.153 0 1
North American Market 1039 0.218 0.413 0 1
Nordic Market 1039 0.113 0.316 0 1
European Market 1039 0.102 0.302 0 1
Asian Market 1039 0.504 0.500 0 1
Other Markets 1039 0.021 0.144 0 1
Buyer Cooperation 1039 0.170 0.376 0 1

27
Table 2. Replication Results
Original Estimation Model 1
Donnet et. al (2008)
Equation (2)
Updated Data
Equation (2)
Sensory Variables
Quality Score
0.077***
0.086***
(0.009)
(0.005)
Reputation Variables
Logged # of Bags
-0.375***
-0.336***
(0.039)
(0.026)
First Place
0.877***
0.812***
(0.104)
(0.048)
Second Place
0.318***
0.286***
(0.104)
(0.045)
Third Place
0.312***
0.227***
(0.078)
(0.044)
Fourth Place
0.139*
0.161***
(0.076)
(0.043)
El Salvador
-0.191***
-0.261***
(0.055)
(0.033)
Costa Rica
-0.211***
(0.046)
Colombia
-0.145*
-0.016

28
(0.079)
(0.046)
Guatemala
0.161***
(0.038)
Honduras
-0.448***
-0.318***
(0.056)
(0.034)
Nicaragua
-0.262***
-0.168***
(0.063)
(0.038)
Bolivia
-0.148
-0.048
(0.096)
(0.044)
Caturra
0.049
-0.007
(0.069)
(0.024)
Catuaí
-0.056
-0.072
(0.054)
(0.136)
Typica
-0.002
-0.01
(0.075)
(0.035)
Pacamara
0.158*
0.121
(0.095)
(0.265)
Other
0.002+
0.025
(0.018)
Correction Variables
2004
-0.084
(0.066)
2005
-0.326***
0.002

29
(0.107)
(0.058)
2006
-0.046
0.099*
(0.093)
(0.053)
2007
0.347***
(0.056)
2008
0.352***
(0.058)
2009
0.727***
(0.091)
2010
1.160***
(0.135)
Logged ICO Price
0.589***
-0.510***
(0.153)
(0.170)
N 541 1307
R2
0.67
0.748
*** Significant at 99% Confidence
** Significant at 95% Confidence
* Significant at 90% Confidence
+ Standard deviation and significance not reported in Donnet et. al (2008)
30
Table 3. New Model Results
Model 2 Model 3 Model 4 Model 5
Additional
Variables
Equation
(3.1)
OLS
Truncated
Model
Equation (3.1)
MLE
Truncated
Model with
Interactions
Equation (3.2)
MLE
Data
Restricted to
2004-08
Equation (3.2)
MLE
Sencory Variables
Quality Score
0.093***
0.250***
0.250***
0.246***
(0.016) (0.024) (0.024) (0.028)
Quality Score2
-0.002
-0.012***
-0.012***
-0.013***
(0.002) (0.002) (0.002) (0.003)
Reputation Variables
Altitude
0.015***
0.023***
0.023***
0.023***
(0.005) (0.008) (0.008) (0.009)
Logged Growing
Area
0.015*
0.020
0.022*
0.024*
(0.008) (0.012) (0.012) (0.14)
Logged # of Bags
-0.356***
-0.546***
-0.551***
-0.579***
(0.030) (0.050) (0.050) (0.055)
First Place
0.857***
0.897***
0.872***
0.845***
(0.069) (0.078) (0.079) (0.092)
Second Place
0.304***
0.318***
0.323***
0.317***
(0.056) (0.064) (0.065) (0.078)

31
Third Place
0.229***
0.232***
0.249***
0.278***
(0.050) (0.058) (0.058) (0.068)
Fourth Place
0.166***
0.149***
0.156***
0.179***
(0.048) (0.056) (0.056) (0.064)
El Salvador
-0.321***
-0.310***
-0.406***
-0.691***
(0.040) (0.058) (0.095) (0.137)
Costa Rica
-0.485***
-0.525***
-0.529***
-0.800***
(0.073) (0.105) (0.122) (0.156)
Colombia
-0.121*
-0.372***
-0.381***
-0.647***
(0.062) (0.094) (0.114) (0.151)
Guatemala
0.120**
-0.167**
-0.241***
-0.509***
(0.052) (0.084) (0.104) (0.145)
Honduras
-0.407***
-0.496***
-0.572***
-0.835***
(0.047) (0.069) (0.090) (0.134)
Nicaragua
-0.222***
-0.280***
-0.452***
-0.647***
(0.045) (0.066) (0.099) (0.143)
Bolivia
-0.128**
-0.238***
-0.278***
-0.475***
(0.058) (0.088) (0.108) (0.134)
Caturra
0.016
0.031
-0.037
-0.040
(0.030) (0.046) (0.057) (0.062)
Catuaí
-0.045
0.166
0.159
0.204
(0.157) (0.206) (0.206) (0.226)
Typica
0.002
-0.039
-0.062
-0.120

32
(0.038) (0.062) (0.064) (0.074)
Pacamara
0.243
0.527
0.523
(0.263) (0.349) (0.346)
Other
0.049
0.091**
0.104**
0.077
(0.026) (0.036) (0.045) (0.052)
Mixed
-0.072**
-0.132**
-0.131**
-0.190***
(0.035) (0.053) (0.054) (0.069)
Organic
0.025
0.029
0.023
0.072
(0.048) (0.068) (0.068) (0.052)
Rainforest Alliance
0.007
-0.084
-0.080
-0.001
(0.056) (0.085) (0.085) (0.097)
Correction Variables
2005
0.012
0.076
0.098
-0.265
(0.064) (0.094) (0.095) (0.233)
2006
0.092
0.202**
0.216**
-0.120
(0.057) (0.083) (0.084) (0.205)
2007
0.342***
0.352***
0.369***
0.043
(0.061) (0.091) (0.091) (0.217)
2008
0.350***
0.446***
0.465***
0.109
(0.062) (0.090) (0.091) (0.222)
2009
0.644***
0.815***
0.850***
(0.099) (0.150) (0.151)
2010
1.048***
1.116***
1.172***
33
(0.149) (0.220) (0.222)
Logged ICO Price
-0.241
-0.149
-0.212
1.056
(0.189) (0.277) (0.278) (0.783)
Buyer Variables
Asian Market
-0.070***
-0.120***
-0.133**
-0.199***
(0.019) (0.028) (0.064) (0.071)
Nordic Market
0.051*
0.072*
0.226**
0.153
(0.028) (0.037) (0.090) (0.099)
European Market
0.040
0.037
0.221**
0.156
(0.030) (0.042) (0.089) (0.098)
Other Market
-0.149**
-0.254**
-0.163
-0.212
(0.059) (0.031) (0.249) (0.272)
Buyer Cooperation
0.017
0.027
-0.011
0.022
(0.023) (0.031) (0.035) (0.041)
Interactions
Score*North
American
0.013**
0.017**
(0.006) (0.007)
Score*Asian
0.011
0.021*
(0.011) (0.012)
Score*Nordic
-0.025
-0.013
(0.015) (0.017)
Score*European
-0.030*
-0.019
(0.016) (0.018)
34
Score*Others
-0.022
-0.019
(0.074) (0.082)
Nicaraguan Caturra
0.180**
0.134
(0.089) (0.104)
Salvadoran Bourbon
0.020
0.039
(0.067) (0.080)
Brazilian Bourbon
-0.147
-0.142
(0.093) (0.110)
N 1039 1039 1039 757
R2 0.765 - - -
Log Likelihood - 416.7 427.4 318.8
AIC - -757.5 -760.8 -551.6
*** Significant at 99% Confidence, ** Significant at 95% Confidence, * Significant at
90% Confidence

35
Figure 1.1:
Distribution of Pooled Prices

36
Figure 1.2:
Distribution of Prices in the 2005 Nicaraguan and 2009 Brazilian auctions

37
Figure 2.1
Model 2 residual plot

38
Figure 2.2
Model 3 residual plot
39
References
Bacon, C., 2005. Confronting the Coffee Crisis: Can Fair Trade, Organic, and Specialty Coffees
Reduce Small-Scale Farmer Vulnerability in Northern Nicaragua?, World Development.
33, 497-511.
Bacon, C. M., Ernesto Mendez, V., Gomez, M. E. F., Stuart, D., Flores, S. R. D., 2008. Are
Sustainable Coffee Certifications Enough to Secure Farmer Livelihoods? The Millenium
Development Goals and Nicaragua's Fair Trade Cooperatives, Globalizations. 5, 259-
274.
Barham, B. L., Callenes, M., Gitter, S., Lewis, J., Weber, J., 2011. Fair Trade/Organic Coffee,
Rural Livelihoods, and the 'Agrarian Question': Southern Mexican Coffee Families in
Transition, World Development. 39, 134-145.
Beuchelt, T. D., Zeller, M., 2011. Profits and Poverty: Certification's Troubled Link for
Nicaragua's Organic and Fairtrade Coffee Producers, Ecological Economics. 70, 1316-
1324.
Bolwig, S., Gibbon, P., Jones, S., 2009. The Economics of Smallholder Organic Contract
Farming in Tropical Africa, World Development. 37, 1094-1104.
Bowden, R. J., 1992. Competitive Selection and Market Data: The Mixed-Index Problem,
Review of Economic Studies. 59, 625-633.
Bowman, K. R., Ethridge, D. E., 1992. Characteristic Supplies and Demands in a Hedonic
Framework: U.S. Market for Cotton Fiber Attributes, American Journal of Agricultural
Economics. 74, 991-1002.
Buccola, S., Iizuka, Y., 1997. Hedonic Cost Models and the Pricing of Milk Components,
American Journal of Agricultural Economics. 79, 452-462.

40
Calo, M., Wise, T. A., 2005. Revaluing Peasant Coffee Production: Organic and Fair Trade
Markets in Mexico, Globalization and Sustainable Development Program, Global
Development and Environment Institute, Tufts University, Medford, MA.
Chang, J. B., Lusk, J. L., Norwood, F. B., 2010. The Price of Happy Hens: A Hedonic Analysis
of Retail Egg Prices, Journal of Agricultural and Resource Economics. 35, 406-423.
. The Coffee Review: Café de El Salvador, 2009, Roast Magazine, Portland, Oregon.
Daviron, B., Ponte, S., 2005. The Coffee Paradox: Global Markets, Commodity Trade and the
Elusive Promise of Development. Zed books, New York.
Donnet, M. L., Weatherspoon, D. D., Hoehn, J. P., 2008. Price Determinants in Top-Quality E-
Auctioned Specialty Coffees, Agricultural Economics. 38, 267-276.
Donnet, M. L., Weatherspoon, D. D., Moss, C. B., 2010. Measuring Food Product
Differentiation by Quality Ratings: A Cross-Entropy Analysis of Specialty Coffee E-
Auctions, Journal of Agricultural Economics. 61, 122-137.
Ekeland, I., Heckman, J. J., Nesheim, L., 2004. Identification and Estimation of Hedonic
Models, Journal of Political Economy. 112, S60-109.
Gereffi, G., Humphrey, J., Sturgeon, T., 2005. The Governance of Global Value Chains, Review
of International Political Economy. 12, 78-104.
Hausman, J. A., Wise, D. A., 1976. The Evaluation of Results from Truncated Samples: The
New Jersey Income Maintenance Experiment, Annals of Economic and Social
Measurement. 5, 421-445.
Hausman, J. A., Wise, D. A., 1977. Social Experimentation, Truncated Distributions, and
Efficient Estimation, Econometrica. 45, 919-938.

41
Hite, D., et al., 2001. Property-Value Impacts of an Environmental Disamenity: The Case of
Landfills, Journal of Real Estate Finance and Economics. 22, 185-202.
Hwang, H.-s., Mortensen, D. T., Reed, W. R., 1998. Hedonic Wages and Labor Market Search,
Journal of Labor Economics. 16, 815-847.
Kennedy, P. E., 1981. Estimation with Correctly Interpreted Dummy Variables in
Semilogarithmic Equations Am. Econ. Rev. 71.
Kubota, L., 2010. Symposium Explores the Single-Serve Market., The Specialty Coffee
Chronicle, Digital Edition. Specialty Coffee Association of America.
Maddala, G. S., 1983. Limited-Dependent and Qualitative Variables in Econometrics.
Cambridge University Press.
McEwan, C., Bek, D., 2009. The Political Economy of Alternative Trade: Social and
Environmental Certification in the South African Wine Industry, Journal of Rural
Studies. 25, 255-266.
Oczkowski, E., 2001. Hedonic Wine Price Functions and Measurement Error, Economic Record.
77, 374-382.
Oczkowski, E., 2010. Hedonic Wine Price Predictions and Nonnormal Errors, Agribusiness. 26,
519-535.
Pendergrast, M., 2010. Uncommon Grounds: The History of Coffee and How It Transformed Our
World. Basic Books (AZ), New York.
Petkova, I., 2006. Shifting Regimes of Governance in the Coffee Market: From Secular Crisis to
a New Equilibrium?, Review of International Political Economy. 13, 313-339.
Pollak, R. A., Wales, T. J., 1981. Demographic Variables in Demand Analysis, Econometrica.
49, 1533-1551.

42
Ponte, S., 2002. The 'Latte Revolution'? Regulation, Markets and Consumption in the Global
Coffee Chain, World Development. 30, 1099-1122.
Ponte, S., Gibbon, P., 2005. Quality Standards, Conventions and the Governance of Global
Value Chains, Economy and Society. 34, 1-31.
Rhinehart, R., 2007. What is Speciality Coffee?, Specialty Coffee Association of America Web
Resources. Specialty Coffee Association of America.
Roseberry, W., 1996. The Rise and Yuppie Coffees and the Reimagination of Class in the United
States, American Anthropologist. 98, 762.
Rosen, S., 1974. Hedonic Prices and Implicit Markets: Product Differentiation in Pure
Competition, Journal of Political Economy. 82, 34-55.
Ruben, R., Fort, R., 2012. The Impact of Fair Trade Certification for Coffee Farmers in Peru,
World Development. 40, 570-582.
Schamel, G., Anderson, K., 2003. Wine Quality and Varietal, Regional and Winery Reputations:
Hedonic Prices for Australia and New Zealand, Economic Record. 79, 357-369.
Smith, V. K., Huang, J.-C., 1995. Can Markets Value Air Quality? A Meta-analysis of Hedonic
Property Value Models, Journal of Political Economy. 103, 209-227.
Spindler, S., 2012. Personal Communication, in A. P. Wilson ed.
Teuber, R., 2009. Cafe de Marcala--Honduras' GI Approach to Achieving Reputation in the
Coffee Market, Estey Centre Journal of International Law and Trade Policy. 10, 131-
148.
Teuber, R., 2010. Estimating the Demand for Sensory Quality--Theoretical Considerations and
an Empirical Application to Specialty Coffee, German Journal of Agricultural
Economics. 59, 173-186.
43
Teuber, R., Herrmann, R., 2012. Towards a Differentiated Modeling of Origin Effects in
Hedonic Analysis: An Application to Auction Prices of Specialty Coffee, Food Policy.
37, 732-740.
Tomek, W. G., 1993. Confirmation and Replication in Empirical Econometrics: A Step toward
Improved Scholarship, American Journal of Agricultural Economics. 75, 6-14.
Tomek, W. G., Robinson, K. L., 2003. Agricultural Product Prices. Cornell University Press,
Ithaca, NY, USA.
Ubilava, D., 2012. El Niño, La Niña, and World Coffee Price Dynamics, Agricultural
Economics. 43, 17-26.
Wilson, A. P., 2012. The Economics of Quality in the Specialty Coffee Industry: Insights from
the Cup of Excellence Auction Programs, Department of Agricultural Economics and
Rural Sociology. Auburn University, Auburn, AL.
Wollni, M., Zeller, M., 2007. Do Farmers Benefit from Participating in Specialty Markets and
Cooperatives? The Case of Coffee Marketing in Costa Rica, Agricultural Economics. 37,
243-248.