Embed Size (px)
Citation preview
The Economics of Climate Change – C 175
The economics of climate changeC Ch i ti TC 175 ‐ Christian Traeger
Part 6: Integrated Assessmentg
Background/Further reading:g g
Nordhaus, W. D. & J. Boyer (2000), Warming the World, MIT Press.Stern N (2007) The Economics of Climate Change Cambridge University Stern, N. (2007), The Economics of Climate Change, Cambridge University
Press.Nordhaus, W.D. (2008), A Question of Balance ‐Weighing the Options on
Global Warming Policies, Yale University Press.g , y
6 Integrated Assessment 1Spring 09 – UC Berkeley – Traeger

What is an Integrated Assessment?
The Economics of Climate Change – C 175
So far we have analyzed
The science of climate change addressing the relation between GHG emissions, temperature and climate change, and their impacts
the economics of policies addressing GHG emissions the economics of policies addressing GHG emissions
Now we combine the two aspects!p
An integrated assessment model (IAM) combines scientific and socio‐economic aspects of climate change for the purpose of assessing impacts and policiesimpacts and policies.
6 Integrated Assessment 2Spring 09 – UC Berkeley – Traeger
Why an Integrated Assessment Model?
The Economics of Climate Change – C 175
Why is such a combined model useful for assessing climate change?
Because
GHG emissions affect climate change
Climate change affects economic production and welfare
Economic production and welfare affect GHG emissions
‐> continuous interaction between the economy, welfare, and climate systemy
A policy that changes one of the above aspects changes all aspects and h h d l i fl h h i !how they develop influence each other over time!
6 Integrated Assessment 3Spring 09 – UC Berkeley – Traeger

Components of an Integrated CC Assessment
The Economics of Climate Change – C 175
Population, technology, production, consumption
Emissions
Mitigation Policy
Emissions
Atmospheric concentrations Fee
Radiative forcing
edbacks
Temperature rise and global climate change
Direct impacts (e.g. crops, forests, ecosystems)
Socio‐economic impacts
6 Integrated Assessment 4Spring 09 – UC Berkeley – Traeger

The Economics of Climate Change – C 175
A Prototype of an IAM: DICE
Spring 09 – UC Berkeley – Traeger 6 Integrated Assessment 5

Building Blocks of an Integrated Assessment Model
The Economics of Climate Change – C 175
We introduce a slightly simplified version of a stylized IAM:Nordhaus’ widespread DICE model
We analyze the most important equations determining
d d Production, Investment, and Emissions
And equations describing how
Capital Capital
GHG concentrations
Temperaturesp
evolve over time (stocks!)
Finally, a welfare function is to be maximized adhering to these tiequations
6 Integrated Assessment 6Spring 09 – UC Berkeley – Traeger

Building Blocks of IAMs: Production
The Economics of Climate Change – C 175
Production: In period t output is
11 t LKAY
which is made up of
tttt
tt LKA
DY
Cobb Douglas production function with inputs
Capital Kt
Labor L Labor Lt
Technological Progress At (increases over time)
Damage Dt reduces output
Costs incurred for reducing emissions Λ t(emissions coming up later)
6 Integrated Assessment 7Spring 09 – UC Berkeley – Traeger

Building Blocks of IAMs: Production
The Economics of Climate Change – C 175
How do we get the values (in DICE)? L b L i ti t t k f l ti d l
11
tttt
tt LKA
DY
Labor Lt is exogenous estimate taken from population models Capital Kt is calculated as part of the model (‐> endogenous)
(next building block)
Parameter γ is estimated γ= 3 Parameter γ is estimated γ=.3 Technological Progress At is exogenous ‘estimate’ Damage Dt is approximated as a quadratic function of temperature :
Note: Thus, modeling precipitation change or sea level rise is cut out in thed l d d ff di l l d h
2210 ttt TaTaaD
model and adverse effects are directly related to temperature change Costs of emission reduction is estimated as a function Λt (μt)
of the emission‐control rate μt (percentage of emissions mitigated, emissions coming up later) (p g g , g p )
6 Integrated Assessment 8Spring 09 – UC Berkeley – Traeger

IAMs: on Damages... (Stern Review)
Global temperature change (relati e to pre industrial)
The Economics of Climate Change – C 175
1°C 2°C 5°C4°C3°C
Falling crop yields in many areas, particularly developing regions
FoodFood
Global temperature change (relative to pre‐industrial)0°C
developing regions
WaterWater
Falling yields in many developed regions
Significant decreases in water
Possible rising yields in some high latitude regions
Sea level rise threatens major cities
WaterWater Significant decreases in water availability in many areas, including Mediterranean and Southern Africa
Small mountain glaciers disappear – water supplies threatened in several areas
EcosystemsEcosystems
Rising number of species face extinctionExtensive Damage to Coral Reefs
Risk of Abrupt and Risk of Abrupt and
Extreme Extreme Weather Weather EventsEvents
Rising intensity of storms, forest fires, droughts, flooding and heat waves
Risk of Abrupt and Risk of Abrupt and Major Irreversible Major Irreversible ChangesChanges
Increasing risk of dangerous feedbacks and abrupt, large‐scale shifts in the climate system
6 Integrated Assessment 9Spring 09 – UC Berkeley – Traeger

IAMs: on Damages... (IPCC AR4)The Economics of Climate Change – C 175
Sources: IPCC (2008)6 Integrated Assessment 10Spring 09 – UC Berkeley – Traeger

Regional damage estimates in DICE‐2007
The Economics of Climate Change – C 175
Regional damage estimates for 2005 and temperature increase of 2.5°C
Uses individual indices relating temperature/climate change to damage for the different dimensions of damage (columns).
6 Integrated Assessment 11Spring 09 – UC Berkeley – Traeger

Aggregate Damage Estimates DICE‐2007
The Economics of Climate Change – C 175
Adding estimates for catastrophic damages and Aggregating over Regions and Extrapolating for temperature changes other then 2 5°C yields Damage Extrapolating for temperature changes other then 2.5 C yields Damage
Source: Nordhaus (2007) Figure 3 3 Damage function in DICE 2007 versus earlier Source: Nordhaus (2007), Figure 3‐3, Damage function in DICE‐2007 versus earlier model (RICE‐1999) and estimated range from IPCC AR4, which reports that “global mean losses could be 1–5% GDP for 4°C of warming”.
6 Integrated Assessment 12Spring 09 – UC Berkeley – Traeger
Building Blocks of IAMs: Capital
The Economics of Climate Change – C 175
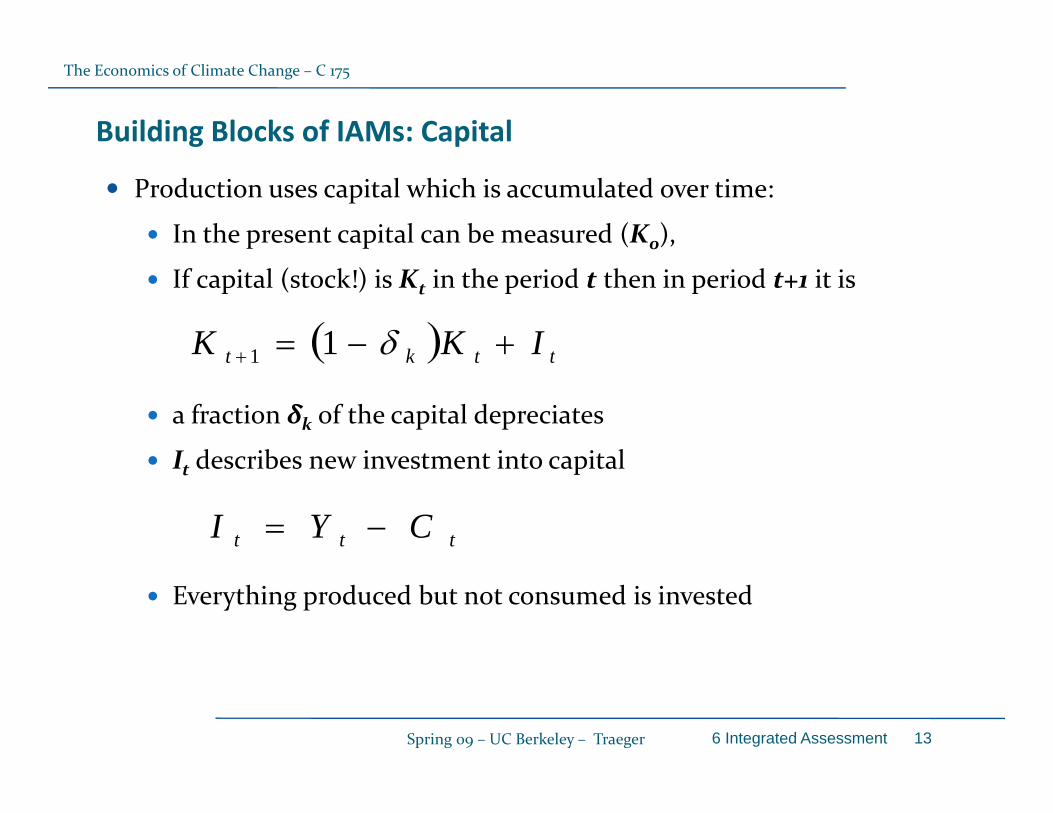
Production uses capital which is accumulated over time:
In the present capital can be measured (K0),
If capital (stock!) is Kt in the period t then in period t+1 it is
ttkt IKK 11
a fraction δk of the capital depreciates
I describes new investment into capital
ttkt 1
It describes new investment into capital
ttt CYI
Everything produced but not consumed is invested
6 Integrated Assessment 13Spring 09 – UC Berkeley – Traeger
Building Blocks of IAMs: Emissions
The Economics of Climate Change – C 175
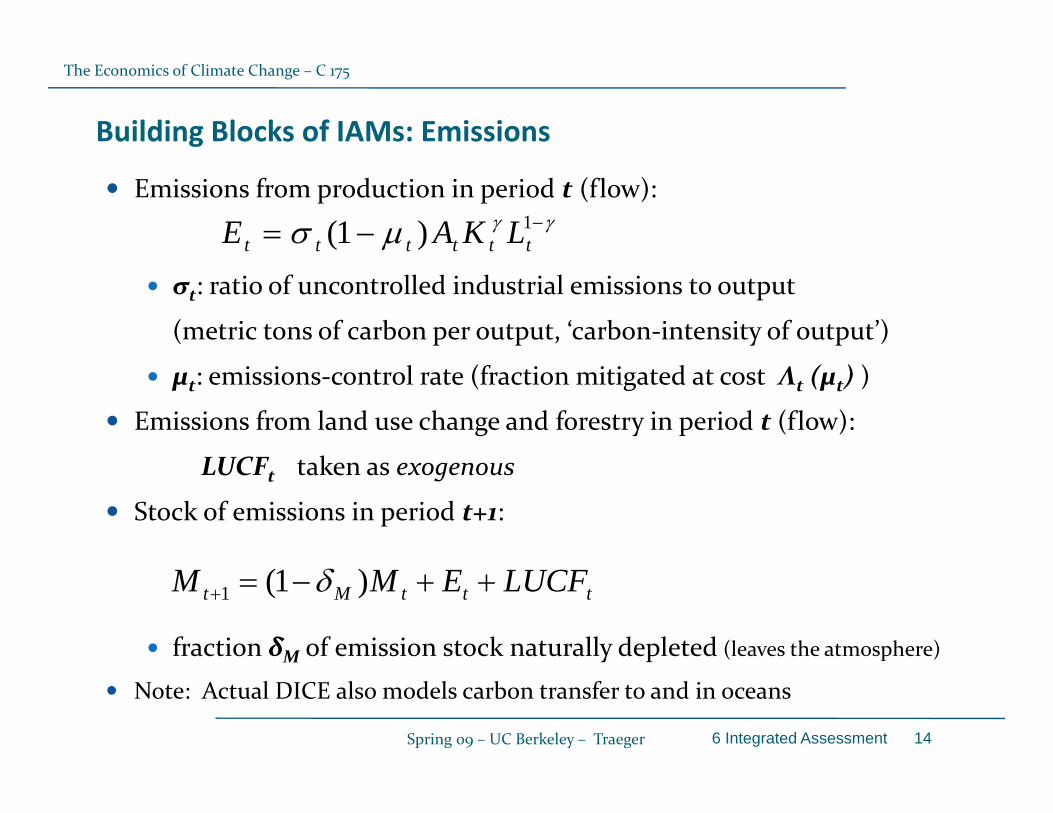
Emissions from production in period t (flow): 1)1( tttttt LKAE
σt: ratio of uncontrolled industrial emissions to output
(metric tons of carbon per output, ‘carbon‐intensity of output’)
μt: emissions‐control rate (fraction mitigated at cost Λt (μt) )
Emissions from land use change and forestry in period t (flow):
LUCF k LUCFt taken as exogenous
Stock of emissions in period t+1:
fraction δM of emission stock naturally depleted (leaves the atmosphere)
tttMt LUCFEMM )1(1
Note: Actual DICE also models carbon transfer to and in oceans
6 Integrated Assessment 14Spring 09 – UC Berkeley – Traeger

Building Blocks IAM: Temperature
The Economics of Climate Change – C 175
Temperature: In period t temperature increase w.r.t. preindustrial is
TFTT
Temperature increases proportional to the difference between
tttt TFTT 1
Radiative forcing Ft in period t
The equilibrium forcing λTt that would correspond to Tt
σ characterizes delay in temperature increase (small σ slow change)σ characterizes delay in temperature increase (small σ slow change)
Radiative forcing Ft is given by
M
With:
• η = forcing parameter
tpreind
t
t OtherGHGsM
M
F
2ln
ln
η g p
• Mpreind= Preindustrial CO2 stock
• OtherGHGst= non‐CO2 GHGs taken as exogenous
6 Integrated Assessment 15Spring 09 – UC Berkeley – Traeger

Building Blocks IAM: Welfare
The Economics of Climate Change – C 175
Temperature closes the model feeding back into the damage function
However, in order to distinguish a good situation from a bad one we need:
Welfare function:),(
)1(1
ttt
t LCuW
with
Pure rate of time preference ρ 1
tC
Consumption elasticity of marginal utility
1
),( tL
ttt LLCu
Per capita consumption
t
tLC
6 Integrated Assessment 16Spring 09 – UC Berkeley – Traeger