Embed Size (px)
Citation preview

The Economics of Climate Change Study for Colombia –
EIECC
Ana María Loboguerrero Sustainable Environmental Development
Deputy Directory
LAMP – First Meeting Belo Horizonte
January 17 – 19, 2012
Index
1. EIECC
2. PHASE 1
National CGE
3. PHASE 2
SECTORAL AND REGIONAL STUDIES
4. 2012 AGENDA
What is the DNP?
• Is the national authority for public policy, investment budget and monitoring and evaluation of investment projects.
• Is the technical counterpart of all sectoral
ministers and designs inter-sectoral policies.
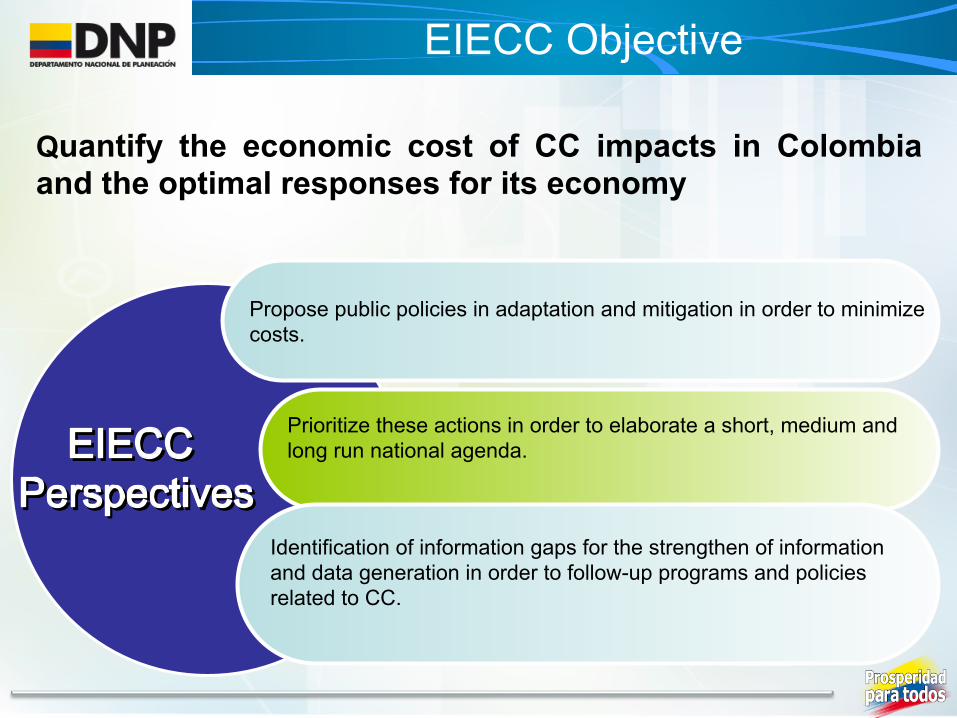
EIECC Objective
Quantify the economic cost of CC impacts in Colombia and the optimal responses for its economy
Propose public policies in adaptation and mitigation in order to minimize costs.
Prioritize these actions in order to elaborate a short, medium and long run national agenda.
Identification of information gaps for the strengthen of information and data generation in order to follow-up programs and policies related to CC.

National Development Plan 2010 -
2014
National Adaptation
Plan
Disaster Financial Protection Strategy
National Strategy for
REDD+
Colombian Low Carbon
Growth Strategy
CONPES 3700
Institutional Framework
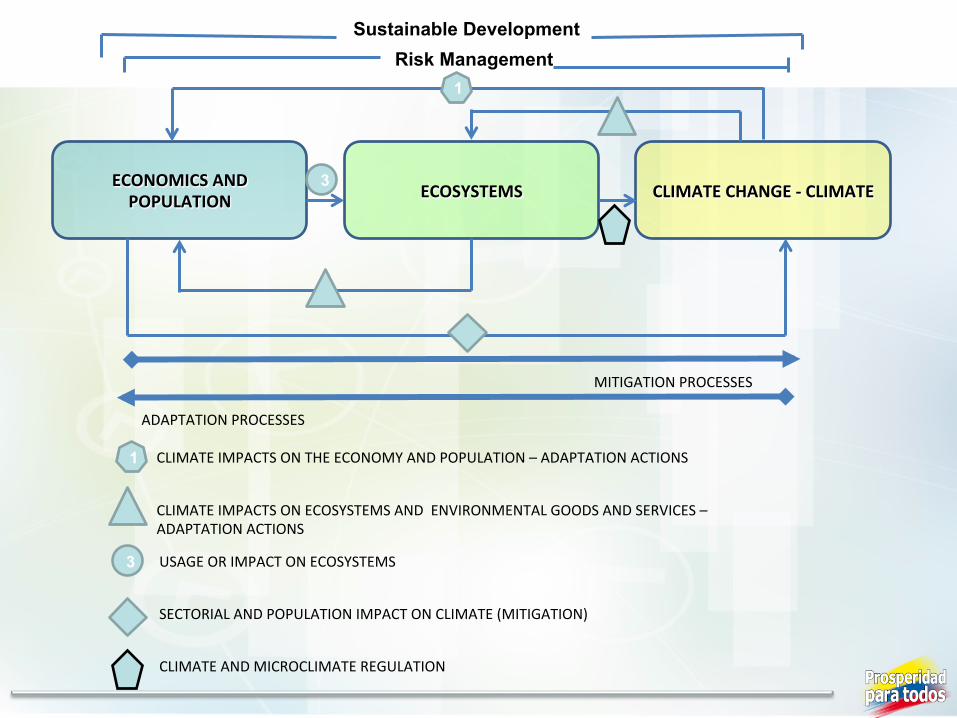
Sustainable Development
ECONOMICS AND POPULATION ECOSYSTEMS CLIMATE CHANGE -‐ CLIMATE
1
ADAPTATION PROCESSES
MITIGATION PROCESSES
CLIMATE IMPACTS ON THE ECONOMY AND POPULATION – ADAPTATION ACTIONS
CLIMATE IMPACTS ON ECOSYSTEMS AND ENVIRONMENTAL GOODS AND SERVICES – ADAPTATION ACTIONS
USAGE OR IMPACT ON ECOSYSTEMS
SECTORIAL AND POPULATION IMPACT ON CLIMATE (MITIGATION)
2
2
3
4
1
2
3
4
Risk Management
5
5 CLIMATE AND MICROCLIMATE REGULATION
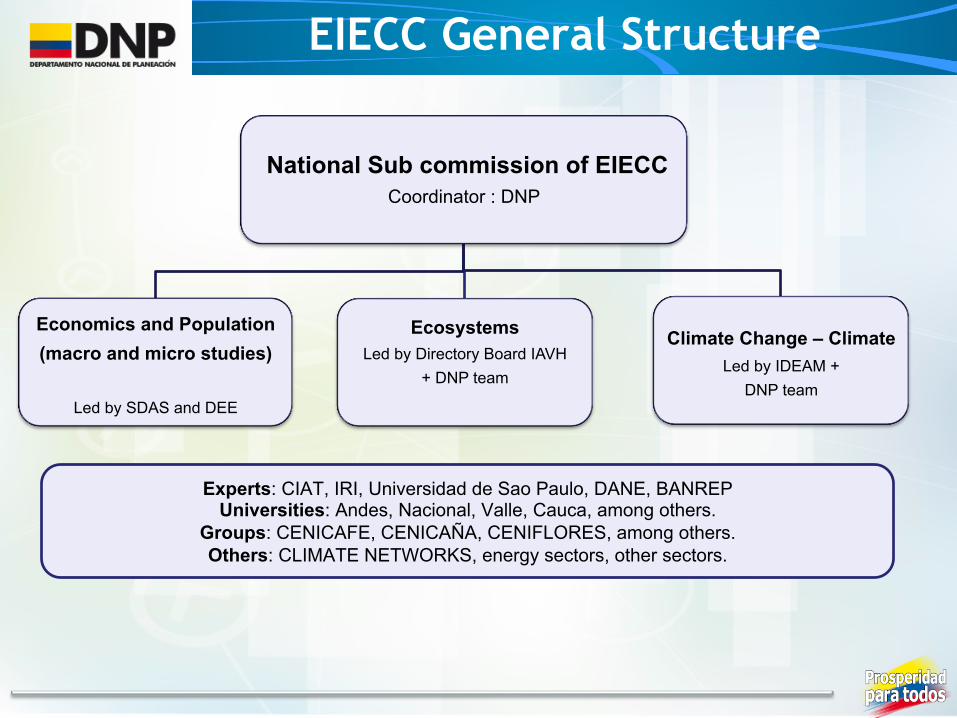
EIECC General Structure
National Sub commission of EIECC Coordinator : DNP
Economics and Population (macro and micro studies)
Led by SDAS and DEE
Ecosystems Led by Directory Board IAVH
+ DNP team
Climate Change – Climate
Led by IDEAM + DNP team
Experts: CIAT, IRI, Universidad de Sao Paulo, DANE, BANREP Universities: Andes, Nacional, Valle, Cauca, among others.
Groups: CENICAFE, CENICAÑA, CENIFLORES, among others. Others: CLIMATE NETWORKS, energy sectors, other sectors.

PHASE 1: NATIONAL CGE
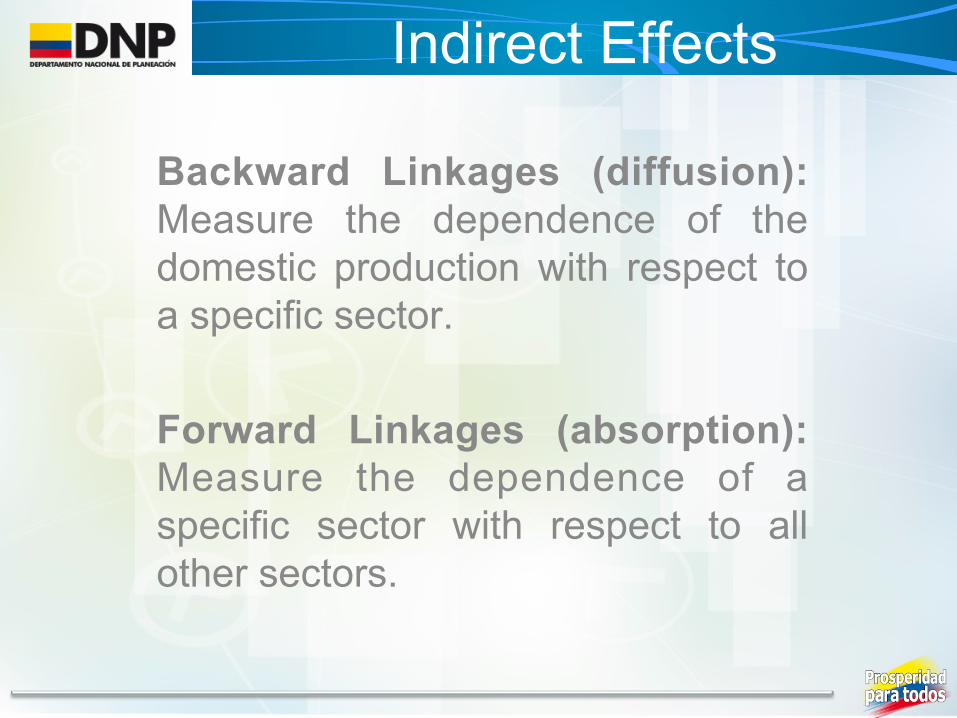
Indirect Effects
Backward Linkages (diffusion): Measure the dependence of the domestic production with respect to a specific sector. Forward Linkages (absorption): Measure the dependence of a specific sector with respect to all other sectors.
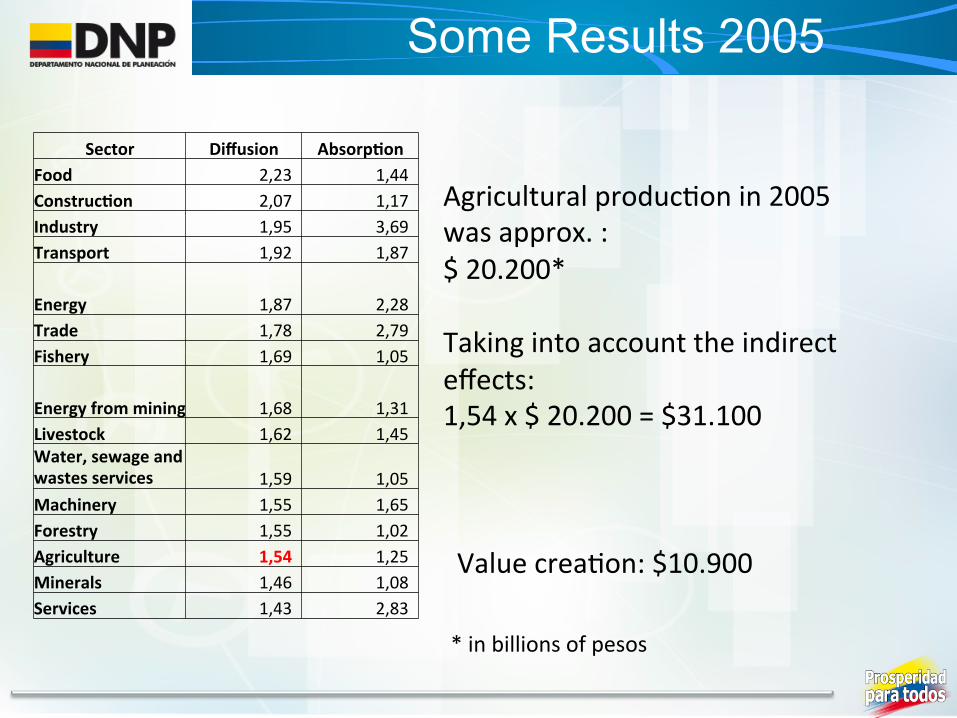
Some Results 2005
Agricultural producBon in 2005 was approx. : $ 20.200* Taking into account the indirect effects: 1,54 x $ 20.200 = $31.100 Value creaBon: $10.900
Sector Diffusion Absorp?on Food 2,23 1,44 Construc?on 2,07 1,17 Industry 1,95 3,69 Transport 1,92 1,87
Energy 1,87 2,28 Trade 1,78 2,79 Fishery 1,69 1,05
Energy from mining 1,68 1,31 Livestock 1,62 1,45 Water, sewage and wastes services 1,59 1,05 Machinery 1,55 1,65 Forestry 1,55 1,02 Agriculture 1,54 1,25 Minerals 1,46 1,08 Services 1,43 2,83
* in billions of pesos

Agricultural loss was approx. 1.200 billions of pesos*. Considering indirect effects and the structure of the economy in 2005: -‐1,54 x $ 1.200 billions = -‐$1.900 billions Value creaBon: -‐654 billions, represent 2,7% of GDP from agriculture.
GDP Loss: Heavy Rainy Season 2010
*Approx. 5% of GDP from agriculture and 0,44% of 2005 GDP.
Sector Diffusion Absorp?on Food 2,23 1,44 Construc?on 2,07 1,17 Industry 1,95 3,69 Transport 1,92 1,87
Energy 1,87 2,28 Trade 1,78 2,79 Fishery 1,69 1,05 Energy from mining 1,68 1,31 Livestock 1,62 1,45 Water, sewage and wastes services 1,59 1,05 Machinery 1,55 1,65 Forestry 1,55 1,02 Agriculture 1,54 1,25 Minerals 1,46 1,08 Services 1,43 2,83
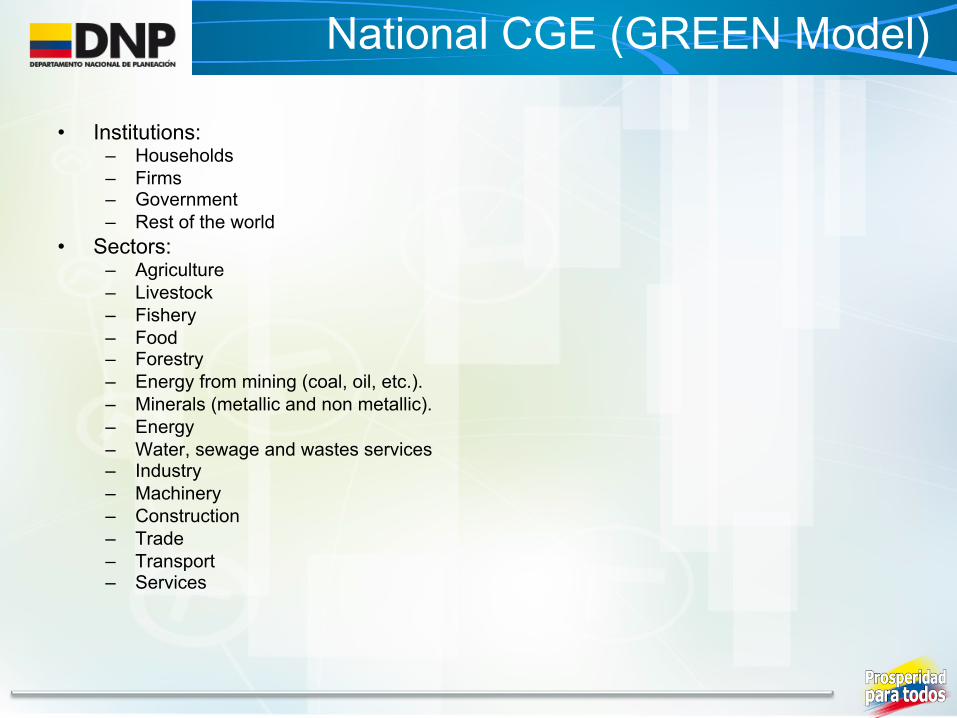
• Institutions: – Households – Firms – Government – Rest of the world
• Sectors: – Agriculture – Livestock – Fishery – Food – Forestry – Energy from mining (coal, oil, etc.). – Minerals (metallic and non metallic). – Energy – Water, sewage and wastes services – Industry – Machinery – Construction – Trade – Transport – Services
National CGE (GREEN Model)

Production Leontief
Intermediate Consumption
Value Added CES
Labor CES
Capital - Energy Bundle CES
Skilled Unskilled Capital Energy
Good 1 Armington
Domestic
Import ROW
Good 15 Armington
Domestic
Import ROW
…
Production
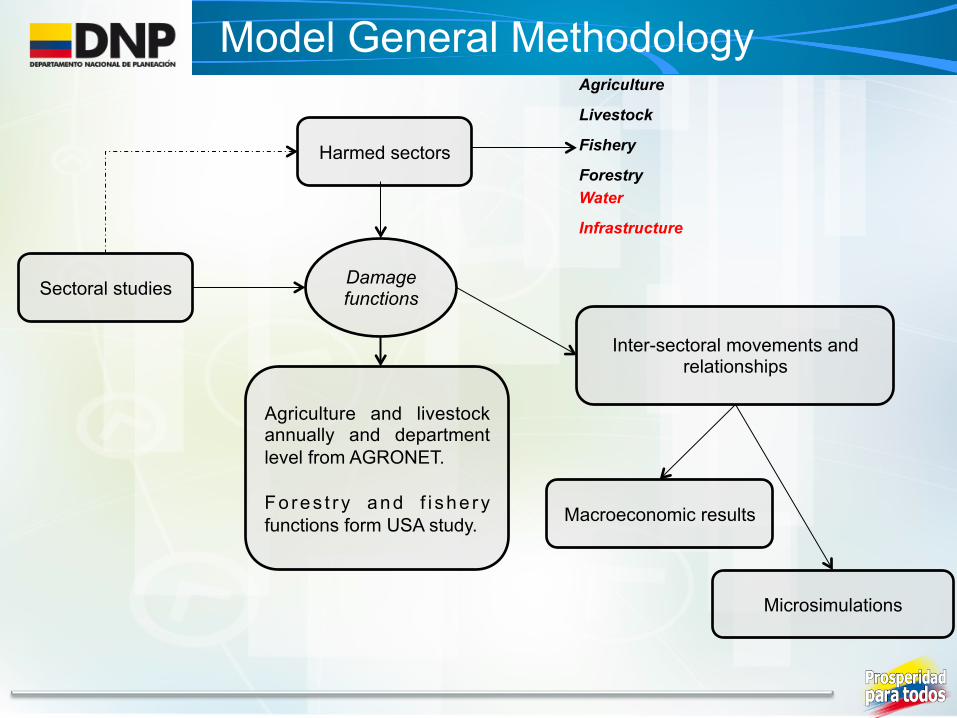
Model General Methodology
Sectoral studies
Harmed sectors
Inter-sectoral movements and relationships
Damage functions
Microsimulations
Macroeconomic results
Agriculture
Livestock
Fishery
Forestry Water
Infrastructure
Agriculture and livestock annually and department level from AGRONET. Fo res t r y and f i she ry functions form USA study.

Population
0
0,002
0,004
0,006
0,008
0,01
0,012
0,014
0,016
0,018
0,02
0
10
20
30
40
50
60
70
80
2010 2020 2030 2040 2050 2060 2070 2080 2090 2100
Grow
th rate
Populatio
n and WAP
in millions
Population and Working Age Population
WAP POP WAP GR POP GR
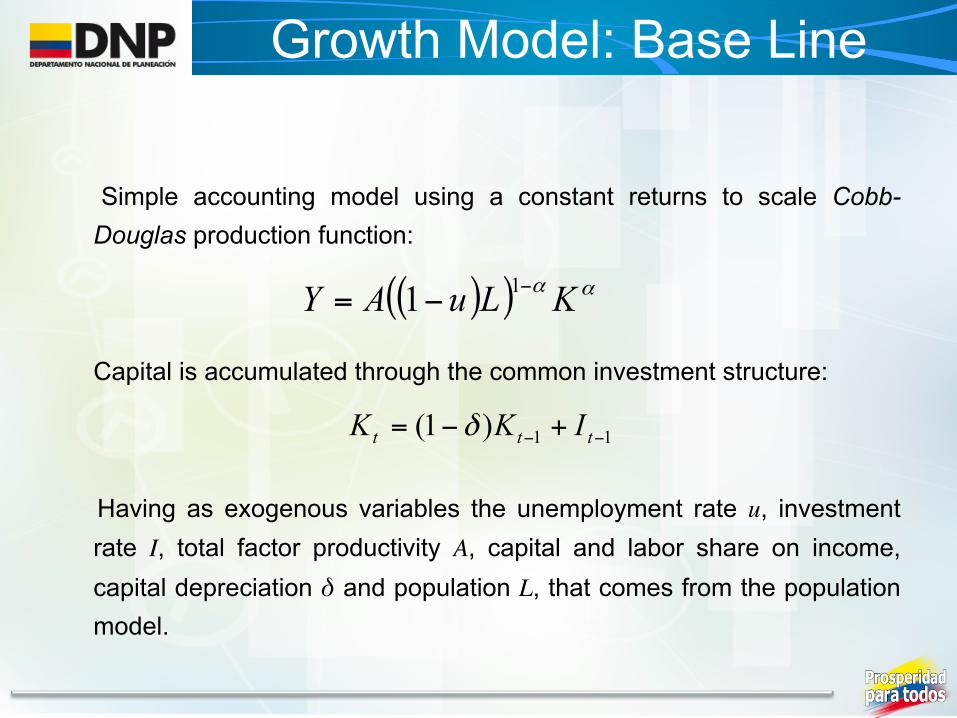
Growth Model: Base Line
Simple accounting model using a constant returns to scale Cobb-Douglas production function:
Capital is accumulated through the common investment structure:
Having as exogenous variables the unemployment rate u, investment rate I, total factor productivity A, capital and labor share on income, capital depreciation δ and population L, that comes from the population model.
( )( ) αα KLuAY −−= 11
11)1( −− +−= ttt IKK δ
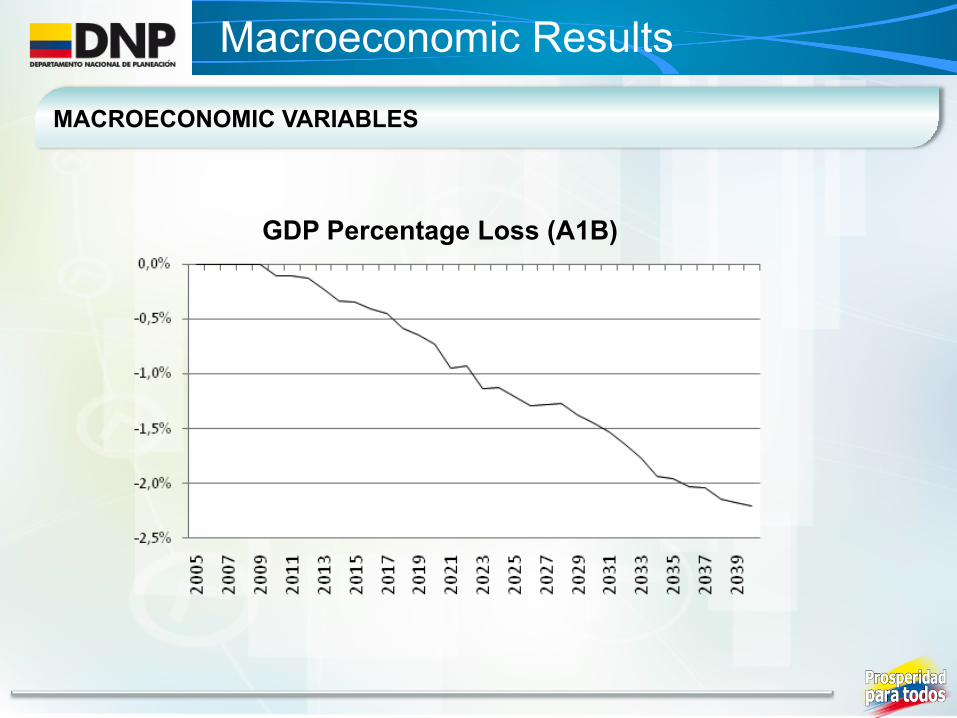
Macroeconomic Results
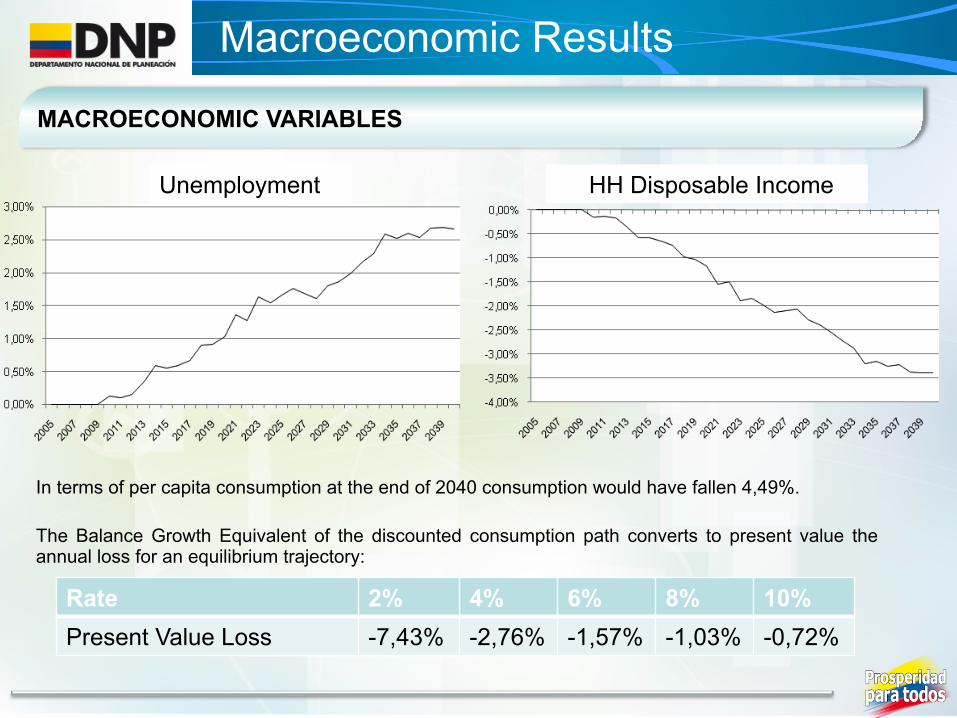
MACROECONOMIC VARIABLES
GDP Percentage Loss (A1B)
MACROECONOMIC VARIABLES
Macroeconomic Results
In terms of per capita consumption at the end of 2040 consumption would have fallen 4,49%. The Balance Growth Equivalent of the discounted consumption path converts to present value the annual loss for an equilibrium trajectory:
Rate 2% 4% 6% 8% 10% Present Value Loss -7,43% -2,76% -1,57% -1,03% -0,72%
Unemployment HH Disposable Income
GDP Loss: Heavy Rainy Season 2010
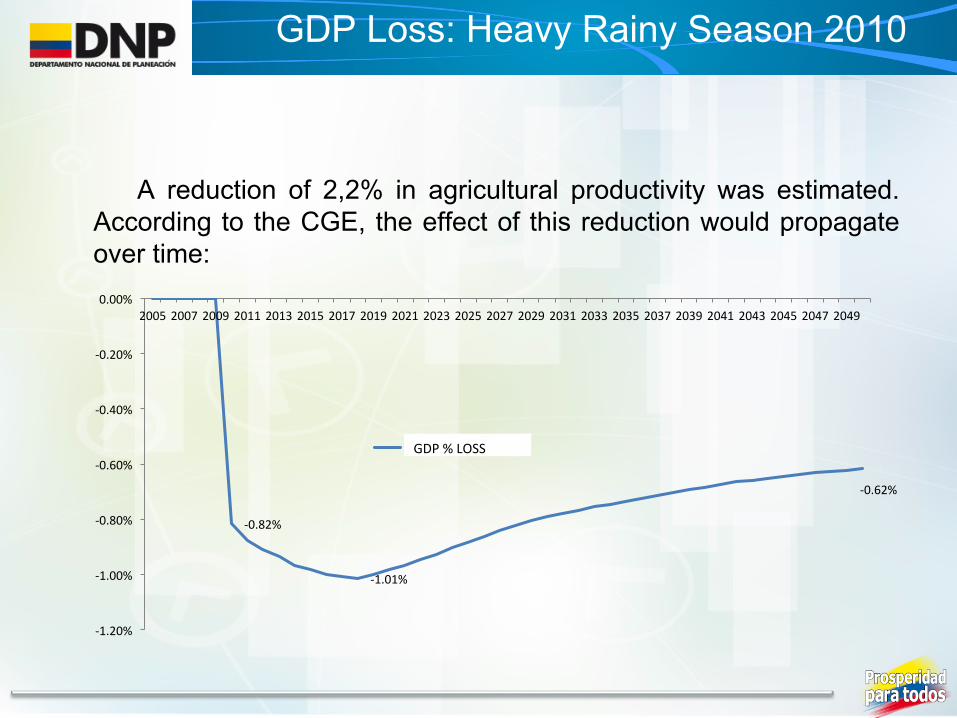
A reduction of 2,2% in agricultural productivity was estimated. According to the CGE, the effect of this reduction would propagate over time:
-‐0.82%
-‐1.01%
-‐0.62%
-‐1.20%
-‐1.00%
-‐0.80%
-‐0.60%
-‐0.40%
-‐0.20%
0.00% 2005 2007 2009 2011 2013 2015 2017 2019 2021 2023 2025 2027 2029 2031 2033 2035 2037 2039 2041 2043 2045 2047 2049
Pérdida % PIB GDP % LOSS
Microsimulations
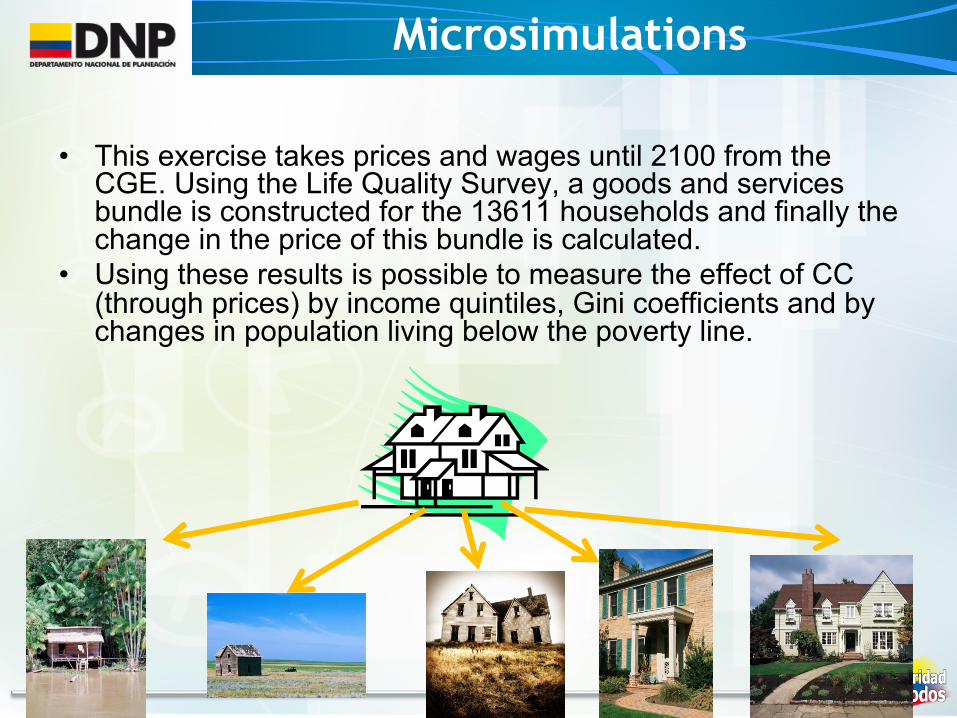
• This exercise takes prices and wages until 2100 from the CGE. Using the Life Quality Survey, a goods and services bundle is constructed for the 13611 households and finally the change in the price of this bundle is calculated.
• Using these results is possible to measure the effect of CC (through prices) by income quintiles, Gini coefficients and by changes in population living below the poverty line.
Microsimulations Results
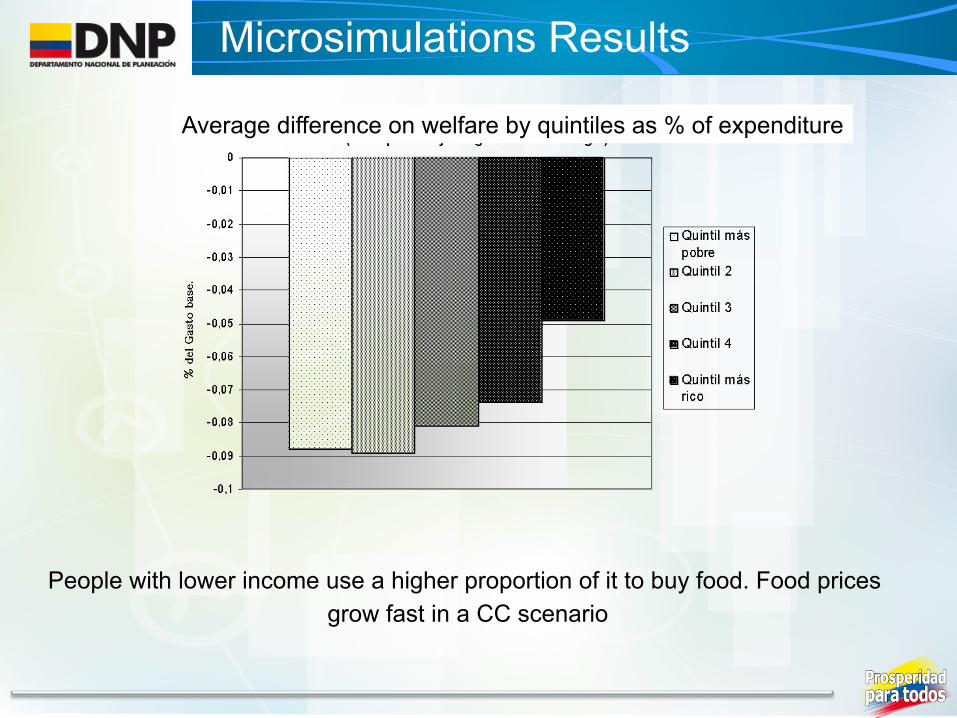
People with lower income use a higher proportion of it to buy food. Food prices grow fast in a CC scenario
Average difference on welfare by quintiles as % of expenditure
Microsimulations Results
0,0%
5,0%
10,0%
15,0%
20,0%
25,0%
30,0%
35,0%
40,0%
45,0%
50,0%
2006 2026 2046 2066 2086
Porc
enta
je d
e la
pob
laci
ón v
ivie
ndo
por d
ebaj
o de
la lí
nea
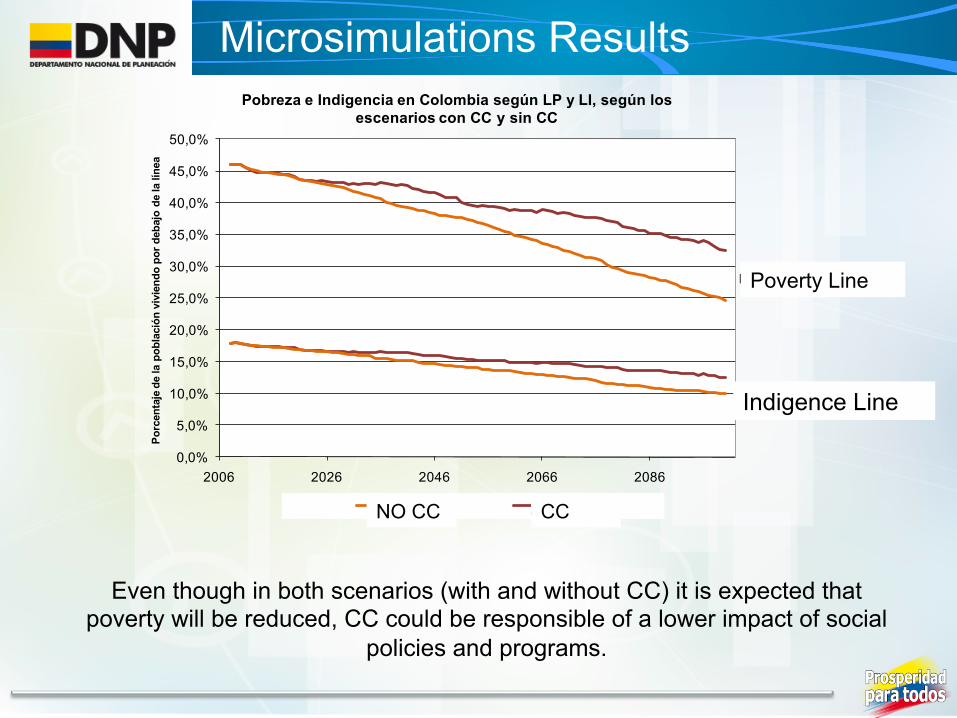
Pobreza e Indigencia en Colombia según LP y LI, según los escenarios con CC y sin CC
LI, LP con CC LI, LP sin CC
Línea de pobreza
Línea de indigencia
Even though in both scenarios (with and without CC) it is expected that poverty will be reduced, CC could be responsible of a lower impact of social
policies and programs.
0,0%
5,0%
10,0%
15,0%
20,0%
25,0%
30,0%
35,0%
40,0%
45,0%
50,0%
2006 2026 2046 2066 2086
Porc
enta
je d
e la
pob
laci
ón v
ivie
ndo
por d
ebaj
o de
la lí
nea
Pobreza e Indigencia en Colombia según LP y LI, según los escenarios con CC y sin CC
LI, LP con CC LI, LP sin CC
0,0%
5,0%
10,0%
15,0%
20,0%
25,0%
30,0%
35,0%
40,0%
45,0%
50,0%
2006 2026 2046 2066 2086
Porc
enta
je d
e la
pob
laci
ón v
ivie
ndo
por d
ebaj
o de
la lí
nea
Pobreza e Indigencia en Colombia según LP y LI, según los escenarios con CC y sin CC
LI, LP con CC LI, LP sin CC
Poverty Line
Indigence Line
NO CC CC
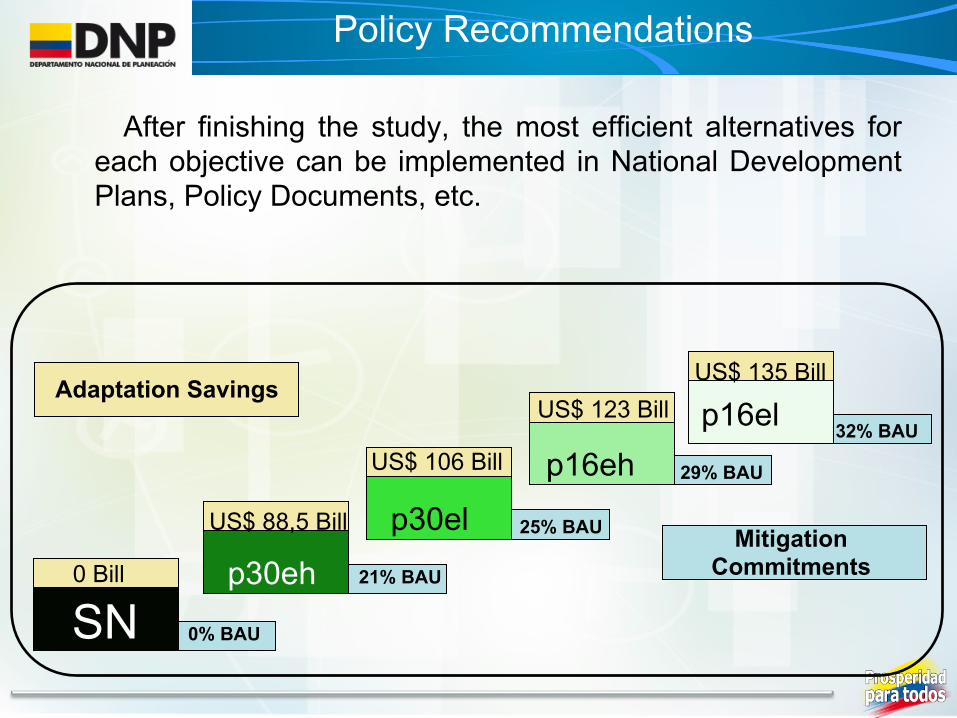
Policy Recommendations
After finishing the study, the most efficient alternatives for each objective can be implemented in National Development Plans, Policy Documents, etc.
p16eh
US$ 123 Bill
29% BAU
p30eh
US$ 88,5 Bill
21% BAU
p30el 25% BAU
US$ 106 Bill
US$ 135 Bill
32% BAU
Adaptation Savings
SN 0 Bill
0% BAU
Mitigation Commitments
p16el

PHASE 2:
SECTORAL AND REGIONAL STUDIES

The population projections are based on a fertility vs. mortality basic model and were calibrated in order to replicate the regional projections from the IPCC.
IPCC Scenarios – Population
0
10
20
30
40
50
60
70
80
90
100
1990 2000 2010 2020 2030 2040 2050 2060 2070 2080 2090 2100 2110
Población en Colombia para los escenarios de CC (En millones)
Colombia A1B1 Colombia A2 ColombiaB2A1B1 A2 B2
Population in Colombia for the IPCC scenarios (millions)

IPCC Scenarios - Economy
0
20000
40000
60000
80000
100000
120000
140000
2005 2020 2035 2050 2065 2080 2095
A2
A1B
B2
GDP per capita (in thousands of 2005 pesos)
Growth Accounting
• Labor (population, WAP, unemployment) • Total factor productivity • Investment
GDP Growth
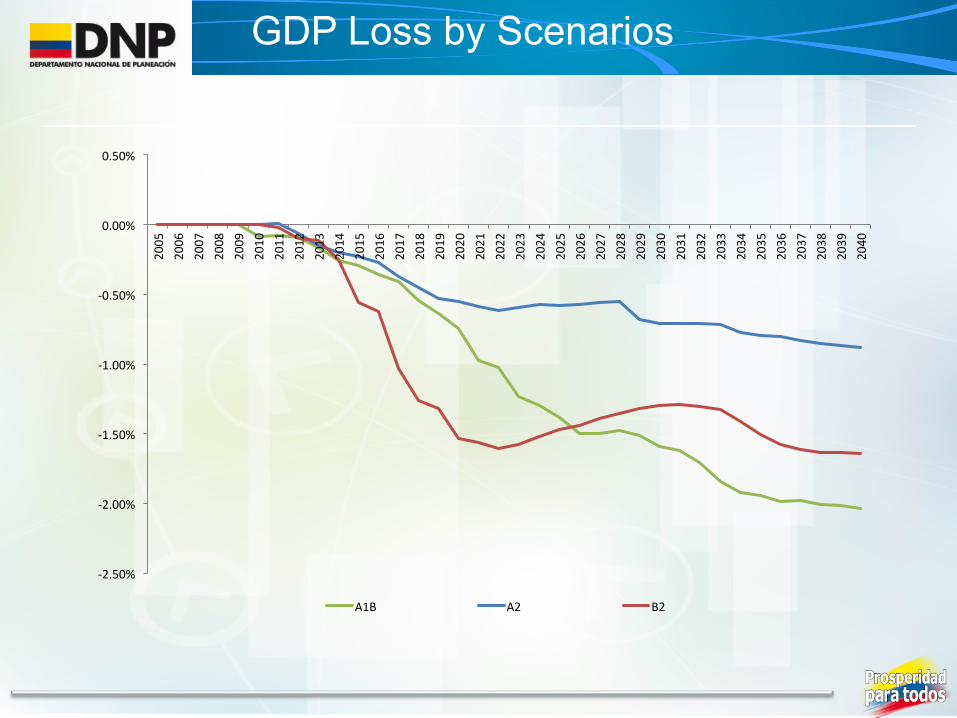
GDP Loss by Scenarios
-‐2.50%
-‐2.00%
-‐1.50%
-‐1.00%
-‐0.50%
0.00%
0.50% 2005
2006
2007
2008
2009
2010
2011
2012
2013
2014
2015
2016
2017
2018
2019
2020
2021
2022
2023
2024
2025
2026
2027
2028
2029
2030
2031
2032
2033
2034
2035
2036
2037
2038
2039
2040
A1B A2 B2
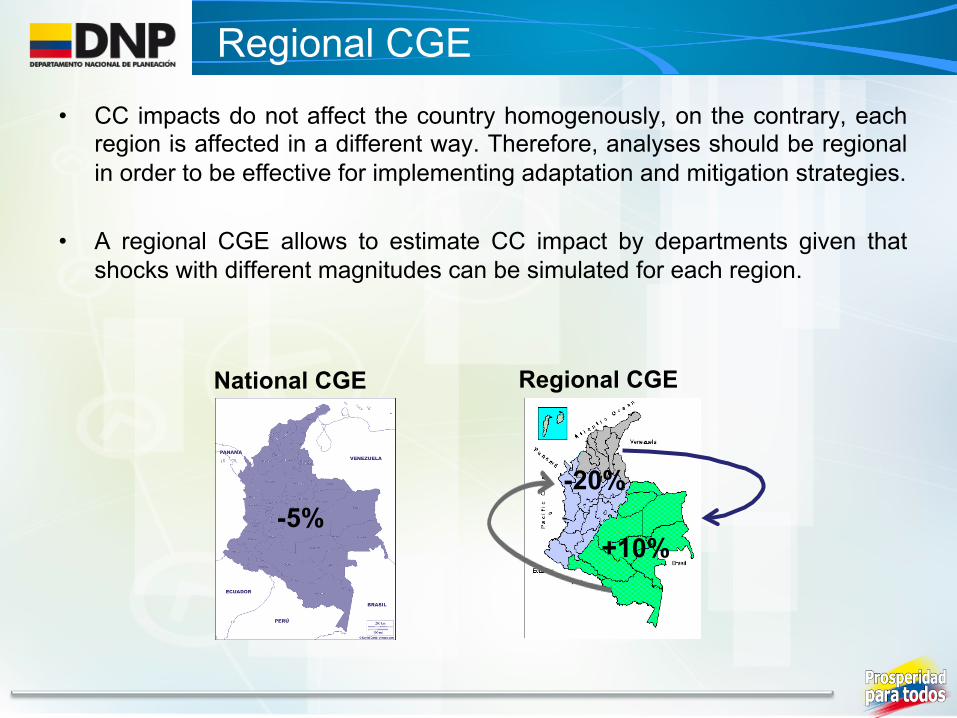
Regional CGE
• CC impacts do not affect the country homogenously, on the contrary, each region is affected in a different way. Therefore, analyses should be regional in order to be effective for implementing adaptation and mitigation strategies.
• A regional CGE allows to estimate CC impact by departments given that shocks with different magnitudes can be simulated for each region.
Regional CGE National CGE
-5% -20%
+10%
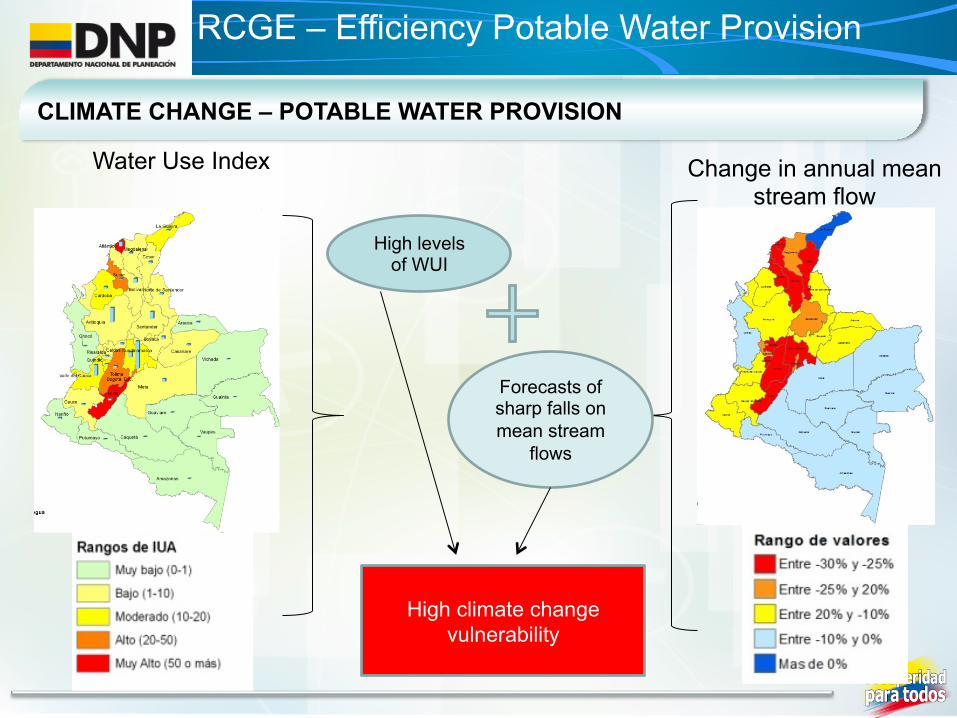
High levels of WUI
Forecasts of sharp falls on mean stream
flows
High climate change vulnerability
CLIMATE CHANGE – POTABLE WATER PROVISION
RCGE – Efficiency Potable Water Provision
Water Use Index Change in annual mean stream flow
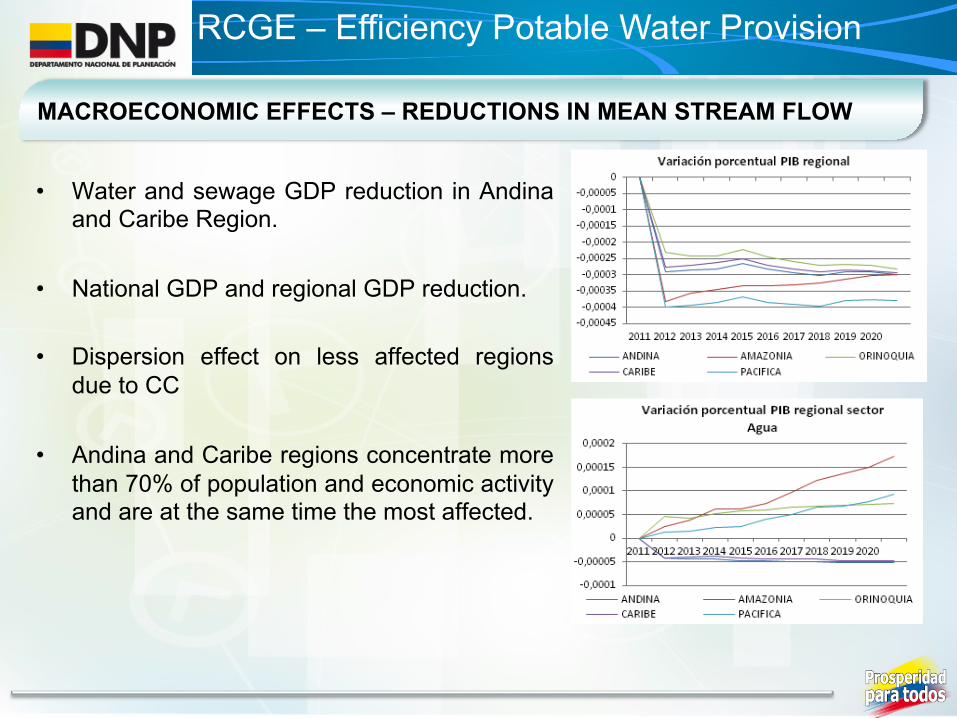
• Water and sewage GDP reduction in Andina and Caribe Region.
• National GDP and regional GDP reduction.
• Dispersion effect on less affected regions due to CC
• Andina and Caribe regions concentrate more than 70% of population and economic activity and are at the same time the most affected.
MACROECONOMIC EFFECTS – REDUCTIONS IN MEAN STREAM FLOW
RCGE – Efficiency Potable Water Provision
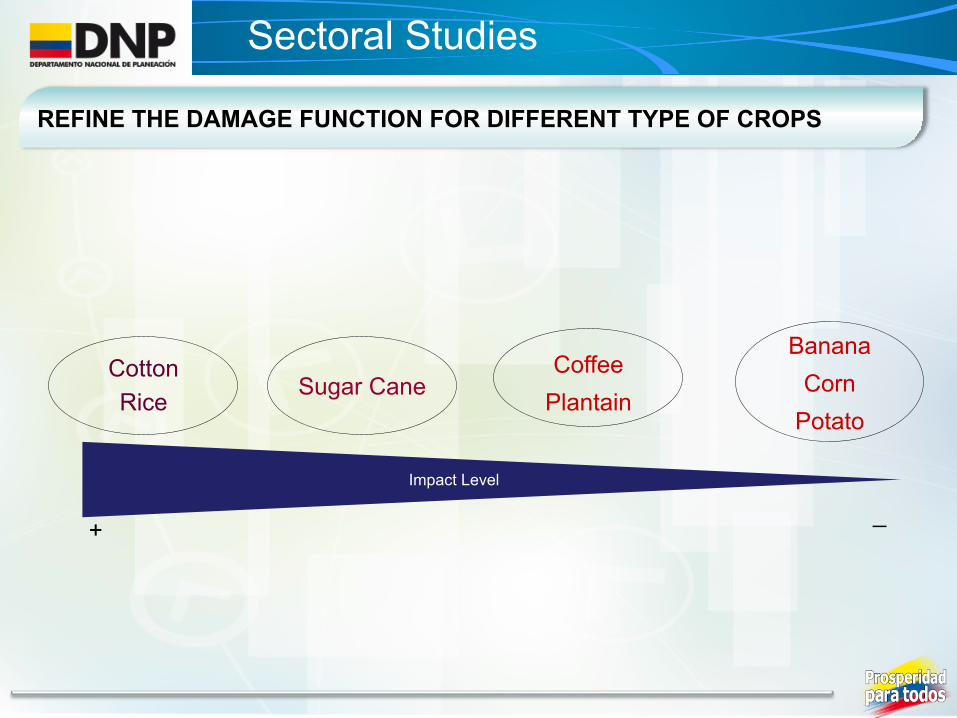
Sectoral Studies
REFINE THE DAMAGE FUNCTION FOR DIFFERENT TYPE OF CROPS
Cotton Rice Sugar Cane
Coffee Plantain
Banana Corn
Potato
_ +
Impact Level

¿How do Ecological Niche Models work?
Present
Climate Change Scenario
+ ......
Modeling algorithm
....
..
Potential distribution under present conditions
Potential distribution under new conditions
+ ...... ....
..
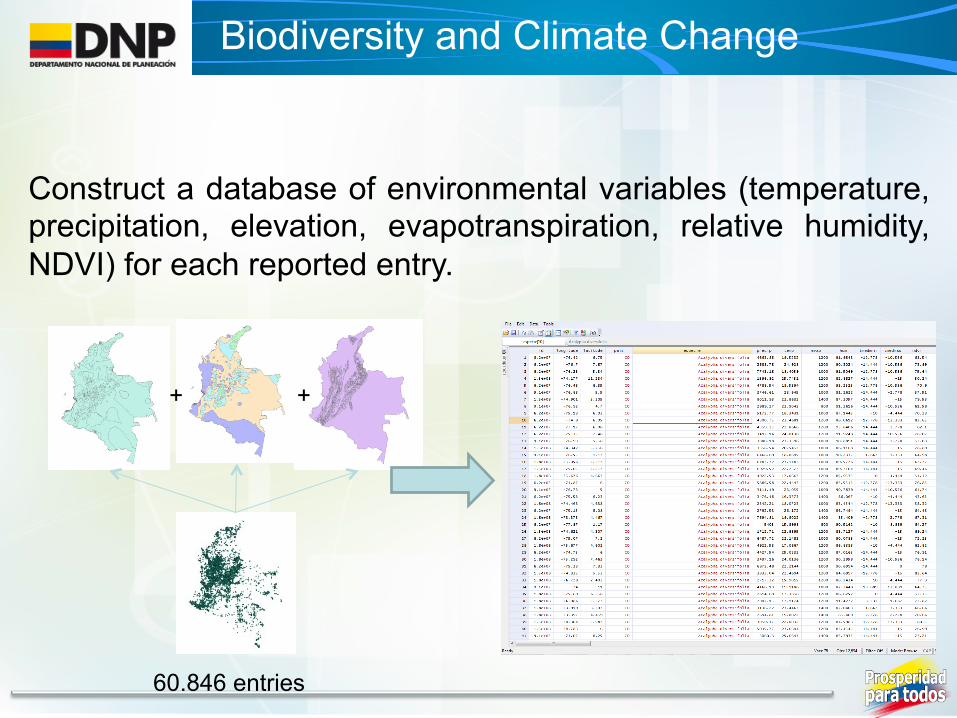
Biodiversity and Climate Change
Construct a database of environmental variables (temperature, precipitation, elevation, evapotranspiration, relative humidity, NDVI) for each reported entry.
+ +
60.846 entries

• Clasify the species statistically into clusters based on the environmental variables
We identify 22 independent clusters which are going to be modeled as dicrete units
Anth
uriu
m_p
ropi
nquu
mC
lidem
ia_o
cton
aAn
thur
ium
_pan
durif
orm
eD
rym
onia
_tur
rialv
aeO
ssae
a_m
icra
ntha
Kohl
eria
_ina
equa
lisBu
rmei
ster
a_su
ccul
enta
Col
umne
a_di
mid
iata
Hyp
nella
_div
ersi
folia
Met
eoriu
m_n
igre
scen
sVi
smia
_lau
rifor
mis
Clu
sia_
decu
ssat
aPh
ilono
tis_g
lauc
esce
nsSo
lanu
m_a
mer
ican
umC
entro
pogo
n_co
rnut
usSe
mat
ophy
llum
_sub
pinn
atum
Acal
ypha
_mac
rost
achy
aSy
rrho
podo
n_le
prie
urii
Arth
rost
emm
a_ci
liatu
mFa
bron
ia_c
iliaris
Zelo
met
eoriu
m_p
atul
umM
icon
ia_p
rasi
naVi
smia
_bac
cife
raEr
ythr
oxyl
um_c
itrifo
lium
Phor
aden
dron
_chr
ysoc
lado
nC
alop
hyllu
m_b
rasi
liens
eC
upan
ia_l
atifo
liaW
ither
ingi
a_so
lana
cea
Col
umne
a_co
nsan
guin
eaN
ecta
ndra
_mem
bran
acea
Cor
dia_
spin
esce
nsPh
thiru
sa_p
yrifo
liaN
ecke
rops
is_u
ndul
ata
Fiss
iden
s_fla
ccid
usTr
ema_
mic
rant
haM
icon
ia_s
mar
agdi
naPa
ssiflo
ra_c
oria
cea
Anth
uriu
m_o
btus
ilobu
mC
ycla
nthu
s_bi
parti
tus
Stac
hyta
rphe
ta_c
ayen
nens
isAc
iotis
_pur
pura
scen
sPs
ycho
tria_
defle
xaAn
thur
ium
_gre
xPh
ytol
acca
_riv
inoi
des
Mic
onia
_min
utiflo
raPh
ilode
ndro
n_in
aequ
ilate
rum
Acal
ypha
_div
ersi
folia
Cou
ssar
ea_p
anic
ulat
aC
lidem
ia_o
strin
aPi
tyro
gram
ma_
calo
mel
anos
Ces
trum
_meg
alop
hyllu
mSo
lanu
m_a
rbor
eum
Acio
tis_r
ubric
aulis
Tovo
mita
_wed
dellia
naH
asse
ltia_f
lorib
unda
Mic
onia
_dol
icho
rrhy
ncha
Col
umne
a_pi
cta
Cor
dia_
nodo
saPs
ycho
tria_
caer
ulea
Acio
tis_o
rnat
aC
lidem
ia_c
renu
lata
Cyp
erus
_lax
usSa
bice
a_vi
llosa
Iser
tia_h
aenk
eana
Pipe
r_hi
spid
umM
icon
ia_s
erru
lata
Hyo
phila
_inv
olut
aM
anih
ot_e
scul
enta
Cro
ssom
itriu
m_p
atris
iae
Cis
sam
pelo
s_pa
reira
Leuc
omiu
m_s
trum
osum
Oct
oble
phar
um_p
ulvi
natu
mVe
sicu
laria
_ves
icul
aris
Kyllin
ga_p
umila
Mic
onia
_alb
ican
sLa
ntan
a_ca
mar
aR
hync
hosp
ora_
nerv
osa
Psyc
hotri
a_pi
losa
Xant
hoso
ma_
dagu
ense
Ludw
igia
_oct
oval
vis
Pass
iflora
_aur
icul
ata
Sten
ospe
rmat
ion_
angu
stifo
lium
Cis
sus_
eros
aSo
lanu
m_j
amai
cens
eG
onza
lagu
nia_
corn
ifolia
Pani
cum
_pilo
sum
Mic
onia
_ner
vosa
Clid
emia
_ser
icea
Toco
ca_a
cum
inat
aAn
thur
ium
_obt
usum
Sipa
runa
_gui
anen
sis
Pipe
r_m
argi
natu
mLi
ndsa
ea_l
ance
aPa
ssiflo
ra_v
itifol
iaM
icon
ia_a
ffinis
Psyc
hotri
a_po
eppi
gian
aC
yper
us_l
uzul
aeH
eist
eria
_acu
min
ata
Mic
onia
_gra
cilis
Adel
obot
rys_
adsc
ende
nsC
omps
oneu
ra_m
utis
iiC
lusi
a_lin
eata
Philo
dend
ron_
hebe
tatu
mBe
lluci
a_pe
ntam
era
Berti
era_
guia
nens
isXi
phid
ium
_cae
rule
umPa
licou
rea_
guia
nens
isSa
uvag
esia
_ere
cta
Clid
emia
_cap
itella
taLe
andr
a_di
chot
oma
Sabi
cea_
pana
men
sis
Sola
num
_nud
umH
amel
ia_p
aten
sPi
per_
adun
cum
Chi
ococ
ca_a
lba
Ory
ctan
thus
_alv
eola
tus
Pipe
r_ar
bore
umTo
coca
_gui
anen
sis
Iser
tia_p
ittier
iM
icon
ia_t
riner
via
Varr
onia
_spi
nesc
ens
Anth
uriu
m_f
orm
osum
Psyc
hotri
a_ac
umin
ata
Mic
onia
_lac
era
Oly
ra_l
atifo
liaM
onst
era_
adan
soni
iC
lidem
ia_h
irta
Dry
mon
ia_s
erru
lata
Ory
ctan
thus
_occ
iden
talis
Cap
sicu
m_a
nnuu
mG
uazu
ma_
ulm
ifolia
Pass
iflora
_foe
tida
Pass
iflora
_biflo
raM
icon
ia_p
unct
ata
Rya
nia_
spec
iosa
Taxi
thel
ium
_pla
num
Leuc
obry
um_m
artia
num
Acio
tis_a
cum
inifo
liaPi
losi
um_c
hlor
ophy
llum
Sem
atop
hyllu
m_s
ubsi
mpl
exC
allic
oste
lla_p
allid
aPa
voni
a_fru
ticos
aG
enip
a_am
eric
ana
Oct
oble
phar
um_a
lbid
umM
onoc
haet
um_m
yrto
ideu
mC
astill
eja_
fissi
folia
Pass
iflora
_mix
taSo
lanu
m_p
hure
jaC
ybia
nthu
s_ite
oide
sSo
lanu
m_c
arip
ense
Ditr
ichu
m_d
iffici
leEr
ioso
rus_
flexu
osus
Cam
pylo
pus_
conc
olor
Sola
num
_tub
eros
umn_
andi
gena
Bucq
uetia
_glu
tinos
aAn
thox
anth
um_o
dora
tum
Ces
trum
_bux
ifoliu
mC
haet
olep
is_m
icro
phyl
laM
icon
ia_l
igus
trina
Cam
pylo
pus_
areo
dict
yon
Breu
telia
_sub
arcu
ata
Lepy
rodo
n_to
men
tosu
sR
acom
itriu
m_c
rispi
pilu
mC
erat
odon
_ste
noca
rpus
Pilo
pogo
n_gu
adal
upen
sis
Atra
ctyl
ocar
pus_
long
iset
usBa
rtram
ia_a
ngus
tifolia
Breu
telia
_chr
ysea
Cam
pylo
pus_
fragi
lisBr
eute
lia_i
nclin
ata
Myr
sine
_dep
ende
nsBr
yum
_arg
ente
umAp
tych
ella
_pro
liger
aBr
yum
_and
icol
aD
icra
num
_frig
idum
Nec
kera
_chi
lens
isTh
uidi
um_p
eruv
ianu
mLe
ptod
ontiu
m_l
uteu
mC
ampy
lopu
s_ja
mes
onii
Lept
odon
tium
_vitic
ulos
oide
sC
atag
oniu
m_b
revi
caud
atum
Breu
telia
_squ
arro
saBo
mar
ea_s
etac
eaAn
omob
ryum
_jul
aceu
mH
ypnu
m_a
mab
ileAr
cyto
phyl
lum
_nitid
umC
alam
agro
stis
_effu
saH
edw
igid
ium
_int
egrif
oliu
mC
horis
odon
tium
_spe
cios
um_v
ar_s
peci
osum
Chu
sque
a_te
ssel
lata
Cho
risod
ontiu
m_m
itteni
iPl
euro
zium
_sch
rebe
riLe
ptod
ontiu
m_p
unge
nsC
ampy
lopu
s_pi
ttieri
Cas
trate
lla_p
ilose
lloid
esPo
rotri
chod
endr
on_s
uper
bum
Sola
num
_col
ombi
anum
Breu
telia
_tria
nae
Rha
coca
rpus
_pur
pura
scen
sBr
eute
lia_t
omen
tosa
Bego
nia_
urtic
aeC
entro
pogo
n_fe
rrug
ineu
sM
acro
mitr
ium
_lon
gifo
lium
Prio
nodo
n_fu
scol
utes
cens
Stre
ptop
ogon
_ery
thro
dont
usC
entro
pogo
n_so
lani
foliu
sEp
iden
drum
_fim
bria
tum
Cap
anea
_affin
isSo
lanu
m_j
ugla
ndifo
lium
Anth
uriu
m_n
igre
scen
sAn
thur
ium
_pul
veru
lent
umAn
thur
ium
_ver
sico
lor
Clid
emia
_cilia
taSt
ruth
anth
us_l
epto
stac
hyus
Cen
tropo
gon_
gran
ulos
usU
rera
_bac
cife
raAn
thur
ium
_jes
usii
Sola
num
_lep
idot
umBo
ehm
eria
_cau
data
Phyl
logo
nium
_ful
gens
Col
umne
a_ni
cara
guen
sis
Palic
oure
a_ga
rcia
ePs
ycho
tria_
aubl
etia
naTh
amni
opsi
s_un
data
Leuc
obry
um_g
igan
teum
Palic
oure
a_de
mis
saC
yclo
dict
yon_
albi
cans
Anth
uriu
m_m
icro
spad
ixBe
sler
ia_s
olan
oide
sKo
hler
ia_h
irsut
aC
onda
min
ea_c
orym
bosa
Kohl
eria
_spi
cata
Sola
num
_atu
rens
eAc
ropo
rium
_pun
gens
Not
ople
ura_
mac
roph
ylla
Col
umne
a_pu
rpur
ata
Gue
ttard
a_cr
ispi
flora
Mic
onia
_cau
data
Hed
yosm
um_b
onpl
andi
anum
Antid
aphn
e_vi
scoi
dea
Rac
opilu
m_t
omen
tosu
mSo
lanu
m_a
phyo
dend
ron
Anth
uriu
m_s
cand
ens
Pyrr
hobr
yum
_spi
nifo
rme
Thui
dium
_tom
ento
sum
Col
umne
a_m
inor
Anth
uriu
m_m
yosu
roid
esC
hrys
ochl
amys
_col
ombi
ana
Lasi
acis
_nig
raPi
per_
cras
sine
rviu
mAs
clep
ias_
cura
ssav
ica
Ipom
oea_
bata
tas
Eryt
hrod
ontiu
m_l
ongi
setu
mC
occo
cyps
elum
_lan
ceol
atum
Myr
sine
_gui
anen
sis
Mic
onia
_aer
ugin
osa
Inde
term
inad
o_in
dete
rmin
ada
Syrr
hopo
don_
prol
ifer_
var_
prol
ifer
Blec
hnum
_occ
iden
tale
Palic
oure
a_th
yrsi
flora
Que
rcus
_hum
bold
tiiC
inch
ona_
pube
scen
sEp
iden
drum
_sec
undu
mLe
andr
a_su
bser
iata
Atric
hum
_pol
ycar
pum
Funa
ria_c
alve
scen
sFi
ssid
ens_
cris
pus
Pass
iflora
_cum
bale
nsis
Cor
dia_
cylin
dros
tach
yaM
icon
ia_t
heae
zans
Pilo
trich
ella
_fle
xilis
Met
eoriu
m_d
eppe
iR
hync
host
egiu
m_s
cario
sum
Adel
othe
cium
_bog
oten
seLy
copo
dium
_cla
vatu
mN
erte
ra_g
rana
dens
isLe
ptod
ontiu
m_l
ongi
caul
e_va
r._lo
ngic
aule
Nec
kera
_sca
brid
ens
Esca
lloni
a_pa
nicu
lata
Pipe
r_ar
tant
hePa
ssiflo
ra_m
anic
ata
Philo
notis
_unc
inat
aH
edyo
smum
_rac
emos
umPo
lypo
dium
_fra
xini
foliu
mLe
ucob
ryum
_cris
pum
Mic
onia
_the
izan
sM
eteo
ridiu
m_r
emot
ifoliu
mH
ypop
tery
gium
_tam
aris
ciM
itteno
tham
nium
_rep
tans
Sola
num
_ova
lifoliu
mBr
yohu
mbe
rtia_
filifo
liaIre
sine
_diffu
saM
icon
ia_l
ehm
anni
iPa
licou
rea_
angu
stifo
liaPl
agio
mni
um_r
hync
hoph
orum
Equi
setu
m_b
ogot
ense
Fiss
iden
s_as
plen
ioid
esLa
denb
ergi
a_m
acro
carp
aM
acro
mitr
ium
_cirr
osum
Tolo
xis_
impo
nder
osa
Poro
trich
oden
dron
_lin
digi
iPt
erob
ryon
_den
sum
Anth
uriu
m_c
auca
num
Clu
sia_
ducu
oide
sC
olum
nea_
strig
osa
Cte
nidi
um_m
alac
odes
Thui
dium
_del
icat
ulum
Anth
uriu
m_o
xybe
lium
Car
ex_b
onpl
andi
iC
ampy
lopu
s_ric
hard
iiPl
atyh
ypni
dium
_aqu
atic
umPo
lytri
chum
_jun
iper
inum
Zygo
don_
rein
war
dtii
Cam
pylo
pus_
pilife
rG
aiad
endr
on_p
unct
atum
Rho
dobr
yum
_gra
ndifo
lium
Squa
mid
ium
_leu
cotri
chum
Poro
trich
um_l
ongi
rost
reSe
mat
ophy
llum
_sw
artz
iiM
yrsi
ne_c
oria
cea
Poly
trich
adel
phus
_lon
gise
tus
Mor
ella
_pub
esce
nsG
aliu
m_h
ypoc
arpi
umW
einm
anni
a_pu
besc
ens
Lyci
anth
es_r
adia
taSt
rept
opog
on_c
alym
pere
sLe
pido
pilu
m_l
ongi
foliu
mPr
iono
don_
dens
usC
lusi
a_m
ultifl
ora
Phyl
logo
nium
_vis
cosu
mSq
uam
idiu
m_n
igric
ans
Anth
uriu
m_l
onge
geni
cula
tum
Fiss
iden
s_po
lypo
dioi
des0
500
1000
1500
2000
Cluster Dendrogram
hclust (*, "average")distancia1
Hei
ght
Biodiversity and Climate Change
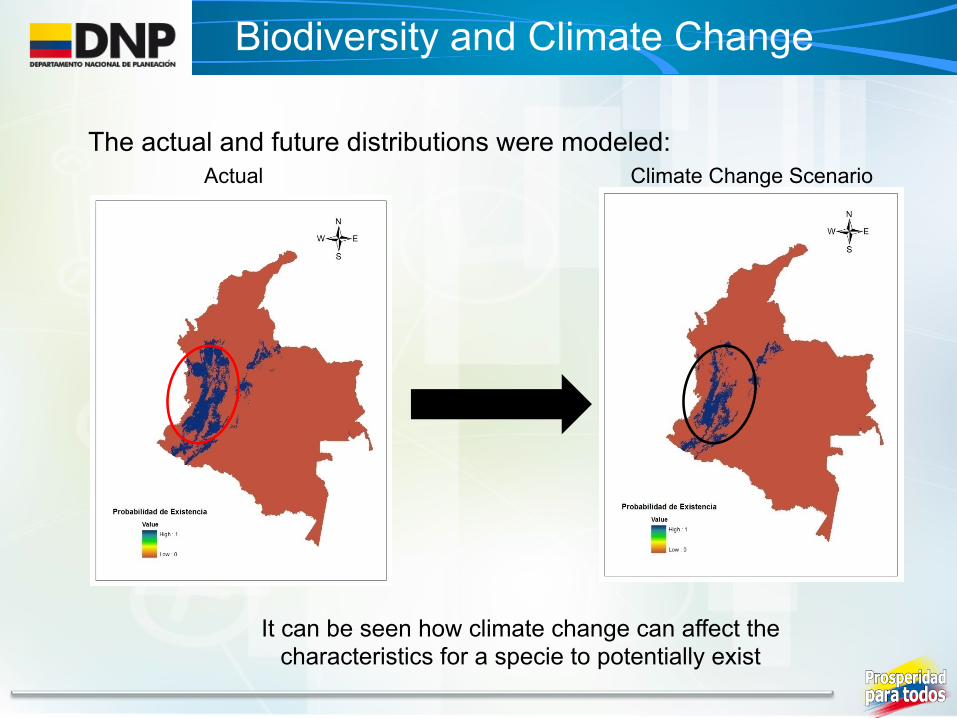
The actual and future distributions were modeled:
It can be seen how climate change can affect the characteristics for a specie to potentially exist
Biodiversity and Climate Change
Climate Change Scenario Actual
Sectoral Studies:
o Damage functions for livestock, fishery, forestry, transport, water and biodiversity and incorporation into the regional CGE (Technical Cooperation IDB).
o Consolidation of results for agriculture (Aquacrop Project with FAO).
Modeling:
o Introduce land use change issues into the model. o Define a damage function for tourism.
2012 Agenda
SOME PERSPECTVES
RCGE
o Incorporate extreme events impacts into the RCGE (Technical Cooperation IDB).
o Microsimulations at the regional level.
Adaptations Measures:
o Specific adaptation measures according to the analysis of the EIECC. o Cost-benefit analysis of adaptations measures and incorporation in the
CGE as support for the National Adaptation Plan for Climate Change (Technical Cooperation IDB).
2012 Agenda
SOME PERSPECTIVES

Gracias www.dnp.gov.co
PBX: 3815000