Embed Size (px)
Citation preview

THE ECONOMIC IMPACTS OF VISITOR AND SUNDANCE INSTITUTE SPENDING
2015 SUNDANCE FILM FESTIVAL
JANUARY 22, 2015 TO FEBRUARY 1, 2015
PREPARED BY
JAN ELISE STAMBRO BUREAU OF ECONOMIC AND BUSINESS RESEARCH
UNIVERSITY OF UTAH
April 2015

Economic Impacts of the 2015 Sundance Film Festival
1 B U R E A U O F E C O N O M I C A N D B U S I N E S S R E S E A R C H
T H E E C O N O M I C I M P A C T S O F T H E 20 1 5 S U N D A N C E F I L M F E S T I V A L
INTRODUCTION This report provides information developed by the Bureau of Economic and Business Research (BEBR) about the 2015 Sundance Festival presented by Sundance Institute (Institute) and held in Utah between January 22, 2015 and February 1, 2015. The data presented here includes characteristics of Festival attendees as well as the economic impacts of the expenditures made by those attendees during the Festival. It also shows the impacts of expenditures made by the Sundance Institute to produce and support the Festival. The visitor information presented in this analysis is based on random intercept surveys of Festival attendees conducted by BEBR survey staff during the Festival. These surveys results were used to estimate the visitor spending impact component of the report. The impact of the Institute’s spending to produce the Festival is based on information provided by the Institute. These expenditures were made between March 1, 2014 and February 28, 2015. Sundance films are shown in 16 theater venues in four geographic locations in Utah—Park City, Salt Lake City, the Sundance Resort in Utah County, and Ogden. For films shown in Salt Lake City, the Sundance Resort and Ogden, BEBR surveyed only at the theater venue. In Park City, BEBR surveyed at each theater venue and conducted intercept surveys on Main Street, at the Old Town Transit Center and other locations around Main Street. Over the course of the Festival, a total of 810 surveys were completed. The number of surveys conducted in a particular geographic area was determined by the number of Festival tickets sold for theater venues in that location during the Festival in the previous year. Ticket sales for theater venues in Park City account for 74.5 percent of all film screenings; hence, approximately 73 percent of the surveys conducted during the 2015 Film Festival were in the Park City area. Total Festival attendance, and the ratio of local to nonlocal participation in Festival events was estimated by BEBR using ticket sales and ticket redemption information provided by the Institute. Based on that data, BEBR estimated total attendance at the 2015 Film Festival to be 46,107, of which 15,215 were residents of Utah and 30,892 were visiting from other areas. Survey results and impact estimates are summarized in the Major Findings section. Supporting data tables are provided in Appendices A through F. Expenditures made by the Sundance Institute to produce the Festival are detailed in Appendix G. The economic impacts of the 2015 Sundance Film Festival have been estimated using a regional impact model known as RIMS II, developed by the U.S. Department of Commerce, Bureau of Economic Analysis. A discussion of economic impact modeling in general and the RIMS II Model in particular is provided in Appendix H.
Economic Impacts of the 2015 Sundance Film Festival
2 B U R E A U O F E C O N O M I C A N D B U S I N E S S R E S E A R C H
M A J O R F I N D I N G S ATTENDANCE AND SPENDING • BEBR estimated 46,107 people attended the Sundance Film Festival in 2015. This is
slightly higher than the 2014 estimate of 45,352. Since 2010, Festival attendance has ranged from a low of 41,221 in 2010 to a high of 46,947 in 2013.
• Of the estimated 46,107 Festival attendees, 33 percent (15,215) were residents of Utah
(locals) and 67 percent (30,892) visited from outside Utah (nonresidents). Over the past seven years, locals have accounted for 30 to 34 percent of total Festival attendance.
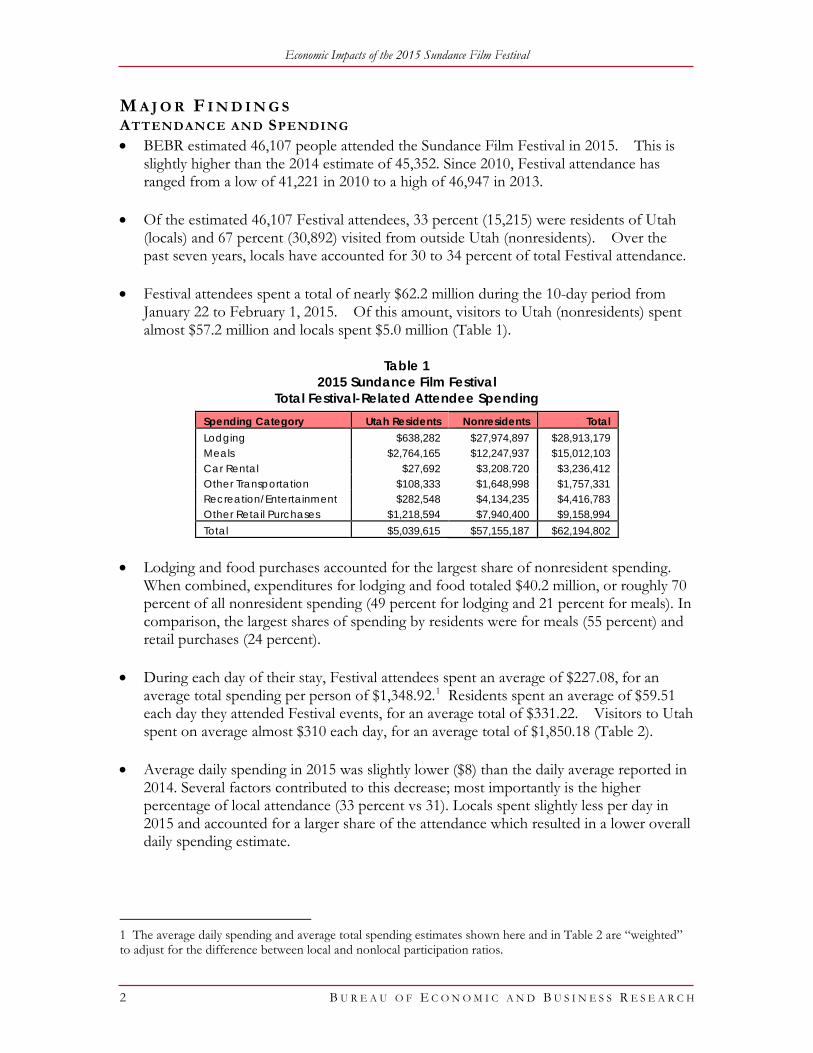
• Festival attendees spent a total of nearly $62.2 million during the 10-day period from
January 22 to February 1, 2015. Of this amount, visitors to Utah (nonresidents) spent almost $57.2 million and locals spent $5.0 million (Table 1).
Table 1
2015 Sundance Film Festival Total Festival-Related Attendee Spending
Spending Category Utah Residents Nonresidents Total Lodging $638,282 $27,974,897 $28,913,179 Meals $2,764,165 $12,247,937 $15,012,103 Car Rental $27,692 $3,208.720 $3,236,412 Other Transportation $108,333 $1,648,998 $1,757,331 Recreation/Entertainment $282,548 $4,134,235 $4,416,783 Other Retail Purchases $1,218,594 $7,940,400 $9,158,994 Total $5,039,615 $57,155,187 $62,194,802
• Lodging and food purchases accounted for the largest share of nonresident spending.
When combined, expenditures for lodging and food totaled $40.2 million, or roughly 70 percent of all nonresident spending (49 percent for lodging and 21 percent for meals). In comparison, the largest shares of spending by residents were for meals (55 percent) and retail purchases (24 percent).
• During each day of their stay, Festival attendees spent an average of $227.08, for an average total spending per person of $1,348.92.1 Residents spent an average of $59.51 each day they attended Festival events, for an average total of $331.22. Visitors to Utah spent on average almost $310 each day, for an average total of $1,850.18 (Table 2).
• Average daily spending in 2015 was slightly lower ($8) than the daily average reported in
2014. Several factors contributed to this decrease; most importantly is the higher percentage of local attendance (33 percent vs 31). Locals spent slightly less per day in 2015 and accounted for a larger share of the attendance which resulted in a lower overall daily spending estimate.
1 The average daily spending and average total spending estimates shown here and in Table 2 are “weighted” to adjust for the difference between local and nonlocal participation ratios.

Economic Impacts of the 2015 Sundance Film Festival
3 B U R E A U O F E C O N O M I C A N D B U S I N E S S R E S E A R C H
Table 2 2015 Sundance Film Festival
Weighted Average Spending per Person All Attendees Utah Residents Nonresidents Spending Category Daily Total Daily Total Daily Total Lodging $83.35 $620.58 $6.43 $41.95 $121.23 $905.58 Meals $58.66 $325.59 $32.32 $181.67 $71.63 $396.45 Car Rental $12.30 $70.19 $0.33 $1.82 $18.20 $103.87 Other Transportation $7.01 $38.11 $1.56 $7.12 $9.69 $53.38 Recreation/Entertainment $22.58 $95.79 $4.89 $18.57 $31.30 $133.83 Other Retail Purchases $43.17 $198.65 $13.96 $50.09 $57.56 $257.04 Total $227.08 $1,348.92 $59.51 $331.22 $309.61 $1,850.18 The average daily spending estimate is the amount each attendee spent per day while attending the festival. The average total spending estimate is the amount each attendee spent over the course of his or her visit.
• In total Festival attendees spent about $1.7 million less in 2015 than in 2014. The
decline is explained by the smaller share of nonresident attendance in 2015. While nonresidents spent essentially the same amount each day during their stay in Utah in 2015 as they did in 2014, and attended Festival event about the same number of days, BEBR estimated that the number of local attendees attending the Festival in 2015 was higher than the estimate in 2014. Because locals spend just a fraction of the amount spent by nonresidents during the Festival, total spending was lower.
• In 2015, Festival attendees reported spending less each day for lodging than in 2014 ($144 compared to $121). This decrease accounts for most of the spending decline and is likely the result of an increase in the share of nonresidents who reported they were staying with friends and family (23.7 percent in 2015 and 20.7 percent in 2014), and an increase in the number of nonresidents who reported they were staying in hotels and motels located outside the Deer Valley/Park City area (27.7 percent in 2015 and 26.8 percent in 2014).
• The decrease in lodging expenditures was partially offset by increased spending for meals
(food and beverages) and retail purchases, which increased by $1.2 million and $1.9 million, respectively. Table 3 compares the total estimated spending of Festival attendees for 2014 and 2015.
Table 3
2015 Sundance Film Festival Total Resident and Nonresident Attendee Spending
2014 and 2015 Comparison Spending Category 2014 2015 Dollar Change Lodging $33,574,602 $28,613,179 ($4,961,423) Meals $13,724,961 $15,012,103 $1,287,142 Car Rental $3,179,209 $3,236,412 $57,203 Other Transportation $1,654,442 $1,757,331 $192,889 Recreation/Entertainment $4,534,868 $4,416,783 ($118,085) Other Retail Purchases $7,237,286 $9,158,994 $1,921,708) Total $63,905,369 $62,194,802 ($1,710,567)
Note: Data for 2014 are from a previous report completed by BEBR for the Sundance Institute.
Economic Impacts of the 2015 Sundance Film Festival
4 B U R E A U O F E C O N O M I C A N D B U S I N E S S R E S E A R C H
E C O N O M I C I M P A C T E S T I M A T E S The economic impact estimates presented here include (1) the impacts of purchases made by nonresidents attending the 2015 Sundance Film Festival and (2) the impacts of expenditures made in Utah by the Sundance Institute to produce the Festival. The impact estimates were generated using an economic impact model known as RIMS II, developed by the Bureau of Economic Analysis. The model has been regionalized for Utah.
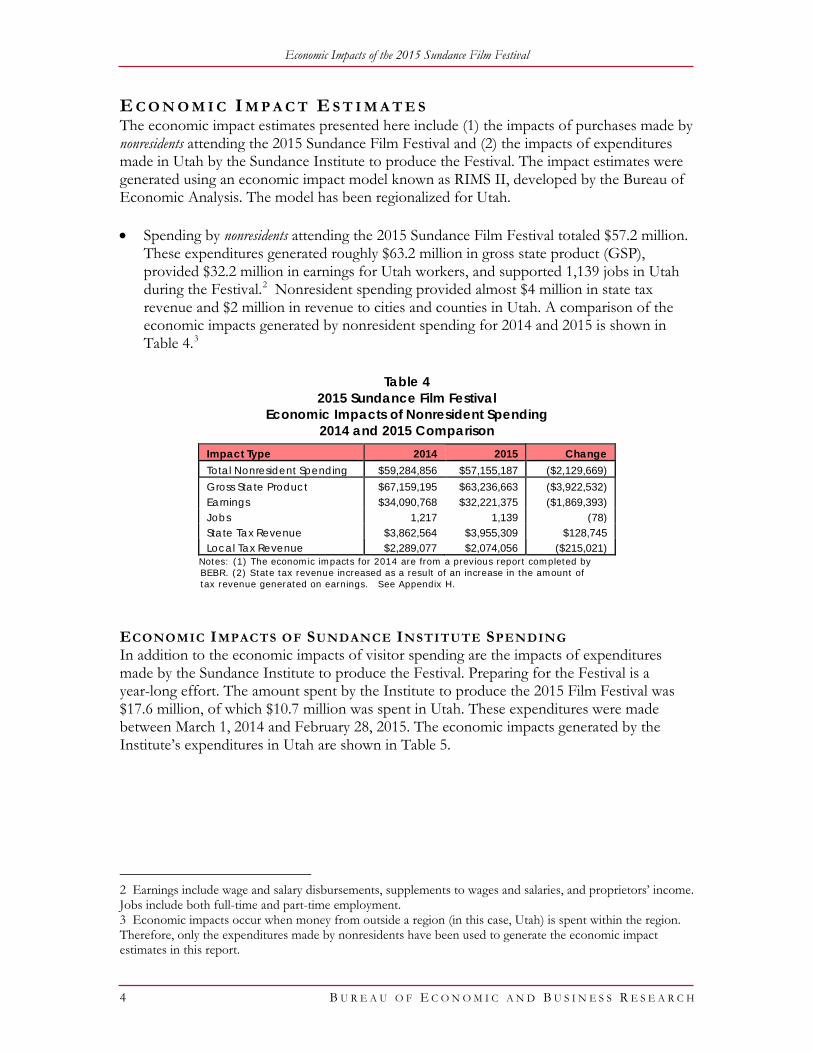
• Spending by nonresidents attending the 2015 Sundance Film Festival totaled $57.2 million.
These expenditures generated roughly $63.2 million in gross state product (GSP), provided $32.2 million in earnings for Utah workers, and supported 1,139 jobs in Utah during the Festival.2 Nonresident spending provided almost $4 million in state tax revenue and $2 million in revenue to cities and counties in Utah. A comparison of the economic impacts generated by nonresident spending for 2014 and 2015 is shown in Table 4.3
Table 4 2015 Sundance Film Festival
Economic Impacts of Nonresident Spending 2014 and 2015 Comparison
Impact Type 2014 2015 Change Total Nonresident Spending $59,284,856 $57,155,187 ($2,129,669) Gross State Product $67,159,195 $63,236,663 ($3,922,532) Earnings $34,090,768 $32,221,375 ($1,869,393) Jobs 1,217 1,139 (78) State Tax Revenue $3,862,564 $3,955,309 $128,745 Local Tax Revenue $2,289,077 $2,074,056 ($215,021)
Notes: (1) The economic impacts for 2014 are from a previous report completed by BEBR. (2) State tax revenue increased as a result of an increase in the amount of tax revenue generated on earnings. See Appendix H.
ECONOMIC IMPACTS OF SUNDANCE INSTITUTE SPENDING In addition to the economic impacts of visitor spending are the impacts of expenditures made by the Sundance Institute to produce the Festival. Preparing for the Festival is a year-long effort. The amount spent by the Institute to produce the 2015 Film Festival was $17.6 million, of which $10.7 million was spent in Utah. These expenditures were made between March 1, 2014 and February 28, 2015. The economic impacts generated by the Institute’s expenditures in Utah are shown in Table 5.
2 Earnings include wage and salary disbursements, supplements to wages and salaries, and proprietors’ income. Jobs include both full-time and part-time employment. 3 Economic impacts occur when money from outside a region (in this case, Utah) is spent within the region. Therefore, only the expenditures made by nonresidents have been used to generate the economic impact estimates in this report.
Economic Impacts of the 2015 Sundance Film Festival
5 B U R E A U O F E C O N O M I C A N D B U S I N E S S R E S E A R C H
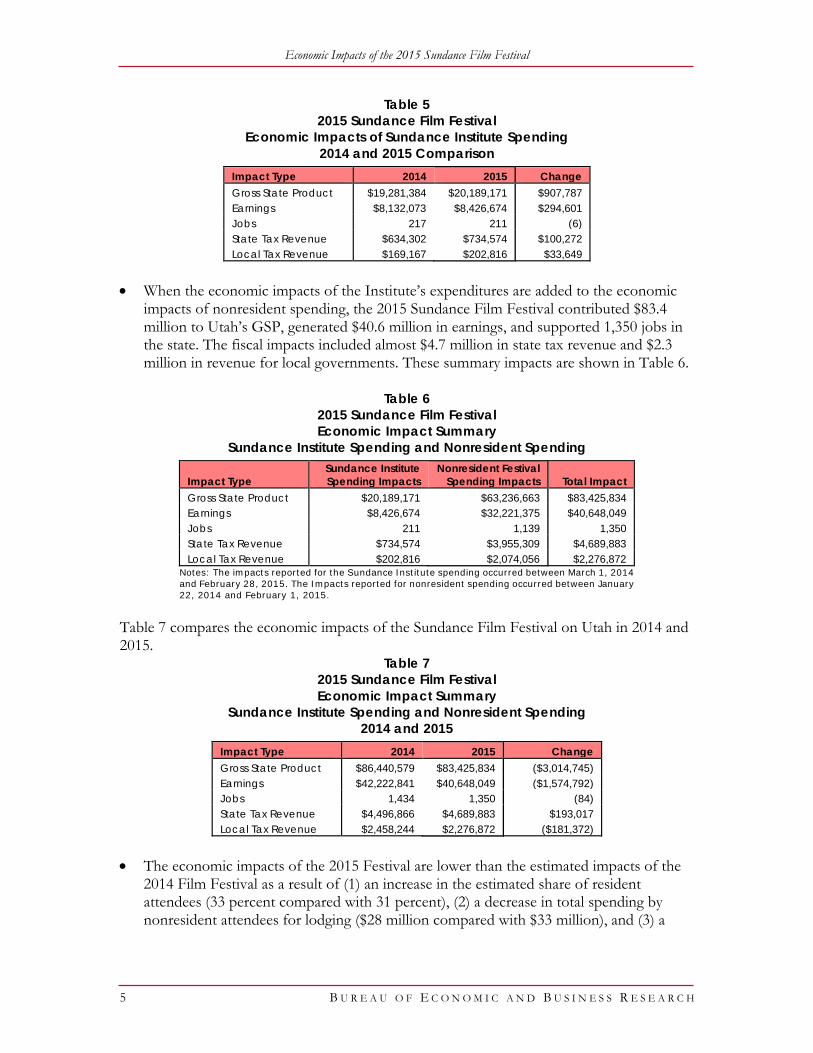
Table 5 2015 Sundance Film Festival
Economic Impacts of Sundance Institute Spending 2014 and 2015 Comparison
Impact Type 2014 2015 Change Gross State Product $19,281,384 $20,189,171 $907,787 Earnings $8,132,073 $8,426,674 $294,601 Jobs 217 211 (6) State Tax Revenue $634,302 $734,574 $100,272 Local Tax Revenue $169,167 $202,816 $33,649
• When the economic impacts of the Institute’s expenditures are added to the economic
impacts of nonresident spending, the 2015 Sundance Film Festival contributed $83.4 million to Utah’s GSP, generated $40.6 million in earnings, and supported 1,350 jobs in the state. The fiscal impacts included almost $4.7 million in state tax revenue and $2.3 million in revenue for local governments. These summary impacts are shown in Table 6.
Table 6
2015 Sundance Film Festival Economic Impact Summary
Sundance Institute Spending and Nonresident Spending
Impact Type Sundance Institute Spending Impacts
Nonresident Festival Spending Impacts Total Impact
Gross State Product $20,189,171 $63,236,663 $83,425,834 Earnings $8,426,674 $32,221,375 $40,648,049 Jobs 211 1,139 1,350 State Tax Revenue $734,574 $3,955,309 $4,689,883 Local Tax Revenue $202,816 $2,074,056 $2,276,872
Notes: The impacts reported for the Sundance Institute spending occurred between March 1, 2014 and February 28, 2015. The Impacts reported for nonresident spending occurred between January 22, 2014 and February 1, 2015.
Table 7 compares the economic impacts of the Sundance Film Festival on Utah in 2014 and 2015.
Table 7 2015 Sundance Film Festival Economic Impact Summary
Sundance Institute Spending and Nonresident Spending 2014 and 2015
Impact Type 2014 2015 Change Gross State Product $86,440,579 $83,425,834 ($3,014,745) Earnings $42,222,841 $40,648,049 ($1,574,792) Jobs 1,434 1,350 (84) State Tax Revenue $4,496,866 $4,689,883 $193,017 Local Tax Revenue $2,458,244 $2,276,872 ($181,372)
• The economic impacts of the 2015 Festival are lower than the estimated impacts of the
2014 Film Festival as a result of (1) an increase in the estimated share of resident attendees (33 percent compared with 31 percent), (2) a decrease in total spending by nonresident attendees for lodging ($28 million compared with $33 million), and (3) a

Economic Impacts of the 2015 Sundance Film Festival
6 B U R E A U O F E C O N O M I C A N D B U S I N E S S R E S E A R C H
higher share of nonresident attendees who said they were staying with friends and family (23.7percent compared with 20.7percent).
A T T E N D A N C E H I G H L I G H T S • Most of the people attending the Festival are U.S. residents, the largest share of which
live in Utah, California and New York. This finding is consistent with survey results for previous years. Based on survey findings, 92 percent of those attending the Festival in 2015 live in the U.S. Of these, 57 percent were residents of Utah, California or New York.
An estimated 3,735 people attending the Festival in 2015 were not U.S. residents. Visitors from 30 countries were surveyed at the 2015 Festival. Visitors from Canada accounted for the largest share of international attendees, followed by visitors from Brazil and Germany. The number of international visitors to the Festival in 2015 was higher than the 3,583 estimated in 2014, but lower than the number of international visitor estimate in 2012 of 5,795.
• Eighty-eight percent of the nonresident visitors surveyed said that attending the Festival was the primary reason for their visit to Utah. Almost 28 percent of nonresidents said they were visiting Utah for the first time and 49 percent said they would visit Utah again within the next 12 months.
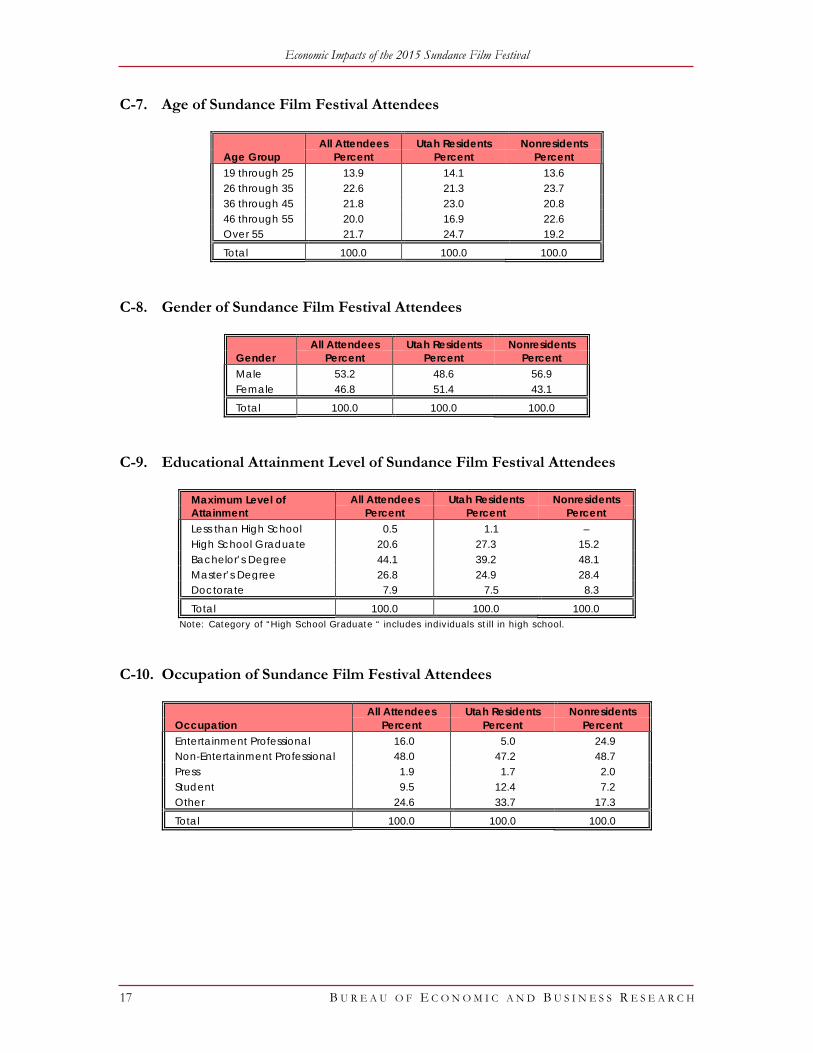
DEMOGRAPHICS • The Sundance Film Festival appeals to people of all ages. People between 19 and 25
years old accounted for almost 14 percent of all Festival attendees in 2015. For Utah residents, the largest share of attendees was over the age of 55 (almost 25 percent), while the largest share of nonresidents was between 26 years and 35 years old (almost 24 percent).
• Festival attendees tend to be well educated—almost 80 percent are college graduates. Approximately 27 percent have attained a master’s degree and about 8 percent have a doctorate degree.
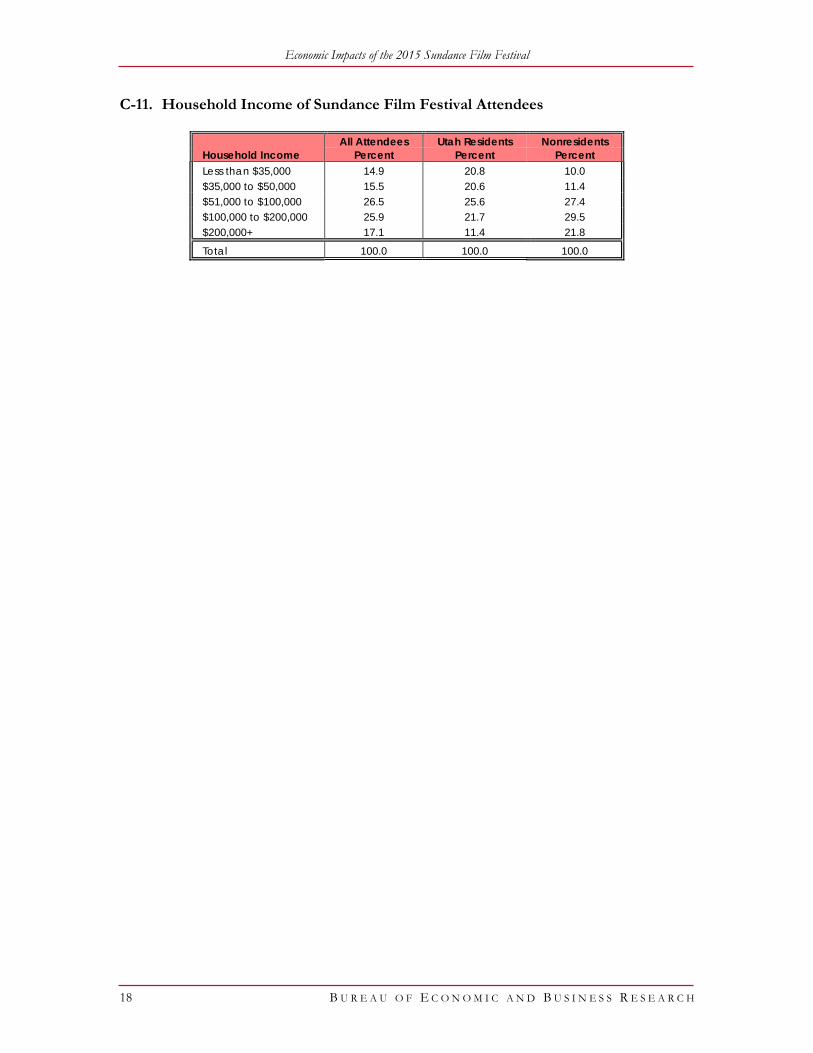
• About 43 percent of 2015 Festival attendees said their annual household income was
more than $100,000; a percentage slightly lower than the 50 percent reported in 2014. Nonresident attendees were more likely to report having high annual incomes—51 percent compared with 33 percent of Utah residents.
• Although the Festival is an entertainment-driven event, most people who attend the
Festival are not affiliated with the entertainment industry. Just 16 percent of those surveyed said they were entertainment professionals.
• Slightly more than half of those attending the Festival in 2015 were males (53 percent)
and 47 percent were female.

Economic Impacts of the 2015 Sundance Film Festival
7 B U R E A U O F E C O N O M I C A N D B U S I N E S S R E S E A R C H
FILM FESTIVAL ACTIVITIES • On average, attendees said they planned to spend about 6 days (5.64) participating in
Festival events and intended to see about 8 films. Almost 13 percent said they would participate in Festival events every day during the 10-day Festival period. Although the average number of screenings was 8, 13 percent of Utah residents and 19 percent of nonresidents said they planned to watch at least 15 films during the Festival.
• While film screenings are offered at theaters in four geographic locations—Park City,
Salt Lake City, Sundance Resort and Ogden—Park City is the hub of Festival events, with more screenings offered at Park City venues than all other areas combined. Additionally, sponsor events are also concentrated in the Park City area. Not surprisingly, most Festival attendees will spend some time in Park City during the course of the Festival. About 75 percent of those surveyed said they would view most of the films they intend to see in Park City. Nonresidents were most likely to select Park City venues over other options. For nonresidents, almost 89 percent indicated their film screenings would be concentrated in Park City.
• Seventy percent of attendees at the 2015 Festival have attended previously. The
average number of previous visits was about 7. Eleven percent said they had attended at least 15 festivals. Utah residents were most likely to have attended a previous festival. Nearly 86 percent of locals said they have attended the Festival at least once, compared to 58 percent of nonresidents.
• About 80 percent of 2015 Festival attendees said they would participate in the festival
again. This included 91 percent of Utah residents and 72 percent of nonresidents.
RECREATIONAL ACTIVITIES • Almost half of nonresidents surveyed said they intended to ski or snowboard during
their stay. This equates to about 15,239 people. The most popular resorts for skiing were Park City Mountain Resort and Deer Valley.
• About 15 percent of locals surveyed said they would include skiing or snowboarding as part of their Festival experience. The Park City Mountain Resort and resorts located in Salt Lake County were the ski areas of choice for Utah residents who intended to ski or snowboard.
• Of those who intended to ski or snowboard (both locals and nonresidents), 35 percent
said they would spend at least two full days at Deer Valley, almost 40 percent said they would ski at least two days at the Park City Mountain Resort, 21 percent said they would ski for two days at the Canyons Resort and 13 percent said they would ski at the Sundance Resort.

Economic Impacts of the 2015 Sundance Film Festival
8 B U R E A U O F E C O N O M I C A N D B U S I N E S S R E S E A R C H
LODGING AND TRANSPORTATION • On average, nonresidents planned to spend between 7 and 8 nights in Utah during their
visit, about the same as the number reported in 2014. Nearly 42 percent stayed commercially (hotel, motel or inn), 18 percent stayed in a condominium or timeshare, and 8 percent rented private homes. Almost one-quarter of those surveyed said they were staying with friends and family—a slightly higher rate than reported in 2014.
• Seventy-two percent of nonresidents surveyed said they were staying in the Deer Valley/
Park City area; this includes those staying commercially as well as those staying with friends and family.
• Of those staying commercially, 66 percent said they were staying in the Deer Valley/Park City Area and 26 percent said they were staying in Salt Lake County. For comparison, in 2014, 74 percent of those staying commercially said they were staying the Deer Valley/Park City area and just 20 percent said they were staying in facilities located in Salt Lake.
• Eighty-three percent of people visiting Utah for the Festival in 2015 traveled via air, a
significant increase over the 66 percent in 2014. Fourteen percent of nonresident visitors said they traveled by personal vehicle. The remaining 2.5 percent traveled via rental car or bus.

Economic Impacts of the 2015 Sundance Film Festival
9 B U R E A U O F E C O N O M I C A N D B U S I N E S S R E S E A R C H
A P P E N D I C ES
S U R V E Y OF P E R S ON S A TTE N D I N G TH E 201 5 S U N D A N C E F I LM F E S TI V A L
T A B L E O F C O N T E N T S
A. Attendance Information ........................................................................................................... 11
A-1. Estimated Attendance and Sample Size .......................................................................... 11 A-2. Primary Location Where Festival Attendees Will View Screenings ............................ 11 A-3. Primary Location Where Festival Attendees Will View Screenings,
2014 and 2015 Comparison .............................................................................................. 11 B. Spending and Economic Impacts of Spending ................................................................ 12
B-1. Estimated Weighted Average Daily Spending per Person, All Attendees ................. 12 B-2. Estimated Average Daily Spending per Person, Utah Resident and
Nonresident Comparison .................................................................................................. 12 B-3. Estimated Weighted Average Total Spending per Person ............................................ 12 B-4. Estimated Average Total Spending per Person, Utah Resident and
Nonresident Comparison .................................................................................................. 13 B-5. Estimated Weighted Average Total Spending per Person, 2014 and
2015 Comparison ............................................................................................................... 13 B-6. Estimated Total Average Spending per Person, Utah Resident and
Nonresident Comparison: 2014 and 2015 ...................................................................... 13 B-7. Estimated Total Spending, Utah Resident and Nonresident Comparison ................ 14 B-8. Estimated Economic Impacts of Nonresident Spending, 2014 and
2015 Comparison ............................................................................................................... 14 C. Demographic and Economic Characteristics of Sundance
Film Festival Attendees ........................................................................................................... 15 C-1. Utah Residency of Sundance Film Festival Attendees .................................................. 15 C-2. County of Residence, Utah Residents Only ................................................................... 15 C-3. U.S. Residency of Sundance Film Festival Attendees ................................................... 15 C-4. Residency of Nonlocal Sundance Film Festival Attendees .......................................... 15 C-5. Place of U.S. Residency of Sundance Film Festival Attendees (Nonlocals) .............. 16 C-6. List of Countries of Residence of Sundance Film Festival Attendees ........................ 16 C-7. Age of Sundance Film Festival Attendees ...................................................................... 17 C-8. Gender of Sundance Film Festival Attendees ................................................................ 17 C-9. Educational Attainment Level of Sundance Film Festival Attendees ........................ 17 C-10. Occupation of Sundance Film Festival Attendees ...................................................... 17 C-11. Household Income of Sundance Film Festival Attendees ......................................... 18
D. Festival Statistics ....................................................................................................................... 19 D-1. Number of Days Attending the Sundance Film Festival ........................................... 19 D-2. Summary Statistics, Number of Days Attending the Sundance Film Festival .......... 19 D-3. Number of Intended Screenings ...................................................................................... 19

Economic Impacts of the 2015 Sundance Film Festival
10 B U R E A U O F E C O N O M I C A N D B U S I N E S S R E S E A R C H
D-4. Summary Statistics, Number of Intended Screenings .................................................. 20 D-5. Location Where Most Screenings Will Be Viewed ....................................................... 20 D-6. All Locations Where Attendees Will View Screenings ................................................. 20 D-7. Percent of Nonresidents Visiting Utah Primarily to Attend the
Sundance Film Festival ..................................................................................................... 20 D-8. Percent of Nonresident Attendees Visiting Utah for the First Time ......................... 20 D-9. Prior Attendance at a Sundance Film Festival ............................................................... 21 D-10. Number of Times Previously Attended ....................................................................... 21 D-11. Summary Statistics, Number of Previous Visits .......................................................... 21 D-12. Percent of Attendees Who Plan to Attend the Sundance Film
Festival Next Year ........................................................................................................... 21 E. Recreational Activities of Sundance Film Festival Attendees ...................................... 22
E-1. Nonresident Attendees Who Intend to Visit Utah Within the Next 12 Months ..... 22 E-2. Summary Statistics, Number of Accompanying Visitors ............................................. 22 E-3. Attendees Who Plan to Ski or Snowboard While Attending the
Sundance Film Festival ..................................................................................................... 22 E-4. Resorts Where Nonresident Attendees Intend to Ski or Snowboard ......................... 22 E-5. Number of Days Skiing or Snowboarding, by Resort .................................................. 23
F. Lodging and Transportation Statistics ................................................................................ 24
F-1. Type of Lodging Used by Nonresident Attendees ........................................................ 24 F-2. Location of Lodging Used by Nonresident Attendees ................................................. 24 F-3. Number of Nights of Lodging of Nonresident Attendees ........................................... 24 F-4. Summary Statistics, Number of Nights of Lodging ....................................................... 25 F-5. Location of Commercial Lodging Used by Nonresident Attendees ........................... 25
F-6. Primary Form of Transportation to Utah to Attend the Festival .............................. 25 G. The Economic Impacts of Sundance Institute–Related Spending ............................ 26
G-1. 2015 Sundance Film Festival, Economic Impacts of Sundance Institute Spending .............................................................................................................. 26
G-2. 2015 Sundance Film Festival, Detailed Indirect and Induced Impacts of Sundance Institute Spending ........................................................................ 26
H. Economic Impacts: Measures and Definitions ............................................................ 27
Input-Output Models ....................................................................................................... 27 RIMS II ............................................................................................................................... 27 Estimating Fiscal Impacts ................................................................................................ 28 Definitions Used in This Report .................................................................................... 28

Economic Impacts of the 2015 Sundance Film Festival
11 B U R E A U O F E C O N O M I C A N D B U S I N E S S R E S E A R C H
A . A T T E N D A N C E I N F O R M A T I O N A-1. Estimated Attendance and Sample Size
Total Estimated Attendance 46,107 Surveys 810
Attendance at the 2015 Film Festival was estimated by BEBR based on ticket sales and redemption information provided by the Sundance Institute. It is a point estimate. Survey data were not used to produce this estimate.
A-2. Primary Location Where Festival Attendees Will View Screenings
Place Percent Park City 73.6 Salt Lake City 19.0 Sundance Resort 2.2 Ogden 3.0 Not certain 2.2
Total 100.0 Notes: (1) “Primary location” is where the respondent indicated he/she would attend most screenings. (2) Includes just those respondents who indicated they would attend a film.
A-3. Primary Location Where Festival Attendees Will View Screenings,
2014 and 2015 Comparison
Place 2014 2015
Number Percent Number Percent Park City 34,830 77.3 33,935 73.6 Salt Lake City 8,254 18.3 8,760 19.0 Sundance Resort 1,179 2.7 1,014 2.2 Ogden 816 1.8 1,3,83 3.0 Uncertain/Not attending 273 0.6 1,014 2.2
Total 45,352 100.0 46,107 100.0 Notes: “Uncertain/not attending” includes responses of individuals surveyed in Park City who indicated they would “probably not” attend a film, but would attend in Park City in the event they did attend a screening.

Economic Impacts of the 2015 Sundance Film Festival
12 B U R E A U O F E C O N O M I C A N D B U S I N E S S R E S E A R C H
B . S P E N D I N G A N D E C O N O M I C I M P A C T S O F S P E N D I N G B-1. Estimated Weighted Average Daily Spending per Person, All Attendees
Spending Category Weighted Average
Standard Error of the
Mean Lodging $83.35 $5.39 Meals $58.66 $2.42 Automobile Rental $12.30 $1.20 Other Transportation $7.01 $0.85 Recreation/Entertainment $22.58 $2.79 Other Retail Purchases $43.17 $5.33
Total $227.08 $4.90 The estimated average daily weighted spending per person is $227.08 ±$4.90, producing a spending range of $222.18 to $231.98.
B-2. Estimated Average Daily Spending per Person,
Utah Resident and Nonresident Comparison
Spending Category
Utah Residents Nonresidents Average
Daily Spending
Standard Error of the
Mean
Average Daily
Spending
Standard Error of the
Mean Lodging $6.43 $1.48 $121.23 $7.32 Meals $32.34 $1.69 $71.63 $2.78 Automobile Rental $0.33 $0.20 $18.20 $1.70 Other Transportation $1.56 $0.45 $9.69 $1.04 Recreation/Entertainment $4.89 $1.06 $31.30 $3.64 Other Retail Purchases $13.96 $1.12 $57.56 $7.41 Total $59.51 $4.99 $309.61 $4.85
The estimated average daily spending by Utah residents is $59.51 ±$4.99, producing a range of $54.52 to $64.50. The estimated average daily spending by nonresidents is $309.61 ±$4.85, producing a range of $304.76 to $314.46.
B-3. Estimated Weighted Average Total Spending per Person
Spending Category
Weighted Average
Total
Standard Error of the
Mean Lodging $620.58 $45.04 Meals $325.59 $15.55 Automobile Rental $70.19 $7.07 Other Transportation $38.11 $4.88 Recreation/Entertainment $95.79 $9.35 Other Retail Purchases $198.65 $14.04 Total $1,348.92 $100.92
The estimated average total weighted spending per person is $1,348.92 ± $100.92, producing a range of $1,248.00 to $1,449.84.

Economic Impacts of the 2015 Sundance Film Festival
13 B U R E A U O F E C O N O M I C A N D B U S I N E S S R E S E A R C H
B-4. Estimated Average Total Spending Per Person, Utah Resident and Nonresident Comparison
Spending Category
Utah Residents Nonresidents Average
Total Spending
Standard Error of the
Mean
Average Total
Spending
Standard Error of the
Mean Lodging $41.95 $9.75 $905.58 $62.42 Meals $181.67 $10.37 $396.48 $18.10 Automobile Rental $1.82 $1.20 $103.87 $9.96 Other Transportation $7.12 $2.07 $53.38 $6.26 Recreation/Entertainment $18.57 $3.61 $133.83 $12.18 Other Retail Purchases $80.09 $6.42 $257.04 $17.80 Total $331.22 $31.39 $1,850.18 $135.16
The estimated average total spending by Utah residents is $331.22 ±$31.39, producing a range of $299.83 to $362.61. The estimated average total spending by nonresidents is $1,850.18 ±$135.16, producing a range of $1,715.02 to $1,985.34.
B-5. Estimated Weighted Average Total Spending per Person,
2014 and 2015 Comparison
Spending Category 2014 Total
Average 2015 Total
Average Dollar
Change Lodging $740.31 $620.58 ($119.73) Meals $302.63 $325.59 $22.96 Automobile Rental $70.10 $70.19 $0.09 Other Transportation $36.48 $38.11 $1.63 Recreation $99.91 $95.79 ($4,12) Other Retail Purchases $159.58 $198.65 $39.07 Total $1,409.09 $1,348.92 ($60.17)
Note: Data for 2014 are from a previous report completed by BEBR for the Sundance Institute.
B-6. Estimated Total Average Spending per Person,
Utah Resident and Nonresident Comparison: 2014 and 2015
Spending Category Utah Residents Nonresidents 2014 2015 2014 2015
Lodging $38.62 $41.95 $1,049.46 $905.58 Meals $187.24 $181.67 $353.47 $396.48 Automobile Rental $2.44 $1.82 $99.91 $103.87 Other Transportation $12.67 $7.12 $46.97 $53.38 Recreation $16.13 $18.57 $136.94 $133.83 Other Purchases $76.03 $80.09 $196.39 $257.04
Total $333.13 $331.22 $1,883.14 $1,850.18 Note: Data for 2014 are from a previous report completed by BEBR for the Sundance Institute.

Economic Impacts of the 2015 Sundance Film Festival
14 B U R E A U O F E C O N O M I C A N D B U S I N E S S R E S E A R C H
B-7. Estimated Total Spending, Utah Resident and Nonresident Comparison
Spending Category Utah Residents Nonresidents Grand Total Lodging $638,282 $27,974,897 $28,613,179 Meals $2,764,165 $12,247,937 $15,012,103 Automobile Rental $27,692 $3,208,720 $3,236,412 Other Transportation $108,333 $1,648,998 $1,757,331 Sporting/Recreation $282,548 $4,134,235 $4,416,783 Other Retail Purchases $1,218,594 $7,940,400 $9,158,994 Total $5,039,615 $57,155,187 $62,194,802
B-8. Estimated Economic Impacts of Nonresident Spending,
2014 and 2015 Comparison
Impact Variable 2014 2015 Change Gross State Product $67,159,195 $63,236,663 ($3,922,532) Earnings $34,090,768 $32,221,375 ($1,869,393) Jobs 1,217 1,139 (78) State Tax Revenue $3,862,564 $3,955,309 $128,745 Local Tax Revenue $2,289,077 $2,074,056 ($215,021)
Note: Data for 2014 are from a previous report completed by BEBR for the Sundance Institute.

Economic Impacts of the 2015 Sundance Film Festival
15 B U R E A U O F E C O N O M I C A N D B U S I N E S S R E S E A R C H
C . D E M O G R A P H I C A N D E C O N O M I C C H A R A C T E R I S T I C S O F S U N D A N C E F I L M F E S T I V A L A T T E N D E E S
C-1. Utah Residency of Sundance Film Festival Attendees
Resident of Utah Percent Number Yes 33.0 15,215 No 67.0 30,892
Total 100.0 46,107 The ratio of local and nonlocal attendees was estimated by BEBR based on information provided by the Sundance Institute. This is a point estimate. Survey data were not used to produce these estimates
C-2. County of Residence, Utah Residents Only
County Percent Number Salt Lake 44.2 6,725 Summit 22.4 3,404 Utah 9.7 1,471 Weber 9.4 1,429 Wasatch 2.8 420 All Other 11.6 1,765
Total 100.0 15,215
C-3. U.S. Residency of Sundance Film Festival Attendees
U.S. Resident Percent Number Yes 91.9 42,372 No 8.1 3,735
Total 100.0 46,107
C-4. Residency of Nonlocal Sundance Film Festival Attendees
Residence Number U.S. Nonlocal 27,157 International 3,735
Total 30,892

Economic Impacts of the 2015 Sundance Film Festival
16 B U R E A U O F E C O N O M I C A N D B U S I N E S S R E S E A R C H
C-5. Place of U.S. Residency of Sundance Film Festival Attendees (Nonlocals)
State or Country Percent State or Country Percent California 25.0 Washington D.C. 1.0 New York 8.4 Iowa 1.0 Colorado 6.9 Massachusetts 1.0 Texas 4.2 Montana 1.0 Washington 4.2 Rhode Island 1.0 Florida 3.9 Wisconsin 1.0 Arizona 3.4 Wyoming 1.0 Illinois 3.1 Hawaii 0.8 Georgia 2.4 Kansas 0.8 Idaho 2.4 Minnesota 0.8 New Jersey 2.4 North Carolina 0.8 Pennsylvania 2.4 Nebraska 0.5 Nevada 2.1 Ohio 0.5 New Mexico 2.1 Oklahoma 0.5 Maryland 1.8 South Dakota 0.5 Oregon 1.8 Tennessee 0.5 Connecticut 1.6 Alabama 0.3 Louisiana 1.3 Indiana 0.3 Michigan 1.3 Kentucky 0.3 New Hampshire 1.3 Mississippi 0.3 Virginia 1.3 Missouri 0.3 Alaska 1.0 South Carolina 0.3 Arkansas 1.0 Vermont 0.3
Total 100.0
C-6. List of Countries of Residence of Sundance Film Festival Attendees (Shown in order of response frequency)
Country Response
Frequency Country Response
Frequency United States 744 Denmark 1 Canada 17 Dubai 1 Brazil 6 England 1 Germany 4 Guam 1 Australia 3 Guatemala 1 U.K. 3 Honduras 1 Argentina 2 Ireland 1 Chile 2 Jamaica 1 China 2 Mexico 1 France 2 Norway 1 India 2 Panama 1 Italy 2 Peru 1 Japan 2 Puerto Rico 1 South Africa 2 Spain 1 Columbia 1 Sweden 1 Costa Rico 1 Total 810
Economic Impacts of the 2015 Sundance Film Festival
17 B U R E A U O F E C O N O M I C A N D B U S I N E S S R E S E A R C H
C-7. Age of Sundance Film Festival Attendees
Age Group All Attendees Utah Residents Nonresidents
Percent Percent Percent 19 through 25 13.9 14.1 13.6 26 through 35 22.6 21.3 23.7 36 through 45 21.8 23.0 20.8 46 through 55 20.0 16.9 22.6 Over 55 21.7 24.7 19.2
Total 100.0 100.0 100.0
C-8. Gender of Sundance Film Festival Attendees
Gender All Attendees Utah Residents Nonresidents
Percent Percent Percent Male 53.2 48.6 56.9 Female 46.8 51.4 43.1
Total 100.0 100.0 100.0
C-9. Educational Attainment Level of Sundance Film Festival Attendees
Maximum Level of Attainment
All Attendees Utah Residents Nonresidents Percent Percent Percent
Less than High School 0.5 1.1 – High School Graduate 20.6 27.3 15.2 Bachelor’s Degree 44.1 39.2 48.1 Master’s Degree 26.8 24.9 28.4 Doctorate 7.9 7.5 8.3
Total 100.0 100.0 100.0 Note: Category of “High School Graduate “ includes individuals still in high school.
C-10. Occupation of Sundance Film Festival Attendees
Occupation All Attendees Utah Residents Nonresidents
Percent Percent Percent Entertainment Professional 16.0 5.0 24.9 Non-Entertainment Professional 48.0 47.2 48.7 Press 1.9 1.7 2.0 Student 9.5 12.4 7.2 Other 24.6 33.7 17.3
Total 100.0 100.0 100.0
Economic Impacts of the 2015 Sundance Film Festival
18 B U R E A U O F E C O N O M I C A N D B U S I N E S S R E S E A R C H
C-11. Household Income of Sundance Film Festival Attendees
Household Income All Attendees Utah Residents Nonresidents
Percent Percent Percent Less than $35,000 14.9 20.8 10.0 $35,000 to $50,000 15.5 20.6 11.4 $51,000 to $100,000 26.5 25.6 27.4 $100,000 to $200,000 25.9 21.7 29.5 $200,000+ 17.1 11.4 21.8
Total 100.0 100.0 100.0

Economic Impacts of the 2015 Sundance Film Festival
19 B U R E A U O F E C O N O M I C A N D B U S I N E S S R E S E A R C H
D . F E S T I V A L S T A T I S T I C S
D-1. Number of Days Attending the Sundance Film Festival
Days of Attendance
All Attendees Utah Residents Nonresidents Percent Percent Percent
1 7.5 10.8 4.9 2 7.0 9.1 5.4 3 10.0 9.4 10.5 4 13.1 12.4 13.6 5 14.6 11.6 17.0 6 11.7 9.9 13.2 7 9.9 7.2 12.1 8 7.2 6.4 7.8 9 6.2 5.5 6.7
10+ 12.8 17.7 8.7
Total 100.0 100.0 100.0
D-2. Summary Statistics, Number of Days Attending the Sundance Film Festival
Statistic All
Attendees Utah
Residents Nonresidents Mean 5.64 5.62 5.65 Standard Error .10 .16 .12 Median 5.00 5.00 5.00 Standard Deviation 2.83 3.16 2.53 Variance 8.02 10.15 6.43
D-3. Number of Intended Screenings
Number of Screenings
All Attendees Utah Residents Nonresidents Percent Percent Percent
0 4.7 5.2 4.2 1 5.3 7.5 3.6 2 7.2 9.7 5.1 3 8.0 8.3 7.8 4 6.3 5.2 7.1 5 7.5 9.1 6.3 6 7.5 7.5 7.6 7 5.1 4.7 5.4 8 6.4 6.4 6.5 9 4.6 3.9 5.1 10 10.4 8.3 12.1 11 2.0 2.5 1.6 12 4.4 3.9 4.9 13 1.5 1.9 1.1 14 2.6 2.2 2.9
15+ 16.5 13.8 18.7
Total 100.0 100.0 100.0

Economic Impacts of the 2015 Sundance Film Festival
20 B U R E A U O F E C O N O M I C A N D B U S I N E S S R E S E A R C H
D-4 Summary Statistics, Number of Intended Screenings
Statistic All
Attendees Utah
Residents Nonresidents Mean 8.37 7.69 8.92 Standard Error .22 .34 .30 Median 7.00 6.00 8.00 Standard Deviation 6.47 6.58 6.34 Variance 41.94 43.37 40.20
D-5. Location Where Most Screenings Will Be Viewed
Place All Attendees Utah Residents Nonresidents
Percent Percent Percent Park City 75.3 59.5 87.8 Salt Lake City 19.4 32.8 8.8 Ogden 2.3 6.0 0.7 Sundance 3.0 1.7 2.7
Total 100.0 100.0 100.0 Note: Includes only respondents who intended to view a film.
D-6. All Locations Where Attendees Will View Screenings
Place All Attendees Utah Residents Nonresidents Yes No Yes No Yes No
Park City 85.7 14.3 74.9 25.1 94.4 5.6 Salt Lake City 43.2 56.8 57.7 42.3 31.5 68.5 Sundance 15.1 84.9 14.9 85.1 15.2 84.8 Ogden 8.8 91.2 15.7 84.3 3.1 96.9
Note: Includes only respondents who intended to view screenings.
D-7. Percent of Nonresidents Visiting Utah Primarily to Attend the
Sundance Film Festival
Response Percent Yes 88.1 No 11.9
Total 100.0
D-8. Percent of Nonresident Attendees Visiting Utah for the First Time
Response Percent Yes 27.5 No 72.5
Total 100.0

Economic Impacts of the 2015 Sundance Film Festival
21 B U R E A U O F E C O N O M I C A N D B U S I N E S S R E S E A R C H
D-9. Prior Attendance at a Sundance Film Festival
Prior Attendance All Attendees Utah Residents Nonresidents
Percent Percent Percent Yes 70.1 85.9 57.4 No 29.9 14.1 42.6
Total 100.0 100.0 100.0
D-10. Number of Times Previously Attended
Years of Prior Attendance
All Attendees Utah Residents Nonresidents Percent Percent Percent
0 1.1 1.0 1.2 1 10.9 7.7 14.8 2 9.9 9.6 10.2 3 12.0 10.6 13.7 4 7.8 7.1 8.6 5 11.5 9.6 13.7 6 6.2 5.5 7.0 7 6.2 6.4 5.9 8 5.5 4.8 6.3 9 3.7 4.8 2.3 10 6.2 7.7 4.3 11 1.8 1.6 2.0 12 4.1 5.5 2.3 13 1.8 1.9 1.6 14 1.1 1.3 0.8
15+ 10.6 14.8 5.5
Total 100.0 100.0 100.0
D-11. Summary Statistics, Number of Previous Visits
Statistic All
Attendees Utah
Residents Nonresidents Mean 6.8 7.8 5.6 Standard Error .22 .33 .28 Median 5.0 6.0 5.0 Standard Deviation 5.5 5.9 4.5
D-12. Percent of Attendees Who Plan to Attend the Sundance Film Festival Next
Year
Response All Attendees Utah Residents Nonresidents
Percent Percent Percent Yes 80.5 90.6 72.3 No 3.7 2.5 4.7 Uncertain 15.8 6.9 23.0
Total 100.0 100.0 100.0

Economic Impacts of the 2015 Sundance Film Festival
22 B U R E A U O F E C O N O M I C A N D B U S I N E S S R E S E A R C H
E . R E C R E A T I O N A L A C T I V I T I E S O F S U N D A N C E F I L M F E S T I V A L A T T E N D E E S
E-1. Nonresident Attendees Who Intend to Visit Utah Within the Next 12 Months
Response Percent Number Yes 49.3 15,239 No 26.6 8,206 Uncertain 24.1 7,447
Total 100.0 30,892
E-2. Summary Statistics, Number in Party
Statistic Accompanying
Visitors Mean 3.7 Standard Error .16 Median 3.0 Standard Deviation 2.3
E-3. Attendees Who Plan to Ski or Snowboard While Attending the
Sundance Film Festival
Nonresidents Residents Response Percent Number Percent Number Yes 34.4 10,627 14.7 2,237 No/Uncertain 65.6 20,265 85.3 12,978 Total 100.0 30,892 100.0 15,215
E-4. Resorts Where Nonresident Attendees Intend to Ski or Snowboard
Resort Percent
Average Number of Days
Deer Valley 35.1 2.0 Park City Mountain Resort 39.6 2.5 The Canyons 21.4 2.5 Sundance Resort 13.0 2.5 Other Utah Resorts 28.6 1.5

Economic Impacts of the 2015 Sundance Film Festival
23 B U R E A U O F E C O N O M I C A N D B U S I N E S S R E S E A R C H
E-5. Number of Days Skiing or Snowboarding, by Resort
Number of
Days Skiing/ Snowboarding
Deer Valley (Percent)
Park City (Percent)
The Canyons (Percent)
Sundance Resort
(Percent)
Other Resorts
(Percent) 1 46.3 50.8 51.5 60.0 59.1 2 29.6 34.4 30.3 10.0 31.8 3 5.6 4.9 3.0 -- 4.5 4 11.1 3.3 9.1 5.0 4.5 5 3.7 1.6 3.0 5.0 --
6+ 3.7 4.8 3.0 20.0 -- Note: Data for each resort include only those respondents intending to ski or snowboard at that resort.

Economic Impacts of the 2015 Sundance Film Festival
24 B U R E A U O F E C O N O M I C A N D B U S I N E S S R E S E A R C H
F . L O D G I N G A N D T R A N S P O R T A T I O N S T A T I S T I C S F-1. Type of Lodging Used by Nonresident Attendees
Lodging Type Percent Hotel/Motel 41.8 Condo Rental 18.1 Timeshare 3.8 Private Home Rental 8.3 Friends/Family 23.7 Other 4.3
Total 100.0
F-2. Location of Lodging Used by Nonresident Attendees (All lodging types)
Location Percent Deer Valley/Park City Area 72.3 Salt Lake County 21.0 Sundance Resort 4.3 Ogden Area 0.7 Other 1.8
Total 100.0
F-3. Number of Nights of Lodging of Nonresident Attendees (All lodging types)
Number of Nights Percent
2 0.7 3 1.6 4 7.6 5 12.5 6 15.2 7 14.7 8 14.5 9 8.9
10+ 24.3
Total 100.0

Economic Impacts of the 2015 Sundance Film Festival
25 B U R E A U O F E C O N O M I C A N D B U S I N E S S R E S E A R C H
F-4. Summary Statistics, Number of Nights of Lodging of Nonresident Attendees (All lodging types)
Statistic Value Mean 7.50 Standard Error .11 Median 7.00 Standard Deviation 2.32
F-5. Location of Commercial Lodging Used by Nonresident Attendees: 2014 and 2015 (Hotels, motels and bed and breakfast facilities)
Location 2014
Percent 2015
Percent Deer Valley/Park City Area 75.3 66.1 Salt Lake County 20.2 26.3 All Other 4.5 7.6
Total 100.0 100.0
F-6. Primary Form of Transportation to Utah to Attend the Festival
(Nonresidents)
Mode of Transportation Percent Number Airplane 83.4 25,778 Private Vehicle 13.9 4,285 Rental Vehicle 1.1 346 Bus/Other 1.5 484
Total 100.0 30,892

Economic Impacts of the 2015 Sundance Film Festival
26 B U R E A U O F E C O N O M I C A N D B U S I N E S S R E S E A R C H
G . T H E E C O N O M I C I M P A C T S O F S U N D A N C E I N S T I T U T E – R E L A T E D S P E N D I N G
The economic impacts presented here are based on the operational expenditures made by the Sundance Institute (the Institute) in Utah to produce and support the 2015 Sundance Film Festival. In developing these impacts, only the amount of money spent by the Institute in Utah has been included. The amount does not include spending by sponsors, which may be significant but was not available for this analysis. Preparing for the Festival is a year-long effort for the Sundance Institute. The cost to produce the 2015 Film Festival was $17.6 million, of which $10.7 million was spent locally. The economic impacts generated by this local spending are shown below. Detailed spending and impact calculations are presented in Table G-2. G-1. 2015 Sundance Film Festival
Economic Impacts of Sundance Institute Spending
Impact Type Direct Impacts Indirect and
Induced Impacts Total Economic
Impacts Gross State Product $9,352,995 $10,836,176 $20,189,171 Earnings $2,862,607 $5,566,067 $8,426,674 Jobs 60 151 211
Note: The direct jobs impact of 60 is a full-time-equivalent employment estimate provided by the Sundance Institute. The indirect and induced job impact of 151 includes both full-time, part-time and proprietors’ employment.
G-2. 2015 Sundance Film Festival
Detailed Indirect and Induced Impacts of Sundance Institute Spending
Industry Sector Adjusted Utah
Spending1 Earnings
Coefficient Earnings Impact
Jobs Coefficient
Jobs Impact
Gross State Product
Coefficient
Gross State Product Impact
Construction $2,557 .7935 $2,029 18.86 0.06 1.2758 $3,269 Printing Services $184,905 .6196 $114,567 16.21 3.00 1.0536 $194,816 Retail Trade $36,159 .6428 $23,243 20.60 0.75 1.2694 $45,900 Air Transportation $113,424 .4481 $50,825 10.19 1.16 0.9679 $109,783 Ground Transportation $297,504 .7898 $234,969 20.28 6.03 1.3203 $392,795 Insurance $60,548 .6082 $36,826 14.95 0.91 1.2591 $76,236 Property/Equipment Rental $1,613,598 .5252 $847,462 11.11 17.92 1.2709 $2,050,722 Advertising/Public Relations $665,662 .8284 $551,434 19.35 12.88 1.3934 $927,533 Business Services $586,522 .8284 $485,875 19.35 11.35 1.3934 $817,259 Professional/Technical Srvcs. $1,067,917 .8284 $884,662 19.35 20.66 1.3934 $1,488,035 Accommodations/Lodging $1,733,670 .5946 $1,030,840 19.34 33.53 1.2012 $2,082,484 Food and Beverage $473,194 .6333 $299,674 27.27 12.91 1.1887 $562,486 Wages and Salaries $2,517,334 .3987 $1,003,661 12.03 30.28 0.8282 $2,084,856 Totals $9,352,995 $5,343,380 151.41 $10,836,176
1 Spending has been adjusted to account for trade margins and the source of revenue used to fund the Institute’s efforts.

Economic Impacts of the 2015 Sundance Film Festival
27 B U R E A U O F E C O N O M I C A N D B U S I N E S S R E S E A R C H
H. ECONOMIC IMPACTS: MEASURES AND DEFINITIONS Economic impacts are the changes in the size and structure of a region’s economy that occur when goods and services are purchased from vendors within the region with money generated outside the region. In the strictest interpretation, economic impacts occur only when “new” money enters the regional economy and is then spent locally. Such an inflow has the potential to expand the size and strength of the region’s economy. Money spent outside the region is considered “leakage” and does not generate economic growth within the region. Likewise, purchases of goods and services by local residents from local vendors do not increase the economic base of the region; they simply reshuffle the existing resources. Input-Output Models Various models have been built to evaluate the economic impacts that occur with changes in regional exports. The key inputs to these models are the direct impacts, which are the spending injections into the community when goods produced locally are sold outside the region. One of the most commonly used models for regional impact analysis is the single-region input-output (I-O) model. I-O models capture business-to-business purchases within a region. When an export base industry purchases raw materials, equipment or other inputs from local producers, the size of the region’s export base increases; these are known as the indirect effects. These inter-industry linkages are captured in an I-O model. I-O models also capture induced spending generated when households supported by the direct and indirect activities purchase goods and services within the region. I-O models simultaneously describe the demand and supply relationships between industries by showing the final demand for goods and services and the inter-industry transactions required to satisfy that demand. Using the construction industry as an example, an I-O model would identify all industries that provide goods and services to the construction industry. The I-O model also shows the value of goods and services provided by each industry directly to the construction industry, as well as all industries that are indirect suppliers to the initial supplying industries. These interactions continue until the value of supplies from all producing sectors that provide goods and services to the direct suppliers of the construction industry have been accounted for. This is called the “multiplier” effect. RIMS II RIMS II is the updated version of the Regional Input-Output Modeling System developed by the U.S. Department of Commerce, Bureau of Economic Analysis (BEA) in 1970. RIMS II is based on an accounting framework called an input-output table, which shows the input and output structure of approximately 500 industries in the U.S. The BEA’s regional economic accounts are used to adjust the national I-O table to show a region’s industrial structure and trading patterns.4 RIMS II multipliers can be estimated for any region in the U.S. that is composed of one or more counties, and for any industry or group of industries in the national I-O table. 4 “Regional Input-Output Modeling System,” U.S. Department of Commerce, Bureau of Economic Analysis; available at www.bea.gov/regional/rims.

Economic Impacts of the 2015 Sundance Film Festival
28 B U R E A U O F E C O N O M I C A N D B U S I N E S S R E S E A R C H
The impact effects produced using RIMS II are the net changes in value added, earnings and employment that occur when new dollars flow into a region and are then spent locally. The impacts represent the increase in the existing economic base of the region under study. Estimating Fiscal Impacts The fiscal impacts provided in this analysis were derived in two ways. The fiscal impact of visitors’ spending was estimated by applying the appropriate sales and use tax, and other tax rates (such as transient room tax, restaurant tax and other leasing taxes) to total spending. State taxes also include an estimate of the personal income tax generated from earnings. The state income tax effects were estimated by applying an “average tax” rate of 3.93 percent to the earnings estimate. This rate was estimated using 2013 earnings data from the U.S. Department of Commerce, Bureau of Economic Analysis and income tax collections for the state of Utah as reported in State Government Finances: 2013 published by the U.S. Census Bureau. This is the most recent data available. The fiscal impacts of spending by the Sundance Institute were estimated by quantifying the relationship between 2013 earnings in the state of Utah and selected state tax collections in 2013, expressed as a ratio representing the effective state and local tax rates. The ratio used to estimate the effects on state tax revenues was 8.72. This ratio was developed using earnings information from the U.S. Department of Commerce, Bureau of Economic Analysis and tax collection data from the U.S. Census Bureau, State Government Finances: 2013 (the most current year for which data are available). The fiscal effects on local units of government were derived in a similar manner using 2012 data from the U.S. Census Bureau Local Government Finances: 2012—the most recent year for which data were available. The ratio used to estimate the effects on local tax revenues was 1.5. The fiscal impact estimates of the Sundance Institute spending are conservative. Using an effective tax rate methodology to calculate fiscal impacts assumes that state and local taxes are directly related to earnings. While this assumption holds with respect to state income tax, and to a lesser degree, sales tax, the relationship between earnings and other taxes, such as property tax, is less obvious; e.g., an increase in earnings may not affect property tax revenue or other tax revenue. Thus property tax was not used in estimating the effective state and local tax ratios. Definitions Used in This Report Conceptually, economic impacts fall into three categories: direct, indirect and induced. The type of impacts generated includes value added, earnings and jobs. These terms are defined below:
Direct Effects: The effects of purchases of goods and services from local suppliers, and wage and salary payments made to employees.
Indirect Effects: The effects of additional business sales, jobs and income generated by direct purchases of goods and services from local suppliers. The purchases of these suppliers create subsequent rounds of spending, which when added to the initial suppliers’ purchases represent the total indirect effects.
Induced Effects: The effect of increased consumer and household spending that result from direct and indirect wages and salaries.

Economic Impacts of the 2015 Sundance Film Festival
29 B U R E A U O F E C O N O M I C A N D B U S I N E S S R E S E A R C H
Gross State Product/Value Added: The additional value of a commodity over the cost of the commodities used to produce it from the previous stage of production. Value added is conceptually equivalent to Gross State Product (GSP).
Earnings: Earnings are the sum of three components of personal income: wage and salary disbursements, supplements to wages and salaries, and proprietor’s income.
Jobs: Jobs generated using RIMS II include both full-time and part-time workers (counted equally) as well as the self-employed.