Embed Size (px)
Citation preview
THE ECONOMIC IMPACTS OF VISITOR AND SUNDANCE INSTITUTE SPENDING
2014 SUNDANCE FILM FESTIVAL
JANUARY 16, 2014 TO JANUARY 26, 2014
PREPARED BY
JAN ELISE STAMBRO BUREAU OF ECONOMIC AND BUSINESS RESEARCH
UNIVERSITY OF UTAH
April 2014

Economic Impacts of the 2014 Sundance Film Festival
1 B U R E A U O F E C O N O M I C A N D B U S I N E S S R E S E A R C H
T H E E C O N O M I C I M P A C T S O F T H E 20 1 4 S U N D A N C E F I L M F E S T I V A L
The Bureau of Economic and Business Research (BEBR) at the University of Utah has estimated the economic impacts of visitor spending during the 2014 Sundance Film Festival (the Festival) and expenditures made by the Sundance Institute (the Institute) in support of the 2014 Festival. The Festival was held in the state of Utah from January 16, 2014 through January 26, 2014. Visitor impact estimates were based on random intercept surveys of Festival attendees that were conducted by BEBR survey staff during the Festival. Institute impact estimates were based on information provided by the Institute and include all expenditures made by the organization to support and produce the Festival. These expenditures were made between March 1, 2013 and February 28, 2014. The Sundance Film Festival is held in four geographic locations in Utah—Park City, Salt Lake City, the Sundance Resort in Utah County, and Ogden—in 18 theater venues. For films shown in Salt Lake City, the Sundance Resort and Odgen, BEBR surveyed solely at the theater venue. In Park City, BEBR surveyed at each theater venue and conducted intercept surveys on Main Street, at the Old Town Transit Center and at the temporary Sundance headquarters. Over the course of the Festival, a total of 1,022 surveys were completed. The number of surveys to be conducted in a particular geographic area was based on the relationship between the number of tickets sold at theater venues in that location in the previous year and total ticket sales that year. Typically, ticket sales for theater venues in Park City account for more than 70 percent of all film screenings; hence, approximately 74 percent of the surveys conducted during the 2014 Film Festival were at venues in the Park City area. With the exception of the estimated attendance, information presented in the impact analysis of the Festival and characteristics of Festival attendees is survey-based. Total Festival attendance, and the ratio of local to nonlocal participation in Festival events, was estimated by BEBR using ticket sales and ticket redemptions information provided by the Institute. Based on that data, BEBR estimated total attendance at the 2014 Film Festival to be 45,352. The survey results and impact estimates are summarized in the Major Findings section that follows. Supporting information and data tables are provided in Appendices A through F. Expenditures made by the Sundance Institute to produce the Festival are detailed in Appendix G. The economic impacts of the 2014 Sundance Film Festival have been estimated using a regional impact model known as RIMS II, developed by the U.S. Department of Commerce, Bureau of Economic Analysis. A discussion of RIMS II is also provided in Appendix G.
Economic Impacts of the 2014 Sundance Film Festival
2 B U R E A U O F E C O N O M I C A N D B U S I N E S S R E S E A R C H
M A J O R F I N D I N G S ATTENDANCE AND SPENDING
An estimated 45,352 people attended the Sundance Film Festival in 2014, a number slightly lower than the 2013 estimate of 45,947. Over the past five years, Festival attendance has averaged about 45,000, ranging from a high of 46,731 in 2012 to a low of 41,221 in 2010.
Of the estimated 45,352 Festival attendees, 31 percent (13,870) were residents of Utah and 69 percent (31,482) visited from outside Utah. The ratio of local to nonlocal participation in the Festival has remained relatively constant over the past five years.
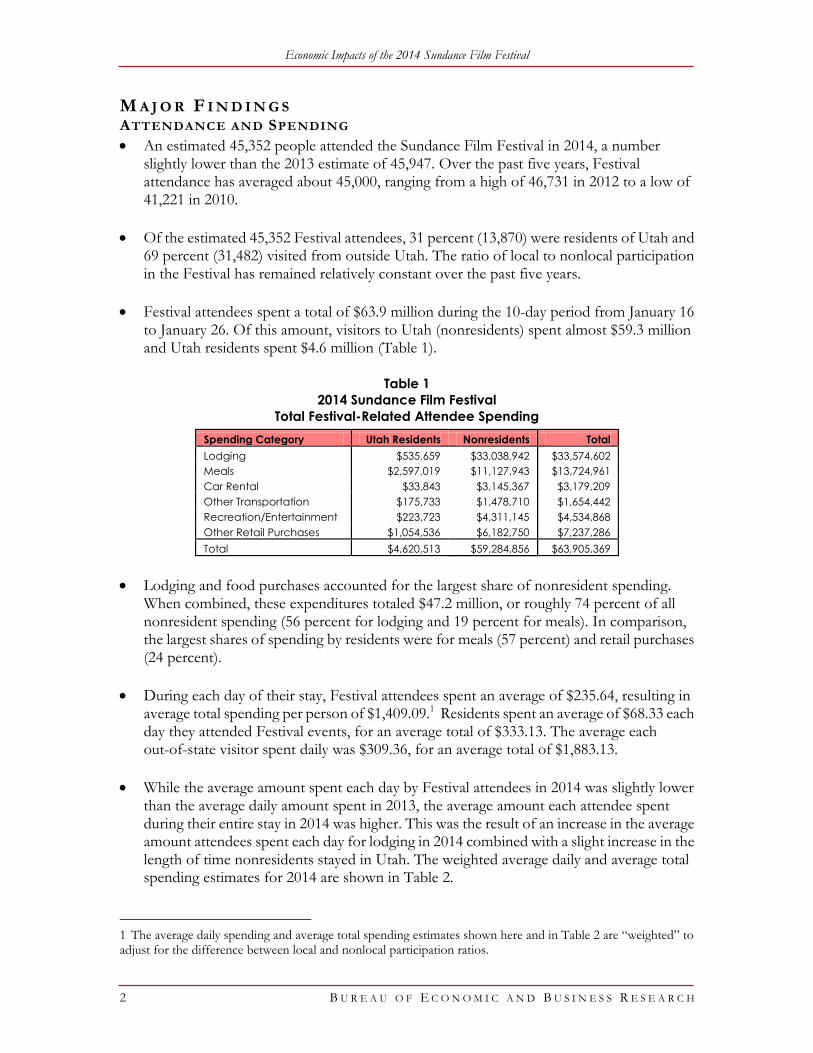
Festival attendees spent a total of $63.9 million during the 10-day period from January 16 to January 26. Of this amount, visitors to Utah (nonresidents) spent almost $59.3 million and Utah residents spent $4.6 million (Table 1).
Table 1
2014 Sundance Film Festival
Total Festival-Related Attendee Spending
Spending Category Utah Residents Nonresidents Total
Lodging $535,659 $33,038,942 $33,574,602
Meals $2,597,019 $11,127,943 $13,724,961
Car Rental $33,843 $3,145,367 $3,179,209
Other Transportation $175,733 $1,478,710 $1,654,442
Recreation/Entertainment $223,723 $4,311,145 $4,534,868
Other Retail Purchases $1,054,536 $6,182,750 $7,237,286
Total $4,620,513 $59,284,856 $63,905,369
Lodging and food purchases accounted for the largest share of nonresident spending. When combined, these expenditures totaled $47.2 million, or roughly 74 percent of all nonresident spending (56 percent for lodging and 19 percent for meals). In comparison, the largest shares of spending by residents were for meals (57 percent) and retail purchases (24 percent).
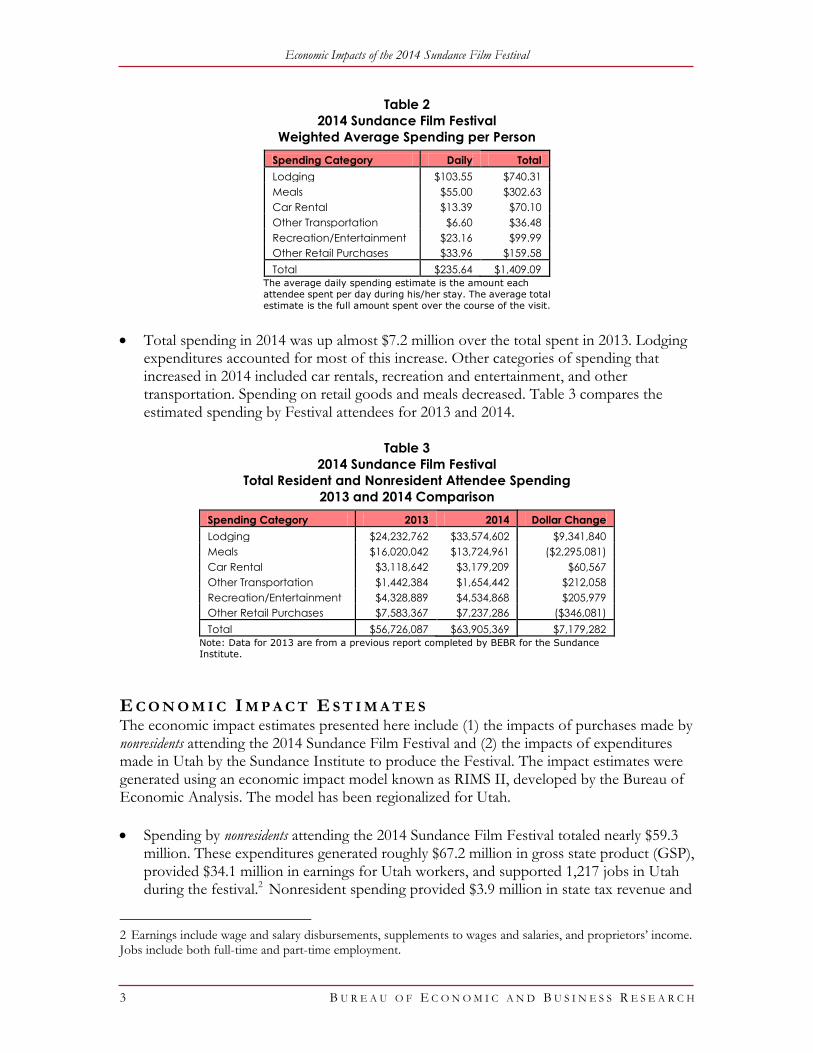
During each day of their stay, Festival attendees spent an average of $235.64, resulting in average total spending per person of $1,409.09.1 Residents spent an average of $68.33 each day they attended Festival events, for an average total of $333.13. The average each out-of-state visitor spent daily was $309.36, for an average total of $1,883.13.
While the average amount spent each day by Festival attendees in 2014 was slightly lower than the average daily amount spent in 2013, the average amount each attendee spent during their entire stay in 2014 was higher. This was the result of an increase in the average amount attendees spent each day for lodging in 2014 combined with a slight increase in the length of time nonresidents stayed in Utah. The weighted average daily and average total spending estimates for 2014 are shown in Table 2.
1 The average daily spending and average total spending estimates shown here and in Table 2 are “weighted” to adjust for the difference between local and nonlocal participation ratios.
Economic Impacts of the 2014 Sundance Film Festival
3 B U R E A U O F E C O N O M I C A N D B U S I N E S S R E S E A R C H
Table 2
2014 Sundance Film Festival
Weighted Average Spending per Person
Spending Category Daily Total
Lodging $103.55 $740.31
Meals $55.00 $302.63
Car Rental $13.39 $70.10
Other Transportation $6.60 $36.48
Recreation/Entertainment $23.16 $99.99
Other Retail Purchases $33.96 $159.58
Total $235.64 $1,409.09
The average daily spending estimate is the amount each
attendee spent per day during his/her stay. The average total
estimate is the full amount spent over the course of the visit.
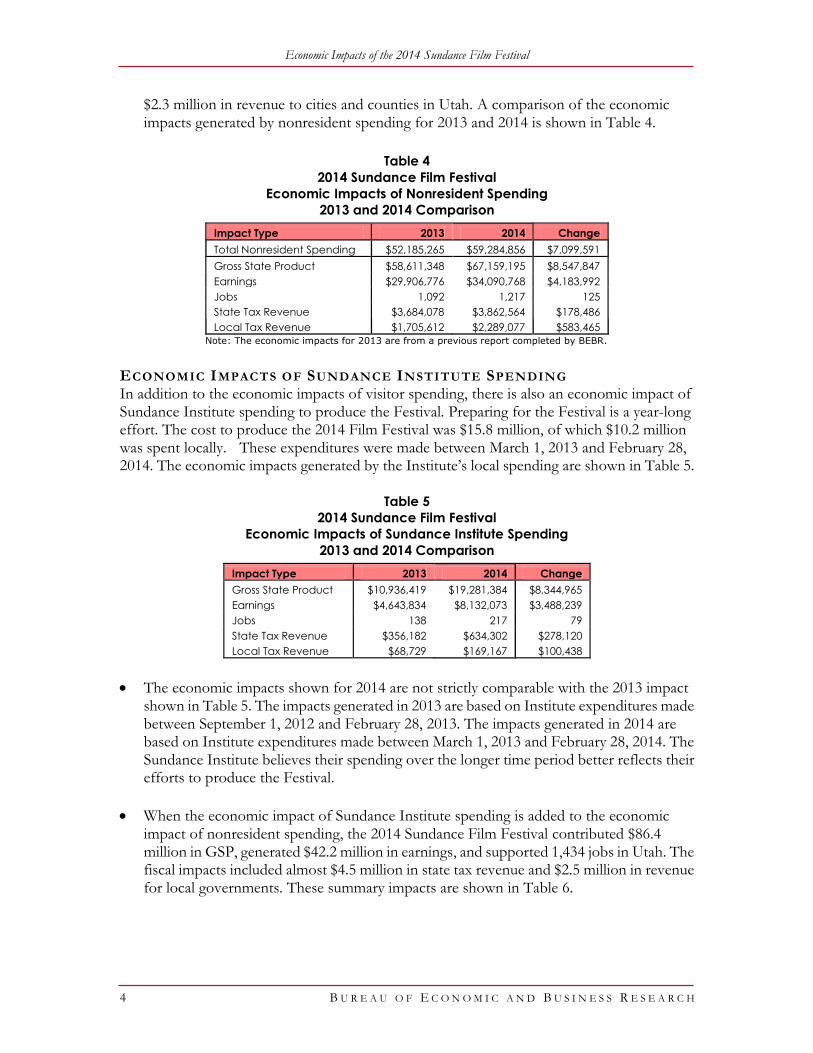
Total spending in 2014 was up almost $7.2 million over the total spent in 2013. Lodging expenditures accounted for most of this increase. Other categories of spending that increased in 2014 included car rentals, recreation and entertainment, and other transportation. Spending on retail goods and meals decreased. Table 3 compares the estimated spending by Festival attendees for 2013 and 2014.
Table 3
2014 Sundance Film Festival
Total Resident and Nonresident Attendee Spending
2013 and 2014 Comparison
Spending Category 2013 2014 Dollar Change
Lodging $24,232,762 $33,574,602 $9,341,840
Meals $16,020,042 $13,724,961 ($2,295,081)
Car Rental $3,118,642 $3,179,209 $60,567
Other Transportation $1,442,384 $1,654,442 $212,058
Recreation/Entertainment $4,328,889 $4,534,868 $205,979
Other Retail Purchases $7,583,367 $7,237,286 ($346,081)
Total $56,726,087 $63,905,369 $7,179,282
Note: Data for 2013 are from a previous report completed by BEBR for the Sundance
Institute.
E C O N O M I C I M P A C T E S T I M A T E S The economic impact estimates presented here include (1) the impacts of purchases made by nonresidents attending the 2014 Sundance Film Festival and (2) the impacts of expenditures made in Utah by the Sundance Institute to produce the Festival. The impact estimates were generated using an economic impact model known as RIMS II, developed by the Bureau of Economic Analysis. The model has been regionalized for Utah.
Spending by nonresidents attending the 2014 Sundance Film Festival totaled nearly $59.3 million. These expenditures generated roughly $67.2 million in gross state product (GSP), provided $34.1 million in earnings for Utah workers, and supported 1,217 jobs in Utah during the festival.2 Nonresident spending provided $3.9 million in state tax revenue and
2 Earnings include wage and salary disbursements, supplements to wages and salaries, and proprietors’ income. Jobs include both full-time and part-time employment.
Economic Impacts of the 2014 Sundance Film Festival
4 B U R E A U O F E C O N O M I C A N D B U S I N E S S R E S E A R C H
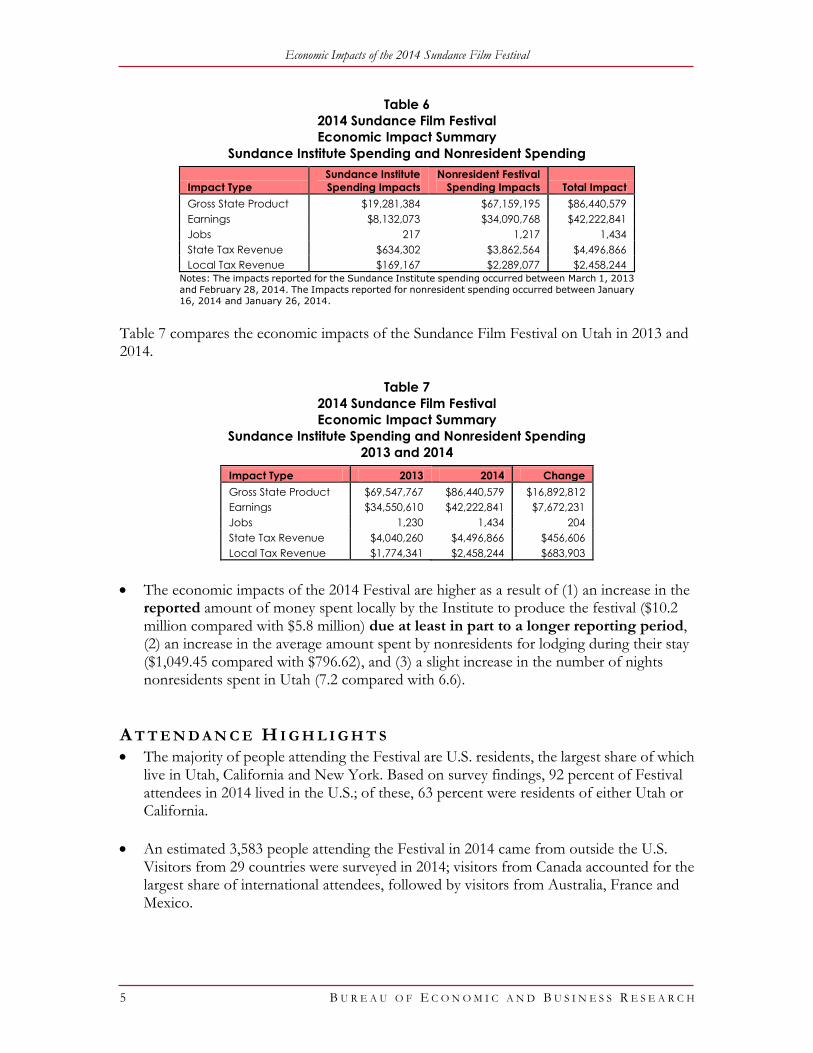
$2.3 million in revenue to cities and counties in Utah. A comparison of the economic impacts generated by nonresident spending for 2013 and 2014 is shown in Table 4.
Table 4
2014 Sundance Film Festival
Economic Impacts of Nonresident Spending
2013 and 2014 Comparison
Impact Type 2013 2014 Change
Total Nonresident Spending $52,185,265 $59,284,856 $7,099,591
Gross State Product $58,611,348 $67,159,195 $8,547,847
Earnings $29,906,776 $34,090,768 $4,183,992
Jobs 1,092 1,217 125
State Tax Revenue $3,684,078 $3,862,564 $178,486
Local Tax Revenue $1,705,612 $2,289,077 $583,465
Note: The economic impacts for 2013 are from a previous report completed by BEBR.
ECONOMIC IMPACTS OF SUNDANCE INSTITUTE SPENDING In addition to the economic impacts of visitor spending, there is also an economic impact of Sundance Institute spending to produce the Festival. Preparing for the Festival is a year-long effort. The cost to produce the 2014 Film Festival was $15.8 million, of which $10.2 million was spent locally. These expenditures were made between March 1, 2013 and February 28, 2014. The economic impacts generated by the Institute’s local spending are shown in Table 5.
Table 5
2014 Sundance Film Festival
Economic Impacts of Sundance Institute Spending
2013 and 2014 Comparison
Impact Type 2013 2014 Change
Gross State Product $10,936,419 $19,281,384 $8,344,965
Earnings $4,643,834 $8,132,073 $3,488,239
Jobs 138 217 79
State Tax Revenue $356,182 $634,302 $278,120
Local Tax Revenue $68,729 $169,167 $100,438
The economic impacts shown for 2014 are not strictly comparable with the 2013 impact shown in Table 5. The impacts generated in 2013 are based on Institute expenditures made between September 1, 2012 and February 28, 2013. The impacts generated in 2014 are based on Institute expenditures made between March 1, 2013 and February 28, 2014. The Sundance Institute believes their spending over the longer time period better reflects their efforts to produce the Festival.
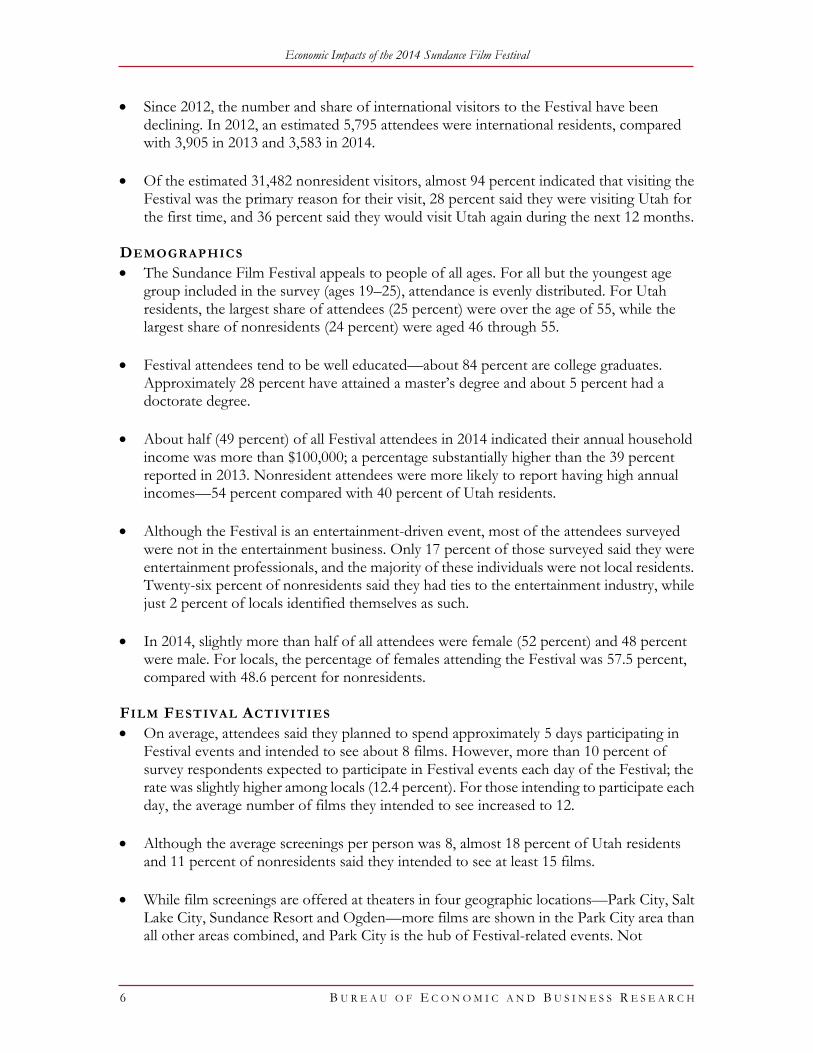
When the economic impact of Sundance Institute spending is added to the economic impact of nonresident spending, the 2014 Sundance Film Festival contributed $86.4 million in GSP, generated $42.2 million in earnings, and supported 1,434 jobs in Utah. The fiscal impacts included almost $4.5 million in state tax revenue and $2.5 million in revenue for local governments. These summary impacts are shown in Table 6.
Economic Impacts of the 2014 Sundance Film Festival
5 B U R E A U O F E C O N O M I C A N D B U S I N E S S R E S E A R C H
Table 6
2014 Sundance Film Festival
Economic Impact Summary
Sundance Institute Spending and Nonresident Spending
Impact Type
Sundance Institute
Spending Impacts
Nonresident Festival
Spending Impacts Total Impact
Gross State Product $19,281,384 $67,159,195 $86,440,579
Earnings $8,132,073 $34,090,768 $42,222,841
Jobs 217 1,217 1,434
State Tax Revenue $634,302 $3,862,564 $4,496,866
Local Tax Revenue $169,167 $2,289,077 $2,458,244
Notes: The impacts reported for the Sundance Institute spending occurred between March 1, 2013
and February 28, 2014. The Impacts reported for nonresident spending occurred between January
16, 2014 and January 26, 2014.
Table 7 compares the economic impacts of the Sundance Film Festival on Utah in 2013 and 2014.
Table 7
2014 Sundance Film Festival
Economic Impact Summary
Sundance Institute Spending and Nonresident Spending
2013 and 2014
Impact Type 2013 2014 Change
Gross State Product $69,547,767 $86,440,579 $16,892,812
Earnings $34,550,610 $42,222,841 $7,672,231
Jobs 1,230 1,434 204
State Tax Revenue $4,040,260 $4,496,866 $456,606
Local Tax Revenue $1,774,341 $2,458,244 $683,903
The economic impacts of the 2014 Festival are higher as a result of (1) an increase in the reported amount of money spent locally by the Institute to produce the festival ($10.2 million compared with $5.8 million) due at least in part to a longer reporting period, (2) an increase in the average amount spent by nonresidents for lodging during their stay ($1,049.45 compared with $796.62), and (3) a slight increase in the number of nights nonresidents spent in Utah (7.2 compared with 6.6).
A T T E N D A N C E H I G H L I G H T S The majority of people attending the Festival are U.S. residents, the largest share of which
live in Utah, California and New York. Based on survey findings, 92 percent of Festival attendees in 2014 lived in the U.S.; of these, 63 percent were residents of either Utah or California.
An estimated 3,583 people attending the Festival in 2014 came from outside the U.S. Visitors from 29 countries were surveyed in 2014; visitors from Canada accounted for the largest share of international attendees, followed by visitors from Australia, France and Mexico.
Economic Impacts of the 2014 Sundance Film Festival
6 B U R E A U O F E C O N O M I C A N D B U S I N E S S R E S E A R C H
Since 2012, the number and share of international visitors to the Festival have been declining. In 2012, an estimated 5,795 attendees were international residents, compared with 3,905 in 2013 and 3,583 in 2014.
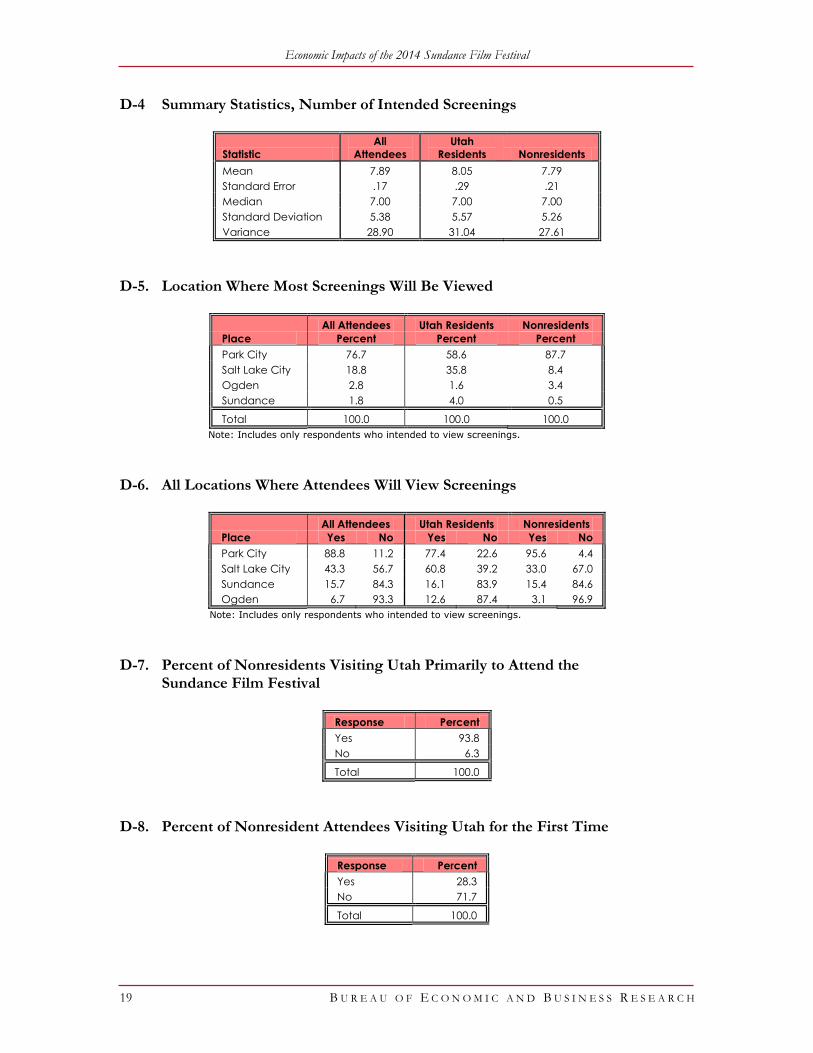
Of the estimated 31,482 nonresident visitors, almost 94 percent indicated that visiting the Festival was the primary reason for their visit, 28 percent said they were visiting Utah for the first time, and 36 percent said they would visit Utah again during the next 12 months.
DEMOGRAPHICS
The Sundance Film Festival appeals to people of all ages. For all but the youngest age group included in the survey (ages 19–25), attendance is evenly distributed. For Utah residents, the largest share of attendees (25 percent) were over the age of 55, while the largest share of nonresidents (24 percent) were aged 46 through 55.
Festival attendees tend to be well educated—about 84 percent are college graduates. Approximately 28 percent have attained a master’s degree and about 5 percent had a doctorate degree.
About half (49 percent) of all Festival attendees in 2014 indicated their annual household income was more than $100,000; a percentage substantially higher than the 39 percent reported in 2013. Nonresident attendees were more likely to report having high annual incomes—54 percent compared with 40 percent of Utah residents.
Although the Festival is an entertainment-driven event, most of the attendees surveyed were not in the entertainment business. Only 17 percent of those surveyed said they were entertainment professionals, and the majority of these individuals were not local residents. Twenty-six percent of nonresidents said they had ties to the entertainment industry, while just 2 percent of locals identified themselves as such.
In 2014, slightly more than half of all attendees were female (52 percent) and 48 percent were male. For locals, the percentage of females attending the Festival was 57.5 percent, compared with 48.6 percent for nonresidents.
FILM FESTIVAL ACTIVITIES
On average, attendees said they planned to spend approximately 5 days participating in Festival events and intended to see about 8 films. However, more than 10 percent of survey respondents expected to participate in Festival events each day of the Festival; the rate was slightly higher among locals (12.4 percent). For those intending to participate each day, the average number of films they intended to see increased to 12.
Although the average screenings per person was 8, almost 18 percent of Utah residents and 11 percent of nonresidents said they intended to see at least 15 films.
While film screenings are offered at theaters in four geographic locations—Park City, Salt Lake City, Sundance Resort and Ogden—more films are shown in the Park City area than all other areas combined, and Park City is the hub of Festival-related events. Not

Economic Impacts of the 2014 Sundance Film Festival
7 B U R E A U O F E C O N O M I C A N D B U S I N E S S R E S E A R C H
surprisingly then, 77 percent of those attending the Festival said they would view most of the films they intended to see in the Park City area, a rate that was even higher for nonresidents (88 percent).
People attending the Festival tend to be repeat customers. Seventy-two percent of those surveyed said they had attended in the past. The average number of previous visits was 6. Seven percent said they had attended the festival 15 times or more; most of which were residents of Utah.
Eighty-eight percent of those who attended the 2014 Festival said they would attend again, including 95 percent of Utah residents and 84 percent of nonresidents.
RECREATIONAL ACTIVITIES
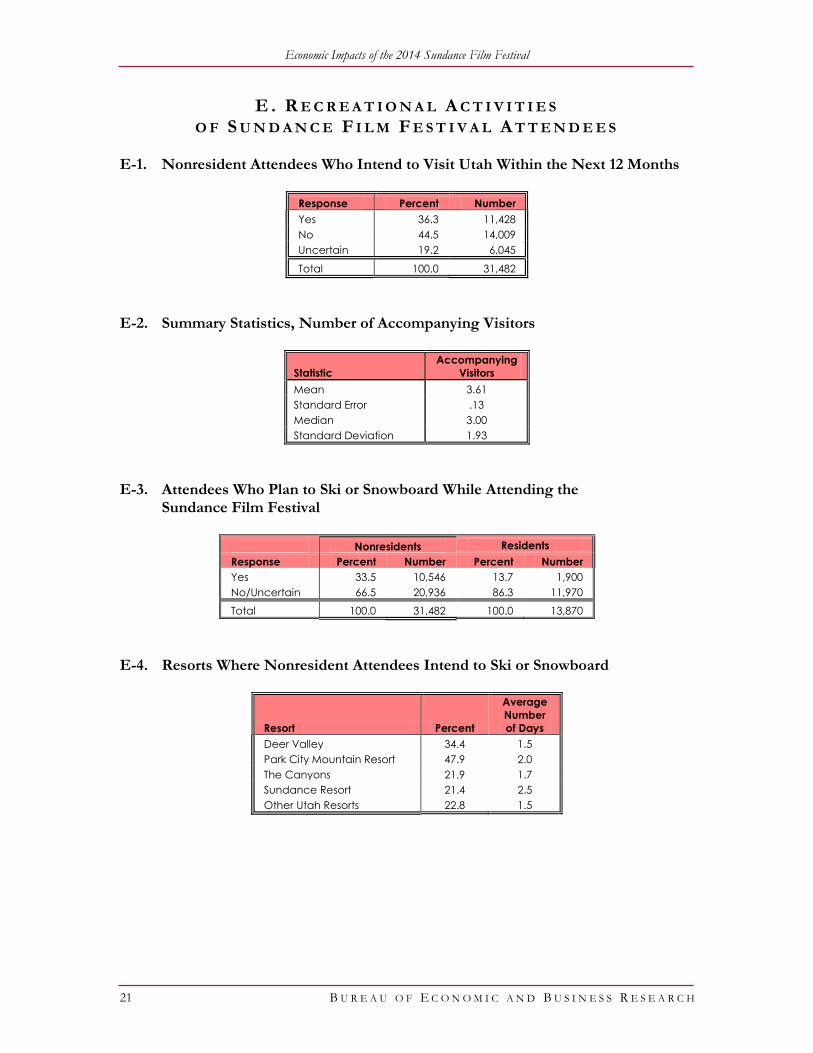
One-third of all nonresidents surveyed said they would ski or snowboard during their stay. This equates to about 10,500 people. The most popular resorts for skiing were Park City and Deer Valley.
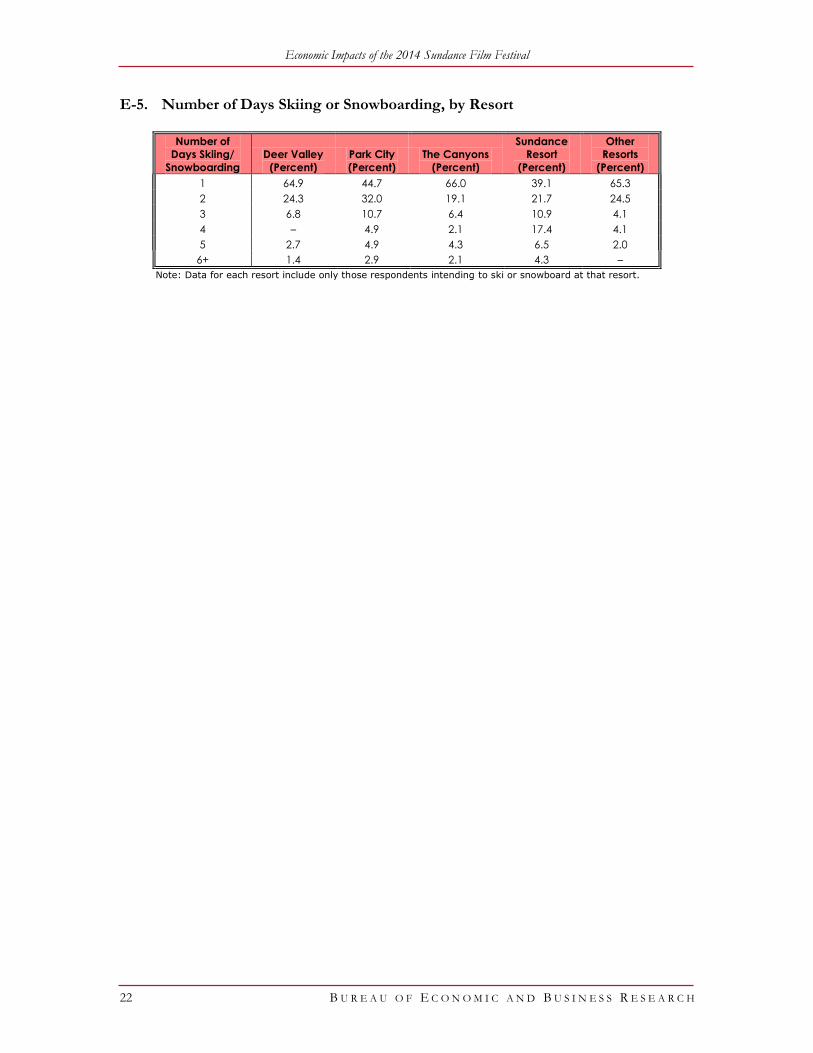
The Sundance Resort was a popular ski venue for those staying at the resort. Most of the people who indicated they were staying at Sundance also said they intended to ski at Sundance. The average number of ski days was 4, all of which were at the resort.
About 14 percent of locals surveyed said they would include skiing or snowboarding as part of their Festival experience. The Park City Mountain Resort and the Canyons were the ski areas of choice for Utah residents who intended to ski or snowboard.
Of those who intended to ski or snowboard (locals and nonlocals), 48 percent said they would spend at least two full days at the Park City Mountain Resort and 34 percent said they would spend at least one day at Deer Valley.
LODGING AND TRANSPORTATION
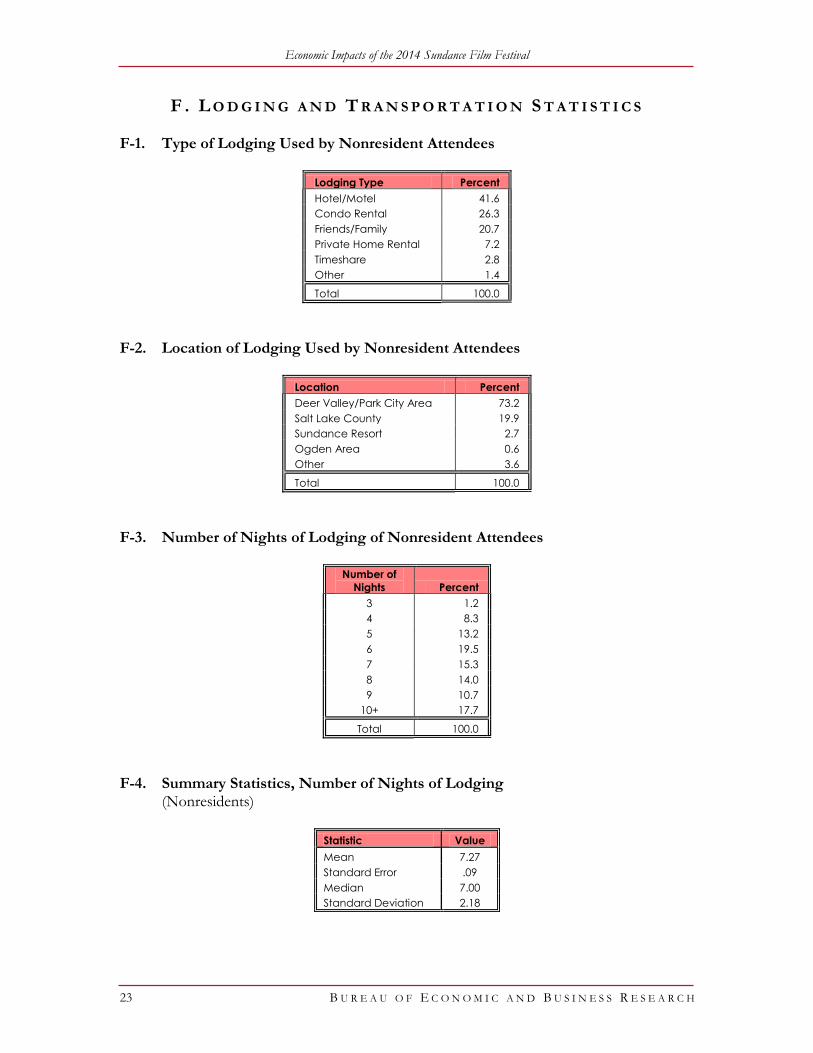
On average, nonresidents planned to spend 7 nights in Utah during their visit, almost a full day more than the average reported in 2013. Nearly 42 percent stayed commercially (hotel, motel or inn), 29 percent stayed in a condominium or timeshare, and 7 percent rented private homes. More than 20 percent of those surveyed said they were staying with friends and family—a slightly higher rate than reported in 2013. Almost 7 percent of locals surveyed said they were staying commercially. The majority of these respondents lived outside of the Wasatch Front area.
Seventy-three percent of nonresidents surveyed said they were staying in the Deer Valley/ Park City area; this includes those staying commercially as well as those staying with friends and family.
About two-thirds of those visiting Utah for the Festival in 2014 traveled via air, down from 73 percent in 2013. Eighteen percent of nonresident visitors said they traveled by personal vehicle—roughly the same percentage as in 2013.
Economic Impacts of the 2014 Sundance Film Festival
8 B U R E A U O F E C O N O M I C A N D B U S I N E S S R E S E A R C H
AP P E ND I C ES
S U R V E Y OF P E R S ONS ATTE ND I NG TH E 201 4 S U ND ANC E F I LM F E S TI V AL
T A B L E O F C O N T E N T S A. Attendance Information ........................................................................................................... 10
A-1. Estimated Attendance and Sample Size .......................................................................... 10 A-2. Primary Location Where Festival Attendees Will View Screenings ............................ 10 A-3. Primary Location Where Festival Attendees Will View Screenings,
2013 and 2014 Comparison .............................................................................................. 10 B. Spending and Economic Impacts of Spending ................................................................ 11
B-1. Estimated Weighted Average Daily Spending per Person, All Attendees ................. 11 B-2. Estimated Average Daily Spending per Person, Utah Resident and
Nonresident Comparison .................................................................................................. 11 B-3. Estimated Weighted Average Total Spending per Person ............................................ 11 B-4. Estimated Average Total Spending per Person, Utah Resident and
Nonresident Comparison .................................................................................................. 12 B-5. Estimated Weighted Average Total Spending per Person, 2013 and
2014 Comparison ............................................................................................................... 12 B-6. Estimated Total Average Spending per Person, Utah Resident and
Nonresident Comparison: 2013 and 2014 ...................................................................... 12 B-7. Estimated Total Spending, Utah Resident and Nonresident Comparison ................ 13 B-8. Estimated Economic Impacts of Nonresident Spending, 2013 and
2014 Comparison ............................................................................................................... 13 C. Demographic and Economic Characteristics of Sundance
Film Festival Attendees ........................................................................................................... 14 C-1. Utah Residency of Sundance Film Festival Attendees .................................................. 14 C-2. County of Residence, Utah Residents Only ................................................................... 14 C-3. U.S. Residency of Sundance Film Festival Attendees ................................................... 14 C-4. Residency of Nonlocal Sundance Film Festival Attendees .......................................... 14 C-5. Place of U.S. Residency of Sundance Film Festival Attendees (Nonlocals) .............. 15 C-6. List of Countries of Residence of Sundance Film Festival Attendees ........................ 15 C-7. Age of Sundance Film Festival Attendees ...................................................................... 16 C-8. Gender of Sundance Film Festival Attendees ................................................................ 16 C-9. Educational Attainment Level of Sundance Film Festival Attendees ........................ 16 C-10. Occupation of Sundance Film Festival Attendees ...................................................... 16 C-11. Household Income of Sundance Film Festival Attendees ......................................... 17
D. Festival Statistics ....................................................................................................................... 18 D-1. Number of Days Attending the Sundance Film Festival ........................................... 18 D-2. Summary Statistics, Number of Days Attending the Sundance Film Festival .......... 18 D-3. Number of Intended Screenings ...................................................................................... 18
Economic Impacts of the 2014 Sundance Film Festival
9 B U R E A U O F E C O N O M I C A N D B U S I N E S S R E S E A R C H
D-4. Summary Statistics, Number of Intended Screenings .................................................. 19 D-5. Location Where Most Screenings Will Be Viewed ....................................................... 19 D-6. All Locations Where Attendees Will View Screenings ................................................. 19 D-7. Percent of Nonresidents Visiting Utah Primarily to Attend the
Sundance Film Festival ..................................................................................................... 19 D-8. Percent of Nonresident Attendees Visiting Utah for the First Time ......................... 19 D-9. Prior Attendance at a Sundance Film Festival ............................................................... 20 D-10. Number of Times Previously Attended ....................................................................... 20 D-11. Summary Statistics, Number of Previous Visits .......................................................... 20 D-12. Percent of Attendees Who Plan to Attend the Sundance Film
Festival Next Year ........................................................................................................... 20 E. Recreational Activities of Sundance Film Festival Attendees ...................................... 21
E-1. Nonresident Attendees Who Intend to Visit Utah Within the Next 12 Months ..... 21 E-2. Summary Statistics, Number of Accompanying Visitors ............................................. 21 E-3. Attendees Who Plan to Ski or Snowboard While Attending the
Sundance Film Festival ..................................................................................................... 21 E-4. Resorts Where Nonresident Attendees Intend to Ski or Snowboard ......................... 21 E-5. Number of Days Skiing or Snowboarding, by Resort .................................................. 22
F. Lodging and Transportation Statistics ................................................................................ 23
F-1. Type of Lodging Used by Nonresident Attendees ........................................................ 23 F-2. Location of Lodging Used by Nonresident Attendees ................................................. 23 F-3. Number of Nights of Lodging of Nonresident Attendees ........................................... 23 F-4. Summary Statistics, Number of Nights of Lodging ....................................................... 23 F-5. Primary Form of Transportation to Utah to Attend the Festival ................................ 24
G. The Economic Impacts of Sundance Institute–Related Spending ............................ 25
G-1. 2014 Sundance Film Festival, Economic Impacts of Sundance Institute Spending .............................................................................................................. 25
G-2. 2014 Sundance Film Festival, Detailed Indirect and Induced Impacts of Sundance Institute Spending ........................................................................ 25
Economic Impacts: Measures and Definitions ....................................................................... 26 Input-Output Models ....................................................................................................... 26 RIMS II ............................................................................................................................... 26 Estimating Fiscal Impacts ................................................................................................ 27 Definitions Used in This Report .................................................................................... 27
Economic Impacts of the 2014 Sundance Film Festival
10 B U R E A U O F E C O N O M I C A N D B U S I N E S S R E S E A R C H
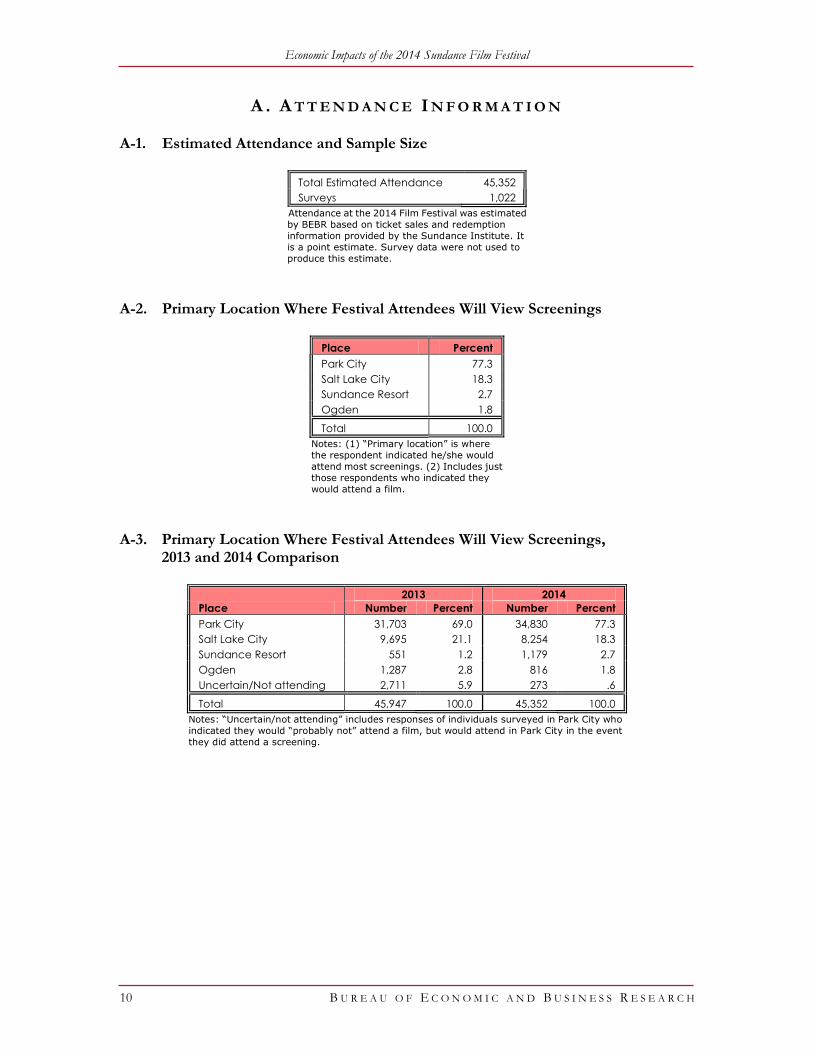
A . A T T E N D A N C E I N F O R M A T I O N A-1. Estimated Attendance and Sample Size
Total Estimated Attendance 45,352
Surveys 1,022
Attendance at the 2014 Film Festival was estimated
by BEBR based on ticket sales and redemption
information provided by the Sundance Institute. It
is a point estimate. Survey data were not used to
produce this estimate.
A-2. Primary Location Where Festival Attendees Will View Screenings
Place Percent
Park City 77.3
Salt Lake City 18.3
Sundance Resort 2.7
Ogden 1.8
Total 100.0
Notes: (1) “Primary location” is where
the respondent indicated he/she would
attend most screenings. (2) Includes just
those respondents who indicated they
would attend a film.
A-3. Primary Location Where Festival Attendees Will View Screenings,
2013 and 2014 Comparison
Place
2013 2014
Number Percent Number Percent
Park City 31,703 69.0 34,830 77.3
Salt Lake City 9,695 21.1 8,254 18.3
Sundance Resort 551 1.2 1,179 2.7
Ogden 1,287 2.8 816 1.8
Uncertain/Not attending 2,711 5.9 273 .6
Total 45,947 100.0 45,352 100.0
Notes: “Uncertain/not attending” includes responses of individuals surveyed in Park City who
indicated they would “probably not” attend a film, but would attend in Park City in the event
they did attend a screening.

Economic Impacts of the 2014 Sundance Film Festival
11 B U R E A U O F E C O N O M I C A N D B U S I N E S S R E S E A R C H
B . S P E N D I N G A N D E C O N O M I C I M P A C T S O F S P E N D I N G B-1. Estimated Weighted Average Daily Spending per Person, All Attendees
Spending Category
Weighted
Average
Standard
Error of the
Mean
Lodging $103.55 $6.25
Meals $55.00 $1.78
Automobile Rental $13.39 $1.34
Other Transportation $6.60 $0.75
Recreation/Entertainment $23.16 $2.32
Other Retail Purchases $33.94 $2.62
Total $235.64 $14.65
A 95% confidence interval for the weighted daily average spending
per person is $235.64 ±$14.65, producing a range of $220.99 to
$250.29.
B-2. Estimated Average Daily Spending per Person,
Utah Resident and Nonresident Comparison
Spending Category
Utah Residents Nonresidents Average
Daily
Spending
Standard
Error of the
Mean
Average
Daily
Spending
Standard
Error of the
Mean
Lodging $10.51 $2.38 $144.54 $7.95
Meals $33.63 $1.70 $64.42 $1.81
Automobile Rental $0.84 $0.39 $18.92 $1.76
Other Transportation $2.07 $0.37 $8.60 $0.91
Recreation/Entertainment $4.81 $0.98 $31.24 $2.91
Other Retail Purchases $16.47 $1.68 $41.64 $3.03
Total $68.33 $6.58 $309.36 $18.21
A 95% confidence interval for daily average spending by Utah residents is $68.33 ±$6.58, producing a
range of $61.75 to $74.91.
A 95% confidence interval for daily average spending by nonresidents is $309.36 ±$18.21, producing a range of $291.15 to $327.57.
B-3. Estimated Weighted Average Total Spending per Person
Spending Category
Weighted
Average
Total
Standard
Error of the
Mean
Lodging $740.31 $45.26
Meals $302.63 $12.59
Automobile Rental $70.10 $7.22
Other Transportation $36.48 $4.32
Recreation/Entertainment $99.99 $7.95
Other Retail Purchases $159.58 $11.02
Total $1,409.09 $98.19
A 95% confidence interval for weighted average total spending per
person is $1,409.09 ± $98.19, producing a range of $1,310.90 to
$1,507.28
Economic Impacts of the 2014 Sundance Film Festival
12 B U R E A U O F E C O N O M I C A N D B U S I N E S S R E S E A R C H
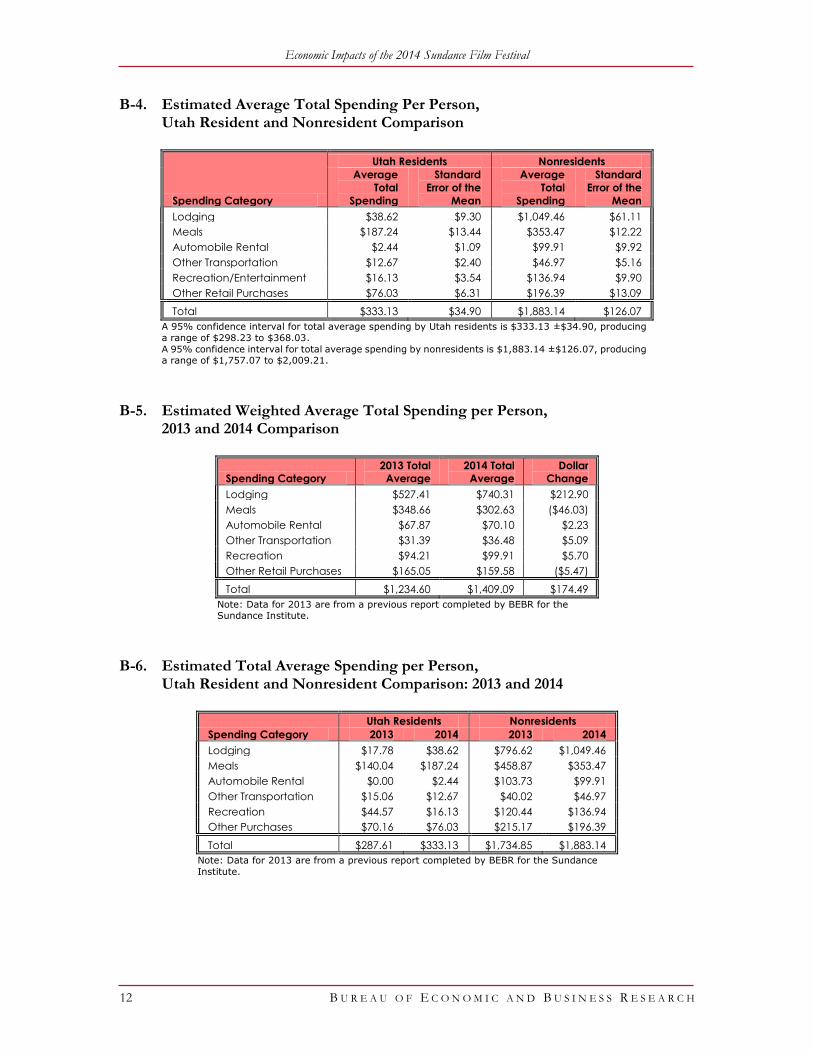
B-4. Estimated Average Total Spending Per Person, Utah Resident and Nonresident Comparison
Spending Category
Utah Residents Nonresidents
Average
Total
Spending
Standard
Error of the
Mean
Average
Total
Spending
Standard
Error of the
Mean
Lodging $38.62 $9.30 $1,049.46 $61.11
Meals $187.24 $13.44 $353.47 $12.22
Automobile Rental $2.44 $1.09 $99.91 $9.92
Other Transportation $12.67 $2.40 $46.97 $5.16
Recreation/Entertainment $16.13 $3.54 $136.94 $9.90
Other Retail Purchases $76.03 $6.31 $196.39 $13.09
Total $333.13 $34.90 $1,883.14 $126.07
A 95% confidence interval for total average spending by Utah residents is $333.13 ±$34.90, producing
a range of $298.23 to $368.03.
A 95% confidence interval for total average spending by nonresidents is $1,883.14 ±$126.07, producing a range of $1,757.07 to $2,009.21.
B-5. Estimated Weighted Average Total Spending per Person,
2013 and 2014 Comparison
Spending Category
2013 Total
Average
2014 Total
Average
Dollar
Change
Lodging $527.41 $740.31 $212.90
Meals $348.66 $302.63 ($46.03)
Automobile Rental $67.87 $70.10 $2.23
Other Transportation $31.39 $36.48 $5.09
Recreation $94.21 $99.91 $5.70
Other Retail Purchases $165.05 $159.58 ($5.47)
Total $1,234.60 $1,409.09 $174.49
Note: Data for 2013 are from a previous report completed by BEBR for the Sundance Institute.
B-6. Estimated Total Average Spending per Person,
Utah Resident and Nonresident Comparison: 2013 and 2014
Spending Category
Utah Residents Nonresidents
2013 2014 2013 2014
Lodging $17.78 $38.62 $796.62 $1,049.46
Meals $140.04 $187.24 $458.87 $353.47
Automobile Rental $0.00 $2.44 $103.73 $99.91
Other Transportation $15.06 $12.67 $40.02 $46.97
Recreation $44.57 $16.13 $120.44 $136.94
Other Purchases $70.16 $76.03 $215.17 $196.39
Total $287.61 $333.13 $1,734.85 $1,883.14
Note: Data for 2013 are from a previous report completed by BEBR for the Sundance
Institute.
Economic Impacts of the 2014 Sundance Film Festival
13 B U R E A U O F E C O N O M I C A N D B U S I N E S S R E S E A R C H
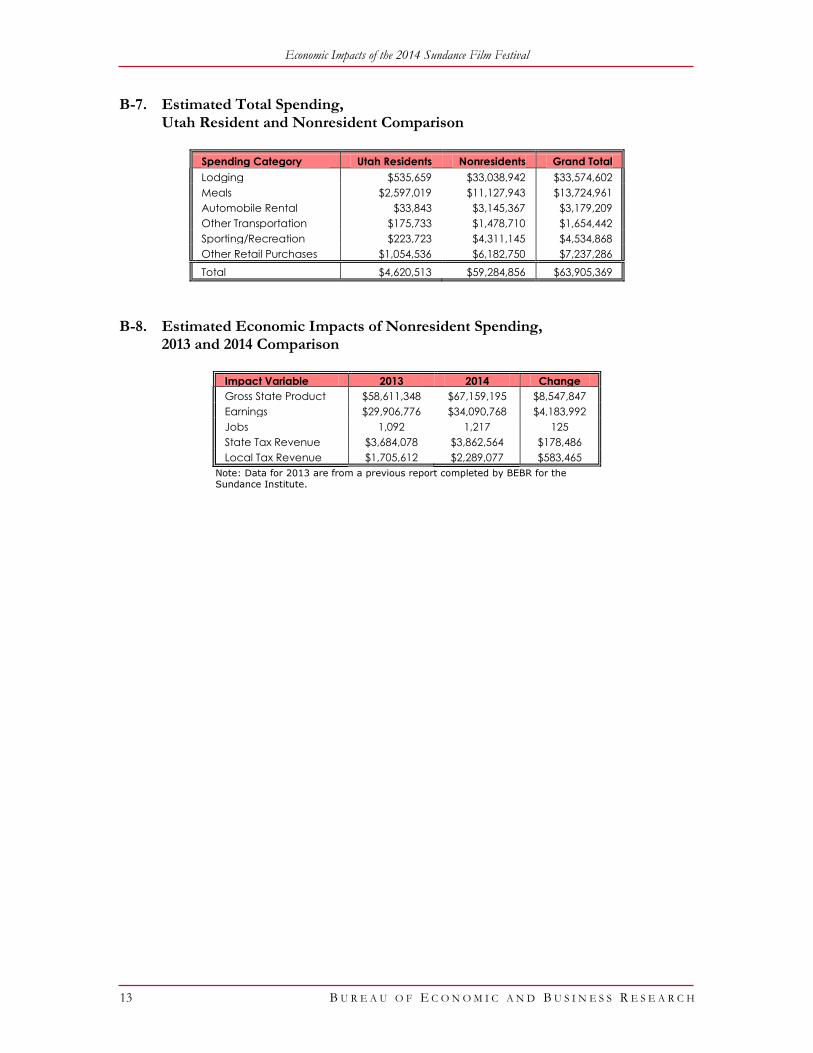
B-7. Estimated Total Spending, Utah Resident and Nonresident Comparison
Spending Category Utah Residents Nonresidents Grand Total
Lodging $535,659 $33,038,942 $33,574,602
Meals $2,597,019 $11,127,943 $13,724,961
Automobile Rental $33,843 $3,145,367 $3,179,209
Other Transportation $175,733 $1,478,710 $1,654,442
Sporting/Recreation $223,723 $4,311,145 $4,534,868
Other Retail Purchases $1,054,536 $6,182,750 $7,237,286
Total $4,620,513 $59,284,856 $63,905,369
B-8. Estimated Economic Impacts of Nonresident Spending,
2013 and 2014 Comparison
Impact Variable 2013 2014 Change
Gross State Product $58,611,348 $67,159,195 $8,547,847
Earnings $29,906,776 $34,090,768 $4,183,992
Jobs 1,092 1,217 125
State Tax Revenue $3,684,078 $3,862,564 $178,486
Local Tax Revenue $1,705,612 $2,289,077 $583,465
Note: Data for 2013 are from a previous report completed by BEBR for the Sundance Institute.

Economic Impacts of the 2014 Sundance Film Festival
14 B U R E A U O F E C O N O M I C A N D B U S I N E S S R E S E A R C H
C . D E M O G R A P H I C A N D E C O N O M I C C H A R A C T E R I S T I C S O F
S U N D A N C E F I L M F E S T I V A L A T T E N D E E S C-1. Utah Residency of Sundance Film Festival Attendees
Resident of Utah Percent Number
Yes 31.0 13,870
No 69.0 31,482
Total 100.0 45,352
The ratio of local and nonlocal attendees was estimated by
BEBR based on information provided by the Sundance
Institute. This is a point estimate. Survey data were not
used to produce these estimates
C-2. County of Residence, Utah Residents Only
County Percent Number
Salt Lake 46.2 6,408
Summit 29.0 4,022
Utah 10.6 1,470
Weber 7.1 985
Wasatch 1.8 250
All Other 5.3 735
Total 100.0 13,870
C-3. U.S. Residency of Sundance Film Festival Attendees
U.S. Resident Percent Number
Yes 92.1 41,769
No 7.9 3,583
Total 100.0 45,352
C-4. Residency of Nonlocal Sundance Film Festival Attendees
Residence Number
U.S. Nonlocal 27,899
International 3,583
Total 31,482
Economic Impacts of the 2014 Sundance Film Festival
15 B U R E A U O F E C O N O M I C A N D B U S I N E S S R E S E A R C H
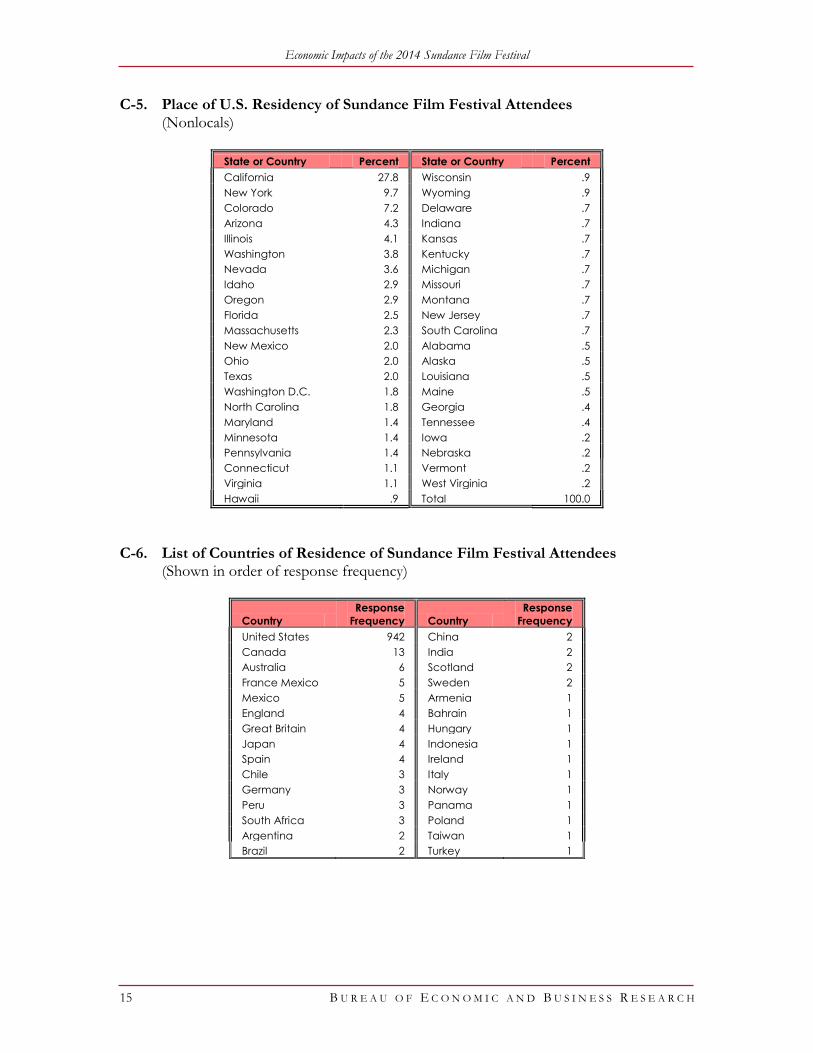
C-5. Place of U.S. Residency of Sundance Film Festival Attendees (Nonlocals)
State or Country Percent State or Country Percent
California 27.8 Wisconsin .9
New York 9.7 Wyoming .9
Colorado 7.2 Delaware .7
Arizona 4.3 Indiana .7
Illinois 4.1 Kansas .7
Washington 3.8 Kentucky .7
Nevada 3.6 Michigan .7
Idaho 2.9 Missouri .7
Oregon 2.9 Montana .7
Florida 2.5 New Jersey .7
Massachusetts 2.3 South Carolina .7
New Mexico 2.0 Alabama .5
Ohio 2.0 Alaska .5
Texas 2.0 Louisiana .5
Washington D.C. 1.8 Maine .5
North Carolina 1.8 Georgia .4
Maryland 1.4 Tennessee .4
Minnesota 1.4 Iowa .2
Pennsylvania 1.4 Nebraska .2
Connecticut 1.1 Vermont .2
Virginia 1.1 West Virginia .2
Hawaii .9 Total 100.0
C-6. List of Countries of Residence of Sundance Film Festival Attendees (Shown in order of response frequency)
Country
Response
Frequency Country
Response
Frequency
United States 942 China 2
Canada 13 India 2
Australia 6 Scotland 2
France Mexico 5 Sweden 2
Mexico 5 Armenia 1
England 4 Bahrain 1
Great Britain 4 Hungary 1
Japan 4 Indonesia 1
Spain 4 Ireland 1
Chile 3 Italy 1
Germany 3 Norway 1
Peru 3 Panama 1
South Africa 3 Poland 1
Argentina 2 Taiwan 1
Brazil 2 Turkey 1
Economic Impacts of the 2014 Sundance Film Festival
16 B U R E A U O F E C O N O M I C A N D B U S I N E S S R E S E A R C H
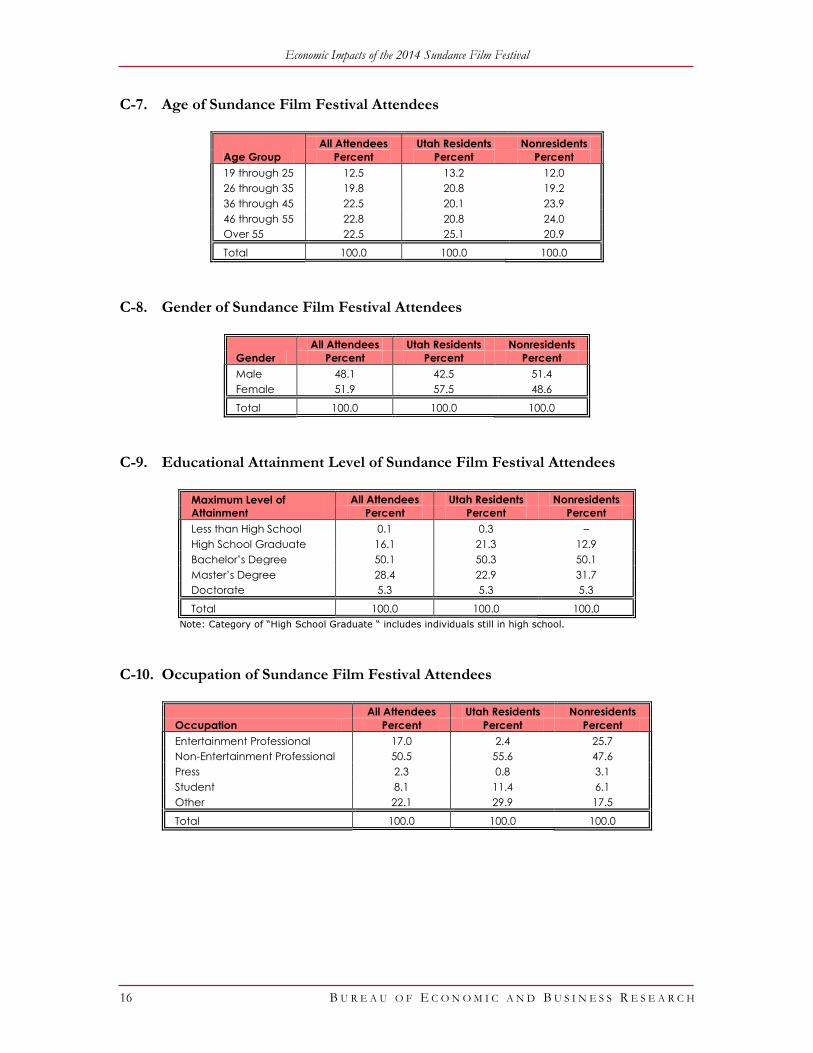
C-7. Age of Sundance Film Festival Attendees
Age Group
All Attendees Utah Residents Nonresidents
Percent Percent Percent
19 through 25 12.5 13.2 12.0
26 through 35 19.8 20.8 19.2
36 through 45 22.5 20.1 23.9
46 through 55 22.8 20.8 24.0
Over 55 22.5 25.1 20.9
Total 100.0 100.0 100.0
C-8. Gender of Sundance Film Festival Attendees
Gender
All Attendees Utah Residents Nonresidents
Percent Percent Percent
Male 48.1 42.5 51.4
Female 51.9 57.5 48.6
Total 100.0 100.0 100.0
C-9. Educational Attainment Level of Sundance Film Festival Attendees
Maximum Level of
Attainment
All Attendees Utah Residents Nonresidents
Percent Percent Percent
Less than High School 0.1 0.3 –
High School Graduate 16.1 21.3 12.9
Bachelor’s Degree 50.1 50.3 50.1
Master’s Degree 28.4 22.9 31.7
Doctorate 5.3 5.3 5.3
Total 100.0 100.0 100.0
Note: Category of “High School Graduate “ includes individuals still in high school.
C-10. Occupation of Sundance Film Festival Attendees
Occupation
All Attendees Utah Residents Nonresidents
Percent Percent Percent
Entertainment Professional 17.0 2.4 25.7
Non-Entertainment Professional 50.5 55.6 47.6
Press 2.3 0.8 3.1
Student 8.1 11.4 6.1
Other 22.1 29.9 17.5
Total 100.0 100.0 100.0
Economic Impacts of the 2014 Sundance Film Festival
17 B U R E A U O F E C O N O M I C A N D B U S I N E S S R E S E A R C H
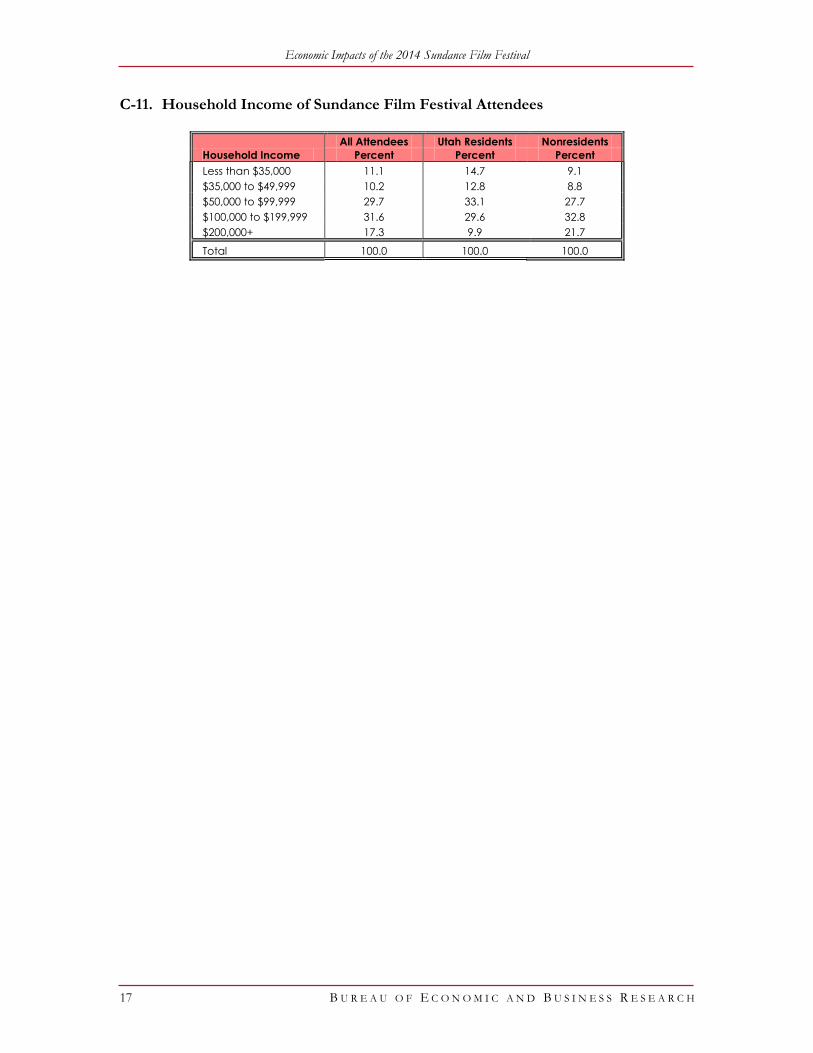
C-11. Household Income of Sundance Film Festival Attendees
Household Income
All Attendees Utah Residents Nonresidents
Percent Percent Percent
Less than $35,000 11.1 14.7 9.1
$35,000 to $49,999 10.2 12.8 8.8
$50,000 to $99,999 29.7 33.1 27.7
$100,000 to $199,999 31.6 29.6 32.8
$200,000+ 17.3 9.9 21.7
Total 100.0 100.0 100.0

Economic Impacts of the 2014 Sundance Film Festival
18 B U R E A U O F E C O N O M I C A N D B U S I N E S S R E S E A R C H
D . F E S T I V A L S T A T I S T I C S
D-1. Number of Days Attending the Sundance Film Festival
Days of
Attendance
All Attendees Utah Residents Nonresidents
Percent Percent Percent
1 5.4 9.7 2.8
2 5.8 9.2 3.7
3 11.8 13.2 11.1
4 18.0 14.5 20.1
5 17.4 11.1 21.2
6 11.2 7.6 13.2
7 9.1 7.6 10.0
8 6.6 7.6 5.9
9 4.1 7.1 2.3
10 10.6 12.4 9.9
Total 100.0 100.0 100.0
D-2. Summary Statistics, Number of Days Attending the Sundance Film Festival
Statistic
All
Attendees
Utah
Residents Nonresidents
Mean 5.41 5.33 5.46
Standard Error .08 .15 .09
Median 5.00 5.00 5.00
Standard Deviation 2.57 2.96 2.31
Variance 6.61 8.76 5.34
D-3. Number of Intended Screenings
Number of
Screenings
All Attendees Utah Residents Nonresidents
Percent Percent Percent
0 1.7 1.3 1.9
1 7.7 8.0 7.6
2 5.3 7.4 4.0
3 6.3 6.9 6.0
4 7.6 7.4 7.7
5 9.9 9.5 10.1
6 10.0 7.2 11.8
7 6.0 7.2 5.3
8 6.8 4.5 8.2
9 4.5 6.1 3.5
10 9.3 6.9 10.8
11 2.5 1.3 3.2
12 4.7 5.0 4.5
13 1.5 1.9 1.3
14 2.5 1.9 2.9
15+ 13.5 17.6 11.3
Total 100.0 100.0 100.0
Economic Impacts of the 2014 Sundance Film Festival
19 B U R E A U O F E C O N O M I C A N D B U S I N E S S R E S E A R C H
D-4 Summary Statistics, Number of Intended Screenings
Statistic
All
Attendees
Utah
Residents Nonresidents
Mean 7.89 8.05 7.79
Standard Error .17 .29 .21
Median 7.00 7.00 7.00
Standard Deviation 5.38 5.57 5.26
Variance 28.90 31.04 27.61
D-5. Location Where Most Screenings Will Be Viewed
Place
All Attendees Utah Residents Nonresidents
Percent Percent Percent
Park City 76.7 58.6 87.7
Salt Lake City 18.8 35.8 8.4
Ogden 2.8 1.6 3.4
Sundance 1.8 4.0 0.5
Total 100.0 100.0 100.0
Note: Includes only respondents who intended to view screenings.
D-6. All Locations Where Attendees Will View Screenings
Place
All Attendees Utah Residents Nonresidents
Yes No Yes No Yes No
Park City 88.8 11.2 77.4 22.6 95.6 4.4
Salt Lake City 43.3 56.7 60.8 39.2 33.0 67.0
Sundance 15.7 84.3 16.1 83.9 15.4 84.6
Ogden 6.7 93.3 12.6 87.4 3.1 96.9
Note: Includes only respondents who intended to view screenings.
D-7. Percent of Nonresidents Visiting Utah Primarily to Attend the
Sundance Film Festival
Response Percent
Yes 93.8
No 6.3
Total 100.0
D-8. Percent of Nonresident Attendees Visiting Utah for the First Time
Response Percent
Yes 28.3
No 71.7
Total 100.0

Economic Impacts of the 2014 Sundance Film Festival
20 B U R E A U O F E C O N O M I C A N D B U S I N E S S R E S E A R C H
D-9. Prior Attendance at a Sundance Film Festival
Prior Attendance All Attendees Utah Residents Nonresidents
Percent Percent Percent
Yes 71.7 87.6 61.3
No 28.9 12.4 38.7
Total 100.0 100.0 100.0
D-10. Number of Times Previously Attended
Years of Prior
Attendance
All Attendees Utah Residents Nonresidents
Percent Percent Percent
0 .6 – 1.0
1 15.3 10.5 19.4
2 10.1 6.9 12.8
3 15.7 12.6 18.4
4 9.1 7.5 10.5
5 11.7 12.0 11.5
6 6.1 7.5 4.8
7 4.6 5.1 4.1
8 3.4 4.8 2.3
9 3.4 4.5 2.6
10 6.1 9.3 3.3
11 1.0 0.6 1.3
12 2.8 2.4 3.1
13 1.5 1.8 1.3
14 1.4 1.8 1.0
15+ 7.0 12.6 3.2
Total 100.0 100.0 100.0
D-11. Summary Statistics, Number of Previous Visits
Statistic
All
Attendees
Utah
Residents Nonresidents
Mean 5.9 7.3 4.6
Standard Error .19 .31 .20
Median 4.00 6.00 3.00
Standard Deviation 5.00 5.70 3.95
D-12. Percent of Attendees Who Plan to Attend the Sundance Film Festival Next Year
Response
All Attendees Utah Residents Nonresidents
Percent Percent Percent
Yes 88.0 94.7 84.0
No 12.0 5.3 16.0
Total 100.0 100.0 100.0
Economic Impacts of the 2014 Sundance Film Festival
21 B U R E A U O F E C O N O M I C A N D B U S I N E S S R E S E A R C H
E . R E C R E A T I O N A L A C T I V I T I E S O F S U N D A N C E F I L M F E S T I V A L A T T E N D E E S
E-1. Nonresident Attendees Who Intend to Visit Utah Within the Next 12 Months
Response Percent Number
Yes 36.3 11,428
No 44.5 14,009
Uncertain 19.2 6,045
Total 100.0 31,482
E-2. Summary Statistics, Number of Accompanying Visitors
Statistic
Accompanying
Visitors
Mean 3.61
Standard Error .13
Median 3.00
Standard Deviation 1.93
E-3. Attendees Who Plan to Ski or Snowboard While Attending the
Sundance Film Festival
Nonresidents Residents
Response Percent Number Percent Number
Yes 33.5 10,546 13.7 1,900
No/Uncertain 66.5 20,936 86.3 11,970
Total 100.0 31,482 100.0 13,870
E-4. Resorts Where Nonresident Attendees Intend to Ski or Snowboard
Resort Percent
Average
Number
of Days
Deer Valley 34.4 1.5
Park City Mountain Resort 47.9 2.0
The Canyons 21.9 1.7
Sundance Resort 21.4 2.5
Other Utah Resorts 22.8 1.5
Economic Impacts of the 2014 Sundance Film Festival
22 B U R E A U O F E C O N O M I C A N D B U S I N E S S R E S E A R C H
E-5. Number of Days Skiing or Snowboarding, by Resort
Number of
Days Skiing/
Snowboarding
Deer Valley
(Percent)
Park City
(Percent)
The Canyons
(Percent)
Sundance
Resort
(Percent)
Other
Resorts
(Percent)
1 64.9 44.7 66.0 39.1 65.3
2 24.3 32.0 19.1 21.7 24.5
3 6.8 10.7 6.4 10.9 4.1
4 – 4.9 2.1 17.4 4.1
5 2.7 4.9 4.3 6.5 2.0
6+ 1.4 2.9 2.1 4.3 –
Note: Data for each resort include only those respondents intending to ski or snowboard at that resort.
Economic Impacts of the 2014 Sundance Film Festival
23 B U R E A U O F E C O N O M I C A N D B U S I N E S S R E S E A R C H
F . L O D G I N G A N D T R A N S P O R T A T I O N S T A T I S T I C S F-1. Type of Lodging Used by Nonresident Attendees
Lodging Type Percent
Hotel/Motel 41.6
Condo Rental 26.3
Friends/Family 20.7
Private Home Rental 7.2
Timeshare 2.8
Other 1.4
Total 100.0
F-2. Location of Lodging Used by Nonresident Attendees
Location Percent
Deer Valley/Park City Area 73.2
Salt Lake County 19.9
Sundance Resort 2.7
Ogden Area 0.6
Other 3.6
Total 100.0
F-3. Number of Nights of Lodging of Nonresident Attendees
Number of
Nights Percent
3 1.2
4 8.3
5 13.2
6 19.5
7 15.3
8 14.0
9 10.7
10+ 17.7
Total 100.0
F-4. Summary Statistics, Number of Nights of Lodging
(Nonresidents)
Statistic Value
Mean 7.27
Standard Error .09
Median 7.00
Standard Deviation 2.18
Economic Impacts of the 2014 Sundance Film Festival
24 B U R E A U O F E C O N O M I C A N D B U S I N E S S R E S E A R C H
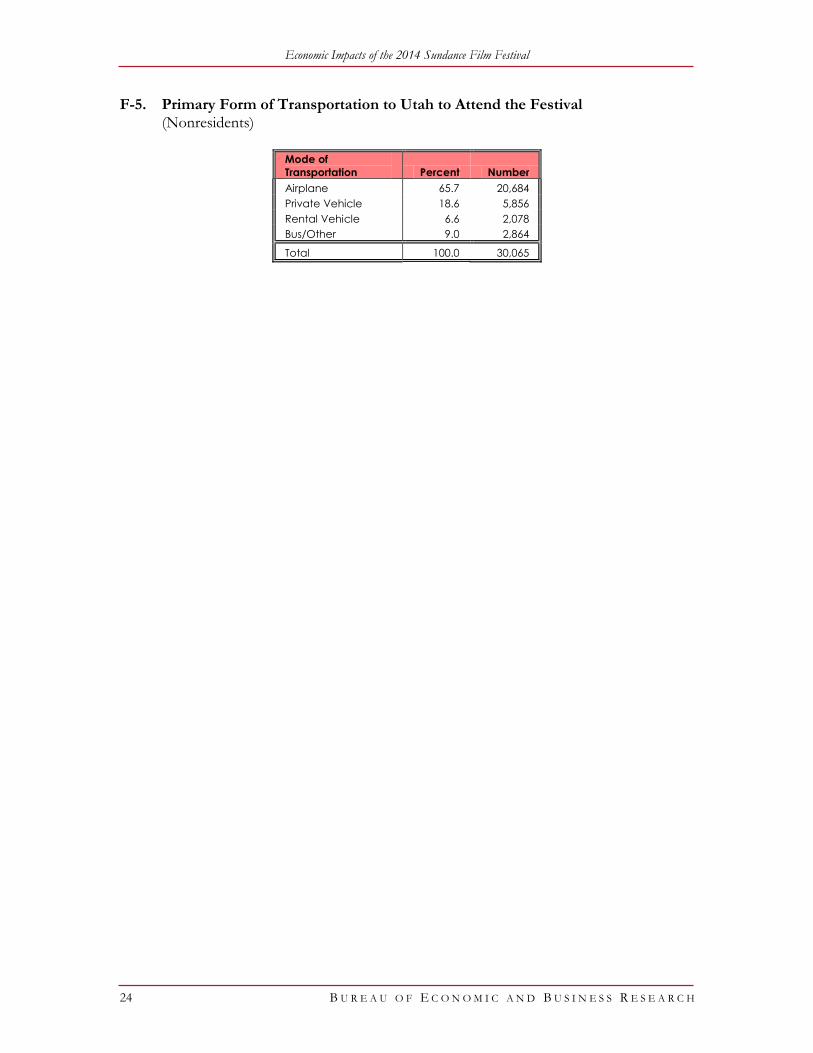
F-5. Primary Form of Transportation to Utah to Attend the Festival (Nonresidents)
Mode of
Transportation Percent Number
Airplane 65.7 20,684
Private Vehicle 18.6 5,856
Rental Vehicle 6.6 2,078
Bus/Other 9.0 2,864
Total 100.0 30,065
Economic Impacts of the 2014 Sundance Film Festival
25 B U R E A U O F E C O N O M I C A N D B U S I N E S S R E S E A R C H
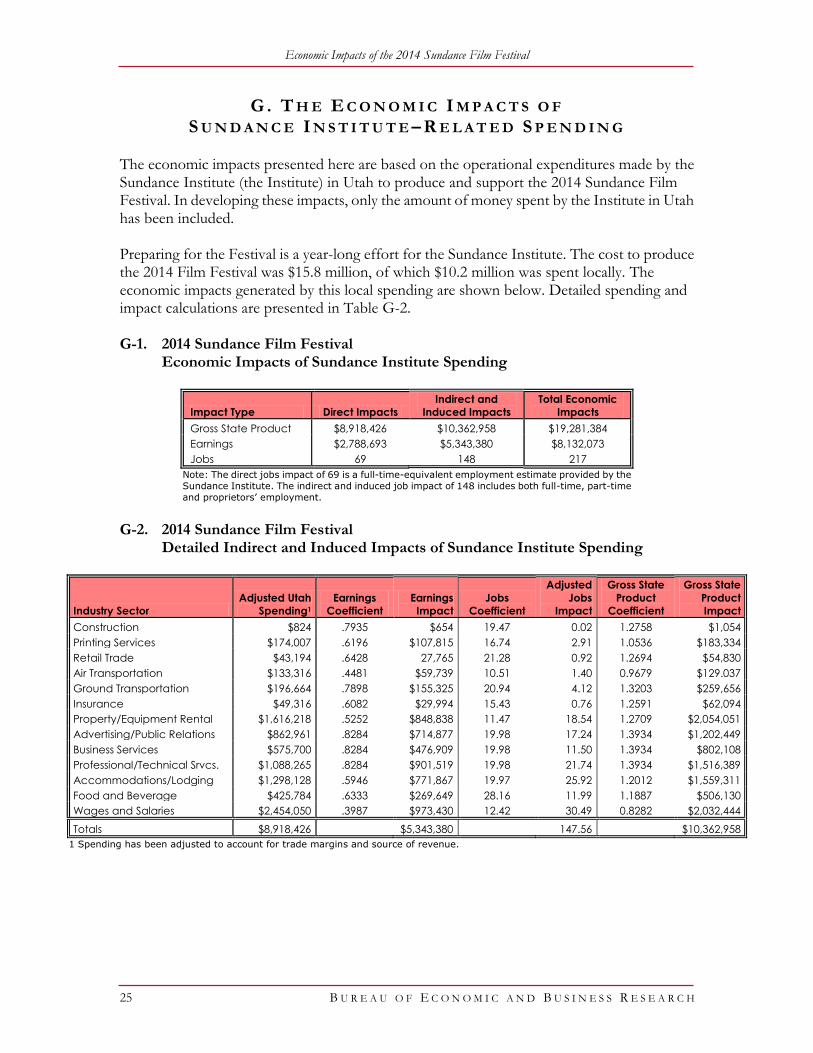
G . T H E E C O N O M I C I M P A C T S O F S U N D A N C E I N S T I T U T E–R E L A T E D S P E N D I N G
The economic impacts presented here are based on the operational expenditures made by the Sundance Institute (the Institute) in Utah to produce and support the 2014 Sundance Film Festival. In developing these impacts, only the amount of money spent by the Institute in Utah has been included. Preparing for the Festival is a year-long effort for the Sundance Institute. The cost to produce the 2014 Film Festival was $15.8 million, of which $10.2 million was spent locally. The economic impacts generated by this local spending are shown below. Detailed spending and impact calculations are presented in Table G-2. G-1. 2014 Sundance Film Festival
Economic Impacts of Sundance Institute Spending
Impact Type Direct Impacts
Indirect and
Induced Impacts
Total Economic
Impacts
Gross State Product $8,918,426 $10,362,958 $19,281,384
Earnings $2,788,693 $5,343,380 $8,132,073
Jobs 69 148 217
Note: The direct jobs impact of 69 is a full-time-equivalent employment estimate provided by the
Sundance Institute. The indirect and induced job impact of 148 includes both full-time, part-time
and proprietors’ employment.
G-2. 2014 Sundance Film Festival
Detailed Indirect and Induced Impacts of Sundance Institute Spending
Industry Sector
Adjusted Utah
Spending1
Earnings
Coefficient
Earnings
Impact
Jobs
Coefficient
Adjusted
Jobs
Impact
Gross State
Product
Coefficient
Gross State
Product
Impact
Construction $824 .7935 $654 19.47 0.02 1.2758 $1,054
Printing Services $174,007 .6196 $107,815 16.74 2.91 1.0536 $183,334
Retail Trade $43,194 .6428 27,765 21.28 0.92 1.2694 $54,830
Air Transportation $133,316 .4481 $59,739 10.51 1.40 0.9679 $129.037
Ground Transportation $196,664 .7898 $155,325 20.94 4.12 1.3203 $259,656
Insurance $49,316 .6082 $29,994 15.43 0.76 1.2591 $62,094
Property/Equipment Rental $1,616,218 .5252 $848,838 11.47 18.54 1.2709 $2,054,051
Advertising/Public Relations $862,961 .8284 $714,877 19.98 17.24 1.3934 $1,202,449
Business Services $575,700 .8284 $476,909 19.98 11.50 1.3934 $802,108
Professional/Technical Srvcs. $1,088,265 .8284 $901,519 19.98 21.74 1.3934 $1,516,389
Accommodations/Lodging $1,298,128 .5946 $771,867 19.97 25.92 1.2012 $1,559,311
Food and Beverage $425,784 .6333 $269,649 28.16 11.99 1.1887 $506,130
Wages and Salaries $2,454,050 .3987 $973,430 12.42 30.49 0.8282 $2,032,444
Totals $8,918,426 $5,343,380 147.56 $10,362,958
1 Spending has been adjusted to account for trade margins and source of revenue.

Economic Impacts of the 2014 Sundance Film Festival
26 B U R E A U O F E C O N O M I C A N D B U S I N E S S R E S E A R C H
ECONOMIC IMPACTS : MEASURES AND DEFINITIONS Economic impacts are the changes in the size and structure of a region’s economy that occur when goods and services are purchased from vendors within the region with money generated outside the region. In the strictest interpretation, economic impacts occur only when “new” money enters the regional economy and is then spent locally. Such an inflow has the potential to expand the size and strength of the region’s economy. Money spent outside the region is considered “leakage” and does not generate economic growth within the region. Likewise, purchases of goods and services by local residents from local vendors do not increase the economic base of the region; they simply reshuffle the existing resources. Input-Output Models Various models have been built to evaluate the economic impacts that occur with changes in regional exports. The key inputs to these models are the direct impacts, which are the spending injections into the community when goods produced locally are sold outside the region. One of the most commonly used models for regional impact analysis is the single-region input-output (I-O) model. I-O models capture business-to-business purchases within a region. When an export base industry purchases raw materials, equipment or other inputs from local producers, the size of the region’s export base increases; these are known as the indirect effects. These inter-industry linkages are captured in an I-O model. I-O models also capture induced spending generated when households supported by the direct and indirect activities purchase goods and services within the region. I-O models simultaneously describe the demand and supply relationships between industries by showing the final demand for goods and services and the inter-industry transactions required to satisfy that demand. Using the construction industry as an example, an I-O model would identify all industries that provide goods and services to the construction industry. The I-O model also shows the value of goods and services provided by each industry directly to the construction industry, as well as all industries that are indirect suppliers to the initial supplying industries. These interactions continue until the value of supplies from all producing sectors that provide goods and services to the direct suppliers of the construction industry have been accounted for. This is called the “multiplier” effect. RIMS II RIMS II is the updated version of the Regional Input-Output Modeling System developed by the U.S. Department of Commerce, Bureau of Economic Analysis (BEA) in 1970. RIMS II is based on an accounting framework called an input-output table, which shows the input and output structure of approximately 500 industries in the U.S. The BEA’s regional economic accounts are used to adjust the national I-O table to show a region’s industrial structure and trading patterns.3 RIMS II multipliers can be estimated for any region in the U.S. that is composed of one or more counties, and for any industry or group of industries in the national I-O table.
3 “Regional Input-Output Modeling System,” U.S. Department of Commerce, Bureau of Economic Analysis; available at www.bea.gov/regional/rims.
Economic Impacts of the 2014 Sundance Film Festival
27 B U R E A U O F E C O N O M I C A N D B U S I N E S S R E S E A R C H
The impact effects produced using RIMS II are the net changes in value added, earnings and employment that occur when new dollars flow into a region and are then spent locally. The impacts represent the increase in the existing economic base of the region under study. Estimating Fiscal Impacts The fiscal impacts provided in this analysis were derived in two ways. The fiscal impact of visitors’ spending was estimated by applying the appropriate sales and use tax and other tax rates to total spending. The impact on state income tax was estimated by applying an “average tax” rate of 3.13 percent to the earnings estimate. The average tax rate was estimated using 2011 personal income data from the U.S. Department of Commerce, Bureau of Economic Analysis and income tax collections for the state of Utah as reported in State and Local Government Finances: 2011, published by the U.S. Census Bureau. The fiscal impacts of spending by the Sundance Institute were estimated by quantifying the relationship between earnings in the state of Utah and selected state and local tax collections, expressed as a ratio representing the effective state and local tax rates. This derived ratio was applied to the total earnings impacts. The effective state rate used in this analysis was 7.8 percent. The effective local rate was 1.4 percent. The fiscal impact estimates for Sundance Institute spending are conservative. Using an effective tax rate methodology to calculate fiscal impacts assumes that state and local taxes are directly related to earnings. While this assumption holds with respect to state income tax, and to a lesser degree, sales tax, the relationship between earnings and other taxes, such as property tax, is less obvious; e.g., an increase in earnings may not affect property tax revenue or other tax revenue. Thus property tax and selected other taxes were not used in estimating the effective state and local tax ratios. Definitions Used in This Report Conceptually, economic impacts fall into three categories: direct, indirect and induced. The type of impacts generated includes value added, earnings and jobs. These terms are defined below:
Direct Effects: The effects of purchases of goods and services from local suppliers, and wage and salary payments made to employees.
Indirect Effects: The effects of additional business sales, jobs and income generated by direct purchases of goods and services from local suppliers. The purchases of these suppliers create subsequent rounds of spending, which when added to the initial suppliers’ purchases represent the total indirect effects.
Induced Effects: The effects of increased consumer and household spending resulting from the direct and indirect incomes.
Gross State Product/Value Added: The additional value of a commodity over the cost of the commodities used to produce it from the previous stage of production. Value added is conceptually equivalent to Gross State Product (GSP).
Earnings: Earnings are the sum of three components of personal income: wage and salary disbursements, supplements to wages and salaries, and proprietor’s income.
Economic Impacts of the 2014 Sundance Film Festival
28 B U R E A U O F E C O N O M I C A N D B U S I N E S S R E S E A R C H
Jobs: Jobs generated using RIMS II include both full-time and part-time workers (counted equally) as well as the self-employed.