Embed Size (px)
Citation preview
The Economic Impact of the Tsunami in Thailand
1Asian Disaster Preparedness Center
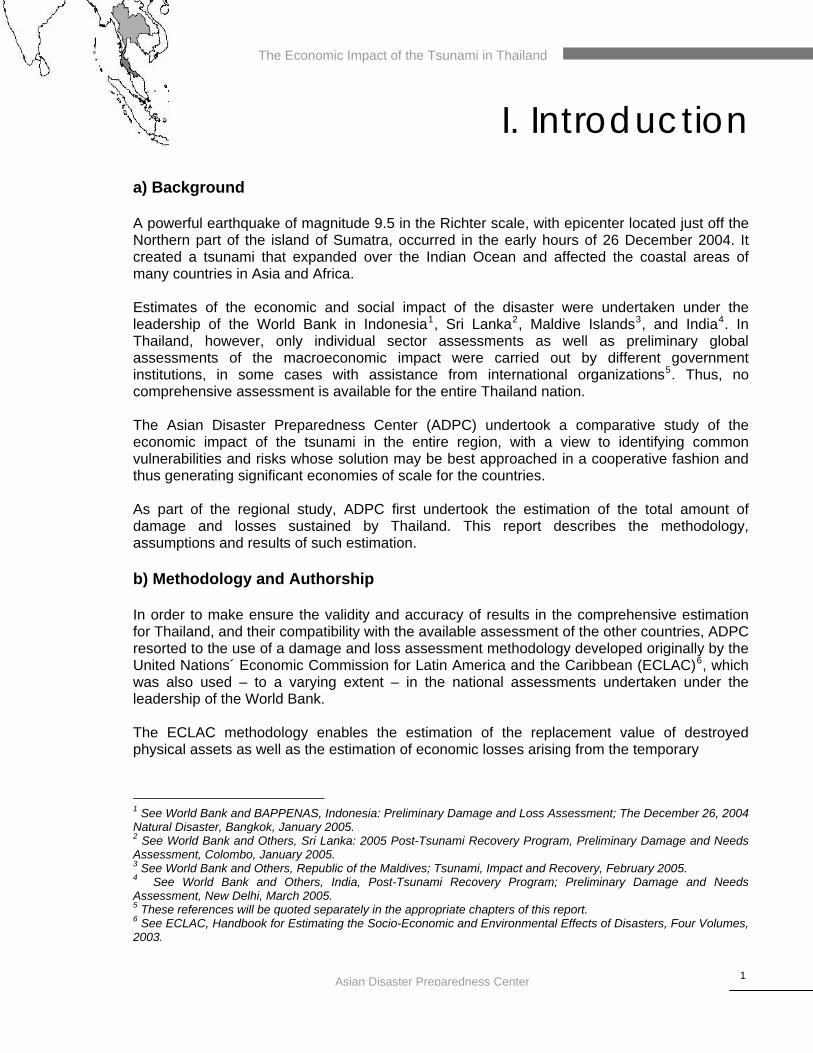
I. Introduction a) Background A powerful earthquake of magnitude 9.5 in the Richter scale, with epicenter located just off the Northern part of the island of Sumatra, occurred in the early hours of 26 December 2004. It created a tsunami that expanded over the Indian Ocean and affected the coastal areas of many countries in Asia and Africa. Estimates of the economic and social impact of the disaster were undertaken under the leadership of the World Bank in Indonesia1, Sri Lanka2, Maldive Islands3, and India4. In Thailand, however, only individual sector assessments as well as preliminary global assessments of the macroeconomic impact were carried out by different government institutions, in some cases with assistance from international organizations5. Thus, no comprehensive assessment is available for the entire Thailand nation. The Asian Disaster Preparedness Center (ADPC) undertook a comparative study of the economic impact of the tsunami in the entire region, with a view to identifying common vulnerabilities and risks whose solution may be best approached in a cooperative fashion and thus generating significant economies of scale for the countries. As part of the regional study, ADPC first undertook the estimation of the total amount of damage and losses sustained by Thailand. This report describes the methodology, assumptions and results of such estimation. b) Methodology and Authorship In order to make ensure the validity and accuracy of results in the comprehensive estimation for Thailand, and their compatibility with the available assessment of the other countries, ADPC resorted to the use of a damage and loss assessment methodology developed originally by the United Nations´ Economic Commission for Latin America and the Caribbean (ECLAC)6, which was also used – to a varying extent – in the national assessments undertaken under the leadership of the World Bank. The ECLAC methodology enables the estimation of the replacement value of destroyed physical assets as well as the estimation of economic losses arising from the temporary
1 See World Bank and BAPPENAS, Indonesia: Preliminary Damage and Loss Assessment; The December 26, 2004 Natural Disaster, Bangkok, January 2005. 2 See World Bank and Others, Sri Lanka: 2005 Post-Tsunami Recovery Program, Preliminary Damage and Needs Assessment, Colombo, January 2005. 3 See World Bank and Others, Republic of the Maldives; Tsunami, Impact and Recovery, February 2005. 4 See World Bank and Others, India, Post-Tsunami Recovery Program; Preliminary Damage and Needs Assessment, New Delhi, March 2005. 5 These references will be quoted separately in the appropriate chapters of this report. 6 See ECLAC, Handbook for Estimating the Socio-Economic and Environmental Effects of Disasters, Four Volumes, 2003.

The Economic Impact of the Tsunami in Thailand
2Asian Disaster Preparedness Center
absence of the assets. The resulting figures are subsequently used to estimate the impact of the disaster on the macro-economic performance of the country. Original information used in the sectoral assessments undertaken by the Government of Thailand as well as by international organizations was collected. In addition, statistical data in regard to sectoral and global development was obtained. These data were processed using the aforementioned ECLAC methodology. Reports were collected from, and/or interviews were held with, inter alia, the following official organizations:
Bank of Thailand Ministry of Finance National Economic and Social Development Board (NESD) Department of Disaster Prevention and Mitigation (DDPM) Tourism Authority of Thailand (TAT) Ministry of Agriculture and Cooperatives (MOAC) Ministry of Education Airports of Thailand (AOT) Department of Highways Provincial Electricity Authority (PEA) Provincial Water Works Authority (PWA) World Bank Food and Agriculture Organization (FAO) World Health Organization (WHO)
For this analysis, as well as for the comparative regional study, ADPC engaged the services of international consultant Roberto Jovel, who led the development and recent updating of the ECLAC methodology. Mr. Jovel has been leading the simplification and adaptation of the methodology to the local conditions of the State of Gujarat, India, under a project financed by the World Bank and executed by ADPC. Mr. Jovel has also prepared this report. ADPC personnel assisted him in the collection and processing of information from primary and secondary sources.
The Economic Impact of the Tsunami in Thailand
3Asian Disaster Preparedness Center
II. The Social Sectors a) Population Affected The waves of the tsunami slammed the coastal areas of the Andaman Sea coastal provinces of Krabi, Trang, Phang Nga, Phuket, Ranong and Satun. Of these, Phang Nga was the hardest hit. The number of deaths and injuries sustained in each province is listed in the following table, as prepared by the Department of Disaster Prevention and Mitigation (DDPM)7.
Table 2-1 Number of Deaths and Injuries Caused by the Tsunami
Number of deaths*
Province Thai Foreign Unknown Total Number of
Injured Krabi 672 435 161 1,268 1,376 Trang 4 2 6 112 Phang Nga 2,654 2,229 997 5,880 5,597 Phuket 398 474 17 889 1,111 Ranong 162 6 4 172 246 Satun 6 6 15 Total 3,896 3,146 1,179 8,221 8,457
Source: Department of Disaster Prevention and Mitigation (DDPM) * The number of missing persons has been added to the number of deaths The above data reveals a very high proportion of foreign nationals that died in the disaster, no doubt due to the large amount of foreigners that visit the resorts and hotels located in the affected area. It is also worth noting that, due to the special characteristics of the disaster, many of the dead have not been identified or reclaimed by their relatives. When the number of households and persons directly affected in their assets is considered, there exists a similar pattern as shown above, in that most affected were the provinces of Phang Nga, Krabi and Phuket, in descending order (See table 2-2 below) 7 See DDPM, Loss Assessment by Tsunami and Earthquake from Provinces (Data as of June 10, 2005).

The Economic Impact of the Tsunami in Thailand
4Asian Disaster Preparedness Center
Table 2-2
Number of People Directly Affected by the Disaster
Number of Directly Affected Province Persons Households
Krabi 15,812 2,759 Trang 1,302 1,123 Phang Nga 19,509 4,394 Phuket 13,065 2,616 Ranong 5,942 1,509 Satun 2,920 414 Total 58,550 12,815
Source: Department of Disaster Prevention and Mitigation (DDPM) b) Housing The waves of the tsunami destroyed or damaged many housing units, their associated domestic infrastructure, and the household goods and equipment contained therein. Many persons were forced to flee and were housed in temporary camps until the reconstruction and repairs can be effected. Estimates were made of the replacement value for the destroyed housing units, and of the repair cost for the damaged homes. Furthermore, the value of the associated tertiary infrastructure and of the household goods and equipment were also estimated. For this, prevailing construction and equipment costs were adopted and adjusted8.
Table 2-4 Estimated Damage to the Housing Sector
Number of
Housing Units* Value of Damage,
Million Baht Province
Destroyed Damaged Reconstruct Repair Household Goods
Total
Krabi 396 262 59.4 18.3 11.6 89.4Trang 34 156 5.1 10.9 2.4 18.4Phang Nga
1,904 604 333.2 51.3 92.3 476.8
Phuket 742 291 152.1 29.1 45.3 226.5Ranong 224 111 33.6 7.8 6.2 47.6Satun 2 80 0.3 5.6 0.9 6.7Total 3,302 1,504 583.7 123.1 158.7 865.5
* Source of housing data: DDPM; Damage estimated made by Consultant.
8 The following average unit costs were adopted: Reconstruction, 150,000 Baht per home in Krabi, Trang, Ranong and Satun; 175,000 Baht in Phang Nga; and 205,000 in Phuket. Repair: 70,000 Baht in Krabi, Trang, Ranong and Satun; 100,000 in Phuket and 85,000 in Phang Nga. The percent value of household goods was 15% in Krabi, Trang, Ranong and Satun; 24% in Phang Nga, and 24% in Phuket.

The Economic Impact of the Tsunami in Thailand
5Asian Disaster Preparedness Center
The total value of damage to the housing sector has been estimated at 865 million Baht, as described in table 2-4 above. c) Education Schools located near the coastal areas sustained total or partial destruction as well as damage to their furniture, equipment and educational material. Classes were suspended for limited period of time, which will be recovered at the end of the school year. It was fortunate that the tsunami occurred during the weekend; otherwise the number of children directly affected would have been significantly higher. According to the Ministry of Education, a total of 5 schools were fully destroyed, and 51 more were slightly damaged. The furniture, equipment and education materials were considerably destroyed. The estimated amount of damage is described in the following table.
Table 2-5 Estimation of Damage in the Education Sector
Number of Schools Damage, in million Baht Province
Destroyed Damaged Bldg Furniture Total Krabi 1 11 44.6 0.5 45.1 Trang 3 2.6 2.6 Phang Nga 3 4 32.8 91.0 123.8 Phuket 5 77.3 33.4 110.7 Ranong 1 10 17.5 9.0 26.5 Satun 18 31.6 31.6 Total 5 19 206.3 133.9 340.2
Source: Ministry of Education e) Health Very limited damage was sustained by the health sector facilities, and they were able to provide the services that were required after the tsunami, and met the increased temporary workload. The sector incurred into post-tsunami expenses for the treatment of psychologically affected persons. It was estimated that a total of 115 million Baht was used to cover post-tsunami activities in the sector.

The Economic Impact of the Tsunami in Thailand
6Asian Disaster Preparedness Center
III. Productive Sectors Damage and losses were sustained by the productive sectors of agriculture and livestock, fisheries and aquaculture, agro-industry, commerce and tourism. a) Agriculture The waves of the tsunami reached agricultural lands located near the coastline of the six affected Provinces. The standing crops were either washed away or negatively affected by the salt content of the water deposited in the soils. Some semi-permanent plantations – such as oil palms and coconut trees – were uprooted by the action of the waves, and will require re-planting. The surface area of each crop affected is given in Table 3-1.
Table 3-1 Agricultural Area Affected by Tsunami in Thailand
Rice Other Crops Plantation Province
Area, Rai
Area, Hectares
Area, Rai
Area, Hectares
Area, Rai
Area, Hectares
Krabi 15 2.4 5 0.8 40 6.4Trang 100 16.0 167 26.7 21 3.4Phang Nga 37 5.9 8,369 1,339.0Phuket 10 1.6 80 12.8Ranong 184 29.4 11 1.8 1,430 228.8Satun 122 19.5 387 61.9Total 468 74.8 183 29.3 10,327 1,652.3
Source: Ministry of Agriculture and Cooperatives (MOAC) and FAO The resulting impact on production includes the loss of the standing crops, as well as reductions in productivity the following two years, especially in the case of the most salt-sensitive crops and plantations. In addition, the cost of replanting oil palm plantations that were uprooted must be taken into consideration. Estimates of the value of the standing annual and plantation crops that were destroyed by the tsunami were made based on the extent of the area affected (See table 3-1), and average unit yields and average unit prices taken from the agricultural statistics yearbook9. It was assumed that future production in these soils in 2005 would be diminished by 10% from their average values, due to the residual salt content. In the case of plantations, the value of damage and losses was estimated as the cost of replanting 18% of their affected area10; the value of standing production at the time of the disaster and a reduction of 10% in future production in 2005 and 2006 due to salinity; and the production that would not be obtained in two years until the replanted trees reach maturity. 9 See Office of Agricultural Information, Agricultural Statistics of Thailand, 2003 and 2004, Ministry of Agriculture and Co-operatives, Bangkok. 10 An average cost of replanting of US$ 25,000 per hectare was assumed for these estimations.
The Economic Impact of the Tsunami in Thailand
7Asian Disaster Preparedness Center
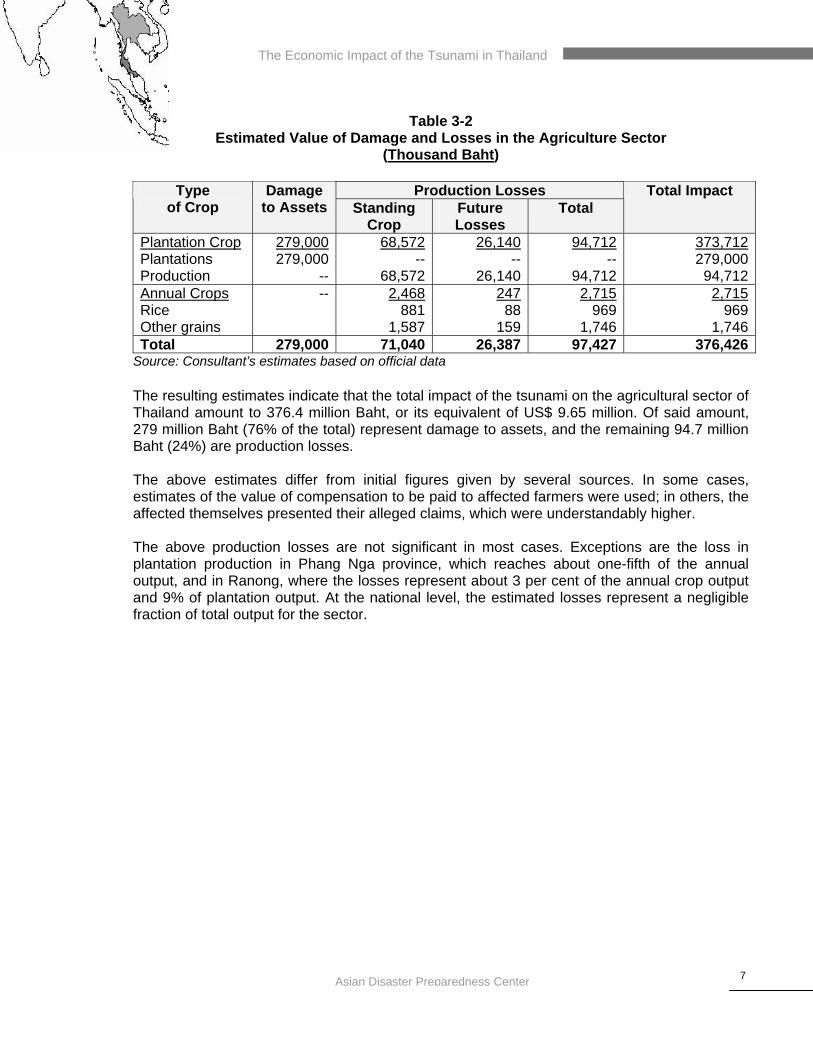
Table 3-2
Estimated Value of Damage and Losses in the Agriculture Sector (Thousand Baht)
Production Losses Type
of Crop Damage
to Assets Standing Crop
Future Losses
Total Total Impact
Plantation Crop Plantations Production
279,000279,000
--
68,572--
68,572
26,140--
26,140
94,712 --
94,712
373,712279,000
94,712Annual Crops Rice Other grains
-- 2,468881
1,587
24788
159
2,715 969
1,746
2,715969
1,746Total 279,000 71,040 26,387 97,427 376,426
Source: Consultant’s estimates based on official data The resulting estimates indicate that the total impact of the tsunami on the agricultural sector of Thailand amount to 376.4 million Baht, or its equivalent of US$ 9.65 million. Of said amount, 279 million Baht (76% of the total) represent damage to assets, and the remaining 94.7 million Baht (24%) are production losses. The above estimates differ from initial figures given by several sources. In some cases, estimates of the value of compensation to be paid to affected farmers were used; in others, the affected themselves presented their alleged claims, which were understandably higher. The above production losses are not significant in most cases. Exceptions are the loss in plantation production in Phang Nga province, which reaches about one-fifth of the annual output, and in Ranong, where the losses represent about 3 per cent of the annual crop output and 9% of plantation output. At the national level, the estimated losses represent a negligible fraction of total output for the sector.
The Economic Impact of the Tsunami in Thailand
8Asian Disaster Preparedness Center
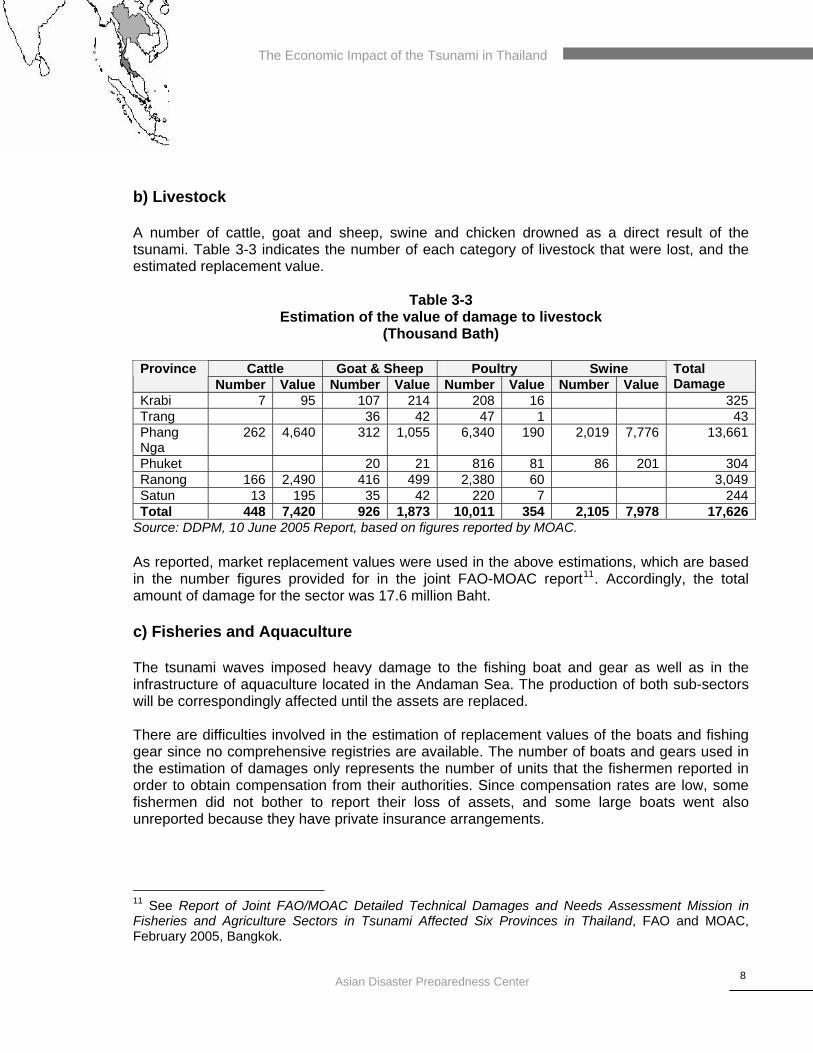
b) Livestock A number of cattle, goat and sheep, swine and chicken drowned as a direct result of the tsunami. Table 3-3 indicates the number of each category of livestock that were lost, and the estimated replacement value.
Table 3-3
Estimation of the value of damage to livestock (Thousand Bath)
Cattle Goat & Sheep Poultry Swine Province
Number Value Number Value Number Value Number ValueTotal Damage
Krabi 7 95 107 214 208 16 325Trang 36 42 47 1 43Phang Nga
262 4,640 312 1,055 6,340 190 2,019 7,776 13,661
Phuket 20 21 816 81 86 201 304Ranong 166 2,490 416 499 2,380 60 3,049Satun 13 195 35 42 220 7 244Total 448 7,420 926 1,873 10,011 354 2,105 7,978 17,626
Source: DDPM, 10 June 2005 Report, based on figures reported by MOAC. As reported, market replacement values were used in the above estimations, which are based in the number figures provided for in the joint FAO-MOAC report11. Accordingly, the total amount of damage for the sector was 17.6 million Baht. c) Fisheries and Aquaculture The tsunami waves imposed heavy damage to the fishing boat and gear as well as in the infrastructure of aquaculture located in the Andaman Sea. The production of both sub-sectors will be correspondingly affected until the assets are replaced. There are difficulties involved in the estimation of replacement values of the boats and fishing gear since no comprehensive registries are available. The number of boats and gears used in the estimation of damages only represents the number of units that the fishermen reported in order to obtain compensation from their authorities. Since compensation rates are low, some fishermen did not bother to report their loss of assets, and some large boats went also unreported because they have private insurance arrangements. 11 See Report of Joint FAO/MOAC Detailed Technical Damages and Needs Assessment Mission in Fisheries and Agriculture Sectors in Tsunami Affected Six Provinces in Thailand, FAO and MOAC, February 2005, Bangkok.
The Economic Impact of the Tsunami in Thailand
9Asian Disaster Preparedness Center
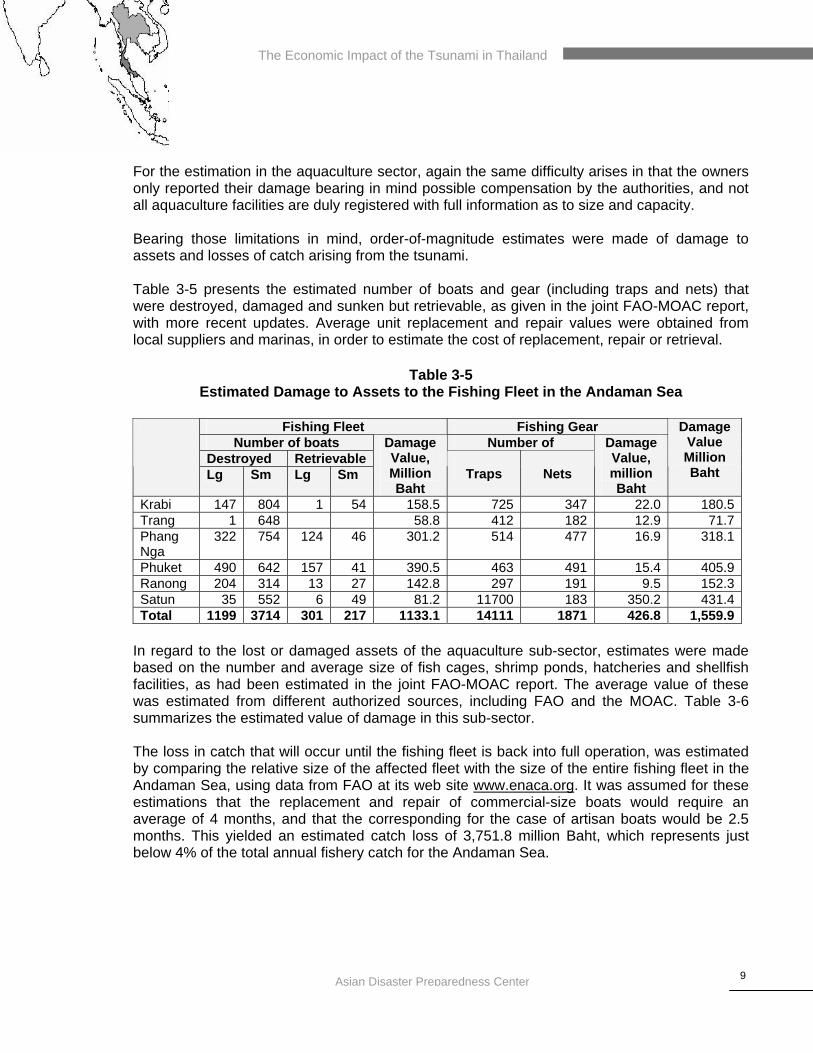
For the estimation in the aquaculture sector, again the same difficulty arises in that the owners only reported their damage bearing in mind possible compensation by the authorities, and not all aquaculture facilities are duly registered with full information as to size and capacity. Bearing those limitations in mind, order-of-magnitude estimates were made of damage to assets and losses of catch arising from the tsunami. Table 3-5 presents the estimated number of boats and gear (including traps and nets) that were destroyed, damaged and sunken but retrievable, as given in the joint FAO-MOAC report, with more recent updates. Average unit replacement and repair values were obtained from local suppliers and marinas, in order to estimate the cost of replacement, repair or retrieval.
Table 3-5 Estimated Damage to Assets to the Fishing Fleet in the Andaman Sea
Fishing Fleet Fishing Gear
Number of boats Number of Destroyed Retrievable
Lg Sm Lg Sm
Damage Value, Million Baht
Traps
Nets
Damage Value, million Baht
Damage Value Million Baht
Krabi 147 804 1 54 158.5 725 347 22.0 180.5Trang 1 648 58.8 412 182 12.9 71.7Phang Nga
322 754 124 46 301.2 514 477 16.9 318.1
Phuket 490 642 157 41 390.5 463 491 15.4 405.9Ranong 204 314 13 27 142.8 297 191 9.5 152.3Satun 35 552 6 49 81.2 11700 183 350.2 431.4Total 1199 3714 301 217 1133.1 14111 1871 426.8 1,559.9
In regard to the lost or damaged assets of the aquaculture sub-sector, estimates were made based on the number and average size of fish cages, shrimp ponds, hatcheries and shellfish facilities, as had been estimated in the joint FAO-MOAC report. The average value of these was estimated from different authorized sources, including FAO and the MOAC. Table 3-6 summarizes the estimated value of damage in this sub-sector. The loss in catch that will occur until the fishing fleet is back into full operation, was estimated by comparing the relative size of the affected fleet with the size of the entire fishing fleet in the Andaman Sea, using data from FAO at its web site www.enaca.org. It was assumed for these estimations that the replacement and repair of commercial-size boats would require an average of 4 months, and that the corresponding for the case of artisan boats would be 2.5 months. This yielded an estimated catch loss of 3,751.8 million Baht, which represents just below 4% of the total annual fishery catch for the Andaman Sea.

The Economic Impact of the Tsunami in Thailand
10Asian Disaster Preparedness Center
Table 3-6 Estimated Damage to Assets in the Aquaculture Sub-Sector
(Million Baht)
Province Fish Cages Shrimp Ponds
Shellfish Hatcheries Total Value
Krabi 124.3 9.7 1.9 135.9Trang 42.0 0.3 42.3Phang Nga 155.8 9.0 25.0 125.4 315.1Phuket 120.2 3.1 32.0 20.0 175.4Ranong 171.8 0.9 3.6 176.3Satun 179.6 15.1 194.6Total 793.7 22.6 77.9 145.4 1,039.6
The estimation of production losses in aquaculture assumed that a period of 5 to 6 months would be required for full restoration of infrastructure and facilities. Average unit production values for each type of culture were used in combination with the surface area of destroyed or damaged assets to estimate the total value of lost production. A total value of 130.1 million Baht was estimated for the affected provinces, which represent slightly less than 1.5% of the national aquaculture production. Thus, the total estimated impact of the tsunami in the fishery and aquaculture sector of the affected provinces is 6,481 million Baht, 40% of which (2,560 million) are damage to assets and the remaining 60% (3,882 million) are losses in production for the rest of the present year. See table 3-7 below.
Table 3-7 Summary of Estimated Damage and Losses
in the Fishery and Aquaculture Sector
Impact, million Baht Damage to assets 2,599.5 Production losses 3,881.9 Total impact 6,481.2
In this case again, the estimated value of impact for the fisheries and aquaculture sector differs from previous estimates. Reasons for such differences include, inter alia, the fact that more detailed estimates of aquaculture production were made on the basis of more recent information; the fact that an analysis of marine fishery production was included in the estimates using data for the Andaman Sea fleet and production.

The Economic Impact of the Tsunami in Thailand
11Asian Disaster Preparedness Center
d) Agro-Based Industry and Commerce Due to the losses in primary production of agriculture and fishery, subsequent losses will occur in the processing industries and commerce that are the forward links of the production chain. Based on a comparison of producer, wholesale and retail prices of the affected commodities12, an order-of-magnitude estimate was made of the added value involved in these losses. These added-value figures were combined with the volumes of primary losses of the affected products, after discounting the volumes retained by producers for their own consumption, in order to arrive at losses in the agro-industrial processing and marketing sub-sectors.
12 Prices were obtained from the MOAC´s Agricultural Statistics of Thailand for 2003, as well as from the Bank of Thailand’s Domestic and World Prices of Certain Commodities tables. Additional information on price level structure from nearby countries was also utilized.

The Economic Impact of the Tsunami in Thailand
12Asian Disaster Preparedness Center
Table 3-8
Estimated Losses in Agro-Based Industry and Commerce
Estimated Value of Loss, million Baht Primary
Production Agro-Industry Agro-Commerce
Rice 0.9 0.6 0.2 Other annual crops 1.2 0.2 0.1 Plantation crops 90.0 90.0 45.0 Fish 3,128.5 2,033.5 1,407.8 Shrimp 63.9 57.5 25.6 Total 3,284.5 2,181.8 1,478.7
These estimates yield a loss of 2,182 and 1,479 million Baht for the agro-related industry and commerce sub-sectors, respectively. It is to be noted that in previous damage and loss estimates, the impact on these sectors had not been included. e) Tourism In terms of tourism, the six affected provinces are of significance for Thailand as in 2004 they generated 17% of total tourism revenues in the entire nation. The affected area has a total of 1,130 hotels with a total of 40,272 rooms. Assets were destroyed and damaged by the direct action of the tsunami, and hotel occupancy rates dropped considerable thereafter in the six affected provinces, generating significant losses to the sector. The Tourism Authority of Thailand (TAT) reported at the end of January that some 328 hotels (24% of the total room capacity) in the affected provinces were either destroyed or damaged. The estimated replacement value of the hotel infrastructure, and of the furniture and other goods contained therein, as well as in other tourism-related commercial facilities (stalls, shops and restaurants)13, are summarized in the table below.
13 The figures of affected number of hotels and related commercial facilities are taken from the DDPM report titled Loss Assessment by Tsunami and Earthquake from Provinces (Data as of June 10, 2005). Adjustments were made to unit values of damage, and to account for furniture and other goods within the affected facilities.

The Economic Impact of the Tsunami in Thailand
13Asian Disaster Preparedness Center
Table 3-9
Estimated replacement and repair value of tourism facilities in the affected area (Million Baht)
Hotels and Resorts Other Commerce
# Bldgs Goods Damage # Bldgs Goods Damage Total
Krabi 131
3,256.9 473.7 3,730.6 984 13.4 3.6 17.0 3,747.6
Trang 4 150.0 24.0 174.0 142 1.3 0.2 1.5 175.5 Phang Nga
93 5,953.0 340.2 6,283.1 858 20.4 4.9 25.3 6.616.1
Phuket 100
3,170.9 637.8 6,590.8 2,858 367.6 103.3 470.9 4,103.0
Ranong 2 4.4 0.6 5.0 62 0.8 0.2 1.0 6.1 Satun Total 32
8 12,535.2 1,597.8 14,132.6 4,904 403.5 112.2 515.7 14,648.3
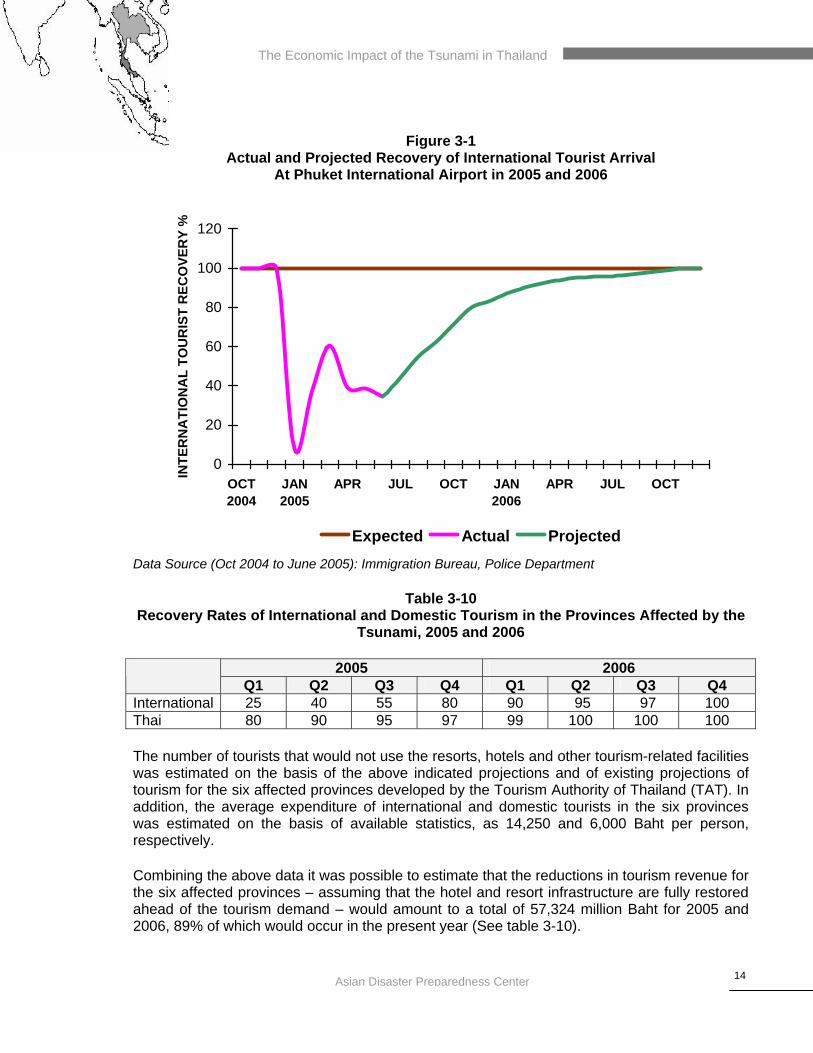
Losses of revenue for the sector due to the drop in tourist arrivals, both international and domestic, were estimated on the basis of actual statistics through June 2005 and projections for the rest of the year and for 2006. Separate estimations were made for international and domestic tourism as they have behaved differently; international tourists are recovering at a slow pace, due to the uncertainty of available hotel facilities and remaining fear of the tsunami, while Thailand tourists are arriving in the affected areas with higher recovery rates. Available data for the six affected provinces show that recovery of international tourist arrivals occurred at a relatively fast rate in the first quarter of 2005, and that recovery rates slowed down in the second quarter (See figure 3-1, where data on international arrival of tourists at Phuket International Airport are displayed). Domestic tourists arrivals, on the other hand, have recovered at faster and sustained rates. On the basis of the observed recovery trends, it was concluded that it would not be until the fourth quarter of 2006 when international tourism would achieve pre-disaster levels. For the analysis, the schedule of recovery indicated in table 3-10 was adopted.
The Economic Impact of the Tsunami in Thailand
14
Figure 3-1 Actual and Projected Recovery of International Tourist Arrival
At Phuket International Airport in 2005 and 2006
0
20
40
60
80
100
120
OCT2004
JAN2005
APR JUL OCT JAN2006
APR JUL OCT
INTE
RN
ATI
ON
AL
TOU
RIS
T R
ECO
VER
Y %
Expected Actual Projected
Data Source (Oct 2004 to June 2005): Immigration Bureau, Police Department
Table 3-10 Recovery Rates of International and Domestic Tourism in the Provinces Affected by the
Tsunami, 2005 and 2006
2005 2006 Q1 Q2 Q3 Q4 Q1 Q2 Q3 Q4
International 25 40 55 80 90 95 97 100 Thai 80 90 95 97 99 100 100 100 The number of tourists that would not use the resorts, hotels and other tourism-related facilities was estimated on the basis of the above indicated projections and of existing projections of tourism for the six affected provinces developed by the Tourism Authority of Thailand (TAT). In addition, the average expenditure of international and domestic tourists in the six provinces was estimated on the basis of available statistics, as 14,250 and 6,000 Baht per person, respectively. Combining the above data it was possible to estimate that the reductions in tourism revenue for the six affected provinces – assuming that the hotel and resort infrastructure are fully restored ahead of the tourism demand – would amount to a total of 57,324 million Baht for 2005 and 2006, 89% of which would occur in the present year (See table 3-10).
Asian Disaster Preparedness Center
The Economic Impact of the Tsunami in Thailand
15Asian Disaster Preparedness Center
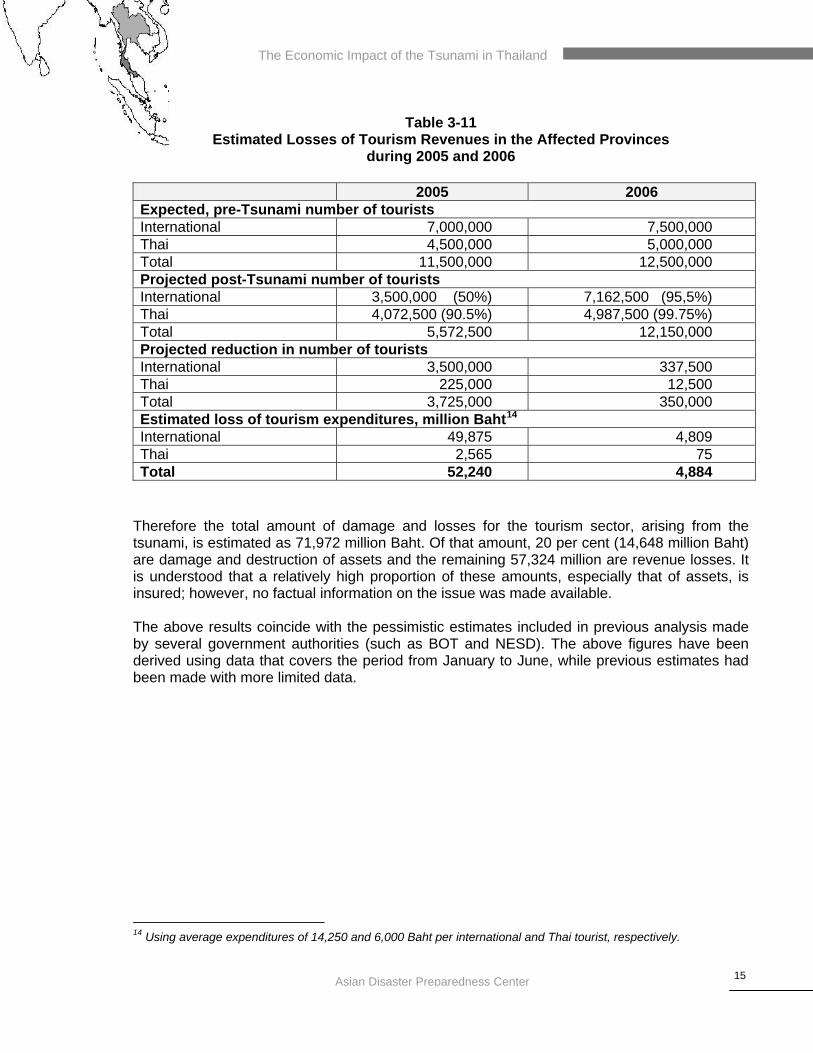
Table 3-11
Estimated Losses of Tourism Revenues in the Affected Provinces during 2005 and 2006
2005 2006 Expected, pre-Tsunami number of tourists International 7,000,000 7,500,000 Thai 4,500,000 5,000,000 Total 11,500,000 12,500,000 Projected post-Tsunami number of tourists International 3,500,000 (50%) 7,162,500 (95,5%) Thai 4,072,500 (90.5%) 4,987,500 (99.75%) Total 5,572,500 12,150,000 Projected reduction in number of tourists International 3,500,000 337,500 Thai 225,000 12,500 Total 3,725,000 350,000 Estimated loss of tourism expenditures, million Baht14
International 49,875 4,809 Thai 2,565 75 Total 52,240 4,884
Therefore the total amount of damage and losses for the tourism sector, arising from the tsunami, is estimated as 71,972 million Baht. Of that amount, 20 per cent (14,648 million Baht) are damage and destruction of assets and the remaining 57,324 million are revenue losses. It is understood that a relatively high proportion of these amounts, especially that of assets, is insured; however, no factual information on the issue was made available. The above results coincide with the pessimistic estimates included in previous analysis made by several government authorities (such as BOT and NESD). The above figures have been derived using data that covers the period from January to June, while previous estimates had been made with more limited data.
14 Using average expenditures of 14,250 and 6,000 Baht per international and Thai tourist, respectively.

The Economic Impact of the Tsunami in Thailand
16Asian Disaster Preparedness Center
IV. Infrastructure
Physical infrastructure and utility systems were destroyed or damaged by the tsunami in the six affected provinces. The estimations for both damage and associated losses are described below. a) Electricity A total of 69 electrical subsystems were affected. Their combined value of replacement and repair has been estimated as 172.5 million Baht15. In the absence of detailed sales data for the affected provinces, an indirect procedure was used to estimate the value of the reduction in electricity sales that will arise from the absence of tourism. Thus, data from the estimated reduction in total tourists arrival was taken from the appropriate section of this report. A daily electricity use of 7.5 KWh per person was assumed for the estimations, based on the average national use of 1,621 KWh per person for Thailand16, and taking the upper bracket of consumption for the tourist areas. An average electricity rate of 2.5 Baht per KWh was adopted17. Thus, losses of revenue of 352.2 and 32.3 million Baht were estimated for 2005 and 2006, respectively, yielding a total revenue loss of 384.5 million Baht for the Provincial Electrical Authority (PEA). The latter represents less than 0.5% of PEA’s annual electricity sales.18
b) Water Supply Nineteen water supply systems were damaged in different components. It was estimated that their replacement or repair value was 24.0 million Baht19. Since no detailed information was available in regard to drop in water sales, the same indirect procedure – as in the case of electricity – was used to estimate reduction of water sales due to the tsunami. A daily per capita consumption rate of 300 liters was adopted for the estimates, typical of the climate and upscale tourism environment. An average water rate of 2.1 Satang/liter was used20. Losses of revenue were then estimated as 118.3 and 10.9 million Baht for 2005 and 2006, respectively, or a total revenue loss for the utility of 129.2 million Baht. This loss figure represents less than 2% of the value of total annual sales for PWA.
15 The value of damage to electrical subsystems was directly taken from the DDPM report titled Loss Assessment by Tsunami and Earthquake from Provinces (Data as of June 10, 2005). 16 This information was taken from the web site www.nationmaster.com. 17 This information was taken from Annual Report 2003, Provincial Electricity Authority, Bangkok, Thailand, 2004. 18 A recent communication received from the Director of the Administration Department of PEA indicated that electricity sales for the first half of 2005 have dropped by 0.5%, in comparison to the previous year. 19 The value of damage to water supply systems was also taken from the DDPM report titled Loss Assessment by Tsunami and Earthquake from Provinces (Data as of June 10, 2005). 20 This is the rate charged to large businesses, according to the Provincial Waterworks Authority web site, at http://www.pwa.co.th/english/tariff_rates.htm.

The Economic Impact of the Tsunami in Thailand
17Asian Disaster Preparedness Center
c) Transport and Communications The transport and communications infrastructure was destroyed and damaged, and revenues from their operations have dropped. Main and rural roads, bridges and their ancillary drainage structures were destroyed and damaged to varying degrees; the value of such damage was taken from the DDPM report dated 10 June 2005, which draws from data from the relevant sector organizations, and was verified and supplemented with information received from the Highways Departments21. The international airports operated by Airports of Thailand (AOT) sustained minor infrastructure damage, but their revenues dropped in accordance with the reduced number of tourist arrivals and of landings by airplanes22. Damage to telecommunications facilities was limited23. No estimate of increased road transport costs was made, as no sufficient data was available. No estimate was made of lower revenues for the telecommunications sector, but they are expected to be low. The total impact on the transport and communications sector was estimated as 632 million Baht, of which 289 million refer to damage to assets (46 per cent) and the remaining 343 million (54%) are losses of revenue. See table 4-1.
Table 4-1
Damage and Losses in the Transport and Communications Sector (Million Baht)
Damage Losses Total Transport Roads Bridges Drainage works Airports
235.1 186.9 41.6 2.6 4.0
343.3 …
343.3
578.4 186.9 41.6 2.6
347.3 Telecommunications 53.6 … 53.6 Total 288.7 343.3 632.0
d) Other infrastructure The DDPM June report lists damage to several types of miscellaneous physical infrastructure, including piers, dams and retaining walls, buildings and others. The total value of replacement or repair of these physical facilities was estimated as 593 million Baht. 21 Communications received from Department of Highways (28 July 2005) and from Department of Rural Roads (5 August 2005). 22 According to a communication from the Director, Budget Division, Planning Section, OAT, 3 August, 2005. 23 The value of damage to telephone systems was directly taken from the DDPM report titled Loss Assessment by Tsunami and Earthquake from Provinces (Data as of June 10, 2005).

The Economic Impact of the Tsunami in Thailand
18Asian Disaster Preparedness Center
e) Summary Results of the estimation of the impact of the tsunami on infrastructure, as described briefly before, indicate a total impact of 1,919 million Baht, of which 1,062 million (55 per cent) are damage to assets and 857 million refer to revenue losses (45%). The estimated figures are given in table 4-2 below.
Table 4-2 Summary of Damage and Losses in Infrastructure
(Million Baht)
Damage Losses Total Water Supply 24.0 129.2 153.2 Electricity 172.6 384.5 557.1 Transport and Communications
288.7 343.3 632.0
Other infrastructure 576.5 … 576.5 Total 1,061.6 857.0 1,918.6

The Economic Impact of the Tsunami in Thailand
19Asian Disaster Preparedness Center
IV. Summary of Disaster Impact a) National Impact An aggregation of the individual sector estimates presented in the preceding sections of the report indicates that the total impact (Measured in terms of the amount of damage and losses) caused by the tsunami in Thailand is 85,747 million Baht, or its equivalent of US$ 2,199 million24. This makes Thailand the second most affected country by the tsunami. The magnitude of the disaster for the Thai economy can be visualized when comparing the total impact to the national GDP. Such comparison yields a value of 1.3 per cent. This implies that the impact of the disaster is not too great and that the national economy should be able to absorb it with relative ease.25 Nevertheless, the economies of the local communities affected will be very significant, and will certainly require central government assistance for their recovery. Total impact can be broken down into its components of damage and losses, as follows:
Value, Million Baht
% of total impact
Damage 19,811 23.1 Losses 65,936 76.9
The distribution of total impact among its components in the case of Thailand makes the country a unique case in this disaster since losses exceed damage by a ratio of 3 to 1. This feature reveals the high vulnerability and exposure of productive activities in the affected region, with special reference to tourism as will be discussed later on. In addition, the above figures are useful in that the amount of damage is representative of the value of lost or destroyed assets that must be replaced. And the amounts of losses are in fact reductions in production that will arise in 2005 and 2006 as a result of the disaster. The amount of damage represents 1.3% of the annual rate of capital formation for the country, and can be considered a cost of opportunity for normal socio-economic development, since financial resources will have to be assigned for the replacement of assets that were already in place, at much higher unit prices, and will thus prevent or defer the solution of other developmental needs. The amount of losses represents slightly less than 1% of gross domestic product and, when converted into value added, will provide an indication of the reduction of GDP that will result as an effect of the disaster. Most damage and losses are to be sustained by the private sector. This is especially in the case of the large private enterprises of the tourism and fisheries sector that are usually well insured, and should be able to rebound with relative ease. However, there exist a large number of individuals that have lost both assets and livelihood, and who have no means of recovering 24 A uniform exchange rate of 39 Baht/US$ has been used throughout in this report, as the one that prevailed when the disaster occurred. 25 International experience shows that when the impact/GDP ratio is above 8%, the magnitude can be considered moderate; and that when it exceeds 40&, the affected economy will face significant difficulties for recovery.
The Economic Impact of the Tsunami in Thailand
20Asian Disaster Preparedness Center
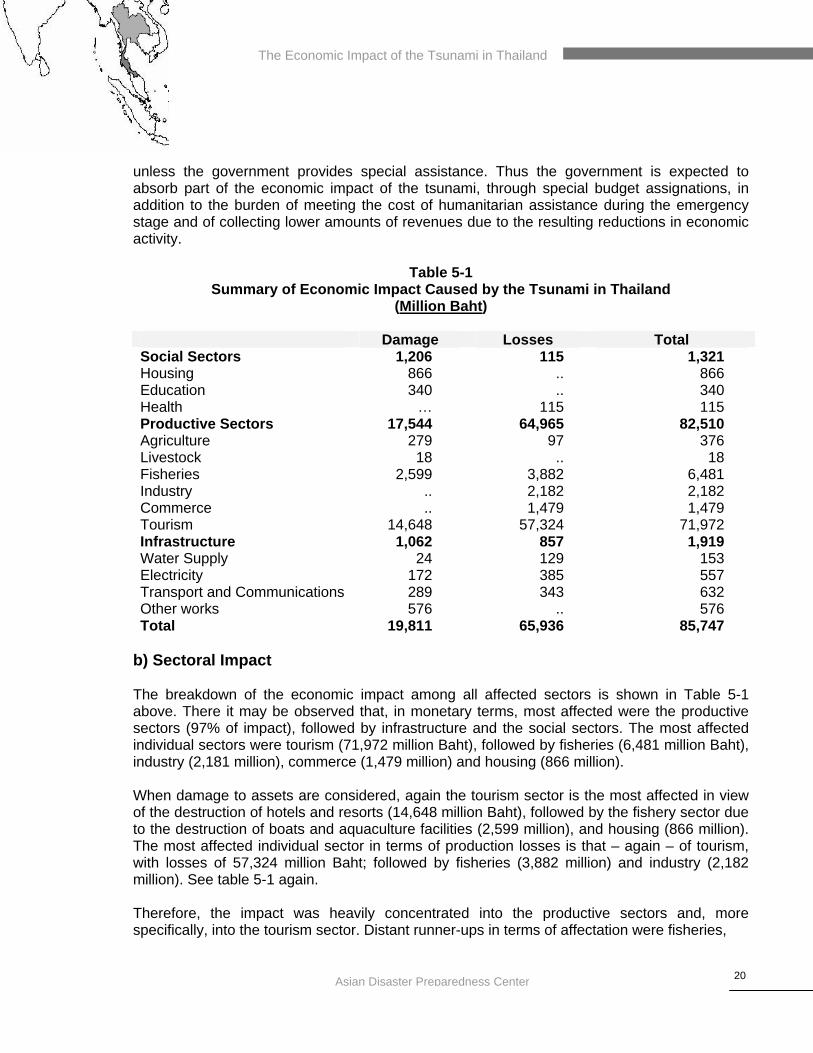
unless the government provides special assistance. Thus the government is expected to absorb part of the economic impact of the tsunami, through special budget assignations, in addition to the burden of meeting the cost of humanitarian assistance during the emergency stage and of collecting lower amounts of revenues due to the resulting reductions in economic activity.
Table 5-1 Summary of Economic Impact Caused by the Tsunami in Thailand
(Million Baht) Damage Losses Total Social Sectors Housing Education Health
1,206 866 340
…
115 .. ..
115
1,321 866 340 115
Productive Sectors Agriculture Livestock Fisheries Industry Commerce Tourism
17,544 279 18
2,599 .. ..
14,648
64,965 97 ..
3,882 2,182 1,479
57,324
82,510 376 18
6,481 2,182 1,479
71,972 Infrastructure Water Supply Electricity Transport and Communications Other works
1,062 24
172 289 576
857 129 385 343
..
1,919 153 557 632 576
Total 19,811 65,936 85,747 b) Sectoral Impact The breakdown of the economic impact among all affected sectors is shown in Table 5-1 above. There it may be observed that, in monetary terms, most affected were the productive sectors (97% of impact), followed by infrastructure and the social sectors. The most affected individual sectors were tourism (71,972 million Baht), followed by fisheries (6,481 million Baht), industry (2,181 million), commerce (1,479 million) and housing (866 million). When damage to assets are considered, again the tourism sector is the most affected in view of the destruction of hotels and resorts (14,648 million Baht), followed by the fishery sector due to the destruction of boats and aquaculture facilities (2,599 million), and housing (866 million). The most affected individual sector in terms of production losses is that – again – of tourism, with losses of 57,324 million Baht; followed by fisheries (3,882 million) and industry (2,182 million). See table 5-1 again. Therefore, the impact was heavily concentrated into the productive sectors and, more specifically, into the tourism sector. Distant runner-ups in terms of affectation were fisheries,

The Economic Impact of the Tsunami in Thailand
21Asian Disaster Preparedness Center
industry and commerce. As indicated before, this sectoral breakdown of damage and losses indicates the high vulnerability and exposure of the productive activities located in the affected region. This is very clearly the case of tourism activities, but of other sectors such as fisheries, and food-based industries and commerce as well. c) Spatial Distribution of Impact An examination of the spatial distribution of impact reveals that damage and losses were concentrated in Phuket, Krabi and Phang Nga, in order of decreasing importance, while the other three provinces sustained much lower impacts (See table 5-2 below).
Table 5-2 Summary of Impact in Affected Provinces
(Million Baht)
Province GPP (2004)
Damage Losses Total Impact
Impact/GPP
Krabi 28,588 4,414 15,238 19,652 69 Trang 40,174 315 2,097 2,412 6 Phang Nga 20,281 8,523 5,249 13,772 68 Phuket 51,984 5,405 41,423 46,827 90 Ranong 11,570 483 1,393 1,876 16 Satun 19,794 672 546 1,218 6 Total 172,391 19,811 65,936 85,747 50
The true measure of the spatial distribution of impact can be visualized, however, when considering the magnitude of the disaster in each province, as indicated in the last column of table 5-2. For the entire affected region, the magnitude of the impact is equivalent to one half of the combined gross provincial product (GPP), a very high ratio that indicates that the affected area cannot easily overcome by itself the situation arising from the disaster. Thus, the need for central government assistance is evident, especially in the case of Phuket (where the magnitude equals to 90% of GPP), Krabi and Phang Nga (magnitude of around 70%). While most of the impact falls in the private sector domain and there seems to be insurance involved, the recovery of the entire affected area will require some intervention by the government, as the livelihood of many persons belonging to the lower income strata has been compromised and there seems to exist a relatively high degree of under-insurance.

The Economic Impact of the Tsunami in Thailand
22Asian Disaster Preparedness Center
d) Impact on Economic Performance On the basis of the estimated value of losses arising from the disaster, preliminary projections of the disaster impact on GDP growth have been made. Before the disaster occurred, Thailand economic authorities expected that in 2005 GDP would grow at a rate of 6 per cent, down 0.1% from the previous year’s rate. When the value added of the estimated losses for the disaster is subtracted from the forecasted GDP, a growth rate of 5.5% is obtained for 2005. That is to say, the losses caused exclusively by the disaster would result in a 0.5% reduction in economic growth for the country26. The above estimated reduction in GDP growth should be partially compensated by the positive impact of reconstruction and economic recovery efforts of the government and the private sector. In this regard it is understood that the government has made special budget appropriations to assist and compensate the affected persons and small and medium enterprises. It is also known that there is insurance involved in the large private sector enterprises. However, at the time in which this report was prepared, no comprehensive information was available concerning the rate of public sector disbursements made to date. In addition, there are some reports indicating that there was considerable underinsurance in the large enterprises, that insurance payments are slow in coming, and that there have been delays in replacing and repairing some public infrastructure in tourism areas. These facts would have a bearing on the final rate of investment for the current year, and may even result in the transferring of investment to 2006. Once the actual figures are known in this regard, it will be possible to estimate the net effect of the disaster on economic growth for the country in 2005. The impact of damage and losses caused by the disaster on the fiscal budget and on the balance of payments and trade can be derived from the estimates presented here, although it is expected to be limited.
26 This does not take into consideration the reductions in economic growth that may be caused by rising international prices of oil.