Embed Size (px)
Citation preview

8/8/2019 The Economic and Fiscal Impacts of Connecticut’s Film Tax Credit
http://slidepdf.com/reader/full/the-economic-and-fiscal-impacts-of-connecticuts-film-tax-credit 1/64
The Economic and Fiscal Impacts of
Connecticut’s Film Tax Credit
DEPARTMENT OF ECONOMIC AND COMMUNITY
DEVELOPMENT
Prepared for the Connecticut Commission on Culture and Tourism
February 2008

8/8/2019 The Economic and Fiscal Impacts of Connecticut’s Film Tax Credit
http://slidepdf.com/reader/full/the-economic-and-fiscal-impacts-of-connecticuts-film-tax-credit 2/64
Authored By:
Stanley McMillen, Ph.D.
Kathryn Parr
Troy Helming
Research Assistance By:
Selini Katsaiti

8/8/2019 The Economic and Fiscal Impacts of Connecticut’s Film Tax Credit
http://slidepdf.com/reader/full/the-economic-and-fiscal-impacts-of-connecticuts-film-tax-credit 3/64
Table of Contents
EXECUTIVE SUMMARY .........................................................................................................i INTRODUCTION.....................................................................................................................1 BACKGROUND......................................................................................................................1
The U.S. Film Industry.......................................................................................................2 Connecticut’s Film Industry .............................................................................................5 The General Structure of Film Production Tax Incentives ............................................8 Connecticut’s Film Production Tax Credit....................................................................12
FILM PRODUCTION INCENTIVE STUDIES........................................................................13 Manitoba Province (Canada) ..........................................................................................13 British Colombia Province (Canada) .............................................................................16 New York ..........................................................................................................................17 Louisiana..........................................................................................................................19
THE ECONOMIC AND FISCAL IMPACTS OF FILM PRODUCTION IN CONNECTICUT..21 Economic Impact Method ...............................................................................................26
ECONOMIC IMPACT RESULTS..........................................................................................32 CONCLUSION......................................................................................................................39 APPENDIX A: THE REMI MODEL.......................................................................................41 APPENDIX B: U.S. FILM PRODUCTION INCENTIVES......................................................51

8/8/2019 The Economic and Fiscal Impacts of Connecticut’s Film Tax Credit
http://slidepdf.com/reader/full/the-economic-and-fiscal-impacts-of-connecticuts-film-tax-credit 4/64
i
EXECUTIVE SUMMARY
PA 06-172, codified as Section 12-217jj of the Connecticut General Statutes, mandated
that the Connecticut Commission on Culture and Tourism (CCT) report to the legislature
on the economic and fiscal impacts of the state’s film tax credit program. CCT
requested the Department of Economic and Community Development (DECD) to
perform the study to evaluate these impacts. The study period is July 1, 2006 through
September 30, 2007 during which thirteen productions filed final applications seeking the
issuance of tax credits from the Commission.1 In July 2007, the legislature expanded
and refined the scope of the film tax credit. The current analysis does not reflect the
impact of these legislative changes. Productions that applied for the credit certificate on
which CCT had to issue credits by September 30, 2007 are included in this report.
Several other films were in various stages of production during the study period and their
contribution to the Connecticut economy does not reflect in this study. There were thirty
film productions in process during the study period incurring $282 million in expenditures
in Connecticut that will claim $86 million in credits over the next year or so. This
spending is more than five times the spending driving the impact estimated in the current
study.
Film productions receiving their credit under the original film tax credit program duringFY 2007 generate a modest impact on the Connecticut economy. In the study period,
Connecticut’s film tax credit program stimulated:
• $55.1 million in film production spending that generates;
• $20.72 million in new real gross state product (RGSP) and adds;
• 395 full time equivalent (FTE) jobs and generates;
1The Connecticut legislature repealed Section 12-217jj of the general statues July 1, 2007 and replaced it
with Public Act 07-236 (effective January 1, 2008) that expands the type of production qualifying for the taxcredit, stiffens the reporting requirements, and penalizes production companies for fraudulent claims. Priorlaw required a company to apply for a production tax credit eligibility certificate within 90 days after incurringits first production expense. Then, no later than 90 days after incurring its last expense, it had to apply forthe actual credit certificate on which CCT had to enter a credit amount. The study period therefore includesproductions completing this process and filing an audit report during state FY 2007. The text of PA 07-236appears at http://www.cga.ct.gov/2007/ACT/PA/2007PA-00236-R00HB-06500-PA.htm. A summary of theAct appears at http://www.cga.ct.gov/2007/sum/2007SUM00236-R02HB-06500-SUM.htm.

8/8/2019 The Economic and Fiscal Impacts of Connecticut’s Film Tax Credit
http://slidepdf.com/reader/full/the-economic-and-fiscal-impacts-of-connecticuts-film-tax-credit 5/64

8/8/2019 The Economic and Fiscal Impacts of Connecticut’s Film Tax Credit
http://slidepdf.com/reader/full/the-economic-and-fiscal-impacts-of-connecticuts-film-tax-credit 6/64
iii
Tourism Research reports that the number of visitors rises an average of 54% over four
years in a location where a successful film was shot.3 We have not accounted for
movie-induced tourism in this study.
In the studies examined in the literature review, only a few examined the experiences of
film tax credits in specific states. Some studies are projective, predicting what the
impact of the tax credits would be if legislated (e.g., Tennessee and Montana) and we
have not included them here. The proliferation of film tax credits appears to be a
relatively recent phenomenon and many early adopter states are now publishing studies
of incentives they started five to eight years ago. Connecticut is an outlier in that regard
and the present study may not indicate future success, because the states that were
trying to foster a film industry did not experience as much growth the first year as they
did in the second and third years. There is likely a recognition lag as production
companies ponder their shooting locations given the variety of incentives they face
(described in Appendix B).
The literature suggests the primary goal of the film tax credit should be to build industry
infrastructure including pre- and post-postproduction facilities and the requisite
professional workforce within the state to provide lasting benefits and not just to attract a
series of films to shoot film and exit. Perhaps the examples from other states may
stimulate Connecticut educational and professional development programs that will
attract additional film production dollars to the state (PA 07-236 may help accomplish
this). It may be advantageous to perform a similar analysis at three-year intervals to
assess the economic and fiscal impacts of Connecticut’s film tax credit as the film
industry discovers the state and the supportive infrastructure evolves.
3Riley, Roger, Dwayne Baker and Carlton S. Van Doren (1998). “Movie Induced Tourism,” The Annals of
Tourism Research , vol. 25, no. 4, 919-935.

8/8/2019 The Economic and Fiscal Impacts of Connecticut’s Film Tax Credit
http://slidepdf.com/reader/full/the-economic-and-fiscal-impacts-of-connecticuts-film-tax-credit 7/64
1
INTRODUCTION
On January 1, 2006, the Connecticut General Assembly enacted an aggressive film
production tax credit (defined in Sec. 12-217jj of the Connecticut General Statutes)
intending to attract a larger segment of the lucrative film industry into the state. Theimmediate result of this act is transparent, as Connecticut has experienced a dramatic
increase in film production since the law’s enactment. The economic ramifications of
this act, however, are less straightforward. In granting a tax credit to the film industry,
the state effectively reduces the tax revenue it would otherwise receive from increased
film production in the state that presumably would not occur without the credit. The
result of this temporary sacrifice of tax revenue is a flurry of direct and indirect economic
activity that stimulates Connecticut’s economy, which one hopes more than offsets the
direct reduction in tax revenue and its indirect effects. The increase in economic activityprovides a wide range of economic benefits including increased output (sales) for local
businesses, new jobs, as well as subsequent increases in sales and personal income
tax revenue to the state. The purpose of this study is to evaluate the impact of the film
production tax credit on Connecticut’s economy.
BACKGROUND
In January 1999, the Directors Guild of America and Screen Actors Guild commissioned
the Monitor Company to perform an investigation4,5 into the phenomenon of “runaway”
film and television productions from the U.S. Runaway productions are those that are
developed and intended for release, exhibition or television broadcast in the U.S., but
are actually filmed in another country. Creative runaways depart because the story
takes place in a foreign setting that cannot be duplicated or for other creative
considerations cannot be produced domestically, while economic runaways depart to
achieve lower production costs (similar to manufacturing jobs migrating to China). “In
1998, of the 1,075 U.S.-developed film and television productions in the study’s scope,
4This study considered only feature films, direct-to-video productions, movies for television, and series for
television.5
U.S. Runaway Film and Television Production Study Report available athttp://www.dga.org/news/pr_runaway.pdf
8/8/2019 The Economic and Fiscal Impacts of Connecticut’s Film Tax Credit
http://slidepdf.com/reader/full/the-economic-and-fiscal-impacts-of-connecticuts-film-tax-credit 8/64
2
285 (27% of total) were economic runaways, a 185% increase from 100 (14% of total) in
1990.” The result was a $10.3 billion loss in gross domestic product (GDP) and a loss of
20,000 FTE jobs. The destination of 81% of economic runaways was Canada while
Australia and the U.K. captured another 10%.
The Monitor report cites a number of reasons that contribute to the rapid increase in
runaway productions. Location decisions encompass expected revenues, costs of
production, quality and availability of talent, and physical infrastructure. Foreign crews
and infrastructure have improved through experience and direct investment.
Additionally, through much of the 1990s, currency in nations that attracted runaway
productions declined 15% to 23% relative to the U.S. dollar, lowering the cost of labor
and costs of goods and services by at least 15%. Lastly, Canada offers federal and
provincial tax credits of 22% to 45% of labor expenses6 (we discuss tax credits in detail
below).
“This runaway production has since set off a chain-reaction competition among U.S.
states, with each giving the economic red-carpet treatment to the film industry with the
goal of creating good-paying jobs, increasing local consumption and some free wide-
screen publicity about the landscape or urban milieu that might encourage more
tourism.”7 “Today, all but five states offer some type of film production incentive, ranging
from a transferable or refundable tax credit to a direct rebate from the state, to a waiver
of sales tax and occupancy tax, to a production loan.”8 In addition, international
competitors have designed similar tax incentives to lure film production to their regions.
The U.S. Film Industry
Before considering the impact of Connecticut’s film industry, it is necessary to
characterize the overall status of the film industry in the U.S. In 2006, the outlook for the
film industry in the U.S. remained strong. Driven by an increase in the release of new
films, the number of total releases in the U.S. increased 11% reaching another all-time
high in 2006. Chart 1 shows the recent growth trend in total film releases in the U.S.9
6This was the incentive structure when the report appeared in 1999.
7“Roll the credits…and the tax incentives,” Kathy Cobb, Fedgazette, September 2006; available at:
http://www.minneapolisfed.org/pubs/fedgaz/06-09/film.cfm.8
“Fall 2007 Edition The Complete Guide to U.S. Production Incentives,” by Axium International.9
“U.S. Entertainment Industry: 2006 Market Statistics,” by the Motion Picture Association of America.Available at: http://www.mpaa.org.

8/8/2019 The Economic and Fiscal Impacts of Connecticut’s Film Tax Credit
http://slidepdf.com/reader/full/the-economic-and-fiscal-impacts-of-connecticuts-film-tax-credit 9/64
3
Chart 1: Recent Growth Trend
Source: U.S. Entertainment Industry: 2006 Market Statistics,” by the Motion Picture Association of America. Available at: http://www.mpaa.org
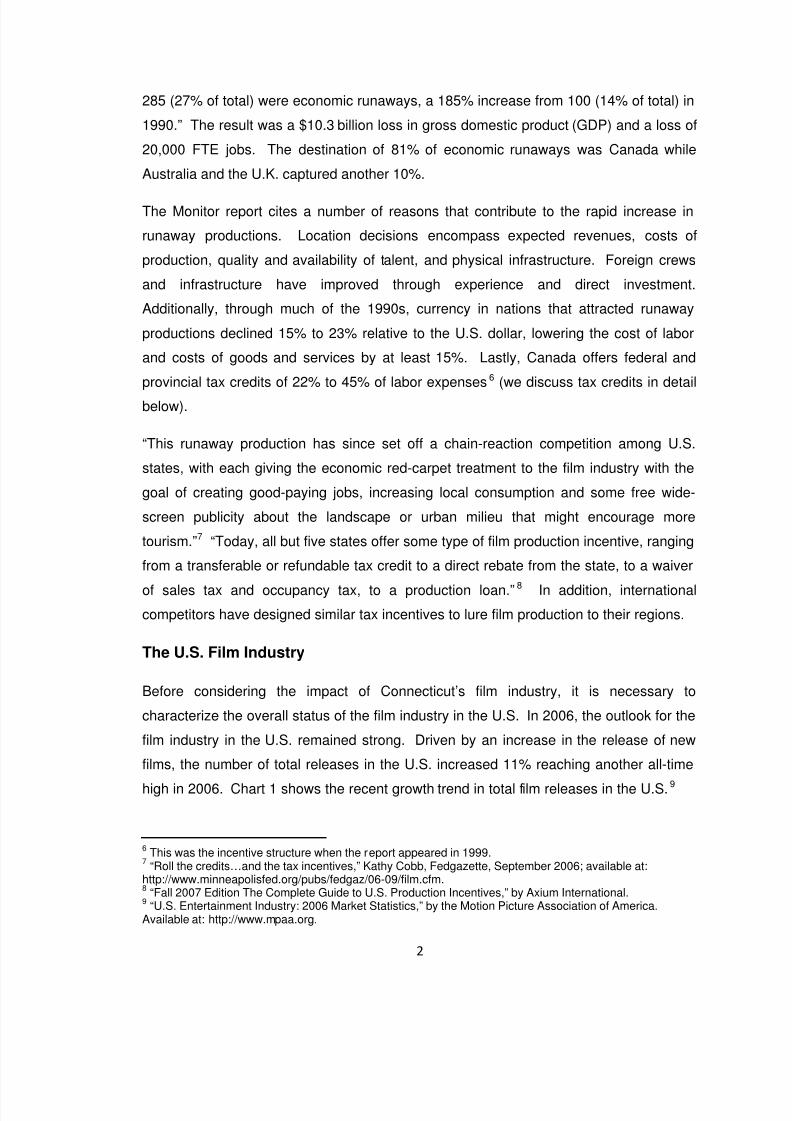
In 2006, total domestic box office revenue increased by 5.5% to $9.5 billion. Global box
office admissions grew 11% as well, reaching an all-time high of $25.8 billion. The
growth trend in the domestic box office revenue is not as pronounced as the growth in
total film production, but there has been a 13% increase since 2001. Global box office
revenue increased 52% over this same period. Chart 2 illustrates the trend in both U.S.
and Global box office receipts (see footnote 8).
8/8/2019 The Economic and Fiscal Impacts of Connecticut’s Film Tax Credit
http://slidepdf.com/reader/full/the-economic-and-fiscal-impacts-of-connecticuts-film-tax-credit 10/64
4
Chart 2: Trend in U.S. and Global Box Office
Source: U.S. Entertainment Industry: 2006 Market Statistics,” by the Motion Picture Association of America. Available at: http://www.mpaa.org
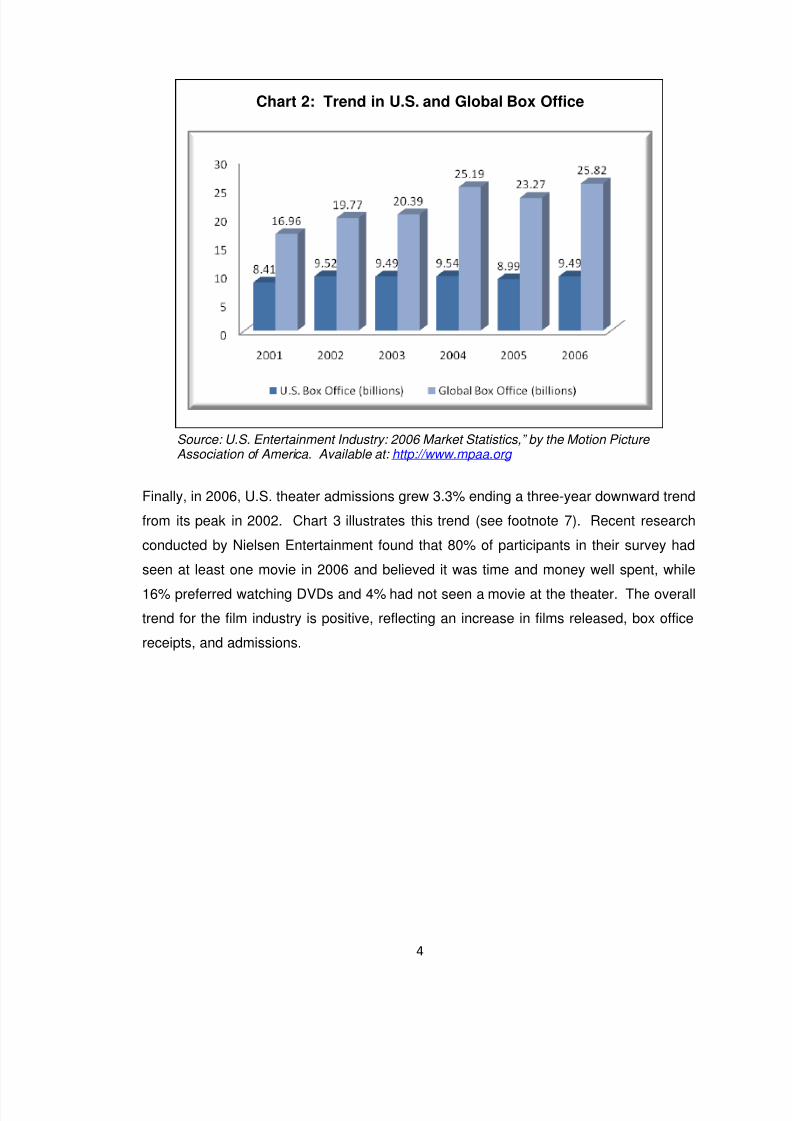
Finally, in 2006, U.S. theater admissions grew 3.3% ending a three-year downward trend
from its peak in 2002. Chart 3 illustrates this trend (see footnote 7). Recent research
conducted by Nielsen Entertainment found that 80% of participants in their survey had
seen at least one movie in 2006 and believed it was time and money well spent, while
16% preferred watching DVDs and 4% had not seen a movie at the theater. The overall
trend for the film industry is positive, reflecting an increase in films released, box office
receipts, and admissions.
8/8/2019 The Economic and Fiscal Impacts of Connecticut’s Film Tax Credit
http://slidepdf.com/reader/full/the-economic-and-fiscal-impacts-of-connecticuts-film-tax-credit 11/64
5
Chart 3: 2006 U.S. Theater Admissions Growth
Source: U.S. Entertainment Industry: 2006 Market Statistics,” by the Motion Picture Association of America. Available at: http://www.mpaa.org
Connecticut’s Film Industry
To determine the economic and fiscal impacts of Connecticut’s film tax incentive, it is
important to examine the nature of the industry as it exists within the state. This section
reviews the film and sound recording industries in Connecticut and its competitors froman employment and economic perspective. It is important to note that the most recent
data available for our use below is 2006, thus we do not reflect the impact of
Connecticut’s film production incentive in these numbers.
From the literature, we glean two factors that typically determine filming location for
production companies. The first factor is artistic - the local landscape and scenery are of
primary importance. The second factor is economic and the availability of economic
incentives, among other things, is of primary importance. As film production is a highmobility industry, we define Connecticut’s competitors both geographically as well as
those states with similar tax incentives. Fortunately, the states neighboring Connecticut
offer film production incentives that are similar to Connecticut’s, making comparison
easier (for a description of these incentives, see Appendix B). We include California, the
leader in film production in the U.S. as well.

8/8/2019 The Economic and Fiscal Impacts of Connecticut’s Film Tax Credit
http://slidepdf.com/reader/full/the-economic-and-fiscal-impacts-of-connecticuts-film-tax-credit 12/64
6
The first indicator we examine is the fraction of employment in the film and sound
recording industry within a region. This is a ratio of industry employment to baseline
industry employment and provides a measure of the relative size of an industry in a
given region. The film and sound recording industries represents 0.33% of employment
in the U.S. as a whole. Connecticut’s film and sound recording industries account for
less than half the national average (0.15% of total employment), which is the smallest of
any of Connecticut’s competitors. Table 1 presents the fraction of film and sound
recording industry employment in relevant states.
Table 1: Film Production EmploymentShares for Selected States
California 1.15%
New York 0.65%
Massachusetts 0.16%Rhode Island 0.22%
Connecticut 0.15%
Source: Bureau of Labor Statistics available at http://www.bls.gov
The Location Quotient (LQ) is another powerful indicator that allows an area’s
distribution of employment in an industry to be compared to a baseline.10 An LQ of 1
indicates that the industry has the same share of employment as the reference area. An
LQ greater than 1 indicates the local industry has a greater share of employment than
the reference area, while an LQ less than 1 indicates the local industry has a smaller
share of employment than the reference area. Thus, LQs effectively measure the
concentration of an industry within a region. In this study, the reference area is the U.S.
Connecticut has an LQ of 0.46, which is again the lowest among its competitors. Table
2 presents the LQs.11
10Bureau of Labor Statistics available at: http://data.bls.gov/help/def/lq.htm#location_quotient
11Bureau of Labor Statistics available at http://www.bls.gov

8/8/2019 The Economic and Fiscal Impacts of Connecticut’s Film Tax Credit
http://slidepdf.com/reader/full/the-economic-and-fiscal-impacts-of-connecticuts-film-tax-credit 13/64
7
Table 2: Film Production Location Quotientsfor Selected States
California 3.47
New York 1.98Massachusetts 0.50
Rhode Island 0.66
Connecticut 0.46
Source: Bureau of Labor Statistics available at: http://data.bls.gov/
The final two measures we examine are the total number of establishments in the film
and sound recording industry and the total employment generated by the industries.
Though the measures do not provide information on the importance of the concentration
of the industry, as do the previous statistics, they provide insight into the current capacity
of the industry in the region. Both the number of establishments and total employees in
the film and sound recording industries has decreased in Connecticut, though this is an
industry-wide trend not specific to Connecticut. Among its competitors (California is not
a competitor), Connecticut ranks only above Rhode Island in the number of
establishments and employees. Tables 3 and 4 present the establishment employment
and total employment respectively.
Table 3: Film Production Establishments in Selected States
2001 2002 2003 2004 2005 2006
U.S. 28,296 27,415 26,476 25,905 25,904 26,663
New York 3,658 3,401 3,265 3,172 3,143 3,179
Massachusetts 543 529 514 523 511 468
Connecticut 340 315 297 289 288 305
Rhode Island 58 57 56 59 63 70
Source: Bureau of Labor Statistics available at: http://data.bls.gov/

8/8/2019 The Economic and Fiscal Impacts of Connecticut’s Film Tax Credit
http://slidepdf.com/reader/full/the-economic-and-fiscal-impacts-of-connecticuts-film-tax-credit 14/64
8
Table 4: Employment in Film Production Establishments in Selected States
2001 2002 2003 2004 2005 2006
U.S. 366,789 384,838 368,459 380,300 373,561 372,585
New York 56,632 50,868 45,628 44,332 45,986 45,885
Massachusetts 5,720 5,453 5,124 4,718 4,718 4,581
Connecticut 2,289 2,293 2,265 2,200 2,151 2,181
Rhode Island 566 641 639 610 585 917
Source: Bureau of Labor Statistics available at: http://data.bls.gov/
The General Structure of Film Production Tax Incentives
As the film industry is the second largest “clean” industry in the U.S. (the largest is the
semiconductor industry), it is no surprise that luring the film industry to particular regions
through tax incentives has drawn significant interest in recent years. All but five states in
the U.S. offer various types of tax incentives to the film industry, and foreign
competition12 intensifies competition for film production. A plethora of tax incentives
designed by different states exists, each with a different vision for the film industry in
their respective locations. The following section examines the underlying structure and
motivation of tax incentives in detail.
The most basic tax incentive is an exemption from local sales and use tax. A number of
states employ this approach as it is relatively simple to implement, easy to evaluate and
non-controversial. Additionally, by its nature it only applies to spending occurring within
the region offering the incentive. Connecticut does not exempt film productions from
local taxes. Many states including Connecticut waive hotel/lodging taxes on stays longer
than 30 consecutive days (the required length of stay varies). Though this is not always
directly connected to the film production tax incentive, film companies that produce film
in a particular region for an extended period consider it favorably. A small number of
U.S. states employ the lodging tax waiver as their only tax incentive, but states often use
it in conjunction with other tax incentives. Few restrictions apply when this is the only tax
incentive a state offers, though some states require production companies to spend
12For simplicity, we use the term “state” to refer to U.S. states, Canadian provinces and foreign nations.

8/8/2019 The Economic and Fiscal Impacts of Connecticut’s Film Tax Credit
http://slidepdf.com/reader/full/the-economic-and-fiscal-impacts-of-connecticuts-film-tax-credit 15/64
9
more than approximately $250,000 (varies by state) on qualified film production
expenditures.
Another mechanism, utilized more frequently, is a tax credit or rebate for a portion of the
film’s budget (Connecticut has adopted this approach). Generally, only in-state
expenses qualify, though there are exceptions. Additionally, several states specify
which expenses qualify for the tax credit and those that do not. This approach has
advantages over tax exemption. Primarily, the tax credit or rebate can offer incentives
beyond those available via tax exemption alone. The incentive available through tax
exemption is limited to the value of the tax; by offering a rebate greater than the tax
liability, states are able to increase the value of the rebate making their state more
attractive to the film industry.
An additional feature of tax credits is the ability to include targeted incentives to
encourage greater local economic activity than would otherwise occur with a sales or
lodging tax exemption. Many states offer an incentive-laden tax credit in an attempt to
influence film industry behavior, generally attempting to foster the employment of in-state
residents and encourage in-state spending on goods and services in film production.
Though some states offer a tax credit only on in-state labor expenses, no state offers an
exclusive rebate on non-labor expenses. Several states award different levels of tax
credits for labor and other in-state expenses. In these states, in-state labor always
receives a higher tax credit than in-state expenditure. There is a clear, though not
universal, trend in tax incentives that favor in-state labor rather than overall in-state
spending. The structure of Connecticut’s tax incentive does not favor hiring in-state
laborers over non-labor expenditure; however, it does specify that only in-state
expenditure qualifies for the tax credit. Additionally, Connecticut’s tax incentive is more
generous than some states’ as out-of-state laborers qualify for the credit as long as they
work in Connecticut.
The trend for film tax incentives to favor in-state labor rather than overall in-state
spending provides states with several distinct advantages. First, it creates a direct
means to provide quality jobs for the state’s population. In addition, the trend favoring
labor in tax incentives fosters further growth of the film industry in the state by
encouraging the establishment of a local labor pool to sustain the industry. This labor
pool, which consists primarily of below-the-line laborers (below-the-line labor refers to all

8/8/2019 The Economic and Fiscal Impacts of Connecticut’s Film Tax Credit
http://slidepdf.com/reader/full/the-economic-and-fiscal-impacts-of-connecticuts-film-tax-credit 16/64
10
labor that is not creative talent including technical, professional and skilled
tradespersons), is the lifeblood that makes film production possible. Finally, labor-based
incentives provide a framework for on-the-job training programs established in some
states. Connecticut’s tax incentive, however, does not differentiate between labor and
other expenses. Manitoba’s experience exemplifies a state (in this case, a Canadian
province) focusing on labor force development. Manitoba offers a 35% rebate on in-
state labor expenses. Out-of-province labor expenses qualify if there are no in-province
laborers available with the necessary skills, given that the production company provides
training opportunities for in-province residents. Because of its generous tax incentive
program, film production in Manitoba has experienced rapid growth. Its indigenous labor
force, however, has not kept pace and many production companies looking to film in
Manitoba cite a lack of available local labor as the primary reason they choose to film
elsewhere.
Through another set of incentives, states attempt to influence the type of film production
they attract. Some states employ a wide range of qualifications they require productions
to meet to be eligible for their tax incentives. One widely utilized incentive is the
implementation of tax credits with an expense threshold (on qualifying in-state
expenses) that productions must exceed to be eligible to receive the tax credit. This
attracts larger productions that will create a greater local economic impact. The typical
qualifying expense can range from $100,000 to $1 million. Connecticut requires a
$50,000 qualifying expense that falls significantly below the median of minimum
qualifying expenditures. States that do not have a minimum qualifying expenditure often
develop an incentive that specifies the percentage of employees, percentage
expenditure of the total budget, or percentage of filming that must occur within the state.
The typical range is between 50% and 75% locally employed, spent, or indigenously
filmed. As Connecticut has a fixed minimum expenditure amount, it does not require a
minimum percentage to be employed, spent or filmed in-state.
A more intricate iteration of the size incentive is a sliding scale of tax credits on the
amount a film production spends instate for labor, goods, and services. A typical
example is Mississippi, which offers a rebate of 20% on the first $1 million, 25% on the
expenditures between $1 million and $4 million, and 30% on expenditures above $5
million. Connecticut does not offer greater incentives for larger productions; instead as
previously mentioned it specifies a minimum in-state spending requirement.

8/8/2019 The Economic and Fiscal Impacts of Connecticut’s Film Tax Credit
http://slidepdf.com/reader/full/the-economic-and-fiscal-impacts-of-connecticuts-film-tax-credit 17/64
11
Additional incentives attempt to influence the time or location of the film production. For
example, Florida offers an additional 5% tax credit for filming in the off-season. New
York offers an additional 5% tax credit when filming is in New York City and Hawaii
offers varying tax credits depending on which island film production occurs. As the
expenses associated with film production can be quite large, several states offer a loan
program to film producers as well. Connecticut does not currently offer a loan program
for film production and as states offer it relatively infrequently, we consider the
disadvantage to be small and it primarily affects films struggling for funding such as
independent films.
Other features of film production incentives are limitations on the extent of expenses that
qualify. Many states place a cap on the amount of compensation per employee that
qualifies for a tax credit. Generally, the cap is near $1 million per employee, but can
range from $100,000 to $15 million. The $15 million limit of Connecticut represents the
extreme in this case; the next largest per individual cap is $1 million, offered by several
states such as North Carolina, Pennsylvania and South Carolina. Additionally, many
states have maximum total tax credits per year and a maximum tax credit per
production. Unless there is an optimal level of film production in a given state, an annual
cap has dubious merit (that is, provided the tax credit affords an overall benefit to the
state measured periodically by analyses such as this). Theoretically, as long as an
incentive produces more economic and fiscal benefit than its cost, there should be no
limit to how much of the incentivized activity occurs. If there is a minimum threshold
necessary to induce a production to entertain a particular location, a per production cap
can be a means to limit the tax credit issued to a given production. This becomes less
attractive, however, compared to a state that does not have a per production cap.
Connecticut offers neither an annual maximum tax credit nor a maximum per production
tax credit at this writing.
A final consideration in film production incentive programs is the structure of the
payment. A number of different payment structures exist with varying degrees of
flexibility, ranging from nontransferable tax credits to an outright cash rebate. States
infrequently employ nontransferable tax credits as they only benefit productions with tax
liability in the state of production. Transferable tax credits are more common; they allow
film producers to transfer their tax credit to an entity that has tax liability in the state.
There are two types of payment structures: one allows transfer of tax credits to

8/8/2019 The Economic and Fiscal Impacts of Connecticut’s Film Tax Credit
http://slidepdf.com/reader/full/the-economic-and-fiscal-impacts-of-connecticuts-film-tax-credit 18/64
12
individuals with personal income tax liability, the other allows transfer of tax credits to
corporations with corporate profit tax liability. Connecticut’s tax credit is transferable to
corporations with Connecticut corporate profits tax liability. The final, and most widely
utilized, payment structure is a rebate or refundable tax credit. A rebate and refundable
tax credit are similar in structure; however, they have a small difference. The distinction
is that a rebate is an outright payment by a state to a production company, while a
refundable tax credit is an outright payment by a state to a production company after
deducting its own tax liability. Several states offer a combination tax credit and tax
rebate. States employing this incentive offer a tax credit that may be sold to an
individual, corporation, or broker or may be sold directly to the state at a discount (at
approximately 80 cents on the dollar).
Connecticut’s Film Production Tax Credit13
Connecticut has one of the most aggressive film production tax credits in the United
States. The tax credit provides qualifying productions with a tax credit equal to thirty
percent of production costs incurred in the state for preproduction, production, and
postproduction costs. Qualified productions encompass a vast range of film productions
including motion pictures, documentaries, mini-series, sound recordings, videos and
music videos, interactive television, video games, commercials, any format of digital
media created primarily for distribution or exhibition to the public, and numerous other
productions. Ongoing programs created primarily as news, weather, financial market
reports, and any production containing material that is obscene as defined by Section
53a-193 of the Connecticut General Statutes do not qualify for the tax credit. Expenses
incurred in Connecticut that qualify include worker compensation or purchases in both
production and postproduction markets, distribution expenditures, and intellectual
property expenditures subject to certain conditions,14 but exclude specific costs that may
arise.15
13This description reflects section 12-217jj of the General Statues, which is the subject of this study and
reflects the tax credits apportioned over the study period.14
The intellectual property was primarily produced in the state, 75% of the production based on theintellectual property is produced in the state, and it accounts for no more than 35% of production expensesincurred in the state.15
Talent fees for extras that exceed the rates of the Screen Actors Guild, media promotion or marketing,deferred, leveraged or profit participation costs, costs related to transfer of tax credits, and amounts paid topersons as a result of their participation in profits from the exploitation of the qualified production are noteligible for the tax credit.
8/8/2019 The Economic and Fiscal Impacts of Connecticut’s Film Tax Credit
http://slidepdf.com/reader/full/the-economic-and-fiscal-impacts-of-connecticuts-film-tax-credit 19/64
13
FILM PRODUCTION INCENTIVE STUDIES
It is perhaps equally informative to examine the experience of film tax incentives enacted
in other states or provinces in determining the optimal policy as it is to examine
Connecticut’s own experience. In the sections that follow, we will examine the filmproduction tax incentives of other regions, highlighting some of the unique experiences
other regions encountered. The principal focus in this section is regions that have
studied the economic impact of their film tax incentives, either before or after
implementation as this provides the most insight to the effect of the incentives.
Manitoba Province (Canada)
It is instructive to start by examining the Canadian example because it pioneered film
production incentives, experienced spectacular success, and developed an integrated
approach to launching its film/television production-oriented initiatives. The success of
Canada in luring film production away from the U.S. is unmistakable. Canada captured
81% of U.S. economic runaways in 1998 (before U.S. states responded with film
production incentives of their own). Canada’s federal government offers a 25% rebate
on domestic productions and a 16% rebate on foreign productions.16 The integrated
approach Canada pioneered “begins with a relatively underdeveloped production
industry. It then launches a series of (usually tax credit-centered) initiatives to attract
production activity and investments, and often creates qualifying requirements for thoseincentives that stimulate hiring of local personnel. As a result, local production crews
gain valuable experience and training and are, therefore, more capable and attractive to
producers. At the same time, investments in physical infrastructure are sought so that
more and more productions can be accommodated. As these production capabilities
expand, other tax incentives such as those for local labor expenditures are offered to
further stimulate demand for local production resources.”17 The most important aspect
of this approach is that it not only attracts film production to the region, it cultivates local
growth of the industry and builds the infrastructure necessary to sustain the industry.For example, film production requires the involvement of governments and a large
variety of outside businesses to provide the goods, services, permits, and rentals that
16In 2003, Canada increased this by 5% from 11%.
17See footnote 4.

8/8/2019 The Economic and Fiscal Impacts of Connecticut’s Film Tax Credit
http://slidepdf.com/reader/full/the-economic-and-fiscal-impacts-of-connecticuts-film-tax-credit 20/64
14
allow film and video professionals to operate. The Manitoba film study cited below
provides a useful conceptual diagram of these cascading effects illustrated in Chart 4.
Chart 4: Relationship of Direct, Indirect and Induced Employment in the Film andTelevision Production Industry in Manitoba
Source: “Action! Industry in Motion! Economic Impact Analysis of Manitoba’s Film Industry 2003” by InterGroup Consultants and OARS Training Inc.
In 1997, the Province of Manitoba introduced a film production tax credit based on labor
expenses in addition to Canada’s federal tax incentives. Both domestic and foreign
production companies are eligible for a 35% tax credit on labor expenses paid to
Manitoba residents. If no qualified Manitobans are available to fill a specific position,
then the production is eligible for the labor tax credit, given that they provide training
opportunities for Manitobans. “This is an important link between the Manitoba Tax
Credit and the training and development of the Manitoba film labor force. Such training
support is especially important because the cyclical nature of the film industry generally
does not allow it to take advantage of income support programs accessible for training in

8/8/2019 The Economic and Fiscal Impacts of Connecticut’s Film Tax Credit
http://slidepdf.com/reader/full/the-economic-and-fiscal-impacts-of-connecticuts-film-tax-credit 21/64
15
other industries.”18 Manitoba structures the tax credit such that it must be invested in a
production; a producer or production company cannot retain it as earnings or profits.
However, the production companies generally do not receive the credit until three to six
months after the production is complete. A producer is responsible for all interest and
financing charges on interim funds, which severely handicaps producers (see footnote
18).
An economic impact study by InterGroup Consultants and OARS Training Inc. concludes
that the tax credit has had a significant impact on the film industry in Manitoba. In
1996/1997, (the year prior to implementation of the tax credit) the total budget of
production filming in Manitoba was CAD19 15-20 million per year, whereas in 2001/2002,
the total film production budget increased to CAD 65 million, reaching CAD 82.9 million
in 2002/2003. During this period, the number of foreign productions nearly doubled and
the number of indigenous productions increased more than 60%. However, indigenous
productions grew steadily during the period, “it appears that offshore productions have
been the main driver behind the growth in production volumes in 2000/01 through
2002/03,” (see footnote 17). TV specials and feature films represented the largest
proportion of production and they experienced the greatest growth over the study period.
It is important to note, however, that direct expenditures in Manitoba only increased from
CAD 26.8 million in 1998/1999 to CAD 33.7 million in 2002/2003. Yet the outlook is
positive, “Manitoba’s film industry has grown during a period when production volumes
at the national level are stabilizing… [and] Manitoba’s film industry continues to improve
its performance relative to other regions in Canada” (see footnote 17).
It is not possible to determine the fiscal impact based upon these numbers, but they
illustrate the economic and fiscal growth enhancing potential of a film production
incentive tax credit. In conducting a more detailed analysis of fiscal impacts, the study
concludes that Manitoba generally recovered more than 50% of the tax credit through
direct revenues created by the film industry within the province. The Manitoba study
utilizes spending multipliers, which range from 2.0 to 2.5 for employment income and
1.25 to 1.75 for other expenditures, to determine total expenditures (including direct,
indirect and induced spending). From this calculation, the study’s authors determine
total fiscal impacts. The smaller multipliers indicate positive fiscal impacts in 1998/99,
18“Action! Industry in Motion! Economic Impact Analysis of Manitoba’s Film Industry 2003” by InterGroup
Consultants and OARS Training Inc.19
CAD = Canadian dollars.

8/8/2019 The Economic and Fiscal Impacts of Connecticut’s Film Tax Credit
http://slidepdf.com/reader/full/the-economic-and-fiscal-impacts-of-connecticuts-film-tax-credit 22/64
16
with net revenue of CAD 132,000, but increasingly negative fiscal impacts thereafter
ranging from a loss of CAD 128,000 in 1999/2000 to a loss of CAD 584,000 in
2001/2002. The results indicated by the higher multipliers are more encouraging and
positive in every year, but decline from a surplus of CAD 1.1 million in 1998/99 to a
surplus of CAD 560,000 in 2001/2002. Table 5 presents the fiscal impacts of Manitoba’s
film production incentive. The Manitoba study concludes, “Based on this analysis, it can
be reasonably concluded that when indirect and induced effects are taken into account
the provincial tax credit is revenue neutral to the province and in some years may be
positive revenue” (see footnote 18). It is important to note, however, that as total film
budgets grew rapidly over the study period 1998 to 2002, the fiscal impacts declined.
One possible explanation for this performance is that, though total film budgets
increased 23% from 1998/1999 to 2001/2002, expenditures within Manitoba increased
19% over the same period. If Manitoba lacked the necessary infrastructure, either
physical or workforce,20 to accommodate the rapid increase in the number of
productions, this would allow expenditures outside the province to qualify for the tax
credit without generating fiscal returns to Manitoba.
Table 5: Fiscal Impacts of Manitoba's Film Production Incentive (Canadian Dollars)
1998/1999 1999/2000 2000/2001 2001/2002
Net Fiscal Impact Low $132,000 ($128,000) ($299,000) ($584,000)
Net Fiscal Impact High $1,106,000 $663,000 $680,000 $560,000Source: “Action! Industry in Motion! Economic Impact Analysis of Manitoba’s Film Industry 2003” by InterGroup Consultants and OARS Training Inc.
British Colombia Province (Canada)
In 1998, British Colombia (BC) deployed a film production incentive in addition to the
federal government’s tax credit. BC offers different tax credits for productions with
certain levels of qualifying Canadian content. Productions that meet this requirement
receive a 30% refundable corporate income tax credit21 on qualified labor expenditures,
which is capped at 48% of total production expenditures. An additional 12.5% is
available if shooting occurs outside of the Vancouver area. Finally, a 30% tax credit is
20Lack of skilled crew was cited by several production companies as the reason they did not film in
Manitoba.21
This amount was 20% prior to January 2005.
8/8/2019 The Economic and Fiscal Impacts of Connecticut’s Film Tax Credit
http://slidepdf.com/reader/full/the-economic-and-fiscal-impacts-of-connecticuts-film-tax-credit 23/64

8/8/2019 The Economic and Fiscal Impacts of Connecticut’s Film Tax Credit
http://slidepdf.com/reader/full/the-economic-and-fiscal-impacts-of-connecticuts-film-tax-credit 24/64
18
multiple employment opportunities for actors – in legitimate theater and daytime soap
operas as well as film, cable and broadcast television and commercials – New York is a
primary center for acting talent. By virtue of its long history and current strengths in
these production sectors, New York has an abundance of highly qualified crew in all the
specialty occupations required for media production.”23 Though it is a source of
competition for Connecticut film production, the proximity of New York also provides
Connecticut film producers with a readily accessible pool of talent and nearby
infrastructure able to fill deficiencies in Connecticut’s film industry. New York’s position
of both competitor and complement to Connecticut’s film industry makes it critical to
understand the role of its film production tax incentive.
In August 2004, New York State instituted a program that provides a 10% refundable tax
credit for qualifying feature films, television series, pilots, and television movies.
Beginning in January 2005, New York City provided an additional 5% tax credit to
productions within the City. Thus, any production in New York City receives a 15% tax
credit and any production in New York State outside the City receives a 10% tax credit.
The state incentive has an annual cap of $60 million and the New York City incentive
annual cap is $30 million; both are offered on a first-come, first-served basis. To qualify
for the tax credit, a production must spend 75% or more of its facility-related expenses at
a qualifying New York State facility, and if the costs associated with the work are less
than $3 million, the production must shoot at least 75% of its location days in New York
State.
If it does not meet these requirements, the production can, in some circumstances, be
eligible for a partial tax benefit. “‘Qualified production costs’ are costs for tangible
property or services used or performed within New York directly and predominantly in
the production (including pre- and postproduction) of a qualified film. Qualified
production costs generally include costs of technical and crew production, expenditures
for facilities, props, makeup, wardrobe, set construction, background talent, and
generally exclude costs of stories and scripts, wages for writers, directors, producers
and performers (other than extras without spoken lines).”24 Production companies
receiving tax credits may apply them against the New York State tax liability of the
person or entity that controls the qualified film. If that person or entity does not use the
23“New York’s Big Picture - Assessing New York’s Position in Film, Television and Commercial Production,”
by Cornell University and Fiscal Policy Institute, New York.24
“Fall 2007 Edition, The Complete Guide to U.S. Production Incentives” by Axium International.

8/8/2019 The Economic and Fiscal Impacts of Connecticut’s Film Tax Credit
http://slidepdf.com/reader/full/the-economic-and-fiscal-impacts-of-connecticuts-film-tax-credit 25/64
19
entire tax credit, 50% of the unused amount will be issued as a rebate and the remaining
50% will carry forward to the following year. The unused portion in the next year will be
fully refunded. Additionally, there is no sales tax on most below-the-line expenses; New
York City provides police services without charge and free shooting permits.
A study by Cornell University and the Fiscal Policy Institute (FPI) of New York estimates
the economic impact of film, television, and the production of commercials in New York
State. Utilizing the IMPLAN regional input-output model,25 Cornell and FPI analyze the
impact of film, television, and commercials in the year 2003 and estimate the impacts in
2004 and 2005. Thus, this study provides an initial indication of the impact the tax
incentives implemented in New York had on the production of film, television, and
commercials. In 2003, they find that film, television, and commercial production
contributes $5.4 billion in direct value added to New York’s gross state product (GSP) as
well as providing direct employment of 36,372 (jobs). Total value added is $11.7 billion
and total (direct plus indirect) employment impact totals 114,000 jobs. The study’s
authors estimate a 7.2% increase in production from 2003 to 2004 and a 6.0% increase
from 2004 to 2005. This equates to direct value added of $5.8 billion and $6.2 billion
GSP for 2004 and 2005 respectively. The corresponding total value added (that is,
GSP) is $12.5 billion for 2004 and $13.3 billion for 2005. This indicates 13.6% growth in
the New York State tax credit over the first two years of the production of film, television,
and commercials. This study estimates industry growth as a whole with incentives in
place, but does not separate incentives or delineate between pre-incentive and post
incentive outcomes.
Louisiana
Louisiana’s film production incentives are worthy of close examination not only because
its aggressive tax incentives are structured similar to Connecticut’s film tax incentive,
but, as an early adopter of film production incentives, coupled with aggressive tax
incentives, Louisiana was quite successful. Though Connecticut offers a slightly higher
overall tax credit rate, Louisiana’s film tax credit has several unique features such as
offering a tax credit on in-state labor that exceeds Connecticut’s rate as well as an
infrastructure investment tax credit. Before enacting its film incentive program,
Louisiana had little film production in the state, averaging approximately two productions
25For a description of the model, see http://www.implanpro.com.

8/8/2019 The Economic and Fiscal Impacts of Connecticut’s Film Tax Credit
http://slidepdf.com/reader/full/the-economic-and-fiscal-impacts-of-connecticuts-film-tax-credit 26/64
20
per year. Since implementing film production incentives, the number of productions has
grown exponentially, exceeding forty in 2006. Over the past several years, Louisiana’s
labor force in the film industry has increased dramatically and currently the state is
planning and building additional infrastructure capacity and soundstages.26
In 2002, Louisiana was one of the first states to emulate the Canadian film tax incentive
program. Louisiana’s film tax incentives have undergone revisions since their
introduction. The current implementation features a 25% transferable income tax credit,
which is now limited to qualifying in-state expenditures. Pre-production, production and
post-production expenses are eligible for the credit. Louisiana offers an additional 10%
tax credit on the first $1 million for each state resident employed. Production companies
must spend a minimum of $300,000 in Louisiana to qualify for the tax credit. They may
sell the tax credits directly to the Office of Film and Television for 72 cents on the dollar,
or sell them to brokers or the private market. Finally, Louisiana has a 15% tax credit for
infrastructure investments that exceed $300,000.
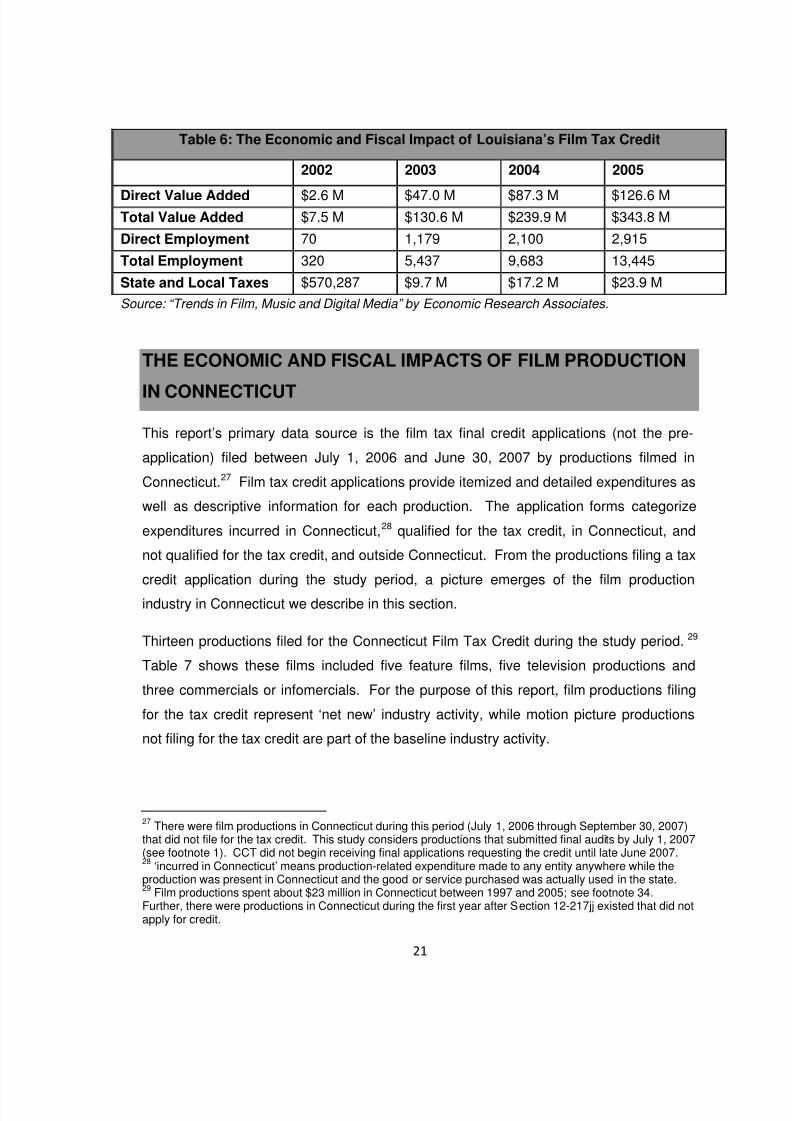
A 2006 report by the Economic Research Associates (see footnote 25) estimates the
economic impact of the film industry in Louisiana. Utilizing the IMPLAN regional input-
output model (see footnote 25), they analyze the impact of film production in Louisiana.
The direct impact of film production in 2002 was a $2.6 million increase in total output
and the creation of 70 full time equivalent (FTEs) positions (see Table 6). Using a
multiplier of approximately 1.85, they estimate the total impact on GRP to be $7.5 million
and 320 FTEs. These numbers grew exponentially reaching $343.8 million in GSP and
more than 13,000 FTEs by 2005. This rapid increase in economic activity created a
corresponding increase in tax revenues in the state. Total tax revenue generated by film
production increased from $570,287 in 2002 to $23.9 million in 2005. This, however,
represents a total increase in tax revenue. It does not take into account the cost of the
tax incentives and thus it does not represent net new state revenue. It is clear the
Louisiana film tax incentives successfully attracted the film industry and increased film
production in the state. Unfortunately, the study does not examine the fiscal feasibility of
the tax incentives.
26“Trends in Film, Music and Digital Media” by Economic Research Associates. See also the study in
footnote 34.
8/8/2019 The Economic and Fiscal Impacts of Connecticut’s Film Tax Credit
http://slidepdf.com/reader/full/the-economic-and-fiscal-impacts-of-connecticuts-film-tax-credit 27/64
21
Table 6: The Economic and Fiscal Impact of Louisiana’s Film Tax Credit
2002 2003 2004 2005
Direct Value Added $2.6 M $47.0 M $87.3 M $126.6 MTotal Value Added $7.5 M $130.6 M $239.9 M $343.8 M
Direct Employment 70 1,179 2,100 2,915
Total Employment 320 5,437 9,683 13,445
State and Local Taxes $570,287 $9.7 M $17.2 M $23.9 M
Source: “Trends in Film, Music and Digital Media” by Economic Research Associates.
THE ECONOMIC AND FISCAL IMPACTS OF FILM PRODUCTION
IN CONNECTICUT
This report’s primary data source is the film tax final credit applications (not the pre-
application) filed between July 1, 2006 and June 30, 2007 by productions filmed in
Connecticut.27 Film tax credit applications provide itemized and detailed expenditures as
well as descriptive information for each production. The application forms categorize
expenditures incurred in Connecticut,28 qualified for the tax credit, in Connecticut, and
not qualified for the tax credit, and outside Connecticut. From the productions filing a tax
credit application during the study period, a picture emerges of the film production
industry in Connecticut we describe in this section.
Thirteen productions filed for the Connecticut Film Tax Credit during the study period. 29
Table 7 shows these films included five feature films, five television productions and
three commercials or infomercials. For the purpose of this report, film productions filing
for the tax credit represent ‘net new’ industry activity, while motion picture productions
not filing for the tax credit are part of the baseline industry activity.
27There were film productions in Connecticut during this period (July 1, 2006 through September 30, 2007)
that did not file for the tax credit. This study considers productions that submitted final audits by July 1, 2007(see footnote 1). CCT did not begin receiving final applications requesting the credit until late June 2007.28
‘incurred in Connecticut’ means production-related expenditure made to any entity anywhere while theproduction was present in Connecticut and the good or service purchased was actually used in the state.29
Film productions spent about $23 million in Connecticut between 1997 and 2005; see footnote 34.Further, there were productions in Connecticut during the first year after Section 12-217jj existed that did notapply for credit.

8/8/2019 The Economic and Fiscal Impacts of Connecticut’s Film Tax Credit
http://slidepdf.com/reader/full/the-economic-and-fiscal-impacts-of-connecticuts-film-tax-credit 28/64
22
Table 7: Connecticut Film Productions (July 1, 2006through June 30, 2007)
Production Type Total Number
of Productions
Total
PhotoDays
Average
Commercial/ Infomercial 3 12 4
Television Show 5 64 12.8
Feature Film 5 142 28.4
Total 13 218 16.8
Source: DECD calculations using CCT data
The thirteen productions spent a total of 218 days shooting in Connecticut. On average,
feature films had the longest average photo-shoot days, 28.4 days per production, and
commercials/infomercials had the shortest average photo-shoot days at 4 days per
production.
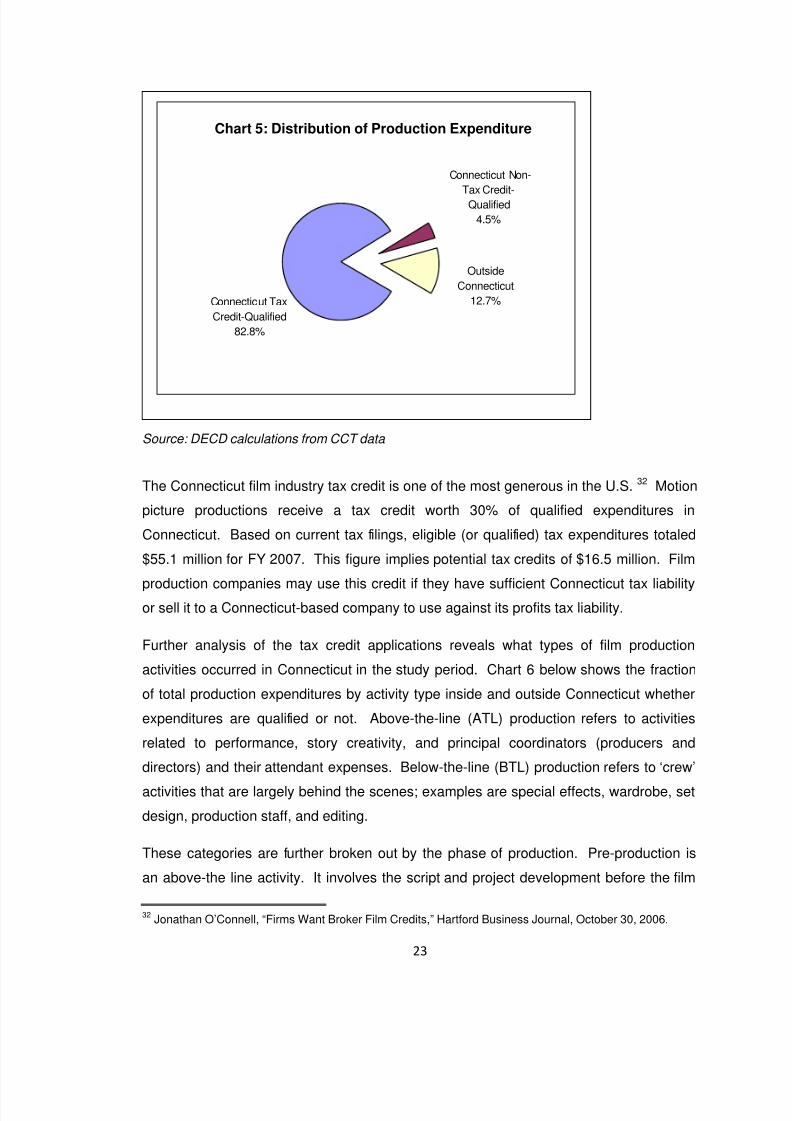
Expenditures for the thirteen productions occurred primarily in Connecticut (see Chart 5
below). Productions spent $57.9 million in Connecticut on both tax credit-qualified and
non-tax credit-qualified expenditures30 representing 87.3% of total expenditure. Tax
credit-qualified expenditures meet the guidelines for Connecticut’s film tax credit as it
appeared at the time of filing. Film productions made non-qualified expenditures in
Connecticut that are not tax-eligible. Productions applying for the Connecticut tax credit
spent $8.4 million of their total expenditure (12.7%) outside of Connecticut.31 This
spending does not affect the Connecticut economy nor is it eligible for the 30% film tax
credit.
30This figure is based on Form D tax filings summary, which are projected in some cases. These may differ
slightly from expenditure figure breakdowns.31
Note that figures may not add perfectly because of rounding.
8/8/2019 The Economic and Fiscal Impacts of Connecticut’s Film Tax Credit
http://slidepdf.com/reader/full/the-economic-and-fiscal-impacts-of-connecticuts-film-tax-credit 29/64
23
Source: DECD calculations from CCT data
The Connecticut film industry tax credit is one of the most generous in the U.S. 32 Motion
picture productions receive a tax credit worth 30% of qualified expenditures in
Connecticut. Based on current tax filings, eligible (or qualified) tax expenditures totaled
$55.1 million for FY 2007. This figure implies potential tax credits of $16.5 million. Film
production companies may use this credit if they have sufficient Connecticut tax liabilityor sell it to a Connecticut-based company to use against its profits tax liability.
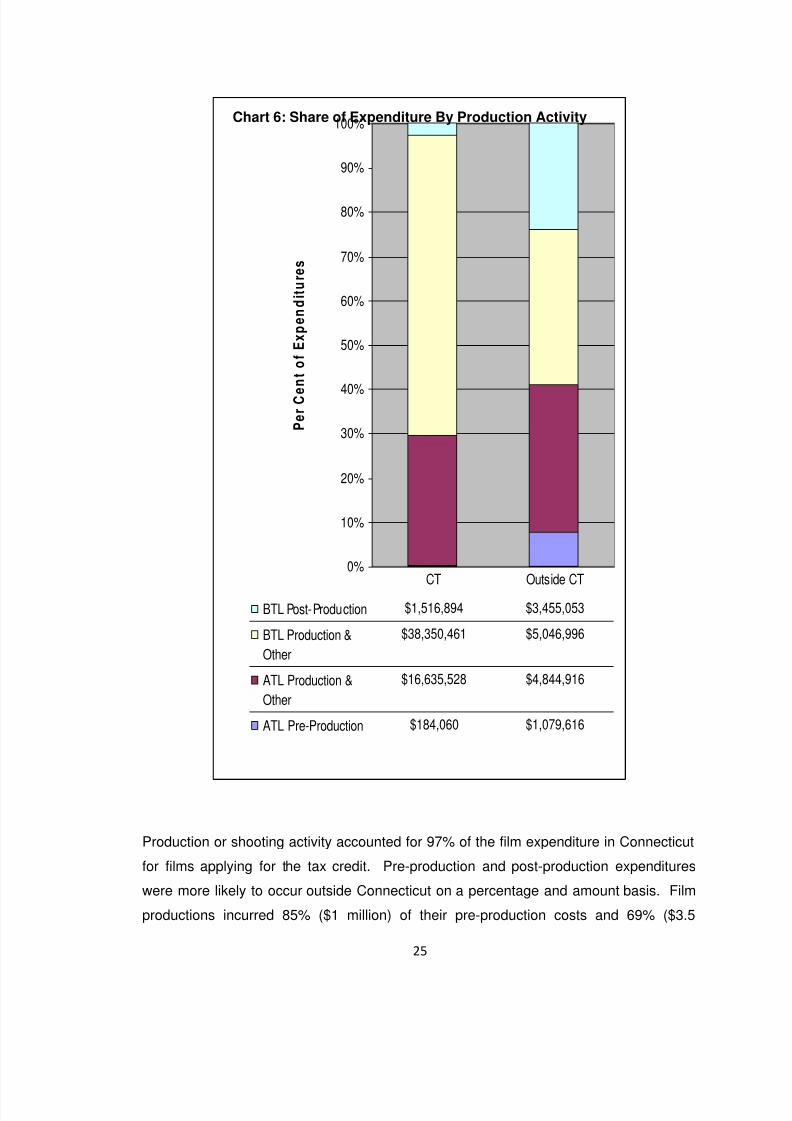
Further analysis of the tax credit applications reveals what types of film production
activities occurred in Connecticut in the study period. Chart 6 below shows the fraction
of total production expenditures by activity type inside and outside Connecticut whether
expenditures are qualified or not. Above-the-line (ATL) production refers to activities
related to performance, story creativity, and principal coordinators (producers and
directors) and their attendant expenses. Below-the-line (BTL) production refers to ‘crew’
activities that are largely behind the scenes; examples are special effects, wardrobe, set
design, production staff, and editing.
These categories are further broken out by the phase of production. Pre-production is
an above-the line activity. It involves the script and project development before the film
32Jonathan O’Connell, “Firms Want Broker Film Credits,” Hartford Business Journal, October 30, 2006.
Connecticut Tax
Credit-Qualified
82.8%
Outside
Connecticut
12.7%
Connecticut Non-
Tax Credit-
Qualified
4.5%
Chart 5: Distribution of Production Expenditure

8/8/2019 The Economic and Fiscal Impacts of Connecticut’s Film Tax Credit
http://slidepdf.com/reader/full/the-economic-and-fiscal-impacts-of-connecticuts-film-tax-credit 30/64
24
begins shooting. ‘ATL production and other’ includes direction (directors), continued
development (producers), ‘on camera’ activities (talent), and attendant expenses during
filming. ‘BTL production and other’ includes expenditures on crew, sets, business
services and their attendant expenses during filming. In both cases, ‘attendant
expenses’ include expenditures such as travel, lodging, per diem payments, meals, and
office space rental. Post-production involves taking the footage created during the
filming phase and assembling it into a finished product. This category includes editing,
visual effects, music, and sound and occurs after filming is complete. Chart 6 provides
percentages and dollar values for these categories.
8/8/2019 The Economic and Fiscal Impacts of Connecticut’s Film Tax Credit
http://slidepdf.com/reader/full/the-economic-and-fiscal-impacts-of-connecticuts-film-tax-credit 31/64
25
0%
10%
20%
30%
40%
50%
60%
70%
80%
90%
100%
P e r C e
n t o f E x p e n d i t u r e s
BTL Post-Production $1,516,894 $3,455,053
BTL Production &
Other
$38,350,461 $5,046,996
ATL Production &
Other
$16,635,528 $4,844,916
ATL Pre-Production $184,060 $1,079,616
CT Outside CT
Production or shooting activity accounted for 97% of the film expenditure in Connecticut
for films applying for the tax credit. Pre-production and post-production expenditures
were more likely to occur outside Connecticut on a percentage and amount basis. Film
productions incurred 85% ($1 million) of their pre-production costs and 69% ($3.5
Chart 6: Share of Expenditure By Production Activity
8/8/2019 The Economic and Fiscal Impacts of Connecticut’s Film Tax Credit
http://slidepdf.com/reader/full/the-economic-and-fiscal-impacts-of-connecticuts-film-tax-credit 32/64
26
million) of their post-production costs outside of Connecticut. These findings suggest
that the tax credit has attracted the more ‘footloose’ filming activities rather than the
industry’s underlying or fundamental activities.
These descriptive findings translate into an economic analysis of their impact on the
Connecticut economy. The next section describes the methodology used to model the
economic footprint left by the film productions in Connecticut during the study period.
Economic Impact Method
The impact analysis uses itemized amounts from the tax credit application to quantify the
direct economic effects of film production in Connecticut.33 The direct impact measures
the changes in goods and services purchased from the Connecticut economy by
production companies and their staffs. The indirect impact captures the ripple effect ofthis primary demand and describes the subsequent rounds of business-to-business
spending as one expands its business and buys more goods and services from its
supply chain. From these additional (ripple) sales, Connecticut firms experience
increased revenues and more workers have incomes to spend as well. This secondary
effect increases the volume of goods and services sold in Connecticut. This report uses
the Connecticut Economic Model (REMI) to estimate the economic impact (see
Appendix A for a description of the REMI model).
This analysis assumes the expenditure of motion picture productions applying for the
film tax credit represents ‘net new’ spending in the state (it does not displace any
existing spending but only adds to spending in the state). That is, we assume these
productions would not have located in Connecticut but for the tax credit. The literature
review above suggests the film industry is ‘footloose’ and able to relocate production
easily. That these productions located in Connecticut and applied for the credit suggests
that Connecticut’s film tax credit influenced their decision to locate production in the
state. In contrast, some productions occurred in Connecticut during the same period but
did not apply for the film tax credit.34 This report excludes this second group of
productions and assumes their work would have taken place in Connecticut without the
33The itemized amounts may differ slightly from the projected summary amounts.
34This information is based on conversations with the Connecticut Commission on Culture and Tourism film
division staff.

8/8/2019 The Economic and Fiscal Impacts of Connecticut’s Film Tax Credit
http://slidepdf.com/reader/full/the-economic-and-fiscal-impacts-of-connecticuts-film-tax-credit 33/64
27
film tax credit.35 The second group of productions is included in the ‘baseline’ of motion
picture production in Connecticut, while those taking advantage of the tax credit are
over-and-above this baseline film activity.
For the purposes of the impact analysis, DECD includes qualified and unqualified
expenditures in Connecticut because both affect its economy. This stance shifts the
analysis basis between the tax credit-qualification expenditures discussed above and the
expenditures considered below. The tax credit estimate remains $16.5 million based on
the accounting information considered in the tax credit filings.
Another shift in the analysis basis arises as this analysis excludes some reported
expenditures both for methodological reasons and for consistency with other similar film
studies we discuss in the literature review. The first exclusions are salary payments to
and fringe benefits of above-the-line (ATL) primary producers, executive producers,
primary directors, principal cast and supporting cast. Methodologically and
pragmatically, it seems unlikely that most big-budget film earners spend their take-home
pay in Connecticut. Although a few major motion picture stars, producers and directors
call Connecticut home, most others earn their wage here but return home to another
state to spend their income. With sizable salaries, recipients are likely to spend and
save in atypical patterns. Presumably and importantly, we assume highly-compensated
film production professionals save a significant portion of their salaries rather than spend
it. Therefore, including their income in the model as if they entirely spent it in
Connecticut would unrealistically overstate the impact of Connecticut’s film tax credit.
For similar reasons, the economic impact analysis of Louisiana’s tax credit excludes
these incomes as well. The payments to ATL primary producers, executive producers,
primary director, principal cast and supporting cast amounted to $13.8 million.
The second exclusion is the ‘loss and damages’ category. This accounting category
represents goods purchases accounted for elsewhere in the itemized expenditures that
were lost or damaged during the filming process. To include this category would double
count these expenditures. ‘Loss and Damages’ amounted to $155,534. These
exclusions together (payments to ATL personnel plus ‘loss and damages’) account for
almost $14 million of reported film tax expenditures in Connecticut.
35Saas, Darcey Ann (2006). “Hollywood East? Film Tax Credits in New England,” The Federal Reserve
Bank of Boston Policy Brief 06-3, http://www.bos.frb.org/economic/neppc/briefs/2006/briefs063.pdf.

8/8/2019 The Economic and Fiscal Impacts of Connecticut’s Film Tax Credit
http://slidepdf.com/reader/full/the-economic-and-fiscal-impacts-of-connecticuts-film-tax-credit 34/64
28
From detailed itemization on the tax credit applications, DECD translated accounting
categories (purchases of goods and services) into 70 REMI economic sectors using the
North American Industry Classification System (NAICS). In most instances, accounting
descriptions made translation categories apparent. Examples of expenditure types
include hotels, meals, set construction, editing equipment rentals, and film stock. In
some instances, modeling required us to make careful judgments discussed below.
Some productions group their expenditure for wages and materials together and some
do not. For modeling purposes, we need distinct expenditure in each category. To
obtain expenditure in each category, we derive a ratio from productions that report
separate expenditure for wages and materials. We allocate wages and materials
expenditure for those productions that did not separate wages and materials in a REMI
wage and material category in the same proportion as those that do. For example, one
film production reports ‘wardrobe’ expenditures in total. DECD uses the ratio of
expenditure by category derived from other productions to allocate aggregate wardrobe
expenditure into the required REMI wage and material sectors for those productions that
grouped such expenditure together.
DECD allocates categories such as ‘purchases’, ‘materials and supplies’, and
‘miscellaneous’ as follows: for ATL ‘purchases’, 80% accrues to the retail sector and
20% to the wholesale sector. Below-the-line (BTL) purchases by specific trades’ people
(such as lighting or sound technicians) accrue as follows: wholesalers (40%) and
retailers (60%). Purchased by below-the-line operations, ‘materials and supplies’ accrue
as follows: specialized manufacturing (20%), wholesale (40%) and retail (40%). The
‘materials and supplies’ category appear in areas such as wardrobe, props, and special
effects, in which we expect one-of-a-kind craftsmanship occurs. ‘Miscellaneous’
expenditure accrued entirely to the retail sector. These assumptions do not affect total
spending but only the allocation of expenditures among sectors for modeling purposes.
In many instances, the credit application form lists expenditures on fringe benefits for
staff. Because media production often engages freelance contractors, these fringe
benefits represent an important contribution to the employee’s income. From the Bureau
of Labor Statistics’ National Compensation Survey, motion picture industry standards
provide DECD a basis for allocating fringes among sectors (Figure 3). Mandated
benefits include the state worker compensation as well as federal programs.

8/8/2019 The Economic and Fiscal Impacts of Connecticut’s Film Tax Credit
http://slidepdf.com/reader/full/the-economic-and-fiscal-impacts-of-connecticuts-film-tax-credit 35/64
29
Connecticut’s population share of U.S. population provides the estimate of federal
insurance program dollars returning to Connecticut. The derived benefits to ATL and
BTL workers entered the REMI model in the categories depicted in Chart 7.
Insurance
25%
Supplemental
Pay
39%
Mandated
Employer
Taxes
22%
Retirement
14%
Source: DECD calculations using CCT data.
Another form of supplemental pay is ‘box rentals’. In the motion picture industry,
independent artists or crafts persons receive a ‘rental’ fee toward their toolkits. For
instance, a make-up artist might receive not only wages and benefits but also a
supplement toward paying for their make-up tools and kit. This supplement is additional
income or ‘sales’ in their respective industry that we enter into the REMI model.
In some instances, employees travel to Connecticut to shoot film. While in Connecticut,
they stay in hotels, eat meals, shop and travel and, we assume, generally behave as
tourists. Film production budgets include allowances for such expenses. For instance,
meals or ‘craft services’ are typically provided on set. When shooting continues through
meals, workers receive meal-offset payments (supplemental income). Transportation to
and from the state and to and from the set is typically provided by the film for out-of-state
workers. Some productions specify per diem payments as a catchall for non-
accommodation expenditures.
We reviewed several studies on visitor spending patterns. A 2006 study of the Monona
Terrace Community and Convention Center in Madison, Wisconsin, estimated that
Chart 7: Distribution of Fringe Benefits in the Motion PictureIndustry
8/8/2019 The Economic and Fiscal Impacts of Connecticut’s Film Tax Credit
http://slidepdf.com/reader/full/the-economic-and-fiscal-impacts-of-connecticuts-film-tax-credit 36/64
30
convention attendees spent an average of $738 per event. This study took recent
estimates of convention attendee spending from the Destination Marketing Association
International (DMAI) 2005 ExPact study, and adjusted them downwards to reflect the
“small market” definition of Madison and 2005 Monona Terrace actual data. The
average length of stay for an event was 3.56 nights. In 2003, C.H. Johnson Consulting,
Inc. studied convention spending in Peoria, Illinois, and found convention attendees
spent an average of $198 per day, and sporting event visitors spent approximately $57
per day in that area. During FY 2003 and 2004, the San Jose Convention & Visitor’s
Bureau estimated that convention and meeting attendees spent an average of $117 per
day, and day-trippers spent an average of $58 while visiting the city. The different
characteristics between “business” and “leisure” travelers reflect in their spending
patterns.
Based on the above studies, we identified visitor-spending profiles in the following
categories: retail, food and beverages, car rental, lodging, other transportation (fuel,
maintenance and tolls, parking), recreation and entertainment, and miscellaneous
(snacks and convenience store purchases, for example).
From our analysis of the foregoing visitor spending patterns, we assume visitors from
within Connecticut (in-state visitors) spend half their budget on food and beverages and
30% on other transportation. We assume in-state visitors do not spend on lodging and
car rental, but do spend on shopping for souvenirs, recreation, entertainment and
miscellaneous food items.
For visitors from outside Connecticut, we mirrored the Greater Madison Convention and
Visitor Bureau study’s estimates of their spending profile, and assume lodging
accounted for half their spending, 26% on food and beverage, 10% on shopping, 2% on
parking, 7% on other transportation and the remainder on recreation and entertainment
and miscellaneous items.

8/8/2019 The Economic and Fiscal Impacts of Connecticut’s Film Tax Credit
http://slidepdf.com/reader/full/the-economic-and-fiscal-impacts-of-connecticuts-film-tax-credit 37/64
31
Table 8: Estimated Visitor Spending as a Share of Total
Out-of-state visitor spending
as a share of total
In-state visitor spending
as a share of total
Retail 10% 5%
Food & Beverages 26% 50%
Car Rental 2% 0%
Lodging 51% 0%
Other Daily Transportation 7% 30%
Recreation &
Entertainment
3% 10%
Groceries & other
convenience items1% 5%
Total100% 100%
Source: DECD calculations using referenced studies
The current analysis distributes these per diem payments using convention visitor
expenditure vectors based on these studies expressed in Table 8. This study does not
include additional visitor spending beyond that included in the production budgets for
out-of-state workers. This assumption is conservative and may result in an
underestimate of the economic impact.
Excluding ‘loss and damages’ and some ATL salaries specified above, the total
spending for materials, salaries and benefits, and travel and living is about $43 million
based on film tax credit application filings for the study period. The $43 million includes
both tax credit-qualified and non-tax credit-qualified expenditures in Connecticut. DECDassumes this expenditure exceeds what would normally be spent on film production in
Connecticut because we consider it to result entirely from the film tax credit (while there
are other productions in Connecticut that did not file for the tax credit, we do not know
anything more than that they occurred). As such, the $43 million represents a direct

8/8/2019 The Economic and Fiscal Impacts of Connecticut’s Film Tax Credit
http://slidepdf.com/reader/full/the-economic-and-fiscal-impacts-of-connecticuts-film-tax-credit 38/64
32
injection into the Connecticut economy that ripples out through increased business sales
and personal incomes in the state economy.
The projected tax credit for the considered 2007 filings is $16.5 million based exclusively
on qualified Connecticut expenditures. These tax credits are transferable and may be
either applied to the film production company’s tax liability or sold to another company
with Connecticut tax liability. This analysis assumes that film tax credit purchasers
redeem the full value of the tax credit. Consequently, the tax credit reduces state tax
revenue. If the state adheres to the balanced-budget requirement, this reduction in
revenue implies that state government expenditures fall by $16.5 million.
Summary of key points and assumptions:
• Assume expenditures from productions applying for the tax credit represent ‘net
new’ expenditures in Connecticut.
• Thirteen motion picture productions spent $43 million on Connecticut goods and
services in both tax-eligible and non-tax eligible categories excluding loss and
damages and some ATL salaries.
• $55.1 million in tax-eligible expenditure (includes loss and damages and some
ATL salaries and does not include non-tax-eligible expenditure) implies a
potential tax credit of $16.5 million.
ECONOMIC IMPACT RESULTS
In the study period, the film productions filing for the Connecticut film tax credit created:
• 395 new FTE positions;
• $20.7 million in new Real Gross State Product36 (RGSP); and
• a reduction of $14.5 million in state revenues.
If the film productions filing for the tax credit represent new industry spending and thestate government balances its budget, the Connecticut economy will benefit from the tax
credit based on the first twelve months of the program’s operation.
36Gross State Product (GSP) is the value of goods and services produced in the state economy adjusted for
inflation.

8/8/2019 The Economic and Fiscal Impacts of Connecticut’s Film Tax Credit
http://slidepdf.com/reader/full/the-economic-and-fiscal-impacts-of-connecticuts-film-tax-credit 39/64
33
The results presented in this section report both direct and indirect impacts. Direct
spending includes (1) $43 million that the production companies spent on Connecticut
goods and services in both tax eligible and non-tax eligible categories; and, (2) $16.5
million in tax credits, which result in a reduction in state government expenditures under
a balanced budget assumption. The direct impact is the change from the baseline or
status quo forecast in spending on goods and services purchased in the Connecticut
economy and the reduction in government services. From this change in direct
spending, new sales increase incomes and businesses’ demand for inputs. These
indirect and induced effects cause a further change in personal and business incomes
and taxes.
Table 9 summarizes the annual average, net present value and peak values for four key
economic variables over a 6-year time horizon (2007 and five subsequent years to
2012). The annual average value is the change of the variable (e.g., employment) from
the baseline or status quo forecast averaged over six years. The net present value is
the discounted present value (at 5%) of the change from the baseline in each measure
from 2007-2012. The peak values are the maximum increase above the baseline
attained by each measure respectively from 2007-2012. In each case, these estimates
are the change from the assumed baseline resulting from new economic activity
stimulated by the film tax credit.
Table 9: Connecticut Film Tax Credit Economic & Fiscal Impact(in $2007 millions)
Variable AnnualAverage
NetPresentValue
Peak
Full Time Employment (Jobs) 63 NA 395
Population 39 NA 65
Gross State Product $3.02 $17.68 $20.72
Real Disposable Personal Income $1.26 $7.19 $6.58
State Government Revenues $0.22 $1.25 $1.07
Source: DECD calculations using REMI results.
Note that this analysis uses only twelve months of data. In the study period, thirteen
productions filed their audits for credits in Connecticut. For the remainder of the 6-year
time horizon (2007 plus 5 years to 2012), DECD assumes there is no motion picture
8/8/2019 The Economic and Fiscal Impacts of Connecticut’s Film Tax Credit
http://slidepdf.com/reader/full/the-economic-and-fiscal-impacts-of-connecticuts-film-tax-credit 40/64
34
production in Connecticut claiming a tax credit because we have no information. We
report the additional five years because REMI is a dynamic model in which it takes time
for the economic effects to be fully realized. However, the resulting ‘annual averages’
and ‘net present value’ need to be interpreted with caution. These values obtain from
twelve months of Connecticut’s film tax credit distributed over time. If the tax credit
continues to have the same effect each year (through an infusion of spending), the
values in Table 9 would be higher. As we show in Figures 4 through 8 below, the ‘peak’
values each occur in 2007 and are a better measure of what one might expect in future
years with new Connecticut productions claiming a film tax credit at roughly the same
level as during the study period.
Charts 8 through 12 below indicate the time path of employment (jobs), population, real
gross state product, real disposable income, and state revenue and expenditure. In
each case, the graphs show the total changes, that is, the direct, indirect and induced
changes stimulated by 2007 film production spending. Consequently, changes in
economic activity cluster around 2007. We include the 2006 baseline (status quo) for
visual comparison.
Additional employment (measured in FTE jobs) spikes to 395 jobs in 2007 and then falls
to baseline levels (see Chart 8 below). Averaged over six years, this represents an
annual average change of 63 new jobs in the state. Chart 9 shows that people are
attracted to Connecticut because of increased economic activity. Population peaks at 65
in 2007 and slowly continues to adjust at a declining rate over time. The annual average
increase in population is 39 people from 2007 and 2012.

8/8/2019 The Economic and Fiscal Impacts of Connecticut’s Film Tax Credit
http://slidepdf.com/reader/full/the-economic-and-fiscal-impacts-of-connecticuts-film-tax-credit 41/64
35
-100
0
100
200
300
400
500
Year
F T E
J o b s
Full Time Employment 0 395 4.64 -1.71 -5.62 -6.59 -6.35
2006 2007 2008 2009 2010 2011 2012
Source: DECD calculations using REMI results
0
10
20
30
40
50
60
70
Year
P e o p l e
Population 0 64.7 50.29 40.28 32.47 25.88 20.26
2006 2007 2008 2009 2010 2011 2012
Source: DECD calculations using REMI results
Charts 10 and 11 show changes in RGSP and Real Disposable Personal Income
(RDPI). RGSP is the value of all goods and services produced in the state economy in a
given year adjusted for inflation. RDPI is the portion of RGSP that filters into take-home
Chart 8: FTE Jobs Change
Chart 9: Population Change

8/8/2019 The Economic and Fiscal Impacts of Connecticut’s Film Tax Credit
http://slidepdf.com/reader/full/the-economic-and-fiscal-impacts-of-connecticuts-film-tax-credit 42/64
36
incomes adjusted for taxes and inflation. Changes in both economic measures spike in
2007 and then rapidly return to baseline in the absence of additional economic changes
in future years. RDPI returns to the baseline slower than RGSP. In the peak year,
RGSP increases by $20.72 million and RDPI increases by $6.58 million (both expressed
in 2007 million $). The net present value of RGDP increases by $17.68 million from
2007-2012. The net present value of RDPI increases by $7.19 million. These figures
reflect new film production activities’ impact on the state economy.
-5
0
5
10
15
20
25
Year
$ 2 0 0 7 M i l l i o n s
Gross State Product 0 20.72 0.14 -0.45 -0.75 -0.78 -0.77
2006 2007 2008 2009 2010 2011 2012
Source: DECD calculations using REMI results
Chart 10: Gross State Product Change

8/8/2019 The Economic and Fiscal Impacts of Connecticut’s Film Tax Credit
http://slidepdf.com/reader/full/the-economic-and-fiscal-impacts-of-connecticuts-film-tax-credit 43/64
37
-2
0
2
4
6
8
Year
$ 2 0 0 7 M i l l i o n s
Real Disposable
Personal Income
0 6.58 0.73 0.43 0.14 -0.09 -0.21
2006 2007 2008 2009 2010 2011 2012
Source: DECD calculations using REMI results
Chart 12 shows the indirect fiscal impact of the film tax credit. The total change in
government expenditure and tax revenue collection comprises the fiscal impact. We
divide this change into the direct and the indirect effects. In the balanced budget
scenario considered here the direct fiscal impacts are a $16.5 million decrease in state
revenue and a simultaneous, matching $16.5 million decrease in state expenditure.
From a fiscal standpoint, these two changes cancel each other. The film tax credit’s
indirect effects arise from induced economy-wide activity associated with the film
industry expansion and from the state government’s reduction in spending. For
example, more net new jobs increase incomes, which, in turn, increase net income taxes
paid.
Considering the indirect fiscal impact exclusively resulting from the reduction in
government spending, Chart 12 shows an average annual increase in state revenues of
$0.22 million with a peak of $1.1 million in 2007 and a net present value of $1.25 million
from 2007-2012. The peak value best represents the film tax credit’s potential impact
going forward. If the state balances its budget as we assume, this analysis suggests the
Chart 11: Real Disposable Income Change

8/8/2019 The Economic and Fiscal Impacts of Connecticut’s Film Tax Credit
http://slidepdf.com/reader/full/the-economic-and-fiscal-impacts-of-connecticuts-film-tax-credit 44/64
38
state will receive net new fiscal revenue from the film tax credit, that is, revenues will
exceed expenditure in each year in which the credit is claimed.
-3
-2
-1
0
1
2
Year
$ 2 0 0 7
M
i l l i o n s
State Government
Revenues
0 1.07 0.13 0.08 0.04 0.01 -0.01
State Government
Expenditure
0 -2.21 0.50 0.43 0.37 0.31 0.25
2006 2007 2008 2009 2010 2011 2012
Source: DECD calculations using REMI results
State expenditure falls with respect to the baseline as the economy expands (that is,
jobs are created) and the need for programs related to unemployment insurance,
Medicaid, retirement benefits and similar insurance trust requirements decrease as
employment increases. State expenditure falls by $2.2 million at its peak, $0.06 million
on average annually and $0.54 million in net present value from 2007-2017. These netchanges present a favorable outcome for fiscal balance.
Chart 12: Indirect State Revenue and Ex enditure

8/8/2019 The Economic and Fiscal Impacts of Connecticut’s Film Tax Credit
http://slidepdf.com/reader/full/the-economic-and-fiscal-impacts-of-connecticuts-film-tax-credit 45/64
39
CONCLUSION
The film tax credit has a small and positive impact on the Connecticut economy. At its
peak, the program contributes $20.72 million to RGSP and $6.58 million to RDPI. This
change adds to Connecticut’s total estimated $217.4 billion in total RGSP and $147.4billion in total RDPI projected by the REMI model for 2007. In 2007, the film tax credit
adds 395 FTE jobs to the more than 2.2 million FTE jobs projected for the entire
Connecticut economy in 2007.
This expansion is fueled by a $16.5 million film tax credit within a balanced budget
scenario. Connecticut experiences the tax credit impact during the year for which
productions shot in the state. The effects quickly dissipate after the productions
complete their work and leave the state. The additional economic activity exclusively
generated by productions claiming the credit (its indirect effect) returns $1.25 million in
present value tax revenues. For every dollar spent on the tax credit, the state receives
$0.08 back in additional revenue. This will have a small favorable fiscal impact only if
the state government pays for the film tax credit by reducing spending. The state will not
receive enough additional revenue from increased economic activity to pay for the
estimated $16.5 million in tax credits applied for in 2007. From a fiscal perspective, this
program cannot pay for itself in one year. However, every dollar spent on the film tax
credit generates $1.07 of additional RGSP in present value terms. This is because
people and firms continue spending through time the money injected into the economy
when the productions were operating in Connecticut. This finding suggests that the tax
credit does increase economy-wide activity by a greater amount than the cost of
implementation. In this case, present value findings are sensitive to the time horizon
chosen for the study given that only one year of data is available.
In July 2007, the legislature expanded the film tax credit to include additional types of
media production (specifically, digital animation) and an infrastructure credit. The
current analysis does not reflect the impact of these changes. Further, only productionsthat filed their documentation by September 30, 2007 as described in footnote 1 are
included in this report. No data was available on where production company employees
lived. For those workers residing outside the state, their income represents ‘leakage’
from the state in the REMI model. Leakages are income paid out that is not recycled
into new sales for Connecticut businesses. This report assumes some ATL workers

8/8/2019 The Economic and Fiscal Impacts of Connecticut’s Film Tax Credit
http://slidepdf.com/reader/full/the-economic-and-fiscal-impacts-of-connecticuts-film-tax-credit 46/64
40
(talent, producers, and directors) reside outside Connecticut. To the extent this
understates the number of film production workers from outside the state, this analysis
overstates the impact on the Connecticut economy (and vice versa). In general,
however, the report makes conservative assumptions about the impact of film production
spending in Connecticut.
The early experience of Connecticut’s film production tax credit suggests the tax credit
has a small and positive impact on the state’s economy. If the government pays for the
tax credit by reducing expenditures, this analysis suggests the state could receive
additional revenue from induced economic activity. These returns are not likely to be
sufficient to pay for the cost of the film tax credit in one year. Expansions to the tax
credit program and additional years of data may give a stronger indication of the
potential impact of the tax credit program on the Connecticut economy.

8/8/2019 The Economic and Fiscal Impacts of Connecticut’s Film Tax Credit
http://slidepdf.com/reader/full/the-economic-and-fiscal-impacts-of-connecticuts-film-tax-credit 47/64
41
APPENDIX A: THE REMI MODEL
The Connecticut REMI model is a dynamic, multi-sector, regional model developed and
maintained for the Connecticut Center for Economic Analysis by Regional Economic
Models, Inc. of Amherst, Massachusetts. This model provides detail on all eightcounties in the State of Connecticut and any combination of these counties. The REMI
model includes all of the major inter-industry linkages among 466 private industries,
aggregated into 67 major industrial sectors. With the addition of farming and three
public sectors (state and local government, civilian federal government, and military),
there are 70 sectors represented in the model for the eight counties.
The REMI model is based on a national input-output (I/O) model that the U.S. Depart-
ment of Commerce (DoC) developed and continues to maintain. Modern input-output
models are largely the result of groundbreaking research by Nobel laureate Wassily
Leontief. Such models focus on the inter-relationships between industries and provide
information about how changes in specific variables—whether economic variable such
as employment or prices in a certain industry or other variables like population affect
factor markets, intermediate goods production, and final goods production and
consumption.
The REMI Connecticut model takes the U.S. I/O “table” results and scales them accord-
ing to traditional regional relationships and current conditions, allowing the relationshipsto adapt at reasonable rates to changing conditions. Listed below are some salient
structural characteristics of the REMI model:
• REMI determines consumption on an industry-by-industry basis, and models real
disposable income in Keynesian fashion, that is, with prices fixed in the short run
and GDP (Gross Domestic Product) determined solely by aggregate demand.
• The demand for labor, capital, fuel, and intermediate inputs per unit of output
depends on relative prices of inputs. Changes in relative prices cause producers
to substitute cheaper inputs for relatively more expensive inputs.
• Supply of and demand for labor in a sector determine the wage level, and these
characteristics are factored by regional differences. The supply of labor depends
on the size of the population and the size of the workforce.

8/8/2019 The Economic and Fiscal Impacts of Connecticut’s Film Tax Credit
http://slidepdf.com/reader/full/the-economic-and-fiscal-impacts-of-connecticuts-film-tax-credit 48/64
42
• Migration—that affects population size—depends on real after-tax wages as well
as employment opportunities and amenity value in a region relative to other
areas.
• Wages and other measures of prices and productivity determine the cost of doing
business. Changes in the cost of doing business will affect profits and/or prices
in a given industry. When the change in the cost of doing business is specific to
a region, the share of the local and U.S. market supplied by local firms is also
affected. Market shares and demand determine local output.
• “Imports” and “exports” between states are related to relative prices and relative
production costs.
• Property income depends only on population and its distribution adjusted for
traditional regional differences, not on market conditions or building rates relative
to business activity.
• Estimates of transfer payments depend on unemployment details of the previous
period, and total government expenditures are proportional to population size.
• Federal military and civilian employment is exogenous and maintained at a fixed
share of the corresponding total U.S. values, unless specifically altered in the
analysis.
• Because the each variable in the REMI model is related, a change in one
variable affects many others. For example, if wages in a certain sector rise, the
relative prices of inputs change and may cause the producer to substitute capital
for labor. This changes demand for inputs, which affects employment, wages,
and other variables in those industries. Changes in employment and wages
affect migration and the population level that in turn affect other employment
variables. Such chain-reactions continue in time across all sectors in the model.
Depending on the analysis performed, the nature of the chain of events
cascading through the model economy can be as informative for the policymaker
as the final aggregate results. Because REMI generates extensive sectoral
detail, it is possible for experienced economists in this field to discern the
dominant causal linkages involved in the results.
The REMI model is a structural model, meaning that it clearly includes cause-and-effect
relationships. The model shares two key underlying assumptions with mainstream

8/8/2019 The Economic and Fiscal Impacts of Connecticut’s Film Tax Credit
http://slidepdf.com/reader/full/the-economic-and-fiscal-impacts-of-connecticuts-film-tax-credit 49/64
43
economic theory: households maximize utility and producers maximize profits . In the
model, businesses produce goods to sell to other firms, consumers, investors,
governments and purchasers outside the region. The output is produced using labor,
capital, fuel and intermediate inputs. The demand for labor, capital and fuel per unit
output depends on their relative costs, because an increase in the price of one of these
inputs leads to substitution away from that input to other inputs. The supply of labor in
the model depends on the number of people in the population and the proportion of
those people who participate in the labor force. Economic migration affects population
size and its growth rate. People move into an area if the real after-tax wage rates or the
likelihood of being employed increases in a region.
Supply of and demand for labor in the model determine the real wage rate. These wage
rates, along with other prices and productivity, determine the cost of doing business for
each industry in the model. An increase in the cost of doing business causes either an
increase in price or a cut in profits, depending on the market supplied by local firms.
This market share combined with the demand described above determines the amount
of local output. The model has many other feedbacks. For example, changes in wages
and employment impact income and consumption, while economic expansion changes
investment and population growth impacts government spending.
Model Overview
Figure A1.1 is a pictorial representation of the model. The Output block shows a factory
that sells to all the sectors of final demand as well as to other industries. The Labor and
Capital Demand block shows how labor and capital requirements depend on both output
and their relative costs. Population and Labor Supply are shown as contributing to
demand and to wage determination in the product and labor market. The feedback from
this market shows that economic migrants respond to labor market conditions. Demand
and supply interact in the Wage, Price and Profit block. Once prices and profits are
established, they determine market shares, which along with components of demand,
determine output.

8/8/2019 The Economic and Fiscal Impacts of Connecticut’s Film Tax Credit
http://slidepdf.com/reader/full/the-economic-and-fiscal-impacts-of-connecticuts-film-tax-credit 50/64
44
The REMI model brings together the above elements to determine the value of each of
the variables in the model for each year in the baseline forecasts. The model includes
each inter-industry relationship that is in an input-output model in the Output block, but
goes well beyond the input-output model by including the relationships in all of the other
blocks shown in Figure A-1.1.
In order to broaden the model in this way, it is necessary to estimate key relationships
econometrically. This is accomplished by using extensive data sets covering all areas of
the country. These large data sets and two decades of research effort have enabled
REMI to simultaneously maintain a theoretically sound model structure and build a
model based on all the relevant data available. The model has strong dynamic
properties, which means that it forecasts not only what will happen, but also when it will
happen. This results in long-term predictions that have general equilibrium properties.
This means that the long-term properties of general equilibrium models are preservedwithout sacrificing the accuracy of event timing predictions and without simply taking
elasticity estimates from secondary sources.
Figure A-1.1
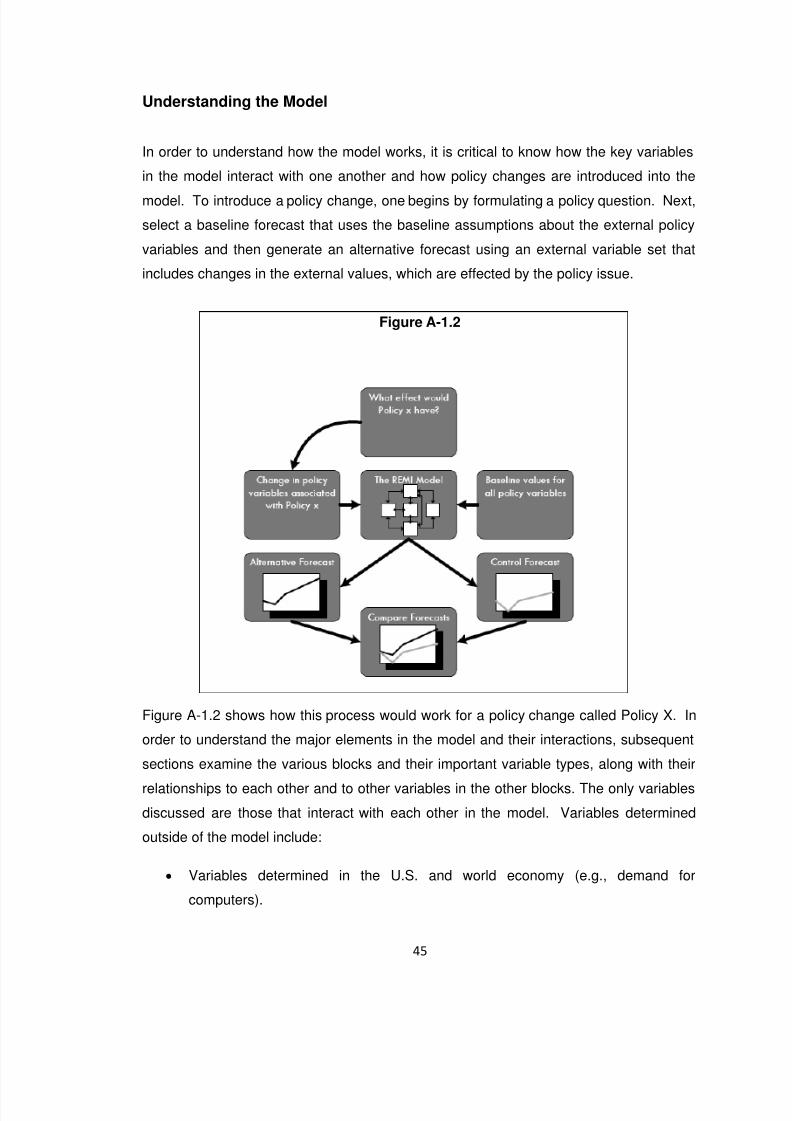
8/8/2019 The Economic and Fiscal Impacts of Connecticut’s Film Tax Credit
http://slidepdf.com/reader/full/the-economic-and-fiscal-impacts-of-connecticuts-film-tax-credit 51/64
45
Understanding the Model
In order to understand how the model works, it is critical to know how the key variables
in the model interact with one another and how policy changes are introduced into the
model. To introduce a policy change, one begins by formulating a policy question. Next,
select a baseline forecast that uses the baseline assumptions about the external policy
variables and then generate an alternative forecast using an external variable set that
includes changes in the external values, which are effected by the policy issue.
Figure A-1.2 shows how this process would work for a policy change called Policy X. In
order to understand the major elements in the model and their interactions, subsequent
sections examine the various blocks and their important variable types, along with their
relationships to each other and to other variables in the other blocks. The only variables
discussed are those that interact with each other in the model. Variables determined
outside of the model include:
• Variables determined in the U.S. and world economy (e.g., demand for
computers).
Figure A-1.2
8/8/2019 The Economic and Fiscal Impacts of Connecticut’s Film Tax Credit
http://slidepdf.com/reader/full/the-economic-and-fiscal-impacts-of-connecticuts-film-tax-credit 52/64
46
• Variables that may change and affect the local area, but over which the local
area has no control (e.g., an increase in international migration).
• Variables that are under control of local policy (e.g., local tax rates).
For simplicity, the last two categories are called policy variables. Changes in these
variables are automatically entered directly into the appropriate place in the model
structure. Therefore, the diagram showing the model structure also serves as a guide to
the organization of the policy variables (see Figure A-1.3).
Output Block
The Output Block variables are:
• State and Local Government Spending
• Investment
• Exports
• Consumption
• Real Disposable Income
These variables interact with each other to determine output and depend on variable
values determined in other blocks as follows:
Variables in the Output Block Variables Outside of the
Output Block that are
Included in its Determinants
State and Local Government Spending Population
Investment Optimal Capital Stock (also the
actual capital stock)

8/8/2019 The Economic and Fiscal Impacts of Connecticut’s Film Tax Credit
http://slidepdf.com/reader/full/the-economic-and-fiscal-impacts-of-connecticuts-film-tax-credit 53/64
47
Output Share of Local Market
(The proportion of local demand
supplied locally, called the Regional
Purchase Coefficient)
Exports The Regional Share of Interregional
and International Trade
Real Disposable Income Employment, Wage Rates and the
Consumer Expenditure Price Index
Labor and Capital Demand Block
The Labor and Capital Demand block has only three types of key variables:
• Employment - determined by the labor/output ratio and the output in each
industry, determined in the Output block.
• Optimal Capital Stock - depends on relative labor, capital and fuel costs and the
amount of employment.
• Labor/Output Ratio - depends on relative labor, capital and fuel costs.
Simply put, if the cost of labor increases relative to the cost of capital, the labor per unit
of output falls and the capital per unit of labor increases.
Population and Labor Supply Block
The model predicts population for 600 cohorts segmented by age, ethnicity and gender.
This block also calculates the demographic processes - births, deaths and aging. The
models deal with different population sectors as follows:
• Retired Migrants are based on past patterns for each age cohort 65 and over.
• International migrants follow past regional distributions by country of origin.
8/8/2019 The Economic and Fiscal Impacts of Connecticut’s Film Tax Credit
http://slidepdf.com/reader/full/the-economic-and-fiscal-impacts-of-connecticuts-film-tax-credit 54/64
48
• Military and college populations are treated as special populations that do not
follow normal demographic processes.
• Economic migrants are those who are sensitive to changes in quality of life and
relative economic conditions in the regional economies. The economic variables
that change economic migration are employment opportunity and real after-tax
wage rates.
This block allows the determination of the size of the labor force by predicting the labor
force participation rates for age, ethnicity and gender cohorts, which are then applied to
their respective cohorts and summed. The key variables that change participation rates
within the model are the ratio of employment to the relevant population (labor market
tightness) and the real after-tax wage rates.
Wage, Price and Profit Block
Variables contained within the Wage, Price and Profit block are:
• Employment Opportunity
• Wage Rate
• Production Costs
• Housing Price
• Consumer Price Deflator
• Real Wage Rate
• Industry Sales Price
• Profitability
The wage rate is determined by employment opportunity and changes in employment
demand by occupation for occupations that require lengthy training. The housing price
increases when population density increases. The Consumer Expenditure Price Index is
based on relative commodity prices, weighted by their share of U.S. nominal personal
consumption expenditures. The model uses the price index to calculate the real after-
tax wage rate for potential migrants that includes housing price directly, while the price
index used to deflate local income uses the local sales price of construction. Wage rates
affect production costs, as well as other costs, and they in turn determine profitability or
8/8/2019 The Economic and Fiscal Impacts of Connecticut’s Film Tax Credit
http://slidepdf.com/reader/full/the-economic-and-fiscal-impacts-of-connecticuts-film-tax-credit 55/64
49
sales prices, depending on whether the type of industry involved serves mainly local or
external markets. For example, a cost increase for all local grocery stores results in an
increase in their prices, while an increase in costs for a motor vehicle factory reduces its
profitability of production at that facility but may not increase their prices worldwide.
Market Shares Block
The Market Shares Block consists of:
• Share of Local Market
• Share of External Market
An increase in prices leads to some substitution away from local suppliers toward
external suppliers. In addition, a reduction in profitability for local factories leads to lessexpansion of these factories relative to those located in areas where profits have not
decreased. These responses occur because the U.S. is a relatively open economy
where firms can move to the area that is most advantageous for their business.
The Complete Model
Figure A1.3 illustrates the entire model and its components and linkages. This diagram
is helpful in understanding the complex relationships shared by variables within the
various blocks discussed above, as well as their relationships to variables in other
blocks.

8/8/2019 The Economic and Fiscal Impacts of Connecticut’s Film Tax Credit
http://slidepdf.com/reader/full/the-economic-and-fiscal-impacts-of-connecticuts-film-tax-credit 56/64
50
Figure A-1.3

8/8/2019 The Economic and Fiscal Impacts of Connecticut’s Film Tax Credit
http://slidepdf.com/reader/full/the-economic-and-fiscal-impacts-of-connecticuts-film-tax-credit 57/64
51
APPENDIX B: U.S. FILM PRODUCTION INCENTIVES
Table B1 below summarizes film production incentive programs in the U.S. as of 2006.
Note: New Hampshire tax credits are state tax policy, not directly related to film
production and the following states have no film tax credit program: Alabama, Alaska,Ohio, and North Dakota.
Table B1: Film Production Incentives by State or Region
Region Incentive Qualifications
Alabama No incentive available
Alaska No incentive available
Arizona Transferable tax credit equal to 20%of all in-state expenditures of
$250,000 to $1 million and 30% onin-state expenditures of more than 1million; $5 million per production and$40 million cap in 2007 and $7million per production and $50 millioncap in 2008
Spend more than $250,000; atleast 35% of employees (cast
and crew) must be Arizonaresidents, for 2008 50% mustbe Arizona residents; mustreceive approval prior tobeginning filming
Arkansas State sales and use tax refunded if$500,000 is spent within 6 months or$1 million is spent within 12 months
Must provide a letter of supportfrom the community in whichfilming will take place
California Little or no fee on state ownedproperties; no sales tax onproduction services; no state lodging
taxColorado 10% rebate on local expenditures for
out of state productions on qualifiedexpenditures; cap of $600,000;lodging tax rebate when stayingmore than 30 days
Minimum of $1 million inqualified expenditures; 75% ofcrew payroll must be Coloradoresidents and 75% of below-the-line expenditures must bequalified local expenditures
Connecticut Transferable tax credit equal to 30%of qualified in-state expenses onproductions; hotel tax does not applyon stays longer than 30 days
Spend more than $50,000 onqualified in-state expenditures;obscene material does notqualify; Compensation inexcess of $15 million perindividual does not qualify,media buys and promotionalevents do not qualify; news,sports and weather do notqualify
Delaware No state or local sales tax

8/8/2019 The Economic and Fiscal Impacts of Connecticut’s Film Tax Credit
http://slidepdf.com/reader/full/the-economic-and-fiscal-impacts-of-connecticuts-film-tax-credit 58/64
52
Table B1: Film Production Incentives by State or Region (continue)
District ofColumbia
Refundable grant equal to the lesserof 10% of qualified expenses or100% of sales and use tax if morethan $500,000 is spent
Spend more than $500,000 onqualified in-state expenditures
Florida Rebate of 15% of qualified in-stateexpenditures; additional rebate of 5%for filming in the off season;additional 2% rebate for creating afamily-friendly film; statewide cap of$25 million and each production canqualify for $8 million; sales taxexemption
Spend more than $625,000;commercials and music videosspend more than $100,000;digital media projects spendmore than $300,000; only first$400,000 of compensation toFlorida residents qualify
Georgia Base tax credit of 9% on qualifiedexpenditures and both in-state andout-of-state labor, an additional 3% isawarded for expenses on Georgiaresidents
Spend more than $500,000 onqualified in-state expenditures
Hawaii Refundable tax credit of 15% onOahu and 20% on neighbor islands;$8 million credit cap per production
Must make effort to hire localcrew and make contributionstoward local education orworkforce development
Idaho Rebate of sales tax; hotel stays ofmore than 30 days do not pay salesor hotel tax
Spend more than $200,000 onqualifying expenses
Illinois Transferable tax credit against stateincome tax equal to 20% of in-stateexpenditures and labor; hotel taxwaived on stays longer than 30 days
Spend at least $100,000 onqualifying expenditures; taxcredit on salary limited to thefirst $100,000 to each resident;minority hiring and trainingrequirements
Indiana Hotel stays longer than 30 days areexempt from taxes
Iowa Transferable income tax credit equalto 25% of in-state expenditureswhere local vendors are able toreduce their gross income by amountreceived on qualified expenditures; a
25% credit is available to investorsas well
Spend more than $100,000 onqualifying expenses; the sameperson cannot claim theexpenditure and investor credit
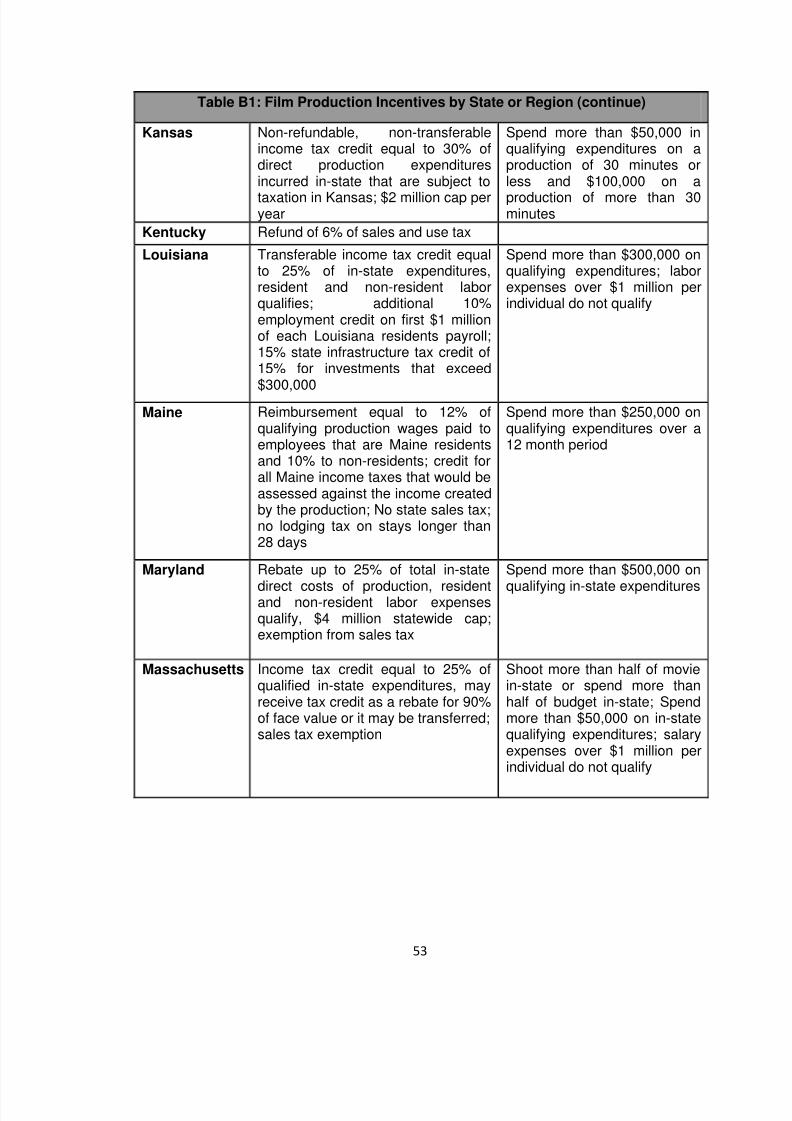
8/8/2019 The Economic and Fiscal Impacts of Connecticut’s Film Tax Credit
http://slidepdf.com/reader/full/the-economic-and-fiscal-impacts-of-connecticuts-film-tax-credit 59/64
53
Table B1: Film Production Incentives by State or Region (continue)
Kansas Non-refundable, non-transferableincome tax credit equal to 30% ofdirect production expendituresincurred in-state that are subject to
taxation in Kansas; $2 million cap peryear
Spend more than $50,000 inqualifying expenditures on aproduction of 30 minutes orless and $100,000 on a
production of more than 30minutes
Kentucky Refund of 6% of sales and use tax
Louisiana Transferable income tax credit equalto 25% of in-state expenditures,resident and non-resident laborqualifies; additional 10%employment credit on first $1 millionof each Louisiana residents payroll;15% state infrastructure tax credit of15% for investments that exceed$300,000
Spend more than $300,000 onqualifying expenditures; laborexpenses over $1 million perindividual do not qualify
Maine Reimbursement equal to 12% ofqualifying production wages paid toemployees that are Maine residentsand 10% to non-residents; credit forall Maine income taxes that would beassessed against the income createdby the production; No state sales tax;no lodging tax on stays longer than28 days
Spend more than $250,000 onqualifying expenditures over a12 month period
Maryland Rebate up to 25% of total in-state
direct costs of production, residentand non-resident labor expensesqualify, $4 million statewide cap;exemption from sales tax
Spend more than $500,000 on
qualifying in-state expenditures
Massachusetts Income tax credit equal to 25% ofqualified in-state expenditures, mayreceive tax credit as a rebate for 90%of face value or it may be transferred;sales tax exemption
Shoot more than half of moviein-state or spend more thanhalf of budget in-state; Spendmore than $50,000 on in-statequalifying expenditures; salaryexpenses over $1 million perindividual do not qualify

8/8/2019 The Economic and Fiscal Impacts of Connecticut’s Film Tax Credit
http://slidepdf.com/reader/full/the-economic-and-fiscal-impacts-of-connecticuts-film-tax-credit 60/64
54
Table B1: Film Production Incentives by State or Region (continue)
Michigan Refundable sales tax credit up to $2million per production, 12% credit onexpenditures from $200,000 to $1million increasing to 20% credit on
expenditures above $5 million; $7million cap per fiscal year; no tax onhotel stays longer than 30 days
Compensation above$100,000 per individual doesnot qualify
Minnesota Rebate of up to 15% of qualified in-state production costs, capped at$1.3 million per biennium; sales taxexemption on commercials; not hoteltax on stays longer than 30 days
At least 60% of film must shootin-state
Mississippi Cash rebate of 20% of the first $1
million of local expenditures, 25% ofthe next $4 million, and 30% of localexpenditures over $5 million; 10%rebate for out-of-state payroll; salestax waived for qualifying purchases;max $5 million rebate per production
Obscene material does not
qualify
Missouri Transferable state tax credit equal to50% of qualified expenses, maximumcredit per project is $1 million,capped at $1.5 million (credit can becarried to next year if no funds
available)
Spend more than $300,000 onqualifying expenditures
Montana Refundable tax credit equal to 14%of the first $50,000 paid to eachMontana resident; 9% refundable taxcredit on qualified in-stateexpenditures (excluding labor); nohotel tax on stays longer than 30days
Nebraska Sales and lodging taxes are waivedfor hotel stay of 30 days or more
Nevada Reduction in hotel tax after 30 days
NewHampshire
No sales and use tax, personalincome tax or capital gains tax inNew Hampshire
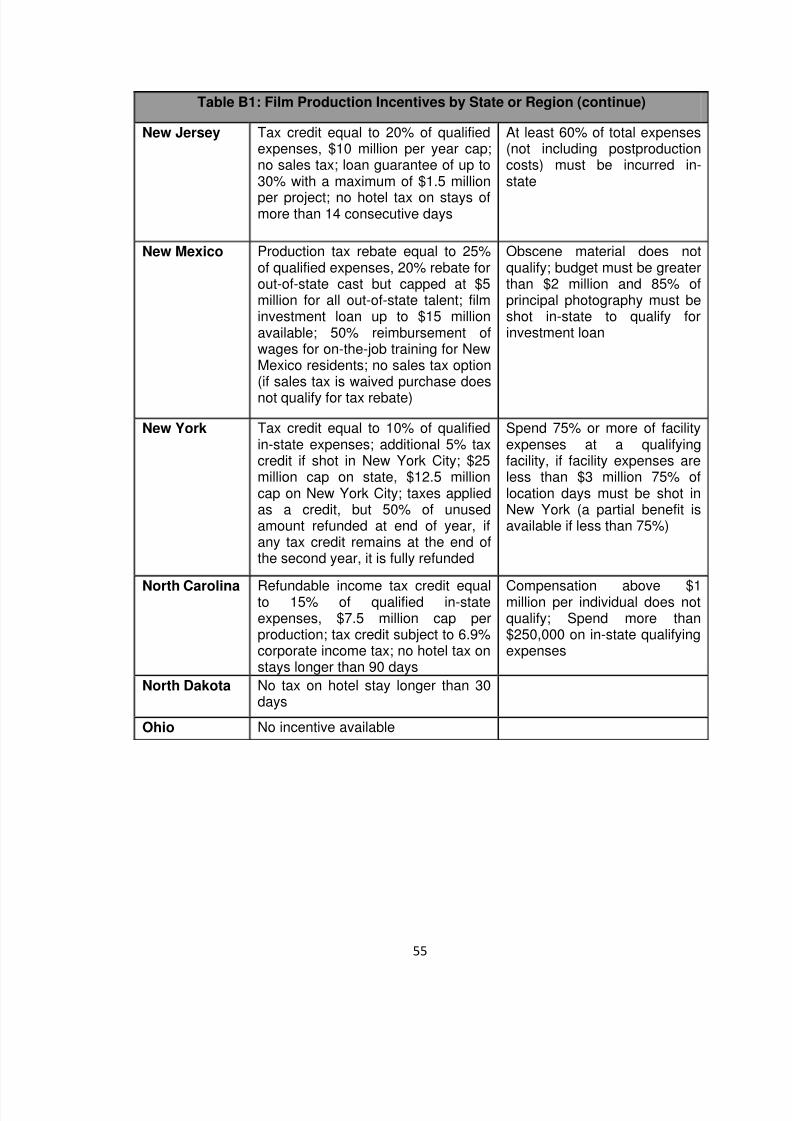
8/8/2019 The Economic and Fiscal Impacts of Connecticut’s Film Tax Credit
http://slidepdf.com/reader/full/the-economic-and-fiscal-impacts-of-connecticuts-film-tax-credit 61/64
55
Table B1: Film Production Incentives by State or Region (continue)
New Jersey Tax credit equal to 20% of qualifiedexpenses, $10 million per year cap;no sales tax; loan guarantee of up to30% with a maximum of $1.5 million
per project; no hotel tax on stays ofmore than 14 consecutive days
At least 60% of total expenses(not including postproductioncosts) must be incurred in-state
New Mexico Production tax rebate equal to 25%of qualified expenses, 20% rebate forout-of-state cast but capped at $5million for all out-of-state talent; filminvestment loan up to $15 millionavailable; 50% reimbursement ofwages for on-the-job training for NewMexico residents; no sales tax option(if sales tax is waived purchase does
not qualify for tax rebate)
Obscene material does notqualify; budget must be greaterthan $2 million and 85% ofprincipal photography must beshot in-state to qualify forinvestment loan
New York Tax credit equal to 10% of qualifiedin-state expenses; additional 5% taxcredit if shot in New York City; $25million cap on state, $12.5 millioncap on New York City; taxes appliedas a credit, but 50% of unusedamount refunded at end of year, ifany tax credit remains at the end ofthe second year, it is fully refunded
Spend 75% or more of facilityexpenses at a qualifyingfacility, if facility expenses areless than $3 million 75% oflocation days must be shot inNew York (a partial benefit isavailable if less than 75%)
North Carolina Refundable income tax credit equalto 15% of qualified in-stateexpenses, $7.5 million cap perproduction; tax credit subject to 6.9%corporate income tax; no hotel tax onstays longer than 90 days
Compensation above $1million per individual does notqualify; Spend more than$250,000 on in-state qualifyingexpenses
North Dakota No tax on hotel stay longer than 30days
Ohio No incentive available
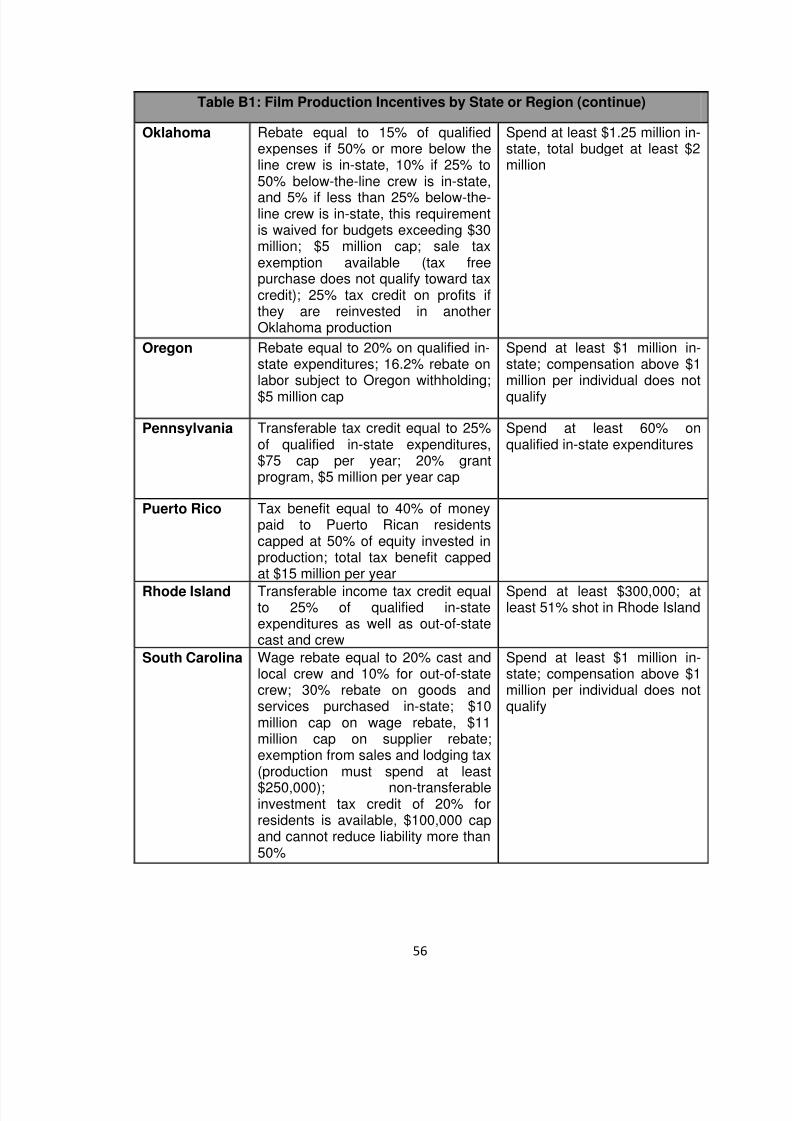
8/8/2019 The Economic and Fiscal Impacts of Connecticut’s Film Tax Credit
http://slidepdf.com/reader/full/the-economic-and-fiscal-impacts-of-connecticuts-film-tax-credit 62/64
56
Table B1: Film Production Incentives by State or Region (continue)
Oklahoma Rebate equal to 15% of qualifiedexpenses if 50% or more below theline crew is in-state, 10% if 25% to50% below-the-line crew is in-state,
and 5% if less than 25% below-the-line crew is in-state, this requirementis waived for budgets exceeding $30million; $5 million cap; sale taxexemption available (tax freepurchase does not qualify toward taxcredit); 25% tax credit on profits ifthey are reinvested in anotherOklahoma production
Spend at least $1.25 million in-state, total budget at least $2million
Oregon Rebate equal to 20% on qualified in-state expenditures; 16.2% rebate onlabor subject to Oregon withholding;
$5 million cap
Spend at least $1 million in-state; compensation above $1million per individual does not
qualify
Pennsylvania Transferable tax credit equal to 25%of qualified in-state expenditures,$75 cap per year; 20% grantprogram, $5 million per year cap
Spend at least 60% onqualified in-state expenditures
Puerto Rico Tax benefit equal to 40% of moneypaid to Puerto Rican residentscapped at 50% of equity invested inproduction; total tax benefit cappedat $15 million per year
Rhode Island Transferable income tax credit equalto 25% of qualified in-stateexpenditures as well as out-of-statecast and crew
Spend at least $300,000; atleast 51% shot in Rhode Island
South Carolina Wage rebate equal to 20% cast andlocal crew and 10% for out-of-statecrew; 30% rebate on goods andservices purchased in-state; $10million cap on wage rebate, $11million cap on supplier rebate;exemption from sales and lodging tax(production must spend at least
$250,000); non-transferableinvestment tax credit of 20% forresidents is available, $100,000 capand cannot reduce liability more than50%
Spend at least $1 million in-state; compensation above $1million per individual does notqualify

8/8/2019 The Economic and Fiscal Impacts of Connecticut’s Film Tax Credit
http://slidepdf.com/reader/full/the-economic-and-fiscal-impacts-of-connecticuts-film-tax-credit 63/64
57
Table B1: Film Production Incentives by State or Region (continue)
South Dakota No sales and use tax or contractortax
News, athletic events andobscene material do notqualify; spend at least$250,000 in taxable costs and
only expenditures in excess of$250,000 qualify
Tennessee Rebate equal to 13% of qualified in-state expenditures, 15% rebate if25% of cast and/or crew areTennessee residents, 17% if spend$20,000 on music created in-state,$100,000 cap; an additional 15%refund is available on qualified in-state expenses (must spend at least$1 million on qualified in-stateexpenses)
Spend at least $200,000 onqualified in-state expenditures;budget must be at least$500,000; compensation ofmore than $100,000 perindividual does not qualify
Texas Grant equal to 5% of qualifying in-state expenditures, $2 million cap perfilm, $2.5 cap million per televisionprogram, $200,000 cap percommercial, and $250,000 cap pervideo game; a production in an“under-utilized area” qualifies for anadditional 1.25% grant; no sales anduse tax
For certain productions onlythe first $50,000 of each in-state resident's salaryqualifies, for certainproductions only the first$100,000 of in-state residentssalary qualifies, for departmentheads only the first $200,000of in-state residents qualifies;spend at least $1 million forfeature or television program,$100,000 for a commercial,
infomercial, music video orvideo game; 70% of labor mustbe in-state; 80% filming in-state
Utah Refundable rebate equal to 15% ofqualified in-state expenditures; $4million cap per year
Spend at least $1 million in-state, wages paid to non-residents do not qualify
Vermont Sales tax waived, lodging tax waivedfor hotel stay of 31 days or more;non-resident performer pay the lower
of the rate of Vermont and theirhome state
Virginia Rebate paid at Governor’s discretion;no sales and use tax; no hotel tax onstays longer than 30 days

8/8/2019 The Economic and Fiscal Impacts of Connecticut’s Film Tax Credit
http://slidepdf.com/reader/full/the-economic-and-fiscal-impacts-of-connecticuts-film-tax-credit 64/64
Table B1: Film Production Incentives by State or Region (continue)
Washington Rebate on up to 20% of qualified in-state expenditures, $1 million cap perproduction; $3.5 million cap per year
Spend at least $500,000 forfeature films, $300,000 fortelevision, and $250,000 forcommercials; compensation
over $250,000 for in-stateresidents does not qualify
West Virginia Non-transferable tax credit (onlybenefits in-state investors) equal to27% on qualifying expenses with anadditional 4% bonus for in-stateresident labor; $10 million cap peryear; no sales tax; no lodging tax onstays longer than 30 consecutivedays
Wisconsin Refundable tax credit equal to 25%
of qualified in-state productionexpenses excluding wages; 25% ofthe first $25,000 of wages paid to in-state residents excluding the twohighest paid employees; sales anduse tax refundable
Productions more than 30
minutes spend at least$100,000 on qualified in-stateexpenditures, productions lessthan 30 minutes spend at least$50,000 on qualified in-stateexpenditures
Wyoming Cash rebate of 12-15% of qualifiedin-state expenses; $1 million cap peryear; lodging tax waived on stayslonger than 30 days
Spend $500,000 on qualifiedin-state expenditures
Source: DECD literature search.