Embed Size (px)
Citation preview

Repackaging Connecticut’s EconomyA New Take on State Manufacturing
Revisiting Government’s Role in the Economy
An Unlikely Source of Public Revenue Revealed
WINTER 2013

The only breaks Connecticut’s econ-omy seems to catch these days are bad ones. The state lost another 1,700 jobs in 2012-Q3, following a 4,000-job swoon the previous quar-ter. Unemployment surged even as potential workers appeared to leave the labor force in droves. Cracks began appearing in what had been a rock-solid state budget. And the jobs forecast for 2013 remains tepid at best.
Employment may be up a hair from the same point last year, but it’s down on a seasonally-adjusted basis for the second quarter in a row. Four of the last five quarters have been the worst for job growth in the recovery to date.
The transportation, trade and utili-ties sector shrank by 2,400, nearly half stemming from staff reductions at retail stores. Hotels and restaurants trimmed their workforces by 900, too. Construction dropped 1,800, despite the best quarter for housing permits in four years. And in a poor harbin-ger of future hiring, professional and business services contracted by 1,300 as employers let about as many tem-porary workers go.
There were gains, to be sure, 1,400 in education, 2,500 in health care, even 1,100 in arts, entertainment and recreation, but not enough to offset the drag from industries that down-sized.
The dim employment picture might be expected to aggravate unemploy-ment, but the jobless rate shot up nearly a full point between 2012-Q2 and 2012-Q3, three times faster than the jobs erosion alone might warrant. What’s more, the quarter recorded the largest exodus of would-be work-ers from the labor force—more than 12,000—since 1976, which should have offset any upward pressure on the jobless rate. The real source of this seeming misfortune might simply be a survey error by the U.S. Census Bureau.
There’s less doubt, however, that the state’s budget situation has taken a turn for the worse, as state revenue slipped 2% in 2012-Q3, following a 0.4% decline a quarter earlier, and growing shortfalls are anticipated in the current and coming fiscal years. Personal income, which drives income, sales and other tax revenue, has for the latest four quarters underperformed relative to all recent recovery periods (graph).
A year from now, the state could be marking job gains of 3,000 or more per quarter, but that assumes we man-age to steer clear of some rocky shoals in the intervening period (see page 14). Until then, avoiding additional job losses would not be an insignifi-cant achievement.
This issue introduces a new report card on Connecticut manufacturing, maps manufacturing concentration across Connecticut towns, and wel-comes in our “Forward Look” the founder and CEO of Lex Products, a maker of electrical power and distri-bution systems, who shares his secret to manufacturing success in this state. We also comb through years of cross-state data for evidence of government’s contribution to real per-capita output and, in an aside, we offer a short primer on the economics of seized property.
2 THE CONNECTICUT ECONOMY Winter 2013
CONNECTICUT ECONOMIC INDICATORS
(Percent change: 2011-Q3 to 2012-Q3)
Indicators of Current Economic Activity
Total Nonfarm Jobs +0.2%
Number Unemployed 0.0%
Labor Force -1.0%
Manufacturing
Jobs -1.0%
Avg. Weekly Hours -0.4%
Avg. Hourly Earnings -5.1%
CT Mfg. Prod. Index -1.7%
New Auto Registrations +8.6%
Travel and Tourism Index +0.4%
Bradley Airport
Passengers -5.4%
Freight -3.5%
State Tax Receipts
Income +8.6%
Sales +4.9%
Real Estate Conveyance +10.9%
Electricity Sales +2.2%
State Exports +4.1%
Personal Income (est.) +3.3%
Coincident GDI +0.3% Indicators of Future Economic Activity
Initial Unemp. Claims -9.9%
Housing Permits +25.2%
Net New Business Starts +7.3%
Leading GDI +3.8%
TAkING SToCk BREAkING BAD
-8%
-6%
-4%
-2%
0
2%
4%
6%
8%
121110987654321
2000
1980s
1990
2008
Recession:
CT INCOME grOwTH lAgs IN THE CUrrENT rECOvErY
CONTENTS winter 2013 – volume 21 Number 1
Taking Stock ........................................2
Manufacturing Report Card ...............3
Government and Real GDP ................6
Centerfold: Manufacturing LQs ..........8
Seized Property Primer .....................10
Labor Market Outlook .......................12
Labor Market Data ............................13
Quarterly Forecast .............................14
A Forward Look .................................16
Quarter of Recovery
4-q
tr %
D in
Rea
l Per
sona
l Inc
ome
SoURCE: The Connecticut Economy based on BEA data.
Winter 2013 THE CONNECTICUT ECONOMY 3
By STEvEN P. LANzA
Mention “manufacturing” and images from a bygone era, of sprawling brick factories, belching smokestacks, clanking machines, and earnest work-ers, might come to mind. But manu-facturing is more than just a vestige of Connecticut’s economic past. Our new report card of manufacturing activity suggests that the industry remains a vital part of Connecticut’s economic present and promises to play a key role in its future.
Like the premature obituaries writ-ten of Mark Twain, reports of the death of Connecticut manufacturing are greatly exaggerated. True, manu-facturing isn’t the jobs engine that it once was. Factory employment in the state has shrunk from 477,000 or about one-third of total jobs in 1969 to just 174,000 or less than 10% of jobs statewide in 2011 according to BEA records.
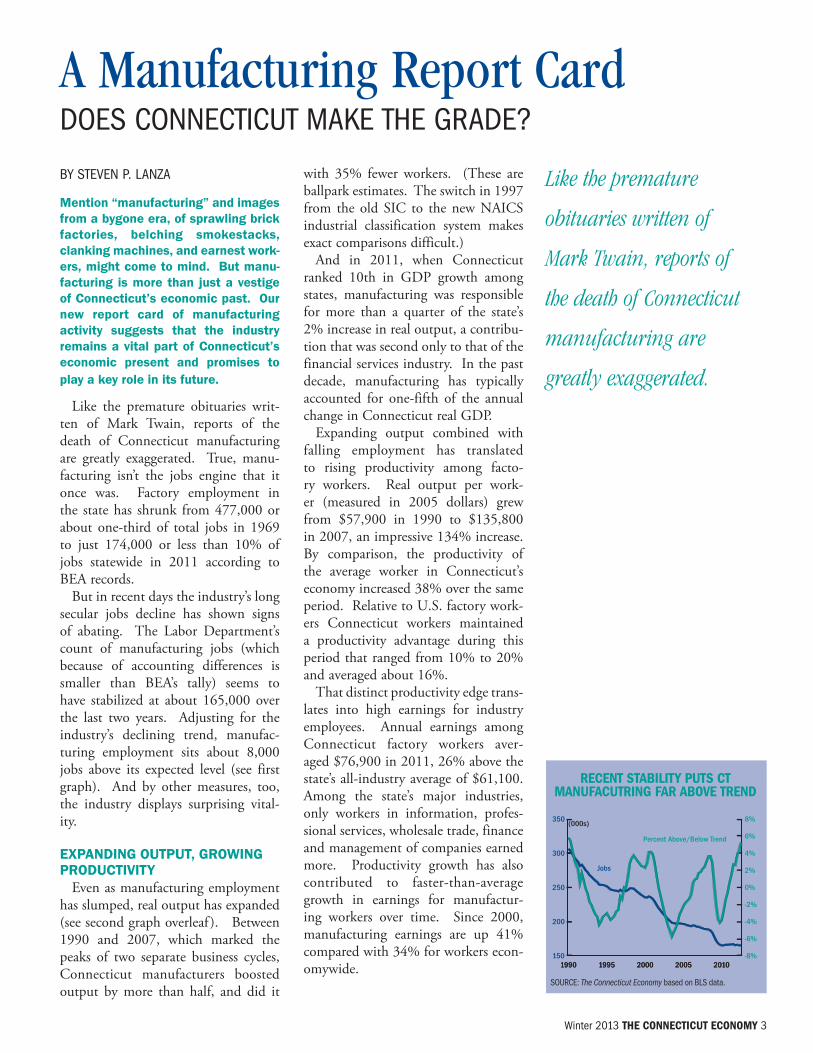
But in recent days the industry’s long secular jobs decline has shown signs of abating. The Labor Department’s count of manufacturing jobs (which because of accounting differences is smaller than BEA’s tally) seems to have stabilized at about 165,000 over the last two years. Adjusting for the industry’s declining trend, manufac-turing employment sits about 8,000 jobs above its expected level (see first graph). And by other measures, too, the industry displays surprising vital-ity.
ExpANDINg OUTpUT, gROwINg pRODUCTIvITy
Even as manufacturing employment has slumped, real output has expanded (see second graph overleaf ). Between 1990 and 2007, which marked the peaks of two separate business cycles, Connecticut manufacturers boosted output by more than half, and did it
with 35% fewer workers. (These are ballpark estimates. The switch in 1997 from the old SIC to the new NAICS industrial classification system makes exact comparisons difficult.)
And in 2011, when Connecticut ranked 10th in GDP growth among states, manufacturing was responsible for more than a quarter of the state’s 2% increase in real output, a contribu-tion that was second only to that of the financial services industry. In the past decade, manufacturing has typically accounted for one-fifth of the annual change in Connecticut real GDP.
Expanding output combined with falling employment has translated to rising productivity among facto-ry workers. Real output per work-er (measured in 2005 dollars) grew from $57,900 in 1990 to $135,800 in 2007, an impressive 134% increase. By comparison, the productivity of the average worker in Connecticut’s economy increased 38% over the same period. Relative to U.S. factory work-ers Connecticut workers maintained a productivity advantage during this period that ranged from 10% to 20% and averaged about 16%.
That distinct productivity edge trans-lates into high earnings for industry employees. Annual earnings among Connecticut factory workers aver-aged $76,900 in 2011, 26% above the state’s all-industry average of $61,100. Among the state’s major industries, only workers in information, profes-sional services, wholesale trade, finance and management of companies earned more. Productivity growth has also contributed to faster-than-average growth in earnings for manufactur-ing workers over time. Since 2000, manufacturing earnings are up 41% compared with 34% for workers econ-omywide.
A Manufacturing Report Card DoES CoNNECTICUT MAkE THE GRADE?
150
200
250
300
350
Jobs
20102005200019951990-8%
-6%
-4%
-2%
0%
2%
4%
6%
8%
Percent Above/Below Trend
20102005200019951990
(000s)
rECENT sTAbIlITY pUTs CT MANUFACUTrINg FAr AbOvE TrENd
SoURCE: The Connecticut Economy based on BLS data.
Like the premature
obituaries written of
Mark Twain, reports of
the death of Connecticut
manufacturing are
greatly exaggerated.

4 THE CONNECTICUT ECONOMY Winter 2013
MANUfACTURINg’S fACElIfTThe factory floor isn’t the noisy, grimy
workshop it once was. Manufacturing has become far more technological-ly advanced, requiring sophisticated machines and computers operated by highly trained and skilled work-ers. While there’s no universal defi-nition of a high-tech industry, one common standard developed by the OECD defines a sector as technologi-cally intensive if it either produces or uses products that require substantial and ongoing research and development efforts. So sectors like food, bever-age, textile and apparel manufacturing are less technologically advanced while computers, electronics and chemicals are more so.
From 1997 to 2010, the share of manufacturing output produced by Connecticut high-tech firms has increased from less than 60% to more than 70% (third graph). Particularly striking is the growth in computer and electronic product manufactur-ing, which jumped from barely 1% of all manufacturing output in 1997, to more than 13% in 2010. Chemical manufacturing, which includes phar-maceuticals, also climbed from 12% in 1997 to as high as 30% in 2007, before the recession cleaved that quotient back to 15% in 2010.
Transportation equipment, where aerospace and much defense-related manufacturing takes place, has also gained share. The sector produced 23% of industry output in 2010 com-pared with 20% in 1997.
BIg ThINgS, SMAll pACkAgESThough the iconic manufacturing
enterprise may be a concrete behemoth claiming acres of industrial property and employing thousands of workers in round-the-clock shifts, the reality is a bit different. The lion’s share of Connecticut manufacturers are small to mid-sized, and most manufacturing workers are employed by these more modest enterprises.
In 2009, the latest year for data from the Small Business Administration, the vast majority of Connecticut manufac-turing establishments (85%) employed fewer than 100 workers (fourth graph). That’s up from 80% in 1990. The share of mid-size (100 to 499 workers) and large (> 500 workers) establish-ments saw corresponding decreases, from 8% to 6% and from 12% to 8%, respectively.
Although the employment statistics aren’t quite so lopsided, a slim major-ity (51%) of workers was employed in small to mid-sized firms in 2009. That’s a jump of 14 percentage points from 1990. So the typical Connecticut manufacturer is far more likely to be small to mid-sized rather than large; and the typical employee is more likely to be employed in these smaller enter-prises.
Outsourcing, the contracting-out of business activities once performed within a firm, has no doubt contrib-uted to the shrinking size of firms over time. So, too, has the rise of custom and batch manufacturing processes run by numerically controlled devices that have, in many cases, supplanted old-style mass production carried along moving assembly lines.
On a related note: establishments with fewer employees are far more dynamic than are their larger coun-terparts. A typical year between 1990 and 2009, for example, saw the birth of about 290 establishments with fewer than 500 employees, most with fewer than five workers. That’s a birth rate of about 6%. By comparison, an average of fewer than 20 large firms were born annually, a birth rate of just 3.5%.
Death rates for smaller firms are higher, too, about 7.5% versus 6% for large enterprises. The pattern for jobs is much the same: higher birth and death rates for smaller firms than for larger ones.
The difference between the birth and death rates yields the net growth in the number of firms (or jobs). But the sum of the two rates is what analysts call “churn,” a combination of firms (or jobs) simultaneously appearing and disappearing from the economy. Early 20th century Austrian econo-mist Joseph Shumpeter described this process as one of “creative destruction” whereby obsolete products or tech-nologies make way for new innova-tions, and resources are allocated to more efficient uses. Though in the short-run the disruption that “churn” causes might crimp industry growth, in the long run “churn,” led by smaller firms, can be an important source of economic change and development.
A MANUfACTURINg INDExSo, overall, how does Connecticut’s
manufacturing industry stack up? To answer that question, it would help to combine these various dimensions of manufacturing activity—income, out-put, employment, productivity, tech-nological sophistication and “churn”—into a composite index that would allow us to compare Connecticut to other states. But that raises at least two potential problems: how do we com-bine data measured in different units, number of jobs and dollars of output
0
$5
$10
$15
$20
$25
$30
Real (2005) Output
0
$20
$40
$60
$80
$100
$120
$140
$160
Real (2005) Output per Worker
1990 1995 2000 2005 2010
Billions (000s)
CT MANUFACTUrINg OUTpUT ANd prOdUCTIvITY ClIMb
SoURCE: The Connecticut Economy based on BEA data.
0
20%
40%
60%
80%
100%
High-Tech
Low-Tech
2010
2009
2008
2007
2006
2005
2004
2003
2002
2001
2000
1999
1998
1997
SoURCE: The Connecticut Economy based on BEA data.
CONNECTICUT MANUFACTUrINg bECOMEs INCrEAsINglY HIgH-TECH
Sha
re o
f M
anuf
actu
ring
Out
put
for example, and how do we weight the contributions of each component to the overall index without introducing our own personal, subjective biases?
A common way to do this is to let the numbers “do their own talking” by standardizing the data, and then calcu-lating the first principal component of the several data series, something many statistical software packages do easily. Standardizing the variables—subtract-ing each series’ mean from the individ-ual observations and then dividing by the standard deviation—converts each observation into a score on a scale with a mean of zero and standard deviation of one. The first principal compo-nent is the simple linear combination of these standardized data series that provides a “best fit” model for all the data points. By capturing the central tendency of the data, the first principal component provides a good way of summarizing the data without intro-ducing the researcher’s own prejudices.
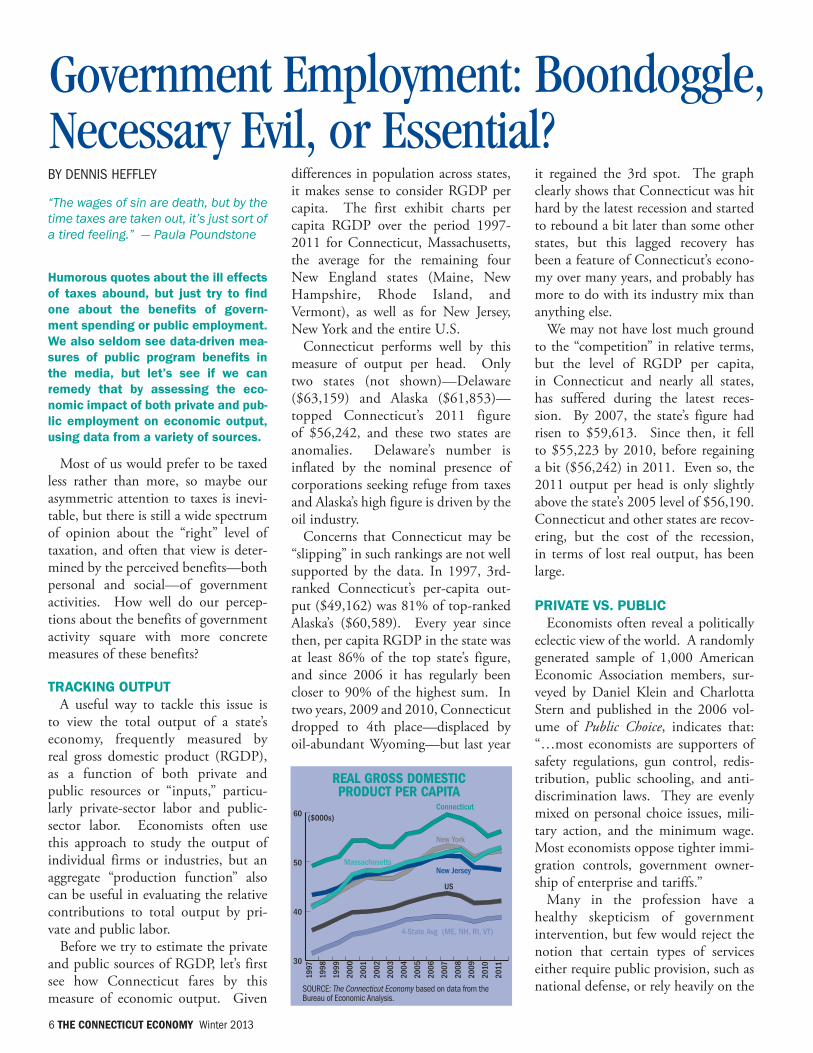
The nearby table ranks states from high to low based on this first princi-pal component measure. Component scores were converted to percentiles and then curved to an average of 75, so states could be graded along the famil-iar A-F academic scale. Connecticut ranks sixth, behind Oregon, Indiana, Wisconsin, Massachusetts, and Louisiana, with a score of 91—a solid A- grade.
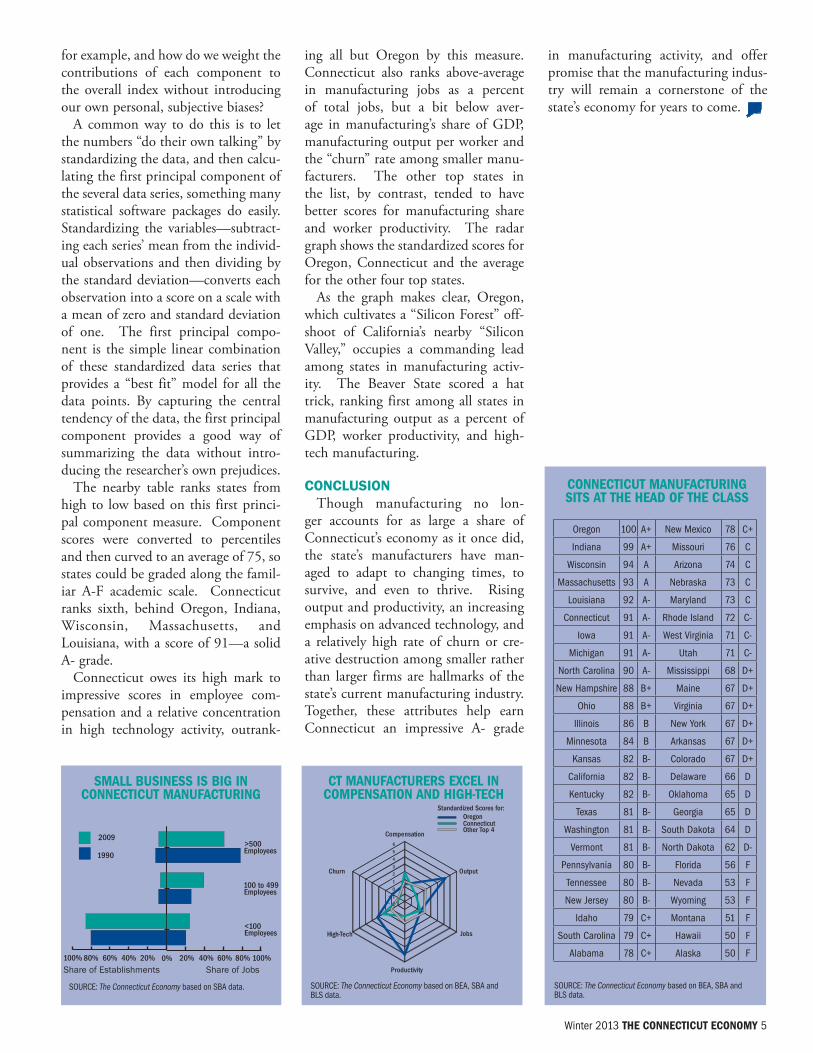
Connecticut owes its high mark to impressive scores in employee com-pensation and a relative concentration in high technology activity, outrank-
ing all but Oregon by this measure. Connecticut also ranks above-average in manufacturing jobs as a percent of total jobs, but a bit below aver-age in manufacturing’s share of GDP, manufacturing output per worker and the “churn” rate among smaller manu-facturers. The other top states in the list, by contrast, tended to have better scores for manufacturing share and worker productivity. The radar graph shows the standardized scores for Oregon, Connecticut and the average for the other four top states.
As the graph makes clear, Oregon, which cultivates a “Silicon Forest” off-shoot of California’s nearby “Silicon Valley,” occupies a commanding lead among states in manufacturing activ-ity. The Beaver State scored a hat trick, ranking first among all states in manufacturing output as a percent of GDP, worker productivity, and high-tech manufacturing.
CONClUSIONThough manufacturing no lon-
ger accounts for as large a share of Connecticut’s economy as it once did, the state’s manufacturers have man-aged to adapt to changing times, to survive, and even to thrive. Rising output and productivity, an increasing emphasis on advanced technology, and a relatively high rate of churn or cre-ative destruction among smaller rather than larger firms are hallmarks of the state’s current manufacturing industry. Together, these attributes help earn Connecticut an impressive A- grade
in manufacturing activity, and offer promise that the manufacturing indus-try will remain a cornerstone of the state’s economy for years to come.
Winter 2013 THE CONNECTICUT ECONOMY 5
0%20%40%60%80%100%
<100
100 to 499
>500
20% 40% 60% 80%
1990
2009
100 to 499
<100
>500
100%
Employees
Employees
Employees
sMAll bUsINEss Is bIg IN CONNECTICUT MANUFACTUrINg
SoURCE: The Connecticut Economy based on SBA data.
- 2
- 1
0
1
2
3
4
5
6
Compensation
Output
Jobs
Productivity
High-Tech
Churn
OregonConnecticutOther Top 4
Standardized Scores for:
CT MANUFACTUrErs ExCEl IN COMpENsATION ANd HIgH-TECH
SoURCE: The Connecticut Economy based on BEA, SBA and BLS data.
oregon 100 A+ New Mexico 78 C+
Indiana 99 A+ Missouri 76 C
Wisconsin 94 A Arizona 74 C
Massachusetts 93 A Nebraska 73 C
Louisiana 92 A- Maryland 73 C
Connecticut 91 A- Rhode Island 72 C-
Iowa 91 A- West virginia 71 C-
Michigan 91 A- Utah 71 C-
North Carolina 90 A- Mississippi 68 D+
New Hampshire 88 B+ Maine 67 D+
ohio 88 B+ virginia 67 D+
Illinois 86 B New york 67 D+
Minnesota 84 B Arkansas 67 D+
kansas 82 B- Colorado 67 D+
California 82 B- Delaware 66 D
kentucky 82 B- oklahoma 65 D
Texas 81 B- Georgia 65 D
Washington 81 B- South Dakota 64 D
vermont 81 B- North Dakota 62 D-
Pennsylvania 80 B- Florida 56 F
Tennessee 80 B- Nevada 53 F
New Jersey 80 B- Wyoming 53 F
Idaho 79 C+ Montana 51 F
South Carolina 79 C+ Hawaii 50 F
Alabama 78 C+ Alaska 50 F
CONNECTICUT MANUFACTUrINg sITs AT THE HEAd OF THE ClAss
SoURCE: The Connecticut Economy based on BEA, SBA and BLS data.
Share of Establishments Share of Jobs
By DENNIS HEFFLEy
“The wages of sin are death, but by the time taxes are taken out, it’s just sort of a tired feeling.” — Paula Poundstone
humorous quotes about the ill effects of taxes abound, but just try to find one about the benefits of govern-ment spending or public employment. we also seldom see data-driven mea-sures of public program benefits in the media, but let’s see if we can remedy that by assessing the eco-nomic impact of both private and pub-lic employment on economic output, using data from a variety of sources.
Most of us would prefer to be taxed less rather than more, so maybe our asymmetric attention to taxes is inevi-table, but there is still a wide spectrum of opinion about the “right” level of taxation, and often that view is deter-mined by the perceived benefits—both personal and social—of government activities. How well do our percep-tions about the benefits of government activity square with more concrete measures of these benefits?
TRACkINg OUTpUTA useful way to tackle this issue is
to view the total output of a state’s economy, frequently measured by real gross domestic product (RGDP), as a function of both private and public resources or “inputs,” particu-larly private-sector labor and public-sector labor. Economists often use this approach to study the output of individual firms or industries, but an aggregate “production function” also can be useful in evaluating the relative contributions to total output by pri-vate and public labor.
Before we try to estimate the private and public sources of RGDP, let’s first see how Connecticut fares by this measure of economic output. Given
differences in population across states, it makes sense to consider RGDP per capita. The first exhibit charts per capita RGDP over the period 1997-2011 for Connecticut, Massachusetts, the average for the remaining four New England states (Maine, New Hampshire, Rhode Island, and Vermont), as well as for New Jersey, New York and the entire U.S.
Connecticut performs well by this measure of output per head. Only two states (not shown)—Delaware ($63,159) and Alaska ($61,853)—topped Connecticut’s 2011 figure of $56,242, and these two states are anomalies. Delaware’s number is inflated by the nominal presence of corporations seeking refuge from taxes and Alaska’s high figure is driven by the oil industry.
Concerns that Connecticut may be “slipping” in such rankings are not well supported by the data. In 1997, 3rd-ranked Connecticut’s per-capita out-put ($49,162) was 81% of top-ranked Alaska’s ($60,589). Every year since then, per capita RGDP in the state was at least 86% of the top state’s figure, and since 2006 it has regularly been closer to 90% of the highest sum. In two years, 2009 and 2010, Connecticut dropped to 4th place—displaced by oil-abundant Wyoming—but last year
it regained the 3rd spot. The graph clearly shows that Connecticut was hit hard by the latest recession and started to rebound a bit later than some other states, but this lagged recovery has been a feature of Connecticut’s econo-my over many years, and probably has more to do with its industry mix than anything else.
We may not have lost much ground to the “competition” in relative terms, but the level of RGDP per capita, in Connecticut and nearly all states, has suffered during the latest reces-sion. By 2007, the state’s figure had risen to $59,613. Since then, it fell to $55,223 by 2010, before regaining a bit ($56,242) in 2011. Even so, the 2011 output per head is only slightly above the state’s 2005 level of $56,190. Connecticut and other states are recov-ering, but the cost of the recession, in terms of lost real output, has been large.
pRIvATE vS. pUBlICEconomists often reveal a politically
eclectic view of the world. A randomly generated sample of 1,000 American Economic Association members, sur-veyed by Daniel Klein and Charlotta Stern and published in the 2006 vol-ume of Public Choice, indicates that: “…most economists are supporters of safety regulations, gun control, redis-tribution, public schooling, and anti-discrimination laws. They are evenly mixed on personal choice issues, mili-tary action, and the minimum wage. Most economists oppose tighter immi-gration controls, government owner-ship of enterprise and tariffs.”
Many in the profession have a healthy skepticism of government intervention, but few would reject the notion that certain types of services either require public provision, such as national defense, or rely heavily on the
6 THE CONNECTICUT ECONOMY Winter 2013
SoURCE: The Connecticut Economy based on data from the Bureau of Economic Analysis.
rEAl grOss dOMEsTIC prOdUCT pEr CApITA
Government Employment: Boondoggle, Necessary Evil, or Essential?

Winter 2013 THE CONNECTICUT ECONOMY 7
public sector to finance the activity. A public tax or toll used to pay private contractors for road construction is a good example of the latter. Most of these “gray areas” involve goods or services that could, and often are, provided privately as well as publicly: health care, education and prisons are the obvious ones. It’s no coincidence that these “mixed good” examples are also the biggest and most controver-sial areas in the ongoing debate about government’s appropriate role in the economy.
We can’t resolve an issue of this sort, one that’s been around for decades if not centuries, but we can shed some light on how both the private sector and the public sector contribute to economic performance. The earlier graph only shows a few states, but even so, it reveals how one measure of eco-nomic performance, RGDP per capita, varies across states and over time. To focus on the role of the private and the public sectors in generating output, a panel database—48 contiguous states over 15 years, 1997-2011—was com-piled and used to estimate the simple linear regression model reported in the table.
Output for each state in each time period, as measured by RGDP per capita, was regressed on five primary variables: private employment per 100 persons, public employment (local, state, and federal) per 100 persons, the percent of the population who have only completed high school, the per-cent with a bachelor’s degree or higher, and the number of patents per million persons. The latter three variables are meant to control for each state’s educa-tional attainment and “inventiveness,” at various points in time. Year-specific dummy variables (D1998-D2011) serve to distinguish the data for each year following the initial year of data (1997). The coefficients for the zero/one dummy variables allow the esti-mated constant (22,515), which per-tains to the 1997 base year, to shift over time by the value of the dummy variable coefficient in each subsequent year.
BOTh DO MATTERThe estimated coefficients in the
regression model suggest that both private and public workers are positive-ly associated with per capita output, across states and over time. The coeffi-cients are of similar magnitude—1,092 and 1,180—and both are statistically significant, as indicated by any p-value less than about 0.05. This simple regression won’t put the private vs. public sector debate to bed, but it may add some perspective. If nothing else, it suggests that simply “killing off ” the public sector without a compensating increase in private employment could harm economic performance. In fact, if one believes the estimates, laying-off one public worker to hire one private worker (each per 100 persons) could reduce per capita RGDP by nearly $88.
Education and inventiveness also seem to play a role in determining a state’s economic performance. Having a population with a larger percent-age of “high school only” workers is negatively associated with RGDP per capita—a good reason to prepare stu-dents well for work or college. The college degree variable—percent with a bachelor’s degree or higher—is posi-tive, but not very significant. This may, in part, reflect a relatively strong correlation with another explanatory variable that is significant, the num-ber of patents per million persons. Inventiveness rewards the economy as well as the inventor.
Overall, the five variables and the year-specific dummy variables, which tend to capture the upward trend in RDGP over time, jointly account for about 56% of the variation in RGDP across the 48 states and over the 15-year period.
ThE RIghT BAlANCEIf one accepts the proposition that
both the private and public sectors have a legitimate role to play in the economy, as well as in our politics, a rather natural question to ask is: What’s the optimal mix of private and public activity—employment, spending, or some other measure of government size—to maximize economic perfor-mance? Furthermore, how do various private/public combinations affect eco-nomic incentives and the distribution of income within the economy? At one time, these were the “big ques-tions” tackled by the best economists. They need to be resurrected and read-dressed by a new generation of econo-mists with the technical skills, but also the common sense, to know how important the answers might be in the years ahead.
SoURCE: The Connecticut Economy based on data from the Bureau of Economic Analysis, the Bureau of Labor Statistics, and the Census Bureau.
dependent variable: rgdp per Capita Coefficient p-value
Constant 22,515.27 0.000
Private Employment per 100 Persons 1,092.41 0.000
Public Employment per 100 Persons 1,180.20 0.000
Percent of Population with High School Only -729.13 0.000
Percent of Population with BA Degree or Higher
68.00 0.379
Patents Per Million Persons 3.51 0.001
D_1998 266.80 0.786D_1999 749.13 0.446D_2000 2,621.25 0.008D_2001 3,397.93 0.001D_2002 4,715.55 0.000D_2003 5,954.03 0.000D_2004 6,839.68 0.000D_2005 7,288.85 0.000D_2006 7,443.58 0.000D_2007 7,862.23 0.000D_2008 8,398.38 0.000D_2009 9,895.31 0.000D_2010 10,565.68 0.000D_2011 10,834.14 0.000
Adjusted R-Squared = .560
N = 720
bOTH prIvATE ANd pUblIC EMplOY-MENT CONTrIbUTE TO OUTpUT pEr
CApITA (48 sTATEs, 1997-2011)

8 THE CONNECTICUT ECONOMY Winter 2013
ANNUAL AvERAGE ANNUAL AvERAGE JoB LoCATIoN
EMPLoyMENT WAGE ($) QUoTIENT
Bridgeport - Stamford lMA Ansonia 358 56,697 0.89Bridgeport 4,143 61,407 0.96Darien 50 120,566 0.07Derby 149 41,449 0.31Easton N/A N/A N/AFairfield 678 80,705 0.28Greenwich 643 57,731 0.18Milford 3,631 67,847 1.25Monroe 212 49,513 0.38New Canaan 9 99,143 0.01Newtown 426 64,962 0.55Norwalk 2,455 132,325 0.54
ANNUAL AvERAGE ANNUAL AvERAGE JoB LoCATIoN
EMPLoyMENT WAGE ($) QUoTIENT
Oxford 466 57,390 1.63 Redding N/A N/A N/ARidgefield N/A N/A N/ASeymour 1,011 63,246 2.35Shelton 4,088 103,429 1.89Southbury 121 28,854 0.14Stamford 3,439 101,038 0.47Stratford 9,044 91,680 3.51Trumbull 915 66,933 0.52Weston N/A N/A N/AWestport 37 31,817 0.02Wilton N/A N/A N/AWoodbridge 73 49,863 0.20
ANNUAL AvERAGE ANNUAL AvERAGE JoB LoCATIoN
EMPLoyMENT WAGE ($) QUoTIENT
Danbury lMA Bethel 1,145 66,116 1.59Bridgewater N/A N/A N/ABrookfield 1,142 66,870 1.65Danbury 5,558 103,649 1.29New Fairfield 28 35,464 0.17New Milford 797 61,595 0.93Sherman N/A N/A N/A
Enfield lMA East Windsor 435 53,157 0.63Enfield 1,898 63,704 0.99Somers 140 51,647 0.55Suffield 297 62,453 0.70Windsor Locks 4,341 101,913 3.23
< 0.5 (35 towns)
0.5 to 1.5 (43 towns)
> 1.5 ( 45 towns)
No Data (34 towns)
THE CENTERFoLD Manufacturing Employment Location Quotients, 2011
SoURCE: The Connecticut Economy based on data from the Connecticut Department of Labor.

Winter 2013 THE CONNECTICUT ECONOMY 9
ANNUAL AvERAGE ANNUAL AvERAGE JoB LoCATIoN
EMPLoyMENT WAGE ($) QUoTIENT
hartford lMA Andover N/A N/A N/AAshford N/A N/A N/AAvon 659 109,877 0.80Barkhamsted N/A N/A N/ABerlin 1,935 61,202 1.67Bloomfield 836 70,552 0.44Bolton 339 39,787 2.82Bristol 2,836 60,578 1.33Burlington 44 54,469 0.44Canton 26 29,168 0.08Colchester 150 54,245 0.42Columbia N/A N/A N/ACoventry 50 40,835 0.36Cromwell 351 59,805 0.55East Granby 1,249 64,741 3.28East Haddam 49 47,781 0.33East Hampton 89 53,775 0.45East Hartford N/A N/A N/AEllington 462 63,031 1.54Farmington 2,391 71,320 0.72Glastonbury 669 67,014 0.41Granby N/A N/A N/AHaddam 51 41,183 0.39Hartford 1,229 43,849 0.11Hartland N/A N/A N/AHarwinton N/A N/A N/AHebron N/A N/A N/ALebanon N/A N/A N/AManchester 2,451 64,755 0.86Mansfield 35 44,480 0.03Marlborough 107 55,126 0.93Middlefield 576 75,339 3.36Middletown 4,027 85,405 1.45New Britain 3,748 74,603 1.44New Hartford 448 47,784 2.99Newington 1,885 62,010 1.14Plainville 1,647 69,166 1.74Plymouth 380 50,000 1.84Portland 265 54,513 1.20Rocky Hill 613 110,998 0.44Simsbury 530 84,663 0.52
ANNUAL AvERAGE ANNUAL AvERAGE JoB LoCATIoN
EMPLoyMENT WAGE ($) QUoTIENT
South Windsor 3,102 63,267 2.53Southington 1,891 59,686 1.24Stafford 1,000 44,900 2.72Thomaston 1,262 53,702 4.63Tolland 513 70,075 1.17Union N/A N/A N/AVernon 209 59,486 0.23West Hartford 2,379 67,344 0.84Wethersfield 254 46,513 0.25Willington 41 50,360 0.29Windsor 4,203 84,900 1.74
New haven lMA Bethany 236 77,599 2.14Branford 1,295 61,855 1.02Cheshire 2,249 86,692 1.51Chester 856 64,278 4.10Clinton 494 65,899 1.16Deep River 413 43,529 3.05Durham 502 61,951 2.43East Haven 417 42,373 0.65Essex 563 51,638 1.60Guilford 457 57,262 0.66Hamden 1,184 47,212 0.58Killingworth 15 58,294 0.21Madison 126 47,814 0.26Meriden 2,363 65,971 1.06New Haven 2,532 52,847 0.31North Branford 891 62,543 2.16North Haven 3,992 64,294 2.05Old Saybrook 320 46,315 0.53Orange 570 61,642 0.64Wallingford 4,741 89,932 1.71West Haven 1,076 54,868 0.73Westbrook 775 66,256 2.06
Norwich - New london lMA Bozrah 186 46,256 1.87Canterbury N/A N/A N/AEast Lyme 266 49,876 0.47Franklin 8 85,007 0.08Griswold 18 10,053 0.10
ANNUAL AvERAGE ANNUAL AvERAGE JoB LoCATIoN
EMPLoyMENT WAGE ($) QUoTIENT
Groton 10,838 97,215 4.11Ledyard 87 81,589 0.07Lisbon N/A N/A N/ALyme N/A N/A N/AMontville 415 49,688 0.28New London 365 61,241 0.24North Stonington 18 32,552 0.12Norwich 591 52,511 0.36Old Lyme 28 46,797 0.10Preston N/A N/A N/ASalem N/A N/A N/ASprague 297 56,422 5.03Stonington 786 75,676 1.08Voluntown N/A N/A N/AWaterford 134 44,560 0.12
Torrington lMA Bethlehem 2 44,065 0.03Canaan N/A N/A N/AColebrook N/A N/A N/ACornwall 8 31,515 0.18Goshen 19 30,115 0.48Kent 19 54,846 0.15Litchfield 48 20,151 0.15Morris 73 33,394 1.71Norfolk N/A N/A N/ANorth Canaan 601 60,688 3.11Roxbury N/A N/A N/ASalisbury N/A N/A N/ASharon N/A N/A N/ATorrington 1,863 50,717 1.17Warren 9 34,655 0.57Washington 30 25,984 0.19Winchester 793 51,252 2.23Woodbury 86 34,148 0.41
waterbury lMA Beacon Falls 178 43,574 1.86Middlebury 141 69,336 0.37Naugatuck 1,209 55,031 1.67Prospect 251 59,580 1.23Waterbury 3,159 58,334 0.80Watertown 2,299 58,330 2.88Wolcott 389 50,301 1.34
willimantic - Danielson lMA Brooklyn 21 32,715 0.15Chaplin N/A N/A N/AEastford N/A N/A N/AHampton N/A N/A N/AKillingly 1,771 51,752 2.04Plainfield 638 50,861 1.54Pomfret 521 39,729 3.30Putnam 985 57,272 1.58Scotland N/A N/A N/ASterling 102 47,908 2.59Thompson 338 54,440 2.07Windham 670 60,813 0.61Woodstock 520 64,784 3.11 Town Average 1,108 $59,646 1.18
The centerfold maps the concentration of manufacturing activity across towns, as mea-sured by a location quotient (LQ) for manu-facturing jobs. These LQs are ratios of town to state manufacturing employment shares and range from a high of 5.03 in Sprague to a low of 0.01 in New Canaan. A town with an LQ of 1.00 would have the same concentration of manufacturing jobs as does the state as a whole. Manufacturing jobs are clustered along the Naugatuck valley, north of the cit-ies of Hartford and New Haven, and in the northeast corner of the state. The scatterplot shows that towns with high job LQs also tend to have a high concentration of manufacturing establishments.
AbOUT THE CENTErFOld
0
1
2
3
4
5
6
1 2 3 4 5
Establishment LQ = 0.07 + 0.83 x Jobs LQR² = 0.42
Man
ufac
turin
g Es
tabl
ishm
ent
LQ
Manufacturing Job LQ
10 THE CONNECTICUT ECONOMY Winter 2013
By DEREk M. JoHNSoN*
Under federal and state laws, includ-ing Connecticut’s, property connected with illegal activity can be forfeited to the government. A key purpose of forfeiture is to penalize wrongdo-ing and thereby discourage unlawful behavior. Seized assets also provide a significant revenue source for state, local and federal governments which, among other things, help fund law enforcement initiatives. But this rev-enue-raising potential also raises the risk of distorting law enforcement activities to maximize the proceeds at the expense of other law enforce-ment objectives. Though the risk of such distortions exists in all states, it is apparently lower in Connecticut than elsewhere.
hISTORIC ROOTSCivil and criminal forfeiture has an
extensive history with roots in admi-ralty law. One of the first acts of the United States Congress in 1790 was to adopt forfeiture laws to enforce customs duties, which was then the principal source of federal tax revenue. (Seizing cargo and ships was the only effective way to prevent ship owners from smuggling goods into the coun-try.) Forfeiture’s use has grown consid-erably since then. It was revitalized in the 1970s and 1980s as a tool against organized crime and narcotics traffick-ing and expanded by Congress to cover a myriad of federal offenses including fraud and other white collar crimes. It now runs the gamut from copyright infringement, to mail and bank fraud to identity theft.
With the passage of the Civil Asset Forfeiture Reform Act of 2000 (“CAFRA”) and the USA PATRIOT Act of 2001, hundreds of additional illegal activities became subject to for-feiture. State forfeiture law has a long history that even predates the U.S.
Constitution. Under the common law, states were authorized to enforce state forfeiture laws. Currently 47 states, including Connecticut, authorize the civil forfeiture of assets.
CRIME AND pUNIShMENT
Though forfeiture laws play a critical role in the legal deterrence structure, they raise unique issues not often asso-ciated with the criminal justice system. In criminal forfeiture proceedings, the defendant property owner must first be convicted of a crime before any (ill gotten) property is forfeited to the gov-ernment. And if the defendant is not convicted, the property is returned.
But property can also be seized in civil suits, where the government action isn’t against the property owner, nor is it predicated on the convic-tion of any party. Rather, the action is against the property itself based on the property’s connection to the illegal activity. Untethered from criminal law procedures and burdens of proof, these civil (and administrative) forfeitures increase the likelihood of de facto pun-ishing innocent parties (often referred to as a “Type I error” or a “false posi-tive”), which is an anathema to one of the most fundamental principles of U.S. criminal justice.
Property owners whose assets have been seized are allowed an “inno-cent owner” defense. But under this affirmative defense, the expense and burden of proof is on the owner to establish that she had no actual or constructive knowledge that the real or personal property was used in the illegal activity or that upon learning of the illegal activity acted “reasonably” under the circumstances or “took all reasonable steps” to stop the illegal activity. Meeting this burden is not always easy.
In United States v. Two Parcels of Property at Castle Street, 31 F.3d 35 (2nd Cir. 1994), for example, authori-ties seized a multi-family New Haven residence where the parents were aware of their children’s narcotic use. While the parents pressed their adult children to stop using drugs, sent their adult children to Virginia to get away from the local narcotics environment and were threatened by local drug dealers after reporting narcotics activities to the police, the Court held that the parents “failed to undertake every reasonable means of preventing narcotics activities at the residence. For instance, they did not conduct searches of the residence parcel to check for narcotics.”
Law enforcement officials can also bypass restrictions on their ability to seize assets under local law by employ-ing federal law under an “equitable sharing” arrangement. So long as the illegal conduct violates “federal law and where federal law provides for forfeiture,” federal law officials can commence forfeiture actions where state and local state law enforcement authorities have conducted all of the “pre-seizure activities.” In these so called “adoptive forfeitures,” local authorities receive 80% of the forfeited assets and the federal government the remaining 20%. Equitably shared fed-eral funds must be used exclusively for law enforcement activities, such as the cost of investigation and law enforce-ment equipment.
DOllARS AND SENSECivil and criminal forfeitures have
been enormously effective law enforce-ment tools and have contributed sig-nificantly to state and municipal oper-ating budgets. In 2006, for example, one-third of all local police depart-ments in the United States received property, assets and goods from drug
Civil Forfeiture Statutes: AN ADDITIoNAL STATE AND FEDERAL REvENUE SoURCE?
Winter 2013 THE CONNECTICUT ECONOMY 11
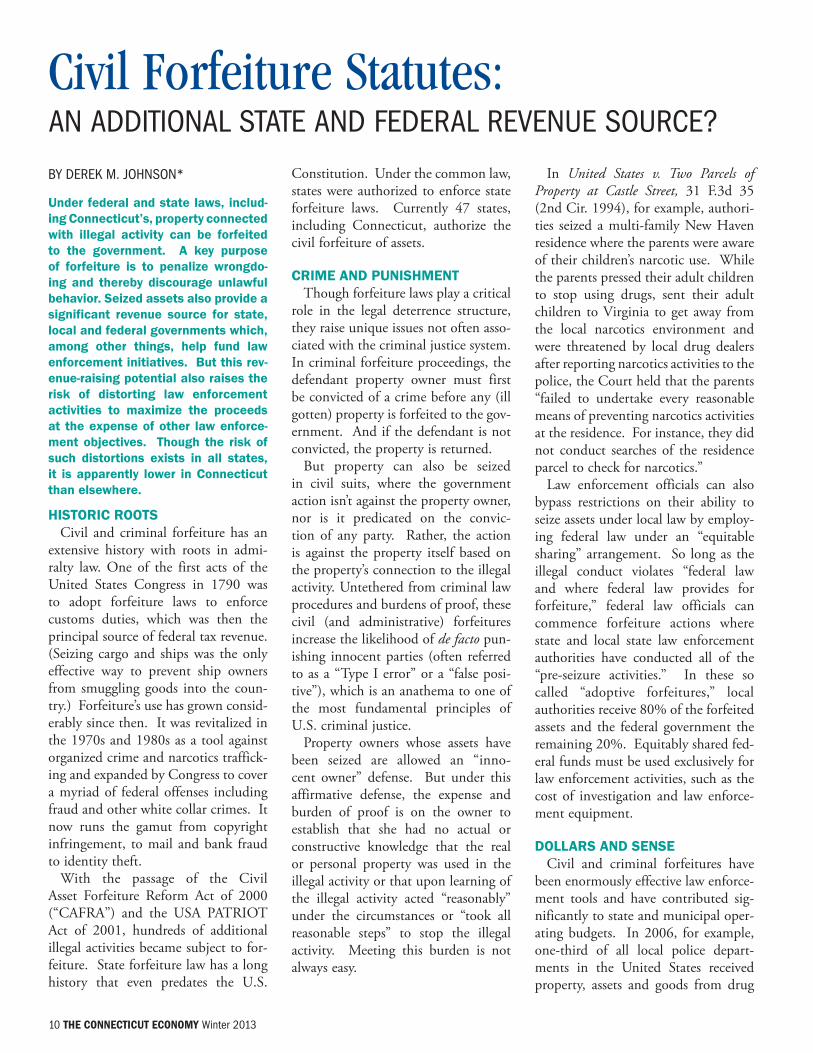
asset forfeitures (civil and criminal), totaling over $300 million. Among local police departments in cities with populations of a million or more, the average receipts from drug asset forfei-tures totaled $2,802,100 in 2006. And from 2000 to 2008, federal equitable sharing payments to state and local authorities approximated $2.4 billion.
The Department of Justice’s Assets Forfeiture Fund (AFF) paid out $550 million in equitable sharing payments in fiscal year 2010 alone, and another $440 million in 2011. Proceeds from forfeitures have grown significantly. In 1986, net forfeited assets paid into the AFF totaled approximately $94 million; at the end of the fiscal year 2011 the net assets in the AFF totaled approximately $1.7 billion.
Connecticut, like the vast major-ity of states, authorizes civil forfei-tures. Under Connecticut law, pro-ceeds from civil forfeitures are paid into the state’s “drug assets forfeiture revolving account,” with 70% allocat-ed to the Department of Public Safety and local police departments (15% of which is used for drug education, and the balance used for law enforcement activities and police training relating to illegal drug trafficking and gang violence.) The remaining 30% is paid to the Department of Mental Health and Division of Criminal Justice.
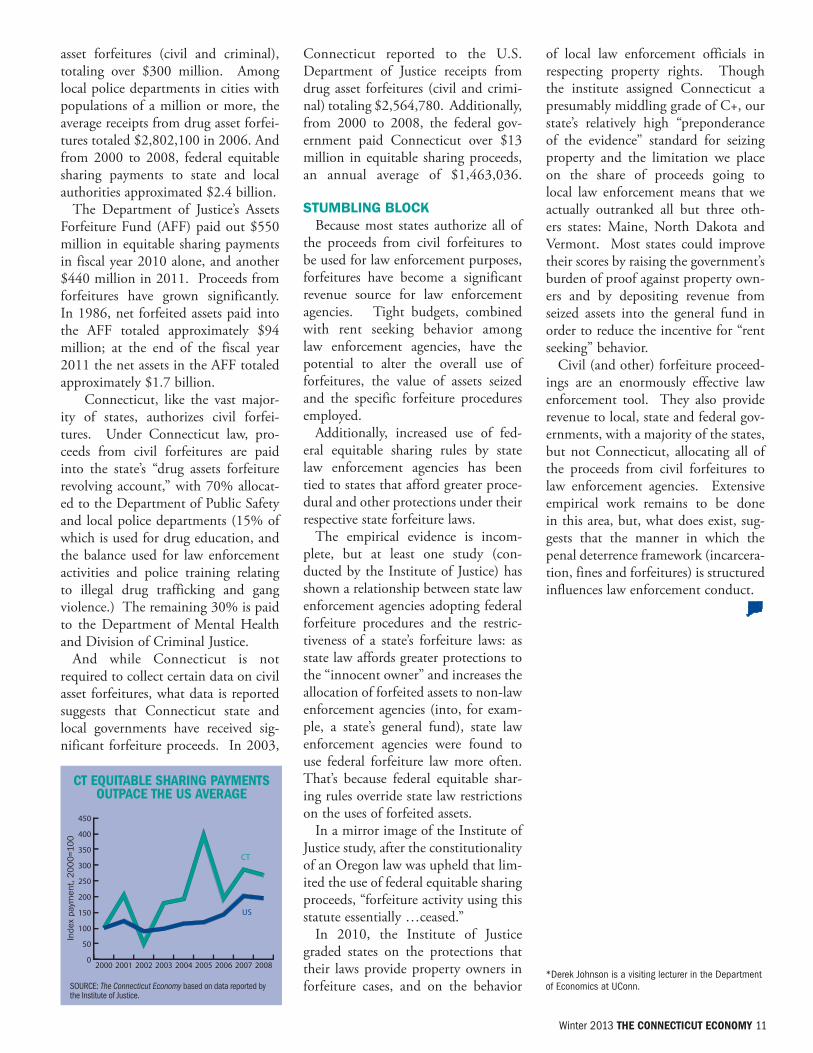
And while Connecticut is not required to collect certain data on civil asset forfeitures, what data is reported suggests that Connecticut state and local governments have received sig-nificant forfeiture proceeds. In 2003,
Connecticut reported to the U.S. Department of Justice receipts from drug asset forfeitures (civil and crimi-nal) totaling $2,564,780. Additionally, from 2000 to 2008, the federal gov-ernment paid Connecticut over $13 million in equitable sharing proceeds, an annual average of $1,463,036. STUMBlINg BlOCk
Because most states authorize all of the proceeds from civil forfeitures to be used for law enforcement purposes, forfeitures have become a significant revenue source for law enforcement agencies. Tight budgets, combined with rent seeking behavior among law enforcement agencies, have the potential to alter the overall use of forfeitures, the value of assets seized and the specific forfeiture procedures employed.
Additionally, increased use of fed-eral equitable sharing rules by state law enforcement agencies has been tied to states that afford greater proce-dural and other protections under their respective state forfeiture laws.
The empirical evidence is incom-plete, but at least one study (con-ducted by the Institute of Justice) has shown a relationship between state law enforcement agencies adopting federal forfeiture procedures and the restric-tiveness of a state’s forfeiture laws: as state law affords greater protections to the “innocent owner” and increases the allocation of forfeited assets to non-law enforcement agencies (into, for exam-ple, a state’s general fund), state law enforcement agencies were found to use federal forfeiture law more often. That’s because federal equitable shar-ing rules override state law restrictions on the uses of forfeited assets.
In a mirror image of the Institute of Justice study, after the constitutionality of an Oregon law was upheld that lim-ited the use of federal equitable sharing proceeds, “forfeiture activity using this statute essentially …ceased.”
In 2010, the Institute of Justice graded states on the protections that their laws provide property owners in forfeiture cases, and on the behavior
of local law enforcement officials in respecting property rights. Though the institute assigned Connecticut a presumably middling grade of C+, our state’s relatively high “preponderance of the evidence” standard for seizing property and the limitation we place on the share of proceeds going to local law enforcement means that we actually outranked all but three oth-ers states: Maine, North Dakota and Vermont. Most states could improve their scores by raising the government’s burden of proof against property own-ers and by depositing revenue from seized assets into the general fund in order to reduce the incentive for “rent seeking” behavior.
Civil (and other) forfeiture proceed-ings are an enormously effective law enforcement tool. They also provide revenue to local, state and federal gov-ernments, with a majority of the states, but not Connecticut, allocating all of the proceeds from civil forfeitures to law enforcement agencies. Extensive empirical work remains to be done in this area, but, what does exist, sug-gests that the manner in which the penal deterrence framework (incarcera-tion, fines and forfeitures) is structured influences law enforcement conduct.
0
50
100
150
200
250
300
350
400
450
CT
US
200820072006200520042003200220012000
SoURCE: The Connecticut Economy based on data reported by the Institute of Justice.
CT EqUITAblE sHArINg pAYMENTs OUTpACE THE Us AvErAgE
Inde
x pa
ymen
t, 2
00
0=1
00
*Derek Johnson is a visiting lecturer in the Department of Economics at UConn.

LABoR MARkET oUTLook Forecasts for key Labor Market Areas
jOBS
UNEMplOyMENT RATE
hOUSINg pRICES
hOUSINg pERMITS
In the relatively calm wake of a sluggish Connecticut employment forecast, area labor markets aren’t apt to see many big changes in their job counts in coming quarters. Each of the four major LMAs is expected to hold to within about 1,000 jobs of its 2012-Q3 total by the same quarter next year. Measured in four-quarter percentage changes, that would translate into declines in each of the next four quarters for Hartford, but drops in only one or two quarters for the other major areas.
12 THE CONNECTICUT ECONOMY Winter 2013
-3%
-2%
-1%
0%
1%
2%
Norwich - New LondonNew HavenHartfordBridgeport - Stamford
ACTUAL: 2011-Q4 to 2012-Q3 PREDICTED: 2012-Q4 to 2013-Q3
4Q%∆
6.0%
6.5%
7.0%
7.5%
8.0%
8.5%
9.0%
9.5%
10.0%
Norwich - New LondonNew HavenHartfordBridgeport - Stamford
ACTUAL: 2011-Q4 to 2012-Q3 PREDICTED: 2012-Q4 to 2013-Q3
-15%
-10%
-5%
0%
5%
10%
Norwich - New LondonNew HavenHartfordBridgeport - Stamford
ACTUAL: 2011-Q4 to 2012-Q3 PREDICTED: 2012-Q4 to 2013-Q3
4Q%∆
-100%
-50%
0%
50%
100%
150%
200%
250%
Norwich - New LondonNew HavenHartfordBridgeport - Stamford
ACTUAL: 2011-Q4 to 2012-Q3 PREDICTED: 2012-Q4 to 2013-Q3
4Q%∆
Joblessness is growing again across labor markets as area labor forces shrink and the number listed as unemployed climbs. That surge should ease in coming quarters, however. Bridgeport-Stamford’s jobless rate is expected to peak in 2013-Q2 and then retreat during the balance of the year. The other major labor markets, which have seen unemployment climb by more than a point, may add between two to four tenths of a percent to their current rates.
Seasonally-adjusted constant qual-ity home prices, tracked by UConn’s Real Estate Center, have shown some recent life, but they may soon again be skating on thin ice. Prices were up, on the quar-ter and on the year, in every major labor market except Hartford. Hartford’s decline could continue and possibly spread, most likely to New London. Though some minor price erosion is possible in New Haven and Bridgeport-Stamford, home values should hold fairly steady in these two markets.
Housing permits have shown some life of late. Recent quarters have witnessed frenzied bursts of activity in New Haven (2011-Q2 to 2011-Q4) and in Bridgeport-Stamford (2012-Q1) and slow but steady gains in Hartford and New London. But home building may reach a plateau in coming quarters, especially if weakness in the broader economy continues as is anticipated. Expect some ups and some downs in most areas, but mostly downs in New London.
By STEvEN P. LANzA

Winter 2013 THE CONNECTICUT ECONOMY 13
INFOrMATION JObs FINANCE JObs bUsINEss sErvICEs EdUCATION & HEAlTH lEIsUrE & HOsp. gOvErNMENT JObs
labor Market Area2012-q3
(000)% Change year ago
2012-q3 (000)
% Change year ago
2012-q3 (000)
% Change year ago
2012-q3 (000)
% Change year ago
2012-q3 (000)
% Change year ago
2012-q3 (000)
% Change year ago
bridgeport - stamford 10.9 0.6 41.3 -2.8 66.6 0.0 68.9 5.2 36.5 -2.1 44.1 1.5
danbury - - - - 7.6 -0.4 - - 6.2 2.2 8.0 0.0
Enfield - - - - - - - - - - - -
Hartford 11.6 2.7 61.3 -1.3 60.5 0.6 101.3 3.3 46.0 5.1 76.1 -1.8
New Haven 4.7 0.0 12.2 -0.5 24.9 -3.5 75.8 2.8 25.5 5.7 30.2 0.4
Norwich - New london 1.5 2.3 3.1 -2.1 9.0 -2.2 20.7 -0.2 16.4 0.2 33.2 -4.3
Torrington - - - - - - - - - - - -
waterbury 0.7 10.5 2.0 0.0 4.3 4.0 17.5 6.7 5.5 2.5 9.1 -0.7
willimantic - danielson - - - - - - - - - - - -
sTATEwIdE 32.0 1.7 132.0 -2.4 195.9 -0.2 322.5 3.4 145.4 0.9 223.5 -1.1
HOUsINg prICEs HOUsINg pErMITs HOME sAlEs Avg. wKlY. HOUrs Avg. wKlY. EArNINgs Avg. HrlY. EArNINgs
labor Market Area2012-q3 ($000)
% Change year ago
2012-q3 % Change year ago
2012-q3 % Change year ago
2012-q3 % Change year ago
2012-q3 ($)
% Change year ago
2012-q3 ($)
% Change year ago
bridgeport - stamford 466.0 2.6 475 45.3 1836 28.1 34.7 2.3 1094.72 4.4 31.55 2.1
danbury 280.5 2.8 127 353.6 227 11.9 33.1 -5.3 919.35 -5.7 27.74 -0.4
Enfield 154.8 -8.5 13 44.4 124 20.7 - - - - - -
Hartford 261.0 -2.5 371 43.8 1751 36.0 35.2 -0.4 1003.45 -2.9 28.51 -2.5
New Haven 203.6 0.3 65 -65.6 667 47.3 33.4 0.4 873.39 -3.7 26.12 -4.1
Norwich - New london 219.9 3.9 55 -11.3 179 66.9 32.3 3.6 804.86 14.5 24.94 10.4
Torrington 155.5 -5.0 13 225.0 96 80.6 - - - - - -
waterbury 115.5 -10.7 16 0.0 130 68.8 33.4 -1.8 776.50 -2.9 23.27 -1.1
willimantic - danielson - - 19 -34.5 30 -3.2 - - - - - -
sTATEwIdE 315.6 -0.2 1154 25.2 5040 34.5 34.1 0.1 950.94 -0.6 27.91 -0.7
LABoR MARkET DATA 2012-Q3 Summary Statistics
*Trade, Transaction and Utilities
lAbOr FOrCE UNEMplOYMENT rATE NONFArM JObs CONsTrUCTION JObs MANUFACTUrINg TTU* JObs
labor Market Area2012-q3
(000)% Change year ago
2012-q3 (%)
2011-q3(%)
2012-q3 (000)
% Change year ago
2012-q3 (000)
% Change year ago
2012-q3 (000)
% Change year ago
2012-q3 (000)
% Change year ago
bridgeport - stamford 487.5 -0.7 8.2 8.2 403.9 1.0 12.3 5.1 35.0 -1.2 71.7 2.3
danbury 94.2 0.0 7.2 7.1 67.3 1.7 - - - - 15.1 3.9
Enfield 50.5 -2.0 8.4 8.7 45.0 2.7 - - - - - -
Hartford 602.9 -1.0 9.0 8.9 537.9 0.7 16.7 -8.4 58.1 1.5 86.4 0.5
New Haven 319.4 -1.0 9.3 9.3 267.5 0.8 9.2 -5.8 26.1 -1.5 48.1 0.5
Norwich - New london 151.7 -3.1 9.0 8.6 127.8 -2.1 3.8 -2.6 14.7 -1.1 22.1 -3.1
Torrington 56.0 -0.4 7.9 8.0 36.3 1.9 - - - - - -
waterbury 103.9 0.2 11.4 11.5 64.2 2.9 2.2 -2.9 7.5 -0.9 12.9 4.3
willimantic - danielson 59.4 -0.7 10.1 9.9 36.2 1.1 - - - - - -
sTATEwIdE 1913.5 -1.0 8.9 8.8 1623.7 0.2 53.1 -4.0 165.7 -1.0 293.0 0.3
Connecticut’s housing market gained traction in 2012-q3 while other sectors slipped. Most LMAs registered an increase in house sales and permits, while half had higher prices than the year before. But worker paychecks shrank even as weekly hours inched up. Construction, finance, and government posted the steepest job losses.

By STEvEN P. LANzA
Connecticut needs more than lacklus-ter U.S. gDp growth to begin notching serious job gains once again. Even doubling 2012-Q2’s 1.3% growth rate in 2012-Q3 didn’t do the trick, though the state went from hemorrhaging 4,000 jobs to shedding about 1,700. Unfortunately, the consensus among economists calls for another lull in growth until the second half of 2013. And an even worse obstacle is the fis-cal abyss that could lie between here and there.
The U.S. economy has toiled might-ily to recover from its worst reces-sion in two generations. But it has managed to post an average annual gain of just 2.2% in the past 13 quar-ters. Connecticut hasn’t done half bad, considering. Given the post-Cold War relationship between U.S. growth and the state’s employment situation, we might only have expected to add 10,000 jobs over this period under such conditions, yet we’ve gained more than 30,000 net. Still, that hardly takes the sting out of the latest losses.
Economists generally believe the U.S. economy will resume 2.7% growth by the end of next year, but not before gathering headwinds slow that rate to 2% or less, according to some four dozen economists surveyed recently by the Wall Street Journal. Growth at the average forecasted rate would push quarterly Connecticut job gains to 3,000 by 2013-Q4, but only 7,500 in total over the period. The problem is that with momentum building so slow-ly Connecticut’s economy will struggle to post more than nominal job gains in the intervening quarters.
But analysts are not unanimous. Respondents in the bottom 25th percentile of the WSJ survey believe growth will slow to 1.4% or lower in this year’s fourth quarter and next
year’s first, and rise to just 2.2% at best by the end of 2013. With unem-ployment still up, wages flat, Europe’s debt crisis unresolved, global growth slowing and investors’ nerves raw, who can blame the pessimists? But that would mean job growth could stall or even turn negative before resuming a modest pace. All told, the net change in payrolls over the period might be 4,000 to the upside.
That dour outlook assumes that we avoid the dreaded fiscal cliff. Driving over the edge would, in the estima-tion of the non-partisan Congressional Budget Office, slash nearly six points off 2013-Q1 GDP growth, more than four points off the second and a point plus off the third, using the middle-of-the-road WSJ scenario as the baseline. The consequences for Connecticut employment would be disastrous. The state could lose as many as 20,000 jobs before growth returned in 2014, with losses peaking at 5,000 in 2013-Q2. And that’s not even counting the pos-sible defense-related job cuts a seques-tration might trigger.
Political analysts are cautiously opti-mistic that, in the wake of the presi-dent’s re-election and modest legisla-tive gains for the Democratic party, recalcitrant Republicans will negotiate an agreement to avert disaster. If the economy then follows the path anticipated by the optimists in the WSJ survey—respondents at the 75th per-centile or higher—Connecticut could expect an earlier return of job growth. The state could add 1,000 jobs as soon as next quarter, and then grow at a quarterly rate of 4,000 by 2013-Q4. Under this more upbeat scenario, the state would gain perhaps 10,000 jobs next year. That’s not a particularly remarkable performance, but it sure beats cliff diving.
A rOCKY JObs rECOvErY...
Fore
cast
ed Q
uart
erly
Job
Cha
nge
14 THE CONNECTICUT ECONOMY Winter 2013
(%)
-8
-6
-4
-2
0
2
4
US
CT
20122011201020092008
-4
-3
-2
-1
0
1
2
3
4
Cliff
HighAverageLow
2013-Q42013-Q32013-Q22013-Q12012-Q4
(%)
-6
-5
-4
-3
-2
-1
0
1
2
3
4
Cliff
HighAverageLow
2013-Q42013-Q32013-Q22013-Q12012-Q4
(000s)
…COUld drOp OFF A FIsCAl ClIFF…
Fore
cast
ed G
DP
Gro
wth
at
Annu
al R
ate
…ANd ClAIM THOUsANds MOrE CONNECTICUT JObs
Qua
rter
ly C
hang
e at
Ann
ual R
ate
SoURCE: The Connecticut Economy, based on data from the Bureau of Labor Statistics.
SoURCE: The Connecticut Economy, based on WSJ and CBo data
SoURCE: The Connecticut Economy.
THE QUARTERLy FoRECAST Economic Cliffhanger
The overall index increased 0.4% in 2012-q3 compared with the same quarter the year before. The index consists of room occupancy, slot machine revenues, atten-dance at six major tourist attractions, and traffic on five tourist roads.
Room Occupancy s +7.0%
Slot Machine Revenue t -9.6%
Attendance s +6.9%
Traffic t -2.7%
Overall s +0.4%
THE CONNECTICUT TrAvEl ANd TOUrIsM INdEx
Please cut out this reply form and return along with your payment to:
c/o Marilyn Moir, Business ManagerCLAS Business Services CenterUniversity of Connecticut215 Glenbrook Road U-4158Storrs, CT 06268
A fORwARD lOOk (continued from page 16)
of Economic and Community Development—introduced us to Doug Hall, founder of the Eureka Ranch, a center for teaching “innovation engi-neering” in Newtown, Ohio, Doug sold us on the concept of developing products that deliver “overt benefits” to users. His mantra is “If it doesn’t have an overt benefit, don’t bother to devel-op it.” At Lex, we use this benchmark more than any other to determine if a new product idea makes the grade.
For example, our flagship products are portable power distribution boxes made out of rubber as opposed to metal. These boxes are not particularly innovative, in fact they’re almost retro, but they’re loaded with overt benefits for the user such as increased safety and longer life.
Our focus at Lex is on innovations viewed through the lens of overt ben-efits. Perhaps the word “benovation” best describes the process.
Another key to being a successful manufacturer in this region of the country is to adopt lean manufactur-ing techniques. Lean manufacturing is the concerted and systematic elimi-nation of waste in the manufacturing process, and I can’t emphasize enough its contribution to the success of our company. Lean manufacturing means the difference between being able to invest in technology and the good paying jobs that go along with it and
barely surviving. I have not seen a suc-cessful manufacturer in Connecticut that does not wholeheartedly embrace lean manufacturing.
Connstep also has shown Lex Products the way with regard to lean manufacturing. We have completed six projects under their leadership over the last seven years, one of which saved us an estimated $6 million alone. Our total savings is probably double that amount. The rate of return on the lean manufacturing projects we have undertaken is incredible.
Something we’d like to see going forward, perhaps from an agency like Connstep, is assistance in targeting and winning federal military con-tracts. The market for military prod-ucts is enormous and the Defense Department is always on the lookout for innovative solutions, an arena where Connecticut manufacturers shine. An agency ombudsman could help lever-age Connecticut’s enviable position in military manufacturing, and identify and teach the best practices needed to win the business of the military.
Lex Products has a bright future ahead and expects to create many man-ufacturing jobs in the coming years. We believe the state of Connecticut can share that bright future in man-ufacturing if manufacturers develop products with overt benefits and follow best practices.
Joo’sView joocartoon.weebly.com
#
Our focus at Lex
is on innovations
viewed through the
lens of overt benefits.

visit Us On-line - http://cteconomy.uconn.edu
(continued on page 15)
__ Please send me 4 quarterly issues of The Connecticut Economy at the annual subscription rate of $55.00. My payment in full is enclosed.
____________________________________________________________________________Name
______________________________________________________________________________________Address
______________________________________________________________________________________City/State/zip
______________________________________________________________________________________Email
______________________________________________________________________________________ Phone
If you have not yet subscribed to The Connecticut Economy please cut out and sign this reply form, place it in a stamped envelope along with your payment and mail to the address indicated on the reverse side.
Lex Products is proud to host the Winter 2013 release of The Connecticut Economy and to become a sustaining partner of this publi-
cation. As a Connecticut manufactur-ing firm, we are pleased to have the opportunity to share our perspective on what it takes to be successful and to make a meaningful contribution to the Connecticut economy.
Too often, it seems, we take manu-facturing for granted or view it as a dying sector of the state’s economy. Yet manufacturing is a dynamic and vital source of some of the state’s most desir-able jobs. Manufacturing accounts for 170,000 jobs at an average annual wage of $95,000. We could use more jobs like that in our economy and we’d be correspondingly worse off if, instead, manufacturing jobs continued to disappear. They key is to identify what works for manufacturers here in Connecticut and replicate it wherever possible.
Innovation is part of the secret to being a successful manufacturer in Connecticut. There has been a great deal of talk lately about the role of innovation in Connecticut’s econ-omy. One article in last quarter’s edition of The Connecticut Economy was entitled “Is Innovation the New Normal?” And our Valley Chamber of Commerce’s theme this year is “Focus on Innovation.”
The relatively high cost of doing business in Connecticut means that a manufacturer in this state cannot suc-ceed by making a “me too” product. But these high costs are balanced by our location in one of the most vibrant regions on the planet and by our pro-ductive, educated work force. Still, the focus cannot be on innovation alone. For example, there are many patents that don’t make their way into a product because they are too expen-sive to implement, or don’t provide enough benefit to the user.
Our friends at Connstep—a non-profit business consulting firm sup-ported by the Connecticut Department
#
A FoRWARD Look Adding “Benovation” to The LexiconBoB LUTHER FoUNDER & CEo oF LEx PRoDUCTS CoRPoRATIoN
published by:UConn department of EconomicsOak Hall, 365 Fairfield way, Unit 1063storrs, CT 06269-1063
Executive Editor: Steven P. Lanza
Co-editor: Dennis R. Heffley
Contributing Editors: Bruce Blakey, Stanley McMillen
Editors Emeritus: William A. McEachern, Raymond R. Beauregard, Edwin L. Caldwell and Arthur W. Wright
research Associate: Sining Wang
Forecast Advisor: Daniel W. kennedy
project development and Founding Executive Committee Member: Peter deWilde Shapiro
Copyright © University of Connecticut 2013. All rights reserved. The annual subscription is $55. Send subscrip-tion requests and change of address information to: Circulation Manager, The Connecticut Economy, CLAS Business Services Center, University of Connecticut, 215 Glenbrook Road U-4158, Storrs, CT 06269-4158 or email us at [email protected]. Make checks payable to the University of Connecticut/The Connecticut Economy. Bill kelly is the designer. The views expressed by authors are theirs alone.
Thanks for the HelpThe editors thank those who provided information for this issue, including Robert Damroth and kolie Sun of the Department of Economic and Community Development; Michael Galliher of the Department of Revenue Services; John Quinn and Stacey Doan of the Department of Transportation; John Haggerty of Northeast Utilities; Michael Howser and his colleagues at UConn’s Map and Geographic Information Center for their mapping assis-tance; and especially Dan kennedy, Charles Joo, Sarah york and their colleagues at the Department of Labor, who have been most helpful with labor data. http://cteconomy.uconn.edu
Printed on recycled paper usingsoy-based ink
Connecticut Secretary of the State
we’re grateful for the financial support of the following sustaining partners: