Embed Size (px)
Citation preview

The dust cycle in the atmosphere
Enric Terradellas, AEMET, Barcelona, [email protected]
6th Training Course on WMO SDS-WAS products, Istanbul, Turkey, 25-27 Oct 2017

Atmospheric aerosol
The cycle of mineral dust
WMO SDS-WAS
Barcelona Dust Forecast Center
Dust observation
Dust forecast
Summary

Atmospheric aerosol
The cycle of mineral dust
WMO SDS-WAS
Barcelona Dust Forecast Center
Dust observation
Dust forecast
Summary

Solid or liquid particles suspended in the air
Types: primary / secondary, natural / anthropogenic
particles
Size: diameter between 0.002 and 100 μm approx.
Chemical and mineralogical composition: diverse
Optical properties (absorption, scattering): diverse
Atmospheric aerosol

Volcanoes, sea salt, products from biomass burning, anthropogenic particles,
organic compounds, mineral dust
Sources

Emissions

Mineral dust (reddish)
Sea salt (blue)
Products from biomass burning (green)
Sulphates (white)
Distribution
NASA
GEOS-5

Atmospheric aerosol
The cycle of mineral dust
WMO SDS-WAS
Barcelona Dust Forecast Center
Dust observation
Dust forecast
Summary

The dust cycle
Emission
Turbulent difussion
Transport
Dry / wet deposition
The dust cycle

Emission
The wind moves the
loose particles
according to its speed
and the size of those
particles
The process is similar to
sediment transport by
rivers

Saltation & sandblasting
Direct suspension is not so
common, because it needs very
strong winds.
Normally, the dust emission is the
result of the combination of two
different physical processes:
saltation (horizontal flux) and
sandblasting (vertical flux).
Sandblasting is a consequence of
the breaking of particle
aggregates.
Shao et al. (2011)

White (1979)
Strong dependence on wind speed
(proportional to u*3)
Strong dependence on partícle size
(through u*t)
Horizontal flux
Need for a very precise wind
forecast
The horizontal flux must be
calculated for different size bins

The threshold for particle mobilization is the result of the balance between
the wind-shear stress and the forces acting to keep the particles on the soil
(weight, cohesive forces between particles)
Erosion threshold
u* = (τ /ρ) 0.5
= ku / ln(z/z0
)
Shao and
Lu (2000))

Non-erodible elements
(i.e. vegetation)
Snow
Erosion threshold
Elements that
modify (increase)
the erosion
threshold
Crusted soils
Soil humidity

The kinetic energy of saltation
breaks the aggregates of
particles and causes a vertical
flux (sandblasting)
A threshold kinetic energy is
required to trigger the
sandblasting
Larger particles are less cohesive
and are the first to be emitted
Fine particles are only emitted in
the most intense episodes
Vertical flux
Emission of
coarse particles
Saltation,
no sandblasting
No saltation
Emission of fine and
coarse particles
Wind speed

Soil factors
Soil texture
Soil moisture
Vegetation
Snow cover
Meteorological factors
Wind speed
Near-surface turbulence
Emission

Sources

Anthropogenic sources

50,000,000 lorries
3,000 ULCC
~ 30–60 Tm/s
~ 1–2 Pg/yr
Total emission

SYNOPTIC SCALE
Frontal systems
Reinforcing trade winds
22-24 Mar 2008
Meteorological confitions

29 Apr – 1 May 2007
Meteorological conditions

13 – 14 Nov
2009
Meteorological conditions

Lake Chad
Lake Chad
Bodélé
Lago Chad
Tibesti
Bodélé
Ennedi
Bodélé depression

MODIS Aqua 29 Apr 2008
Aral Sea

Transport
29 – 30 Jul 2013

Average distribution
Data: CAMS reanalysis
Picture: WMO SDS-WAS
Dust optical depth at 550 nm. Average value 2003-2015

Transport
Pierangelo et al. (2005)
• The average particle size
decreases
• Chemical composition may vary
• Optical properties may vary
• Increasing ability of particles to act
as CN
• Increasing solubility of Fe

0.10 µm
1 µm 0.01 µm 10
µm
Mineral matter
Marine aerosol
S compounds
N compounds C compounds SIZE
(µm)
AVERGE
LIFETIME
(h)
0.1 - 0.18 231
0.18 - 0.3 229
0.3 - 0.6 225
0.6 – 1 219
1 - 1.8 179
1.8 – 3 126
3 – 6 67
6 - 10 28
Deposition
Tegen and Lacis (1996)
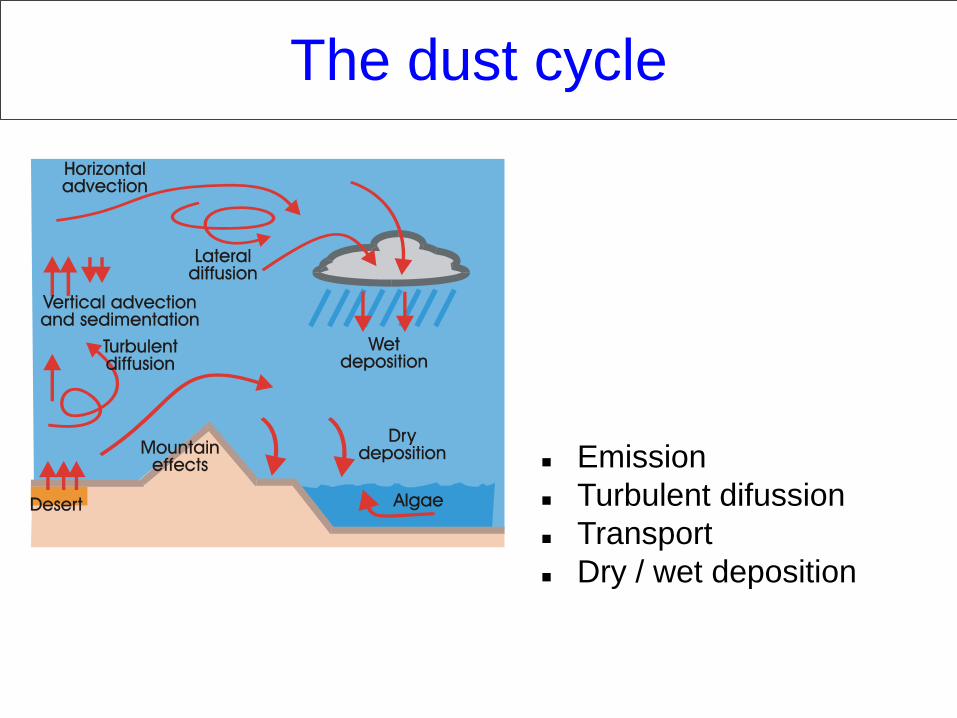
Wet deposition
PM Ayia Marina, Cyprus, Mar 2012
MODIS 12 Mar 2012
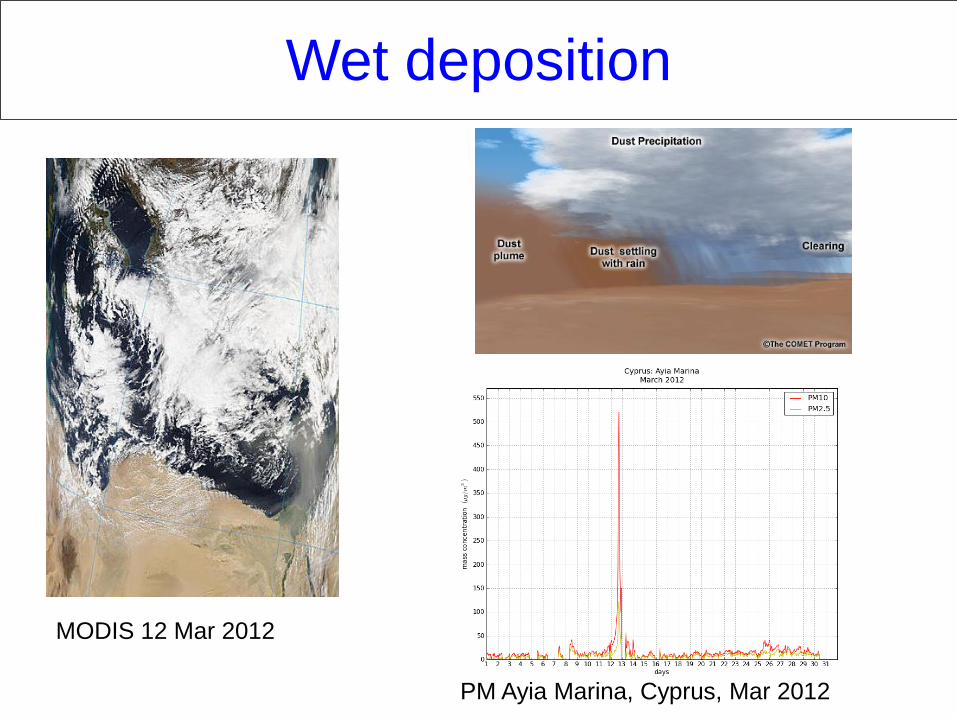
MINERALOGICAL (X-ray diffractometry)
Silicates: quartz, feldspar, phyllosilicates (ilite, kaolinite, smectite)
Carbonates (calcite, dolomite)
Hematite, gypsum, halite, …
ISOTOPICAL (Sr, Nd, Pb)
CHEMICAL (spectroscopy)
Si, Al, Ca, Mg, Fe, K, Na, Mn, Ti, P
Albite Quartz Gypsum
Composition
Information about the
source region
Influence on optical
properties
Influence the impact on
health, ecosystems, ...

Particle size
Palma de Mallorca 2 / 7 Aug 2015 AOD. Palma de Mallorca. Aug 2015
)cos()ln(
1
0 II
Cuar

Seasonal variability
1996-2010
Terradellas et al. (2012)
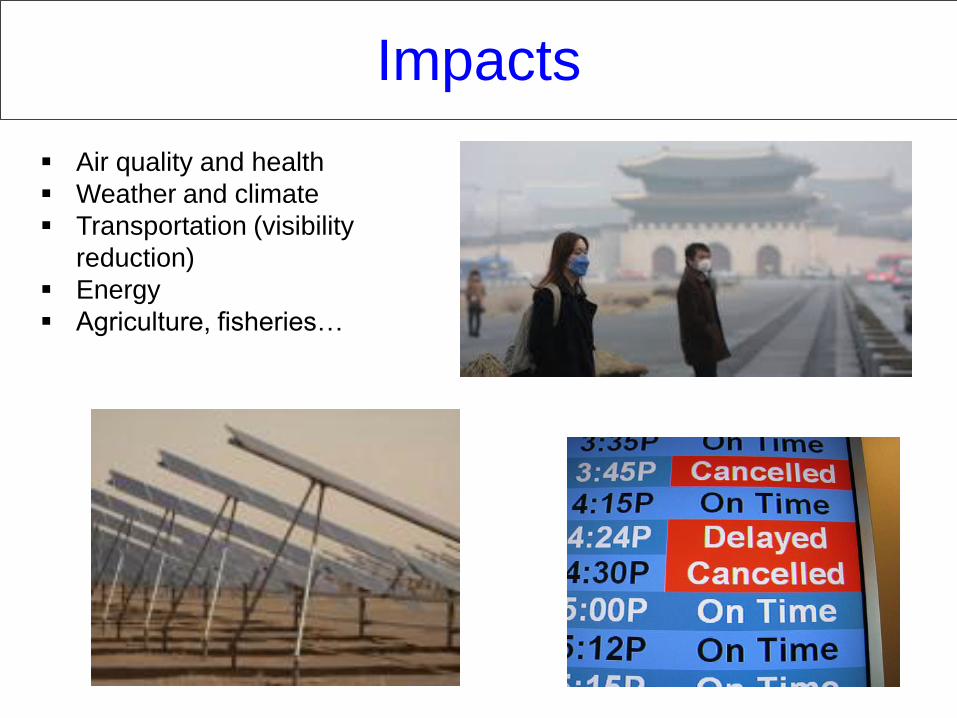
Air quality and health
Weather and climate
Transportation (visibility
reduction)
Energy
Agriculture, fisheries…
Impacts

Health impact
Particle size
Chemical and mineralogical composition
Carrying bacteria, viruses, fungi, ...
Time and intensity of exposure

Impact on weather and climate
Takemura et al. (2009)

D’Almeida (1986) Ben Mohamed et al. (1992)
Impact on transportation
Arizona, 29 Oct 2013
Tunis, 7 May 2002

Visibility
Koschmieder
formula
Tegen and Lacis (1996)

Reduction of available
energy
Reduced efficiency due
to dust deposition
Solar energy

… also positive impacts
Dust deposition
Jickells et al. (2005)
Dust deposition is a
source of micro-nutrients
for continental and marine
ecosystems
Saharan dust has been
shown to fertilize the
Amazon rainforest
The contribution of Fe and
P benefits the production
of marine biomass in
oceanic areas that suffer
from shortage of such
elements

Atmospheric aerosol
The cycle of mineral dust
WMO SDS-WAS
Barcelona Dust Forecast Center
Dust observation
Dust forecast
Summary

Mission:
Enhance the capacity of countries to generate and distribute
to end-users dust observations, forecasts, information and
knowledge
Structure:
Regional Center for Northern Africa, Middle East and
Europe, Barcelona
Regional Center for Asia, Beijing
Regional Center for Pan-America, Bridgetown
Regional Center for West Asia (??)
WMO SDS-WAS

Regional Center NAMEE
The Center is jointly managed by AEMET and
the Barcelona Supercomputing Center
UPC Campus. Nexus II building MareNostrum III supercomputer

MODIS Terra 22 June 2009. MODIS Rapid Response Team:
OBJETIVES:
Identify and improve products for observation
and prediction of airborne dust, in collaboration
with research and operational institutions, as
well as with end users
Facilitate user access to information
Develop the capacity of countries to use the
products supplied
Regional Center NAMEE

Obj. 1: Identify, improve productos
19 Mar 2017
OBSERVATION. Stations with
visibility reduction to less than
5 km by sand or dust
18-21 Mar 2017
PREDICTION. Ensemble
prediction (EPS) from 12
different models

TRAINING
Accra
Addis-Ababa
Ankara
Antalya
Barcelona
Casablanca
Istanbul
Madrid
Muscat
Niamey
Ouagadougou
Tehran
Tbilisi
Obj. 3: Build capacity

Collaborative research
Prediction of the dust outbreak to Europe of
April 2011 (Leader: Nicolas Huneeus)
Model-lidar comparison (Leader: Ioannis Binietoglou)
Study of a haboob in Tehran (Leader:
Ana Vukovic)

Climate monitoring
Average dust AOD at 550 nm 2003-
2015. Based on CAMS reanalysis
Average dust AOD medio at 550 nm in
2016 and its anomaly. Based on CAMS
forecasts. Source: WMO Airborne dust
bulletin N. 1

Atmospheric aerosol
The cycle of mineral dust
WMO SDS-WAS
Barcelona Dust Forecast Center
Dust observation
Dust forecast
Summary

Barcelona Dust Forecast Center
May 2013
WMO designates the consortium of
AEMET and the BSC to host the first
operational center of dust prediction
(RSMC-ASDF). The Center shall
operationally generate and distribute dust
forecasts for Northern Africa, Middle East
and Europe
Feb 2014
The Center starts operations under the
name of Barcelona Dust Forecast Center
(BDFC)
Jun 2017
WMO designates CMA to host a similar
center for Asia

Barcelona Dust Forecast Center
https://dust.aemet.es
dust.aemet.es

Products
6 variables Prediction: 0-72h

Other products

Dissemination
WMO Global
Telecommunications
System
https://dust.aemet.es
EUMETCast

Atmospheric aerosol
The cycle of mineral dust
WMO SDS-WAS
Barcelona Dust Forecast Center
Dust observation
Dust forecast
Summary

Mali, 2001
Foto: Remi Benali/Corbis
Monitoring dust events
Data assimilation into models
Forecast verification
Validation of other observations (i. e. ground observations to validate satellite products)
Why do we need dust observation?

Monitoring: satellite products
The basic tool for monitoring
dust events is satellite imagery
The EUMETSAT RGB dust
product is a composition based
on three infrared channels from
SEVIRI (Meteosat Second
Generation)
Drawbacks:
Qualitative product
Without information from cloudy
areas
Vertical integration. Without
information on near-surface
conditions
19 Mar 2017: The sandstorm named Madar,
originated in Libya, swept through Egypt, Saudi
Arabia, Iraq, Kuwait and Iran

Monitoring: AQ stations
Drawbacks:
Few stations near dust sources
No protocol for data exchange
Lack of harmonization in
measurements
Integration of all particles
Many stations located in urban
environments
Average columnar dust contents
2003-2015 (WMO Airborne Dust
Bulletin, 1)

Monitoring: meteorological reports
https://sds-was.aemet.es
19 Mar 2017
Drawbacks:
Indirect estimation (not
mass concentration)
Subjective nature
Limited to severe events

Data assimilation
Drawbacks:
Lack of suitable
observations
Complexity of extracting
the dust signal from the
measured radiance
Modellers often use
processed products rather
than raw observations
They normally assimilate
MODIS AOD using
variational techniques
(ECMWF) or EKF (JMA,
BSC)
Efforts are now aimed at
assimilating products from
GEO satellites and
lidar/ceilometer profiles
MODIS AODretrieval (DT+DB+O) 19 Mar 2017

Verification: sun photometers
Solar radiation at the top of the atmosphere is known
Airborne particles attenuate the direct radiation (absorption, scattering)
The sun-photometers measure the direct radiation that reach the
surface
Measurement at different wavelengths allows retrieval of total aerosol
contents and some of its properties (e. g. size spectrum)

Atmospheric aerosol
The cycle of mineral dust
WMO SDS-WAS
Barcelona Dust Forecast Center
Dust observation
Dust forecast
Summary

Emission
Transport (diffusion,
convection, advection)
Dry / wet deposition
Interaction with radiation
Interaction with cloud droplets
Atmospheric chemistry
…
Dust prediction models
Meteorological model (NWP)
+
Parameterization of the dust cycle
=
Dust prediction model

Incomplete knowledge of the physical processes involved in the
dust cycle
Processes of very diverse scale
Need for a very accurate wind forecast
Lack of adequate observations for assimilation and verification
Tegen et al. (1994)
Marticorena et al. (1997)
Ginoux et al. (2001)
Problems

Dust model intercomparison
Daily predictions of dust surface concentration and optical depth from 12 models are
collected by the SDS-WAS Regional Center
MODEL INSTITUTION DOMAIN DATA
ASSIMILATION
BSC-
DREAM8b
BSC-CNS Regional No
CAMS ECMWF Global MODIS AOD
DREAM-
NMME-MACC
SEEVCCC Regional MACC analysis
NMMB/BSC-
Dust
BSC-CNS Regional No
MetUM Met Office Global MODIS AOD
GEOS-5 NASA Global MODIS
reflectances
NGAC NCEP Global No
RegCM4 EMA Regional No
DREAMABOL CNR Regional No
NOA WRF-
CHEM
NOA Regional No
SILAM FMI Regional No
LOTOS-
EUROS
TNO Regional No
9 Jul 2017

EPS / Verification
The predictions of the 12 models
are interpolated to a common grid
mesh. Then, multi-model products
are generated.
The median presents better
verification scores than any of the
models
A monthly, seasonal and annual routine
evaluation is conducted using AOD data
from 40 AERONET stations
Only observations with an Angstrom
exponent of less than 0.6 are used in order
to rule out those cases where dust is not
the dominant aerosol type
Models are also evaluated with MODIS
AOD (only those that do not assimilate this
product)
Santa Cruz
de Tenerife
Jul 2016