Embed Size (px)
Citation preview

Staff Discussion Paper/Document d’analyse du personnel 2016-13
The Doug Purvis Memorial Lecture—Monetary/Fiscal Policy Mix and Financial Stability: The Medium Term Is Still the Message
by Stephen S. Poloz
2
Bank of Canada Staff Discussion Paper 2016-13
June 2016
The Doug Purvis Memorial Lecture—Monetary/Fiscal Policy Mix and Financial Stability:
The Medium Term Is Still the Message
by
Stephen S. Poloz
Governor Bank of Canada
Ottawa, Ontario, Canada K1A 0G9 [email protected]
ISSN 1914-0568 © 2016 Bank of Canada

ii
Acknowledgements
This paper was delivered as the Doug Purvis Memorial Lecture at the 50th Annual
Conference of the Canadian Economics Association at the University of Ottawa. The
paper benefited greatly from the assistance of Stephen Murchison, as well as from José
Dorich, Vadym Lepetyuk and HanJing Xie, who performed the model simulations. All
remaining errors and omissions are my own responsibility.
Abstract
Financial stability risks have become topical in the wake of the global financial crisis and the
subsequent extended period of very low interest rates. This paper investigates the significance of
the mix of monetary and fiscal policies for financial stability through counterfactual simulations
of three key historical episodes, using the Bank’s main policy model, ToTEM (Terms-of-Trade
Economic Model). The paper finds that there is an intimate relationship between the
monetary/fiscal policy mix and the dynamics of both private sector and public sector debt
accumulation. No attempt is made to develop criteria for policy mix optimization, since it is clear
from the model simulations that the appropriate policy mix is highly state-dependent. This
finding points to the need for a coherent framework for weighing the relative financial and
macroeconomic consequences of accumulating public sector versus private sector debt.
Furthermore, the analysis suggests that there are potential benefits to ex ante monetary/fiscal
policy coordination, and that Canada’s policy framework—where the monetary and fiscal
authorities jointly agree on an inflation target while enshrining central bank operational
independence—represents an elegant coordinating mechanism.
JEL classification: E37, E5, E63
Bank classification: Economic models; Financial stability; Fiscal policy; Monetary policy
framework
Résumé
Les risques liés à la stabilité financière sont devenus d’actualité dans la foulée de la crise
financière mondiale et de la période prolongée de très bas taux d’intérêt qui a suivi. Le présent
article examine l’importance du dosage des politiques monétaire et budgétaire pour la stabilité
financière au moyen de simulations contrefactuelles de trois grands épisodes historiques,
réalisées à l’aide du principal modèle macroéconomique de la Banque, TOTEM (« Terms-of-
Trade Economic Model »). Ces simulations mettent en lumière l’existence d’un lien étroit entre
le dosage des politiques monétaire et budgétaire et la dynamique de l’accumulation de la dette
des secteurs privé et public. L’objectif n’est pas ici d’élaborer des critères d’optimisation du
dosage des politiques, car les simulations montrent clairement que le dosage approprié dépend
fortement de la conjoncture. Ce constat fait ressortir la nécessité d’un cadre cohérent pour
évaluer les conséquences financières et macroéconomiques relatives de l’accumulation de la
dette publique et de la dette privée. En outre, les résultats de l’analyse donnent à penser que la
coordination ex ante des politiques monétaire et budgétaire comporte des avantages potentiels, et
que le cadre de politiques du Canada – en vertu duquel les autorités monétaire et budgétaire
conviennent conjointement d’une cible d’inflation tout en consacrant l’indépendance
opérationnelle de la banque centrale – représente un dispositif de coordination élégant.
Classification JEL : E37, E5, E63
Classification de la Banque : Modèles économiques; Stabilité financière; Politique budgétaire;
Cadre de la politique monétaire

1. Introduction
Doug Purvis was a friend of mine. I did my undergraduate degree in economics at Queen’s
University from 1974 to 1978 and, in my fourth year, was lucky enough to be invited to take
Doug’s graduate macro course. Doug was 30 at the time, only six years my senior, and already
he had serious stature. For some reason, he took an interest in me, in my undergraduate thesis
and my plans for graduate school, and we stayed in touch after I started work at the Bank of
Canada in 1981. Needless to say, I admired him greatly and was crushed when he passed away
in 1993.
Therefore, it is truly an honour for me to be asked to deliver the Doug Purvis Memorial
Lecture today. It is a unique opportunity to pay homage to someone special and, hopefully, to
offer you a new insight at the same time.
As I began to think about what I might discuss today, I found myself remembering an
important talk—the Harold Innis Lecture—that Doug gave at the meetings of the Canadian
Economics Association in 1985 in Montréal (Purvis 1985). I was in the audience that day. That
lecture was titled “Public Sector Deficits, International Capital Movements and the Domestic
Economy: The Medium-Term Is the Message.” Doug certainly held that fiscal policy was an
effective tool for economic stabilization, but he drew us to a very important caveat—that
stimulative fiscal policy meant government borrowing, and the accumulation of debt through
that channel would one day have important side effects not captured in most macroeconomic
models at the time. As Doug showed, these cumulative debt dynamics would, in time, have
both domestic and international consequences.
Those important side effects would manifest themselves in the medium term. Many of
you will recognize Doug’s subtitle, “The Medium-Term Is the Message,” as a reference to the
familiar quote, “the medium is the message,” penned back in 1964 by the Canadian philosopher
Marshall McLuhan, who may have been the most famous student of Harold Innis. This was
typical of Doug—always clever with words, but in a way that connected with a very broad
audience.
My hope today is to do something similar in Doug’s memory, leveraging his work and
that of many others who followed. Back in 1985, Doug walked us through a series of theoretical
models, mostly extensions of the Mundell-Fleming model with debt-stock effects captured;
today, I will explore the same issues using a state-of-the-art policy model to simulate instructive
counterfactuals during key episodes of Canadian economic history.
Of course, I now find myself actually in the job I was dreaming of while sitting in Doug’s
macro class 38 years ago. I’m quite sure Doug would never have forecast that. In fact, he was
rather hoping I would land in academia. But as a central banker, it would be unusual for me to
2
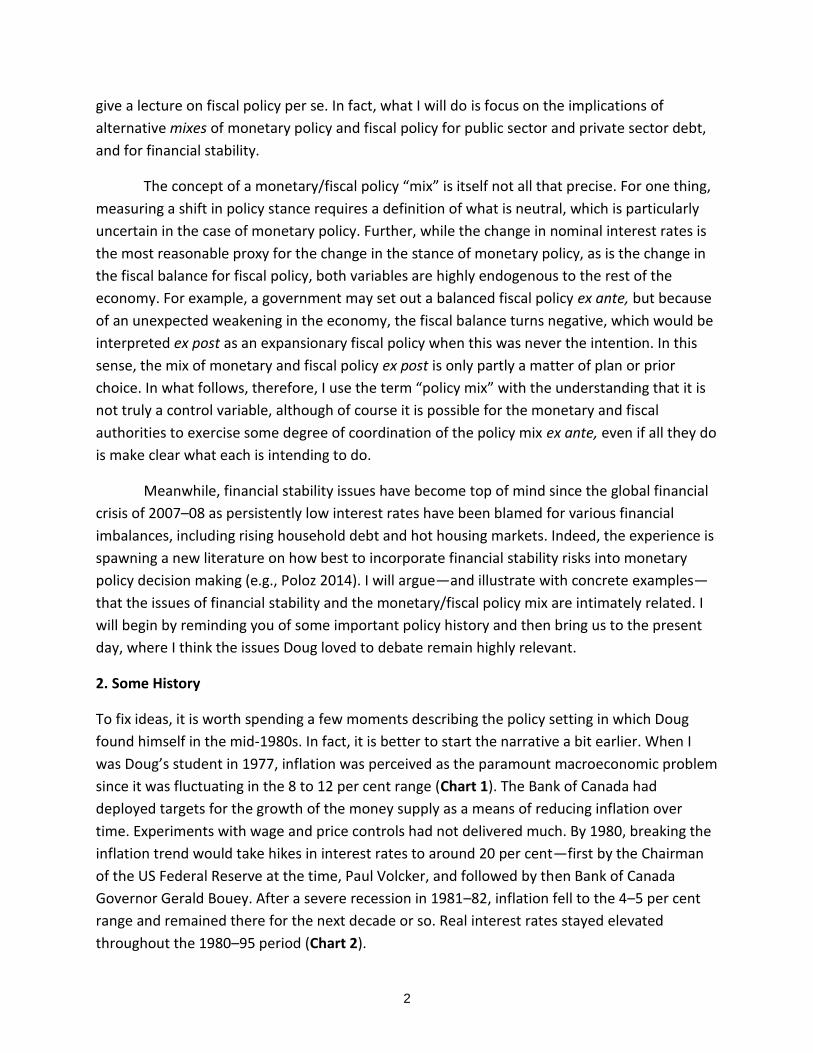
give a lecture on fiscal policy per se. In fact, what I will do is focus on the implications of
alternative mixes of monetary policy and fiscal policy for public sector and private sector debt,
and for financial stability.
The concept of a monetary/fiscal policy “mix” is itself not all that precise. For one thing,
measuring a shift in policy stance requires a definition of what is neutral, which is particularly
uncertain in the case of monetary policy. Further, while the change in nominal interest rates is
the most reasonable proxy for the change in the stance of monetary policy, as is the change in
the fiscal balance for fiscal policy, both variables are highly endogenous to the rest of the
economy. For example, a government may set out a balanced fiscal policy ex ante, but because
of an unexpected weakening in the economy, the fiscal balance turns negative, which would be
interpreted ex post as an expansionary fiscal policy when this was never the intention. In this
sense, the mix of monetary and fiscal policy ex post is only partly a matter of plan or prior
choice. In what follows, therefore, I use the term “policy mix” with the understanding that it is
not truly a control variable, although of course it is possible for the monetary and fiscal
authorities to exercise some degree of coordination of the policy mix ex ante, even if all they do
is make clear what each is intending to do.
Meanwhile, financial stability issues have become top of mind since the global financial
crisis of 2007–08 as persistently low interest rates have been blamed for various financial
imbalances, including rising household debt and hot housing markets. Indeed, the experience is
spawning a new literature on how best to incorporate financial stability risks into monetary
policy decision making (e.g., Poloz 2014). I will argue—and illustrate with concrete examples—
that the issues of financial stability and the monetary/fiscal policy mix are intimately related. I
will begin by reminding you of some important policy history and then bring us to the present
day, where I think the issues Doug loved to debate remain highly relevant.
2. Some History
To fix ideas, it is worth spending a few moments describing the policy setting in which Doug
found himself in the mid-1980s. In fact, it is better to start the narrative a bit earlier. When I
was Doug’s student in 1977, inflation was perceived as the paramount macroeconomic problem
since it was fluctuating in the 8 to 12 per cent range (Chart 1). The Bank of Canada had
deployed targets for the growth of the money supply as a means of reducing inflation over
time. Experiments with wage and price controls had not delivered much. By 1980, breaking the
inflation trend would take hikes in interest rates to around 20 per cent—first by the Chairman
of the US Federal Reserve at the time, Paul Volcker, and followed by then Bank of Canada
Governor Gerald Bouey. After a severe recession in 1981–82, inflation fell to the 4–5 per cent
range and remained there for the next decade or so. Real interest rates stayed elevated
throughout the 1980–95 period (Chart 2).

3
Given this array of developments, fiscal deficits ballooned in the run-up to Doug’s Innis
Lecture in 1985 (Chart 3). The 1970s had witnessed persistent fiscal deficits of 2 to 5 per cent of
GDP, but the deficit expanded during the 1981–82 recession and continued to widen even as
the recovery gained traction, hitting 8 per cent of GDP in 1984. Doug’s message was that the
implications of those deficits for debt accumulation would someday matter.
0
2
4
6
8
10
12
14
1970 1975 1980 1985 1990 1995 2000 2005 2010 2015
%
Chart 1: Inflation in Canada as measured by total CPI, 1970–2015 Year-over-year percentage change, annual data
Last observation: 2015 Source: Statistics Canada
-5
0
5
10
15
20
1970 1975 1980 1985 1990 1995 2000 2005 2010 2015
%
Nominal interest rate Real interest rate
Chart 2: Interest rates in Canada, 1970–2015
Per cent, annual data
Last observation: 2015 Sources: Statistics Canada and Bank of Canada calculations
Note: Nominal interest rate is the annual average of the 3-month treasury bill yield (annualized yield). Real interest rate is the nominal interest rate minus the inflation rate measured by total CPI.

4
As it happens, deficits began to shrink in 1985, but it would take a full 10 years for
budget balance to be achieved. As a consequence, the stock of fiscal debt continued to build
over that period (Chart 4). The macroeconomic situation was made even more difficult by a
significant decline in Canada’s terms of trade (the ratio of export prices to import prices) during
the 1984–87 period, driven mainly by a significant drop in global oil prices (Chart 5), which
made the process of fiscal consolidation doubly challenging.
-10
-8
-6
-4
-2
0
2
4
1970 1975 1980 1985 1990 1995 2000 2005 2010 2015
%
Chart 3: Budgetary balance in Canada (federal), 1970–2015 As a per cent of GDP, annual data
Last observation: 2015–16 Sources: Finance Canada Fiscal Reference Tables 2015 for fiscal years 1970–71 to 2014–15, Federal Budget 2016 for 2015–16
Note: Negative numbers represent a deficit, while positive numbers represent a surplus.
0
10
20
30
40
50
60
70
1970 1975 1980 1985 1990 1995 2000 2005 2010 2015
%
Chart 4: Federal government debt in Canada, 1970–2015
As a per cent of GDP, annual data
Last observation: 2015-16 Sources: Finance Canada Fiscal Reference Tables 2015 for fiscal years 1970–71 to 2014-15, Federal Budget 2016 for 2015-16

5
As the fiscal debt ratio rose through the mid-1980s and early 1990s, consternation in
global financial markets also grew. In 1994–95, federal debt as a share of GDP reached a peak
of 67 per cent. Today, such a government debt ratio sounds high but certainly not catastrophic.
Importantly, though, real interest rates were much higher in the mid-1990s, making the relative
burden of servicing debt much greater than it is at today’s rates. In any case, markets came to
look negatively on Canadian sovereign debt, even describing the weakening Canadian dollar as
“the northern peso” in early 1995 (Chart 6).
Both monetary and fiscal policy-makers responded to this souring of investor sentiment
with renewed urgency. The Bank of Canada had committed to inflation targets in 1991, and
interest rates had been on a declining path, along with inflation. However, interest rates
increased again during 1994–95, despite a slow economy caused in part by weak oil prices; to
0.9
1.0
1.1
1.2
1.3
1970 1975 1980 1985 1990 1995 2000 2005 2010 2015
Index
Chart 5: Canada's terms of trade, 1970–2015 Index: 1970=1, annual data
Last observation: 2015 Sources: Statistics Canada and Bank of Canada calculations
0.6
0.7
0.8
0.9
1.0
1.1
1970 1975 1980 1985 1990 1995 2000 2005 2010 2015
Chart 6: Exchange rate (US$/Can$), 1970–2015
Annual data
Last observation: 2015 Sources: Statistics Canada and Bank of Canada calculations

6
some extent, interest rates rose because markets perceived that the associated exchange rate
depreciation would loop back into inflation pressures, forcing the Bank to tighten policy
eventually. With the benefit of hindsight, it is likely that this market dynamic reflected the fact
that domestic inflation expectations had not yet become anchored by the Bank’s new inflation-
targeting policy, which in turn made it difficult to keep one-time relative price effects on
inflation distinct from the underlying trend in inflation. This is in sharp contrast to our most
recent experience, where well-anchored inflation expectations have enabled the Bank to “look
through” the temporary increase in inflation caused by a weaker currency and actually cut
interest rates to cushion the blow to the economy from falling oil prices.
Meanwhile, fiscal policy was tightened sufficiently to generate a surplus, and fiscal debt
as a share of GDP began a long decline that would be interrupted only by the global financial
crisis and the ensuing global recession. As a consequence, federal government debt as a share
of GDP is around half what it was at its peak in the mid-1990s.
Accordingly, at the risk of oversimplification, we can characterize the history of
Canada’s monetary/fiscal policy mix as follows. When Doug was preparing his Innis Lecture, we
had tight monetary policy and easy fiscal policy. Over the following 10 years, fiscal policy
gradually tightened, and monetary policy took this trend into account while pursuing its
inflation targets. Then, from the late-1990s until the global financial crisis, fiscal surpluses were
generally the norm, and monetary policy remained focused on keeping inflation close to target.
In the aftermath of the global financial crisis, of course, the G20 countries undertook a
coordinated fiscal easing, with many easing monetary policy as well. Starting in 2010, however,
with the worst effects of the crisis behind us, Canada’s fiscal policy gradually moved back into
consolidation mode. Even so, the legacy effects of the financial crisis have lingered in many
countries, and Canada’s export recovery has been halting at best. Accordingly, monetary policy
has remained very easy in order to keep inflation near its target.
Thus, in broad strokes, over 30 years, Canada’s policy mix moved from tight
monetary/easy fiscal to neutral/neutral and then to easy monetary/tight fiscal, until the fiscal
adjustments made in 2016, just at the time of writing.
This quick historical sketch raises some obvious questions about the mix of monetary
and fiscal policies and the consequences for debt dynamics, for both governments and the
private sector. Intuitively, a tight monetary/easy fiscal policy mix means a relatively slow
accumulation of private sector debt and relatively rapid accumulation of fiscal debt; an easy
monetary/tight fiscal policy mix would deliver the opposite dynamic. Either dynamic can
eventually give rise to financial stability risks, as was the case for rising government debt in the
mid-1990s and for rising household imbalances over the past few years. In the following
sections, we explore these linkages in greater depth.

7
3. Some Counterfactuals
In this section, we use the Bank of Canada’s core policy model, ToTEM (Terms-of-Trade
Economic Model) to investigate the significance of the policy mix for some key macroeconomic
episodes.
ToTEM is a large-scale, multi-sector, dynamic stochastic general-equilibrium (DSGE)
model that reflects the consensus view of the key macroeconomic linkages in the Canadian
economy (Murchison and Rennison 2006; Dorich et al. 2013). In particular, ToTEM captures the
stock-flow dynamics for both government debt and household wealth (and therefore debt) that
so preoccupied Doug Purvis.
ToTEM represents some 30 years of research effort, beginning (not coincidentally) at
about the same time that Doug began to work on these issues. ToTEM is essentially the
grandchild of SAM (Small Annual Model) (Rose and Selody 1985), which was developed in the
mid-1980s. SAM incorporated for the first time fully articulated household and government
debt dynamics, endogenous potential output and model-consistent (i.e., rational) inflation
expectations. SAM was later made quarterly and elaborated in a number of respects to produce
QPM (Quarterly Projection Model) (Black et al. 1994; Armstrong et al. 1995), which was the
Bank’s projection model from the mid-1990s until the mid-2000s. As its name suggests, ToTEM
is the first model of its kind to have a fully developed commodity sector that captures economic
and financial interactions with the terms of trade. This investment in modelling more than paid
for itself in 2015, when the Bank was able to reach an early understanding of the plunge in
global oil prices that took place in late 2014 and early 2015.
I have no doubt that Doug would have enjoyed using ToTEM to explore the issue of the
monetary/fiscal policy mix in Canada. Although his preference was to gain his insights from
tractable theoretical models, the literature has progressed with more elaborate models mainly
by going numerical. In what follows, we seek insights by examining alternative scenarios in
known macroeconomic episodes constructed using ToTEM.
3.1 Counterfactual 1: Purvis’s 1985 warning is heeded immediately
As discussed above, Doug expressed considerable concern in 1985 about the medium-term
debt implications of fiscal policies in place at the time. Although budget deficits began a slow
decline around that time, these efforts really became aggressive after the emergence of
international financial market pressures in 1994–95. As noted earlier, the headwind of declining
oil prices posed a significant challenge for fiscal policy during the 1980s.
Accordingly, in our first counterfactual, we ask what the implications for the economy
might have been had Doug’s warning been heeded immediately, with the federal deficit
brought into balance over the five years from 1985 to 1990, about five years earlier than when

8
it actually occurred. The historical and counterfactual budget deficits are shown in Chart 7,
along with a number of other simulation results. In this ToTEM simulation, monetary policy is
modelled using a reaction function estimated on historical data that aims to keep inflation and
therefore aggregate demand (or real GDP) close to their actual historical paths. Since neither
fiscal nor monetary policy is modelled as truly optimal, we are abstracting from the possibility
that different policies might have offered a different, potentially superior, set of
macroeconomic outcomes. We are also abstracting from a key monetary policy issue at the
time, namely, the lack of a well-defined policy target, as inflation targets were not formally
introduced until 1991. ToTEM is built on a credible inflation target and a mixture of rules of
thumb and rational expectations. Despite these caveats, the simulation is instructive.
The shock we analyze is a series of cuts to government spending beginning in 1985 that
brings the federal budget into balance by 1990 and holds it there. Notice that, given the
importance of debt servicing to federal spending at the time, this would have meant a
significant surplus of 4 to 5 per cent of GDP measured in primary terms (i.e., net of interest
payments). Obviously, since we are basing our counterfactuals on actual history, starting points
will matter to the simulations. According to our model, under this assumption of aggressive
fiscal consolidation, the federal debt would have peaked at about 50 per cent of GDP in 1986–
89, instead of around 67 per cent in 1995. Indeed, the federal debt would have declined over
the next several years, falling into the high 30s as a percentage of GDP, some 30 percentage
points lower than actually occurred.
Under this tighter fiscal scenario, interest rates would be lower by between 1 and
2 percentage points, since monetary policy would be cushioning the economy from the
downside shock of lower fiscal spending. This lower interest rate profile would have had a
significant impact on the Canadian dollar, which would have been lower by as much as 8 cents
US. The currency would have peaked at around 80 cents US (measured in annual average
terms), compared with the actual peak of more than 87 cents US on average in 1991.
Canadian households would have responded to this lower interest rate environment by
purchasing more durable goods and houses and therefore borrowing more. Household debt
would have been higher in 1995, by more than 3 per cent of GDP. Clearly, with less government
demand in the economy, there would have been more private sector activity, including
consumption spending, housing construction and, given the lower Canadian dollar, more
exports.
What this counterfactual illustrates is that a shift in policy mix along the lines suggested
by Doug in 1985 would have had predictable implications for the Canadian economy. Notice,
however, that the lower trajectory for government debt would have had a mirror image, albeit
more modest in scope, in household debt. Thus, even from this modest experiment, it is clear
that the stocks of fiscal debt and household debt are interrelated.

9
Chart 7: Faster fiscal consolidation over the 1985–95 period Annual data
Sources: Statistics Canada, Finance Canada Fiscal Reference Tables 2015, Bank of Canada, Bank of Canada calculations
-9
-8
-7
-6
-5
-4
-3
-2
-1
0
1
1985 1987 1989 1991 1993 1995
%
History Counterfactual
a. Federal total balance
Per cent of GDP
-5
-4
-3
-2
-1
0
1
2
3
4
5
6
1985 1987 1989 1991 1993 1995
%
History Counterfactual
b. Federal primary balance
Per cent of GDP
30
35
40
45
50
55
60
65
70
1985 1987 1989 1991 1993 1995
%
History Counterfactual
c. Federal debt
Per cent of GDP
30
35
40
45
50
55
60
65
70
1985 1987 1989 1991 1993 1995
%
History Counterfactual
d. Household debt
Per cent of GDP
0
1
2
3
4
5
6
7
8
9
10
11
12
13
14
15
1985 1987 1989 1991 1993 1995
%
History Counterfactual
e. Short-term interest rate
0.6
0.7
0.8
0.9
1985 1987 1989 1991 1993 1995
History Counterfactual
f. Exchange rate (US$/Can$)

10
As for the desirability of one policy mix over another, hindsight is always 20:20 and such
a discussion would have little meaning here. The Canadian economy was going through a very
challenging period—recovering from the trauma of very high interest rates, falling oil prices and
unanchored inflation expectations—and monetary policy and fiscal policy were both trying to
achieve very important objectives. Here, and in subsequent sections, we will refrain from
evaluating the pros and cons of alternative policy mixes.
3.2 Counterfactual 2: Fiscal policy in primary structural balance from 2000
Having examined an interesting but fairly arbitrary counterfactual adjustment to fiscal policy in
the late-1980s, we now turn to a more rigorous experiment around the policy mix. In our
remaining counterfactuals, we hold fiscal policy in balance (moving the primary structural fiscal
balance to zero) and allow monetary policy to adjust to produce the same level of economic
activity that was observed in the historical data. The primary structural fiscal balance (Chart 8) is
estimated by adjusting budgetary components of revenues and spending to account for the effect
of the output gap and the trading-gain gap, as estimated by the Bank of Canada (see Pichette et
al. [2015] for information on the output gap and Barnett and Matier [2010] for information on
the trading-gain gap). This approach is similar to the one used by the Parliamentary Budget
Officer (Barnett and Matier 2010). Having estimated the primary structural balance, we then add
fiscal spending shocks to the model to force that definition of fiscal balance to zero while
constraining real GDP to follow its original historical path through a corresponding adjustment to
the path of short-term interest rates. This allows us to investigate the policy issue purely in terms
of a monetary/fiscal mix. The simulations are summarized in Chart 9.
-10
-8
-6
-4
-2
0
2
4
6
8
1970 1975 1980 1985 1990 1995 2000 2005 2010 2015
%
Federal fiscal balance Primary fiscal balance Primary structural fiscal balance
Chart 8: Alternative measures of fiscal balance as a share of nominal GDP, 1970–2015
Annual data
Last observation: 2015 Sources: Statistics Canada and Bank of Canada calculations

11
Chart 9: Balanced fiscal policy from 2000 Annual data, 2001–15
Sources: Statistics Canada, Finance Canada Fiscal Reference Tables 2015, Federal Budget 2016, Bank of Canada, Bank of Canada calculations
-6
-5
-4
-3
-2
-1
0
1
2
2001 2003 2005 2007 2009 2011 2013 2015
%
History Counterfactual
a. Federal total balance Per cent of GDP
-2
-1
0
1
2
3
4
5
6
2001 2003 2005 2007 2009 2011 2013 2015
%
History Counterfactual
b. Federal primary structural balance Per cent of GDP
20
30
40
50
60
70
80
90
100
2001 2003 2005 2007 2009 2011 2013 2015
%
History Counterfactual
c. Federal debt Per cent of GDP
20
30
40
50
60
70
80
90
100
2001 2003 2005 2007 2009 2011 2013 2015
%
History Counterfactual
d. Household debt Per cent of GDP
0
1
2
3
4
5
6
7
8
9
10
2001 2003 2005 2007 2009 2011 2013 2015
%
History Counterfactual
e. Short-term interest rate
0.6
0.7
0.8
0.9
1.0
1.1
1.2
2001 2003 2005 2007 2009 2011 2013 2015
History Counterfactual
f. Exchange rate (US$/Can$)

12
Because the government ran persistent fiscal surpluses prior to the global financial
crisis, this counterfactual would have implied considerably easier fiscal policy during the 2000–
07 period, with additional fiscal spending of about 3 to 4 per cent of GDP in primary terms in
most years. Federal debt would have risen steadily throughout the 15-year period, including a
sharp rise during the Great Recession of 2008–10. By 2015, federal debt would have been
around
70 per cent of GDP and still rising—a higher level than the one that prompted market angst in
the mid-1990s. Clearly, therefore, this counterfactual simulation could have tested the limits of
policy mix flexibility. Indeed, such a policy might have proven technically unsustainable, given
the starting point.
Monetary policy in the scenario would have been much tighter under this easy fiscal
policy profile because the central bank would be working to achieve the same path for real GDP
as occurred in history, despite much higher government spending. In other words, monetary
policy would be working to offset the fiscal stimulus. Short-term interest rates would have
fluctuated between 5 and 10 per cent during most of the period, except during the aftermath of
the global financial crisis when rates would have fallen to as low as around 2 per cent. But rates
still would have risen to around 7 per cent again by 2012–15.
Not surprisingly, the Canadian dollar would have been much stronger under this
scenario. Already being pushed toward parity by the steady rise in prices for oil and other
commodities during 2002–12, the dollar would have averaged about 6 cents US higher than its
actual historical level but would have averaged around 10 cents higher during 2012–15. This
would have meant even more long-term damage to the export sector and an even more
laborious recovery from the global financial crisis.
Clearly, this alternative scenario strains credibility in various ways, but our objective is
not to derive a preferable policy path but rather to consider the implications of the shift in
policy mix for debt and financial stability. While the federal government would be racking up a
historically high stock of debt under the fiscal assumptions in our counterfactual, Canadian
households would be doing the opposite. By 2015, household debt as a share of GDP would
have been more than 20 percentage points lower than it is today, while government debt
would be nearly 40 percentage points higher.
Notice that there is not a 1:1 inverse relationship between the debt stocks of the public
and private sectors. This reflects the empirical finding that household indebtedness is only
modestly influenced by monetary policy, a characteristic embedded in our simulations. It also
reflects the overall impact of monetary policy on real GDP, which extends well beyond its
influence on household borrowing. The trade-off between the two debt stocks is highly
dependent on the array of shocks hitting the economy at a point in time.

13
3.3 Counterfactual 3: Fiscal policy in primary structural balance from 2011
Our third counterfactual scenario looks at the post-crisis period. After a significant easing of
both monetary and fiscal policies from 2008 to 2010 across most of the G20, there was a fairly
synchronized return toward neutral or tighter fiscal policy in the next couple of years. Monetary
policy remained easy in many countries, particularly advanced economies, and in some cases
was eased further as recoveries faltered. This has given rise to a debate around the
monetary/fiscal mix—essentially asking what would have happened had fiscal policy remained
easier for longer. In particular, the issue of rising household imbalances and the associated risks
to financial stability have come to the fore.
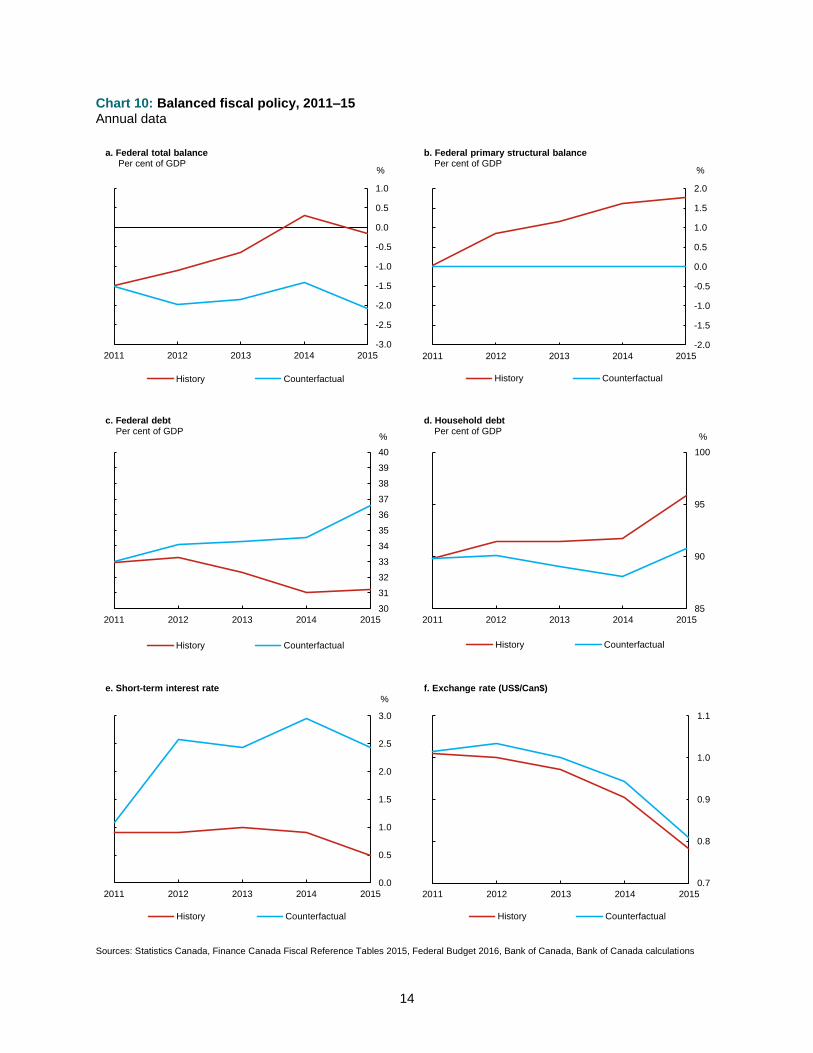
Accordingly, we use ToTEM to conduct a simulation with the primary structural fiscal
balance constrained to zero, starting in 2011. The results are shown in Chart 10. Because
Canada’s primary structural fiscal balance actually moved into surplus in 2011 and rose to
about 2 per cent of GDP by 2015 (Chart 8), this counterfactual would have entailed rising fiscal
spending and persistent fiscal deficits through the 2011–15 period. By 2015, federal debt would
have risen by about 6 per cent of GDP, to about 37 per cent.
To therefore achieve the same level of real output, monetary policy would have been
somewhat tighter, with interest rates fluctuating around 2 to 3 per cent instead of around 1 per
cent, as actually happened. The Canadian dollar would have been stronger as well, by about 3
cents US, on average. It would be fair to argue that, in the context of a soft economy, monetary
policy might not have been tightened as the scenario describes, especially since for most of
2012 and 2013 core inflation was around 1 per cent, about 1 percentage point below target. By
forcing our model to replicate the historical GDP performance, monetary policy would have
necessarily been tighter and would have clearly offset some of the effects of the increased fiscal
spending in the counterfactual—an unlikely outcome, given the situation.
With the higher profile for interest rates, household debt would have been lower than it
actually was in 2015, by some 7 per cent of disposable income, or 5 per cent of GDP. Notice
that the trade-off between private sector debt and fiscal debt in this shorter simulation is close
to 1:1. Even if the financial vulnerability associated with household debt had been lower
throughout the period, it would still have begun to rise again, beginning in 2014. Thus, although
the counterfactual shift in policy mix would have mitigated financial stability risks, they would
still have figured prominently in monetary policy deliberations by 2015.
14
Chart 10: Balanced fiscal policy, 2011–15 Annual data
Sources: Statistics Canada, Finance Canada Fiscal Reference Tables 2015, Federal Budget 2016, Bank of Canada, Bank of Canada calculations
-3.0
-2.5
-2.0
-1.5
-1.0
-0.5
0.0
0.5
1.0
2011 2012 2013 2014 2015
%
History Counterfactual
a. Federal total balance Per cent of GDP
-2.0
-1.5
-1.0
-0.5
0.0
0.5
1.0
1.5
2.0
2011 2012 2013 2014 2015
%
History Counterfactual
b. Federal primary structural balance Per cent of GDP
30
31
32
33
34
35
36
37
38
39
40
2011 2012 2013 2014 2015
%
History Counterfactual
c. Federal debt Per cent of GDP
85
90
95
100
2011 2012 2013 2014 2015
%
History Counterfactual
d. Household debt Per cent of GDP
0.0
0.5
1.0
1.5
2.0
2.5
3.0
2011 2012 2013 2014 2015
%
History Counterfactual
e. Short-term interest rate
0.7
0.8
0.9
1.0
1.1
2011 2012 2013 2014 2015
History Counterfactual
f. Exchange rate (US$/Can$)
15
4. The Appropriate Policy Mix Depends on the State of the Economy
These counterfactual simulations offer a practitioner’s glimpse into a difficult problem—how to
define a guide for a monetary/fiscal policy mix that, if not optimal ex ante, at least works well
on average ex post. The literature on this subject has employed increasingly complex DSGE
models (see, for example, Gnocchi and Lambertini 2016). Despite those complexities, such
models remain far more simple than the sort of elaborate model a policy-maker generally relies
on, such as ToTEM. Thus, one can learn only so much from the conclusions that have been
reached to date.
A key finding in this literature relates to monetary policy’s “commitment,” or, in
common parlance, inflation targets. In a model with government debt, the higher the level of
that debt, the more incentive there is for government to create some surprise inflation,
because surprise inflation erodes the real value of outstanding debt and reduces the need for
future taxation. Such inflation surprises, of course, erode the value of private sector savings
and, in time, lead to a de-anchoring of inflation expectations. Clearly, an inflation target
committed to by the central bank (and, in the case of Canada, agreed to jointly with the federal
government) can help offset this incentive. Accordingly, models with inflation commitments
tend to predict a lower stock of government debt. As well, the credible inflation commitment
gives both monetary and fiscal policy the ability to offset macroeconomic fluctuations. Because
inflation stability emerges only when the economy is sustainably at full capacity, the
coordination problem between monetary and fiscal policy is highly simplified when there is
such a joint commitment to inflation targets.
Where the issue of monetary/fiscal policy mix comes more to the fore is when the
economy is far from equilibrium, and persistently so. As we saw in our simulations, starting
points matter, and persistent disequilibrium gives rise to accumulating debt stocks in either the
public sector or the private sector, or both. As is well known, so-called Ricardian effects are
likely to become increasingly apparent as private sector debt rises—households know full well
that they will have to pay the money back someday, so they will not accumulate debt ad
infinitum. There is every reason to expect similar reactions to high and rising public sector debt:
since households know that they will someday have to pay higher taxes to cover the debt the
government is incurring, they might respond to increased government spending by increasing
their savings today and, in so doing, partially offset the government’s stimulus efforts.
This suggests that there is a meaningful trade-off in the policy space between the
medium-term consequences for debt of monetary and fiscal policies. An easy monetary/tight
fiscal policy mix will lead to higher private sector debt and lower public sector debt, all other
things being equal. Similarly, a tight monetary/easy fiscal policy mix will lead to lower private
sector debt and higher public sector debt. In effect, for a given macroeconomic situation,
policy-makers have the ability to choose the dynamics of those two debt stocks—they can’t

16
influence the two debt stocks independently, but their policy choices have simultaneous
implications for both variables.
What we lack at this time is a coherent framework for weighing the relative
macroeconomic consequences of private sector debt versus public sector debt. For a given
economic situation, what combination of public sector debt and private sector debt represents
the best outcomes from the point of view of financial stability? On all counts, this trade-off is
likely to be extremely complex, highly dependent on the economic situation and therefore
likely to complicate significantly the choice of policy mix.
The next generation of policy models will hopefully be enriched in this dimension,
capturing the complexity of the underlying linkages between economic behaviour and financial
variables in much the same way that ToTEM made such a significant advance with respect to
terms-of-trade shocks. In addition to the stocks of debt, these enriched models would include
other dimensions of financial stability risk, such as overvalued property or stock market prices,
and the feedback these elements can have for consumers and financial intermediaries. A better
understanding of the medium-term trade-off of private sector versus public sector debt will be
helpful in developing stronger guidance around the monetary/fiscal policy mix. No doubt, over
the next few years in Canada, we will learn more about this trade-off at a practical level.
5. Conclusion
We have seen a lot in the 30 years since Doug Purvis gave his Innis Lecture. We have learned
that there are limits to how much government debt financial markets will tolerate, as Doug
thoughtfully predicted. We have also learned that, in unusual circumstances, private sector
debt can reach levels that can similarly strain the tolerance of financial markets. These strains
inevitably feed back into monetary policy deliberations, either because they have real effects
on the economy or because central banks see the danger of making financial stability risks
worse while trying to lessen macroeconomic risks. Central banks are actively engaged in
determining how best to incorporate such financial stability concerns into the conduct of
monetary policy. The analysis presented here has demonstrated that there is an intimate
connection between the debt stocks embedded in financial stability issues and the
monetary/fiscal policy mix.
Objectives for monetary policy, such as monetary or inflation targets, have historically
been seen mainly as a recipe for staying out of trouble; in other words, they are meant to
manage macroeconomic risks in the face of uncertainty, while delivering a less uncertain
environment for economic decision making. While experience shows that inflation targets have
improved macroeconomic performance, the experience of the global financial crisis and its
aftermath demonstrates well that such targets are not sufficient for preventing trouble. Clearly,

17
there can be medium-term consequences that must be taken into account when formulating
monetary policy, certainly in the presence of persistent shocks to the economy.
This strongly suggests that the best mix of monetary and fiscal policy will depend on the
economic situation, and any derived optimality condition is likely to serve only as a rough guide.
Rather, policy coordination around an agreed goal seems to hold out more promise than
seeking some optimality condition. Given the sanctity of central bank independence, the
narrowest form of monetary and fiscal policy coordination would be for the central bank to
take fiscal policy into account while pursuing its inflation target independently. However, within
an institutional arrangement that enshrines central bank independence, there is scope for ex
ante sharing of information and judgment between the two authorities. After all, the inflation
target in Canada is agreed to by the central bank and the government. This institutional
framework is a simple yet elegant form of monetary and fiscal policy coordination that may
have anticipated some recent literature (e.g., Leeper and Leith 2016).
My guess is that Doug Purvis already understood most of this. Certainly, he pointed us in
the right direction 30 years ago. So, if I may paraphrase one of my late friend’s most famous
lines, the appropriate monetary/fiscal policy mix depends on the situation, but the medium
term is still the message.

18
References
Armstrong, J., R.Black, D. Laxton and D. Rose. 1995. “The Bank of Canada’s New Quarterly Projection
Model, Part 2. A Robust Method for Simulating Forward-Looking Models.” Bank of Canada Technical
Report No. 73.
Barnett, R. and C. Matier. 2010. “Estimating Potential GDP and the Government’s Structural Budget
Balance.” Office of the Parliamentary Budget Officer. Available at
http://publications.gc.ca/site/eng/366811/publication.html.
Black, R., D. Laxton, D. Rose and R. Tetlow. 1994. “The Bank of Canada’s New Quarterly Projection
Model, Part 1. The Steady-State Model: SSQPM.” Bank of Canada Technical Report No. 72.
Dorich. J., M. Johnston, R. Mendes, S. Murchison and Y. Zhang. 2013. “ToTEM II: An Updated Version of
the Bank of Canada’s Quarterly Projection Model.” Bank of Canada Technical Report No. 100.
Gnocchi, S. and L. Lambertini. 2016. “Monetary Commitment and the Level of Public Debt.” Bank of
Canada Staff Working Paper No. 2016-3.
Leeper, E. and C. Leith. 2016. “Understanding Inflation as a Joint Monetary-Fiscal Phenomenon.”
National Bureau of Economic Research Working Paper No. 21867.
Murchison, S. and A. Rennison. 2006. “ToTEM: The Bank of Canada’s New Quarterly Projection Model.”
Bank of Canada Technical Report No. 97.
Pichette, L., P. St-Amant, B. Tomlin and K. Anoma. 2015. “Measuring Potential Output at the Bank of
Canada: The Extended Multivariate Filter and the Integrated Framework.” Bank of Canada Staff
Discussion Paper No. 2015-1.
Poloz, S. S. 2014. “Integrating Uncertainty and Monetary Policy-Making: A Practitioner’s Perspective.”
Bank of Canada Staff Discussion Paper No. 2014-6.
Purvis, D. 1985. “Public Sector Deficits, International Capital Movements, and the Domestic Economy:
The Medium-Term Is the Message.” Canadian Journal of Economics 18: 723–42.
Rose, D. and J. Selody. 1985. “The Structure of the Small Annual Model.” Bank of Canada Technical
Report No. 40.