Embed Size (px)
Citation preview

www.csis.org |
The DoD Threat to US National Security: Controlling Costs and Demanding Effective Program Execution
January 28, 2012
1800 K Street, NW Suite 400
Washington, DC 20006
Phone: 1.202.775.3270 Fax: 1.202.775.3199
Email: [email protected]
Web: www.csis.org/burke/reports
Anthony H. Cordesman, Arleigh A. Burke Chair in Strategy with Bradley Bosserman
2 2
Introduction The US Congress has passed budget legislation that threatens devastating cuts in national security funding if the Congress does not act to find meaningful solutions to the nation’s debt and deficit problems by the end of 2011. These cuts, however, are only one of several non-traditional threats to US security.
This brief analyzes the pattern of cuts in recent, ongoing, and possible future defense and national security spending that affects the US and its ability to project power and aid its friends and allies. It shows, however, that this is only part of the story:
• The US may not face peer threats in the near to mid term, but it faces a wide variety of lesser threats that make maintaining effective military forces, foreign aid, and other national security programs a vital national security interest.
• The US does need to reshape its national security planning and strategy to do a far better job of allocating resources to meet these threats. It needs to abandon theoretical and conceptual exercises in strategy that do not focus on detailed force plans, manpower plans, procurement plans, and budgets; and use its resources more wisely.
• The US still dominates world military spending, but it must recognize that maintaining the US economy is a vital national security interest in a world where the growth and development of other nations and regions means that the relative share the US has in the global economy will decline steadily over time, even under the best circumstances.
• At the same time, US dependence on the security and stability of the global economy will continue to grow indefinitely in the future. Talk of any form of “independence,” including freedom from energy imports, is a dangerous myth. The US cannot maintain and grow its economy without strong military forces and effective diplomatic and aid efforts.
• US military and national security spending already places a far lower burden on the US economy than during the peaceful periods of the Cold War, and existing spending plans will lower that burden in the future. National security spending is now averaging between 4% and 5% of the GDP in spite of the fact the US is fighting two wars versus 6-7% during the Cold War.
• No amount of feasible cuts in US national security spending can have more than a token impact on the US deficit and debt problems.
• The most serious single threat the US faces to its national security comes from the non-traditional threat of entitlements spending, but this federal spending is driven by far more serious problems that cannot be addressed simply by altering federal spending. These are driven by non-traditional threats that extend far beyond government spending:
• An aging population that does not save or assume responsibility for retirement; and
3 3
• Unaffordable rises in the burden medical care puts on the economy which cannot be dealt with by cutting back the level of government spending without addressing the entire problem.
• The steady decline in the size and military capability of our traditional allies poses another critical non-traditional threat. It is clear that no amount of US exhortation will change this situation and the US must reshape its strategy accordingly.
• The rise of threats like terrorism is only one aspect of new shifts in the threats to the US that force it to work far more closely and effectively with non-traditional allies, reshape elements of its military spending and operations to help build up their capabilities, and maintain strong embassy teams and aid efforts to help bring political and economic stability.
• The US must fundamentally rethink its approach to “optional wars.” It is far from clear that it can win the Iraq War, rather than empower Iran, without a strong military and aid presence. It will decisively lose the Afghan and Pakistan conflict if it does not quickly develop plans for a military and diplomatic presence, and help to aid Afghanistan in transitioning away from dependence on foreign military and economic spending during 2012-2020. US troop cuts are not a transition plan, and focusing on withdrawal is a recipe for defeat.
• That said, the US cannot, and should not, repeat the mistake it made in intervening in Iraq and Afghanistan. It must deal with non-traditional threats with a far better and more affordable mix of global, regional, and national strategies that can deal with issues like the turmoil in the Middle East, and South and Central Asia, and terrorism and instability on a global basis. It must rely on aiding friendly states, deterrence, containment, and far more limited and less costly forms of intervention.
• The new budget act poses a potentially crippling threat to US national security. Further major defense spending cuts pose a major additional threat under these conditions. The US has already made major cuts in its defense efforts since FY2009, and plans to implement an additional $250 billion in cuts over the next five years. It cannot absorb major additional cuts under these conditions.
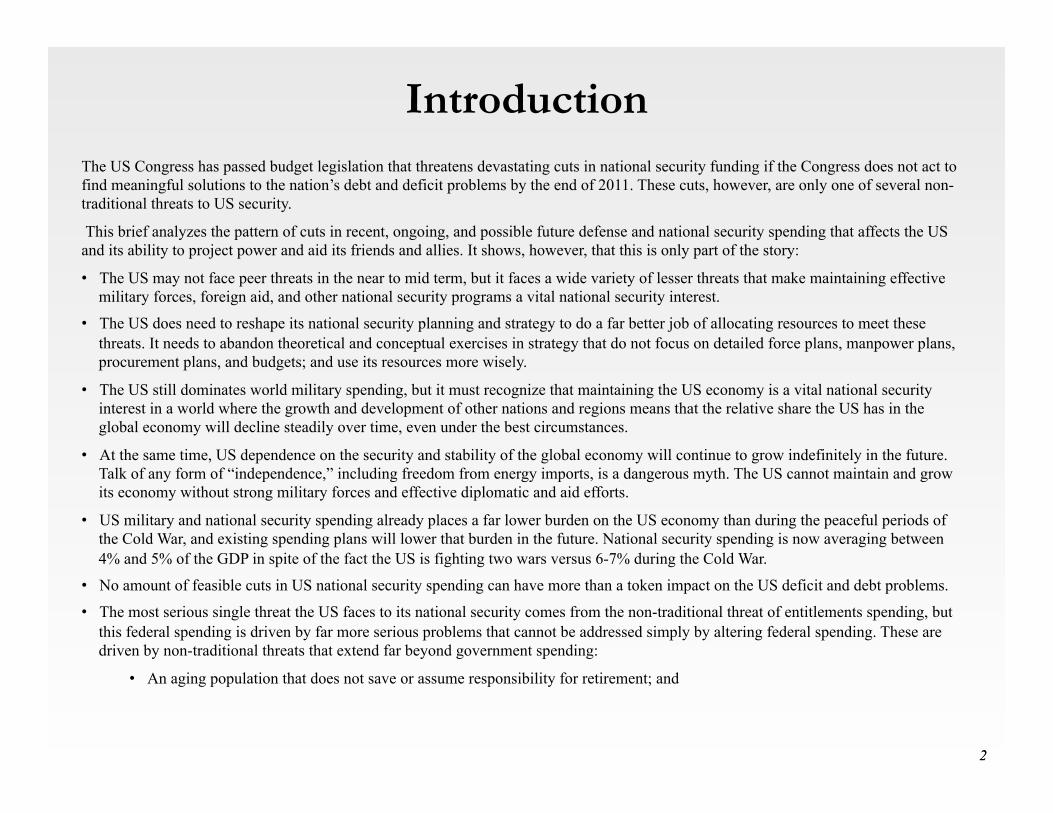
The Department of Defense does, however, need to make a major new effort to deal with its own, self-inflicted non-traditional threats.
• Massive rises in the cost per solider on active duty.
• A quarter century of posturing (?), failed efforts to develop effective procurement programs and cost controls.
• A fundamental breakdown in the ability to tie strategy to feasible, affordable programs.
It is also clear that far more integrated planning is needed at some point to address the proper mix of State Department, Department of Defense, various homeland defense, and Intelligence Community efforts. It is unclear that this would produce meaningful budget savings, but it is all too clear that the present compartmented and stovepiped efforts do not produce anything approaching an integrated strategy or efficient use of resources.

4
The US Economic Burden Threat to US Strategy

5 5
Defense Plans as a Portion of GDP
CBO, Statement of Director Elmendorf before the Joint Select Committee on Deficit Reduction, October 26, 2011, p. 20.

6 6
CBO Estimate Defense Share of Discretionary
Spending: 1971-2021 Without 50% Cut
CBO, The Budget and Economic Outlook, 2011-2021, January 2011, p. 79

7
The Deficit and the Debt Threat to US Strategy

8 8
CBO Estimate of Impact of Budget Deficit: 1971-2021
CBO, The Budget and Economic Outlook, 2011-2021, January 2011, p. 16 and CBO, The Budget and Economic Outlook: An Update, August 2011, Pg. 3

9 9
CBO Estimate of Impact of Federal Debt: 1940-2021
CBO, The Budget and Economic Outlook: An Update, August 2011, Pg. 14

10 10
Legal vs. Probable Real Federal Debt as % of GDP
CBO, CBO’s 2011 Long-Term Budget Outlook, June 2011, p. xi. .
SUMMARY CBO’S 2011 LONG-TERM BUDGET OUTLOOK XI
CBO
Summary Figure 1.
Federal Debt Held by the Public Under CBO’s Long-Term Budget Scenarios(Percentage of gross domestic product)
Source: Congressional Budget Office.
Note: The extended-baseline scenario adheres closely to current law, following CBO’s 10-year baseline budget projections through 2021 and then extending the baseline concept for the rest of the long-term projection period. The alternative fiscal scenario incorporates several changes to current law that are widely expected to occur or that would modify some provisions that might be difficult to sustain for a long period. (For details, see Table 1-1 on page 4.)
The Impact of Growing Deficits and DebtCBO’s projections in most of this report understate the severity of the long-term budget problem because they do not incorporate the negative effects that additional federal debt would have on the economy, nor do they include the impact of higher tax rates on people’s incentives to work and save. In particular, large budget deficits and growing debt would reduce national saving, leading to higher interest rates, more borrowing from abroad, and less domestic investment—which in turn would lower income growth in the United States. Taking those effects into account, CBO estimates that under the extended-baseline scenario, real (inflation-adjusted) gross national product (GNP) would be reduced slightly by 2025 and by as much as 2 percent by 2035, compared with what it would be under the stable economic environment that underlies most of the projections in this report.3 Under the alternative fiscal scenario, real GNP would be 2 percent to 6 percent lower in 2025, and 7 percent to 18 percent lower in 2035, than under a stable economic environment.
Rising levels of debt also would have other negative consequences that are not incorporated in those esti-mated effects on output:
Higher levels of debt imply higher interest payments on that debt, which would eventually require either higher taxes or a reduction in government benefits and services.
Rising debt would increasingly restrict policymakers’ ability to use tax and spending policies to respond to unexpected challenges, such as economic downturns or financial crises. As a result, the effects of such devel-opments on the economy and people’s well-being could be worse.
2000 2005 2010 2015 2020 2025 2030 2035
0
25
50
75
100
125
150
175
200
0
25
50
75
100
125
150
175
200
Extended-Baseline Scenario
Alternative Fiscal Scenario
Actual Projected
3. GNP differs from GDP primarily by including the capital income that residents earn from investments abroad and exclud-ing the capital income that nonresidents earn from domestic investment. In the context of analyzing the impact of growing deficits and debt, GNP is a better measure because projected budget deficits would be partly financed by inflows of capital from other countries.

11 11
DoD Estimate of Budget Deficit
Source: Department of Defense, B02-11-101 v 2.2FY 2012 Budget
12 12
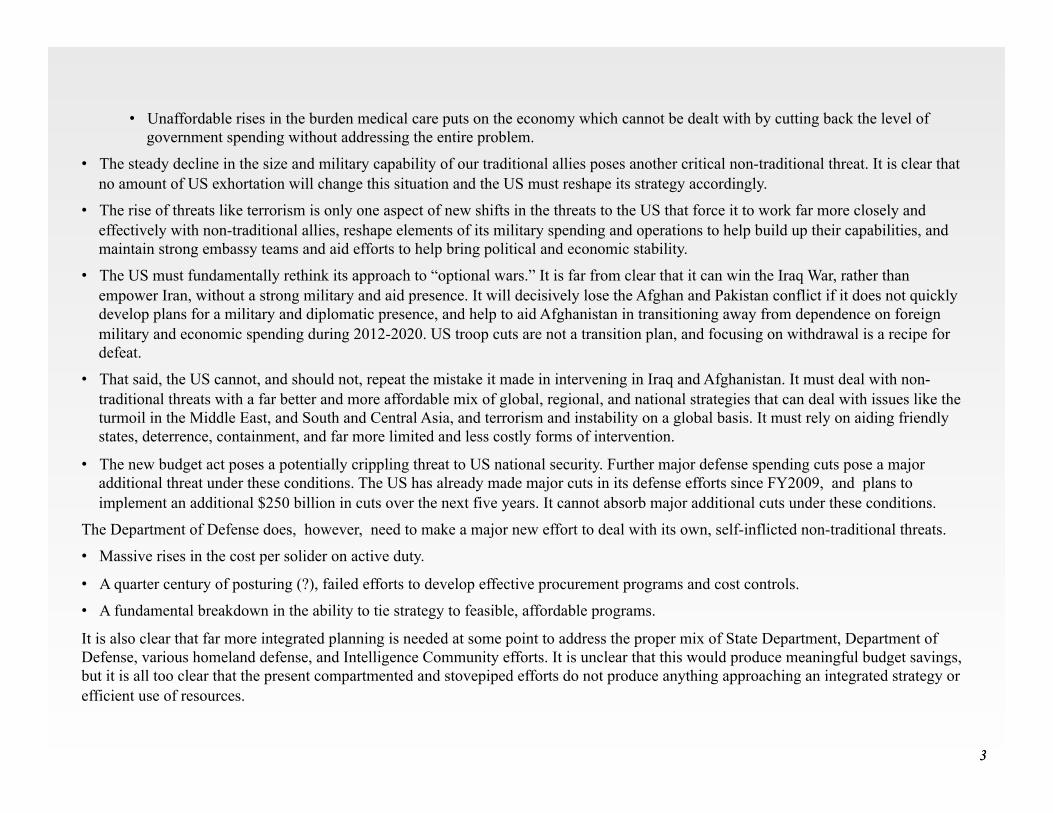
CBO Summary of New Budget Control Act of August 1, 2011
CBO, CBO’s Analysis of the Budget Control Act of August 1, 2011.. .
The bill has the following key provisions: • Establishes caps on discretionary spending through 2021, and effectively calls for $350
billion in cuts over coming 10 years (Same annual levels as Gates $400 billion in cuts over 12 years);
• War Funding, though, is explicitly exempted from caps/sequestration. • Allow for certain amounts of additional spending for “program integrity” initiatives aimed at reducing the amount of improper benefit payments; • Make changes to the Pell Grant and student loan programs; • Require that the House of Representatives and the Senate vote on a joint resolution proposing a balanced budget amendment to the Constitution; • Establish a procedure to increase the debt limit by $400 billion initially and procedures that would allow the limit to be raised further in two additional steps, for a cumulative increase of between $2.1 trillion and $2.4 trillion; • Reinstate and modify certain budget process rules; • Create a Congressional Joint Select Committee on Deficit Reduction to propose further deficit reduction, with a stated goal of achieving at least $1.5 trillion in budgetary savings over 10 years; and • Establish automatic procedures for reducing spending by as much as $1.2 trillion ($600 million of which must be in national security) if legislation originating with the new joint select committee does not achieve such savings.
If appropriations in the next 10 years are equal to the caps on discretionary spending and the maximum amount of funding is provided for the program integrity initiatives, CBO estimates that the legislation—apart from the provisions related to the joint select committee—would reduce budget deficits by $917 billion between 2012 and 2021. In addition, legislation originating with the joint select committee, or the automatic reductions in spending that would occur in the absence of such legislation, would reduce deficits by at least $1.2 trillion over the 10-year period. Therefore, the deficit reduction stemming from this legislation would total at least $2.1 trillion over the 2012-2021 period.

13 13
Budget Breakdown of Budget Control Act of August 1, 2011
CBO, CBO’s Analysis of the Budget Control Act of August 1, 2011. .
Table 1.Projected Savings from Discretionary Caps as Specified in the Budget Control Act of 2011, as Posted on the Web Site of the House Committee on Rules on August 1, 2011(By fiscal year, in billions of dollars)
Total,2012 2013 2014 2015 2016 2017 2018 2019 2020 2021 2012-2021
CBO's March 2011 Baseline BA 1,266 1,290 1,318 1,346 1,377 1,413 1,450 1,488 1,526 1,565 14,038OT 1,344 1,356 1,371 1,391 1,420 1,446 1,475 1,517 1,556 1,594 14,472
AdjustmentsExclude funding for operations in Afghanistan BA -161 -164 -167 -170 -173 -177 -180 -184 -188 -192 -1,756and Iraq and for similar activities OT -76 -131 -153 -163 -169 -172 -175 -180 -184 -187 -1,589
Incorporate final 2011 appropriations BA -17 -17 -18 -18 -18 -18 -19 -19 -19 -20 -183OT -2 -8 -11 -12 -13 -14 -15 -15 -16 -16 -122
Adjusted March 2011 Baseline BA 1,087 1,109 1,134 1,159 1,186 1,218 1,251 1,285 1,319 1,353 12,099OT 1,267 1,217 1,207 1,216 1,238 1,260 1,285 1,323 1,357 1,391 12,760
CBO's January 2011 Baseline Excluding Funding for BA 1,111 1,133 1,157 1,182 1,210 1,242 1,275 1,309 1,343 1,377 12,341Operations in Afghanistan and Iraq and for Similar Activities OT 1,275 1,230 1,224 1,233 1,257 1,280 1,306 1,344 1,378 1,412 12,939
Proposed Discretionary Caps on BA 1,043 1,047 1,066 1,086 1,107 1,131 1,156 1,182 1,208 1,234 11,260Budget Authoritya OT 1,241 1,170 1,148 1,149 1,164 1,179 1,196 1,226 1,252 1,278 12,004
Relative to the Adjusted March 2011 Baseline BA -44 -62 -68 -73 -79 -87 -95 -103 -111 -119 -840OT -25 -47 -59 -67 -74 -81 -89 -97 -104 -112 -756
Relative to the January 2011 Baseline Excluding Funding for BA -68 -86 -92 -97 -103 -111 -119 -127 -135 -144 -1,081Operations in Afghanistan and Iraq and for Similar Activities OT -33 -60 -76 -84 -93 -101 -110 -118 -126 -134 -935
SOURCE: Congressional Budget Office.
NOTES: The calculations above do not include any adjustments for program integrity initiatives. BA = budget authority; OT = outlays.
a. CBO calculated outlays for 2012 to 2021 by assuming an average aggregate spendout rate for all discretionary spending.
Projections of Discretionary Spending
Proposal
Effect of Proposed Discretionary Caps

14
CBO Estimates of Possible Defense
Reduction Paths
CBO, CBO’s Analysis of the Budget Control Act of August 1, 2011. .

15
Defer, Not Solve: Impact of August 2, 2011 Bill
Source: Center on Budget and Policy Priorities, Washington Post, August 4, 2011

16
Revenue: US Income Distribution Wealthy Get Wealthier
Source: CBO, Tends in the Distribution of Household Income Between 1979 and 2007, October 2011.
17
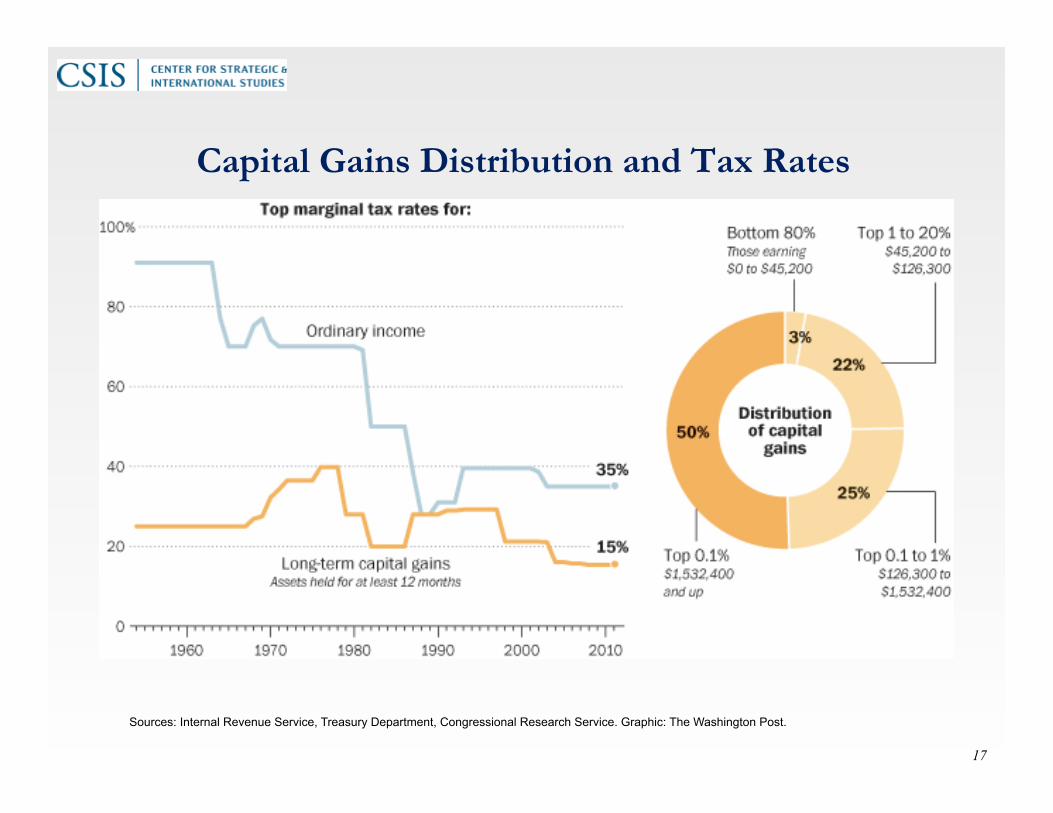
Capital Gains Distribution and Tax Rates
Sources: Internal Revenue Service, Treasury Department, Congressional Research Service. Graphic: The Washington Post.

18
Revenue: Some US Corporations Pay Little Tax
Source: Government Accountability Office, (2008)
19
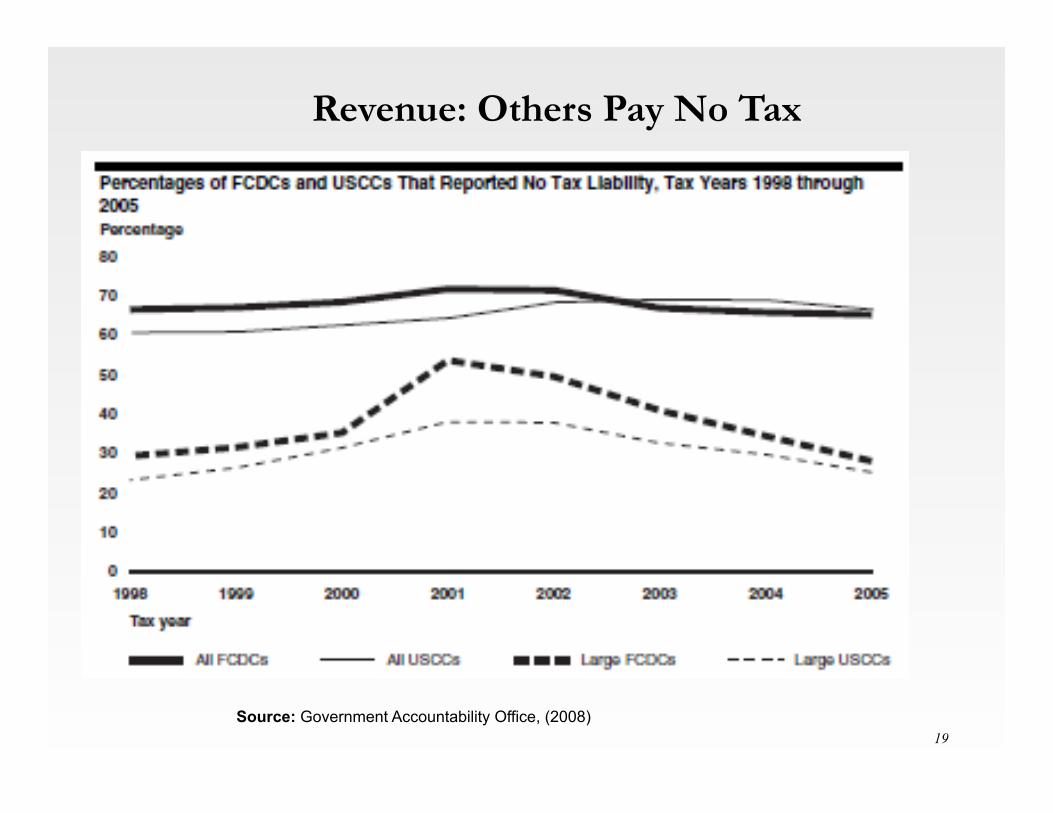
Revenue: Others Pay No Tax
Source: Government Accountability Office, (2008)

20
The Entitlements Threat to US Strategy

21 21
The Growing Entitlements-Revenue Gap
CBO, CBO’s 2011 Long-Term Budget Outlook, June 2011, p. 6. .
6 CBO’S 2011 LONG-TERM BUDGET OUTLOOK
CBO
Figure 1-1.
Primary Spending and Revenues, by Category, Under CBO’s Long-Term Budget Scenarios(Percentage of gross domestic product)
Source: Congressional Budget Office.
Notes: Primary spending refers to all spending other than interest payments on federal debt.
The extended-baseline scenario adheres closely to current law, following CBO’s 10-year baseline budget projections through 2021 and then extending the baseline concept for the rest of the long-term projection period. The alternative fiscal scenario incorporates several changes to current law that are widely expected to occur or that would modify some provisions that might be difficult to sustain for a long period. (For details, see Table 1-1 on page 4.)
CHIP = Children’s Health Insurance Program.
2000 2005 2010 2015 2020 2025 2030 2035
0
5
10
15
20
25
30
0
5
10
15
20
25
30
2000 2005 2010 2015 2020 2025 2030 2035
0
5
10
15
20
25
30
0
5
10
15
20
25
30Alternative Fiscal Scenario
Extended-Baseline Scenario
Social Security
Other Noninterest Spending
Revenues
Social Security
Medicare, Medicaid,CHIP, and Exchange Subsidies
Other Noninterest Spending
RevenuesTotal Primary Spending
Total Primary Spending
Medicare, Medicaid,CHIP, and Exchange Subsidies
Actual Projected
Actual Projected
22 22 22
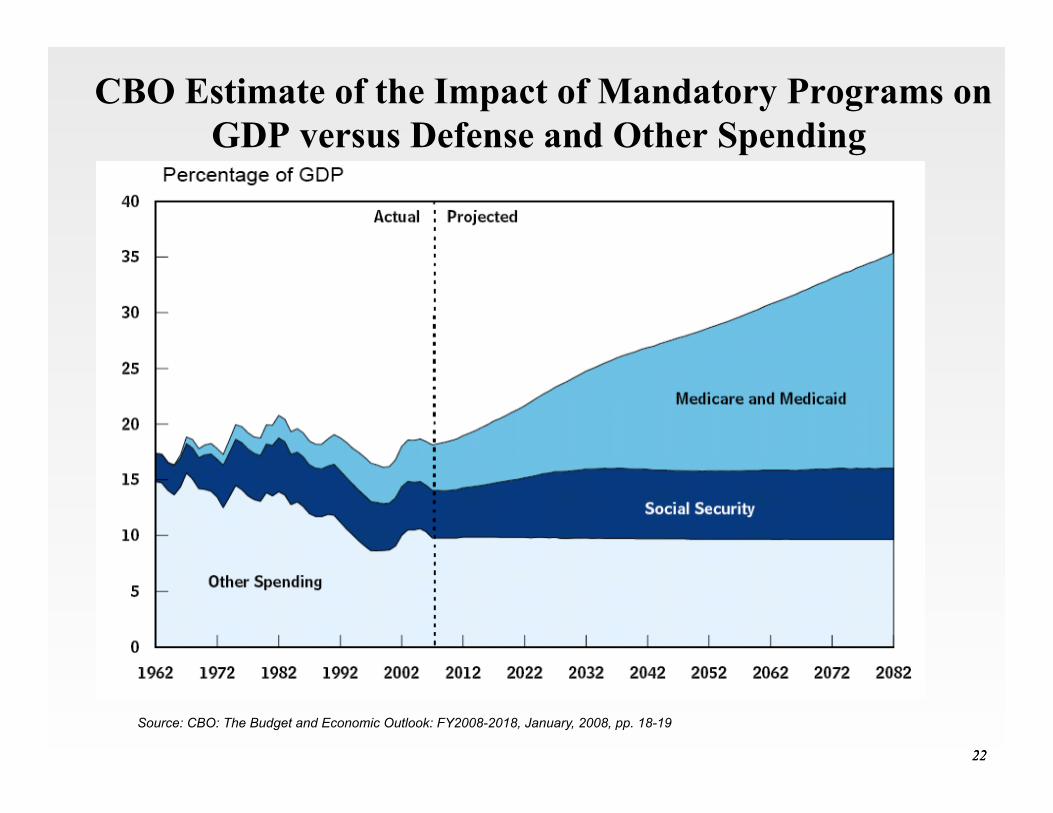
CBO Estimate of the Impact of Mandatory Programs on GDP versus Defense and Other Spending
Source: CBO: The Budget and Economic Outlook: FY2008-2018, January, 2008, pp. 18-19

23
National Defense as Percent of Total and Discretionary Federal Spending (Less
Interest Payments)
Source: US Budgets, and Project on Defense Alternatives, Memo #47, February 2011, p. 3
0
10
20
30
40
50
60
% of Total 18.9 21.4 21.3 18.7% of Discretionary Less Interest 50 53.4 55.6 55
1998-2002 2003-2006 2007-2011 2012-2016
23

24 24 24
CBO Estimate of Percentage Rise in the Cost of Mandatory Programs
CBO: The Budget and Economic Outlook: FY2008-2018, January, 2008, p XIII
25 25
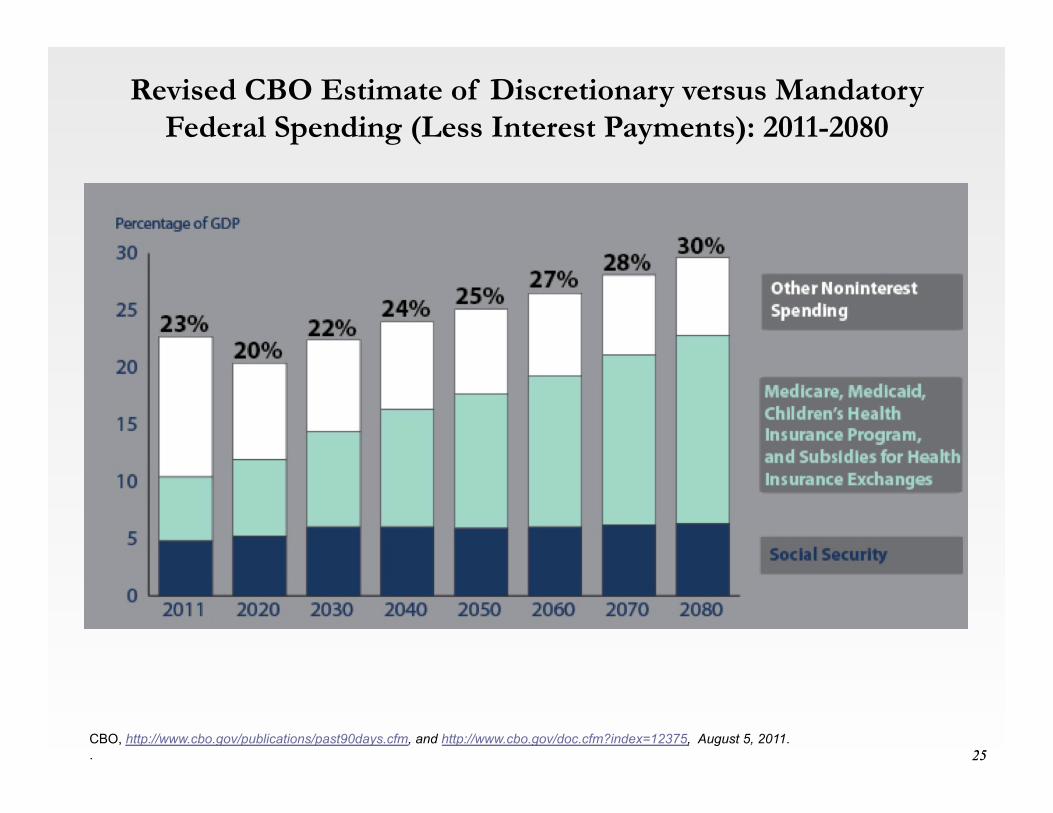
Revised CBO Estimate of Discretionary versus Mandatory
Federal Spending (Less Interest Payments): 2011-2080
CBO, http://www.cbo.gov/publications/past90days.cfm, and http://www.cbo.gov/doc.cfm?index=12375, August 5, 2011. .
26
The Defense Budget Cut Threat to US Strategy
27 27
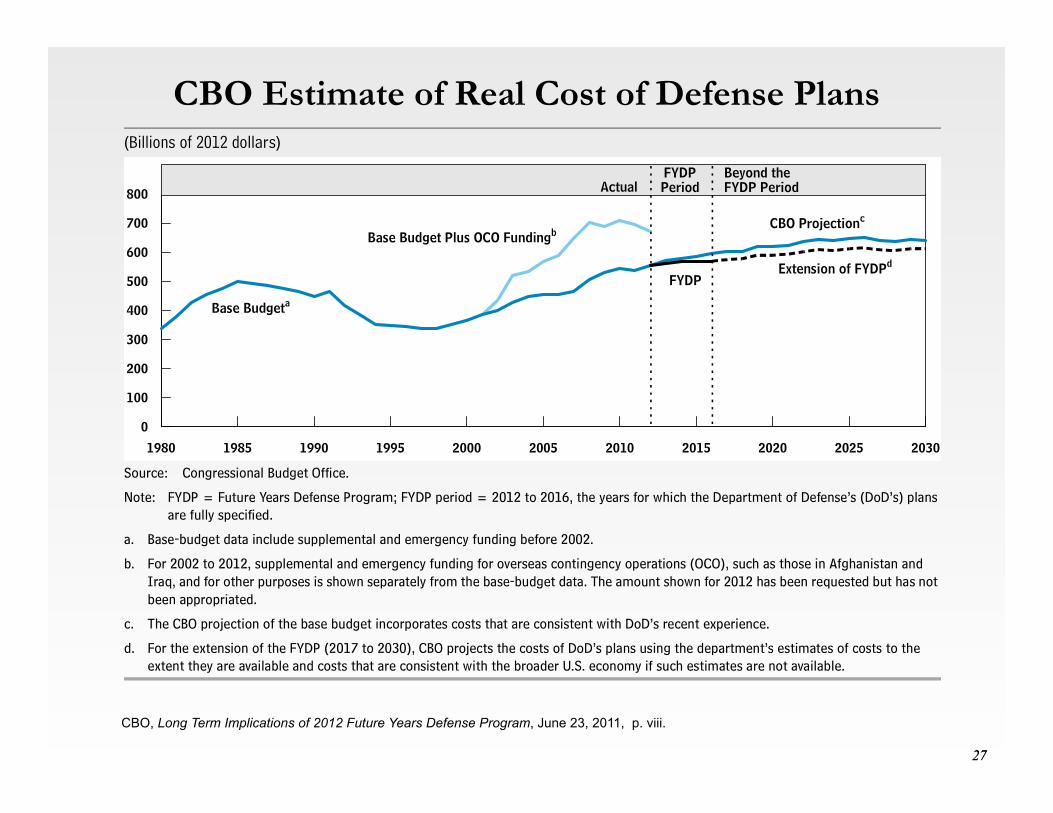
CBO Estimate of Real Cost of Defense Plans
CBO, Long Term Implications of 2012 Future Years Defense Program, June 23, 2011, p. viii.
VIII LONG-TERM IMPLICATIONS OF THE 2012 FUTURE YEARS DEFENSE PROGRAM
CBO
Summary Figure 1.
Costs of DoD’s Plans(Billions of 2012 dollars)
Source: Congressional Budget Office.
Note: FYDP = Future Years Defense Program; FYDP period = 2012 to 2016, the years for which the Department of Defense’s (DoD’s) plans are fully specified.
a. Base-budget data include supplemental and emergency funding before 2002.
b. For 2002 to 2012, supplemental and emergency funding for overseas contingency operations (OCO), such as those in Afghanistan and Iraq, and for other purposes is shown separately from the base-budget data. The amount shown for 2012 has been requested but has not been appropriated.
c. The CBO projection of the base budget incorporates costs that are consistent with DoD’s recent experience.
d. For the extension of the FYDP (2017 to 2030), CBO projects the costs of DoD’s plans using the department’s estimates of costs to the extent they are available and costs that are consistent with the broader U.S. economy if such estimates are not available.
Comparison with Projections Incorporating DoD’s EstimatesCBO compared its projection (referred to in this study as “the CBO projection”) with DoD’s estimate of the costs of the FYDP (for the 2012–2016 period) and with an “extension of the FYDP” (for the 2017–2030 period). The latter projection is based on DoD’s estimates of costs if they are available for years beyond 2016 (for some weapon systems, for instance) and on costs consistent with the broader U.S. economy if such estimates are not available (for pay and medical costs, for instance).
By DoD’s estimates, executing its plans for 2012 to 2016 would require real increases in funding of about 0.7 per-cent annually (excluding supplemental and emergency funding for overseas contingency operations). Over the
five-year period, that growth rate would result in costs that were $142 billion (or 5 percent) greater than the amount of DoD’s budget if it was held at the 2011 level.
In most cost categories, the CBO projection is higher than the FYDP and the extension of the FYDP. For instance, health care costs for DoD have grown faster than they have in the broader economy, and the costs of developing and buying weapons have historically been, on average, 20 percent to 30 percent higher than DoD’s initial estimates. The CBO projection—which, starting with 2013, includes estimates of those costs that reflect historical trends—indicates how rapidly defense budgets would have to grow to execute DoD’s plans under the assumption that the department’s costs continue to grow as they have in the past.
1980 1985 1990 1995 2000 2005 2010 2015 2020 2025 20300
100
200
300
400
500
600
700
800
Extension of FYDPd
Base Budgeta
Base Budget Plus OCO Fundingb
FYDP
CBO Projectionc
ActualFYDPPeriod
Beyond theFYDP Period

28 28
Key Terminations: FY2010-FY2012
OSD Comptroller, FY2012 Budget Request-Overview, February 2011, pp. 45-1 to 4-3
FY2010 • F-22 production • Transformational Satellite • Combat search and rescue helicopter. • VH-71 Presidential helicopter • Multiple Kill Vehicle and Kinetic energy Interceptor • Future Combat Systems Program
Proposed for FY2011 • C-77 procurement • Second Joint Strike Fighter engine • Large cruiser (CG(X) • Navy intelligence aircraft (EP(X)) • Third generation infrared surveillance (3GIRS)
Restructurings for FY2012 • Army’s surface-launched advanced medium range air to air missile
(SLAMRAAM) • Non line of sight launch system (NLOS-LS) • Expeditionary vehicle • Restructure F-35 program and increase F/A-18 procurement

29 29
Gates Savings Plan: FY2012-FY2016 1/2
OSD Comptroller, FY2012 Budget Request-Overview, February 2011, pp. 5-2 to 5-6
Secretary Gates proposed $178 billion in savings and changes. Military Services were allowed to keep their savings of $100 billion and invest them in high priority requirements. The other $78 billion used for deficit reduction to accommodate a topline reduction of $78 billion for FY 2012 – FY 2016.
$100 billion for shift to high priority requirements:
Army ($29.5 billion)
• Reduce infrastructure civilian and military manning ($1.1 billion). • Save on military construction costs by sustaining existing facilities ($1.5 billion).
• Consolidate e-mail infrastructure and data centers ($0.5 billion).
• Cancel procurement of SLAMRAAM ($1.0 billion). • Terminate Non-line of Sight Launch System ($3.2 billion).
• Reduce recruiting and retention incentives and other manning initiatives ($6.7 billion). Navy ($35.1 billion)
• Reduce ashore manpower, reassign personnel to operational ships & air units ($4.9 billion).
• Increase use of multiyear procurement contracts for ships and aircraft ($4.0 billion). • Disestablish Second Fleet headquarters; staffs for submarine, patrol aircraft, and destroyer squadrons;
and one carrier strike group staff ($1.0 billion). • Terminate Expeditionary Fighting Vehicle ($2.8 billion).
• Reduce fossil energy consumption ($2.3 billion).

30 30
Gates Savings Plan: FY2012-FY2016 2/2
OSD Comptroller, FY2012 Budget Request-Overview, February 2011, pp. 5-2 to 5-6
Air Force ($33.3 billion) • Reorganization ($4.2 billion), e.g., consolidate four operations and three numbered Air Force staffs, and
streamline the Installation Support Center. • Improve depot and supply chain business processes ($3.0 billion).
• Reduce fuel and energy consumption within the Air Force Mobility Command ($0.7 billion). • Reduce or terminate programs ($3.7 billion), e.g., terminate Air Force Infrared Search and Track Program.
• Reduce facility sustainment ($1.4 billion).
• Reduce cost of communications infrastructure by 25 percent ($1.3 billion). SOCOM ($2.3 billion)
• Terminate the Joint Multi-Mission Submersible program ($0.8 billion).
• Consolidate multiple task orders into a single Special Operations Forces Information Technology Contract ($0.4 billion).
• Reduce programs where Service-common equipment meets requirements ($0.2 billion).

31 31
Reallocation of $100 Billion: FY2012-FY2016 1/2
OSD Comptroller, FY2012 Budget Request-Overview, February 2011, pp. 5-2 to 5-6
Services will use $28 billion in savings to deal with higher than expected operating costs.
Army • Provide improved suicide prevention and substance abuse counseling for soldiers. • Modernize battle fleet of Abrams tanks, Bradley Fighting Vehicles, and Stryker vehicles. • Accelerate fielding of the Army’s new tactical communications network to the soldier level. • Enhance intelligence, surveillance, and reconnaissance (ISR) assets: Buy more MC-12
reconnaissance aircraft, accelerate procurement of the Army’s most advanced Grey Eagle UAS, and develop a new vertical unmanned air system.
Navy • Accelerate development of a new generation of electronic jammers. • Increase the repair and refurbishment of Marine equipment. • Allocate savings from Expeditionary Fighting Vehicle (EFV) termination to enhance Marine
ground combat vehicles. • Develop a new generation of sea-borne unmanned strike and surveillance aircraft. • Buy more of the latest model F-18s and extend the service life of 150 of these aircraft as a hedge
against more delays in the deployment of the Joint Strike Fighter. • • Purchase six additional ships – including a destroyer, a Littoral Combat Ship, an ocean
surveillance vessel, and three fleet oilers.

32 32
Reallocation of $100 Billion: FY2012-FY2016 2/2
OSD Comptroller, FY2012 Budget Request-Overview, February 2011, pp. 5-2 to 5-6
Air Force • Buy more of the advanced Reaper Unmanned Aerial Vehicles (UAVs). Going forward, advanced
unmanned strike and reconnaissance capabilities will become an integrated part of the Air Force’s regular institutional force structure.
• Increase procurement of the Evolved Expendable Launch Vehicle to assure access to space for both military and other government agencies while sustaining our industrial base.
• Modernize the radars of F-15s to keep this key fighter viable well into the future. • Buy more simulators for Joint Strike Fighter air crew training. • Initiate a program to develop and procure a new bomber that will be long-range, nuclear-
capable, and capable of penetrating hostile airspace. This aircraft will have the option of being piloted remotely. It will be developed using proven technologies, an approach that should make it possible to deliver this capability on schedule and in quantity.

33 33
$78 Billion in Actual Savings: FY2012-FY2016 1/2
OSD Comptroller, FY2012 Budget Request-Overview, February 2011, pp. 5-2 to 5-6
• Combined with a government-wide freeze on civilian salaries and other changes – should yield about $78 billion in savings over the next 5 years.
• Hold DoD civilian hiring at FY 2010 levels ($13 billion). A DoD-wide freeze on civilian workforce levels through FY 2013. Only limited exceptions – most notably, increases in the acquisition workforce in support of DoD’s ongoing acquisition improvement strategy.
• Civilian pay freeze ($12 billion). Following the President’s proposal, Congress has enacted a government-wide freeze on civilian salaries in CY 2011 – CY 2012.
• Defense Health Program ($8 billion). Our DoD leaders are proposing reforms in military health care to better manage medical cost growth and better align the Department with the rest of the country. These will include initiatives to become more efficient, as well as modest increases to TRICARE fees for working age retirees – with fees indexed to adjust for medical inflation. Details are in Chapter 3.
• Defense Agency/Office of the Secretary of Defense ($11 billion). Initiatives include reducing overhead, staffing, and expenses; more efficient contracting and acquisition; and more.
• Disestablish Joint Forces Command ($2 billion). • Disestablish Business Transformation Agency/reduce intelligence organizations ($0.6
billion).
34 34
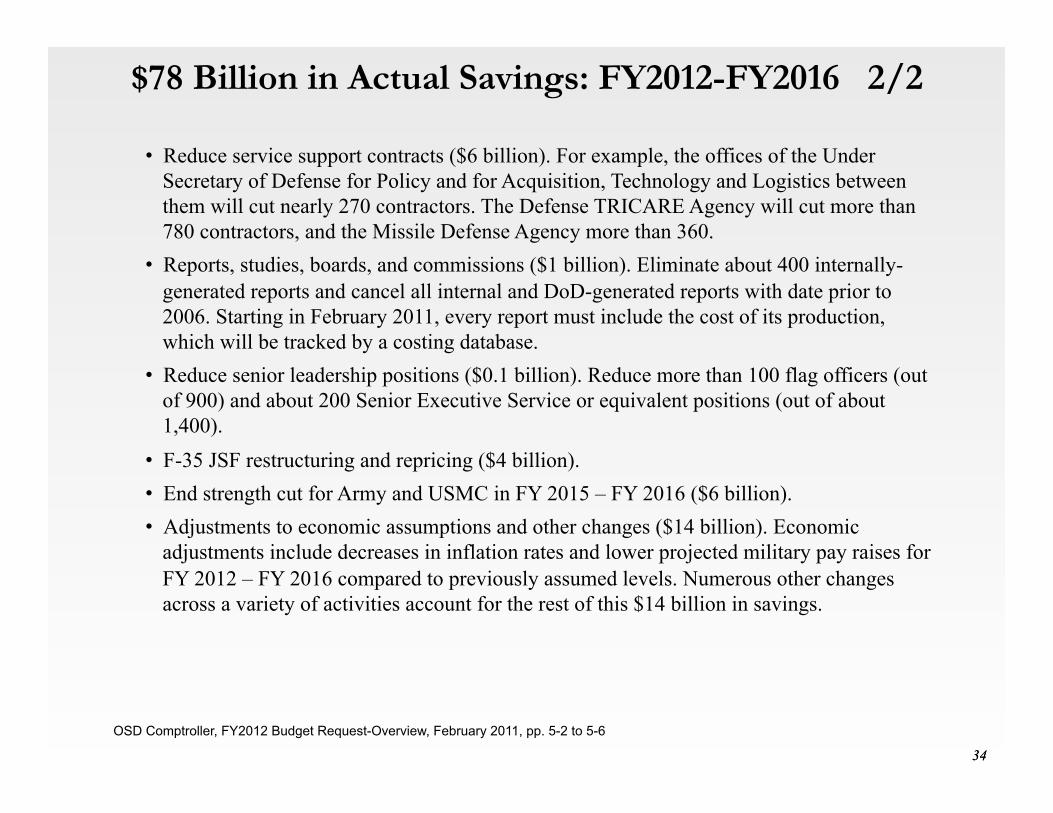
$78 Billion in Actual Savings: FY2012-FY2016 2/2
OSD Comptroller, FY2012 Budget Request-Overview, February 2011, pp. 5-2 to 5-6
• Reduce service support contracts ($6 billion). For example, the offices of the Under Secretary of Defense for Policy and for Acquisition, Technology and Logistics between them will cut nearly 270 contractors. The Defense TRICARE Agency will cut more than 780 contractors, and the Missile Defense Agency more than 360.
• Reports, studies, boards, and commissions ($1 billion). Eliminate about 400 internally- generated reports and cancel all internal and DoD-generated reports with date prior to 2006. Starting in February 2011, every report must include the cost of its production, which will be tracked by a costing database.
• Reduce senior leadership positions ($0.1 billion). Reduce more than 100 flag officers (out of 900) and about 200 Senior Executive Service or equivalent positions (out of about 1,400).
• F-35 JSF restructuring and repricing ($4 billion). • End strength cut for Army and USMC in FY 2015 – FY 2016 ($6 billion). • Adjustments to economic assumptions and other changes ($14 billion). Economic
adjustments include decreases in inflation rates and lower projected military pay raises for FY 2012 – FY 2016 compared to previously assumed levels. Numerous other changes across a variety of activities account for the rest of this $14 billion in savings.

35 35
$400 Billion More During FY2013-2023
Lawrence J. Korb, Laura Conley, Alex Rothman; Sensible Defense Cuts: How to Save $400 Billion Through 2015, CFPA, July 6, 2011
On April 2011, President Barack Obama proposes cutting $400 billion from the Pentagon’s budget through the 2023 fiscal year as part of his plan to reduce the nation’s long-term debt – increasing cuts beyond those sought by Defense Secretary Robert Gates in his February 2011 budget documents. No official statement on cuts emerges before Budget Act of August 1, 2011. Some fear will cripple defense. Others, like Center For New American Progress propose illustrative cuts: • Redirect DOD’s planned efficiency savings to reduce the baseline defense budget ($133 billion through 2015)
• Roll back post-September 11 efforts to grow the ground forces and reduce the number of civilian DOD personnel concomitant with the reduction in military end strength ($39.16 billion through 2015)
• Reduce active-duty troops in Europe and Asia by one-third ($42.5 billion through 2015)
• Cancel the V-22 Osprey program ($9.15 billion through 2015)
• Reform military health care ($42 billion through 2015)
• Limit procurement of the Virginia-class submarine and DDG-51 destroyer to one per year; limit procurement of the littoral combat ship to two vessels per year ($20.04 billion through 2015)
• Cut procurement of the Navy and Marine F-35 Joint Strike Fighter variants ($16.43 billion through 2015).
• Institute an across-the-board reduction in research, development, test, and evaluation funding ($40 billion though 2015)
• Reform the military pay system as the Quadrennial Review of Military Compensation recommends ($13.75 billion through 2015)
• Cancel procurement of the CVN-80 aircraft carrier and retire two existing carrier battle groups and associated air wings ($7.74 billion)
• consider retiring two of our existing carrier battle groups.
• Cut the U.S. nuclear arsenal to 311 operationally deployed strategic nuclear weapons ($33.72 billion)

36 36
Up to $600 Million More?
Automatic Trigger Impacts of August 1, 2011 Budget Act
CBO, CBO’s Analysis of the Budget Control Act of August 1, 2011.. .
The August 1, 2011 legislation effectively calls for $350 billion in cuts over a 10 year period; the same annual levels at the Gates $400 million reduction over 12 years. It also would establish a Congressional Joint Select Committee on Deficit Reduction charged with a goal of reducing the deficit by at least $1.5 trillion between 2012 and 2021. If, by January 15, 2012, enactment of legislation originating with the joint select committee does not achieve an estimated $1.2 trillion in deficit reduction (including an allowance for interest savings), the bill would require reductions in both discretionary and direct spending to make up for any shortfall in that targeted savings. The automatic reductions in spending would be spread evenly over the fiscal years 2013 through 2021; half ($600 billion) would come from defense spending and half from nondefense spending, including both discretionary and direct spending. The reductions would be implemented as follows: • The reductions in discretionary spending in 2013 would be accomplished by cutting the budgetary resources
available for defense and nondefense accounts by the respective percentages necessary to achieve the required reductions for that year.
• The reductions in discretionary spending in 2014 through 2021 would be accomplished by lowering the caps on discretionary budget authority for those years. For the purpose of lowering those caps, the bill would set separate caps on funding for defense and nondefense purposes.
• The reductions in direct spending would be implemented using the procedures specified in the Statutory Pay-As-You-Go (PAYGO) Act of 2010 (title I of P.L. 111-139). Under that act, budgetary resources available for programs subject to the automatic reductions, with the exception of Medicare, would be cut by a uniform percentage sufficient to achieve the total required outlay savings for a year. Many direct spending programs and activities would be exempt, however, including Social Security and other retirement programs, Medicaid, and certain other programs benefiting low-income people. The legislation would limit Medicare cuts to no more than 2 percent.

37 37
The Special Joint Committee
CBO, CBO’s Analysis of the Budget Control Act of August 1, 2011.. .
• The legislation passed on august 2, 2011 sets up a Special Joint Committee’s that must identify $1.5 trillion in additional deficit reductions by the end of 2011.
• If the Congress does not support its proposals, this would trigger automatic deficit reductions of $1.2 trillion to defense and non--‐defense programs, equally, by 2013.
• The Special Joint Committee must support address the cuts that should be made in our national security efforts by November 23, 2011 by a simple majority vote.
• The Congress as must complete up or down votes by December 23, 2011. • If the Special Joint Committee’s recommendations are not accepted, the bill would trigger
massive cuts that apply to a broad national security category that lumps together agency budgets for the Department of Defense, the Department of Homeland Security, the Department of Veterans Affairs, the National Nuclear Security Administration, the intelligence community management account (95–0401–0–1–054), and all budget accounts in budget function 150 (international affairs) without any need to review the different impact of such cuts or debate their impact.
• It also sets annual caps in budget authority on this security category of $546 billion if the Special Joint Committee’s recommendation are not passed into law or are vetoed, and requires OMB to enforce them.

38
The Deficit Sequestration Threat to US Strategy

39 39
The CBO Re-Estimate of the Challenge:
US Federal Revenues and Spending -- Excluding Interest
CBO, Statement of Douglas W. Elmendorf Director Confronting the Nation’s Fiscal Policy Challenges before the Joint Select Committee on Deficit Reduction U.S. Congress, September 13, 2011, p 35. . .
35CBO
Figure 8.
Revenues and Spending, Excluding Interest(Percentage of gross domestic product)
Source: Congressional Budget Office.
Note: Other major health care programs include Medicaid, the Children's Health Insurance Program, and exchanges subsidies and related spending.
budget policy in a fundamental way. To see this point most clearly, it is useful to con-sider the historical experience and CBO’s projections for three broad categories of the budget: revenues; spending for Social Security, Medicare, and other major health care programs; and all other spending excluding interest payments.
Federal Revenues. Revenues have averaged 18.0 percent of GDP during the past 40 years (see Figure 8). They have varied substantially around that level but show no clear trend. Under current law, revenues equal 15.3 percent of GDP in 2011 and will rise to about 21 percent of GDP in 2021; if, instead, all of the tax provisions that are scheduled to expire under current law were extended, revenues in 2021 would be close to their historical average of 18 percent.
Individual income tax receipts account for most of the projected increase in federal revenues over the coming decade, largely because of scheduled changes in tax law and features of the tax system that cause revenues to rise faster than income over time, as well as projected increases in receipts that reflect an expected rebound in taxable
1971 1976 1981 1986 1991 1996 2001 2006 2011 2016 20210
5
10
15
20
25
0
5
10
15
20
25Actual Projected
Revenues
All Other Spending(Excluding net interest)
Spending for Social Security,Medicare, and Other Major
Health Care Programs
40 40
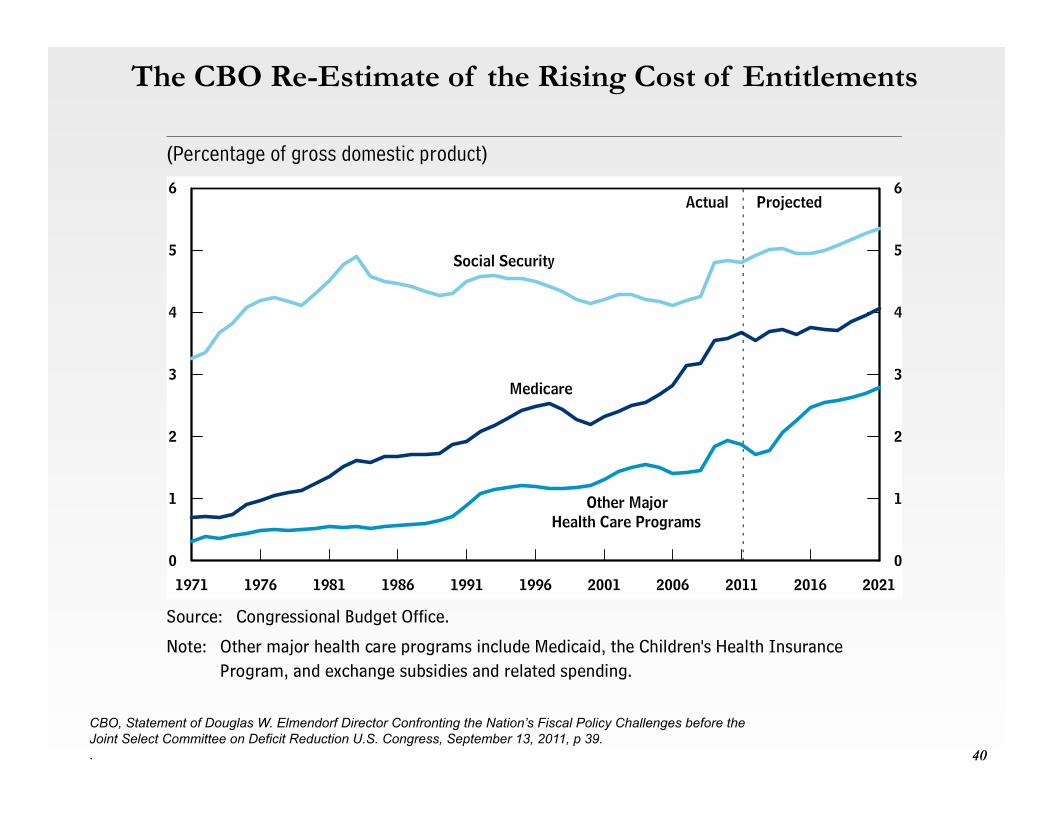
The CBO Re-Estimate of the Rising Cost of Entitlements
CBO, Statement of Douglas W. Elmendorf Director Confronting the Nation’s Fiscal Policy Challenges before the Joint Select Committee on Deficit Reduction U.S. Congress, September 13, 2011, p 39. . .
39CBO
Figure 12.
Spending for Social Security, Medicare, and Other Major Health Care Programs(Percentage of gross domestic product)
Source: Congressional Budget Office.
Note: Other major health care programs include Medicaid, the Children's Health Insurance Program, and exchange subsidies and related spending.
reaching 5.4 percent in 2021 (see Figure 12). Medicare spending (excluding offsetting receipts) is projected to grow even faster, relative to the overall economy, from 0.7 per-cent of GDP in 1971 to 3.7 percent in 2011 and 4.1 percent in 2021. CBO projects that spending for other major health care programs will rise from 1.7 percent of GDP in 2012 to 2.8 percent in 2021; by comparison, Medicaid spending represented 0.3 percent of GDP in 1971.
Most of the spending for Social Security and the major health care programs goes to benefits for people over age 65, with smaller shares for blind and disabled people and for nonelderly able-bodied people. Specifically, CBO estimates that more than four-fifths of Social Security spending in 2021 will go to benefits for retired workers and their dependents and survivors, with the remaining less than one-fifth going to bene-fits for disabled workers and their spouses and children. In addition, even with the significant expansion of federal support for health care for lower-income people enacted in last year’s legislation, CBO projects that about half of spending for the major health care programs in 2021 will go to people over age 65, with another quar-ter going to the blind and disabled, and the remaining quarter going to able-bodied nonelderly people.
1971 1976 1981 1986 1991 1996 2001 2006 2011 2016 20210
1
2
3
4
5
6
0
1
2
3
4
5
6Actual Projected
Social Security
Medicare
Other MajorHealth Care Programs

41 41
The Crisis in Defense Spending if Automatic Reductions Take Place
CBO, Estimated Impact of Automatic Budget Enforcement Procedures Specified in the Budget Control Act September 12, 2011, p 3. . .
Page 3CBO
Table 1.
Estimated Savings from Automatic Reductions If No Savings Result from Enacting Legislation Originated by the Joint Select Committee on Deficit Reduction(By fiscal year, in billions of dollars)
Source: Congressional Budget Office.
Notes: For enforcement purposes, section 302 of the Budget Control Act establishes a goal of $1.2 trillion in reductions and stipulates that 18 percent of that amount be considered reduced spending for debt service, with the remainder split equally between defense and nondefense spending. In this analysis, the $1.2 trillion goal is allocated as follows:
* = between -$500 million and zero. “Budget authority” refers to the authority provided by law to incur financial obligations, which eventually result in outlays.
a. These estimates reflect subsequent changes in spending for some programs that would offset estimated savings stemming from the original reductions.
b. “Debt service” refers to a change in interest payments from a change in projected deficits.
Total Goal for Reductions (Billions of dollars) -1,200Stipulated reduction for debt service -216Required reduction in defense budgetary resources -492Required reduction in nondefense budgetary resources -492
Total,2013-
2013 2014 2015 2016 2017 2018 2019 2020 2021 2021
Changes in Mandatory SpendingDefense
Budget authority * * * * * * * * * *Outlays * * * * * * * * * *
NondefenseBudget authority -16 -17 -18 -19 -19 -19 -20 -21 -22 -170Outlays -16 -17 -18 -19 -19 -19 -20 -21 -22 -170
TotalBudget authority -16 -17 -18 -19 -19 -19 -20 -21 -22 -171Outlays -16 -17 -18 -19 -19 -19 -20 -21 -22 -171
Changes in Discretionary SpendingDefense
Budget authority -55 -55 -55 -55 -55 -55 -55 -55 -55 -492Outlays -33 -46 -51 -53 -54 -54 -54 -54 -54 -454
NondefenseBudget authority -39 -38 -37 -36 -36 -35 -34 -33 -33 -322Outlays -21 -32 -35 -35 -36 -35 -34 -34 -33 -294
TotalBudget authority -94 -93 -92 -91 -90 -90 -89 -88 -87 -813Outlays -54 -78 -86 -88 -90 -89 -89 -88 -87 -749
Outlays Resulting from Sequestration of Mandatory Spendinga 2 3 3 4 3 3 4 4 5 31
Changes in Debt-Service Costsb -1 -2 -5 -10 -17 -23 -30 -37 -44 -169___ ___ ___ ___ ___ ___ ___ ___ ___ _____Total Impact on the Deficit -68 -94 -105 -114 -122 -129 -135 -142 -148 -1,057
Notes: For enforcement purposes, section 302 of the Budget Control Act establishes a goal of $1.2 trillion in reductions and stipulates that 18 percent of that amount be considered reduced spending for debt service, with the remainder split equally between defense and nondefense spending. In this analysis, the $1.2 trillion goal is allocated as follows: • Total Goal for Reductions (Billions
of dollars) -$1,200B
• Stipulated reduction for debt service -$216B
• Required reduction in defense budgetary resources -492B
• Required reduction in nondefense budgetary resources -$492B
• between -$500 million and zero.
* “Budget authority” refers to the authority provided by law to incur financial obligations, which eventually result in outlays. a. These estimates reflect subsequent changes in spending for some programs that would offset estimated savings stemming from the original reductions. b. “Debt service” refers to a change in interest payments from a change in projected deficits.

42 42
Impact on Total Defense Spending
CBO, Estimated Impact of Automatic Budget Enforcement Procedures Specified in the Budget Control Act September 12, 2011, pp. 7-9. . .
Notes: • = between zero and $500 million.
“Budget authority” refers to the authority provided by law to incur financial obligations, which eventually result in outlays.
For the purposes of this table, “defense” refers to all accounts in budget function 050, and “nondefense” refers to all other budget accounts. Limits on discretionary budget authority as specified in section 302 of the Budget Control Act. Sequestration cannot exceed 2 percent for payments made for individual services covered under Parts A and B of Medicare and for monthly contractual payments to Medicare Advantage plans and Part D plans. Accounts that are exempt from sequestration are listed in the Balanced Budget and Emergency Deficit Control Act of 1985; 2 U.S.C. 905, 906(d)(7).
Page 8CBO
Table 3.
CBO’s Estimates of Sequestration Amounts for Mandatory Spending and Reductions in Caps on Discretionary Budget Authority (By fiscal year, in billions of dollars)
Source: Congressional Budget Office.
Notes: This table excludes additional savings that would accrue from reductions in debt-service costs attributable to the reductions in mandatory and discretionary spending. Under the Budget Control Act, those debt-service savings are assumed to be 18 percent of the $1.2 trillion total goal. (“Debt service” refers to a change in interest payments from a change in projected deficits.)
* = between -$500 million and zero; n.a. = not applicable. “Budget authority” refers to the authority provided by law to incur financial obligations, which eventually result in outlays.
a. For the purposes of this table, “defense” refers to all accounts in budget function 050, and “nondefense” refers to all other budget accounts.
b. Because a portion of Medicare spending cannot be subject to a sequestration of more than 2 percent, the remaining amount of required reductions must be reallocated proportionally among other nonexempt mandatory programs and nondefense discretionary funding.
Total,2013-
2013 2014 2015 2016 2017 2018 2019 2020 2021 2021
Defensea
Mandatory sequestration * * * * * * * * * *Reduction in the cap on discretionary
budget authority -55 -55 -55 -55 -55 -55 -55 -55 -55 -492___ ___ ___ ___ ___ ___ ___ ___ ___ ____Total -55 -55 -55 -55 -55 -55 -55 -55 -55 -492
Nondefensea
Mandatory sequestrationMedicare spending subject to
2 percent limit -11 -11 -12 -13 -13 -14 -15 -16 -17 -123Other nonexempt programs -3 -3 -4 -4 -3 -3 -3 -3 -3 -30Additional sequestration applied to
other programs because of the2 percent limit for Medicareb -2 -2 -2 -2 -2 -2 -2 -2 -2 -17__ __ __ __ __ __ __ __ __ ___
Subtotal -16 -17 -18 -19 -19 -19 -20 -21 -22 -170
Reduction in the cap on discretionarybudget authority
Preliminary reductions -25 -24 -24 -23 -23 -23 -22 -21 -21 -206Further reductions because of the
2 percent limit for Medicare -14 -14 -13 -13 -13 -13 -12 -12 -12 -116___ ___ ___ ___ ___ ___ ___ ___ ___ ____Total -55 -55 -55 -55 -55 -55 -55 -55 -55 -492
Memorandum:Percentage Cut to Nonexempt Budget Accounts
Defense 10.0 9.8 9.7 9.5 9.3 9.1 8.9 8.7 8.5 n.a.Nondefense
Discretionary 7.8 7.4 7.1 6.8 6.6 6.4 6.1 5.8 5.5 n.a.Mandatory
Medicare spending subject to2 percent limit 2.0 2.0 2.0 2.0 2.0 2.0 2.0 2.0 2.0 n.a.
Other 7.8 7.4 7.1 6.8 6.6 6.4 6.1 5.8 5.5 n.a.
Page 7CBO
Table 2.
Projected Budgetary Resources Subject to Automatic Reductions(By fiscal year, in billions of dollars)
Source: Congressional Budget Office.
Note: * = between zero and $500 million. “Budget authority” refers to the authority provided by law to incur financial obligations, which eventually result in outlays.
a. For the purposes of this table, “defense” refers to all accounts in budget function 050, and “nondefense” refers to all other budget accounts.
b. Limits on discretionary budget authority as specified in section 302 of the Budget Control Act.
c. Sequestration cannot exceed 2 percent for payments made for individual services covered under Parts A and B of Medicare and for monthly contractual payments to Medicare Advantage plans and Part D plans.
d. Accounts that are exempt from sequestration are listed in the Balanced Budget and Emergency Deficit Control Act of 1985; 2 U.S.C. 905, 906(d)(7).
resources would be triggered that would total $984 billion over the 2013–2021 period (excluding effects on debt service)—$492 billion from defense programs and $492 billion from nondefense programs (see Table 3). In estimating the allocations of those savings among different categories of spending and the percentage reductions that would be required, CBO based its calculations on its most recent baseline budget projections, which incorporate the assumptions that programs will operate as speci-fied in current law and that future discretionary appropriations will adhere to the caps in the Budget Control Act.11
11. For details about CBO’s baseline projections, see Congressional Budget Office, The Budget and Economic Outlook: An Update (August 2011), Chapter 1.
Total,2013-
2013 2014 2015 2016 2017 2018 2019 2020 2021 2021
Defensea
Mandatory outlays subject to sequestration * * * * * * * * * 2Limit on discretionary budget authorityb 546 556 566 577 590 603 616 630 644 5,328____ ____ ____ ____ ____ ____ ____ ____ ____ _____
Total 546 556 566 577 590 603 616 630 644 5,330
Nondefensea
Mandatory outlays subject to sequestrationPortion of Medicare spending subject to
2 percent limitc 542 571 598 644 671 700 756 806 860 6,148All other nonexempt mandatory spendingd 63 71 80 83 82 83 85 88 90 725___ ___ ___ ___ ___ ___ ___ ___ ___ _____
Subtotal 606 642 678 727 753 783 841 894 950 6,874
Limit on discretionary budget authorityb 501 510 520 530 541 553 566 578 590 4,889_____ _____ _____ _____ _____ _____ _____ _____ _____ ______Total 1,107 1,152 1,198 1,257 1,294 1,336 1,407 1,472 1,540 11,763
If none of the specified savings of $1.2 trillion was obtained through legislation originating with the deficit reduction committee, the automatic procedures would reduce budgetary resources for national defense (budget function 050) by about $55 billion a year between 2013 and 2021. Such annual reductions would be split proportionally between mandatory and discretionary defense spending. Because mandatory spending makes up less than 1 percent of all defense spending, however, CBO estimates that only about $150 million would be sequestered from mandatory defense programs over the 2013–2021 period. Consequently, almost all of the required deficit reduction in the defense category would have to be achieved by lowering the caps on future discretionary appropriations for defense activities. (Under the Budget Control Act, the discretionary caps would not constrain spending that is designated by the Congress for overseas contingency operations, such as war-related efforts in Afghanistan or Iraq). The estimated reduction in defense funding from those automatic cuts would require the cap on new defense appropriations in 2013 to be lowered by 10.0 percent). The percentage reductions in the caps for later years would be successively smaller, amounting to 8.5 percent in 2021.

43 43
The Resulting Deficit
CBO, The Budget and Economic Outlook: An Update, August 2001. Pg. 12 . .

44 44
The Resulting Debt
CBO, Statement of Douglas W. Elmendorf Director Confronting the Nation’s Fiscal Policy Challenges before the Joint Select Committee on Deficit Reduction U.S. Congress, September 13, 2011, p. 209 . .
20CBO
Figure 6.
Federal Debt Held by the Public(Percentage of gross domestic product)
Source: Congressional Budget Office.
Note: The projected debt with the continuation of certain policies is based on several assumptions: first, that most of the provisions of the Tax Relief, Unemployment Insurance Reauthorization, and Job Creation Act of 2010 (Public Law 111-312) that originally were enacted in 2001, 2003, 2009, and 2010 do not expire on December 31, 2012, but instead continue; second, that the alternative minimum tax is indexed for inflation after 2011; and third, that Medicare’s payment rates for physicians are held constant at their 2011 level.
significant and increasing pressure on the budget. The number of people age 65 or older will increase by roughly one-third between 2011 and 2021, causing that seg-ment of the U.S. population to climb from 13 percent to 17 percent of the total; beyond 2021, that share will rise further. In addition, the major health care legislation enacted in 2010 will increase the number of beneficiaries of federal health care pro-grams, and CBO projects that the costs of those programs per beneficiary will con-tinue rising (albeit at different rates because of differences in the laws that govern them). All told, outlays for Social Security, Medicare, and Medicaid—which will account for 44 percent of all federal noninterest spending in 2011—will continue to rise relative to GDP and to consume a growing share of the federal budget.
The Budget Control Act of 2011CBO’s current baseline projections show smaller deficits than the agency estimated earlier this year primarily because of the enactment of the Budget Control Act of 2011.12 Provisions in that act:
12. Those earlier projections are shown in Congressional Budget Office, An Analysis of the President’s Budgetary Proposals for Fiscal Year 2012 (April 2011). For an analysis of the Budget Control Act of 2011, see Congressional Budget Office, letter to the Honorable John A. Boehner and the Honor-able Harry Reid estimating the impact on the deficit of the Budget Control Act of 2011 (August 1, 2011). The estimates discussed here do not include the effect of initiatives in the Budget Control Act to enhance “program integrity,” which depend on future appropriations and will be incorpo-rated into CBO’s baseline if they are implemented in the future.
1971 1981 1991 2001 2011 20210
10
20
30
40
50
60
70
80
90
0
10
20
30
40
50
60
70
80
90Actual Projected
CBO'sBaseline
Continuationof CertainPolicies
45
The Optional War Cost Threat to US Strategy

46 46
CBO Breakdown of Post War Baseline Costs
CBO, Long Term Implications of 2012 Future Years Defense Program, June 23, 2011, p. 5 and July 7, 2011.
CHAPTER ONE LONG-TERM IMPLICATIONS OF THE 2012 FUTURE YEARS DEFENSE PROGRAM 5
CBO
Figure 1-1.
Costs of DoD’s Plans, by Appropriation Category(Billions of 2012 dollars)
Source: Congressional Budget Office.
Notes: Base-budget data include supplemental and emergency funding before 2002.
FYDP = Future Years Defense Program; FYDP period = 2012 to 2016, the years for which Department of Defense’s (DoD’s) plans are fully specified.
a. For 2002 to 2012, supplemental and emergency funding for overseas contingency operations (OCO), such as those in Afghanistan and Iraq, and for other purposes is shown separately from the base-budget data. The amount shown for 2012 has been requested but has not been appropriated.
b. Each category shows the CBO projection of the base budget from 2012 to 2030. That projection incorporates costs that are consistent with DoD’s recent experience.
c. For the extension of the FYDP (2017 to 2030), CBO projects the costs of DoD’s plans using the department’s estimates of costs to the extent they are available and costs that are consistent with the broader U.S. economy if such estimates are not available.
for civilian workers and of maintaining the aging equipment in the current inventory and the more sophisticated equipment that will replace today’s systems also contribute.
After barely growing during the FYDP period (because of planned reductions in the number of mili-tary personnel), the annual appropriation for military personnel would increase by about 1.4 percent per year from 2017 to 2030.
After a fairly rapid increase over the next six years, the costs of developing and purchasing new weapon systems (and upgrading older systems) under DoD’s current plans would be fairly steady from 2017 to 2030—albeit with annual variations—at a level that is about 13 percent higher than that in 2011. Beyond 2030, acquisition costs could rise again depending on the decisions that are made about how to equip forces in the distant future.
1980 1985 1990 1995 2000 2005 2010 2015 2020 2025 20300
100
200
300
400
500
600
700
800 ActualFYDPPeriod
Beyond theFYDP Period
Extension of FYDPc
FYDP
Operation and Maintenance
Military Personnel
Procurement
Research, Development, Test, and Evaluation
MilitaryConstructionFamily Housing
Operation andSupport
Acquisition
Infrastructure
OCO FundingaCBO Projectionb

47
FY01 FY02 FY03 FY04 FY05 FY06 FY07 FY08 FY09 FY10 FY11 Other 14 6 23 5 11 13 15 13 14 5 6 Afghanistan 0 12 14 15 10 14 32 33 49 97 110 Iraq 0 0 54 92 57 91 123 140 93 61 44
0
20
40
60
80
100
120
140
160
180
200 Total Cost of Wars through FY2011: Afghanistan: $386 Iraq: $755 Other: $125 Total: $1,266
US Cost of Wars (2001-2011): CBO (In $US billions)
Source: Congressional Budget Office

48
FY01 & 02 FY03 FY04 FY05 FY06 FY07 FY08 FY09 FY10 FY11 FY12
Req Other 13 13.5 3.7 2.1 0.8 0.5 0.1 0.1 0.1 0.1 0.1 Afghanistan 20.8 14.7 14.6 20 19 39.2 43.4 59.5 93.8 118.6 113.7 Iraq 0 53 75.9 85.6 101.7 131.3 142.1 95.5 71.3 49.3 17.7
0
20
40
60
80
100
120
140
160
180
200 Total Cost of Wars through FY2011: Afghanistan: $557.3 Iraq: $823.4 Other: $34.1 Total: $1,414.8
US Cost of Wars (2001-2012): CRS
Source: Congressional Research Service
49
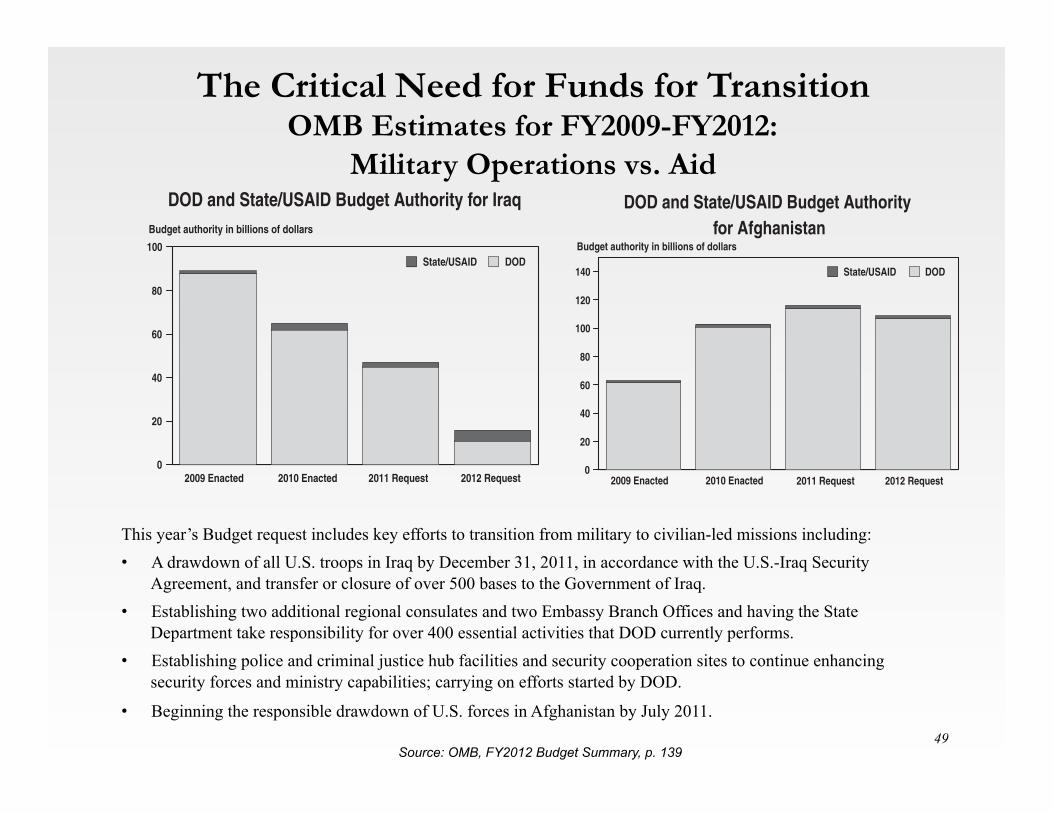
The Critical Need for Funds for Transition OMB Estimates for FY2009-FY2012:
Military Operations vs. Aid
Source: OMB, FY2012 Budget Summary, p. 139
THE BUDGET FOR FISCAL YEAR 2012 139
DOD and State/USAID Budget Authority for Iraq
2009 Enacted 2010 Enacted 2011 Request 2012 Request0
20
40
60
80
100State/USAID DOD
Budget authority in billions of dollars
DOD and State/USAID Budget Authority for Afghanistan
2009 Enacted 2010 Enacted 2011 Request 2012 Request0
20
40
60
80
100
120
140 State/USAID DOD
Budget authority in billions of dollars
This year’s Budget request includes key efforts to transition from military to civilian-led missions including: • A drawdown of all U.S. troops in Iraq by December 31, 2011, in accordance with the U.S.-Iraq Security
Agreement, and transfer or closure of over 500 bases to the Government of Iraq. • Establishing two additional regional consulates and two Embassy Branch Offices and having the State
Department take responsibility for over 400 essential activities that DOD currently performs. • Establishing police and criminal justice hub facilities and security cooperation sites to continue enhancing
security forces and ministry capabilities; carrying on efforts started by DOD.
• Beginning the responsible drawdown of U.S. forces in Afghanistan by July 2011.

50 50
No Money for the Future? DoD Topline Budget: FY2001-FY2016
Notes: ●FY 2012 –FY 2016 reflects levels included in the President’s FY 2012 Budget Request; FY 2009 Non-War Supplemental was appropriated through the American Recovery and Reinvestment Act of 2009 ●FY 2011 reflects the addition of the annualized 2011 Continuing Resolution and an adjustment to the Presidents FY2012 Budget Request Source: Department of Defense Appropriation Acts FY 2001 –FY 2010, FY2011 Continuing Resolution, FY 2011-FY2012 President’s Budget documents, and B02-11-101 v 2.2FY 2012 Budget, p. 22
Baseline Real Growth

51 51
Cutting War Estimates to Create False Top Line? Project on Defense Alternatives: FY2001-FY2016
PROJECT ON DEFENSE ALTERNATIVES, MEMO #47, FEB 2011 – Section 1 1
Past and Future Change in US National Defense Spending & Budget Share
President Obama’s 2012 budget plan maps out a future of steady increases for the National Defense account apart from war costs (which are presumedto decline). As shown in Figure 1-1, National defense sans war is set to rise from $551.9 billion in 2010 to $627.6 billion in 2016 – a boost of about15.5%. This increase exceeds the expected rate of inflation for the period by about seven-tenths of one percent annually. Although small by recentstandards, the increase is not insignificant in the context of deficit-reduction efforts.
The 2012-2016 plan indicates a reduction in war expenditures that seems quite dramatic, but this is an accounting artifact. The plan treats war costsas unsettled and uncertain for the years after 2012. Thus, it uses a “place-keeper” sum of $50 billion per year for the period 2013-2016. This is neithera goal nor a forecast, but instead an effort to lessen the planning distortion caused by uncertainty. Actual war expenditures are likely to exceed $50billion per year – perhaps by a very substantial margin for 2013 and 2014. The low “place keeper” figure for Overseas Contingency Operations after2012 also lends to the impression that overall defense spending will decline by 3.7% over the course of the plan.
Figure 1-1. Planned National Defense Spending and Budget Share, 2010-2016(dollars current billions)
2010 2012 2013 2014 2015 2016 % Change2010 > 2016
National Defense Discretionary (050) w/o OCO 551.9 578.4 595.9 612.1 624.5 637.6 15.5%
Overseas Contingency Operations (OCO) 162.3 117.6 50 50 50 50 -69.2%
National Defense (050) Discretionary 714.2 696 645.9 662.1 674.5 687.6 -3.7%
Non-defense Discretionary Spending 543.4 546.7 542.2 546 553.1 566.4 4%
Total Discretionary Spending 1257.6 1242.7 1188.1 1208.1 1227.6 1254 -0.3%
Total Discretionary Spending w/o OCO 1095.3 1125.1 1138.1 1158.1 1177.6 1204 9.9%
National Defense w/o OCO as % of Discretionary Spending w/o OCO
50.4% 51.4 52.4 52.9 53 53
Sources: Budget of the US Government, Fiscal Years 2012; Undersecretary of Defense (Comptroller), Fiscal Year 2012 Budget Request.

52 52
CBO Estimate of Defense as Percent of GDP Without Wars
CBO, Long Term Implications of 2012 Future Years Defense Program, June 23, 2011, p. 7.
8 LONG-TERM IMPLICATIONS OF THE 2012 FUTURE YEARS DEFENSE PROGRAM
CBO
Figure 1-3.
Costs of DoD’s Plans as a Share of Economic Output(Percentage of gross domestic product)
Source: Congressional Budget Office.
Note: FYDP = Future Years Defense Program; FYDP period = 2012 to 2016, the years for which the Department of Defense’s (DoD’s) plans are fully specified.
a. Base-budget data include supplemental and emergency funding before 2002.
b. For 2002 to 2012, supplemental and emergency funding for overseas contingency operations (OCO), such as those in Afghanistan and Iraq, and for other purposes is shown separately from the base-budget data. The amount shown for 2012 has been requested but has not been appropriated.
c. The CBO projection of the base budget incorporates costs that are consistent with DoD’s recent experience.
d. For the extension of the FYDP (2017 to 2030), CBO projects the costs of DoD’s plans using the department’s estimates of costs to the extent they are available and costs that are consistent with the broader U.S. economy if such estimates are not available.
year, the FYDP does not include estimates of the funding that might be needed to support overseas contingency operations beyond 2012. Moreover, DoD could ask for more funding for 2012 than it has already requested.
The funding needed in the future for overseas contin-gency operations will depend on how political and military conditions evolve in the coming years. As an illustrative example, if today’s contingency force was drawn down to 45,000 troops by 2015 and was then maintained at that number through 2030, contingency operations would add a total of $200 billion to the base budget from 2013 to 2016 and an average of $30 billion per year thereafter, CBO estimates (see Figure 1-4).5 That number of troops would be significantly lower than the
number deployed in 2011 but about three to four times the average number deployed between 1991 and 2001.6
1980 1985 1990 1995 2000 2005 2010 2015 2020 2025 20300
1
2
3
4
5
6
7
8 ActualFYDPPeriod
Beyond theFYDP Period
Extension of FYDPdBase Budgeta
Base Budget Plus OCO Fundingb
CBO Projectionc
FYDP
5. That scenario for contingency operations is the same as one of the policy alternatives presented in Congressional Budget Office, The Budget and Economic Outlook: Fiscal Years 2011 to 2021 (January 2011), Table 3-9. The force levels referred to exclude U.S. military personnel who are permanently based overseas (in locations such as South Korea or Okinawa, Japan) but are not engaged in contingency operations. That scenario is not inconsistent with the President’s announced plans for drawing down U.S. forces in Afghanistan.
6. At the end of calendar year 2010, DoD reported 85,600 military personnel deployed in and around Afghanistan and 103,700 per-sonnel deployed in and around Iraq. See Department of Defense, Active Duty Military Personnel Strengths by Regional Area and by Country (309A), http://siadapp.dmdc.osd.mil/personnel/MILITARY/history/hst1012.pdf (December 31, 2010).

53 53
CBO Estimate of Defense Costs With Wars
CBO, Long Term Implications of 2012 Future Years Defense Program, June 23, 2011, p. 9.
CHAPTER ONE LONG-TERM IMPLICATIONS OF THE 2012 FUTURE YEARS DEFENSE PROGRAM 9
CBO
Figure 1-4.
Costs of DoD’s Plans Including Overseas Contingency Operations(Billions of 2012 dollars)
Source: Congressional Budget Office.
Note: FYDP = Future Years Defense Program; FYDP period = 2012 to 2016, the years for which the Department of Defense’s (DoD’s) plans are fully specified.
a. Base-budget data include supplemental and emergency funding before 2002.
b. For 2002 to 2012, supplemental and emergency funding for overseas contingency operations (OCO), such as those in Afghanistan and Iraq, and for other purposes is shown separately from the base-budget data. The amount shown for 2012 has been requested but has not been appropriated.
The base budget plus OCO funding includes actual funding for the base budget plus supplemental and emergency funding for 2002 to 2011 (the solid portion of the line). For 2012 to 2030 (the dashed portion of the line), it includes CBO’s projection of base-budget costs plus the OCO funding requested for 2012 and an illustrative example of OCO funding for 2013 to 2030 (under an assumption that the number of deployed troops decreases to 45,000 by 2015 and remains at that level thereafter).
c. The CBO projection of the base budget incorporates costs that are consistent with DoD’s recent experience.
1980 1985 1990 1995 2000 2005 2010 2015 2020 2025 20300
100
200
300
400
500
600
700
800
900 ActualFYDPPeriod
Beyond theFYDP Period
Base Budgeta
Base Budget Plus OCO Fundingb
CBO Projectionc
CBO Projection withIllustrative OCO Funding

54
The Rising Cost Per Soldier Threat US Strategy

55 55
CBO Estimate of Personnel and O&M Cost Pressures
CBO, Long Term Implications of 2012 Future Years Defense Program, June 23, 2011, p. 7.
CHAPTER ONE LONG-TERM IMPLICATIONS OF THE 2012 FUTURE YEARS DEFENSE PROGRAM 7
CBO
Figure 1-2.
CBO Projection of Base-Budget Costs of DoD’s Plans, by Type of Spending(Billions of 2012 dollars)
Source: Congressional Budget Office.
Notes: Base-budget data include supplemental and emergency funding before 2002.
FYDP = Future Years Defense Program; FYDP period = 2012 to 2016, the years for which the Department of Defense’s (DoD’s) plans are fully specified.
defense constant at some fraction of GDP. Many such plans envision an immediate increase in defense spend-ing, generally followed by higher rates of growth for the defense budget in the future than those reflected in the FYDP (because most projections of GDP growth are higher than the growth in DoD’s budget anticipated in the FYDP).4
Another way to examine the costs of DoD’s plans is to compare them with CBO’s baseline, which shows what appropriations and spending would be if appropriations in future years were equal to the 2011 funding adjusted to reflect anticipated inflation and growth in the cost of
labor (as measured by the employment cost index, the Bureau of Labor Statistics’ index for wages and salaries in the private sector). The CBO projection of DoD’s plans is $437 billion (or 8 percent) above CBO’s baseline (in 2012 dollars, adjusted for the 2011 appropriations and excluding overseas contingency operations) over the 2012–2021 period (see the appendix).
Costs for Overseas Contingency OperationsOperations in Afghanistan and Iraq are continuing, and those overseas operations, along with any others, will increase costs above CBO’s projections for DoD’s base budget. From 2002 to 2011, DoD’s appropriations for overseas contingency operations totaled $1.3 trillion (in 2012 dollars), an average of about $132 billion per year, or about 22 percent of the department’s total spending. Although DoD has requested $118 billion for those pur-poses for 2012 and the operations will continue after this
1980 1985 1990 1995 2000 2005 2010 2015 2020 2025 2030
0
50
100
150
200
250
300
Operation and Maintenance
Military Personnel
Procurement
Research, Development, Test, and Evaluation
MilitaryConstruction
FamilyHousing
ActualFYDPPeriod
Beyond theFYDP Period
4. For representative examples of such plans, see Mackenzie Eaglen, ed., Four Percent for Freedom: The Need to Invest More in Defense—Selected Writings, Special Report 18 (Washington, D.C.: Heritage Foundation, September 25, 2007).

56 56
CBO Breakdown of O&M Cost Per Active-Duty Service Member
CBO, Long Term Implications of 2012 Future Years Defense Program, June 23, 2011, p. 15.
CHAPTER TWO LONG-TERM IMPLICATIONS OF THE 2012 FUTURE YEARS DEFENSE PROGRAM 15
CBO
accrual payments to the Military Retirement Fund, calcu-lated to provide a balance in the fund that is adequate to pay retirement benefits in the future to personnel who are currently service members. (Health care benefits available to service members and their families through the mili-tary medical system are considered separately in the next section.)
The Administration’s 2012 budget request includes $201 billion in O&S funding for pay and cash benefits for DoD’s military personnel and most of its civilian employees (see Table 2-1 on page 13).2 About $143 billion of that total is in the military personnel appropriation to support DoD’s approximately
1.4 million active-duty service members (plus reserve and National Guard members as necessary), and an additional $58 billion is in the O&M appropriation to compensate most of the department’s 784,000 full-time-equivalent civilian workers. According to the CBO projection of
Box 2-1. Continued
The Context for the Projected Growth of Spending for Operation and Maintenance
Costs of Operation and Maintenance per Active-Duty Service Member
(Thousands of 2012 dollars)
Source: Congressional Budget Office.
Note: FYDP = Future Years Defense Program; FYDP period = 2012 to 2016, the years for which the Department of Defense’s (DoD’s) plans are fully specified.
a. Base-budget data include supplemental and emergency funding before 2002.
b. For 2002 to 2012, supplemental and emergency funding for overseas contingency operations (OCO), such as those in Afghanistan and Iraq, and for other purposes is shown separately from the base-budget data. The amount shown for 2012 has been requested but has not been appropriated.
c. The CBO projection of the base budget incorporates costs that are consistent with DoD’s recent experience.
d. For the extension of the FYDP (2017 to 2030), CBO projects the costs of DoD’s plans using the department’s estimates of costs to the extent they are available and costs that are consistent with the broader U.S. economy if such estimates are not available.
1980 1985 1990 1995 2000 2005 2010 2015 2020 2025 20300
50
100
150
200
250
300
Trend Estimated from1980 to 2001
Base Budget Plus OCO Fundingb
2009 FYDP and Extension
CBO Projectionc
ActualFYDPPeriod
Beyond theFYDP Period
2012 FYDP andExtensiond
Base Budgeta
2. Compensation for some civilian employees—about $12 billion in 2012—is paid from other appropriations. For instance, some civilians in military laboratories are paid from the appropriation for research, development, test, and evaluation, and some civilians are paid from the appropriation for procurement. See the “Green Book,” namely, Department of Defense, National Defense Budget Estimates for FY 2012, http://comptroller.defense.gov/defbudget/fy2012/FY12_Green_Book.pdf (March 2011), Tables 6-1, 6-2, and 7-5.
57 57
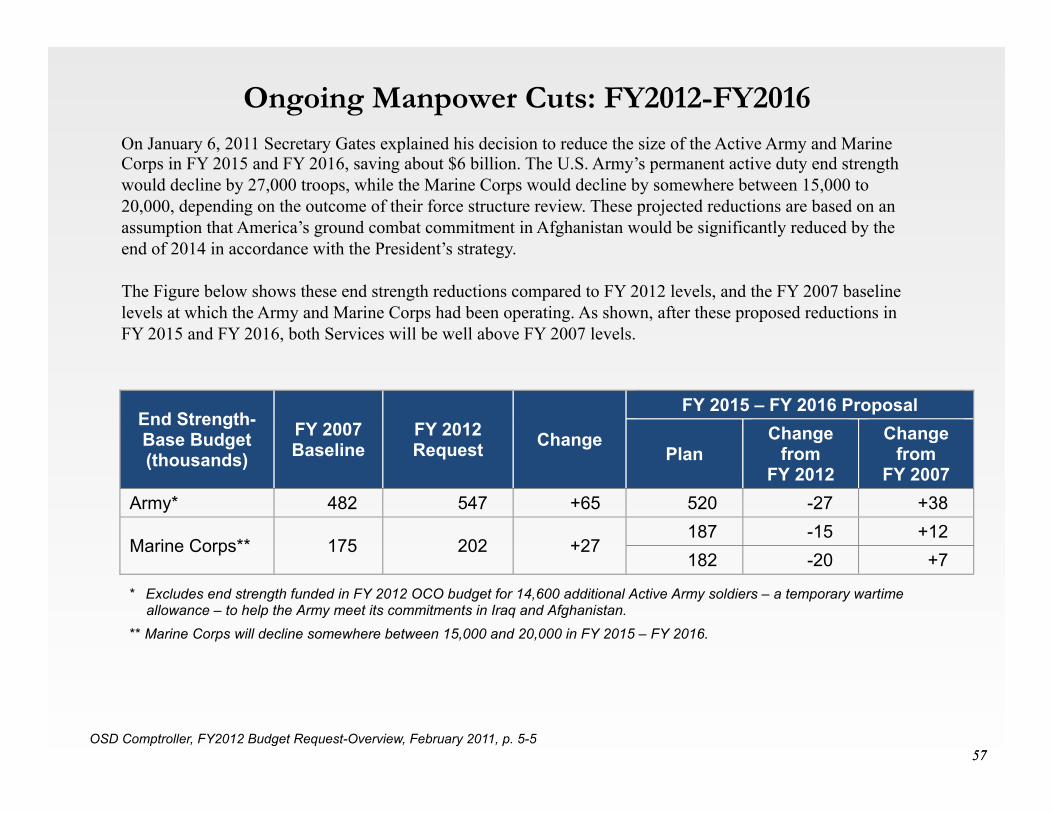
Ongoing Manpower Cuts: FY2012-FY2016
OSD Comptroller, FY2012 Budget Request-Overview, February 2011, p. 5-5
On January 6, 2011 Secretary Gates explained his decision to reduce the size of the Active Army and Marine Corps in FY 2015 and FY 2016, saving about $6 billion. The U.S. Army’s permanent active duty end strength would decline by 27,000 troops, while the Marine Corps would decline by somewhere between 15,000 to 20,000, depending on the outcome of their force structure review. These projected reductions are based on an assumption that America’s ground combat commitment in Afghanistan would be significantly reduced by the end of 2014 in accordance with the President’s strategy. The Figure below shows these end strength reductions compared to FY 2012 levels, and the FY 2007 baseline levels at which the Army and Marine Corps had been operating. As shown, after these proposed reductions in FY 2015 and FY 2016, both Services will be well above FY 2007 levels.
Overview – FY 2012 Defense Budget �
CHAPTER 5 EFFICIENCIES AND REFORMS
5-5
Missile Defense Agency more than 360.
Reports, studies, boards, and commissions ($1 billion). Eliminate about 400 internally-generated reports and cancel all internal and DoD-generated reports with date prior to 2006. Starting in February 2011, every report must include the cost of its production, which will be tracked by a costing database.
Reduce senior leadership positions ($0.1 billion). Reduce more than 100 flag officers (out of 900) and about 200 Senior Executive Service or equivalent positions (out of about 1,400).
F-35 JSF restructuring and repricing ($4 billion). (Details in Chapter 4.)
End strength cut for Army and USMC in FY 2015 – FY 2016 ($6 billion).
Adjustments to economic assumptions and other changes ($14 billion). Economic adjustments include decreases in inflation rates and lower projected military pay raises for FY 2012 – FY 2016 compared to previously assumed levels. Numerous other changes across a variety of activities account for the rest of this $14 billion in savings.
REDUCING GROUND FORCES IN FY 2015 – FY 2016
On January 6, Secretary Gates explained his decision to reduce the size of the Active Army and Marine Corps in FY 2015 and FY 2016, saving about $6 billion. The U.S. Army’s permanent active duty end strength would decline by 27,000 troops, while the Marine Corps would decline by somewhere between 15,000 to 20,000, depending on the outcome of their force structure review. These projected reductions are based on an assumption that America’s ground combat commitment in Afghanistan would be significantly reduced by the end of 2014 in accordance with the President’s strategy.
Figure 5-2 shows these end strength reductions compared to FY 2012 levels, and the FY 2007 baseline levels at which the Army and Marine Corps had been operating. As shown, after these proposed reductions in FY 2015 and FY 2016, both Services will be well above FY 2007 levels.
Figure 5-2. Active Military End Strength
End Strength- Base Budget (thousands)
FY 2007 Baseline
FY 2012 Request Change
FY 2015 – FY 2016 Proposal
Plan Change
from FY 2012
Change from
FY 2007
Army* 482 547 +65 520 -27 +38
Marine Corps** 175 202 +27 187 -15 +12 182 -20 +7
* Excludes end strength funded in FY 2012 OCO budget for 14,600 additional Active Army soldiers – a temporary wartime
allowance – to help the Army meet its commitments in Iraq and Afghanistan.
** Marine Corps will decline somewhere between 15,000 and 20,000 in FY 2015 – FY 2016.
REFORMING DEFENSE ACQUISITION Acquisition reform is the process by which DoD is changing how it buys its weapons and other important systems and investments. The Department is focused on acquisition reform at the strategic and tactical level.
x At the strategic level, we are ensuring investments are affordable and consistent with warfighting priorities.
x At the tactical level, we are focused on acquiring warfighting capability via a disciplined,

58 58
The Tricare Threat to US Strategy
CBO, Long Term Implications of 2012 Future Years Defense Program, June 23, 2011, p. 17.
CHAPTER TWO LONG-TERM IMPLICATIONS OF THE 2012 FUTURE YEARS DEFENSE PROGRAM 17
CBO
Figure 2-2.
Costs of DoD’s Plans for Its Military Health System(Billions of 2012 dollars)
Source: Congressional Budget Office.
Notes: Supplemental and emergency funding for overseas contingency operations (OCO), such as those in Afghanistan and Iraq, is included for 2011 and earlier but not for later years.
Before 2001, pharmaceutical costs were not separately identifiable but were embedded in the costs of two categories: “Purchased Care and Contracts” and “Direct Care and Other.” In 2001 and later years, most pharmaceutical costs are separately identifiable, but some of those costs may be embedded in the category “TRICARE for Life Accrual Payments.”
The amounts shown for the Future Years Defense Program (FYDP) and the extension of the FYDP are the totals for all categories.
FYDP period = 2012 to 2016, the years for which the Department of Defense’s (DoD’s) plans are fully specified.
a. Each category shows the CBO projection of the base budget from 2012 to 2030. That projection incorporates costs that are consistent with DoD’s recent experience.
b. For the extension of the FYDP (2017 to 2030), CBO projects the costs of DoD’s plans using the department’s estimates of costs to the extent they are available and costs that are consistent with the broader U.S. economy if such estimates are not available.
DoD’s base budget.9 According to the CBO projection, the costs of DoD’s plans for its military health care
system would reach $59 billion by 2016 (see Figure 2-2). (That projected amount reflects average annual growth of 3.9 percent over the FYDP period, compared with the 3.0 percent in DoD’s projections.) By 2030, the costs in the CBO projection would grow to $92 billion, nearly double the amount requested in 2012. (That growth would amount to an average annual increase of 3.2 percent over the 2016–2030 period.)
1980 1985 1990 1995 2000 2005 2010 2015 2020 2025 20300
20
40
60
80
100
120 ActualFYDPPeriod
Beyond theFYDP Period
FYDP
Army
TRICARE for Life Accrual Payments
PharmaceuticalsPurchased Care and
Contracts
Military Personnel
Extension of FYDPb
Direct Care and Other
CBO Projectiona
9. That total includes $8 billion for the pay and benefits of military personnel and $5 billion for DoD civilians who work in the mili-tary health system, both of which have been included in the totals for pay and benefits shown in Table 2-1 on page 13. An additional $11 billion covers accrual payments for TRICARE for Life. The cost of the military health system, excluding military and civilian pay and accrual payments for TRICARE for Life, would be $27 billion in 2012.
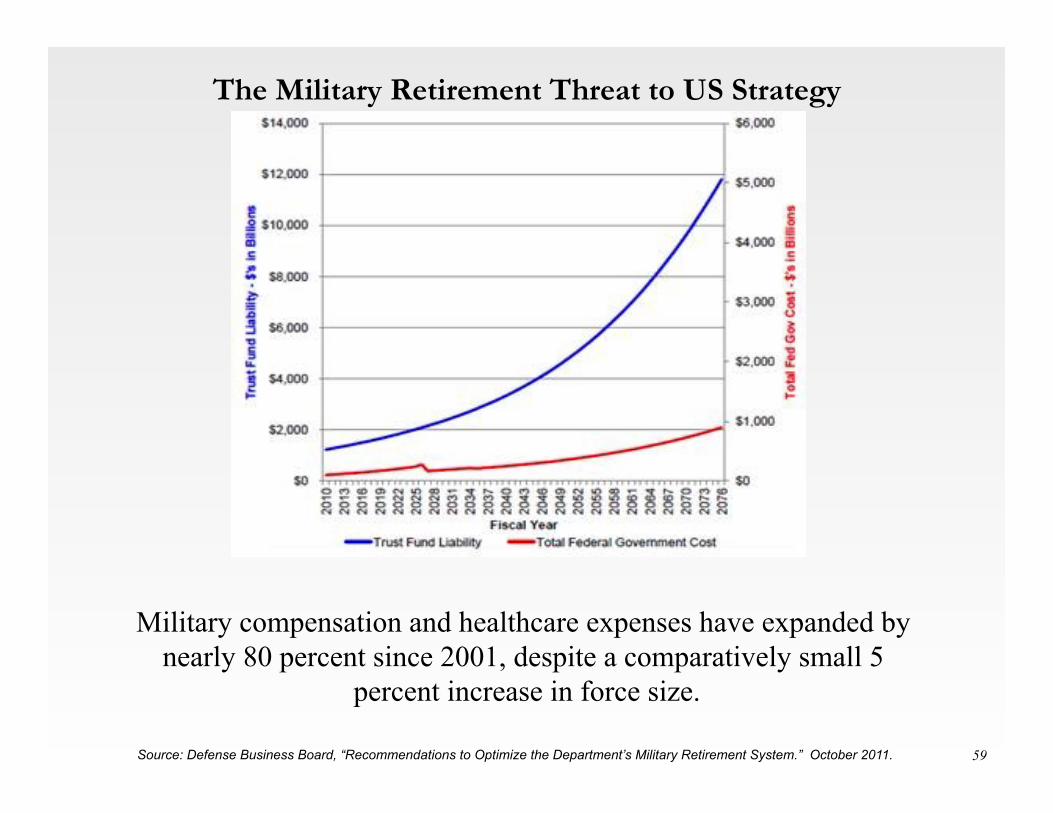
59
The Military Retirement Threat to US Strategy
Source: Defense Business Board, “Recommendations to Optimize the Department’s Military Retirement System.” October 2011.
Military compensation and healthcare expenses have expanded by nearly 80 percent since 2001, despite a comparatively small 5
percent increase in force size.

60
The RDT&E & Procurement Threat to US Strategy
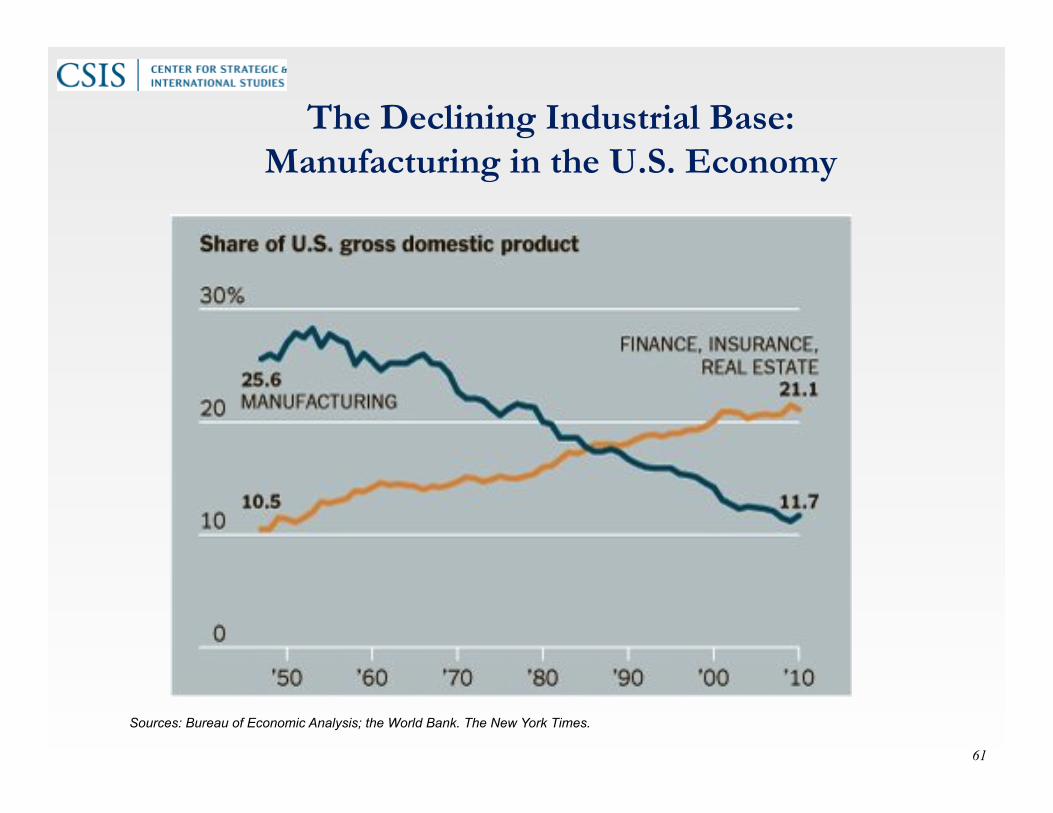
61
The Declining Industrial Base: Manufacturing in the U.S. Economy
Sources: Bureau of Economic Analysis; the World Bank. The New York Times.

62 62
Semi-Affordable Acquisition, Maybe
CBO, Long Term Implications of 2011 Future Years Defense Program, February 2011, p. 13

63 63
CBO Estimate of Squeeze on Procurement and RDT&E
CBO, Long Term Implications of 2011 Future Years Defense Program, February 2011, p. 5

64 64
CBO Estimate of Possible “Acquisition Squeeze”
CBO, Long Term Implications of 2012 Future Years Defense Program, June 23, 2011, p. 22.
22 LONG-TERM IMPLICATIONS OF THE 2012 FUTURE YEARS DEFENSE PROGRAM
CBO
Figure 3-1.
Costs of DoD’s Acquisition Plans(Billions of 2012 dollars)
Source: Congressional Budget Office.
Note: FYDP = Future Years Defense Program; FYDP period = 2012 to 2016, the years for which the Department of Defense’s (DoD’s) plans are fully specified.
a. Base-budget data include supplemental and emergency funding before 2002.
b. For 2002 to 2012, supplemental and emergency funding for overseas contingency operations (OCO), such as those in Afghanistan and Iraq, and for other purposes is shown separately from the base-budget data. The amount shown for 2012 has been requested but has not been appropriated.
c. The CBO projection of the base budget incorporates costs that are consistent with DoD’s recent experience.
d. For the extension of the FYDP (2017 to 2030), CBO projects the costs of DoD’s plans using the department’s estimates of costs to the extent they are available and costs that are consistent with the broader U.S. economy if such estimates are not available.
new combat vehicle planned for the Army). Others (a replacement for the Navy’s F/A-18E/F fighter, for instance) are not based on specific plans but have been identified by CBO either as systems that would be neces-sary to maintain weapon inventories as existing systems reach the end of their service life and need to be replaced, or as systems that would provide new capabilities to meet goals described in the services’ policy statements.
The following sections describe details of the more signif-icant systems in DoD’s acquisition plans and CBO’s estimates of the costs of those plans for each of the mili-tary departments—the Army, the Navy (including the Marine Corps), and the Air Force—and for the parts of DoD outside the military services, including the Missile Defense Agency (see Figure 3-2).
The ArmyThe Administration’s 2012 request for acquisition fund-ing for the Department of the Army includes $32 billion for the base budget plus an additional $5 billion for overseas contingency operations. According to the CBO projection of DoD’s plans, acquisition costs for the Army’s base budget would remain fairly steady through 2024, averaging about $35 billion per year, before tailing off in later years (see Figure 3-3). That projection is about 19 percent higher than the costs estimated in the exten-sion of the FYDP for that period.
For its projections of acquisition costs for the Army, CBO tracked programs in five categories of major systems: ground combat vehicles and trucks; command, control,
1980 1985 1990 1995 2000 2005 2010 2015 2020 2025 2030
0
50
100
150
200
250
300
Base Budget Plus OCO Fundingb
FYDP Extension of FYDPd
Base Budgeta
CBO Projectionc
ActualFYDPPeriod
Beyond theFYDP Period
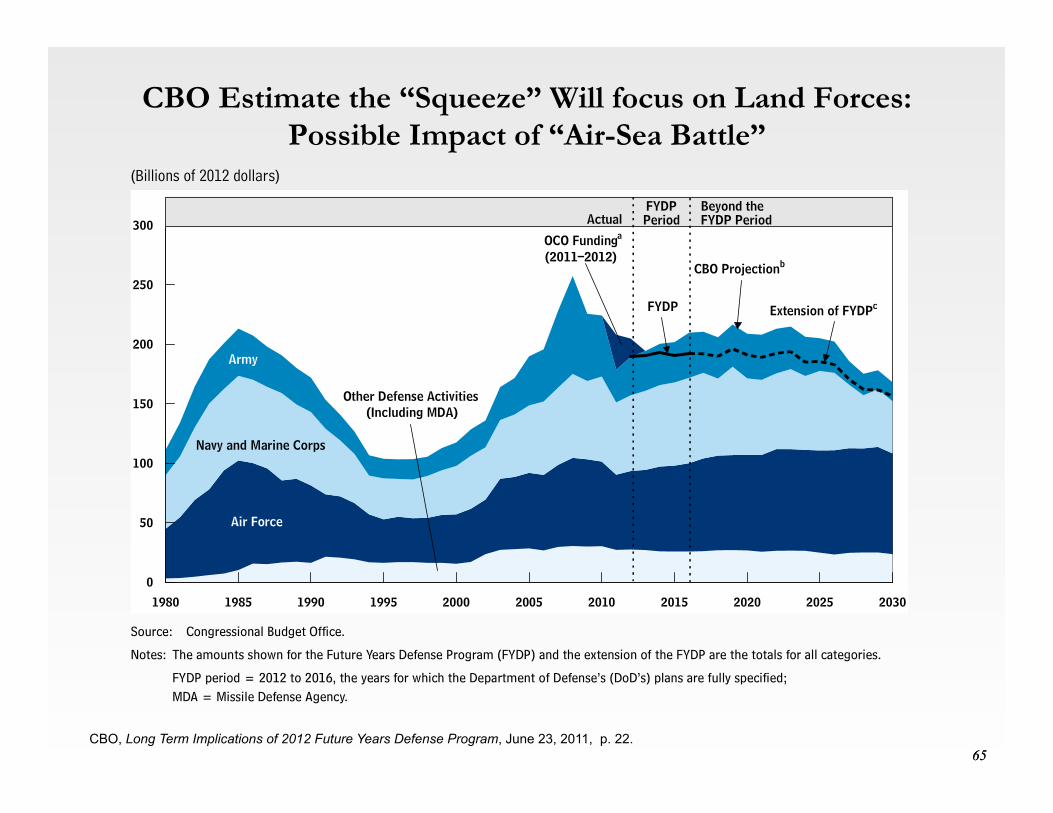
65 65
CBO Estimate the “Squeeze” Will focus on Land Forces:
Possible Impact of “Air-Sea Battle”
CBO, Long Term Implications of 2012 Future Years Defense Program, June 23, 2011, p. 22.
CHAPTER THREE LONG-TERM IMPLICATIONS OF THE 2012 FUTURE YEARS DEFENSE PROGRAM 23
CBO
Figure 3-2.
Costs of DoD’s Acquisition Plans, by Category(Billions of 2012 dollars)
Source: Congressional Budget Office.
Notes: The amounts shown for the Future Years Defense Program (FYDP) and the extension of the FYDP are the totals for all categories.
FYDP period = 2012 to 2016, the years for which the Department of Defense’s (DoD’s) plans are fully specified; MDA = Missile Defense Agency.
a. Supplemental and emergency funding for overseas contingency operations (OCO), such as those in Afghanistan and Iraq, is included for 2012 and earlier but not in later years. The amount shown for OCO funding for 2011 has been appropriated but was not included in the 2012 FYDP; funding for 2012 has been requested but has not been appropriated.
b. Each category shows the CBO projection of the base budget from 2012 to 2030. That projection incorporates costs that are consistent with DoD’s recent experience.
c. For the extension of the FYDP (2017 to 2030), CBO projects the costs of DoD’s plans using the department’s estimates of costs to the extent they are available and costs that are consistent with the broader U.S. economy if such estimates are not available.
communications, computers, intelligence, surveillance, and reconnaissance (C4ISR) systems; aircraft; missile defense systems; and missiles and munitions.2
Ground Combat Vehicles and TrucksThe Army’s plans include upgrades to many combat vehicles—including Stryker vehicles, Abrams tanks, Bradley fighting vehicles, and self-propelled 155-millimeter howitzers—throughout the entire projection period. The plans also include the purchase of two new types of combat vehicles, the ground combat vehicle (GCV) and the armored multipurpose vehicle (AMPV). The Army intends to use the GCVs, which would be entirely new vehicles, to replace the infantry carrier version of the Bradley fighting vehicles in its
1980 1985 1990 1995 2000 2005 2010 2015 2020 2025 20300
50
100
150
200
250
300 ActualFYDPPeriod
Beyond theFYDP Period
OCO Funding(2011–2012)
FYDP
Army
Navy and Marine Corps
Air Force
Other Defense Activities(Including MDA)
Extension of FYDPc
a
CBO Projectionb
2. CBO’s estimates of acquisition costs for major weapon systems do not match those in the services’ major procurement categories because CBO has focused on a subset of the programs contained in those categories. CBO has included the other programs in those categories under “Other Procurement.”
66 66
$78 Billion in Equipment Cost Escalation in 2008-2010
GAO, Defense Acquisitions, Assessments of Selected Weapons Programs, GAO-11-233SP, March 2011.
• The total cost of DOD’s 2010 portfolio of major defense acquisition
programs has grown by $135 billion, or 9 percent, over the past 2 years, of which about $70 billion cannot be attributed to changes in quantities of some weapon systems.
• Ten of DOD’s largest acquisition programs account for over half the
portfolio’s total acquisition cost growth over the past 2 years.
• Fewer than half of the programs in DOD’s 2010 portfolio are meeting established performance metrics for cost growth.
• DOD’s buying power has been reduced for almost 80 percent of its portfolio
of major defense acquisition programs.
• On average, the majority of cost growth materialized after programs entered production, meaning they continued to experience significant changes well after the programs and their costs should have stabilized.

67
Building Down From $1 Trillion in Procurement Over the Last 10 Years
Defense Procurement Funding in Billions of Dollars
Source: Data from the Department of Defense. Greenbook for FY2012. Table 2.1. Graph from the Stimson Center.

68 68
$78 Billion in Equipment Cost Escalation in 2008-2010
GAO, Defense Acquisitions, Assessments of Selected Weapons Programs, GAO-11-233SP, March 2011.
Changes in Total Acquisition Cost and Program Acquisition Unit Cost for 10 of the
Highest-Cost Acquisition Programs
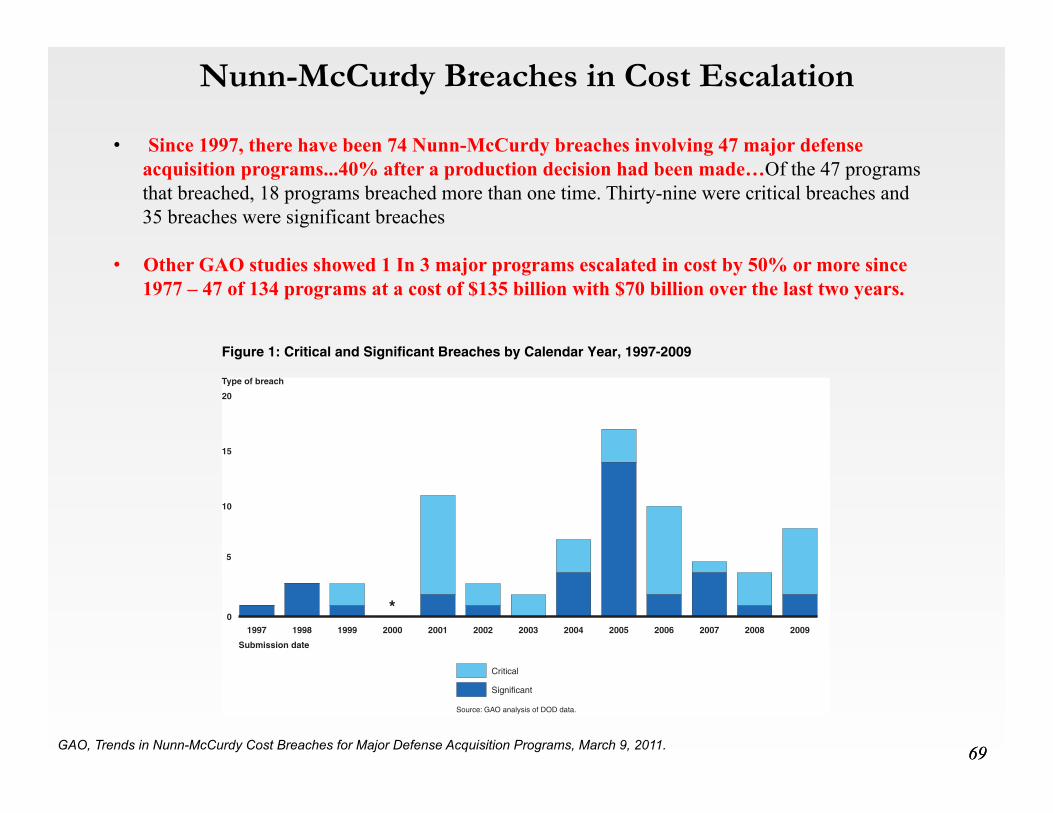
69 69
Nunn-McCurdy Breaches in Cost Escalation
GAO, Trends in Nunn-McCurdy Cost Breaches for Major Defense Acquisition Programs, March 9, 2011.
• Since 1997, there have been 74 Nunn-McCurdy breaches involving 47 major defense acquisition programs...40% after a production decision had been made…Of the 47 programs that breached, 18 programs breached more than one time. Thirty-nine were critical breaches and 35 breaches were significant breaches
• Other GAO studies showed 1 In 3 major programs escalated in cost by 50% or more since 1977 – 47 of 134 programs at a cost of $135 billion with $70 billion over the last two years.
GAO-11-295R Trends in Nunn-McCurdy Breaches 7
Figure 1: Critical and Significant Breaches by Calendar Year, 1997-2009 Type of breach
Submission date
Critical
Significant
Source: GAO analysis of DOD data.
0
5
10
15
20
2009200820072006200520042003200220012000199919981997
*
*No breaches were reported in 2000. Note: This figure uses the terms significant and critical to categorize reported program cost growth. We note, however, that prior to 2006, the statute did not use those terms to describe the cost growth thresholds. Air Force Programs Constitute a Higher Proportion of Nunn-McCurdy Breaches The Air Force had a higher proportion of total breaches compared to its proportion of total programs, whereas the Navy had a smaller proportion of breaches compared to its proportion of programs. Specifically, out of 134 total major defense acquisition programs from 1997 to 2009, 36 (or 27 percent) are Air Force, 37 (or 28 percent) are Army, 12 (or 9 percent) are DOD, and 49 (or 37 percent) are Navy programs. Of the 74 breaches during the same time, 27 (or 36 percent) are Air Force, 19 (or 26 percent) are Army, 11 (or 15 percent) are DOD, and 17 (or 23 percent) are Navy programs.
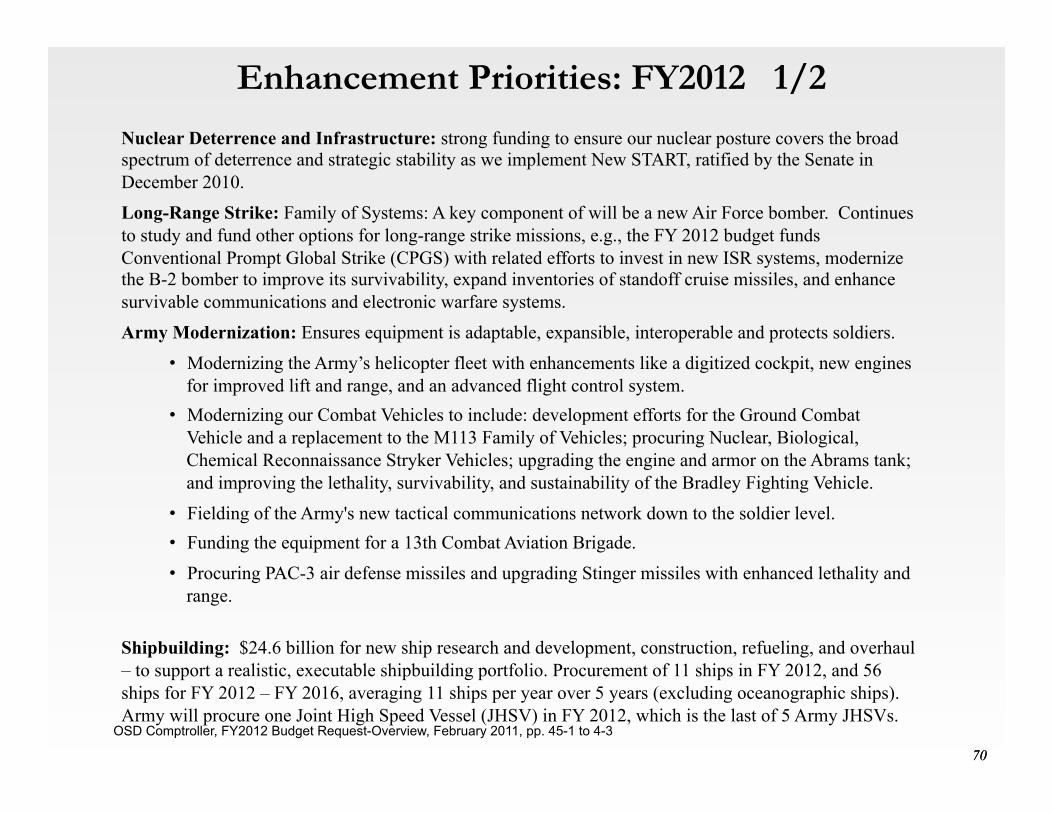
70 70
Enhancement Priorities: FY2012 1/2
OSD Comptroller, FY2012 Budget Request-Overview, February 2011, pp. 45-1 to 4-3
Nuclear Deterrence and Infrastructure: strong funding to ensure our nuclear posture covers the broad spectrum of deterrence and strategic stability as we implement New START, ratified by the Senate in December 2010.
Long-Range Strike: Family of Systems: A key component of will be a new Air Force bomber. Continues to study and fund other options for long-range strike missions, e.g., the FY 2012 budget funds Conventional Prompt Global Strike (CPGS) with related efforts to invest in new ISR systems, modernize the B-2 bomber to improve its survivability, expand inventories of standoff cruise missiles, and enhance survivable communications and electronic warfare systems.
Army Modernization: Ensures equipment is adaptable, expansible, interoperable and protects soldiers.
• Modernizing the Army’s helicopter fleet with enhancements like a digitized cockpit, new engines for improved lift and range, and an advanced flight control system.
• Modernizing our Combat Vehicles to include: development efforts for the Ground Combat Vehicle and a replacement to the M113 Family of Vehicles; procuring Nuclear, Biological, Chemical Reconnaissance Stryker Vehicles; upgrading the engine and armor on the Abrams tank; and improving the lethality, survivability, and sustainability of the Bradley Fighting Vehicle.
• Fielding of the Army's new tactical communications network down to the soldier level. • Funding the equipment for a 13th Combat Aviation Brigade.
• Procuring PAC-3 air defense missiles and upgrading Stinger missiles with enhanced lethality and range.
Shipbuilding: $24.6 billion for new ship research and development, construction, refueling, and overhaul – to support a realistic, executable shipbuilding portfolio. Procurement of 11 ships in FY 2012, and 56 ships for FY 2012 – FY 2016, averaging 11 ships per year over 5 years (excluding oceanographic ships). Army will procure one Joint High Speed Vessel (JHSV) in FY 2012, which is the last of 5 Army JHSVs.

71 71
Enhancement Priorities: FY2012 2/2
OSD Comptroller, FY2012 Budget Request-Overview, February 2011, pp. 45-1 to 4-3
• Build one DDG 51 destroyer, two Virginia class submarines, four of the Littoral Combat Ship (LCS), the last LPD-17 Amphibious Transport Dock ship, two JHSVs (one Army funded and one Navy funded), and one Mobile Landing Platform (MLP).
• Fund Advance Procurement for the CVN 79 aircraft carrier, Virginia class submarines, and the FY 2013 DDG 51 class destroyer.
KC(X) Tanker: Acquire 179 new KC-X aerial refueling tankers procured at a maximum rate of 15 aircraft per year, would replace about 1/3 of the current tanker fleet.
Space Programs: $10.2 billion for the DoD Space Program to include nearly $0.5 billion to develop spacecraft and sensors for the Defense Weather Satellite System (DWSS). National Polar-orbiting Operational Environmental Satellite System (NPOESS) involving three agencies: DoD, Department of Commerce, and NASA; Evolutionary Acquisition for Space Efficiency (EASE).
Science and Technology (S&T): $12.2 billion to fund 2% real growth in Basic Research (and maintains stable funding in the rest of S&T (Functions 6.2 and 6.3). Request is almost 25 percent higher than the FY 2000 request.
Missile defense: defend the Homeland against limited ballistic missile attacks; defend against regional missile threats to U.S. forces, allies and partners; rigorously test new capabilities before they are deployed; develop new capabilities that are fiscally sustainable; field missile defenses that are adaptable and flexible to adjust to future threats; and expand our international efforts. Includes $10.7 billion for BMD programs – including $8.6 billion for the Missile Defense Agency.

72 72
CBO Estimate of Air Force Acquisition Budgets
CBO, Long Term Implications of 2012 Future Years Defense Program, June 23, 2011, p. 29.
CHAPTER THREE LONG-TERM IMPLICATIONS OF THE 2012 FUTURE YEARS DEFENSE PROGRAM 29
CBO
Figure 3-5.
Costs of the Air Force’s Acquisition Plans(Billions of 2012 dollars)
Source: Congressional Budget Office.
Notes: The amounts shown for the Future Years Defense Program (FYDP) and the extension of the FYDP are the totals for all categories.
FYDP period = 2012 to 2016, the years for which the Department of Defense’s (DoD’s) plans are fully specified.
a. Supplemental and emergency funding for overseas contingency operations (OCO), such as those in Afghanistan and Iraq, is included for 2012 and earlier but not in later years. The amount shown for OCO funding for 2011 has been appropriated but was not included in the 2012 FYDP; funding for 2012 has been requested but has not been appropriated.
b. Each category shows the CBO projection of the base budget from 2012 to 2030. That projection incorporates costs that are consistent with DoD’s experience.
c. For the extension of the FYDP (2017 to 2030), CBO projects the costs of DoD’s plans using the department’s estimates of costs to the extent they are available and costs that are consistent with the broader U.S. economy if such estimates are not available.
Missiles and MunitionsThe category of missiles and munitions comprises air-launched weapons (including air-to-air and air-to-ground missiles) and ship-launched weapons (including defensive surface-to-air missiles, land-attack missiles, and torpe-does). Notable among those weapons is a substantial number of the Tactical Tomahawk cruise missiles for attacking land targets and the air-launched Joint Standoff Weapon, also for attacking ground targets.
The Air ForceThe Air Force has requested $66 billion for acquisition in its 2012 budget. According to the CBO projection of DoD’s plans, those costs would average $70 billion per year during the FYDP period (to 2016), about $3 billion higher than the average indicated in the FYDP (see Figure 3-5). Beyond the FYDP period, according to CBO’s projection, the Air Force’s acquisition plans would cost an average of about $84 billion per year, about 9 per-cent higher than the costs estimated in the extension of
1980 1985 1990 1995 2000 2005 2010 2015 2020 2025 20300
20
40
60
80
100
FYDP
Extension of FYDPc
ActualFYDPPeriod
Beyond theFYDP Period
OCO Funding(2011–2012)
Space Systems
Research, Development, Test, and Evaluation
Other Procurement
Missiles andMunitionsAircraft
a CBO Projectionb

73 73
F-22: Force Multiplier vs. Force Killer
GAO, Defense Acquisitions, Assessments of Selected Weapons Programs, GAO-11-233SP, March 2011.

74
High Marginal Costs are Driving Down the Number of Aircraft that Can be Procured
Russell Rumbaugh, What We Bought: Defense Procurement FY01-FY10, Stimson Center. October, 2011. Pg. 11

75 75
Configuration Control: The F-35 as a Case Study
GAO, JOINT STRIKE FIGHTER: Restructuring Places Program on Firmer Footing, but Progress Is Still Lagging, May 19, 2011.
compares monthly design changes and future forecasts against contractor plans in 2007.
Figure 2: Monthly Design Changes for JSF Aircraft
Number of design changes
Source: GAO analysis of DOD data.
Months
Anticipated design changes (2007 plan)
Design changes (actual)
Anticipated future design changes (2010 plan)
0
100
200
300
400
500
600
700
800
900
1000
Jan. 2
016
July
2015
Jan. 2
015
July
2014
Jan. 2
014
July
2013
Jan. 2
013
July
2012
Jan. 2
012
July
2011
Jan. 2
011
July
2010
Jan. 2
010
July
2009
Jan. 2
009
July
2008
Jan. 2
008
July
2007
Jan. 2
007
July
2006
Jan. 2
006
Program now anticipates 10,000 more design changes than anticipated in 2007
The monthly rate in 2009 and 2010 was higher than expected and the program now anticipates more changes over a longer period of time—about 10,000 more changes through January 2016. With most of development testing still ahead for the JSF, the risk and impact from required design changes are significant. In addition, emerging concerns about the STOVL lift fan and drive shaft, fatigue cracks in a ground test article, and stealth-related issues may drive additional and substantive design changes.
Manufacturing and delivering test jets took much more time and money than planned. As in prior years, lingering management inefficiencies,
Page 9 GAO-11-677T
aircraft and an inability to achieve the planned flying rates per aircraft substantially reduced the amount and pace of testing planned previously. Consequently, even though the flight test program accelerated its pace last year, the total number of flights accomplished during the first 4 years of the test program significantly lagged expectations when the program’s 2007 baseline was established. Figure 4 shows that the cumulative number of flights accomplished by the end of 2010 was only about one-fifth the numbers forecast by this time in the 2007 test plan.
Figure 4: Actual JSF Flight Tests Completed through 2010 Compared to the 2007 Plan
0
500
1000
1500
2000
2500
3000
Dec 10Jan 10
2007 Planned flights
2010 Actual flights
Flights
Source: GAO analysis of DOD data.
By the end of 2010, about 10 percent of more than 50,000 planned flight test points had been completed.6 The majority of the points were earned on airworthiness tests (basic airframe handling characteristics) and in ferrying the planes to test sites. Remaining test points include more
6 According to program officials completion of a test point means that the test point has been flown and that flight engineers ruled that the point has met the need. Further analysis may be necessary for the test point to be closed out.
Page 12 GAO-11-677T
Cost Escalation: • 9/2001: $233 billion for
2,866; full rate production in 2008
• 6/2011: $383 billion for 2,457; full production in 2016

76 76
CBO Estimate of Navy-Marine Corps Acquisition Budgets
CBO, Long Term Implications of 2012 Future Years Defense Program, June 23, 2011, p. 26.
26 LONG-TERM IMPLICATIONS OF THE 2012 FUTURE YEARS DEFENSE PROGRAM
CBO
Figure 3-4.
Costs of the Navy and the Marine Corps’ Acquisition Plans(Billions of 2012 dollars)
Source: Congressional Budget Office.
Notes: The amounts shown for the Future Years Defense Program (FYDP) and the extension of the FYDP are the totals for all categories.
FYDP period = 2012 to 2016, the years for which Department of Defense’s (DoD’s) plans are fully specified.
a. Supplemental and emergency funding for overseas contingency operations (OCO), such as those in Afghanistan and Iraq, is included for 2012 and earlier but not in later years. The amount shown for OCO funding for 2011 has been appropriated but was not included in the 2012 FYDP; funding for 2012 has been requested but has not been appropriated.
b. Each category shows the CBO projection of the base budget from 2012 to 2030. That projection incorporates costs that are consistent with DoD’s recent experience.
c. For the extension of the FYDP (2017 to 2030), CBO projects the costs of DoD’s plans using the department’s estimates of costs to the extent they are available and costs that are consistent with the broader U.S. economy if such estimates are not available.
1980 1985 1990 1995 2000 2005 2010 2015 2020 2025 20300
20
40
60
80
100Actual
FYDPPeriod
Beyond theFYDP Period
FYDPGround Combat
Research, Development, Test, and Evaluation
Other Procurement
Missiles andMunitions
Aircraft
Ships
Extension of FYDPc
OCO Funding(2011–2012)
CBO Projectionb
a
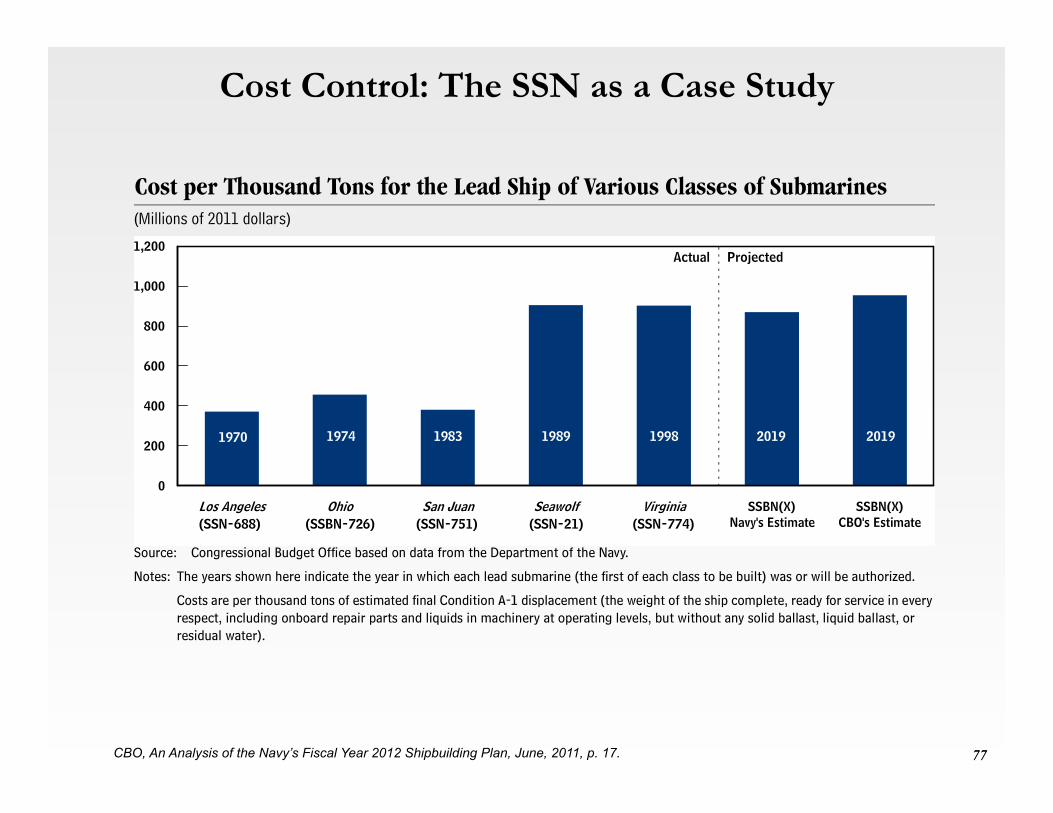
77 77
Cost Control: The SSN as a Case Study
CBO, An Analysis of the Navy’s Fiscal Year 2012 Shipbuilding Plan, June, 2011, p. 17. .
AN ANALYSIS OF THE NAVY’S FISCAL YEAR 2012 SHIPBUILDING PLAN 17
CBO
Figure 6.
Cost per Thousand Tons for the Lead Ship of Various Classes of Submarines(Millions of 2011 dollars)
Source: Congressional Budget Office based on data from the Department of the Navy.
Notes: The years shown here indicate the year in which each lead submarine (the first of each class to be built) was or will be authorized.
Costs are per thousand tons of estimated final Condition A-1 displacement (the weight of the ship complete, ready for service in every respect, including onboard repair parts and liquids in machinery at operating levels, but without any solid ballast, liquid ballast, or residual water).
submarine of a class is particularly difficult because it is not clear how much the Navy will need to spend on non-recurring engineering and detail design. The Navy spent about $2 billion on those items for the lead Virginia class attack submarine. The historical track record for the lead ship of new classes of submarines in the 1970s and 1980s indicates that there is little difference on a per-ton basis between a lead attack submarine (SSN) and a lead SSBN (see Figure 6). In addition, CBO assumed that the cost of nonrecurring items is proportional to the weight of sub-marines. Therefore, CBO estimated that nonrecurring items would cost about $5 billion for the lead SSBN(X), which will be approximately the size of an Ohio class submarine and thus about 2½ times the size of a Virginia class submarine. The increase in the Navy’s estimate for the lead SSBN(X) reflects the fact that the service now also estimates that nonrecurring costs will be about $5 billion. Under the 2011 plan, the Navy appeared to assume that those costs would be about $2 billion.
Overall, 12 SSBN(X)s would cost a total of about $86 billion in CBO’s estimation, or an average of $7.2 billion each. That average includes the $13.3 billion estimated cost of the lead ship and a $6.5 billion average estimated cost for the 2nd through 12th ships. Research
and development would cost another $10 billion to $15 billion, for a total program cost of $96 billion to $101 billion. CBO’s estimate under the 2011 plan was an average of $8.3 billion per submarine. The decline in CBO’s estimate stems from two factors: the changes in the Navy’s design and the narrowing of the projected gap between inflation in the economy overall and inflation in the shipbuilding industry.20 The change in design accounts for about 60 percent of the reduction in cost, and the change in the projected inflation differential accounts for the remainder.
Attack Submarines. Under the 2012 plan, the Navy would buy 23 Virginia class attack submarines at a rate of two per year from 2012 through 2022, with the excep-tions of 2018, 2023, and 2024, when the Navy would buy one per year. Starting in 2025, the Navy would buy the improved Virginia class at a rate of one SSN annually in most years until 2041. With such a procurement
Los Angeles Ohio San Juan Seawolf Virginia SSBN(X)Navy's Estimate
SSBN(X)CBO's Estimate
0
200
400
600
800
1,000
1,200
1970 1974 1983 1989 1998 2019 2019
(SSN-688) (SSBN-726) (SSN-751) (SSN-21) (SSN-774)
Actual Projected
20. As Box 1 on page 12 indicates, CBO now projects that the gap between GDP inflation and shipbuilding inflation will be close to the 30-year historical average. That average is a little less than the gap CBO projected in its analysis of the Navy’s 2011 ship-building plan.
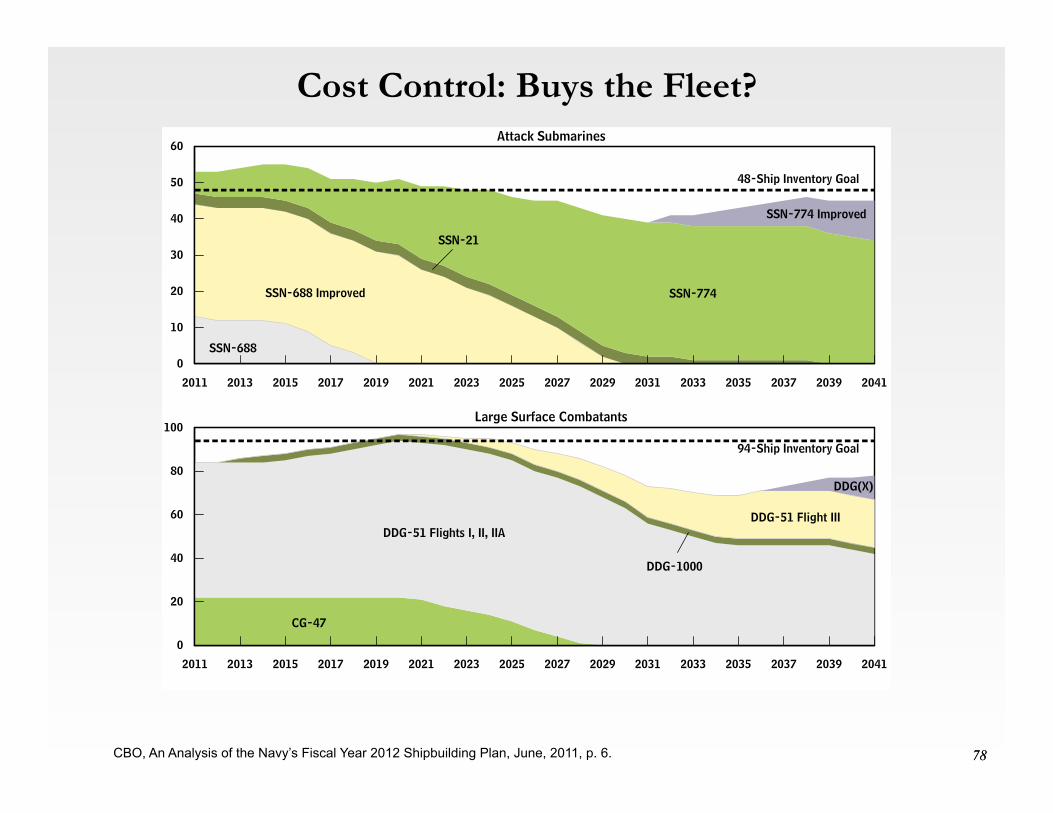
78 78
Cost Control: Buys the Fleet?
CBO, An Analysis of the Navy’s Fiscal Year 2012 Shipbuilding Plan, June, 2011, p. 6.
6 AN ANALYSIS OF THE NAVY’S FISCAL YEAR 2012 SHIPBUILDING PLAN
CBO
Figure 3.
Annual Inventories Versus Goals for Selected Categories of ShipsUnder the Navy’s 2012 Plan
Source: Congressional Budget Office.
Note: SSN = attack submarine; DDG = guided missile destroyer; CG = guided missile cruiser; LSD = dock landing ship; LHA and LHD = amphibious assault ship; LPD = amphibious transport dock.
2011 2013 2015 2017 2019 2021 2023 2025 2027 2029 2031 2033 2035 2037 2039 2041
0
10
20
30
40
50
60Attack Submarines
48-Ship Inventory Goal
SSN-688
SSN-688 Improved
SSN-21
SSN-774
SSN-774 Improved
2011 2013 2015 2017 2019 2021 2023 2025 2027 2029 2031 2033 2035 2037 2039 2041
0
20
40
60
80
100Large Surface Combatants
94-Ship Inventory Goal
CG-47
DDG-51 Flights I, II, IIA
DDG-1000
DDG-51 Flight III
DDG(X)
2011 2013 2015 2017 2019 2021 2023 2025 2027 2029 2031 2033 2035 2037 2039 2041
0
5
10
15
20
25
30
35
40Amphibious Warfare Ships
33-Ship Inventory Goal
LPD-4LHA-1 and LHD-1
LSD-41 and LSD-49LPD-17 LHA-6
LSD(X)

79 79
GAO Summary of Army FCS Program
Since it started development in 2003, the Future Combat System (FCS) was at the center of the Army’s efforts to modernize into a lighter, more agile, and more capable combat force. The Army expected to develop this equipment in 10 years, procure it over 13 years, and field it to 15 FCS- unique brigades. The Army had also planned to spin out selected FCS technologies and systems to current Army forces. In June 2009, after 6 years and an estimated $18 billion invested, the Under Secretary of Defense for Acquisition, Technology, and Logistics issued an acquisition decision memorandum that canceled the FCS acquisition program, terminated manned ground vehicle development efforts, and laid out plans for follow-on Army brigade combat team modernization efforts. These initiatives included plans for the development of: • GCV, • multiple increments of brigade modernization, and • an incremental tactical network capability.
GAO, DEFENSE ACQUISITIONS: Key Questions Confront the Army’s Ground Force Modernization Initiatives, March 9, 2011.

80 80
CBO Estimate of Army Acquisition Budgets
CBO, Long Term Implications of 2012 Future Years Defense Program, June 23, 2011, p. 24.
24 LONG-TERM IMPLICATIONS OF THE 2012 FUTURE YEARS DEFENSE PROGRAM
CBO
Figure 3-3.
Costs of the Army’s Acquisition Plans(Billions of 2012 dollars)
Source: Congressional Budget Office.
Notes: The amounts shown for the Future Years Defense Program (FYDP) and the extension of the FYDP are the totals for all categories.
FYDP period = 2012 to 2016, the years for which the Department of Defense’s (DoD’s) plans are fully specified; C4ISR = command, control, communications, computers, intelligence, surveillance, and reconnaissance.
a. Supplemental and emergency funding for overseas contingency operations (OCO), such as those in Afghanistan and Iraq, is included for 2012 and earlier but not in later years. The amount shown for OCO funding for 2011 has been appropriated but was not included in the 2012 FYDP; funding for 2012 has been requested but has not been appropriated.
b. Each category shows the CBO projection of the base budget from 2012 to 2030. That projection incorporates costs that are consistent with the DoD’s recent experience.
c. For the extension of the FYDP (2017 to 2030), CBO projects the costs of DoD’s plans using the department’s estimates of costs to the extent they are available and costs that are consistent with the broader U.S. economy if such estimates are not available.
combat brigades. The AMPVs, which will be based on existing vehicles, will replace the various versions of the M113 armored personnel carriers in the Army’s combat brigades.3 Procurement funding for the new GCVs would begin in 2015, and purchases of at least 100 vehicles per year would begin in 2018. Purchases of AMPVs are scheduled to begin in 2014.
In addition, the Army intends to upgrade its light, medium, and heavy tactical vehicles (trucks). The Army’s
1980 1985 1990 1995 2000 2005 2010 2015 2020 2025 20300
20
40
60
80
100 ActualFYDPPeriod
Beyond theFYDP Period
Missiles andMunitions
AircraftGroundCombat
FYDP
Research, Development, Test, and Evaluation
C4ISR
Missile Defense
Extension of FYDPc
OtherProcurement
OCO Funding(2011–2012)
CBO Projectionb
a
3. The AMPV will be fielded in various versions, many of which will be based on modifications of existing Bradley fighting vehicles. According to current plans, the ambulance version of the AMPV will be based on the Caiman Mine Resistant Armor Protected (MRAP) vehicle.

81 81
GAO Summary of Army E-IBCT Program (3/2011)
GAO, DEFENSE ACQUISITIONS: Key Questions Confront the Army’s Ground Force Modernization Initiatives, March 9, 2011.
• Significant performance shortfalls, particularly system reliability, were revealed during the September 2009 Limited User Test. The pervasive reliability problems in equipment during testing made it difficult to complete a full assessment of performance and the contribution of these systems to military utility.
• Recent limited user tests conducted by the Army and assessed by the Director, Operational Test and Evaluation that were performed during fiscal year 2010 yielded startling results—most Increment 1 systems showed little or no military utility. In response, the Army has terminated several systems and only two were approved for additional procurement— the small unmanned ground vehicle and the network integration kit.
• These events have raised questions about the Army’s process for establishing requirements. And while the small unmanned ground vehicle performed well in tests, the military utility of the costly network integration kit remains in doubt, and the Army has stated that the kit is not a viable, affordable, long term solution. For us, that raises questions about the desirability of continued procurement of the kit.
• Although never clearly defined, E-IBCT Increment 2 was anticipated to include upgrades to Increment 1 systems, continued development of other FCS systems such as the Common Controller and larger unmanned ground vehicles, and further development of elements of the FCS information network.
• Because Increment 1 systems have been deemed to provide little military utility, the Army and DOD
decided to cancel the entire E-IBCT program, which effectively put an end to both increments.
• Nevertheless, the Army continues to assess whether additional investments are warranted in the remaining systems and capabilities from the FCS program.

82 82
GAO Summary of Army GCV Program (3/2011)
GAO, DEFENSE ACQUISITIONS: Key Questions Confront the Army’s Ground Force Modernization Initiatives, March 9, 2011.
• In August 2010, the initial request for proposals for GCV was rescinded because of concerns that the program was pursuing a high-risk strategy, with questionable requirements and little concern for costs.
• In response, the Army issued a revised request for proposals in November 2010 that shifted the focus to more mature technologies to achieve the desired 7-year schedule. This strategy eliminated or reduced many of the requirements cited as unstable or not well understood.
• The Army has now prioritized the GCV requirements into three groups—a “must have” category, a second group of requirements where the Army intends to be flexible in what it accepts, and a third group deferrable to later increments.
• Questions remain about the urgency of the need for the GCV. In its August 2010 report, the Red Team that was convened by the Army questioned the urgency of the need for the GCV within 7 years. The report concluded that the funds that have migrated from the FCS program were driving the events and activities of the program, versus a true capabilities gap.
• Further, the team reported that the Army had not provided the analysis supporting the need to rapidly replace the Bradley vehicle. The Army is currently conducting portfolio reviews across many of its missions.

83
Resource Management, Cost Control, and Strategic Focus as
Partial Solutions
84 84
Bringing Entitlements, Defense Discretionary Spending, Other Discretionary
Spending – and revenues – into a stable, affordable balance
n Requires hard social choices about mandatory spending n Raise age limits, force efficiency and triage, or increase revenues. n Aging population, rising real medical costs pose major national threat. n So does any failure in economic growth.
n Discretionary spending can be cut, but does not solve budget problem. n Real burden of defense on US economy is not a driving factor in historical
terms. But, n Wars are unpopular and projections assume “victory” in 2014. n Perceptions of waste and mismanagement are critical. n Assumes a “one major regional contingency” force structure is enough.

85 85
Creating a Functional System for Tying Strategic Planning to a Working PPBS and Force Planning
System Actually Executed on Time, at the Promised Level, and at the Promised Cost
n Must force system to actually execute plans at projected cost.
n High cost programs have to work. Must stop confusing force multipliers with force degraders.
n Top Down Accountability: “Fish rot from the head down.” n Need real strategies and not concepts: Force plans, personnel
plans, modernization plans, timescales, and costs. n Need to make hard trade-offs, and by mission – not by
service. n Plan annually in rolling five year (ten? fifteen?) periods. n Shift PPBS system away from services to major commands

86 86
Creating a Functional PPBS/QDR/QDDR
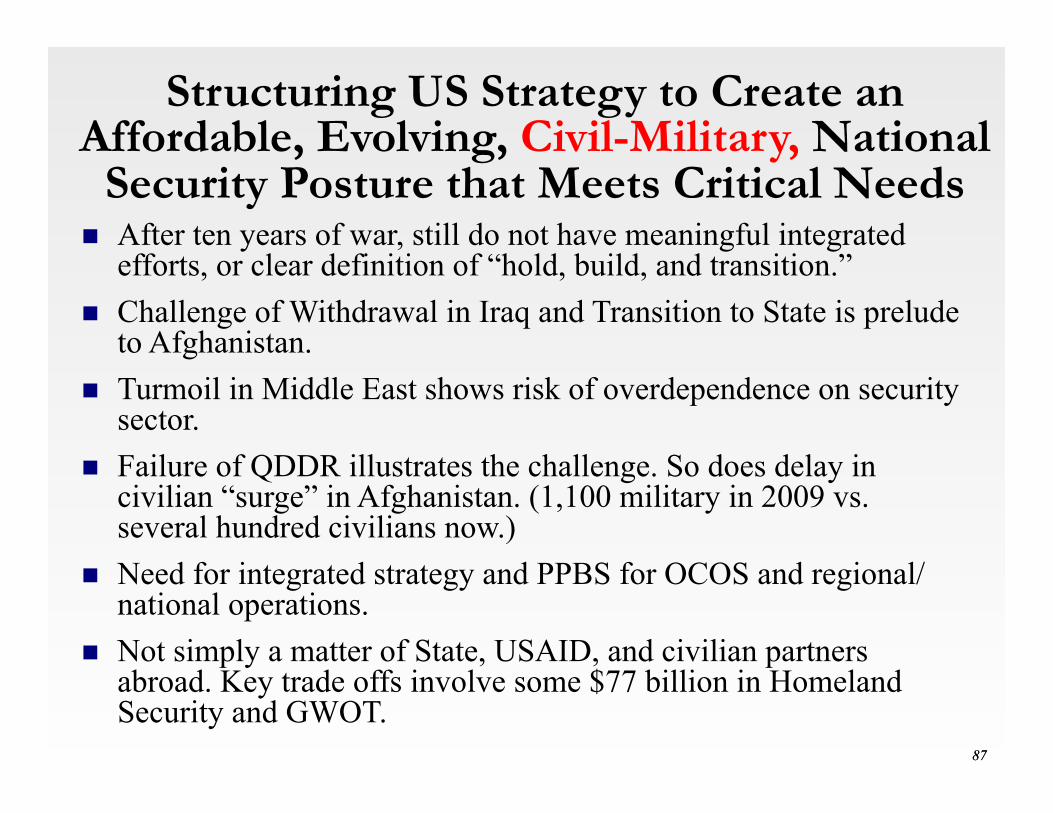
87 87
Structuring US Strategy to Create an
Affordable, Evolving, Civil-Military, National Security Posture that Meets Critical Needs
n After ten years of war, still do not have meaningful integrated efforts, or clear definition of “hold, build, and transition.”
n Challenge of Withdrawal in Iraq and Transition to State is prelude to Afghanistan.
n Turmoil in Middle East shows risk of overdependence on security sector.
n Failure of QDDR illustrates the challenge. So does delay in civilian “surge” in Afghanistan. (1,100 military in 2009 vs. several hundred civilians now.)
n Need for integrated strategy and PPBS for OCOS and regional/national operations.
n Not simply a matter of State, USAID, and civilian partners abroad. Key trade offs involve some $77 billion in Homeland Security and GWOT.

88 88
Finding the Balance Between Irregular/Asymmetric, Conventional, and WMD
Warfare in a Period of Constant Technological Change
n “Hybrid Warfare” is mindless if not tied to force posture and resource choices.
n Nuclear, cyber, biotechnology, weapons of mass effectiveness, increases in strike range, and unconventional delivery all change the map and nature of military power. n Counterproliferation can simply shift the activity to covert
and/or alternative means. n Same with missile defense, preemptive/ preventive strikes.
n Every key US and allied capability, resource dependence, and critical facility redefines the target mix.
n If you can’t ban the crossbow, you have to find an affordable way to live with it.
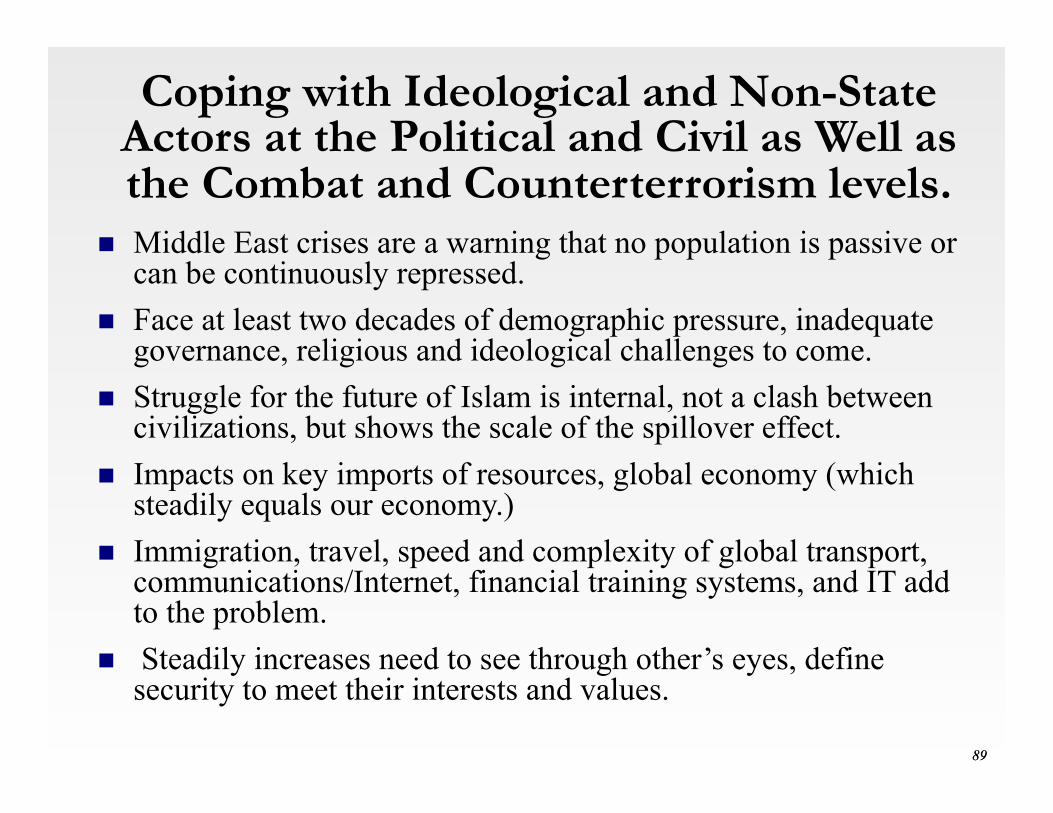
89 89
Coping with Ideological and Non-State
Actors at the Political and Civil as Well as the Combat and Counterterrorism levels.
n Middle East crises are a warning that no population is passive or can be continuously repressed.
n Face at least two decades of demographic pressure, inadequate governance, religious and ideological challenges to come.
n Struggle for the future of Islam is internal, not a clash between civilizations, but shows the scale of the spillover effect.
n Impacts on key imports of resources, global economy (which steadily equals our economy.)
n Immigration, travel, speed and complexity of global transport, communications/Internet, financial training systems, and IT add to the problem.
n Steadily increases need to see through other’s eyes, define security to meet their interests and values.

90 90
Creating a Unified National Security
Budget
n National strategy, defense QDR, State QDDR, and DNI strategies are not coordinated, tied to resources, and linked to coordinated regional and country plans.
n State Department resources are under even more intense budget pressure than DoD at time developments like “Arab Spring” show integrated State-DoD programs are critical.
n Department of Homeland Security alone cost $37 billion in FY2012 budget request. OMB estimates that total cost with DoD and 29 other departments and agencies is $71.6 billion.
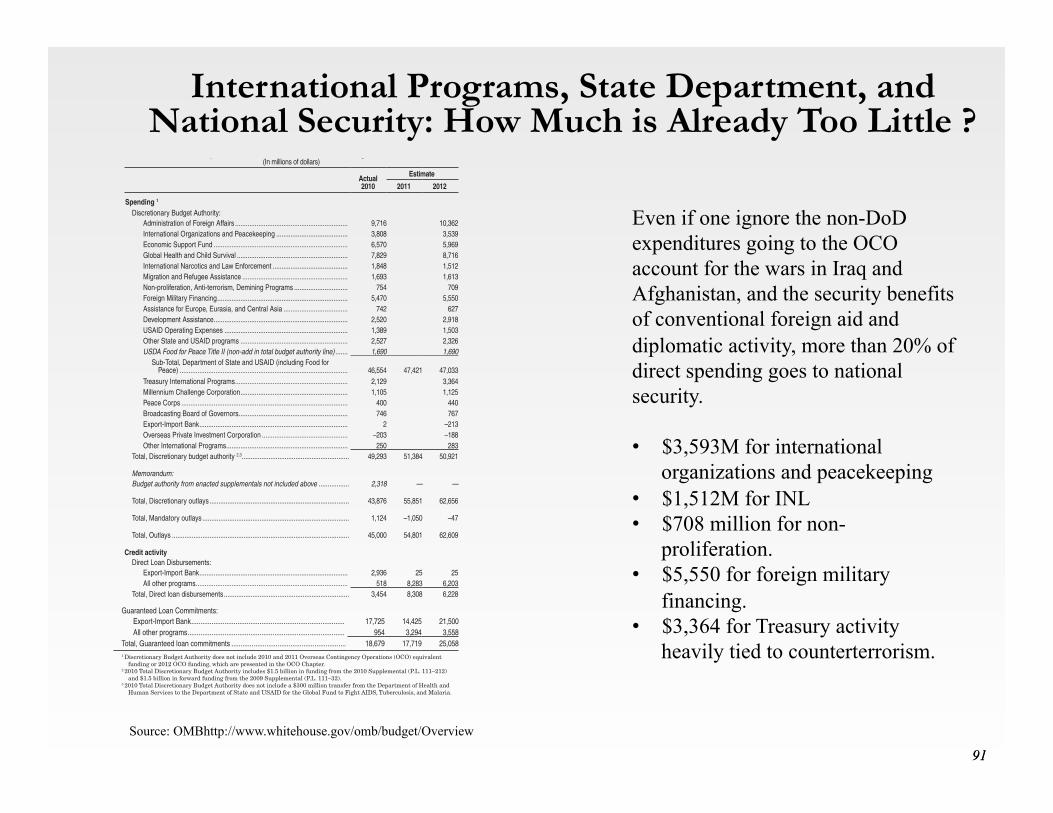
91 91
International Programs, State Department, and
National Security: How Much is Already Too Little ?
Source: OMBhttp://www.whitehouse.gov/omb/budget/Overview
Even if one ignore the non-DoD expenditures going to the OCO account for the wars in Iraq and Afghanistan, and the security benefits of conventional foreign aid and diplomatic activity, more than 20% of direct spending goes to national security. • $3,593M for international
organizations and peacekeeping • $1,512M for INL • $708 million for non-
proliferation. • $5,550 for foreign military
financing. • $3,364 for Treasury activity
heavily tied to counterterrorism.
THE BUDGET FOR FISCAL YEAR 2012 119
Department of State and Other International Programs(In millions of dollars)
Actual 2010
Estimate
2011 2012
Spending 1
Discretionary Budget Authority:Administration of Foreign Affairs ............................................................... 9,716 10,362International Organizations and Peacekeeping ........................................ 3,808 3,539Economic Support Fund ........................................................................... 6,570 5,969Global Health and Child Survival .............................................................. 7,829 8,716International Narcotics and Law Enforcement .......................................... 1,848 1,512Migration and Refugee Assistance ........................................................... 1,693 1,613Non-proliferation, Anti-terrorism, Demining Programs .............................. 754 709Foreign Military Financing ......................................................................... 5,470 5,550Assistance for Europe, Eurasia, and Central Asia .................................... 742 627Development Assistance ........................................................................... 2,520 2,918USAID Operating Expenses ..................................................................... 1,389 1,503Other State and USAID programs ............................................................ 2,527 2,326USDA Food for Peace Title II (non-add in total budget authority line) ....... 1,690 1,690
Sub-Total, Department of State and USAID (including Food for Peace) .............................................................................................. 46,554 47,421 47,033
Treasury International Programs ............................................................... 2,129 3,364Millennium Challenge Corporation ............................................................ 1,105 1,125Peace Corps ............................................................................................. 400 440Broadcasting Board of Governors ............................................................. 746 767Export-Import Bank ................................................................................... 2 –213Overseas Private Investment Corporation ................................................ –203 –188Other International Programs .................................................................... 250 283
Total, Discretionary budget authority 2,3 ............................................................ 49,293 51,384 50,921
Memorandum:Budget authority from enacted supplementals not included above ................. 2,318 — —
Total, Discretionary outlays .............................................................................. 43,876 55,851 62,656
Total, Mandatory outlays .................................................................................. 1,124 –1,050 –47
Total, Outlays ................................................................................................... 45,000 54,801 62,609
Credit activityDirect Loan Disbursements:
Export-Import Bank ................................................................................... 2,936 25 25All other programs ..................................................................................... 518 8,283 6,203
Total, Direct loan disbursements ...................................................................... 3,454 8,308 6,228
120 DEPARTMENT OF STATE AND OTHER INTERNATIONAL PROGRAMS
Department of State and Other International Programs—Continued(In millions of dollars)
Actual 2010
Estimate
2011 2012
Guaranteed Loan Commitments:Export-Import Bank ................................................................................... 17,725 14,425 21,500All other programs ..................................................................................... 954 3,294 3,558
Total, Guaranteed loan commitments .............................................................. 18,679 17,719 25,0581 Discretionary Budget Authority does not include 2010 and 2011 Overseas Contingency Operations (OCO) equivalent
funding or 2012 OCO funding, which are presented in the OCO Chapter.2 2010 Total Discretionary Budget Authority includes $1.5 billion in funding from the 2010 Supplemental (P.L. 111–212)
and $1.5 billion in forward funding from the 2009 Supplemental (P.L. 111–32).3 2010 Total Discretionary Budget Authority does not include a $300 million transfer from the Department of Health and
Human Services to the Department of State and USAID for the Global Fund to Fight AIDS, Tuberculosis, and Malaria.
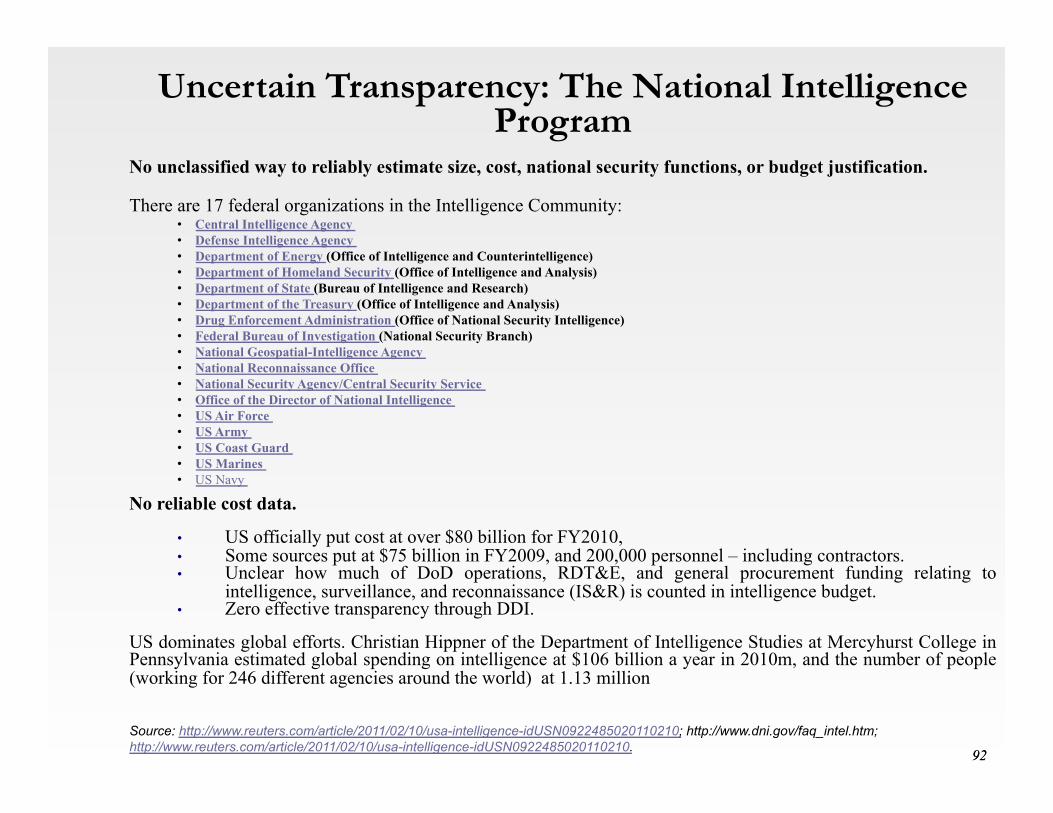
92 92
Uncertain Transparency: The National Intelligence
Program No unclassified way to reliably estimate size, cost, national security functions, or budget justification.
There are 17 federal organizations in the Intelligence Community: • Central Intelligence Agency • Defense Intelligence Agency • Department of Energy (Office of Intelligence and Counterintelligence) • Department of Homeland Security (Office of Intelligence and Analysis) • Department of State (Bureau of Intelligence and Research) • Department of the Treasury (Office of Intelligence and Analysis) • Drug Enforcement Administration (Office of National Security Intelligence) • Federal Bureau of Investigation (National Security Branch) • National Geospatial-Intelligence Agency • National Reconnaissance Office • National Security Agency/Central Security Service • Office of the Director of National Intelligence • US Air Force • US Army • US Coast Guard • US Marines • US Navy
No reliable cost data.
• US officially put cost at over $80 billion for FY2010, • Some sources put at $75 billion in FY2009, and 200,000 personnel – including contractors. • Unclear how much of DoD operations, RDT&E, and general procurement funding relating to
intelligence, surveillance, and reconnaissance (IS&R) is counted in intelligence budget. • Zero effective transparency through DDI.
US dominates global efforts. Christian Hippner of the Department of Intelligence Studies at Mercyhurst College in Pennsylvania estimated global spending on intelligence at $106 billion a year in 2010m, and the number of people (working for 246 different agencies around the world) at 1.13 million
Source: http://www.reuters.com/article/2011/02/10/usa-intelligence-idUSN0922485020110210; http://www.dni.gov/faq_intel.htm; http://www.reuters.com/article/2011/02/10/usa-intelligence-idUSN0922485020110210.
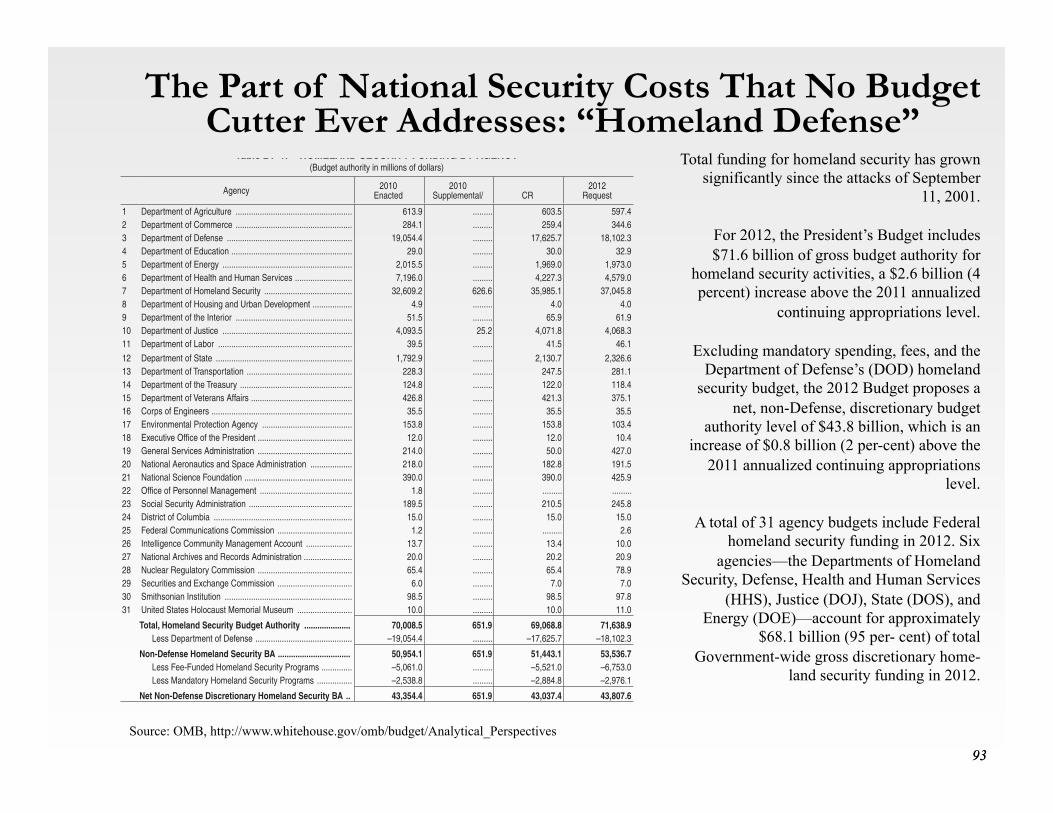
93 93
The Part of National Security Costs That No Budget
Cutter Ever Addresses: “Homeland Defense”
403
Section 889 of the Homeland Security Act of 2002 re-quires that a homeland security funding analysis be in-corporated in the President’s Budget. This analysis ad-dresses that legislative requirement, and covers homeland security funding and activities of all Federal agencies, not only those carried out by the Department of Homeland Security (DHS), as well as State, local, and private sector expenditures. Since not all activities carried out by DHS constitute traditional homeland security funding (e.g. re-sponse to natural disasters and Coast Guard search and
rescue activities), DHS estimates in this section do not encompass the entire DHS budget.
The President’s highest priority is to keep the American people safe. Homeland security budgetary priorities will continue to be informed by careful, government-wide stra-tegic development and review.
Data Collection Methodology and Adjustments
The Federal spending estimates in this analysis uti-lize funding and programmatic information collected
24. HOMELAND SECURITY FUNDING ANALYSIS
Table 24–1. HOMELAND SECURITY FUNDING BY AGENCY(Budget authority in millions of dollars)
Agency 2010Enacted
2010Supplemental/ CR
2012Request
1 Department of Agriculture ..................................................... 613.9 ......... 603.5 597.4 2 Department of Commerce ..................................................... 284.1 ......... 259.4 344.6 3 Department of Defense ......................................................... 19,054.4 ......... 17,625.7 18,102.3 4 Department of Education ....................................................... 29.0 ......... 30.0 32.9 5 Department of Energy ........................................................... 2,015.5 ......... 1,969.0 1,973.0 6 Department of Health and Human Services .......................... 7,196.0 ......... 4,227.3 4,579.0 7 Department of Homeland Security ........................................ 32,609.2 626.6 35,985.1 37,045.8 8 Department of Housing and Urban Development .................. 4.9 ......... 4.0 4.0 9 Department of the Interior ..................................................... 51.5 ......... 65.9 61.9 10 Department of Justice ........................................................... 4,093.5 25.2 4,071.8 4,068.3 11 Department of Labor ............................................................. 39.5 ......... 41.5 46.1 12 Department of State .............................................................. 1,792.9 ......... 2,130.7 2,326.6 13 Department of Transportation ................................................ 228.3 ......... 247.5 281.1 14 Department of the Treasury ................................................... 124.8 ......... 122.0 118.4 15 Department of Veterans Affairs .............................................. 426.8 ......... 421.3 375.1 16 Corps of Engineers ................................................................ 35.5 ......... 35.5 35.5 17 Environmental Protection Agency ......................................... 153.8 ......... 153.8 103.4 18 Executive Office of the President ........................................... 12.0 ......... 12.0 10.4 19 General Services Administration ........................................... 214.0 ......... 50.0 427.0 20 National Aeronautics and Space Administration ................... 218.0 ......... 182.8 191.5 21 National Science Foundation ................................................. 390.0 ......... 390.0 425.9 22 Office of Personnel Management .......................................... 1.8 ......... ......... ......... 23 Social Security Administration ............................................... 189.5 ......... 210.5 245.8 24 District of Columbia ............................................................... 15.0 ......... 15.0 15.0 25 Federal Communications Commission .................................. 1.2 ......... ......... 2.6 26 Intelligence Community Management Account ..................... 13.7 ......... 13.4 10.0 27 National Archives and Records Administration ...................... 20.0 ......... 20.2 20.9 28 Nuclear Regulatory Commission ........................................... 65.4 ......... 65.4 78.9 29 Securities and Exchange Commission .................................. 6.0 ......... 7.0 7.0 30 Smithsonian Institution .......................................................... 98.5 ......... 98.5 97.8 31 United States Holocaust Memorial Museum ......................... 10.0 ......... 10.0 11.0
Total, Homeland Security Budget Authority ..................... 70,008.5 651.9 69,068.8 71,638.9 Less Department of Defense ............................................ –19,054.4 ......... –17,625.7 –18,102.3
Non-Defense Homeland Security BA ................................. 50,954.1 651.9 51,443.1 53,536.7 Less Fee-Funded Homeland Security Programs .............. –5,061.0 ......... –5,521.0 –6,753.0 Less Mandatory Homeland Security Programs ................ –2,538.8 ......... –2,884.8 –2,976.1
Net Non-Defense Discretionary Homeland Security BA .. 43,354.4 651.9 43,037.4 43,807.6
Source: OMB, http://www.whitehouse.gov/omb/budget/Analytical_Perspectives
Total funding for homeland security has grown significantly since the attacks of September
11, 2001.
For 2012, the President’s Budget includes $71.6 billion of gross budget authority for
homeland security activities, a $2.6 billion (4 percent) increase above the 2011 annualized
continuing appropriations level.
Excluding mandatory spending, fees, and the Department of Defense’s (DOD) homeland
security budget, the 2012 Budget proposes a net, non-Defense, discretionary budget
authority level of $43.8 billion, which is an increase of $0.8 billion (2 per-cent) above the
2011 annualized continuing appropriations level.
A total of 31 agency budgets include Federal
homeland security funding in 2012. Six agencies—the Departments of Homeland
Security, Defense, Health and Human Services (HHS), Justice (DOJ), State (DOS), and
Energy (DOE)—account for approximately $68.1 billion (95 per- cent) of total
Government-wide gross discretionary home- land security funding in 2012.