Embed Size (px)
Citation preview

The diversity and abundance of gelatinous
zooplankton in north-western Australia and the
association of Ophiocnemis marmorata
(Echinodermata: Ophiuroidea) with Aurelia aurita
(Cnidaria: Scyphozoa)
By
Brooke Ingram, BSc.
A Thesis submitted as partial fulfilment for
The Degree of Bachelor of Science (Honours)
in
The Griffith School of Environment
Griffith University, Gold Coast Campus, Queensland
Supervisor:
A/Prof Kylie Pitt
27th October 2015
Content Abstract .......................................................................................................................... i
Acknowledgements ...................................................................................................... iii
Statement of originality ................................................................................................. v
Chapter 1: General Introduction .................................................................................... 1
1.1 Diversity and abundance of gelatinous zooplankton ...................................... 1
1.2 Identification of gelatinous zooplankton ........................................................ 1
1.3 Ecological role of medusae in pelagic ecosystems ......................................... 3
1.4 General objectives .......................................................................................... 5
Chapter 2: The diversity and abundance of gelatinous zooplankton found off the central
coast of Western Australia ............................................................................................ 6
2.1 Introduction ........................................................................................................ 6
2.1.1 Global spread of data on abundance and diversity of gelatinous zooplankton 6
2.1.2 Methods needed to comprehensively sample gelatinous zooplankton ....... 9
2.1.3 Genes needed for the molecular identification of gelatinous zooplankton . 9
2.1.4 Genetic analyses identify cryptic species of Aurelia medusae and introductions
of invasive species ................................................................................................... 11
2.1.5 Objectives ................................................................................................. 12
2.2 Methods ............................................................................................................ 13
2.2.1 Sampling sites ........................................................................................... 13
2.2.2 Methods used to sample within the lagoon of Ningaloo Reef .................. 14
2.2.3 Methods used to sample outside the lagoon of Ningaloo Reef ................. 14
2.2.4 Morphological identification .................................................................... 15
2.2.5 Processing samples for genetic analyses................................................... 15
2.2.6 Species identification and phylogenetic analyses for Ningaloo Reef specimens
16
2.2.7 Aurelia sp. phylogeographic analysis ....................................................... 17
2.3 Results .............................................................................................................. 19
2.3.1 Abundance of gelatinous zooplankton inside the lagoon of Ningaloo Reef19
2.3.2 Presence-absence data for gelatinous zooplankton found outside the lagoon of
Ningaloo Reef .......................................................................................................... 20
2.3.3 Analysis of phylogenetic relationships among medusae specimens ......... 21
2.3.4 Phylogeographic analysis of Aurelia sp. based on molecular data ........... 26
2.4 Discussion ........................................................................................................ 28
2.4.1 Gelatinous zooplankton abundance in north-west Western Australia ...... 28
2.4.2 Species identification and relatedness as indicated by mitochondrial DNA
sequence similarity and phylogenetic analyses ....................................................... 29
2.4.3 Aurelia aurita specimens from Ningaloo Reef are endemic .......................... 30
2.5 Conclusion ............................................................................................................. 32
Chapter 3: Commensal associations Aurelia aurita (Cnidaria: Scyphozoa) and
Ophiocnemis marmorata ............................................................................................. 33
3.1 Introduction ...................................................................................................... 33
3.1.1 Associations between echinoderms and medusae ..................................... 33
3.1.2 Evidence needed to assess whether organisms are feeding on their medusa host
35
3.1.3 Aims and Hypotheses ............................................................................... 38
3.2 Methods ............................................................................................................ 39
3.2.1 Frequency of association and relationship between medusae size and number of
ophiuroids ................................................................................................................ 39
3.2.2 Collection of ophiuroids, medusae and other potential prey .................... 39
3.2.3 Sample processing .................................................................................... 40
3.2.4 Stable isotope analysis .............................................................................. 41
3.2.5 Statistical analyses .................................................................................... 41
3.3 Results .............................................................................................................. 43
3.3.1 Size-frequency distribution of medusae with and without ophiuroids and
relationship between medusae size and density of ophiuroids ................................ 43
3.3.2 Dietary composition of Ophiocnemis marmorata defined by stable isotope
analysis…………………………………………………………………………….46
3.4 Discussion ........................................................................................................ 50
3.4.1 The association between O. marmorata and A. aurita ............................. 50
3.4.2 Food sources of Ophiocnemis marmorata associating with Aurelia aurita are
largely plankton-based ............................................................................................. 53
3.5 Conclusion ........................................................................................................ 54
Chapter 4: General Discussion .................................................................................... 56
References ................................................................................................................... 58
Appendices .................................................................................................................. 70

List of figures
Figure 1: Derived from Condon et al. (2012). Distribution of the Jellyfish Database Initiative
(JEDI) metadata sets. Metadata of gelatinous zooplankton includes quantitative (green),
categorical (yellow), presence-absence (red) and presence-only (light blue). North-west
Western Australia is lacking in all types of metadata compared to other regions around the
world. ......................................................................................................................................... 7
Figure 2: Locations of sampling sites. Sites within the lagoon are represented by yellow
circles while sites outside the lagoon are represented by red circles. ...................................... 13
Figure 3: Mean (± SE) overall and species abundance per 100 m3 of gelatinous zooplankton
relative to time of year. Specimens were sampled within the lagoon of Ningaloo Reef. Light
grey bars represent overall mean (± SE) abundance. Species mean (± SE) abundance are
indicated by data labels above corresponding bars………………………………………….19
Figure 4: Maximum-Likelihood phylogenetic tree based on the mitochondrial gene 16S, a
large subunit ribosomal RNA, for specimens found at Ningaloo Reef. Bootstrap values (1000
replicates) reflect the percentage of trees in which the associated taxa clustered together and
are shown at each node. Class lineages are indicated. Scale bar represents evolutionary time.
.................................................................................................................................................. 25
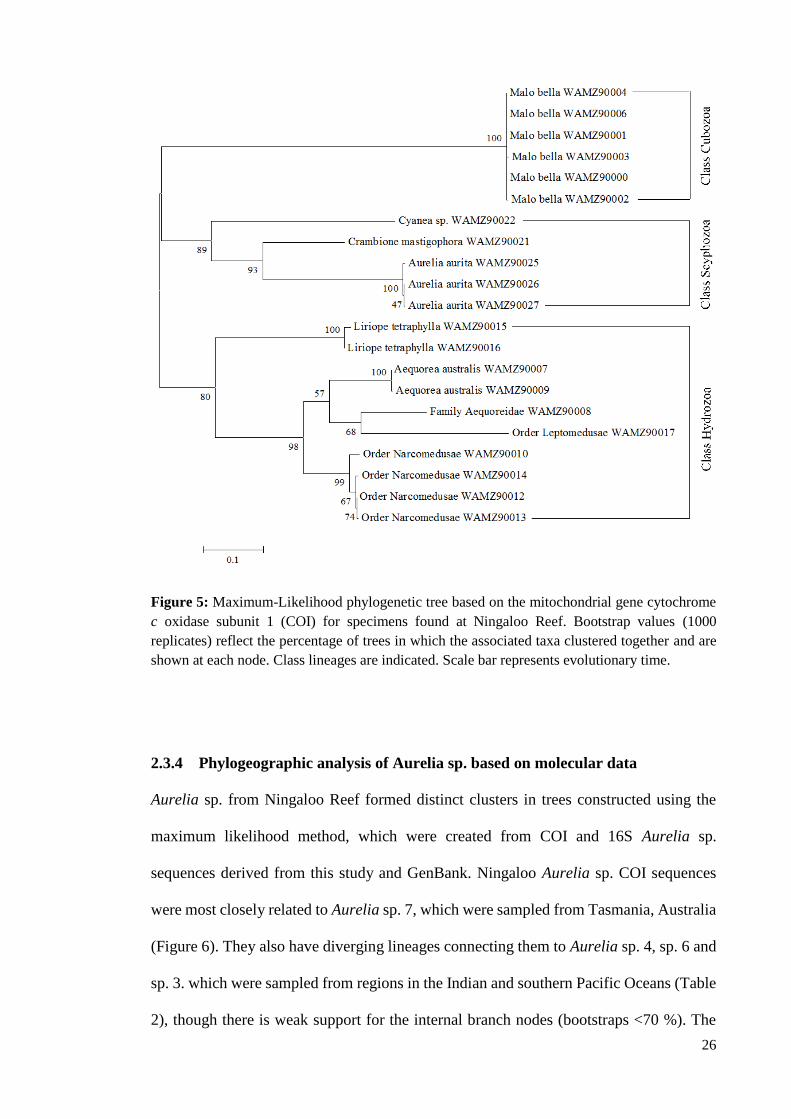
Figure 5: Maximum-Likelihood phylogenetic tree based on the mitochondrial gene
cytochrome c oxidase subunit 1 (COI) for specimens found at Ningaloo Reef. Bootstrap
values (1000 replicates) reflect the percentage of trees in which the associated taxa clustered
together and are shown at each node. Class lineages are indicated. Scale bar represents
evolutionary time. .................................................................................................................... 26

Figure 6: Maximum-Likelihood phylogenetic tree for Aurelia sp. from Ningaloo Reef and
other regions (see Table 2), based on the mitochondrial gene cytochrome c oxidase 1 (COI).
Bootstrap values (1000 replicates) reflect the percentage of trees in which the associated taxa
clustered together and are shown at each node. Scale bar represents evolutionary time. ........ 27
Figure 7: Photo courtesy of 3 Islands (Whale Shark Tourism Operator). O. marmorata riding
on an A. aurita medusa (Ningaloo Reef). The ophiuroids are attached to the underside of the
bell, sitting underneath the oral arms. ...................................................................................... 43
Figure 8: Size-frequency distribution of ophiuroids associated with A. aurita medusae
captured in June 2015 on Ningaloo Reef (N = 217). ............................................................... 44
Figure 9: Size-frequency distribution of A. aurita medusae; medusae not associated with
ophiuroids (white bars, N = 19) and medusae associated with ophiuroids (black bars, N =
73), captured in June 2015 on Ningaloo Reef.......................................................................... 45
Figure 10: Relationship between size of medusae (mm) and density of associating
ophiuroids. ............................................................................................................................... 45
A comparison of δ13C and δ15N values showed isotopic differences between O. marmorata
and their medusa hosts (A. aurita) (Figure 11). O. marmorata were enriched in 13C by ca.
1.3‰ compared to their hosts, and were enriched in 15N by ca. 0.2 ‰ (Figure 11, Table 8). 46
Figure 11: Isotopic biplot showing variation in mean (±SD) δ13C and δ15N (‰) values
calculated for Ophiocnemis marmorata and key food sources potentially contributing to O.
marmorata diet: Aurelia aurita, mesozooplankton (500 µm, 300 µm and 100 µm size classes)
and seston (phytoplankton and particulate organic matter). .................................................... 46

Figure 12: Percentage contribution of each source to the assimilated diet of Ophiocnemis
marmorata with A standard TEF values (Post, 2002), B ophiuroid-specific TEF values
(Blanchet-Aurigny et al., 2012), C positively modified ophiuroid-specific TEF values (+0.5
to values) and D negatively modified ophiuroid-specific TEF values (-0.5 from values). Grey
scale (from light to dark) indicates 95, 75 and 50% confidence intervals, respectively. ........ 49

List of tables
Table 1: Primers and cycling conditions for mitochondrial gene sequences 16S and COI. ... 16
Table 2: Aurelia sp. sequences derived from NCIB GenBank and the regions in which they
were sampled from. .................................................................................................................. 18
Table 3: Presence of gelatinous species outside the lagoon of Ningaloo Reef from April to
July. Ticks represent sightings of a particular species on a given sampling week. Month of
sampling (from April to July) is indicated by light to dark grey scale shading and month
column...................................................................................................................................... 20
Table 4: Results of GenBank megablast 16S sequence similarity search for species
identification of Ningaloo Reef specimens. Rows highlighted in light grey indicate confirmed
species identifications (E-value 0.0, ≥ 90% sequence identity). Rows highlighted in dark grey
indicate species for which GenBank 16S sequences do not exist, so direct comparison to
species sequences was not possible. Species in column “megablast species identification”
represent most closely-related species. .................................................................................... 22
Table 5: Results of GenBank megablast COI sequence similarity search for species
identification of Ningaloo Reef specimens. Rows highlighted in light grey indicate confirmed
species identifications (E-value 0.0, ≥ 90% sequence identity). Rows highlighted in dark grey
indicate species for which GenBank COI sequences do not exist, so direct comparison to
species sequences was not possible. Species in column “megablast species identification”
represent most closely-related species. .................................................................................... 23
Table 6: Host rhizostome medusae associated with Ophiocenmis marmorata. ..................... 34

Table 7: Trophic enrichment factors (TEFs) used for SIAR analyses to assess the
contribution of each source to the diet of O. marmorata. ........................................................ 42
Table 8: Mean (±SD) δ13C and δ15N for O. marmorata and potential prey. .......................... 46
Table 9: One-way ANOVA of differences between acidified and untreated δ15N samples. .. 47
Table 10: One-way ANOVA of differences in δ13C and δ13N of all samples among sites. ... 48

i
Abstract
Gelatinous zooplankton are ubiquitous throughout the world’s oceans, yet data on their
abundance and diversity are scarce in the Indian Ocean, and in particular north-western
Australia. Gelatinous fauna can be identified using morphological or genetic approaches,
though genetic data provide more information to discriminate among species when
morphology alone cannot. Moreover, a number of gelatinous species form commensal
relationships with other organisms, which possibly enhances local pelagic biodiversity.
The aims of this study were to: (1) assess the diversity and abundance of gelatinous
zooplankton in north-western Australia; (2) use morphological and genetic approaches to
identify unknown specimens from an under-sampled area; (3) use molecular approaches
to assess whether an abundant gelatinous species which is highly invasive, was native or
invasive in the study region; and (4) investigate a novel association between medusae and
ophiuroids by assessing ophiuroid diet from stable isotope analysis and whether
frequency of association was correlated with medusa size.
Underwater visual surveys (UVS) were used to measure abundance of gelatinous
zooplankton 48 times between April and July in the northern region of Ningaloo Reef,
Western Australia. Samples for genetic analyses were collected opportunistically offshore
and during UVSs and were later sequenced for 16S and COI genes. The ophiuroid
Ophiocnemis marmorata associated with an abundant species of medusa, Aurelia aurita,
and was sampled for investigations into diet and size relationship with medusae. Ninety-
two medusae with ophiuroids were collected over eight sites and the size of medusae and
ophiuroids was measured. Thirty medusae with ophiuroids were sampled from each of
two sites and potential planktonic prey were collected from each site by conducting four
plankton tows for mesozooplankton and four plankton tows for seston at each site. Stable
isotope analysis was used to assess whether O. marmorata fed upon their gelatinous hosts.

ii
The diet of O. marmorata was modelled under four different trophic enrichment factors
(TEFs) using the Bayesian mixing model Stable Isotope Analysis in R (SIAR).
Gelatinous zooplankton were present from April to July and morphological and genetic
approaches together identified eight species of gelatinous zooplankton, one of which was
M. bella, a dangerous cubozoan species. Phylogeopgraphic analyses indicated Aurelia
aurita, an abundant scyphozoan species, was native to the north-west Australian region.
O. marmorata commonly associated with large A. aurita medusae. All four SIAR models
revealed plankton food sources form on average up to ~65% of the diet of O. marmorata
while host medusae provided on average 0 – 10%. This suggests medusae present a
platform for ophiuroid feeding and consequently may hold a significant role in the
enhancement of biodiversity in pelagic communities. Future research should focus on
rigorous sampling of under-sampled regions such as north-western Australia and the
Indian Ocean to potentially uncover more associations between medusae and other
organisms and to provide a more comprehensive assessment of the diversity and
abundance of gelatinous species in this region.

iii
Acknowledgements
The work presented in this thesis would not have been possible without the help of many
people at Griffith University, the Department of Parks and Wildlife (WA), the Western
Australian Museum, Ocean Eco Adventures and the University of California in Davis
(USA).
Firstly, I would like to thank Associate Professor Kylie Pitt, for her endless support and
guidance in every aspect of this project. Though we were separated by an entire country,
she never failed to provide me with sound advice and insight into how to be a scientific
researcher. I will forever be indebted to her for the knowledge and skills she has passed
on through her mentoring.
I would like to thank Dr Pete Barnes, who was at times more excited about jellyfish than
I was. Through the Department of Parks and Wildlife in Exmouth, Pete provided me with
the resources to flourish as a researcher, and through his enthusiasm for all things
jellyfish, kept me inspired throughout the project. I would also like to thank Pete’s wife,
Heather, for welcoming me into their home and their lives.
To the Department of Parks and Wildlife in Exmouth itself, and the people who work
there, thank you for allowing me to turn the Ningaloo turtle program room into a jellyfish
lab, and providing me with endless resources. I would like to give a special mention, in
no particular order, to Joe Morgan, Grant Griffin, Dani Rob, Arvid Hogstrom, Teresa
Edgecombe, Dave Lierich, Huey Dilley, Alana Whitford and Kristen Wren for taking me
out on patrol to catch jellyfish and providing me with cars and other resources.
I am extremely grateful to Jimmy Small, owner of Ocean Eco Adventures, for allowing
me to come on his whale shark boat, sometimes at very late notice, and collect jellyfish
samples. You embraced me as if I were a seasoned crew member, and were always
iv
accommodating of my need to collect jellyfish, even if it usually took longer than I told
you it would. To the rest of the crew, thank you for helping me catch jellyfish, taking
stunning photos of jellyfish, and most importantly, for becoming my friends.
Sequencing for this work was supported by the Net Conservation Benefits Fund awarded
to the Western Australian Museum. In particular, I would like to thank Dr Nerida Wilson
for her collaboration on the project, as without her, half of this project would not have
been possible. I would also like to thank Mark Salotti, for receiving my voucher
specimens and being very helpful.
I would like to express my gratitude towards Associate Professor Michael Dawson, who
provided guidance for the genetic analyses. Thank you to Bastian Bentlage who also
provided guidance for genetic analyses, and collaborated with Michael Dawson and
Nerida Wilson during the DNA sequencing process.
Thank you to Frazer MacGregor for loaning various lab equipment. Without you I would
not have had a functioning lab.
I would also like to express my appreciation for my fellow Honours students, Vicky
Thomson, James Cifuentes, Sophie Doell, Beth Holzapfel, Dylan Farr and Jacob Dawood,
for the support and sanity you have provided throughout Honours.
Finally, this project is supported through funding from the Australian Government’s
Australian Biological Resources Study (ABRS) National Taxonomy Research Grant
Programme (NTRGP) and through funding from the Australian Rivers Institute and the
School of Environment, Griffith University.

v
Statement of originality
The material submitted in this thesis has not been previously submitted for a degree or
diploma in any university, and to the best of my knowledge contains no material
previously published or written by another person except where due acknowledgement is
made in the thesis itself.
___________________________________
Signed: Brooke Ingram
Date: 27th October 2015

1
Chapter 1: General Introduction
1.1 Diversity and abundance of gelatinous zooplankton
Gelatinous zooplankton, which comprise medusae, ctenophores and salps, are ubiquitous
in the world’s oceans and estuaries (Lilley et al., 2011, Lucas et al., 2014). They are often
conspicuous components of coastal and open-ocean ecosystems (Richardson et al., 2009)
due to the propensity of many species to form blooms (Lucas et al., 2014). Gelatinous
zooplankton are often short-lived, grow rapidly and are distributed patchily and so often
seem to suddenly appear and disappear in the marine environment (Graham et al., 2001).
Research into gelatinous zooplankton has increased recently over concern of rising
populations in some perturbed areas around the world (Pauly et al., 2009, Richardson et
al., 2009). Little information exists, however, about the ecology of gelatinous
zooplankton and the processes that regulate their population dynamics, despite the
increasing interest in this group of marine zooplankton (Dawson and Hamner, 2009,
Lilley et al., 2011, Mills, 2001). Determining the diversity and abundance of gelatinous
zooplankton is an essential step towards understanding the ecology of these species and
monitoring changes in the population dynamics of gelatinous zooplankton in global ocean
ecosystems.
1.2 Identification of gelatinous zooplankton
Studies on the diversity of gelatinous zooplankton in Australia are quite scarce.
Gelatinous fauna are relatively poorly described and most have been identified using
morphological characters (Gershwin and Hannay, 2014 but see Dawson 2005a).
However, morphological identification of gelatinous species can be problematic,
especially if identification is made from a preserved specimen (Bentlage et al., 2010). As
gelatinous zooplankton have extremely high water contents (≥ 95%) and no robust
structural features or hard coverings (Thibault-Botha and Bowen, 2004), they tend to

2
shrink more than other zooplankton when preserved in chemical solutions (formaldehyde,
chloroform and ethanol) (Condon et al., 2012, Mutlu, 1996, Thibault-Botha and Bowen,
2004). This can lead to misinterpretations of diagnostic features in preserved specimens
(Bentlage et al., 2010).
Ambiguities in identifications based solely on morphology can often be resolved by
genetic analyses which in turn can reveal much greater taxonomic diversity than
morphology alone (Bayha and Dawson, 2010). Some gelatinous zooplankton have been
misidentified using diagnostic morphological features but have later been correctly
identified as different species when analysed genetically (Bentlage et al., 2010). For
example, conflicting views over the validity of some medusae species in the genus Alatina
(Cubozoa) led to the revision of two nominal Alatina species into one (Bentlage, 2010,
Bentlage et al., 2010). Specifically, Alatina mordens (Gershwin, 2005a) from the Coral
Sea and A. moseri (Mayer, 1906) from Hawaii were described as two distinct species
using morphological features (Gershwin, 2005a); however Bentlage et al. (2010)
subsequently found no genetic divergences corresponding to the species’ locality. Thus,
based on molecular genetic data (the mitochondrial 16S gene), these two cubozoans
represented a single species in the genus Alatina, with a well-mixed population with
regular gene flow (Bentlage, 2010, Bentlage et al., 2010).
The identification of cryptic gelatinous species has made possible through genetic
analyses (Holland et al., 2004, Lee et al., 2013), where cryptic refers to species that are
challenging or impossible to differentiate using morphological features alone (Holland et
al., 2004). For example, nuclear and mitochondrial DNA sequences have provided
evidence of seven sibling species of the scyphozoan medusa, Aurelia aurita, and two
additional species, Aurelia limbata and Aurelia labiata (Dawson and Jacobs, 2001).
Furthermore, genetic data have recognised six scyphozoan species in the genus
Cassiopea, with five of those species being genetically distinct but morphologically

3
cryptic (Holland et al., 2004). Genetic analyses can also be used to identify introductions
of invasive cryptic species and assess the potential geographic sources of large
populations of gelatinous species through the application of phylogenetic and
phylogeographic studies (Lee et al., 2013).
Genetic data allow for phylogenetic reconstruction independent of morphological
features and provide many additional characters for analysis (Dawson, 2004, Hillis and
Wiens, 2000). On the other hand, traditional morphological approaches to taxonomic
characterisation of gelatinous zooplankton is necessary to facilitate reliable family- or
genus-level identifications by non-specialists (Bentlage, 2012). Therefore, by combining
genetic and morphological techniques, the most robust approach to identifying species
can be employed (Dawson, 2005b). This approach may potentially resolve some of the
taxonomic confusion that exists for gelatinous zooplankton in Australia and avoid
misidentification of gelatinous species (Bentlage et al., 2010).
1.3 Ecological role of medusae in pelagic ecosystems
Despite little being known about the ecology of gelatinous zooplankton, there is evidence
that large aggregations of medusae (jellyfish), may provide a number of ecosystem
services to pelagic ecosystems (Doyle et al., 2014). For example, medusae provide a food
source to many species of fish (Pauly et al., 2009), and are the main food source for some
large predators such as the leatherback turtle, Dermochelys coriacea (Houghton et al.,
2006). A number of organisms are also reported to associate with medusae as they provide
a pelagic substrate for benthic organisms, or offer protection from predation (Ohtsuka et
al., 2009). For example, many juvenile fish species shelter among the oral arms or
underneath the bell of medusae and some feed on the prey and parasites of medusae
(Lynam and Brierley, 2007), or the medusae themselves (D’Ambra et al., 2015). The
presence of blooms of medusae in ecosystems can facilitate the survival of some species,
and thus enhance local biodiversity in pelagic communities (Doyle et al., 2014).
4
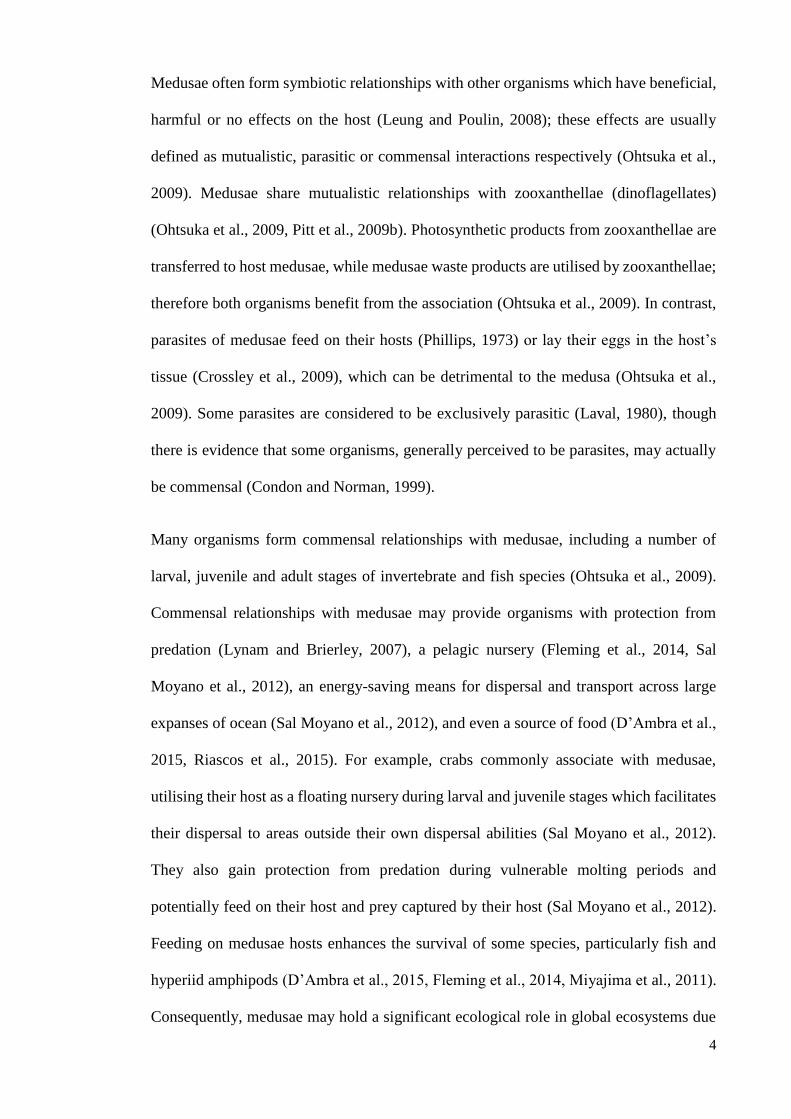
Medusae often form symbiotic relationships with other organisms which have beneficial,
harmful or no effects on the host (Leung and Poulin, 2008); these effects are usually
defined as mutualistic, parasitic or commensal interactions respectively (Ohtsuka et al.,
2009). Medusae share mutualistic relationships with zooxanthellae (dinoflagellates)
(Ohtsuka et al., 2009, Pitt et al., 2009b). Photosynthetic products from zooxanthellae are
transferred to host medusae, while medusae waste products are utilised by zooxanthellae;
therefore both organisms benefit from the association (Ohtsuka et al., 2009). In contrast,
parasites of medusae feed on their hosts (Phillips, 1973) or lay their eggs in the host’s
tissue (Crossley et al., 2009), which can be detrimental to the medusa (Ohtsuka et al.,
2009). Some parasites are considered to be exclusively parasitic (Laval, 1980), though
there is evidence that some organisms, generally perceived to be parasites, may actually
be commensal (Condon and Norman, 1999).
Many organisms form commensal relationships with medusae, including a number of
larval, juvenile and adult stages of invertebrate and fish species (Ohtsuka et al., 2009).
Commensal relationships with medusae may provide organisms with protection from
predation (Lynam and Brierley, 2007), a pelagic nursery (Fleming et al., 2014, Sal
Moyano et al., 2012), an energy-saving means for dispersal and transport across large
expanses of ocean (Sal Moyano et al., 2012), and even a source of food (D’Ambra et al.,
2015, Riascos et al., 2015). For example, crabs commonly associate with medusae,
utilising their host as a floating nursery during larval and juvenile stages which facilitates
their dispersal to areas outside their own dispersal abilities (Sal Moyano et al., 2012).
They also gain protection from predation during vulnerable molting periods and
potentially feed on their host and prey captured by their host (Sal Moyano et al., 2012).
Feeding on medusae hosts enhances the survival of some species, particularly fish and
hyperiid amphipods (D’Ambra et al., 2015, Fleming et al., 2014, Miyajima et al., 2011).
Consequently, medusae may hold a significant ecological role in global ecosystems due

5
to the diverse array of relationships they form with other organisms, which can lead to
enhanced biodiversity in the ecosystem (Doyle et al., 2014).
1.4 General objectives
The objectives of this thesis were (1) to assess the diversity and abundance of gelatinous
zooplankton in an area where they are known to bloom, but data are lacking, (2) use
morphological and genetic analyses to create the most robust species identifications of
unknown specimens from an under-sampled area, and (3) assess the role of medusae in
the facilitation of biodiversity in pelagic communities. This will add to data needed to
reliably assess the global abundance and diversity of gelatinous zooplankton and provide
support for the inclusion of gelatinous zooplankton in ecosystem models.

6
Chapter 2: The diversity and abundance of gelatinous zooplankton
found off north-western Australia
2.1 Introduction
2.1.1 Global spread of data on abundance and diversity of gelatinous zooplankton
Global estimates of gelatinous zooplankton abundance and biomass are generally limited,
mostly due to unbalanced spatial coverage of data across the globe (Lucas et al., 2014).
There are some areas known to be inhabited by gelatinous zooplankton, but data has yet
to be published (Lilley et al., 2011), creating a void in the distribution of data available
for abundance and biomass estimates. Currently, the Jellyfish Database Initiative (JeDI)
is developing a scientifically coordinated global gelatinous zooplankton database to
assess historical, current and future trends in gelatinous zooplankton global abundance
(Condon et al., 2012, Lucas et al., 2014). Figure 1 shows the distribution of JeDI metadata
sets, however most data are presence only or presence/absence rather than quantitative
estimates of abundance (Condon et al., 2012). In particular, there appears to be limited
data for the Southern Hemisphere, despite gelatinous zooplankton known to be abundant
there (Lucas et al., 2014). Furthermore, Lucas et al. (2014) indicated that under-sampling
of the Southern Hemisphere has resulted in biased estimates of global patterns of
gelatinous zooplankton biomass, with whole regions having almost no data for gelatinous
zooplankton.
Quantitative data on the abundance of gelatinous zooplankton are particularly limited in
the Indian Ocean (Condon et al., 2012) (Figure 1) and although presence-absence data
have been recorded, they do not give estimates of the quantity of gelatinous zooplankton
inhabiting this region. Moreover, despite the abundance and frequency of blooms in this

7
region, there is a paucity of data relating to gelatinous zooplankton from the north-west
coast of Australia (Condon et al., 2012) (Figure 1).
Figure 1: Derived from Condon et al. (2012). Distribution of the Jellyfish Database Initiative
(JEDI) metadata sets. Metadata of gelatinous zooplankton includes quantitative (green),
categorical (yellow), presence-absence (red) and presence-only (light blue). North-west Western
Australia is lacking in all types of metadata compared to other regions around the world.
According to SeaLifeBase (www.sealifebase.org), there are potentially 38 species of
gelatinous zooplankton that may occur in Western Australian waters. Of those, thirteen
are endemic to the eastern Indian Ocean, and only four species have been described
directly from locations found along the north-west Australian coast (Gershwin, 2005b,
Gershwin, 2005c, Gershwin, 2014). Despite sightings of large blooms of gelatinous
zooplankton at Ningaloo Reef (P. Barnes, 2014, pers. comm.), which is part of the North
West Cape peninsula (Morton, 2003), only one species, a cubozoan, has been described
from this region (see Gershwin, 2014). This could be due to a number of reasons,
including the difficulty associated with sampling gelatinous organisms, the use of
sampling techniques biased toward non-gelatinous taxa, or environmental drivers such as
food availability and temperature gradients causing gelatinous zooplankton to
sporadically appear and disappear (Lucas et al., 2014). Regardless, the scarcity of
Australia

8
information available for gelatinous zooplankton along the north-western coast of
Australia needs to be addressed.
Western Australia has a variety of pristine natural areas, many of which have gained
international recognition (Wood and Glasson, 2005). For example, Ningaloo Reef, which
extends from Carnarvon to Exmouth in Western Australia (Wood and Glasson, 2005), is
Australia’s longest fringing reef (Cassata and Collins, 2008) and has gained World
Heritage listing due to the high diversity of marine species supported by the relatively
pristine and intact marine and coastal environments (Catlin et al., 2012). Ningaloo Reef
has a low human population density due to its remote location, which has left it relatively
under-developed (Cassata and Collins, 2008). However Ningaloo, like many regions in
north-west Australia, is very resource-rich, and is now home to offshore oil and gas
exploration projects, with port facility developments also proposed for the area (Brown
et al., 2012). Given Ningaloo Reef is still in a relatively pristine condition, establishment
of baseline data on marine species diversity is needed to monitor and evaluate the
potential impacts from these industries (Cassata and Collins, 2008).
Ningaloo Reef supports a high diversity of marine species, and is most famous for
aggregations of whale sharks, manta rays and whales (Wood and Glasson, 2005).
Consequently, marine-based ecotourism has flourished in this region, providing a boost
to the economy that the fishing industry and declining pastoral activities could not sustain
(Wood and Glasson, 2005). However, recent sightings of dangerous medusae at Ningaloo
have gained media attention and are threatening the growing ecotourism industry at
Ningaloo Reef (Jones, 2014). Recently, a cubozoan medusa, Malo bella, presumed to
cause Irukandji syndrome, was identified from the northernmost region of Ningaloo Reef
(Gershwin, 2014). To address tourism operators’ concerns of envenomation of tourists by
dangerous gelatinous species such as M. bella and prevent a subsequent decline in marine-

9
based tourism at Ningaloo Reef, the abundance and diversity of gelatinous zooplankton,
including cubozoans, in this region needs to be assessed.
2.1.2 Methods needed to comprehensively sample gelatinous zooplankton
Multiple approaches should be used to quantitatively sample gelatinous zooplankton
because the wide range of body sizes and variations in the robustness of gelatinous bodies
means that there is no single sampling method suitable for all gelatinous zooplankton. For
example, towing a plankton net slowly and for a relatively short time either at surface or
sub-surface levels can be an effective way to capture firm gelatinous zooplankton, such
as medusae (Raskoff et al., 2003). Collection of gelatinous zooplankton with dip nets
while snorkelling or SCUBA diving reduces the possibility of damaging the organism
and allows for in situ observations of the animal (Pierce, 2009, Raskoff et al., 2003).
Combining plankton net tows with underwater visual surveys would ensure reliable
estimates of abundance, while preserving the structure of gelatinous zooplankton
sufficiently well to enable identification for studies of diversity (Raskoff et al., 2003).
Thus, when concerned with documenting the diversity and abundance of gelatinous
zooplankton, the use of multiple approaches to sampling is essential.
2.1.3 Genes needed for the molecular identification of gelatinous zooplankton
Genetic analyses offer a degree of accuracy and reliability for the identification of
gelatinous species which morphology alone cannot provide. There are, however, various
factors that must be taken into account when using genetic data to identify species. For
example, some genes are suitable for species identification, while others are more suitable
for phylogenetic analyses (Yuri et al., 2013). Mitochondrial genes are most extensively
used for species identification, as they vary only slightly within species, and have greater
variation between species (Savolainen et al., 2005).

10
To help determine the species’ identity of unknown samples, a method known as DNA
barcoding is commonly used (Buhay, 2009, Lv et al., 2014, Savolainen et al., 2005). DNA
barcoding is aimed at developing a DNA-based identification system for all taxa (Herbert
et al., 2003a) and can help detect overlooked species or unknown specimens with subtle
or complex morphological traits (Bucklin et al., 2011). Although, DNA barcoding relies
on the basis that specimens can be identified based on sequence similarity with existing
representative species sequences in a database (Ortman et al., 2010, Ross et al., 2008).
When these sequences do not exist in a database, such as GenBank, only tree-based
methods offer insights into species identification of cryptic or unknown specimens (Ross
et al., 2008).
Multiple genes are usually needed for species identification, as individual genes have
benefits and limitations (Bucklin et al., 2011, Ortman et al., 2010, Zheng et al., 2014).
For example, the mitochondrial, protein-coding gene cytochrome c oxidase subunit 1
(COI) has been established as the core of DNA barcoding (Herbert et al., 2003a) as it is
short enough to generate a large number of sequences quickly (Savolainen et al., 2005),
but long enough to identify variation among species, which is crucial for reliable species
identifications (Herbert et al., 2003b). However, due to gene saturation, COI genes have
low phylogenetic signals at higher levels, making assessments of phylogenetic diversity
difficult (Ortman et al., 2010), whereas the prevalence of indels (insertion/deletion
events) in 16S, a large subunit ribosomal RNA (Savolainen et al., 2005), makes this gene
useful for estimating phylogenetic relationships among animals, especially among
hydrozoan medusae (Yuri et al., 2013, Zheng et al., 2014).
When concerned only with species identification, some genes present difficulties which
can affect the accuracy of identifications. For example, as 16S is a non-coding gene, so it
accumulates indels where protein-coding genes, such as COI, rarely do (Yuri et al., 2013).

11
This can complicate sequence alignments (Herbert et al., 2003a), which are performed to
create sequences with ‘gaps’ that reflect hypothetical positions where indels would have
occurred due to homology (similarity due to common ancestry) (Doyle and Gaut, 2000,
Yuri et al., 2013). Consequently, species identifications based on 16S sequences may not
be reliable if the alignment was complicated due to a high frequency of indels (Herbert et
al., 2003b). Additionally, despite its applicability to a broad range of taxa, COI is unable
to discriminate closely allied species in the phylum Cnidaria (Herbert et al., 2003a),
though this conclusion related to species in the class Anthozoa, or in other words, corals
and sea anemones (Bucklin et al., 2011). A study has recently reported COI can be used
for species identification across the Medusazoa (Ortman et al., 2010), indicating it is still
a reliable marker for medusae species identification. Thus, both COI and 16S have
strengths and limitations with regards to gelatinous species identification, which is why
it may be necessary to use both to obtain the most accurate identification of an unknown
species.
2.1.4 Genetic analyses identify cryptic species of Aurelia medusae and
introductions of invasive species
Aurelia sp. are perhaps the most ubiquitous medusae in the world (Dawson and Jacobs,
2001). They can be found in temperate and tropical waters (Dawson and Jacobs, 2001),
occupying a range of habitats (Schroth et al., 2002). There are fourteen known species of
Aurelia (Dawson et al., 2005), eleven of which are cryptic (Dawson et al., 2005, Dawson
and Jacobs, 2001, Schroth et al., 2002). Many Aurelia sp. are restricted to certain regions
because natural oceanographic patterns limit their dispersal range (Dawson et al., 2005),
however multiple introductions of cryptic Aurelia sp. have been identified using genetic
analyses (Dawson, 2003, Dawson et al., 2005). Typically, regionally restricted Aurelia
sp. have higher geographic structure and genetic diversity than invasive Aurelia species
(Dawson, 2003, Dawson et al., 2005). For example, Aurelia sp. 1, a globally distributed

12
Aurelia species, is thought to be invasive as its reduced genetic diversity does not reflect
an organism with a natural distribution (Dawson, 2003). It is thought anthropogenic
introductions have enabled Aurelia sp. 1 to exceed its natural dispersal range, allowing it
to colonise warm-temperate areas outside of its original, natural distribution (Dawson,
2003, Dawson et al., 2005).
Morphological differences among populations have been used to determine whether
medusae are invasive to an area where they suddenly appear (Bolton and Graham, 2004).
Though, as there are many cryptic Aurelia species (Dawson and Jacobs, 2001) which have
few distinguishing morphological features (Greenberg et al., 1996), and many regions
such as the Indian Ocean and Australia are still under-sampled with regards to gelatinous
zooplankton (Condon et al., 2012), and Aurelia sp. in particular (Dawson and Jacobs,
2001), morphological differences among populations of Aurelia sp. would not be an
effective means for the identification of invasive or endemic populations. Thus, genetic
analyses present a valuable tool for assessing whether populations of Aurelia species are
endemic or introduced to particular regions, and are able to detect cryptic species within
a population (Dawson, 2003, Dawson et al., 2005).
2.1.5 Objectives
The objectives of this chapter were: (1) to assess the abundance of gelatinous zooplankton
at Ningaloo Reef using plankton tows and snorkelled transects, (2) to assess the diversity
of species of gelatinous zooplankton at Ningaloo Reef by exploring the phylogenetic
relationships among specimens using 16S and COI sequences for genetic analyses, and
(3) to determine whether Aurelia sp. at Ningaloo Reef are invasive or endemic, based on
phylogenetic analyses of Aurelia sp., including cryptic species, from various geographic
localities.

13
2.2 Methods
2.2.1 Sampling sites
Gelatinous zooplankton were sampled in and adjacent to the northern section of Ningaloo
Reef, Western Australia (Figure 2). Gelatinous zooplankton were sampled most
commonly on the west coast of the Exmouth Cape, while some were sampled
opportunistically within the Exmouth Gulf on the eastern side of the cape. Sampling sites
included areas within the lagoon of Ningaloo Reef, at depths of 3 – 8 m, and outside the
lagoon, at depths of 20 – 80 m (past the reef break). The whale shark tourism vessel
Latitude 22, owned by Ocean Eco Adventures, was used to sample gelatinous
zooplankton at the sampling sites. Sites within the lagoon were comprised mainly of
patches of coral bomboras, while sites outside the lagoon were oceanic.
Figure 2: Locations of sampling sites. Sites within the lagoon are represented by yellow circles
while sites outside the lagoon are represented by red circles.

14
2.2.2 Methods used to sample within the lagoon of Ningaloo Reef
Gelatinous zooplankton were sampled within the lagoon 48 times from 1st April to 22nd
July 2015 at intervals of 1 – 7 days using underwater visual surveys (UVSs). Each day,
one site was sampled in the morning (between 9:30 and 11:00am) and a second site was
sampled in the afternoon (between 1:30pm and 3:50pm). UVSs were undertaken at a total
of 18 different sites, with sites being sampled 1-12 times throughout the sampling period.
The sites sampled on any given day were determined by the whale shark tourism vessel,
Latitude 22, in accordance with Ocean Eco Adventure’s snorkelling activities, run as part
of the tour. At each site a flowmeter (General Oceanics), that was held in front of the
snorkeler, was used to measure five 50 m transects, with a minimum of 10 m separating
each transect. Gelatinous zooplankton 1 m either side of the snorkeler were identified and
counted in situ or photographed for later morphological identification. Gelatinous
zooplankton were also captured during UVSs using a 2 mm-mesh hand-held dip net and
reserved for identification via genetic analyses.
2.2.3 Methods used to sample outside the lagoon of Ningaloo Reef
Gelatinous zooplankton were sampled outside the lagoon 13 times from 1st April to 23rd
July 2015, however sampling events depended on weather conditions and whether seasick
passengers necessitated the early return of the vessel. Gelatinous zooplankton were
collected from horizontal tows using a plankton net (51 cm diameter net opening, 150
µm-mesh size). However, as only one medusa over the four months was caught using this
method, the data were not analysed. Additional specimens were captured
opportunistically outside the lagoon while snorkelling as part of the whale shark
interaction tour run by Ocean Eco Adventures. All specimens were stored on ice until
they were able to be processed for morphological identification and genetic analyses and
were processed within 24 hours of capture.
15
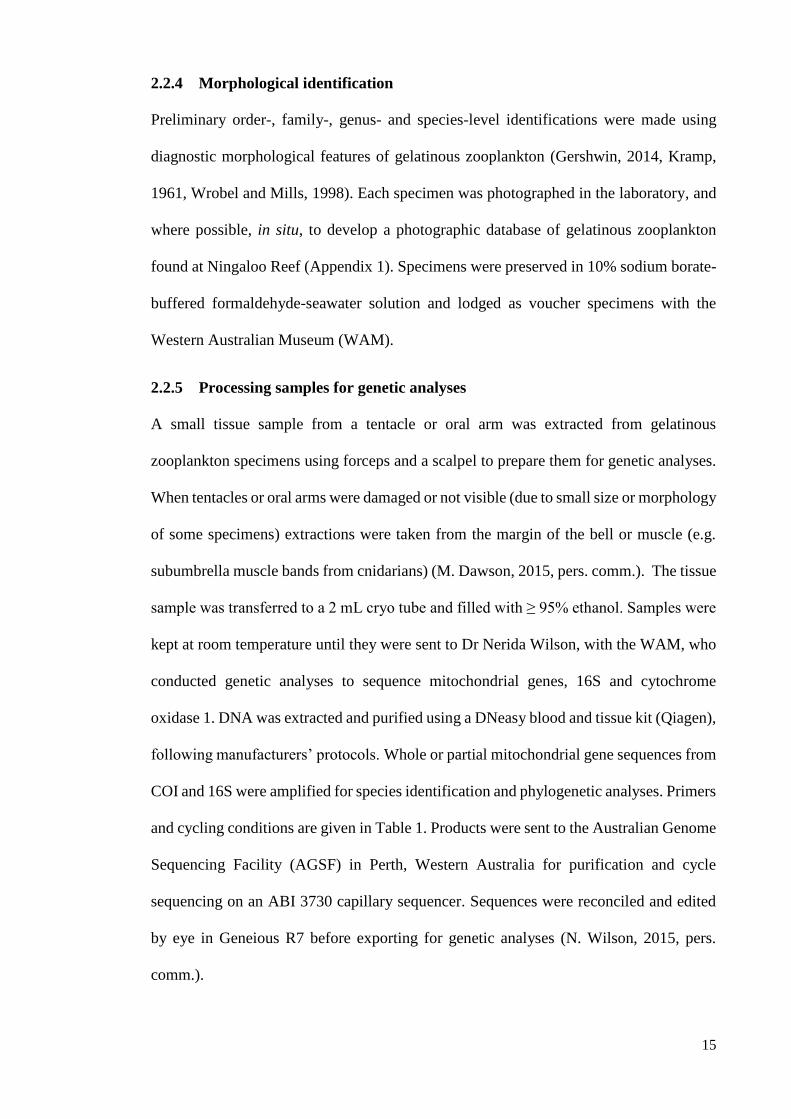
2.2.4 Morphological identification
Preliminary order-, family-, genus- and species-level identifications were made using
diagnostic morphological features of gelatinous zooplankton (Gershwin, 2014, Kramp,
1961, Wrobel and Mills, 1998). Each specimen was photographed in the laboratory, and
where possible, in situ, to develop a photographic database of gelatinous zooplankton
found at Ningaloo Reef (Appendix 1). Specimens were preserved in 10% sodium borate-
buffered formaldehyde-seawater solution and lodged as voucher specimens with the
Western Australian Museum (WAM).
2.2.5 Processing samples for genetic analyses
A small tissue sample from a tentacle or oral arm was extracted from gelatinous
zooplankton specimens using forceps and a scalpel to prepare them for genetic analyses.
When tentacles or oral arms were damaged or not visible (due to small size or morphology
of some specimens) extractions were taken from the margin of the bell or muscle (e.g.
subumbrella muscle bands from cnidarians) (M. Dawson, 2015, pers. comm.). The tissue
sample was transferred to a 2 mL cryo tube and filled with ≥ 95% ethanol. Samples were
kept at room temperature until they were sent to Dr Nerida Wilson, with the WAM, who
conducted genetic analyses to sequence mitochondrial genes, 16S and cytochrome
oxidase 1. DNA was extracted and purified using a DNeasy blood and tissue kit (Qiagen),
following manufacturers’ protocols. Whole or partial mitochondrial gene sequences from
COI and 16S were amplified for species identification and phylogenetic analyses. Primers
and cycling conditions are given in Table 1. Products were sent to the Australian Genome
Sequencing Facility (AGSF) in Perth, Western Australia for purification and cycle
sequencing on an ABI 3730 capillary sequencer. Sequences were reconciled and edited
by eye in Geneious R7 before exporting for genetic analyses (N. Wilson, 2015, pers.
comm.).

16
Table 1: Primers and cycling conditions for mitochondrial gene sequences 16S and COI.
Region Primer Source Sequence (5’-3’) PCR cycling
conditions
COI LCO1490 Folmer et al.
1994
GGTCAACAAATCATAAAGATATTGG (95 °C: 20 s;
45 °C: 30 s; 72
°C: 40 s) x 5;
(95 °C: 20 s;
50 °C: 30 s; 72
°C: 40 s) x 35
COI HCO2198 Folmer et al.
1994
CTAAACTTCAGGGTGACCAAAAAATCA
16S 16SF2 Cunningham
& Buss, 1993
TCGACTGTTTACCAAAAACATA (95 °C: 20 s;
45 °C: 30 s; 72
°C: 40 s) x 5;
(95 °C: 20 s;
50 °C: 30 s; 72
°C: 40 s) x 35
16S R16SR2 Cunningham
& Buss, 1993
ACGGAATGAACTCAAATCATGTAAG
2.2.6 Species identification and phylogenetic analyses for Ningaloo Reef specimens
The sequences provided by WAM were identified using a GenBank non-redundant
megablast search for highly similar sequences (http://blast.ncbi.nlm.nih.gov/Blast.cgi).
E-values close to zero and sequence identities close to 100% indicate closely related
sequences, and therefore potential species matches. Phylogenetic relationships among
species (sequences) were explored using MEGA 6.0 (Tamura et al., 2013). COI and 16S
sequences were aligned by using several gap-opening:gap-extension weighting schemes
in ClustalW and alignments were corrected by eye. Phylogenetic trees were constructed
by using the maximum likelihood method in MEGA 6.0 (Tamura et al., 2013) using
relevant models of molecular evolution (16S, HKY+G; COI, GTR+G+I) identified by
the Find Best DNA/Protein Models (ML) feature. The reliability of the nodes on the
trees were estimated using the bootstrap method (1000 replicates). Nodes with high
bootstrap values (> 70%) are considered to be closely related and specimens that share
sister nodes at the tips of the tree are considered to be closely related and possibly the
same species (Hall, 2013). Trees were left unrooted.
17
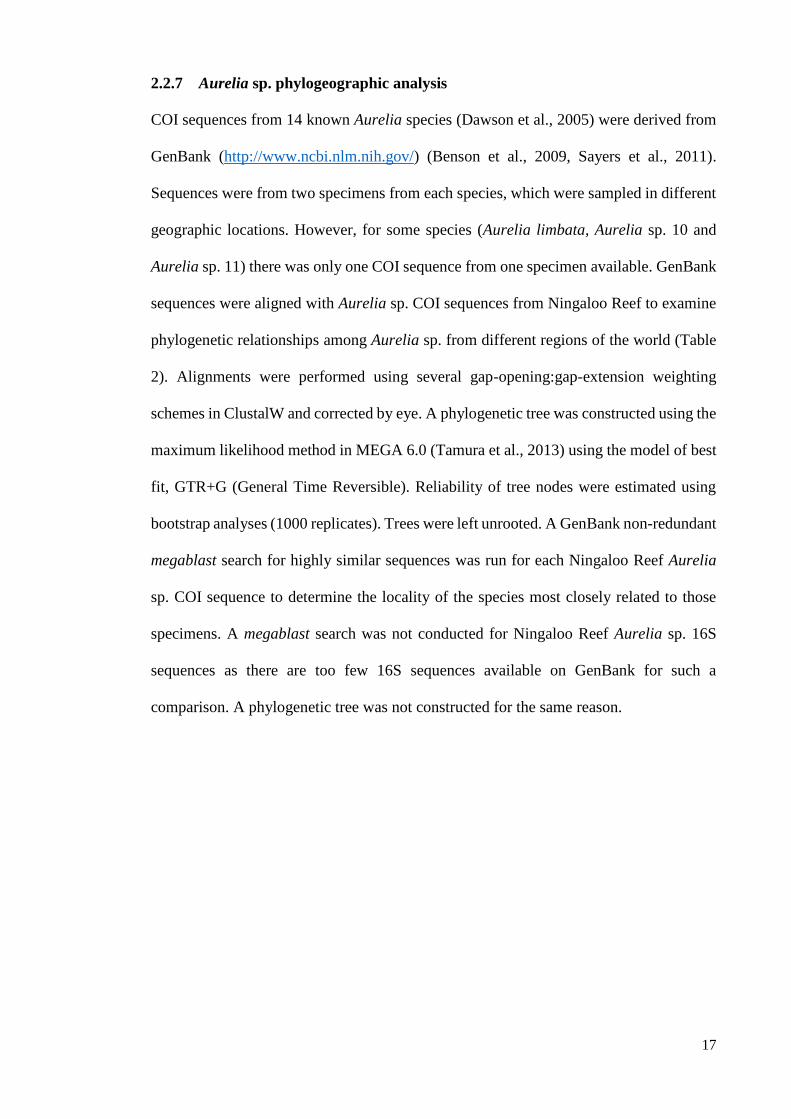
2.2.7 Aurelia sp. phylogeographic analysis
COI sequences from 14 known Aurelia species (Dawson et al., 2005) were derived from
GenBank (http://www.ncbi.nlm.nih.gov/) (Benson et al., 2009, Sayers et al., 2011).
Sequences were from two specimens from each species, which were sampled in different
geographic locations. However, for some species (Aurelia limbata, Aurelia sp. 10 and
Aurelia sp. 11) there was only one COI sequence from one specimen available. GenBank
sequences were aligned with Aurelia sp. COI sequences from Ningaloo Reef to examine
phylogenetic relationships among Aurelia sp. from different regions of the world (Table
2). Alignments were performed using several gap-opening:gap-extension weighting
schemes in ClustalW and corrected by eye. A phylogenetic tree was constructed using the
maximum likelihood method in MEGA 6.0 (Tamura et al., 2013) using the model of best
fit, GTR+G (General Time Reversible). Reliability of tree nodes were estimated using
bootstrap analyses (1000 replicates). Trees were left unrooted. A GenBank non-redundant
megablast search for highly similar sequences was run for each Ningaloo Reef Aurelia
sp. COI sequence to determine the locality of the species most closely related to those
specimens. A megablast search was not conducted for Ningaloo Reef Aurelia sp. 16S
sequences as there are too few 16S sequences available on GenBank for such a
comparison. A phylogenetic tree was not constructed for the same reason.

18
Table 2: Aurelia sp. sequences derived from NCIB GenBank and the regions in which they were
sampled from.
Species 16S COI Reference
Aurelia aurita Baltic Sea Sweden; Turkey Dawson et al. (2005),
Fuchs, et al. (2014)
Woods Hole, USA Schroth et al. (2002)
Aurelia labiata Bamfield, Canada;
Victoria, Canada
Tomales Bay, USA;
Todd Inlet, Canada
Dawson, et al. (2005),
Sparmann et al.
(unpublished)
Aurelia
limbata
Unknown Japan Dawson et al. (2005),
Gotoh et al.
(unpublished),
North West Pacific Schroth et al. (2002)
Aurelia sp. 1 China Perth, Australia He et al. (unpublished),
Dawson et al. (2005)
China San Diego, USA He et al. (unpublished),
Dawson et al. (2005)
Aurelia sp. 2 No sequences
available
Sao Paulo, Brazil Dawson et al. (2005)
Aurelia sp. 3 No sequences
available
Tab Kukau Cove,
Palau; Tketau Lake,
Palau
Dawson et al. (2005)
Aurelia sp. 4 No sequences
available
Hawaii, USA;
Kakaban Is., Palau
Dawson et al. (2005)
Aurelia sp. 5 No sequences
available
Mljet, Croatia Dawson et al. (2005)
Aurelia sp. 6 No sequences
available
Helen Reef, Palau;
New Britain, Papua
New Guinea
Dawson et al. (2005)
Aurelia sp. 7 No sequences
available
Tasmania, Australia Dawson et al. (2005)
Aurelia sp. 8 No sequences
available
Bay of Ston, Croatia;
North Adriatic Sea
Dawson et al. (2005)
Aurelia sp. 9 No sequences
available
Gulf of Mexico,
Alabama
Dawson et al. (2005)
Aurelia sp. 10 No sequences
available
Kachemak Bay,
Alaska
Dawson et al. (2005)
Aurelia sp. 11 No sequences
available
Kwajalein, Marshall
Is.
Dawson et al. (2005)

19
2.3 Results
2.3.1 Abundance of gelatinous zooplankton inside the lagoon of Ningaloo Reef
Gelatinous zooplankton were present in all months (April, May, June and July), however
appeared to be most abundant in April and June (Figure 3). Six medusae were identified
to species-level, family-level and order-level based on morphology during inshore
sampling. Hydrozoans in the order Narcomedusae and the scyphozoan, Crambione
mastigophora, were most abundant in April, while the scyphozoan Aurelia aurita was
most abundant in April and June. The cubozoan Malo bella was present in May, and a
scyphozoan in the order Rhizostomeae and the hydrozoan medusae Liriope tetraphylla
were present in June and July respectively (Figure 3).
Figure 3: Mean (± SE) overall and species abundance per 100 m3 of gelatinous zooplankton
relative to time of year. Specimens were sampled within the lagoon of Ningaloo Reef. Light
grey bars represent overall mean (± SE) abundance. Species mean (± SE) abundance are
indicated by data labels above corresponding bars.

20
2.3.2 Presence-absence data for gelatinous zooplankton found outside the lagoon
of Ningaloo Reef
Outside the lagoon of Ningaloo Reef, four more cnidarians were present from May to
July, including: a Cyanea sp. scyphozoan present in July, Aequorea australis (Hydrozoa)
present in May and June, and a hydrozoan in the family Aequoreidae and a hydrozoan in
the order Leptomedusae both present in July (Table 3). C. mastigophora was present in
both April and May and hydrozoans in the order Narcomedusae appeared in all months
but July (Table 3). Though only present in May inside the lagoon, outside the lagoon M.
bella was present in May, June and July (Table 3).
Table 3: Presence of gelatinous species outside the lagoon of Ningaloo Reef from April to July.
Ticks represent sightings of a particular species on a given sampling week. Month of sampling
(from April to July) is indicated by light to dark grey scale shading and month column.
Month Sampling week
Au
reli
a a
uri
ta
Ord
er
Narc
om
edu
sae
Cra
mbio
ne
mast
igoph
ora
Malo
bel
la
Aeq
uore
a
au
stra
lis
Fam
ily
Aeq
uore
idae
Lir
iope
tetr
aph
ylla
Cya
nea
sp
.
Ord
er
Lep
tom
edu
sae
April 1 Apr - 7 Apr
8 Apr - 14 Apr
15 Apr - 21 Apr
22 Apr - 28 Apr
29 Apr - 5 May
May 6 May - 12 May
13 May - 19 May
20 May - 26 May
27 May - 2 Jun
June 3 Jun - 9 Jun
10 Jun - 16 Jun
17 Jun - 23 Jun
24 Jun - 30 Jun
July 1 Jul - 7 Jul
8 Jul - 14 Jul
15 Jul - 21 Jul
Total no. times species
were sighted: 4 3 4 5 2 1 1 1 1
21
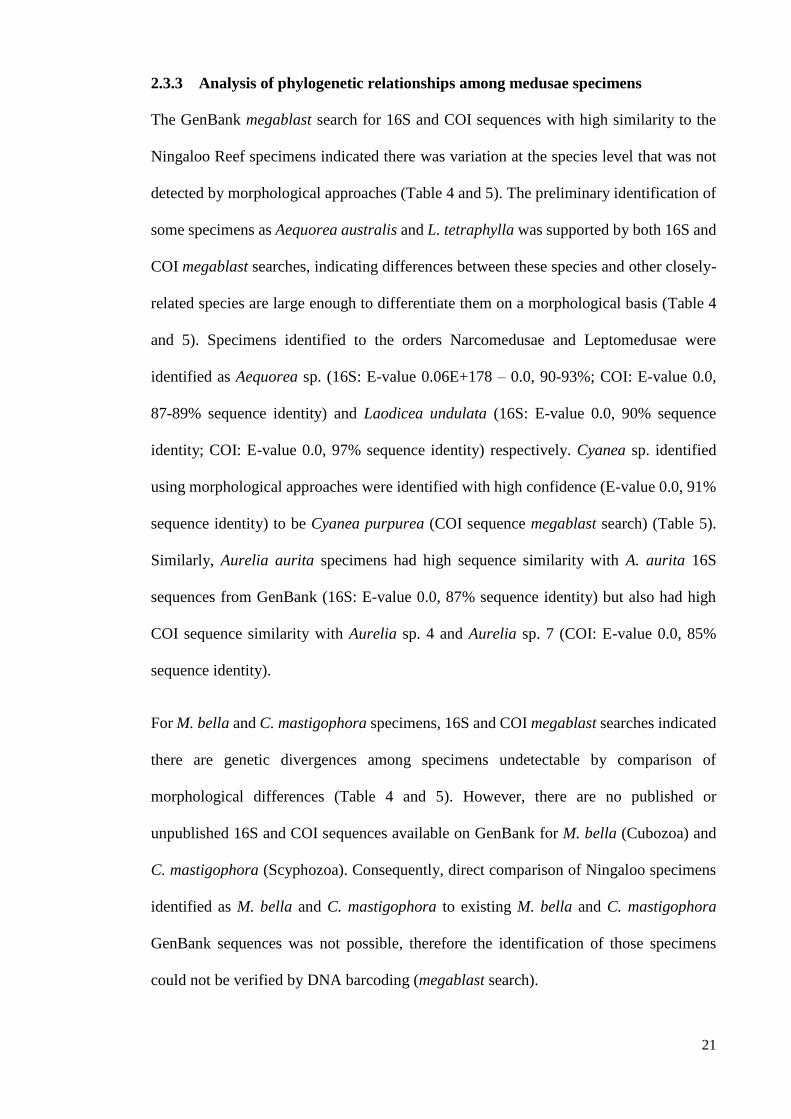
2.3.3 Analysis of phylogenetic relationships among medusae specimens
The GenBank megablast search for 16S and COI sequences with high similarity to the
Ningaloo Reef specimens indicated there was variation at the species level that was not
detected by morphological approaches (Table 4 and 5). The preliminary identification of
some specimens as Aequorea australis and L. tetraphylla was supported by both 16S and
COI megablast searches, indicating differences between these species and other closely-
related species are large enough to differentiate them on a morphological basis (Table 4
and 5). Specimens identified to the orders Narcomedusae and Leptomedusae were
identified as Aequorea sp. (16S: E-value 0.06E+178 – 0.0, 90-93%; COI: E-value 0.0,
87-89% sequence identity) and Laodicea undulata (16S: E-value 0.0, 90% sequence
identity; COI: E-value 0.0, 97% sequence identity) respectively. Cyanea sp. identified
using morphological approaches were identified with high confidence (E-value 0.0, 91%
sequence identity) to be Cyanea purpurea (COI sequence megablast search) (Table 5).
Similarly, Aurelia aurita specimens had high sequence similarity with A. aurita 16S
sequences from GenBank (16S: E-value 0.0, 87% sequence identity) but also had high
COI sequence similarity with Aurelia sp. 4 and Aurelia sp. 7 (COI: E-value 0.0, 85%
sequence identity).
For M. bella and C. mastigophora specimens, 16S and COI megablast searches indicated
there are genetic divergences among specimens undetectable by comparison of
morphological differences (Table 4 and 5). However, there are no published or
unpublished 16S and COI sequences available on GenBank for M. bella (Cubozoa) and
C. mastigophora (Scyphozoa). Consequently, direct comparison of Ningaloo specimens
identified as M. bella and C. mastigophora to existing M. bella and C. mastigophora
GenBank sequences was not possible, therefore the identification of those specimens
could not be verified by DNA barcoding (megablast search).

22
Table 4: Results of GenBank megablast 16S sequence similarity search for species identification
of Ningaloo Reef specimens. Rows highlighted in light grey indicate confirmed species
identifications (E-value 0.0, ≥ 90% sequence identity). Rows highlighted in dark grey indicate
species for which GenBank 16S sequences do not exist, so direct comparison to species sequences
was not possible. Species in column “megablast species identification” represent most closely-
related species.
Specimen Morphological
identification
Sequence
identity E value
Megablast species
identification
WAMZ90001 Malo bella 91% 0.0 Morbakka virulenta
WAMZ90002 Malo bella 91% 0.0 Morbakka virulenta
WAM900004 Malo bella 91% 0.0 Morbakka virulenta
WAM900007 Aequorea australis 98-99% 0.0 Aequorea australis
WAMZ90008 Aequoreidae 90% 0.0 Phialella quadrata
WAMZ90009 Aequorea australis 98-99% 0.0 Aequorea australis
WAMZ90010 Leptomedusae 91-93% 0.0 Aequorea sp.
WAMZ90011 Leptomedusae 91-93% 0.0 Aequorea sp.
WAMZ90012 Leptomedusae 90-92% 0.0 Aequorea sp.
WAMZ90013 Leptomedusae 91-93% 0.0 Aequorea sp.
WAMZ90014 Leptomedusae 91-92% 0.0 Aequorea sp.
WAMZ90015 Liriope tetraphylla 92-99% 0.0 Liriope tetraphylla
WAMZ90016 Liriope tetraphylla 92-99% 0.0 Liriope tetraphylla
WAMZ90017 Leptomeduse 92-96% 0.0 Laodicea undulata
WAMZ90018 Leptomedusae 90% 0.0 Laodicea undulata
WAMZ90020 Crambione
mastigophora
85% 3.00E+166 Cassiopea andromeda
WAMZ90021 Crambione
mastigophora
86% 6.00E+168 Cassiopea andromeda
WAMZ90022 Cyanea sp. 83% 1.00E+145 Cyanea sp.
WAMZ90024 Aurelia aurita 87% 0.00E+00 Aurelia aurita
WAMZ90025 Aurelia aurita 87% 0.00E+00 Aurelia aurita
WAMZ90026 Aurelia aurita 87% 0.00E+00 Aurelia aurita
WAMZ90027 Aurelia aurita 87% 0.0 Aurelia aurita
WAMZ90028 Aurelia aurita 87% 0.00E+00 Aurelia aurita

23
Table 5: Results of GenBank megablast COI sequence similarity search for species identification
of Ningaloo Reef specimens. Rows highlighted in light grey indicate confirmed species
identifications (E-value 0.0, ≥ 90% sequence identity). Rows highlighted in dark grey indicate
species for which GenBank COI sequences do not exist, so direct comparison to species sequences
was not possible. Species in column “megablast species identification” represent most closely-
related species.
Specimen Morphological
identification
Sequence
identity E-value
Megablast species
identification
WAMZ90000 Malo bella 78% 9.00E+102 Chiropsalmus quadrumanus
WAMZ90001 Malo bella 78% 9.00E+102 Chiropsalmus quadrumanus
WAMZ90002 Malo bella 78% 9.00E+102 Chiropsalmus quadrumanus
WAMZ90003 Malo bella 78% 9.00E+102 Chiropsalmus quadrumanus
WAMZ90004 Malo bella 78% 9.00E+102 Chiropsalmus quadrumanus
WAMZ90006 Malo bella 78% 9.00E+102 Chiropsalmus quadrumanus
WAMZ90007 Aequorea australis 97% 0.0 Aequorea australis
WAMZ90008 Aequoreidae 86% 0.0 Blackfordia polytentaculata
WAMZ90009 Aequorea australis 97% 0.0 Aequorea australis
WAMZ90010 Leptomedusae 89% 0.0 Aequorea sp.
WAMZ90012 Leptomedusae 89% 0.0 Aequorea sp. & Eirene sp.
WAMZ90013 Leptomedusae 87-89% 0.0 Aequorea sp. & Eirene sp.
WAMZ90014 Leptomedusae 87-89% 0.0 Aequorea sp. & Eirene sp.
WAMZ90015 Liriope tetraphylla 99% 0.0 Liriope tetraphylla
WAMZ90016 Liriope tetraphylla 99% 0.0 Liriope tetraphylla
WAMZ90017 Leptomedusae 97% 0.0 Laodicea undulata
WAMZ90021 Crambione
mastigophora
82% 7.00E+143 Crambionella stuhlmanni
WAMZ90022 Cyanea sp. 91% 0.0 Cyanea purpurea
WAMZ90025 Aurelia aurita 85% 0.0 Aurelia sp. 4
WAMZ90026 Aurelia aurita 85% 0.0 Aurelia sp. 4 & Aurelia sp. 7
WAMZ90027 Aurelia aurita 85% 0.0 Aurelia sp. 4
All species formed distinct clusters in the 16S and COI trees constructed using the
maximum likelihood (ML) tree method, with the arrangement of clusters reflecting class
level groupings (Hydrozoa, Scyphozoa and Cubozoa) of specimens in the tree (Figure 4
and 5). Three species (L. tetraphylla, A. australis and C. mastigophora) formed strongly
supported clades (bootstrap >90%) in both the COI and 16S trees, with L. tetraphylla and
two specimens of A. australis (WAMZ90007 and WAMZ90009) clearly separated from
other species (bootstraps >70%) (Figure 4 and 5). Furthermore, Leptomedusae specimens

24
in the 16S tree shared the same node, which was very strongly supported (bootstrap =
100%), indicating they were closely related, and potentially the same species (Figure 4).
In the 16S tree, the separation of the cubozoan species M. bella into distinct lineages was
supported by high bootstrap values (>80 %) (Figure 4). This indicates that although the
specimens are closely related, there is genetic variation, perhaps at the species or genus
level, among the specimens. However, they showed very reduced genetic variation in the
COI tree (Figure 5). Internal nodes in the COI tree showed strong support (bootstrap
>70%) for a higher level connection between an Aequoreidae hydrozoan (WAMZ90008)
and Aequorea australis specimens (Figure 5), indicating there is perhaps a family- or
order-level relation among those specimens. Division of Leptomeduse hydrozoans into
separate lineages in both trees (strongly supported in COI tree) revealed potentially
family- and genus-level variation among Leptomedusae specimens (Figure 5), otherwise
undetectable by morphological differences.

25
Figure 4: Maximum-Likelihood phylogenetic tree based on the mitochondrial gene 16S, a large
subunit ribosomal RNA, for specimens found at Ningaloo Reef. Bootstrap values (1000
replicates) reflect the percentage of trees in which the associated taxa clustered together and are
shown at each node. Class lineages are indicated. Scale bar represents evolutionary time.
26
Figure 5: Maximum-Likelihood phylogenetic tree based on the mitochondrial gene cytochrome
c oxidase subunit 1 (COI) for specimens found at Ningaloo Reef. Bootstrap values (1000
replicates) reflect the percentage of trees in which the associated taxa clustered together and are
shown at each node. Class lineages are indicated. Scale bar represents evolutionary time.
2.3.4 Phylogeographic analysis of Aurelia sp. based on molecular data
Aurelia sp. from Ningaloo Reef formed distinct clusters in trees constructed using the
maximum likelihood method, which were created from COI and 16S Aurelia sp.
sequences derived from this study and GenBank. Ningaloo Aurelia sp. COI sequences
were most closely related to Aurelia sp. 7, which were sampled from Tasmania, Australia
(Figure 6). They also have diverging lineages connecting them to Aurelia sp. 4, sp. 6 and
sp. 3. which were sampled from regions in the Indian and southern Pacific Oceans (Table
2), though there is weak support for the internal branch nodes (bootstraps <70 %). The

27
more distantly related Aurelia sp. were mostly sampled from regions in the Northern
Hemisphere. The megablast sequence similarity searches revealed the Ningaloo
specimens were closely related to Aurelia sp. from Palau, Indonesia, Hawaii (USA),
Sweden, Tasmania (Australia), Israel and New Zealand.
Figure 6: Maximum-Likelihood phylogenetic tree for Aurelia sp. from Ningaloo Reef and other
regions (see Table 2), based on the mitochondrial gene cytochrome c oxidase 1 (COI). Bootstrap
values (1000 replicates) reflect the percentage of trees in which the associated taxa clustered
together and are shown at each node. Scale bar represents evolutionary time.
Aurelia sp. 3 Tab Kukau Cove Palau
Aurelia sp. 3 Tketau Lake Palau
Aurelia sp. 6 Helen Reef Palau
Aurelia sp. 6 New Britain PNG
Aurelia sp. 4 Ala Wai marina Hawaii USA
Aurelia sp. 4 Kakaban Is. Palau
Aurelia sp. 7 Huon Estuary Tasmania
Aurelia sp. 7 Tasmania
WAMZ90026 Aurelia sp. 4 or sp. 7 Ningaloo Reef
WAMZ90025 Aurelia sp. 4 Ningaloo Reef
WAMZ90027 Aurelia sp. 4 Ningaloo Reef
Aurelia sp. 5 Mljet Croatia
Aurelia sp. 5 Mljet Croatia 2
Aurelia aurita Sweden
Aurelia aurita Turkey
Aurelia limbata Japan
Aurelia sp. 10 Kachemak Bay Alaska USA
Aurelia sp. 1 Perth Australia
Aurelia sp. 1 San Diego USA
Aurelia labiata Todd Inlet Canada
Aurelia labiata Tomales Bay USA
Aurelia sp. 8 Bay of Ston Croatia
Aurelia sp. 8 North Adriatic Sea
Aurelia sp. 11 Kwajalein Marshall Is.
Aurelia sp. 2 Sao Paulo Brazil
Aurelia sp. 2 Sao Paulo Brazil 2
Aurelia sp. 9 Gulf of Mexico off Alabama USA
Aurelia sp. 9 Gulf of Mexico USA
99
94
100
100
100
100
100
100
41
100
100
99
99
99
57
35
49
42
17
30
23
20
14
25
9
0.05
28
2.4 Discussion
2.4.1 Gelatinous zooplankton abundance in north-west Western Australia
There is a paucity of data relating to the abundance of gelatinous zooplankton found off
the north-western coast of Australia (Condon et al., 2012). This study has created a
baseline to assess the abundance of gelatinous zooplankton in the Ningaloo Reef region
of north-western Australia and has shown species composition within the lagoon varied
through time. A. aurita was the only recurring gelatinous species, and although C.
mastigophora occurred in only one month, it was very abundant. All other species
appeared only once in very low abundance. Presence-absence data indicated gelatinous
species diversity outside the lagoon is slightly higher.
The need for data relating to the abundance and diversity of gelatinous zooplankton at
Ningaloo Reef arose partly due to dangerous carybdeid cubozoan medusae being
regularly sighted and occasionally stinging tourists (Gershwin, 2014, Jones, 2014, P.
Barnes, 2014, pers. comm.). Although four species of carybdeid cubozoans are known
from the Western Australian region (Bailey et al., 2005, Gershwin, 2005c, Gershwin,
2014), during the current study only a single species of carybdeid, M. bella, was found at
Ningaloo Reef. A woman was also stung by one of the nine M. bella specimens captured,
and suffered a severe case of Irukandji syndrome as a result of the envenomation. This
confirmed that this carybdeid species causes Irukandji syndrome, and emphasises the
need for rigorous sampling of cubozoans, particularly carybdeids, in the region. The most
efficient means of capturing cubozoans is by using lights to attract the medusae at night
(Garm et al., 2012, Kingsford et al., 2012). Considering cubozoans pose a threat of serious
envenomation to tourists and to tourism industry professionals participating in marine-
based tourism at Ningaloo Reef, intense sampling using night lights is needed to

29
sufficiently assess the overall abundance and diversity, and ultimately, ecology, of such
a dangerous species in the north-western region of Australia.
2.4.2 Species identification and relatedness as indicated by mitochondrial DNA
sequence similarity and phylogenetic analyses
COI and 16S sequences have provided additional information regarding the diversity of
gelatinous zooplankton from Ningaloo Reef, in Western Australia. Overall, the COI and
16S genes, using the maximum likelihood method, produced trees that reflected the same
patterns of species identification shown by the GenBank megablast sequence similarity
searches. The maximum likelihood method is one of three methods commonly used in
the construction of phylogenetic trees and was chosen as it has a firm statistical basis
(Yang, 1993), does not assume a rate of constant evolution (Tamura et al., 2013) and does
not ignore parsimoniously non-informative characters in sequences (Fischer and Thatte,
2010). This enabled a robust assessment of Ningaloo Reef gelatinous species diversity.
Phylogenetic trees and megblast sequence similarity searches assisted with discriminating
among morphologically similar species. A number of Ningaloo Reef specimens shared
similar morphological traits, which is why some were identified to the order- or genus-
level, and not the species-level. Genetic analyses enabled species-level classifications
where morphological identification could not. This is one of the benefits of using DNA
barcoding, which is used for species recognition and discrimination (Bucklin et al., 2011).
However, databases like GenBank need to be sufficiently populated with sequences from
a broad range of medusae taxa for DNA barcoding to complement morphological
identification (Ekrem et al., 2007, Ortman et al., 2010). Future studies should focus on
increasing the amount of sequences available for medusae, in databases such as GenBank
(Ortman et al., 2010), but sequences cannot be generated without specimens being
accurately identified by taxonomists with expertise in the identification of particular

30
groups of medusae (Ortman et al., 2010). Thus, neither morphological nor genetic
approaches represent a single method for effective identification of gelatinous species;
they must be integrated to ensure accurate and reliable identification of gelatinous species
(Dawson, 2005b).
Phylogenetic trees constructed from 16S and COI sequences using the maximum
likelihood method revealed variation among specimens, which was undetected using
morphology and GenBank megablast searches. For example, the 16S tree indicated there
was variation among M. bella specimens at the species-level, though this variation was
much more reduced in the COI tree. M. bella has been identified using morphology
(Gershwin, 2014), but no DNA samples have been taken and sequenced from any
specimens. Cubozoans have been sequenced using the 16S gene from the Northern
Territory and south-western Australia (Bentlage et al., 2010), but no sequences for
cubozoans from north-western Australia exist, despite a number of species being
described from the area (Gershwin, 2005c, Gershwin, 2014). As a result, there are no 16S
or COI sequences of M. bella or any north-west Australian carybdeid in GenBank to
compare the specimens from Ningaloo Reef to (Benson et al., 2009, Sayers et al., 2011).
As some cubozoans are extremely toxic (Brinkman and Burnell, 2009), it is paramount
future studies aim to acquire sequences for cubozoans from north-western Australia to
assist with species identification, which in turn will give an indication of the toxicity of
cubozoans endemic to the north-west region (Gershwin, 2008).
2.4.3 Aurelia aurita specimens from Ningaloo Reef are endemic
Phylogenetic analyses offer an effective way to identify invasive or endemic populations
of Aurelia medusae (Dawson et al., 2005). Based on Aurelia sp. COI sequences from
different regions of the world, phylogeographic analysis revealed populations of Aurelia
sp. from Ningaloo Reef are most likely endemic, perhaps with a small proportion of the

31
population comprising invasive species. Ningaloo Reef Aurelia sp. appear most closely
related to Aurelia sp. 7, which were sampled from Tasmania, Australia, and may represent
an invasive proportion of the population from a temperate region. Ningaloo Aurelia sp.
also share connections with Aurelia sp.3, sp. 4 and sp. 6, which were sampled from warm,
tropical areas to the north of Australia.
Aurelia sp. are usually regionally restricted by dispersal mechanisms (Dawson et al.,
2005), so it is likely they have dispersed from warmer waters to the north of Australia,
considering they are most closely related to other Aurelia sp. from that region. The
megablast search reflected a similar pattern as Aurelia sp. with high sequence similarity
matches were mostly from regions to the north of Australia. However, bootstrap values
on the internal nodes of the phylogenetic tree indicated higher-level clustering of species
was weakly supported, so it cannot be claimed with any certainty that populations of
Aurelia sp. at Ningaloo Reef are endemic to the north-western Australian region.
Based on locality, it was expected Ningaloo Reef Aurelia sp. would be most closely
related to Aurelia sp. 1, the specimen which was sampled from Perth, Australia. However,
genetic analyses indicated Ningaloo Aurelia sp. are not closely related to Aurelia sp. 1
from Perth. In fact, the specimen from Perth shared a sister node with the Aurelia sp. 1
specimen from San Diego, USA, a clustering which was very strongly supported. This
suggests the Perth Aurelia sp. 1 specimen was invasive to the area and highlights the
utility of a database such as GenBank to assess whether seemingly anomalous populations
of medusae are invasive or endemic.
COI is the DNA barcoding gene of choice for most studies (Dawson et al., 2005, Dawson
and Jacobs, 2001, Holland et al., 2004). This has created databases with large amounts of
COI sequences, which in turn has provided numerous species replicates, densely sampled
across a diverse range of taxa, for DNA barcoding (Bucklin et al., 2011). The large
32
amount of COI sequences available for Aurelia sp. from a range of different localities
consequently enabled a phlylogeographic analysis of the Ningaloo specimens. In contrast,
Aurelia sp. 16S sequences were not used for this study as too few exist in GenBank
(Benson et al., 2009, Sayers et al., 2011) to create a comprehensive phylogenetic tree to
explore the sources of the Ningaloo Reef Aurelia sp. population. Future studies are needed
to sequence genes other than COI for DNA barcoding, to build up a database of genetic
data to enable multi-gene phylogenetic analyses of medusae populations around the world
(Bucklin et al., 2011).
2.5 Conclusion
A baseline of data has been established for the diversity and abundance of gelatinous
zooplankton at Ningaloo Reef, adding to data needed for the north-western Australian
region (Condon et al., 2012). Although, extensive sampling is needed through space and
time to sufficiently develop a database of gelatinous zooplankton in the north-western
Australian region. The use of short sequences of COI and 16S mitochondrial genes
assisted with discrimination of variation among and between medusae species, which was
undetectable by morphological identification, and indicated the diversity of gelatinous
zooplankton at Ningaloo Reef is higher than revealed by morphological identification.
Further studies are needed to assess the diversity and abundance of dangerous medusae,
such as cubozoans, and the level of endemism exhibited by populations of some species,
in north-western Australia, and more broadly, the Indian Ocean. For reliable and accurate
identification of gelatinous zooplankton species, it is recommended future studies use
both morphological and genetic approaches.

33
Chapter 3: Commensal associations between Aurelia aurita (Cnidaria:
Scyphozoa) and Ophiocnemis marmorata
3.1 Introduction
3.1.1 Associations between echinoderms and medusae
Medusae share commensal relationships with a diverse range of organisms (Ohtsuka et
al., 2009). For example, fish use medusae to protect themselves from predation, and are
often found living in or near the medusa (Brodeur, 1998, Lynam and Brierley, 2007). Fish
may also utilise medusae as a food source, either feeding directly on their host (D’Ambra
et al., 2015) or feeding on prey and parasites of the medusae (Lynam and Brierley, 2007).
Other organisms, such as crabs and hyperiid amphipods, often lay eggs within the tissue
of a medusa host and brood young on or inside the medusa (Fleming et al., 2014), or use
it as a pelagic nursery (Sal Moyano et al., 2012). Medusae also facilitate the dispersal of
benthic organisms that may “hitch a ride” on their bells (Pagès et al., 2007). Medusae,
therefore, often enhance the survival of commensal organisms that associate with them,
due to the protection and food sources they provide (D’Ambra et al., 2015), indicating
medusae may hold a significant role in supporting pelagic biodiversity (Doyle et al.,
2014).
Of all organisms that associate with medusae, associations between echinoderms and
medusae are the rarest. The only echinoderm to associate with medusae is the ophiuroid,
Ophiocnemis marmorata, which is usually a benthic organism that lives on soft substrates
in the Indian and Pacific Oceans (Marsh, 1998). In Australia, O. marmorata has been
found associating with medusae in Shark Bay and the Kimberley in Western Australia
(Table 6). To date, O. marmorata has only been found to associate with rhizostome
medusae (Table 6). This association has only been described five times (Berggren, 1994,
Fujita and Namikawa, 2006, Kanagaraj et al., 2008, Marsh, 1998, Panikkar and Raghu

34
Prasad, 1952) and is thought to be a form of phoresy, whereby the ophiuroids use the
jellyfish as a means of dispersing over large areas by ‘hitching a ride’ on the bell (Fujita
and Namikawa, 2006, Kanagaraj et al., 2008, Marsh, 1998, Ohtsuka et al., 2010, Panikkar
and Raghu Prasad, 1952). The reason for this association, however, is yet to be confirmed.
Table 6: Host rhizostome medusae associated with Ophiocenmis marmorata.
Family Species Locality Reference
Rhizostomatidae Rhopilema hispidium Palk Bay, Sri Lanka Pannikkar & Prasad
(1952)
Rhopilema hispidium Vellar estuary, India Kanagaraj et al.
(2008)
Rhopilema esculentum Kagoshima, Japan;
Palawan Island, the
Phillipines
Fujita & Namikawa
(2006)
Rhopilema nomadica Inhaca Island,
Mozambique
Berrgren (1994)
Cepheidae Cephea cephea Shark Bay, Western
Australia
Marsh (1998)
Netrostoma sp. Kimberley, Western
Australia
Marsh (1998)
Despite five studies reporting an association between O. marmorata and medusae (Table
6), the frequency of association between O. marmorata and medusae has never been
investigated. All studies have used few laboratory and in situ observations of O.
marmorata riding on medusae to describe the association (Fujita and Namikawa, 2006,
Kanagaraj et al., 2008, Marsh, 1998, Panikkar and Raghu Prasad, 1952). Most studies
have not collected data relating to the number of medusae hosting ophiuroids (Fujita and
Namikawa, 2006), the number of ophiuroids found on medusae (Fujita and Namikawa,
2006, Panikkar and Raghu Prasad, 1952), and have collected few measurements of
medusa and ophiuroid size (Kanagaraj et al., 2008, Marsh, 1998, Panikkar and Raghu
Prasad, 1952). Consequently, there are no data available to assess the frequency of

35
association between O. marmorata and medusae or whether size influences the number
of ophiuroids that associate with medusae.
Ophiuroids feed in a variety of ways and although the exact feeding method and diet of
O. marmorata is unknown (Stöhr et al., 2012, Warner, 1982), it is thought they may feed
on detritus (Marsh, 1998). As these ophiuroids have usually been found attached to the
oral arms of medusae, it is possible they sweep the surface of the oral arms in search of
food (Fujita and Namikawa, 2006, Marsh, 1998, Panikkar and Raghu Prasad, 1952). In
contrast, it has been suggested O. marmorata that associate with medusae are suspension
feeders, utilising the pulsating movement of their host to acquire food more efficiently
(Fujita and Namikawa, 2006, Kanagaraj et al., 2008). However, no studies have actually
investigated the diet of ophiuroids associating with jellyfish; in fact all studies have been
based on chance encounters and the association described using scarce observations.
3.1.2 Evidence needed to assess whether organisms are feeding on their medusa
host
A variety of approaches can be used to assess whether organisms are feeding on their
medusa host. For example, gut content analyses have been used to determine if associates
are feeding on their hosts (Riascos et al., 2012, Sal Moyano et al., 2012). However, as
jellyfish are not structurally robust and have no hard structures, it is difficult to identify
gelatinous tissue in stomachs once digestion has begun (D’Ambra et al., 2015) and even
if gut contents are preserved, gelatinous tissue often disintegrates (D’Ambra et al., 2015,
Mianzan et al., 1996, Mutlu, 1996). Sal Moyano et al. (2012) have used the presence of
nematocysts, which are not easily digested, in the gut contents of Libinia spinosa crabs
to infer the crabs’ diet. The species-specific structures needed to identify the type of
nematocyst present, however, were not visible and the species of medusa the nematocyst
came from could not be identified. Using the presence of nematocysts to infer diet is also
time consuming and although it provides evidence of predation on medusae, it does not

36
enable the proportion of gelatinous prey that is assimilated by the predator to be
determined (Sal Moyano et al., 2012). Gut contents also cannot distinguish between prey
that is assimilated (and so important to the nutrition of the predator) and prey that is
ingested incidentally (Fry, 2006).
Stable isotope analysis (SIA) can determine which foods are assimilated by a predator
and detect food sources not easily visualised in gut contents (Pitt et al., 2009a). Stable
isotopes reflect the history of metabolic processes of an organism (Peterson and Fry,
1987) and their use relies on potential prey sources, such as different plants or animals,
having distinct ratios of the common, light isotope to the heavy, rare isotope (West et al.,
2006). Carbon (13C/12C) is the foundation for the majority of energetic requirements for
pelagic organisms, while nitrogen (15N/14N) is involved in protein synthesis; therefore
both elements are commonly used in dietary studies (Lajtha and Michener, 2007, West et
al., 2006). The preferential respiration of the lighter 12C and excretion of lighter 14N
slightly enriches the heavier isotopes, 13C and 15N, therefore the carbon and nitrogen
isotope ratios in an organism’s tissues closely reflect the carbon and nitrogen isotope
ratios of their prey (Blanchet-Aurigny et al., 2012, DeNiro and Epstein, 1978, DeNiro
and Epstein, 1981).
A process known as fractionation, where isotopic ratios change slightly from one trophic
level to the next (i.e. from predator to prey) (McCutchan et al., 2003, Peterson and Fry,
1987) allows for δ13C and δ15N to be used as isotopic tracers (Lajtha and Michener, 2007,
West et al., 2006). δ13C is enriched only slightly from predator to prey, which is why it is
used to identify and trace potential food sources. δ15N reflects the trophic level at which
an organism feeds as it has a much greater stepwise enrichment from prey to predator
(Fleming et al., 2011, Lajtha and Michener, 2007, West et al., 2006). In addition, trophic
enrichment factors (TEFs) account for the variation in fractionation between predator and

37
prey and vary among species (Blanchet-Aurigny et al., 2012, Riascos et al., 2015). TEFs
are necessary to generate reliable estimates of the contribution of different sources to a
predator’s diet, and standard TEF values can be applied across different taxa (McCutchan
et al., 2003, Post, 2002, Vanderklift and Ponsard, 2003), though they are not applicable
to some organisms (D’Ambra et al., 2014).
Recently, stable isotope analysis has been used to infer the dietary sources of organisms
associating with medusae and has confirmed that a number of organisms, including fish,
crabs and hyperiid amphipods, feed on their medusae hosts (D’Ambra et al., 2015,
Riascos et al., 2015, Towanda and Thuesen, 2006). For example, D’Ambra et al. (2015)
and Riascos et al. (2015) both demonstrated that medusae provide the bulk of the
assimilated diet of fish and parasitic amphipods, which was confirmed by the high
proportion of medusae δ13C isotope ratios in their respective diets. Similarly, an earlier
study by Towanda and Thuesen (2006) used stable isotope analysis to infer the diet of a
brachyuran crab and a hyperiid amphipod and found that both may feed on their medusa
host. Behavioural observations as well as gut content analysis and examinations of fecal
pellet samples further supported their conclusion (Towanda and Thuesen, 2006). Fleming
et al (2014) used stable isotope analysis to demonstrate that parasitic hyperiid amphipods
use their medusae hosts as a seasonally abundant prey source. The association was
observed to be limited to seasons of high amphipod abundance and the longer amphipods
associated with their host, the more their diet appeared to reflect the isotopic signatures
of gelatinous tissue (Fleming et al., 2014). Therefore, stable isotope analysis presents a
valuable tool for the assessment of the dietary composition of organisms that associate
with medusae, particularly if the associate is suspected to be actually feeding on their
gelatinous host.

38
3.1.3 Aims and Hypotheses
The aims were: (1) to describe the prevalence of association between a medusa host,
Aurelia aurita, and the ophiuroid O. marmorata, (2) to determine whether the density of
ophiuroids was correlated with the size of host medusae, and (3) to use stable isotope
analysis to determine if O. marmorata were feeding on their scyphozoan hosts.
Specifically, it was hypothesised that density of ophiuroids on A. aurita medusae was
positively correlated with the size of the medusa, and that A. aurita contributed a minor
proportion of the ophiuroid’s diet.

39
3.2 Methods
3.2.1 Frequency of association and relationship between medusae size and number
of ophiuroids
Ninety two A. aurita medusae were sampled across eight sites in the northern section of
Ningaloo Reef, Western Australia, between 29th May and 26th June 2015. At each site, A.
aurita medusae were selected at random and collected from a boat using a hand-held dip
net. Medusae were placed in individual buckets and any ophiuroids present on the
jellyfish were removed. The number of ophiuroids present on each A. aurita medusa was
counted and the central disc diameter of each ophiuroid was measured to the nearest 1
mm. The bell diameter of the medusa was measured to the nearest 1 mm using a ruler.
3.2.2 Collection of ophiuroids, medusae and other potential prey
Thirty medusae and their associated ophiuroids were collected at two sites separated by
approximately 4km using a hand-held dip net (1 mm mesh size). All ophiuroids
associating with the medusae were collected. Medusae were stored on ice during
transportation to the laboratory but ophiuroids were transported alive and placed in
aerated seawater where they were maintained for 24 hours to allow them to evacuate their
guts.
Potential planktonic prey of ophiuroids and medusae were collected using plankton nets.
Four replicate plankton tows using a small net (diameter = 30 cm; mesh size = 53µm)
were conducted at each site to isolate seston (phytoplankton and particulate organic
matter), while four replicate plankton tows using a large net (diameter = 51 cm; mesh size
= 150 µm) were used to sample potential mesozooplankton prey. Sites were sampled two
days apart.

40
3.2.3 Sample processing
In the laboratory, medusae were placed on a plastic tray and rinsed with filtered seawater
until all associated debris was removed. Medusae were processed fresh as preservation
by freezing and or in ethanol can alter the isotopic signature of medusae (Fleming et al.,
2011). The bell diameter was measured to the nearest 1 mm and a sub-sample of the bell
was extracted from each medusa and dried. A ca. 5 cm2 sample of the bell was used for
SIA as the isotopic composition of the bell is similar to that of the whole body (D’Ambra
et al., 2014). The ophiuroid with the largest disc diameter from an individual medusa was
prepared for isotope analysis by rinsing it in filtered seawater to remove any detritus.
Additional ophiuroids were preserved in formaldehyde for identification purposes and
lodged as voucher specimens with the Western Australian Museum in Perth, Australia.
Different size classes of mesozooplankton were separated using sieves (500 µm, 300 µm
and 100 µm) and rinsed with filtered seawater. Any algal detritus present in the samples
was removed during sieving using forceps. Seston (53 µm – 100 µm) samples were sieved
through 100 µm mesh and filtered through pre-ashed Whatman GF/F filter papers using
a single stage vacuum pump.
All samples were dried in an oven at 60°C for a minimum of 96 hours to ensure samples
were at a constant weight and then homogenised to a fine powder using a mortar and
pestle. Samples collected on GF/F filter papers remained firmly embedded in the glass
fibre and were combusted and homogenised together (per Grey et al., 2000). Prior to
analysis of δ13C, samples of ophiuroids and plankton were decalcified by the drop-wise
addition of 1M HCl. Acid was added until the sample stopped bubbling and samples were
redried and weighed (±0.01 mg) into silver capsules (5 mm, Sercon). Ophiuroid and
plankton samples for δ15N analyses and all medusae samples (i.e. for both δ13C and δ15N
analyses) were left untreated and weighed into tin capsules (5 mm, Sercon).
41
3.2.4 Stable isotope analysis
The C and N isotopic ratios of ophiuroids, medusae, mesozooplankton and seston were
measured using a continuous flow isotope ratio mass spectrometer at the University of
California Stable Isotope Facility in Davis (UC SIF), California, USA, and reported as
per mil values (‰) against international standards (Vienna PeeDee Belemnite for C and
Air for N) using the following formula:
𝛿𝐻X (‰) = [(Rsample
Rstandard) − 1] × 103
where X = C or N, the superscript H gives the respective heavy isotope mass of the
element (13C or 15N) and R is the ratio of either 13C/12C or 15N/14N (Fry, 2006). Precision
of values as a standard are measured at 0.2‰ for 13C and 0.3‰ for 15N. During analyses,
samples were interspersed with replicates of at least two different laboratory standards,
selected to be compositionally similar to the samples being analysed.
3.2.5 Statistical analyses
The strength of the linear relationship between the density of ophiuroids and size of
medusae was analysed using Pearson’s Correlation Coefficient. Level of association was
denoted by r, with r values >0 indicating a positive correlation between the two factors.
One-way ANOVAs were used to test differences between δ13C and δ15N of samples
among sites and between acidified and non-acidified samples. Alpha level was 0.05. Prior
to the analyses, the assumption of normality was tested using residual plots (Q-Q plots)
and the assumption of homogeneity of variance was tested using Levene’s test. ANOVAs
were run using SPSS (version 20) statistical software.
The dietary composition of ophiuroids was modelled using SIAR (version 3.2.0), a
package in R (Comprehensive Archive Network site http://cran.r-project.org/). SIAR
reduces error due to generalised fractionation ranges by allowing for species-specific

42
fractionation ranges (D'Ambra, 2012, Parnell et al., 2010). SIAR fits a Bayesian mixing
model to the potential food sources of organisms, based on their derived isotopic ratios
(Parnell and Jackson, 2013), to estimate the proportion of sources contributing to an
organism’s diet (Parnell et al., 2010). Seston, mesozooplankton and A. aurita were
considered as potential prey of ophiuroids. For the analyses, samples from the two sites
were pooled.
Species-specific TEFs for O. marmorata do not exist so TEFs were selected based on a
previous study that estimated TEFs for two ophiuroid species (Blanchet-Aurigny et al.,
2012) and TEF values that are standard across different taxa (Post, 2002). The sensitivity
of the analysis to variation in TEFs was tested by comparing four different models using
four different TEFs (sensu Riascos et al. 2015) (Table 7). The TEFs in Model A were
derived from Post (2002) and are standard across different taxa (Table 7). The TEFs in
Model B were from Blanchet-Aurigny et al. (2012) and represent TEFs specific to the
fractionation ranges of ophiuroids (Table 7). Models C and D used TEFs modified from
the TEFs used for Model B (Blanchet-Aurigny et al., 2012) (Table 7). The TEFs in Model
C were increased by 0.5‰, while the TEFs in Model D were decreased by 0.5‰, to
simulate more variation in ophiuroid fractionation ranges (TEFs).
Table 7: Trophic enrichment factors (TEFs) used for SIAR analyses to assess the contribution of
each source to the diet of O. marmorata.
∆13C TEF ∆15N TEF Reason for use Reference
Model A 1.4 ± 1‰ 3.0 ± 1‰ Standard across taxa Post (2002)
Model B 1.5 ± 0.2‰ 4.0 ± 0.3‰ Ophiuroid-specific
Blanchet-
Aurigny et al.
(2012)
Model C 2.0 ± 0.2‰ 4.5 ± 0.3‰ Positively modified
ophiuroid-specific
Blanchet-
Aurigny et al.
(2012)
Model D 1.0 ± 0.2‰ 3.5 ± 0.3‰
Negatively
modified ophiuroid-
specific
Blanchet-
Aurigny et al.
(2012)

43
3.3 Results
3.3.1 Size-frequency distribution of medusae with and without ophiuroids and
relationship between medusa size and density of ophiuroids
Seventy three of the 92 A. aurita sampled (79%) hosted at least one O. marmorata.
Ophiuroids were generally located underneath the bell or amongst the oral arms (Figure
7). Disc diameter of ophiuroids ranged from 1 to 6 mm, with 67% of ophiuroids having a
disc diameter of 3 mm or larger (Figure 8).
Figure 7: Photo courtesy of 3 Islands (Whale Shark Tourism Operator). O. marmorata riding on
an A. aurita medusa (Ningaloo Reef). The ophiuroids are attached to the underside of the bell,
sitting underneath the oral arms.
20 mm
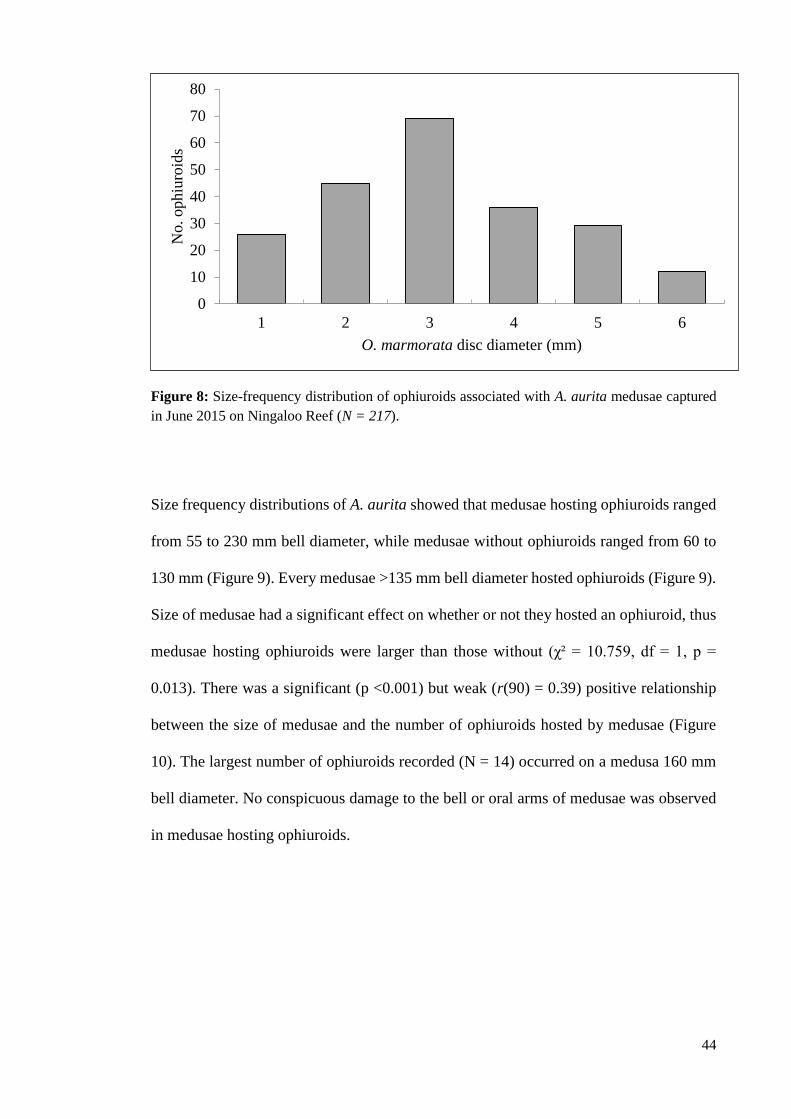
44
Figure 8: Size-frequency distribution of ophiuroids associated with A. aurita medusae captured
in June 2015 on Ningaloo Reef (N = 217).
Size frequency distributions of A. aurita showed that medusae hosting ophiuroids ranged
from 55 to 230 mm bell diameter, while medusae without ophiuroids ranged from 60 to
130 mm (Figure 9). Every medusae >135 mm bell diameter hosted ophiuroids (Figure 9).
Size of medusae had a significant effect on whether or not they hosted an ophiuroid, thus
medusae hosting ophiuroids were larger than those without (χ² = 10.759, df = 1, p =
0.013). There was a significant (p <0.001) but weak (r(90) = 0.39) positive relationship
between the size of medusae and the number of ophiuroids hosted by medusae (Figure
10). The largest number of ophiuroids recorded (N = 14) occurred on a medusa 160 mm
bell diameter. No conspicuous damage to the bell or oral arms of medusae was observed
in medusae hosting ophiuroids.
0
10
20
30
40
50
60
70
80
1 2 3 4 5 6
No. ophiu
roid
s
O. marmorata disc diameter (mm)

45
Figure 9: Size-frequency distribution of A. aurita medusae; medusae not associated with
ophiuroids (white bars, N = 19) and medusae associated with ophiuroids (black bars, N = 73),
captured in June 2015 on Ningaloo Reef.
Figure 10: Relationship between size of medusae (mm) and density of associating ophiuroids.
0
2
4
6
8
10
12
14
55
60
80
90
95
100
105
110
115
120
125
130
135
140
145
150
155
160
170
180
190
195
230
No. m
edusa
e w
ith o
r w
ithout
ophiu
roid
/s
A. aurita bell diameter (mm)
0
2
4
6
8
10
12
14
16
50
60
70
80
90
100
110
120
130
140
150
160
170
180
190
200
210
220
230
Den
sity
of
ophiu
roid
s
A. aurita bell diameter (mm)

46
3.3.2 Dietary composition of Ophiocnemis marmorata defined by stable isotope
analysis
A comparison of δ13C and δ15N values showed isotopic differences between O.
marmorata and their medusa hosts (A. aurita) (Figure 11). O. marmorata were enriched
in 13C by ca. 1.3‰ compared to their hosts, and were enriched in 15N by ca. 0.2 ‰ (Figure
11, Table 8).
Figure 11: Isotopic biplot showing variation in mean (±SD) δ13C and δ15N (‰) values calculated
for Ophiocnemis marmorata and key food sources potentially contributing to O. marmorata diet:
Aurelia aurita, mesozooplankton (500 µm, 300 µm and 100 µm size classes) and seston
(phytoplankton and particulate organic matter).
Table 8: Mean (±SD) δ13C and δ15N for O. marmorata and potential prey.
Taxon n δ13C δ15N
Ophiocnemis marmorata 17 -17.65 (2.5) 9.52 (0.3)
Aurelia aurita 20 -19.26 (1.2) 9.33 (0.3)
500 µm mesozooplankton 8 -18.48 (2.5) 6.62 (0.5)
300 µm mesozooplankton 6 -20.52 (1.5) 6.64 (0.4)
100 µm mesozooplankton 7 -19.40 (1.1) 7.31 (1.0)
Seston (phytoplankton and POM) 8 -17.45 (3.2) 6.88 (0.4)
5
6
7
8
9
10
11
12
-22 -21 -20 -19 -18 -17 -16 -15
Mea
n δ
¹⁵N
(±
SD
)
Mean δ¹³C (± SD)
Ophiocnemis marmorata
Aurelia aurita
500 µm Mesozooplankton
300 µm Mesozooplankton
100 µm Mesozooplankton
Seston

47
Four separate SIAR model runs using different TEFs (Table 7) indicated 500 µm-sized
mesozooplankton contributed the greatest proportion, ~50 – 75%, of the diet of O.
marmorata (CI = 95%) (Figure 12). The 300 µm-sized mesozooplankton contributed ~45
– 60% of the diet of O. marmorata while seston made up ~40 – 55% (CI = 95%) (Figure
12). However, the models showed 500 µm-sized mesozooplankton, 300 µm-sized
mesozooplankton and seston also contributed low amounts (0.3 – 7%; 0 – 5%; and 0 –
0.7% respectively) to the diet of O. marmorata (CI = 95%) (Figure 12), indicating
individuals of O. marmorata were feeding on a range of planktonic food sources, causing
variation in proportional ranges of sources. All four models indicated 100 µm-sized
mesozooplankton contributed a small amount (0 – 31% on average) to the diet of O.
marmorata, while the host medusa, A. aurita, contributed only 0 – 10% on average under
any scenario.
Acidification had no effect on δ15N values of O. marmorata (F(1,32) = 0.252 , p = 0.619),
mesozooplankton (F(1,48) = 0.599, p = 0.443) and seston (F(1,17) = 0.267, p = 0.612)
samples (Table 9). δ13C for mesozooplankton was significantly different between sites
and δ15N for seston was also significantly different between sites (Table 10). Site had no
effect on δ13C and δ15N for O. marmorata and A. aurita (Table 10).
Table 9: One-way ANOVA of differences between acidified and untreated δ15N samples.
Ophiocnemis marmorata
Source df F p
δ13N Between groups 1 .252 .619
Within groups 32
Total 33
Mesozooplankton (all sizes pooled)
Source df F p
δ13N Between groups 1 .599 .443
Within groups 48
Total 49
Seston
Source df F p
δ13N Between groups 1 .267 .612
Within groups 17
Total 18
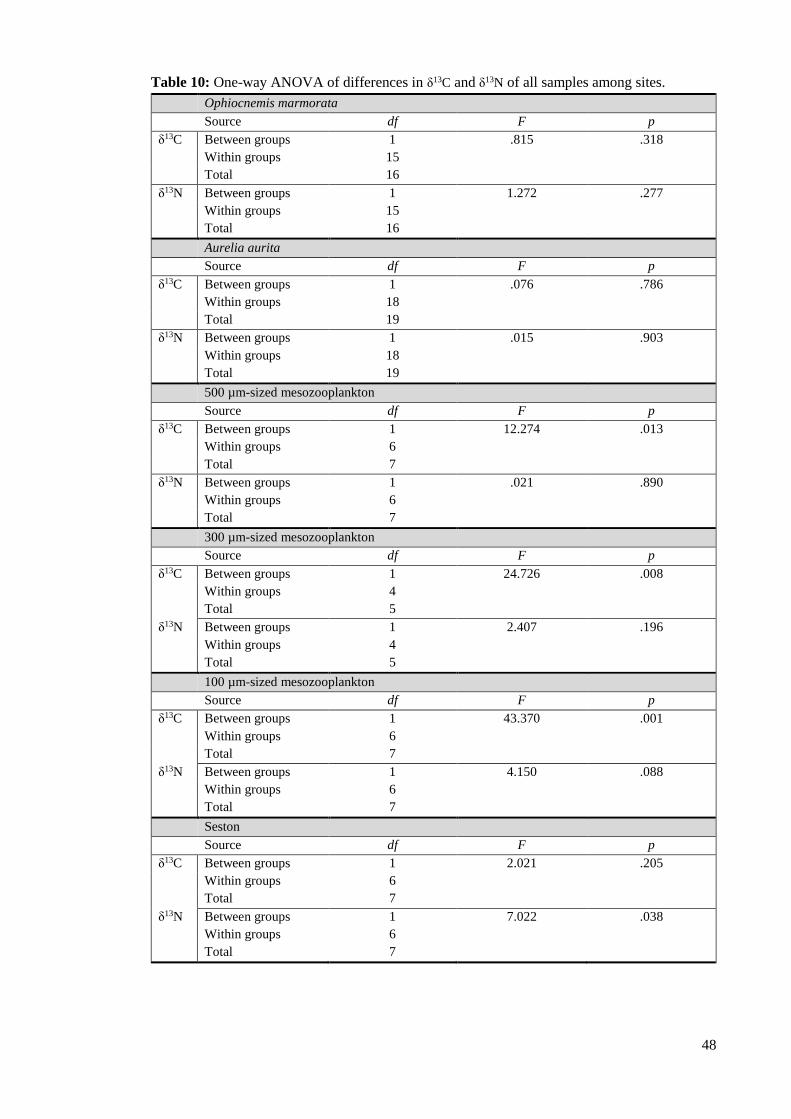
48
Table 10: One-way ANOVA of differences in δ13C and δ13N of all samples among sites.
Ophiocnemis marmorata
Source df F p
δ13C Between groups 1 .815 .318
Within groups 15
Total 16
δ13N Between groups 1 1.272 .277
Within groups 15
Total 16
Aurelia aurita
Source df F p
δ13C Between groups 1 .076 .786
Within groups 18
Total 19
δ13N Between groups 1 .015 .903
Within groups 18
Total 19
500 µm-sized mesozooplankton
Source df F p
δ13C Between groups 1 12.274 .013
Within groups 6
Total 7
δ13N Between groups 1 .021 .890
Within groups 6
Total 7
300 µm-sized mesozooplankton
Source df F p
δ13C Between groups 1 24.726 .008
Within groups 4
Total 5
δ13N Between groups 1 2.407 .196
Within groups 4
Total 5
100 µm-sized mesozooplankton
Source df F p
δ13C Between groups 1 43.370 .001
Within groups 6
Total 7
δ13N Between groups 1 4.150 .088
Within groups 6
Total 7
Seston
Source df F p
δ13C Between groups 1 2.021 .205
Within groups 6
Total 7
δ13N Between groups 1 7.022 .038
Within groups 6
Total 7

49
Figure 12: Percentage contribution of each source to the assimilated diet of Ophiocnemis
marmorata with A standard TEF values (Post, 2002), B ophiuroid-specific TEF values (Blanchet-
Aurigny et al., 2012), C positively modified ophiuroid-specific TEF values (+0.5 to values) and
D negatively modified ophiuroid-specific TEF values (-0.5 from values). Grey scale (from light
to dark) indicates 95, 75 and 50% confidence intervals, respectively.
TEF = ∆13C = 1.4 ± 1‰; ∆15N = 3.0 ± 1‰
TEF = ∆13C = 1.5 ± 0.2‰; ∆15N = 4.0 ± 0.3‰
TEF = ∆13C = 2.0 ± 0.2‰; ∆15N = 4.5 ± 0.3‰
TEF = ∆13C = 1.0 ± 0.2‰; ∆15N = 3.5 ± 0.3‰

50
3.4 Discussion
3.4.1 The association between O. marmorata and A. aurita
The ophiuroid O. marmorata has been found to associate with medusae in the Indo-
Pacific region, including India (Kanagaraj et al., 2008), Sri Lanka (Panikkar and Raghu
Prasad, 1952), Japan (Fujita and Namikawa, 2006), Mozambique (Berggren, 1994), the
Philippines (Fujita and Namikawa, 2006) and Western Australia (Marsh, 1998). O.
marmorata is now reported to associate with A. aurita medusae at Ningaloo Reef, which
is close to other areas in Western Australia where it has previously been found (see Marsh,
1998). Furthermore, medusae hosting O. marmorata in previous studies have all been
members of the order Rhizostomeae, and it is thought the stiff body, complicated form of
oral arms, coastal habitat and vertical movements of many of these types of medusae
facilitates their colonisation by O. marmorata (Fujita and Namikawa, 2006).
Interestingly, the medusae reported here, A. aurita, are members of the order
Semaeostomeae, which lack complex appendages (Yasuda, 1973). Therefore, it is now
recognised that O. marmorata associate with two orders of medusae, and that factors like
complex appendages, useful for attachment (Fujita and Namikawa, 2006, Kanagaraj et
al., 2008), may not significantly influence whether ophiuroids colonise medusae.
This study presents the first data on the frequency with which O. marmorata associates
with medusae and the relationship between the size of medusae and density of ophiuroids.
O. marmorata associated with 79% of A. aurita at Ningaloo Reef indicating the
association is a common occurrence. This is supported by a number of other studies that
have reported the association (Fujita and Namikawa, 2006, Marsh, 1998, Panikkar and
Raghu Prasad, 1952). The number of ophiuroids associating with medusae differed based
on the size of a medusa. There was a significant, positive relationship between the density
of ophiuroids and size (bell diameter) of medusae, suggesting ophiuroids tend to more

51
prolifically colonise medusae with larger bell diameters. Despite the correlation being
significant, however, only 39% of the variability between density of ophiuroids and size
of medusae was accounted for. A larger sample size may have revealed a stronger
relationship, though these results are still a robust indication of how the size of a medusa
may influence the amount of ophiuroids it hosts, and how frequent the association is.
There are a number of reasons why large medusae may be more likely to host ophiuroids
and host a higher number of them. Multiple cohorts of medusae were present at the time
of sampling, as indicated by the range of A. aurita size classes (Pitt and Kingsford, 2003).
The older cohort may have been present when the ophiuroids were available to recruit to
the medusae. Large medusae also provide a larger surface for colonisation, perhaps
increasing the likelihood of ophiuroids coming into contact with them and colonising the
medusae (Fujita and Namikawa, 2006). However, the method of colonisation is still
unclear (Fujita and Namikawa, 2006, Kanagaraj et al., 2008, Marsh, 1998).
As O. marmorata are typically benthic, two methods for colonising medusae have been
suggested (Fujita and Namikawa, 2006, Kanagaraj et al., 2008, Marsh, 1998). Firstly,
medusae may occasionally encounter the benthos as they swim thereby creating
opportunity for ophiuroids to attach to the medusae (Fujita and Namikawa, 2006, Marsh,
1998, Ohtsuka et al., 2009). O. marmorata have been found on the benthos in Exmouth
Gulf, which is 70 km south east of the Ningaloo Reef sampling locations used in this
study. Like rhizostome medusae, A. aurita medusae undergo vertical migration through
the water column (Yasuda, 1973). However, rates at which medusae encounter the
benthos may be insufficient to allow the high numbers of O. marmorata observed on A.
aurita at Ningaloo Reef to colonise the medusae so prevalently (Yasuda, 1973).
A second method of colonisation has been proposed by two authors (Kanagaraj et al.,
2008, Marsh, 1998), who believe ophiuroids may settle on the medusa body during their

52
planktonic larval stage. When compared to their counterparts on the benthos, ophiuroids
found riding on medusae were observed to be smaller (Fujita and Namikawa, 2006)
suggesting they may live and grow on the medusa in place of a benthic substrate
(Kanagaraj et al., 2008, Marsh, 1998). Similarly, O. marmorata found on A. aurita were
very small, ranging in size from 1 – 6 mm disc diameter. As some ophiuroid species reach
sexual maturity at 5 mm disc diameter (Hendler, 1975), it’s possible the ophiuroids found
on A. aurita were mostly in the juvenile developmental stage (Fujita and Namikawa,
2006). A number of other studies have found larger, and perhaps more mature, O.
marmorata specimens on medusae, ranging from around 6 – 124 mm disc diameter
(Fujita and Namikawa, 2006, Kanagaraj et al., 2008, Marsh, 1998). However, the 124
mm ophiuroid disc diameter seems erroneous, as benthic ophiuroids are usually around
20 mm (Ambrose et al., 2001). Regardless, O. marmorata specimens found on A. aurita
medusae may have colonised their hosts during their planktonic larval stage (Marsh,
1998), although further research is needed to determine the reproductive status of the
commensal O. marmorata to assess whether they were juveniles.
It remains unclear as to whether O. marmorata live on medusae hosts for the majority of
their life, or return to the benthos after to reaching a particular stage of life (or due to the
death of the medusa host) (Marsh, 1998). In the laboratory, O. marmorarata were
observed to detach from their host medusae after 8 hours, though it was unclear whether
that was a natural behaviour or due to the stress of being in captivity (Kanagaraj et al.,
2008). Further studies, employing both laboratory and in situ experiments, would be
needed to determine the duration for which O. marmorata associates with medusae to
assess whether the association is obligate, facultative or opportunistic (Fujita and
Namikawa, 2006).

53
3.4.2 Food sources of Ophiocnemis marmorata associating with Aurelia aurita are
largely plankton-based
Stable isotope analysis of ophiuroids and their potential sources of prey indicated that
mesozooplankton (500 µm- and 300 µm-sized) and seston represent a large proportion of
the diet of O. marmorata, while medusae hosts provided a negligible contribution. Also,
as A. aurita may have contributed up to 10% on average of the diet of O. marmorata, it
is possible the ophiuroids were scavenging prey from the oral arms of their medusa host,
and incidentally ingesting some of the medusa as they consume prey captured by their
host. Therefore, O. marmorata may display kleptoparasitism, defined as “a form of
competition that involves the stealing of already-procured items” (Iyengar, 2008).
Alternatively, as the majority of the ophiuroid’s diet is comprised of larger
mesozooplankton (500 µm- and 300 µm-sized) and seston, O. marmorata may also filter-
feed while sitting on the bell of a medusa (Fujita and Namikawa, 2006). Thus, A. aurita
present a platform for O. marmorata feeding, with ophiuroids possibly switching between
filter-feeding and scavenging, depending on food availability.
Different SIAR mixing models run using a range of TEFs indicated 500 µm-sized
mesozooplankton consistently contributed the largest proportion of the diet of O.
marmorata and that 300 µm-sized mesozooplankton and seston were also assimilated.
The models also consistently showed that medusae made a minor or no contribution to
the diet. Thus, ophiuroids feed on a range of different-sized plankton and any medusa
tissue in their diet is most likely due to incidental ingestion. To discern which source truly
contributes the largest proportion to their diet, species-specific TEFs for O. marmorata
are needed. It is recommended future studies follow the procedures outlined by Blanchet-
Aurigny et al. (2012), where the TEFs of two other ophiuroid species were estimated
using laboratory experiments. O. marmorata specimens would be fed a specific diet (e.g.
fish, mussel) daily (Blanchet-Aurigny et al., 2012). Individuals would be sampled

54
randomly over time, and kept in filtered seawater overnight to allow them to evacuate
their guts before being dried and ground to a fine powder for isotope analysis (Blanchet-
Aurigny et al., 2012).
Identification of food sources of O. marmorata may have been affected by variation in
δ13C values of prey. Large variation in δ13C values existed for 500 µm-, 300 µm- and 100
µm-sized mesozooplankton and in δ15N values for seston. The δ13C variation could be
due to the differences in the species composition of mesozooplankton among sites, or due
to the division of samples into size-classes, rather than division by species or genera
groups. Mesozooplankton species present in different-sized samples may have been more
depleted in δ13C, as indicated by previous studies (Jerling and Wooldridge, 1995,
Tamelander et al., 2006). The size of phytoplankton within seston samples may also have
created variation, as larger phytoplankton typically have more enriched δ15N values
(Parker et al., 2011). Moreover, upwelling events can influence N signatures of
phytoplankton (Brzezinski and Washburn, 2011), but given the sampling sites were in
close proximity (approximately 4 km apart) and were sampled two days apart, an
upwelling is not a likely explanation for variation in δ15N seston values between sites.
Overall, despite the variation among sites, all four TEF models still indicated plankton
formed the majority of the diet of O. marmorata, while under any scenario, A. aurita
contributed a minor proportion to the diet, if any.
3.5 Conclusion
The use of quantitative data in this study has led to a better understanding of the unusual
association between O. marmorata and medusae. The size of a medusa has an effect on
the prevalence of association, with larger medusae more frequently hosting higher
densities of O. marmorata. This could be due to a number of reasons, including the
recruitment and maturity of large medusae coinciding with ophiuroid colonisation, or

55
large bell sizes of medusae offering a larger surface for colonisation (Fujita and
Namikawa, 2006).
Stable isotope analysis provided evidence that O. marmorata is not feeding on its host.
Instead, stable isotopes allowed host medusae to be identified as a platform for ophiuroid
feeding. The association may also be a form of phoresy, allowing the ophiuroids to
disperse over large areas by riding on medusae (Fujita and Namikawa, 2006, Kanagaraj
et al., 2008, Ohtsuka et al., 2009). Both phoresy and the platform for feeding may
potentially enhance the survival of O. marmorata (D’Ambra et al., 2015). Through the
provision of ecosystem services, such as presenting a platform for pelagic feeding and
phoresy to organisms that typically adopt a benthic lifestyle, blooming medusae
populations may actually facilitate the biodiversity of pelagic communities (Doyle et al.,
2014).

56
Chapter 4: General Discussion
The perceived widespread increase in the global abundance of gelatinous zooplankton
still lacks rigorous foundation, as there is a scarcity of data relating to the abundance and
diversity of gelatinous zooplankton in most ecosystems (Brotz et al., 2012, Condon et al.,
2012). Detecting trends in gelatinous zooplankton populations is hindered by the lack of
a defined baseline for many ecosystems, caused by a dearth of long-term data on
gelatinous zooplankton (Condon et al., 2012). Blooms of gelatinous zooplankton have
been overlooked in older scientific literature (Galigher, 1925), causing many recent
blooms to be considered outbreaks (Condon et al., 2012). Furthermore, the study of the
diversity of gelatinous species can be impeded by the absence of data for species prior to
their discovery (Condon et al., 2012). Species may be misidentified as invasive species
due to a lack of prior observation of the native species (Bentlage et al., 2010, Gorokhova
et al., 2009).
Some regions of the world are more under-sampled than others for data on gelatinous
zooplankton (Condon et al., 2012, Lucas et al., 2014). While a large amount of data exists
for gelatinous zooplankton in the Northern Hemisphere, there is limited data for the
Southern Hemisphere (Condon et al., 2012, Lilley et al., 2011, Lucas et al., 2014).
Sampling efforts may be reduced in the Southern Hemisphere due to it being far more
sparsely populated (Small and Cohen, 2004) and having a greater area of ocean to sample
(see Figure 5 in Condon et al., 2012). Put simply, there are far less people available to
sample a wider expanse of ocean compared to the Northern Hemisphere, making it
inherently more difficult to obtain data on gelatinous zooplankton in the Southern
Hemisphere (Lucas et al., 2014).
This study has provided baseline data on the abundance and diversity of gelatinous
zooplankton for a region of the Southern Hemisphere where almost no gelatinous

57
zooplankton data exist: north-western Australia (Condon et al., 2012). It has also provided
baseline data for dangerous species, such as cubozoans, and highlighted the need for more
genetic data relating to cubozoans from north-western Australia, which, when integrated
with morphological diagnoses, will ensure correct identification of these dangerous
animals (Dawson, 2005b). Future studies would need to employ long-term temporal
sampling to detect trends in populations of gelatinous zooplankton in north-western
Australia, however there is now a reference point from which to base descriptions of
gelatinous zooplankton abundance and diversity. This will ultimately fill some of the
knowledge gaps relating to gelatinous zooplankton in the Southern Hemisphere and
perhaps uncover changes in abundance and diversity over time (Condon et al., 2012,
Lucas et al., 2014).
Through their association with a number of organisms, gelatinous zooplankton may
actually be enhancing the biodiversity of many other organisms in pelagic communities
(Doyle et al., 2014, Graham et al., 2014). In this study, a novel association between
ophiuroids and A. aurita medusae was observed. Medusae made a minor contribution, if
any, to the diet of the ophiuroid O. marmorata and instead provided their associated
ophiuroids with a platform for feeding and, potentially, a means of dispersal. In contrast,
a number of other studies have demonstrated that medusae usually contribute a significant
food source to the diet of their associates (D’Ambra et al., 2015, Riascos et al., 2015, Sal
Moyano et al., 2012). Intense temporal sampling of severely under-sampled regions in
the Southern Hemisphere may reveal similar outcomes, where an association with
gelatinous zooplankton is actually facilitating the survival of another organism. Thus,
gelatinous zooplankton may hold a significant role in the facilitation of biodiversity in
pelagic communities, which is why the paucity of gelatinous zooplankton data for the
Southern Hemisphere needs to be addressed.

58
References
Ambrose, W., Clough, L., Tilney, P. & Beer, L. 2001. Role of echinoderms in benthic
remineralization in the Chukchi Sea. Marine Biology, 139, 937-949.
Bailey, P. M., Bakker, A. J., Seymour, J. E. & Wilce, J. A. 2005. A functional comparison
of the venom of three Australian jellyfish—Chironex fleckeri, Chiropsalmus sp.,
and Carybdea xaymacana—on cytosolic Ca 2+, haemolysis and Artemia sp.
lethality. Toxicon, 45, 233-242.
Bayha, K. M. & Dawson, M. N. 2010. New family of allomorphic jellyfishes,
Drymonematidae (Scyphozoa, Discomedusae), emphasizes evolution in the
functional morphology and trophic ecology of gelatinous zooplankton. The
Biological Bulletin, 219, 249-267.
Benson, D., Karsch-Mizrachi, I., Lipman, D., Ostell, J. & Sayers, E. 2009. GenBank.
Nucleic Acids Research, 37, D26-D31.
Bentlage, B. 2010. Carybdea alata auct.(Cubozoa): rediscovery of the Alatina grandis
type. Zootaxa, 2713, 52-54.
Bentlage, B. 2012. PHYLOGENETIC SYSTEMATICS, TAXONOMY, AND
BIOGEOGRAPHY OF JELLYFISH (CNIDARIA: MEDUSOZOA).
Bentlage, B., Cartwright, P., Yanagihara, A. A., Lewis, C., Richards, G. S. & Collins, A.
G. 2010. Evolution of box jellyfish (Cnidaria: Cubozoa), a group of highly toxic
invertebrates. Proceedings of the Royal Society B: Biological Sciences,
rspb20091707.
Berggren, M. 1994. Periclimenes nomadophila and Tuleariocaris surec, two new species
of pontoniine shrimps (Decapoda: Pontominae), from Inhaca Island,
Mocambique. Journal of Crustacean Biology, 14, 782-782.
Blanchet-Aurigny, A., Guillou, M., Pernet, F., Gaffet, J.-D. & Dubois, S. F. 2012. Tissue-
diet discrimination factors of isotopic ratios (∆ δ 13 C and∆ δ 15 N) in two brittle
star species: Effect of reproductive state, diet and tissue composition. Journal of
Experimental Marine Biology and Ecology, 426, 68-77.
Bolton, T. F. & Graham, W. M. 2004. Morphological variation among populations of an
invasive jellyfish. Marine ecology. Progress series, 278, 125-139.

59
Brinkman, D. L. & Burnell, J. N. 2009. Biochemical and molecular characterisation of
cubozoan protein toxins. Toxicon, 54, 1162-1173.
Brodeur, R. D. 1998. In situ observations of the association between juvenile fishes and
scyphomedusae in the Bering Sea. Marine Ecology Progress Series, 163, 11-20.
Brotz, L., Cheung, W. L., Kleisner, K., Pakhomov, E. & Pauly, D. 2012. Increasing
jellyfish populations: trends in Large Marine Ecosystems. Hydrobiologia, 690, 3-
20.
Brown, A., Bejder, L., Cagnazzi, D., Parra, G. J. & Allen, S. J. 2012. The North West
Cape, Western Australia: A Potential Hotspot for Indo-Pacific Humpback
Dolphins Sousa chinensis? Pacific Conservation Biology, 18, 240-246.
Brzezinski, M. A. & Washburn, L. 2011. Phytoplankton primary productivity in the Santa
Barbara Channel: Effects of wind-driven upwelling and mesoscale eddies.
Journal of Geophysical Research: Oceans, 116.
Bucklin, A., Steinke, D. & Blanco-Bercial, L. 2011. DNA barcoding of marine metazoa.
Annual Review of Marine Science, 3, 471-508.
Buhay, J. E. 2009. “COI-like” Sequences are Becoming Problematic in Molecular
Systematic and DNA Barcoding Studies. Journal of Crustacean Biology, 29, 96-
110.
Cassata, L. & Collins, L. B. 2008. Coral Reef Communities, Habitats, and Substrates in
and near Sanctuary Zones of Ningaloo Marine Park. Journal of Coastal Research,
24, 139-151.
Catlin, J., Jones, T. & Jones, R. 2012. Balancing commercial and environmental needs:
Licensing as a means of managing whale shark tourism on Ningaloo reef. Journal
of Sustainable Tourism, 20, 163-178.
Condon, R. & Norman, M. 1999. Commensal associations between the hyperiid
amphipod, Themisto australis, and the scyphozoan jellyfish, Cyanea capillata.
Condon, R. H., Graham, W. M., Duarte, C. M., Pitt, K. A., Lucas, C. H., Haddock, S. H.
D., Sutherland, K. R., Robinson, K. L., Dawson, M. N., Decker, M. B., Mills, C.
E., Purcell, J. E., Malej, A., Mianzan, H., Uye, S.-I., Gelcich, S. & Madin, L. P.
2012. Questioning the Rise of Gelatinous Zooplankton in the World's Oceans.
Bioscience, 62, 160-169.

60
Crossley, S. M., George, A. L. & Keller, C. J. 2009. A method for eradicating amphipod
parasites (Hyperiidae) from host jellyfish, Chrysaora fuscescens (Brandt, 1835),
in a closed recirculating system. Journal of Zoo and Wildlife Medicine, 40, 174-
180.
D'ambra, I. 2012. Application of stable isotopes in the analysis of trophic interactions
between jellyfish and fish. University of South Alabama.
D’ambra, I., Carmichael, R. H. & Graham, W. M. 2014. Determination of δ13C and δ15N
and trophic fractionation in jellyfish: implications for food web ecology. Marine
Biology, 161, 473-480.
D’ambra, I., Graham, W. M., Carmichael, R. H. & Hernandez Jr, F. J. 2015. Fish rely on
scyphozoan hosts as a primary food source: evidence from stable isotope analysis.
Marine Biology, 1-6.
Dawson, M. 2003. Macro-morphological variation among cryptic species of the moon
jellyfish, Aurelia (Cnidaria: Scyphozoa). Marine Biology, 143, 369-379.
Dawson, M. 2004. Some implications of molecular phylogenetics for understanding
biodiversity in jellyfishes, with emphasis on Scyphozoa. Hydrobiologia, 530,
249-260.
Dawson, M. N. 2005a. Morphologic and molecular redescription of Catostylus mosaicus
conservativus (Scyphozoa: Rhizostomeae: Catostylidae) from south-east
Australia. Journal of the Marine Biological Association of the United Kingdom,
85, 723-731.
Dawson, M. N. 2005b. Morphological variation and systematics in the Scyphozoa:
Mastigias (Rhizostomeae, Mastigiidae)–a golden unstandard? Hydrobiologia,
537, 185-206.
Dawson, M. N., Gupta, A. S. & England, M. H. 2005. Coupled biophysical global ocean
model and molecular genetic analyses identify multiple introductions of
cryptogenic species. Proceedings of the National Academy of Sciences of the
United States of America, 102, 11968-11973.
Dawson, M. N. & Hamner, W. M. 2009. A character-based analysis of the evolution of
jellyfish blooms: adaptation and exaptation. Hydrobiologia, 616, 193-215.
61
Dawson, M. N. & Jacobs, D. K. 2001. Molecular Evidence for Cryptic Species of Aurelia
aurita (Cnidaria, Scyphozoa).
Deniro, M. J. & Epstein, S. 1978. Influence of diet on the distribution of carbon isotopes
in animals. Geochimica et cosmochimica acta, 42, 495-506.
Deniro, M. J. & Epstein, S. 1981. Influence of diet on the distribution of nitrogen isotopes
in animals. Geochimica et cosmochimica acta, 45, 341-351.
Doyle, J. J. & Gaut, B. S. 2000. Evolution of genes and taxa: a primer. Plant Molecular
Biology, 42, 1-23.
Doyle, T. K., Hays, G. C., Harrod, C. & Houghton, J. D. 2014. Ecological and societal
benefits of jellyfish. In: PITT, K. A. & LUCAS, C. H. (eds.) Jellyfish Blooms.
Springer.
Ekrem, T., Willassen, E. & Stur, E. 2007. A comprehensive DNA sequence library is
essential for identification with DNA barcodes. Molecular phylogenetics and
evolution, 43, 530-542.
Fischer, M. & Thatte, B. 2010. Revisiting an equivalence between maximum parsimony
and maximum likelihood methods in phylogenetics. Bulletin of mathematical
biology, 72, 208-220.
Fleming, N. E., Harrod, C., Griffin, D. C., Newton, J. & Houghton, J. D. 2014.
Scyphozoan jellyfish provide short-term reproductive habitat for hyperiid
amphipods in a temperate near-shore environment. Mar Ecol Prog Ser, 510, 229-
240.
Fleming, N. E., Houghton, J. D., Magill, C. L. & Harrod, C. 2011. Preservation methods
alter stable isotope values in gelatinous zooplankton: implications for interpreting
trophic ecology. Marine biology, 158, 2141-2146.
Fuchs, B., Wang, W., Graspeuntner, S., Li, Y., Insua, S., Herbst, E. M., Dirksen, P.,
Bohm, A. M., Hemmrich, G., Sommer, F., Domazet-Loso, T., Klostermeier, U.C.,
Anton-Erxleben, F., Rosenstiel, P., Bosch, T. C. & Khalturin, K. 2014. Regulation
of polyp-to-jellyfish transition in Aurelia aurita. Current Biology, 24 (3), 263-
273.
Fry, B. 2006. Stable isotope ecology, New York, Springer.

62
Fujita, T. & Namikawa, H. 2006. New observations of Ophiocnemis marmorata
(Echinodermata: Ophiuroidea) associated with Rhopilema esculentum (Cnidaria:
Scyphozoa: Rhizostomeae) in the Philippines and Japan. Memoirs of the National
Science Museum, Tokyo, 44, 3-28.
Galigher, A. 1925. On the occurrence of the larval stages of scyphozoa in the Elkhorn
Slough, Monterey Bay, California. American Naturalist, 94-96.
Garm, A., Bielecki, J., Petie, R. & Nilsson, D. E. 2012. Opposite patterns of diurnal
activity in the box jellyfish Tipedalia cystophora and copula sivickisi. The
Biological Bulletin, 222, 35.
Gershwin, L.-A. 2005a. Carybdea alata auct. and Manokia stiasnyi, reclassification to a
new family with description of a new genus and two new species. Memoirs of the
Queensland Museum, 51, 501-523.
Gershwin, L.-A. 2005b. Taxonomy and phylogeny of Australian Cubozoa. PhD Thesis,
James Cook University, Townsville, pp. 1-202.
Gershwin, L.-A. 2005c. Two new species of jellyfishes (Cnidaria: Cubozoa: Carybdeida)
from tropical Western Australia, presumed to cause Irukandji Syndrome. Zootaxa,
1084, 1-30.
Gershwin, L.-A. 2014. Two new species of box jellies (Cnidaria: Cubozoa: Carybdeida)
from the central coast of Western Australia, both presumed to cause Irukandji
syndrome. Records of the Western Australian Museum, 29, 10-19.
Gershwin, L. 2008. Morbakka fenneri, a new genus and species of Irukandji jellyfish
(Cnidaria: Cubozoa). Memoirs of the Queensland Museum–Nature, 54, 23-33.
Gershwin, L. & Hannay, K. 2014. An anomalous cluster of Irukandji jelly stings
(Cnidaria: Cubozoa: Carybdeida) at Ningaloo Reef. Records of the Western
Australian Museum, 29, 78-81.
Gorokhova, E., Lehtiniemi, M., Viitasalo-Frösen, S. & Haddock, S. H. 2009. Molecular
evidence for the occurrence of ctenophore Mertensia ovum in the northern Baltic
Sea and implications for the status of the Mnemiopsis leidyi invasion. Limnology
and Oceanography, 54, 2025-2033.

63
Gotoh, R. O., Ito, C., Mochizuki, S. & Hanzawa, N. Unpublished. Development of the
rapid identification method for the giant jellyfish, Nemopilema nomurai, in
possession of Yamagata University library, Japan, 2012.
Graham, W. M., Gelcich, S., Robinson, K. L., Duarte, C. M., Brotz, L., Purcell, J. E.,
Madin, L. P., Mianzan, H., Sutherland, K. R. & Uye, S.-I. 2014. Linking human
well-being and jellyfish: ecosystem services, impacts, and societal responses.
Frontiers in Ecology and the Environment, 12, 515-523.
Graham, W. M., Pagès, F. & Hamner, W. M. 2001. A physical context for gelatinous
zooplankton aggregations: a review. Hydrobiologia, 451, 199-212.
Greenberg, N., Garthwaite, R. & Potts, D. 1996. Allozyme and morphological evidence
for a newly introduced species of Aurelia in San Francisco Bay, California.
Marine Biology, 125, 401-410.
Hall, B. G. 2013. Building Phylogenetic Trees from Molecular Data with MEGA.
Molecular Biology and Evolution, 30, 1229-1235.
He, J. R., Zheng, L. M, Lin, Y. S., Zhang, W. J. & Cao, W.O. Unpublished. DNA
barcoding Medusazoa of China Seas, Xiamen University library, China, 2014.
Hendler, G. 1975. Adaptational significance of the patterns of ophiuroid development.
American Zoologist, 15, 691-715.
Herbert, P. D. N., Cywinska, A., Ball, S. L. & Dewaard, J. R. 2003a. Biological
identifications through DNA barcodes. Proceedings of the Royal Society: Biology
Letters, 270.
Herbert, P. D. N., Ratnaslngham, S. & Dewaard, J. R. 2003b. Barcoding animal life:
cytochrome c oxidase subunit 1 divergences among closely related species.
Proceedings of the Royal Society: Biology Letters, 270, S96-S99.
Hillis, D. & Wiens, J. 2000. Molecules versus morphology in systematics: conflicts,
artifacts, and misconceptions. Phylogenetic analysis of morphological data, 1-19.
Holland, B. S., Dawson, M. N., Crow, G. L. & Hofmann, D. K. 2004. Global
phylogeography of Cassiopea (Scyphozoa: Rhizostomeae): molecular evidence
for cryptic species and multiple invasions of the Hawaiian Islands. Marine
Biology, 145, 1119-1128.

64
Houghton, J. D., Doyle, T. K., Wilson, M. W., Davenport, J. & Hays, G. C. 2006. Jellyfish
aggregations and leatherback turtle foraging patterns in a temperate coastal
environment. Ecology, 87, 1967-1972.
Iyengar, E. V. 2008. Kleptoparasitic interactions throughout the animal kingdom and a
re‐evaluation, based on participant mobility, of the conditions promoting the
evolution of kleptoparasitism. Biological Journal of the Linnean Society, 93, 745-
762.
Jerling, H. & Wooldridge, T. 1995. Relatively negative δ13C ratios of mesozooplankton
in the Sundays River estuary, comments on potential carbon sources. Southern
African Journal of Aquatic Science, 21, 71-77.
Jones, N. 2014. Two newly discovered irukandji jellyfish species found off WA coast.
ABC News [Online]. Available: http://www.abc.net.au/news/2014-08-
06/irukandji-jellyfish-species-malo-bella-keesingia-found-off-wa/5650650.
Kanagaraj, G., Kumar, P. S. & Morandini, A. C. 2008. The occurrence of Ophiocnemis
marmorata (Echinodermata: Ophiuroidea) associated with the rhizostome medusa
Rhopilema hispidum (Cnidaria: Scyphozoa). Journal of Ocean University of
China, 7, 421-424.
Kingsford, M., Seymour, J. & O’callaghan, M. 2012. Abundance patterns of cubozoans
on and near the Great Barrier Reef. Jellyfish Blooms IV. Springer.
Kramp, P. L. 1961. Synopsis of the medusae of the world. Journal of the marine
biological Association of the United Kingdom, 40, 7-382.
Lajtha, K. & Michener, R. H. 2007. Stable isotopes in ecology and environmental science,
Malden, MA; Oxford, Blackwell.
Laval, P. 1980. Hyperiid amphipods as crustacean parasitoids associated with gelatinous
zooplankton. Oceanogr. Mar. Biol. Ann. Rev, 18, 11-56.
Lee, P. L., Dawson, M. N., Neill, S. P., Robins, P. E., Houghton, J. D., Doyle, T. K. &
Hays, G. C. 2013. Identification of genetically and oceanographically distinct
blooms of jellyfish. Journal of The Royal Society Interface, 10, 20120920.
Leung, T. & Poulin, R. 2008. Parasitism, commensalism, and mutualism: exploring the
many shades of symbioses. Vie et Milieu, 58, 107.

65
Lilley, M. K. S., Beggs, S. E., Doyle, T. K., Hobson, V. J., Stromberg, K. H. P. & Hays,
G. C. 2011. Global patterns of epipelagic gelatinous zooplankton biomass. Marine
Biology, 158, 2429-2436.
Lucas, C. H., Jones, D. O., Hollyhead, C. J., Condon, R. H., Duarte, C. M., Graham, W.
M., Robinson, K. L., Pitt, K. A., Schildhauer, M. & Regetz, J. 2014. Gelatinous
zooplankton biomass in the global oceans: geographic variation and
environmental drivers. Global ecology and biogeography, 23, 701-714.
Lv, J., Wu, S., Zhang, Y., Chen, Y., Feng, C., Yuan, X., Jia, G., Deng, J., Wang, C. &
Wang, Q. 2014. Assessment of four DNA fragments (COI, 16S rDNA, ITS2, 12S
rDNA) for species identification of the Ixodida (Acari: Ixodida). Parasit Vectors,
7, 93.
Lynam, C. P. & Brierley, A. S. 2007. Enhanced survival of 0-group gadoid fish under
jellyfish umbrellas. Marine Biology, 150, 1397-1401.
Marsh, L. 1998. Hitch-hiking ophiuroids. Echinoderms: San Francisco, 393-396.
Mayer, A. 1906. Medusae collected in the Hawaiian Islands by the steamer Albatross in
1902. Bull. US Fish Comm. 1903, 23, 1131-1143.
Mccutchan, J. H., Lewis, W. M., Kendall, C. & Mcgrath, C. C. 2003. Variation in trophic
shift for stable isotope ratios of carbon, nitrogen, and sulfur. Oikos, 102, 378-390.
Mianzan, H. W., Mianzan, H. W., Mari, N., Prenski, B. & Sanchez, F. 1996. Fish
predation on neritic ctenophores from the Argentine continental shelf: A neglected
food resource? Fisheries research, 27, 69-79.
Mills, C. E. 2001. Jellyfish blooms: are populations increasing globally in response to
changing ocean conditions? Jellyfish Blooms: Ecological and Societal
Importance, 55-68.
Miyajima, Y., Masuda, R., Kurihara, A., Kamata, R., Yamashita, Y. & Takeuchi, T. 2011.
Juveniles of threadsail filefish, Stephanolepis cirrhifer, can survive and grow by
feeding on moon jellyfish Aurelia aurita. Fisheries Science, 77, 41-48.
Morton, B. 2003. Ningaloo. Marine Pollution Bulletin, 46, 1213-1214.
Mutlu, E. 1996. Effect of formaldehyde on the gelatinous zooplankton (Pleurobrachia
pileus, Aurelia aurita) during preservation. Turkish Journal of Zoology, 20, 423-
426.

66
Ohtsuka, S., Koike, K., Lindsay, D., Nishikawa, J., Miyake, H., Kawahara, M., Mujiono,
N., Hiromi, J. & Komatsu, H. 2009. Symbionts of marine medusae and
ctenophores. Plankton and Benthos Research, 4, 1-13.
Ohtsuka, S., Kondo, Y. & Sakai, Y. 2010. In-situ Observations of Symbionts on Medusae
Occurring in Japan, Thailand, Indonesia and Malaysia< Article>. 広島大学総合
博物館研究報告, 9-18.
Ortman, B. D., Bucklin, A., Pagès, F. & Youngbluth, M. 2010. DNA Barcoding the
Medusozoa using mtCOI. Deep-Sea Research Part II, 57, 2148-2156.
Pagès, F., Corbera, J. & Lindsay, D. 2007. Piggybacking pycnogonids and parasitic
narcomedusae on Pandea rubra (Anthomedusae, Pandeidae). Plankton Benthos
Res, 2, 83-90.
Panikkar, N. K. & Raghu Prasad, R. 1952. Interesting association of ophiuroids, fish and
crab with the jellyfish Rhopilema hispidum. Journal of The Bombay Natural
History Society, 51, 295-296.
Parker, A. E., Wilkerson, F. P., Dugdale, R. C., Marchi, A. M., Hogue, V. E., Landry, M.
R. & Taylor, A. G. 2011. Spatial patterns of nitrogen uptake and phytoplankton
in the equatorial upwelling zone (110°W–140°W) during 2004 and 2005. Deep-
Sea Research Part II, 58, 417-433.
Parnell, A. C., Inger, R., Bearhop, S. & Jackson, A. L. 2010. Source partitioning using
stable isotopes: coping with too much variation. PloS one, 5, e9672.
Parnell, A. C. & Jackson, A. 2013. Package ‘siar’. Stable Isotope Analysis in R. 4.2 ed:
CRAN.
Pauly, D., Graham, W., Libralato, S., Morissette, L. & Palomares, M. D. 2009. Jellyfish
in ecosystems, online databases, and ecosystem models. Hydrobiologia, 616, 67-
85.
Peterson, B. J. & Fry, B. 1987. Stable isotopes in ecosystem studies. Annual review of
ecology and systematics, 293-320.
Phillips, P. J. 1973. The Occurrence of the Remarkable Scyphozoan, Deepstaria
enigmatica, in the Gulf of Mexico and Some Observations on Cnidarian
Symbionts. Gulf and Caribbean Research, 4, 166-168.

67
Pierce, J. 2009. Prediction, location, collection and transport of jellyfish (Cnidaria) and
their polyps. Zoo biology, 28, 163-176.
Pitt, K. A. & Kingsford, M. J. 2003. Temporal and spatial variation in recruitment and
growth of medusae of the jellyfish, Catostylus mosaicus (Scyphozoa:
Rhizostomeae). Marine and Freshwater Research, 54, 117-125.
Pitt, K. A., Connolly, R. M. & Meziane, T. 2009a. Stable isotope and fatty acid tracers in
energy and nutrient studies of jellyfish: a review. Jellyfish Blooms: Causes,
Consequences, and Recent Advances. Springer.
Pitt, K. A., Welsh, D. T. & Condon, R. H. 2009b. Influence of jellyfish blooms on carbon,
nitrogen and phosphorus cycling and plankton production. Hydrobiologia, 616,
133-149.
Post, D. M. 2002. Using stable isotopes to estimate trophic position: models, methods,
and assumptions. Ecology, 83, 703-718.
Raskoff, K. A., Sommer, F. A., Hamner, W. M. & Cross, K. M. 2003. Collection and
Culture Techniques for Gelatinous Zooplankton. Biological Bulletin, 204, 68-80.
Riascos, J., Vergara, M., Fajardo, J., Villegas, V. & Pacheco, A. 2012. The role of
hyperiid parasites as a trophic link between jellyfish and fishes. Journal of fish
biology, 81, 1686-1695.
Riascos, J. M., Docmac, F., Reddin, C. & Harrod, C. 2015. Trophic relationships between
the large scyphomedusa Chrysaora plocamia and the parasitic amphipod Hyperia
curticephala. Marine Biology, 162, 1841-1848.
Richardson, A. J., Bakun, A., Hays, G. C. & Gibbons, M. J. 2009. The jellyfish joyride:
causes, consequences and management responses to a more gelatinous future.
Trends in ecology & evolution, 24, 312-322.
Ross, H. A., Murugan, S. & Li, W. L. S. 2008. Testing the reliability of genetic methods
of species identification via simulation. Systematic biology, 57, 216-230.
Sal Moyano, M., Schiariti, A., Giberto, D., Briz, L. D., Gavio, M. & Mianzan, H. 2012.
The symbiotic relationship between Lychnorhiza lucerna (Scyphozoa,
Rhizostomeae) and Libinia spinosa (Decapoda, Epialtidae) in the Río de la Plata
(Argentina–Uruguay). Marine biology, 159, 1933-1941.

68
Savolainen, V., Cowan, R. S., Vogler, A. P., Roderick, G. K. & Lane, R. 2005. Towards
writing the encyclopaedia of life: an introduction to DNA barcoding.
Philosophical Transactions of the Royal Society B: Biological Sciences, 360,
1805-1811.
Sayers, E. W., Barrett, T., Benson, D. A., Bolton, E., Bryant, S. H., Canese, K.,
Chetvernin, V., Church, D. M., Dicuccio, M. & Federhen, S. 2011. Database
resources of the national center for biotechnology information. Nucleic acids
research, 39, D38-D51.
Schroth, W., Jarms, G., Streit, B. & Schierwater, B. 2002. Speciation and phylogeography
in the cosmopolitan marine moon jelly, Aurelia sp. BMC Evolutionary Biology,
2, 1.
Small, C. & Cohen, J. 2004. Continental Physiography, Climate, and the Global
Distribution of Human Population. Current Anthropology, 45, 269-277.
Sparmann, S. F., Ortaman, B. D. & Leander, B.S. Unpublished. Utility of 16S rDNA for
phylogenetic inference and phylogeography, University of British Colombia,
Vancouver, 2012.
Stöhr, S., O’hara, T. D. & Thuy, B. 2012. Global diversity of brittle stars (Echinodermata:
Ophiuroidea). PLoS One, 7, e31940.
Tamelander, T., Renaud, P. E., Hop, H., Carroll, M. L., Ambrose, W. G. & Hobson, K.
A. 2006. Trophic relationships and pelagic-benthic coupling during summer in the
Barents Sea Marginal Ice Zone, revealed by stable carbon and nitrogen isotope
measurements. Marine ecology. Progress series, 310, 33-46.
Tamura, K., Stecher, G., Peterson, D., Filipski, A. & Kumar, S. 2013. MEGA6: molecular
evolutionary genetics analysis version 6.0. Molecular biology and evolution, 30,
2725-2729.
Thibault-Botha, D. & Bowen, T. 2004. Impact of formalin preservation on Pleurobrachia
bachei (Ctenophora). Journal of experimental marine biology and ecology, 303,
11-17.
Towanda, T. & Thuesen, E. V. 2006. Ectosymbiotic behavior of Cancer gracilis and its
trophic relationships with its host Phacellophora camtschatica and the parasitoid
Hyperia medusarum. Marine Ecology Progress Series, 315, 221-236.

69
Vanderklift, M. A. & Ponsard, S. 2003. Sources of variation in consumer-diet δ15N
enrichment: a meta-analysis. Oecologia, 136, 169-182.
Warner, G. 1982. Food and feeding mechanisms: Ophiuroidea. Echinoderm nutrition.
Balkema, Rotterdam, 161-181.
West, J. B., Bowen, G. J., Cerling, T. E. & Ehleringer, J. R. 2006. Stable isotopes as one
of nature's ecological recorders. Trends in Ecology & Evolution, 21, 408-414.
Wood, D. & Glasson, J. 2005. Giving the environment a voice: the transformational
potential of valuing tourism in sensitive natural environments: the case of the
Ningaloo coastal region, Western Australia. Planning, Practice & Research, 20,
391-407.
Wrobel, D. & Mills, C. 1998. Pacific coast pelagic invertebrates: a guide to the common
gelatinous animals, Sea Challengers.
Yang, Z. 1993. Maximum-likelihood estimation of phylogeny from DNA sequences
when substitution rates differ over sites. Molecular Biology and Evolution, 10,
1396-1401.
Yasuda, T. 1973. Ecological studies on the jelly-fish, Aurelia aurita (Linné), in Urazoko
Bay, Fukui Prefecture-VIII. Diel vertical migration of the medusa in early fall,
1969.
Yuri, T., Kimball, R. T., Harshman, J., Bowie, R. C., Braun, M. J., Chojnowski, J. L.,
Han, K.-L., Hackett, S. J., Huddleston, C. J. & Moore, W. S. 2013. Parsimony and
model-based analyses of indels in avian nuclear genes reveal congruent and
incongruent phylogenetic signals. Biology, 2, 419-444.
Zheng, L., He, J., Lin, Y., Cao, W. & Zhang, W. 2014. 16S rRNA is a better choice than
COI for DNA barcoding hydrozoans in the coastal waters of China. Acta
Oceanologica Sinica, 33, 55-76.
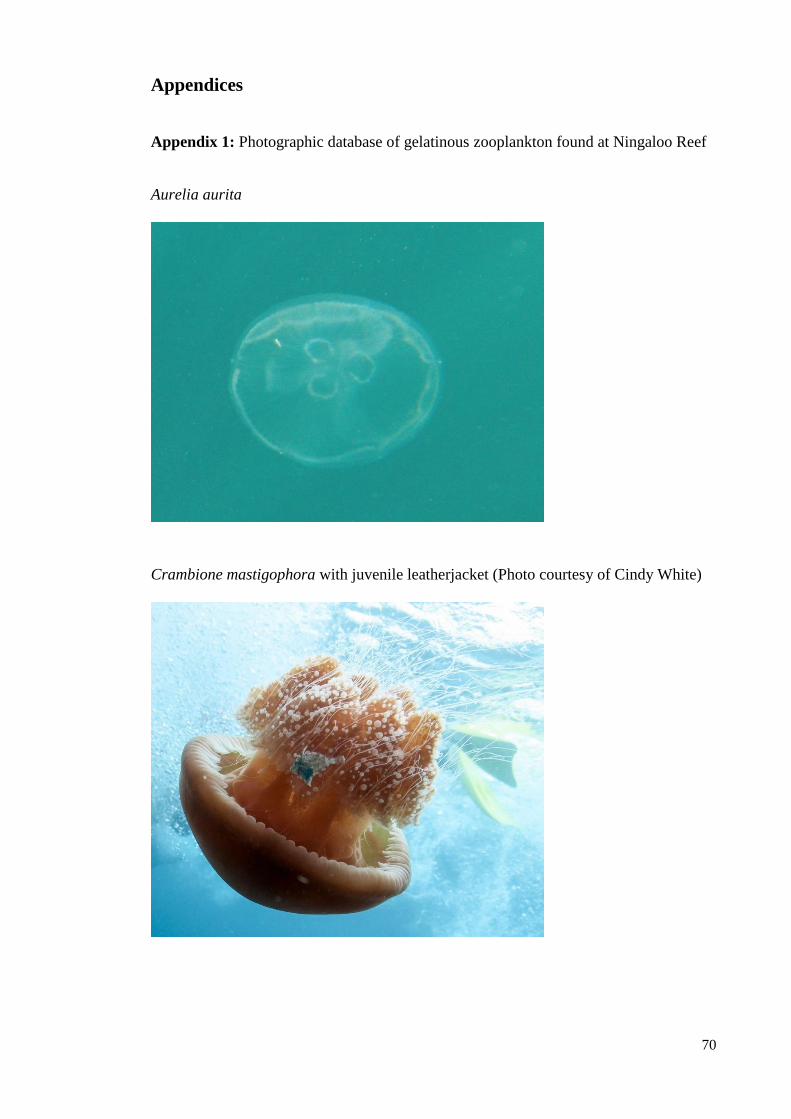
70
Appendices
Appendix 1: Photographic database of gelatinous zooplankton found at Ningaloo Reef
Aurelia aurita
Crambione mastigophora with juvenile leatherjacket (Photo courtesy of Cindy White)
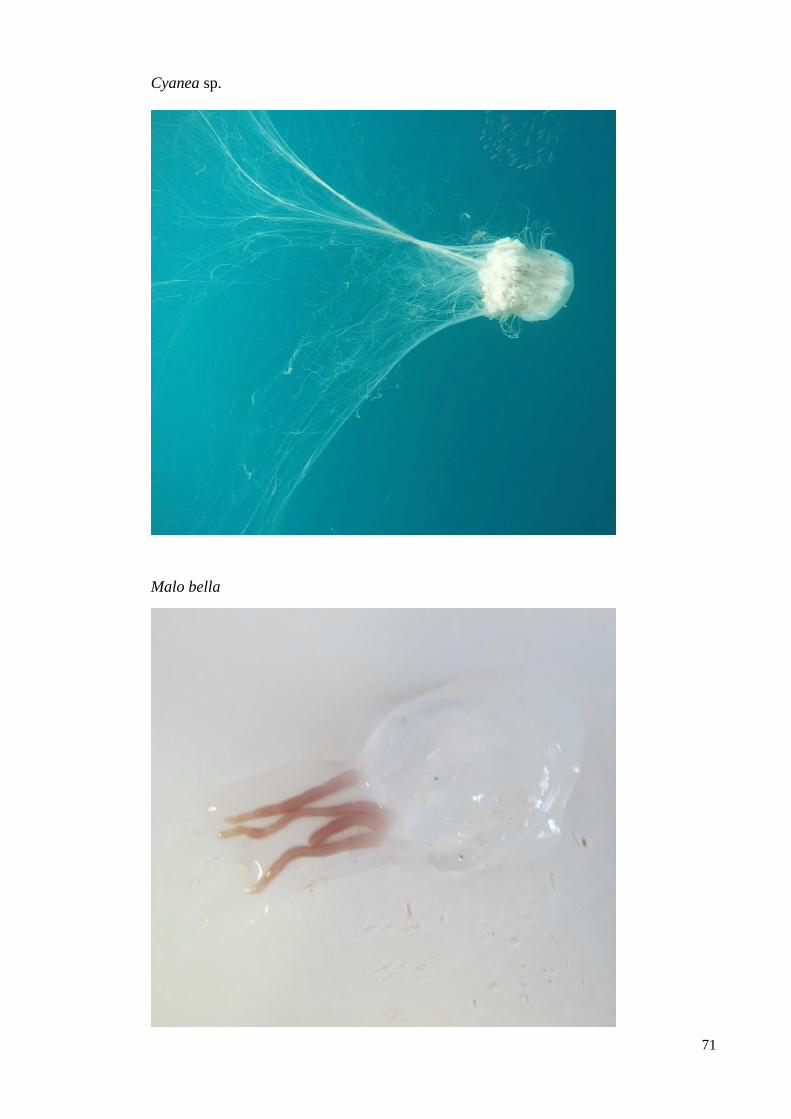
71
Cyanea sp.
Malo bella

72
Leptomedusae specimen
Aequorea australis
Rhizostome specimen