Embed Size (px)
Citation preview
T H E D I F F E R E N T I A T I O N P A T H W A Y OF T L Y M P H O C Y T E S
EVIDENCE FOR Two DIFFERENTIATED CELL TYPES*
BY ALEX MATTER~:
(From the Institut d'Histologie et d'lEmbryologie, Ecole de M~decine, Geneva, Switzerland)
(Received for publication 2 April 1974)
The ultrastructure of thymus-derived (T) lymphocytes from mouse spleen and lymph nodes has been described in a previous report (1). In the present study, differentiation steps for T lymphocytes have been established by study- ing cellular transformation in response to allogeneic stimulation. Two experi- mental models have been used: in the first a graft-vs.-host (GVH) l reaction was induced by injecting thymocytes or cortisone-resistant (CR) thymocytes into lethally irradiated allogeneic hosts (2, 3). This gave a donor T-cell popula- tion in the spleen with relatively weak cytotoxic activity when tested in the chromium release assay against tumor cells of the same H-2 specificity as the host (4). In the second, rejection of an allogeneic tumor graft (5) produced T cells of very high cytotoxic activity in the peritoneal cavity. Morphologically there were two differentiated T-cell types, a dark one mainly seen in the GVH reaction and resembling the cell described earlier (1), and a pale one, very frequent during tumor graft rejection. Circumstantial evidence suggests that this latter is the cytotoxic T cell.
Materials and Methods
Animals.--CBA/J (H-2k), C57/BL6 (H-2b), DBA/2 (H-2d), CDH (H-2k), Balb/c (H-2 a) mice were obtained from C.S.E.A.L., Centre National de la Recherche Scientifique, OrlEans- ta-Source, France, and Bomholtgard, Ry, Denmark.
Tumor Cell Lines.--RBL-3, a C57/BL6 lymphoma (kindly donated by Dr. M. Potter, N.I.H., Bethesda, Md.), and P-815, a DBA/2 mastocytoma (kindly donated by Dr. K. T. Brunner, I.S.R.E.C., Lausanne, Switzerland), were used.
Antisera.--Rabbit anti-mouse-specific lymphocyte antigen (aMSLA), rabbit antimouse Ig (RaMIg), mouse anti-~-CsH, and sheep antirabbit Ig (SaRIg) coupled to rhodamine (rho) or to horseradish peroxidase (pox) were prepared as described previously (6). Alloantisera of
* Supported by the Swiss National Science Foundation grant no. 3.8080.72. :~ Present address: Immunology Division, National Institute for Medical Research, Mill
Hill, London NW7 1AA, England. 1 Abbreviations used in this paper: BaS, brain-associated 0-antigen; C, complement; CR,
hydrocortisone resistant; EM, electron microscopy; ER, endoplasmic reticulum; FN, fila- mentous network; GVH, graft-vs.-host; MSLA, mouse-specific lymphocyte antigen; aMSLA, anti-MSLA serum; pox, horse radish peroxidase; RaMIg, rabbit antimouse Ig; rho, tetra- methylrhodamine; SaRIg, sheep antirabbit Ig.
566 THE JOURNAL OF EXPERIMENTAL MEDICINE • VOLUME 140, 1974
on January 3, 2019jem.rupress.org Downloaded from http://doi.org/10.1084/jem.140.2.566Published Online: 1 August, 1974 | Supp Info:
ALEX MATTER 567
C57/BL6 anti-DBA/2 and of DBA/2 anti-C57/BL6 were obtained by repeated intraperitoneal injections of allogeneic spleen cells until strong cytotoxic titers were obtained.
Cytotoxicity Tests.--Complement-dependent cytotoxicity was determined by trypan blue dye exclusion (7) using agarose-absorbed rabbit serum (8) as the source of complement (C).
Preparation of Hydrocortisone-Resistant (CR) Thymocytes.--6-wk old C57 and A mice were injected with 3 mg of hydrocorfisone succinate (Solu-Cortef, Upjohn Co., Kalamazoo, Mich.) according to Blomgren and Andersson (2) and killed 48 h later, 1 h after intraperitoneal injec- tion of indian ink to facilitate removal of the smallest thymus-adherent lymph nodes.
Stimulation of Thymocytes in a GVH Reaction.--DBA/2 mice were lethally irradiated (850 R) and injected intravenously with 100 X l0 s thymocytes (or 10-20 X 106 CR-resistant thymocytes), according to the protocol of Cerottini et al., (4). 3-6 days later, the mice were killed and their spleen cells used (these mice seldom survive more than 5-6 days).
Isolation of T Lymphocytes Cytotoxic for Allogeneic Tumor Cdls.--The protocol of Berke et al., (5) was used with minor modifications. 10-15 X l0 s RBL-3 (H-2 ~) or P-815 (H-g a) tumor cells were injected intraperitoneally into adult mice of a different H-2 locus. The recipient mice were killed 7-14 days later, 30 min after an intraperitoneal injection of indian ink. The cells harvested from their peritoneal cavity were mainly lymphocytes and macro- phages (easily identified by the ingested carbon), the tumor cells were usually dead by 10 days. The lymphocytes were purified by removal of the adherent cells either by passage through glass bead columns (Superbrite, type 100-5,005, 3M Co., St. Paul, Minn.) according to Rosenthal et al., (9), or by three successive incubations of 30 rain at 37°C in plastic culture dishes (Falcon Plastics, Div. of BioQuest, Oxnard, Calif.) on a rocking platform (3 cpm), the cells being suspended in medium RPMI 1640 (Microbiological Associates Inc., Bethesda, Md.) containing 6% fetal calf serum (Flow Laboratories, Irvine, Ayrshire, Scotland). The final cell suspensions contained 90-95% lymphocytes. The cytotoxicity of these lymphocytes was determined using 51Cr-labeled tumor ceils according to the protocol of Cerottini and Brunner (10).
Fractionation of Nonadherent Cytotoxic T Lymphocytes.--Nonadherent peritoneal cells were fractionated either on Sephadex G-200 (Pharmacia Fine Chemicals AB, Uppsala, Sweden) linked with rabbit antimouse Fab, antibody (11), or on Degalan (Degalan V26, Degussa Wolfgang AG, Hanau am Main, Germany) columns carrying complexes of mouse Ig and rabbit antimouse Ig (12).
Phase Contrast Microcinematography of Living Cdls.--The ceils, suspended in culture medium containing 10% fetal calf serum, were introduced into a transparent perfusion cham- ber on a phase contrast microscope (Zeiss Universal, Oberkochen, West Germany) placed in a plexiglass incubator maintaining a temperature of 37°C.
Processing of Cells for Immunofluorescence and Electron Microscopy.--Processing occurred as previously described (1, 6). For processing small numbers of cells for electron microscopy, plastic capsules were used (BEEM, LKB Produkter AG, Stockholm, Sweden), the pellet being centrifuged at 150 g after each step.
RESULTS
T h e morpho logy of the different cell types tha t were encounte red in cell sus-
pensions of normal and cor t i sone- t rea ted t h y m u s will be deal t wi th in a separa te
repor t (A. M a t t e r , manusc r ip t in prepara t ion) . I t shall suffice here to say tha t
the cell types present af ter allogeneic s t imula t ion were no t seen among thymo-
cytes nor C R - t h y m o c y t e s . Th is was also t rue for mice in jec ted wi th syngeneic
thymocytes . T h e spleens of these l a t t e r animals y ie lded only small l ymphocy te s
wi th a pale " e m p t y " cy top lasm, p la sma cells, macrophages , and neutrophi ls .
Stimulation of Thymocytes by GVH Reaction.--Table I i l lustrates the rap id
568 DIFFERENTIATION OF MOUSE T CELLS
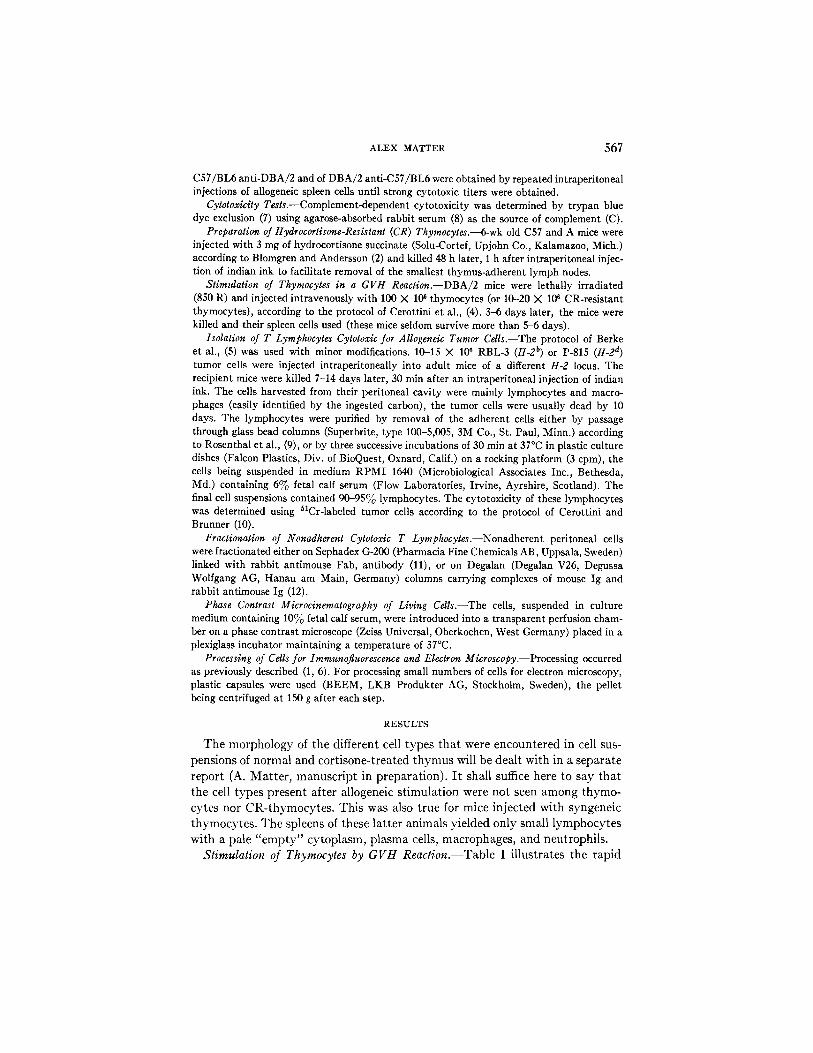
TABLE I GVH Reaction Induced with Allogeneic Cells in Lethally Irradiated Hosts
(Controls: Syngeneic Cells)
Hosts* Injected with: killed Day Total no. Average cells no. of Average of of exp. recovered/spleen host cells:[:
%
DBA/2 8 X 10⁷ DBA/2 thymocytes 4 1 0.6 N 106 ND C57 8 X 10⁷ C57 thymocytes 4 1 0.75 × 10⁶ ND DBA/2 10 s C57 thymocytes 3 2 107 10 DBA/2 l0 s C57 thymocytes or 2 X 10⁷ 4 6 5 N 106 19
CR-thymocytes§ DBA/2 l0 s C57 thymocytes or 2 X 10⁷ 5 5 1.5 X 10⁶ 30
CR-thymocytes§ DBA/2 10 s C57 thymocytes 6 1 106 30
* Irradiated 850 rad, groups of 10 animals. J/Host cells identified with alloantibodies produced in the donor strain (C57), used either
in cytotoxicity tests (9) with Agar-absorbed rabbit complement (10) or in fluorescence with a sandwich technique (less than I% of cells stained directly with RaMIG-F1 because of sur- face Ig, so Ramig-F1 could be used to detect alloantibodies).
§ See Material and Methods section.
proliferation that occurs in the spleen of lethally irradiated mice injected with allogeneic cells. Spleen weights at day 4 were increased 2-3 times over non- injected lethally irradiated controls.
Spleen cell suspensions were prepared 3-6 days after allogeneic cell injection and the ultrastructure of the donor cells examined. Though all stages of transi- tions occurred donor cells were classified arbitrarily into three categories:
(a) Blast cells: These huge cells contained considerable numbers of poly- ribosomes, often in a "rosette" configuration, usually some profiles of rough endoplasmic reticuhlm, and sometimes one or several dense granules. These T blasts were identical in all respects to the T blasts observed in the spleen or lymph nodes of normal mice immunized with various antigens. These cells were dividing very rapidly. If the spleens were fixed in situ at day 4 after grafting, 1 h after colchicine treatment (300 #g i.p.), mitotic figures could be seen in roughly 1 out of every 10-20 cells.
(b) Big dark cells: Big dark cells were smaller than blasts and of strikingly dark appearance due to large accumulations of closely packed monoribosomes and homogeneously greyish, usually peripheral, areas of the cytoplasmic matrix (Fig. 1). At high magnification these areas are seen to consist of a dense fila- mentous network (FN) (inset, Fig. 1). Usually these cells also had several elongated profiles of endoplasmic reticulum, a Golgi area mainly consisting of irregularly distributed flattened vesicles, granules, and autophagosomes.
(c) Small dark cells: This cell differed from the dark big cell mainly in its size (slightly bigger than a small thymocyte but much smaller than a big dark

ALEX~TTER 569
Fie. 1. Donor lymphocyte from the spleen of irradiated DBA/2 mice on day 5 after C57 B1 thymocyte injection. This cell type, classified as a big, dark cell, contains a vast number of monoribosomes, several ER profiles, and irregularly shaped vesicles. The mostly peripheral greyish zones (*) are illustrated at higher magnification in the inset: these zones have a fibrillar aspect closely resembling a filamentous network.
cell) and in its reduced content of the cytoplasmic const i tuents found in the big dark cells (Fig. 2).
Microcinematography.--Lymphocytes obtained from the spleen 5 days after thymocyte injection flatten out very rapidly on glass surfaces and are extremely motile, project ing large cytoplasmic veils of quickly varying shape.

570 DIFFERENTIATION OF MOUSE T CELLS
Fro. 2. Donor lymphocyte from the spleen of irradiated DBA/2 mice on day 5 after C57 BI thymocyte injection. This ceil is a representative of the small, dark cells containing Golgi complex, ER and also autophagosomes (*) and myelinic figures (arrows).
All the cells described above were shown to be T cells originating from the injected thymocytes by the following experiments: (a) They all carried MSLA as shown by incubation in rabbit anti MSLA followed by SaRIg-pox. The cells were not stained when aMSLA was replaced by normal rabbit serum. (b) They survived incubation with anti DBA/2 alloantiserum plus C, this killed the residual host cells. (c) They fixed anti-C57 but not anti-DBA/2 alloantibodies. The alloantibodies were demonstrated by incubation with RaMIg followed by SaRIg-pox. Since none of these cells carried detectable surface mouse Ig they did not stain directly with RaMIg followed by SaRIg-pox.
The frequencies of these three cell types were determined by counting at least 100 cells on days 3-5 (Fig. 3). There was a peak of blast cells at day 3, a peak of big, dark cells at day 5, and a peak of small dark cells at day 5. This sequence strongly suggests a differentiation of donor T cells during the GVH reaction, from a precursor thymocyte to a blast cell, and then to a big dark and possibly to a small dark cell. I t would also mean that the cytoplasmic

O BLASTS
A BIG DARK
rn SMALL DARK
571
L)
8 §
ALEX MATTER
DA*S 3 [21 41'=] S[2] FIG. 3. Counts of donor cell types during the GVH reaction. Number of experiments in
parentheses. For interpretation see text.
features of dark ceils such as the Golgi apparatus, the FN, the granules and the lysosomes are acquired during this period, and it seems logical to assume that these differentiation products are linked to the effector role of GVH cells.
In chromium release assays with labeled Mastocytoma P-815 cells as targets, these cells were only weakly cytotoxic, in keeping with the results of Cerottini et al., (4). Ratios of killer to targets of 10:1 produced up to 40% lysis after 8 h of incubation, in other experiments lyric activity was minimal.
Purification of Cytotoxic T Lymphocytes after In Vivo Rejection of Allogeneic Tumour Cells, and Study of Their Interactions with Their Targets.--Using minor modifications of the protocol of Berke, Sullivan, and Amos (5) cells were col- lected from the peritoneal cavity of mice injected intraperitoneally 10-14 days earlier with allogeneic tumor cells. After removal of the glass-adherent peritoneal cells the population (recovery: 30-50 %) was almost exclusively T lymphocytes (more than 95 % in some experiments), as judged by rabbit aMSLA followed by SaRIg-rho for immunofluorescence, and by SaRIg, pox for electron micros- copy (EM). Remaining macrophages were easily recognizable because they contained large amounts of indian ink. Granulocytes made up 5-10% of the purified population. A few residual degenerating tumor cells of very large size were occasionally observed. The purified population of T lymphocytes were highly cytotoxic when mixed for 2 h with fresh tumor cells labeled with 5tCr (50 % lysis at ratios of 1 : 1 killer to target cells). This cytotoxicity was entirely suppressed by pretreatment with mouse anti-0-C3H or rabbit aMSLA plus C.
On passage of cytotoxic, nonadherent cells through columns of Sephadex coupled to rabbit antimouse Fab (11), about 25 % of the cells and about 30%
572 D I F F E R E N T I A T I O N OF MOUSE T CELLS
of the lytic activity was lost. Both losses are considered to be unspecific, since fractionation on Sephadex alone gave practically the same losses. Fractionation on Degalan carrying antigen-antibody complexes (12) resulted in a far more serious loss. The cell number was decreased by about 50% and the lyric ac- tivity of the effluent cells by about 80 %. Since Degalan columns coated with normal mouse serum took between 30 and 35 % of the cells, the specific loss was 15-20 %. All lymphocyte-like cell types (see below) were recovered in the effluent. The loss in lyric activity might be associated with the mitochondrial swelling which was very conspicuous in the case of Degalan-fractionated cells. I t is concluded from these column experiments that cells carrying surface im- munoglobulins or Fc receptor sites do not represent a numerically or func- tionally important part at this stage of the tumor graft rejection. Since the origin of the effector cell population in this system is uncertain it was essential that the surface markers used to identify the cells should be reliable. Several additional controls were carried out to ascertain the specificity of the aMSLA: (a) Normal spleen cells treated with anti-0 and C, and subsequently with aMSLA and SaRIg-pox, were not labeled. (b) The cell population elicited by proteose-peptone (1 ml 10% i.p., 72 h before sacrifice) was rich in macrophages and monocytes (--~50 %) but did not contain more than 3 % cells positive with aMSLA as detected by immunofluorescence. In EM aMSLA and SaRIg-pox gave only faint background labeling of the same cells. (c) The cell suspensions always had a few remaining macrophages and granulocytes. These were not stained by a MSLA followed by SaRIg-pox. Therefore, aMSLA is considered a reliable and specific T-cell marker.
Ultrastructure of Cytotoxic T lymphocytes.--Cytotoxic T lymphocytes from the peritoneal cavity may be divided into two classes: dark cells and pale cells. They are similar in size, about equivalent to a medium-sized lymphocyte, and neither phagocytoses carbon particles.
The dark cell: This cell is rich in monoribosomes, has a peripheral dense FN, a variously developed Golgi apparatus, a few short profiles of ER, one or two granules, and an occasional autophagosome. These cells were not seen attached (0/25) to target cells after incubation in a chromium release assay and staining with aMSLA and SaRIg-pox. Their frequency declined rapidly after rejection of the tumor. They accounted for 25 % of aMSLA plus cells on day 10, but only for 7 % on day 12 and 3 % on day 14 (one experiment for each time point). By day 14 there were often signs of cell degeneration. The similarity of these dark cells with some of the GVH cells is quite striking. Since the killing effi- ciency of purified peritoneal cells declined hardly at all over this time period (A. Matter add B. A. Askonas, unpublished observations) the dark cells are presumably not the main cytotoxic T cell.
The pale cell (Fig. 4): The differences between dark and pale cells are quantitative, not qualitative: the pale cell has less ribosomes, less ER, and less granules, but a more developed Golgi, more autophagosomes, bigger vacuoles,

FIG. 4. Cell found in the peritoneal cavity at the height (day 10-12) of an allogeneic tumor rejection (RBL-3 of C57 BI origin in CBA or C3H mice). Pale cells of this type form the large majority of cytotoxic T lymphocytes at the height (day 10-12) of allogeneic tumor rejection. They do not possess a lot of ribosomes but have many vesicles, granules, multi- vesicular bodies, autophagosomes, vacuoles, and occasionally fat droplets.
Fro. 5. Pale T cell (surface labeling with aMSLA and SaRIg-pox) found after incubation with fresh RBL-3 cells to be attached to a tumor cell. The latter has many microvilli.
573

574 DIF F ERENTIATION OF MOUSE T CELLS
and more microvesicles, often of the coated type. There are often one or two fat droplets. Curiously, the mitochondrial matrix is usually much denser in pale cells. Microtubules are frequent, as well as fibrils of 80-100 ~ diameter. The FN is a constant feature and well developed. At high magnifications it seems to be less densely packed than in GVH cells; it is therefore more easily resolved as a meshwork of filaments. This network seems to be linked to the 100 .~ fibrils as well as to the microtubules. Pale cells are often seen attached to target cells when fixed in situ in the conditions of the chromium release assay (Fig. 5). Microcinematography shows that attachment precedes target cell destruction; therefore pale cells seem to be the cytotoxic T cells. However, at- tachment does occur, though less frequently, with tumor cells other than those used for sensitization. The ultrastructural characteristics of the attachment and the events leading to target cell destruction will be dealt with in a separate report (A. Matter, manuscript in preparation).
DISCUSSION
The two systems used to study T-cell differentiation resulted in two func- tionally different cell populations--the GVH reaction induced only limited lyric activity, tumor graft rejection induced an enormously efficient T-killed cell population. During GVH reaction in the conditions used in these experi- ments thymocytes differentiated into rapidly dividing blast cells, and further into big dark and, possibly, into small dark cells. This differentiation took place within about 5 days and resulted in a surprisingly homogeneous cell population. The tumor graft rejection did not show cell differentiation from a known start- ing population, but after rejection there was a functionally and morphologically very well defined T-cell population. This population comprises two cell types: a small number of relatively dark cells resembling the GVH cells, and a ma- jority of pale cells. Circumstantial evidence indicating that these pale cells are the killer cells can be summarized as follows: (a) killing, as measured by the chromium release assay, late in graft rejection is roughly equivalent to killing at the height of the rejection; the dark cells, however, have practically disap- peared at this late stage; (b) attachment, that is actual contact of killer cells with target cells, is important for killing as demonstrated by our time-lapse study (unpublished observations) and by other investigators as well. aMSLA plus cells seen attached to target cells after incubation in the conditions of the chromium release test are exclusively of the pale type.
Therefore there seem to be two varifies of differentiated T cells: a dark GVH cell and a pale killer cell. This finding recalls recent evidence which seems to indicate that there are at least two peripheral T cells, T1 and T~, differing in their life span, homing pattern, surface antigens, sensitivity to drugs, X-rays, and mitogens (reviewed in 13, 14, 15).
Currently it is believed that T1 cells are the precursors of killer cellS, and respond to transplantation antigens which are determined by the K and D loci
ALEX MATTER 575
of the H-2 chromosome (16, 17). T8 cells, however, are thought to be precursors of "amplifier" cells in the GVH reaction. They respond to the gene products of one or several MLC loci on the H-2 chromosome (18, 19) or of the M-locus (20). Synergy between T~ and T~ cells has been demonstrated in vivo (21), and, more recently, in vitro, during generation of cytotoxic cells (22, 23, 24). Specific absorption experiments have made it possible to distinguish a slowly dividing killer cell population from a rapidly dividing MLC population (17).
In the light of all these findings it is tempting to suggest that the pale killer cells seen late in tumor graft rejection are the progeny of TI cells, while the dark cell seen during the GVH reaction may be mainly amplifier cells, which are not cytotoxic directly. The small number of dark cells found at the height of tumor graft rejection might be amplifiers of the pale killer cells. Alterna- tively these dark cells might be precursors of the pale cells, a possibility which cannot be ruled out at this moment. In further experiments we shall try to elucidate the role of the strikingly different cytoplasmic machinery of the two cell types.
SUMMARY
Two experimental models have been used to study T-cell differentiation. The first, a graft-vs.-host reaction, was induced by injecting thymocytes or corti- sone-resistant thymocytes into lethally irradiated allogeneic mice. The second was tumor graft rejection in allogeneic hosts. Ultrastructural studies at various time intervals revealed two differentiated T-cell types. One of these (the "pale" cell) is probably high cytotoxic as measured in the chromium-release assay, the other (the "dark" cell) may be an "amplifier" cell, helping in the differentiation of cytotoxic cells.
I wish to thank Dr. Anne Cross for proofreading and helpful criticism. Many thanks are due to Miss Chantal Bonnet for expert technical assistance. Photographic reproductions were done by Mr. J.-C. Rumbeli. Mr. M. Baumann provided the set-up for microcinematography.
REFERENCES
1. Matter, A., B. Lisowska-Bernstein, J. E. Ryser, J.-P. Lamelin, and P. Vassalli. 1972. Mouse thymus-independent and thymus-derived lymphoid cells. II. Ultrastructural studies. J. Exp. Med. 136:1008.
2. Blomgren, H., and B. Andersson. 1969. Evidence for a small pool of immuno- competent cells in the mouse thymus. Exp. Cell Res. 57:185.
3. Cohen, J. J., M. Fischbach, and H. N. Claman. 1970. Hydrocortisone resistance of graft-vs.-host activity in mouse thymus, spleen and bone marrow. J. Im- munol. 105:1146.
4. Cerottini, J. C., A. A. Nordin, and K. T. Brunner. 1970. In vitro cytotoxic activity of thymus cells sensitised to alloantigens. Nature (Lond.). 227:72.
5. Berke, G., K. A. Sullivan, and B. Amos. 1972. Rejection of ascites tumor allo- grafts. II. A pathway for cell-mediated tumor destruction in vitro by peritoneal exudate lymphoid cells. J. Exp. Med. 136:1594.
576 DIFFERENTIATION OF MOUSE T CELLS
6. Lamelin, J.-P., B. Lisowska-Bernstein, A. Matter, J. E. Ryser, and P. Vassalli. 1972. Mouse thymus-independent and thymus-derived lymphoid cells. I. Im- munofluorescent and functional studies. J. Exp. Med. 136:984.
7. Boyse, E. A., L. J. Old, and I. Chouroulinkov. 1964. Cytotoxic test for demonstra- tion of mouse antibody. Methods Med. Res. 10:39.
8. Cohen, A., and M. Schlesinger. 1970. Absorption of guinea pig serum with agar. A method for elimination of its cytotoxicity for murine thymus cells. Trans- plantation. 10:130.
9. Rosenthal, A. S., D. L. Rosenstreich, J. M. Davie, and J. Th. Blake. 1972. Isola- tion and characterization of cellular immune effector cells: evidence for the heterogeneity of such cells in the guinea pig. In Proceedings of the 6th Leucocyte Culture Conference. M. R. Schwarz, editor. Academic Press, Inc., New York. 433.
10. Cerottini, J. C., and K. T. Brunner. 1971. In vitro assay of target cell lysis by sensitized lymphocytes. In In Vitro Methods in Cell-Mediated Immunity. B. R. Bloom and P. R. Glade, editors. Academic Press, Inc., New York. 369.
11. Schlossman, S. F., and L. Hudson. 1973. Specific purification of lymphocyte populations on a digestible immunoadsorbent. J. lmmunol. 110:313.
12. Wigzell, H., K. G. Sundqvist, and T. O. Yoshida. 1972. Separation of cells ac- cording to surface antigens by the use of antibody-coated columns. Fractiona- tion of cells carrying immunoglobulins and blood group antigens. Scancl. J. Immunol. 1:75.
13. Asofsky, R., H. Cantor, and R. E. Tigelaar. 1971. Cell interactions in the graft- versus-host response. In Progress in Immunology. B. Amos, editor. Academic Press, Inc., New York. 369.
14. Raft, M. C., and H. Cantor. 1971. Subpopulations of thymus cells and thymus- derived lymphocytes. In Progress in Immunology. B. Amos, editor. Academic Press, Inc., New York. 83.
15. Stobo, J. D. 1972. Phytohaemagg!utinin and concanavalin A: probes for routine "T" cell activation and differentiation. Transplant. Rev. 11:60.
16. Alter, B. J., D. J. Schendel, Marilyn L. Bach, F. H. Bach, J. Kkin, and J. H. Stimpfling. 1973. Cell-mediated lympholysis. Importance of serologically defined 1t-2 regions. J. Exp. Med. 137:1303.
17. Bach, F. H., M. Segall, Karen Stouber Zier, P. M. Sondel, B. J. Alter, and M. L. Bach. 1973. Cell-mediated immunity: separation of cells involved in recognitive and destructive phases, Science, (Wash. D. C.). 180:403.
18. Livnat, S., J. Klein, and F. H. Bach. 1973. Graft versus host reaction in strains of mice identical for H-2K and H-2D antigens. Nat. New Biol. 243:42.
19. Klein, J., and J. M. Park. 1973. Graft-vs.-host reaction across different regions of the H-2 complex of the mouse. J. Exp. Med. 137:1213.
20. Abbasi, K., and H. Festenstein. 1973. Antigenic strength investigated by cell- mediated lympholysis in mice. Eur. J. Immunol. 3:430.
21. Tigelaar, R. E., and R. Asofsky. 1973. Synergy among lymphoid cells mediating the graft-vs.-host response. V. Derivation by migration in lethally irradiated recipients of two interacting subpopulations of thymus-derived cells from normal spleen. J. Exp. Med. 137:239.
22. Cohen, L., and M. L. Howe. 1973. Synergism between subpopulations of thymus-

ALEX MAWT~R 577
derived cells mediating the proliferative and effector phases of the mixed lymphocyte reaction. Proc. Natl. Acad. Sci. U. S. ,4.70:2707.
23. Wagner, H. 1973. Cell-mediated immune responses in vitro: interaction of thymus- derived cells during cytotoxic allograft responses in vitro. Science, (Wash. D. C.). 181:1170.
24. H~yry, P., and L. C. Andersson. 1974. T cell synergy in mixed lymphocyte culture- induced cytolysis. Eur. J. Immunol. 4:145.