Embed Size (px)
Citation preview
Transportation Research Record I 106
4. Deflection tests successfully profile the loss in pavement strength during the spring thaw period, and can be used to establish when the spring posting period should end.
5. A correlation appears to exist between depth of thaw and the peak deflection.
RECOMMENDATIONS
1 . Deflection tests should not be used to establish the time when spring axle weight limits should be posted.
2. The spring posting period should have begun by the time the thaw depth reached 6 in.
3. Deflection tests should be used to aid in determining when the spring posting period should end.
4. More research should be conducted to determine if the depth of thaw defines peak deflection (D 1 ), which, if true, would eliminate the need for deflection testing.
5. Frost tubes should be installed in all test sections. 6. A period of 3 weeks after peak deflection should be
considered the criterion for removal of spring posting limits.
145
ACKNOWLEDGMENT
Invaluable assistance to this study was provided by District 2 Materials personnel; the Office of Materials Engineering; and research assistants Karl Keel and Gerald Teig.
REFERENCE
I. M. S. Hoffman and M. R. Thompson. Mechanistic Interpretation of Nondestructive Pavement Testing Deflections. Transportation Engineering Series 32. Civil Engineering Studies, Illinois Cooperative Highway and Transportation Series No. 190, University of Illinois, U rbaha-Champaign, June 1981.
The contents of rhis paper reflecr the views of the aurhors and do nor necessarily reflect the official policies of the Minnesota Deparrmenr of Transporrarion. This paper does nor constitute a standard, specification, or regulation.
The Development of a Procedure for Analyzing Load Limits on Low-Volume Roads EMMANUEL G. FERNANDO, DAVID R. LUHR, ANDHARI N. SAXENA
The Commonwealth of Pennsylvania has 44,000 miles of roads under its jurisdiction, the majority of which have pavements with limited structural capacity. The state has the authority to restrict axle loads on its roads if it believes that those axle loads would result in excessive damage to the pavement structure. The purpose of the research reported herein was to develop rational guidelines for the posting of load limits. To evaluate the effect of axle loads under a variety of conditions, a theoretical analysis was conducted that considered various load magnitudes and configurations for different pavement thicknesses and material properties. It was found that axle configuration (i.e.,
E.G. Fernando and D.R. Luhr, Department of Civil Engineering, The Pennsylvania State University, University Park, Pa. 16802. H. N. Saxena, Public Works Department, Jaipur, India.
single-, tandem-, and triple-axle assemblies) did not significantly affect theoretical pavement response, provided that the load per tire and the tire pressure remained the same. After the axle loads were analyzed, a performance model was developed that uses deflection measurements from either the road rater or the Falling Weight Deflectometer to predict pavement performance for a given level of traffic. A microcomputer program was written that incorporates the new procedure and includes a default traffic stream that is typical of low-volume rural roads. The program generates information on the predicted number of years to failure for different load limits, which would enable the user to quantitatively consider the effects of axle-load limits on pavement deterioration. In addition, information useful for determining which axle loads are responsible for pavement damage is provided by the program. An example is given of how the responsibility for pavement damage can be converted to cost responsibility by assessing charges to heavy haulers.

146
Throughout the worid, low-volume roads make up the greater part of most road networks . The Interstate highway system comprises less than 2 percent of the total road mileage of the United States. Much of the roadway network in this country is composed of thin, l1t:xible pavement structures that are intended to ca rry low' volumes of traffic. In Pennsylvania, these roads are termed type D (collector) and type E (local) roads.
Each state has a specified maximum, legal load limit for a single-axle truck, for a tandem-axle truck, and for maximum gross vehicle weight (GVW). However, low-volume roads often do not have an adequate structural capacity to carry axle loads at the legal load limit for all or part of the year. In the spring, when the ground is thawing, the bearing capacity of these pavements is significantly reduced . The expense of importing materials for low-volume roads that are not susceptible to frost is prohibitive. To circumvent this problem, some legal codes allow for the posting of load limits below the state's legal maximum.
The Commonwealth of Pennsylvania has 44,000 miles of roads under its jurisdiction. About two-thirds of these are lowvolume roads which, in other states, would be the responsibility of local governments. Because the majority of these low-volume roads have pavements with limited structural capacity, the state has the authority to restrict axle loads if it is believed that those axle loads would result in excessive damage to the pavement structure. In Pennsylvania, the establishment of load restrictions below the legal load limit is authorized by Section 4902 of the Motor Vehicle Code. Under this law, Commonwealth and local authorities may impose restrictions on the weight or size of vehicles allowed to operate on a particular route whenever it is determined that, without such restrictions, excessive damage may occur to the road. Section 4902 also authorizes Commonwealth and local authorities to issue permits allowing the movement of vehicles that exceed the limits of size and weight and to require sufficient security to cover the cost of repairing the pavement damage due to the movement of heavy vehicles.
The maintenance districts in Pennsylvania currently enforce a JO-ton GVW limit for posted roads. Chapter 15 of the Pennsylvania Department of Transportation's (PaDOT) Maintenance Manual establishes a uniform, statewide policy on hauling in excess of posted load limits (I) . This load-limit specification is based on GVW and was selected on the basis of engineering judgment and experience.
The posting of load limits on the basis of GVW poses a fundamental problem. The load of the vehicle is transmitted through the axle tires, and the load applied by each tire depends on the number of tires per axle. Tandem and triple axles have more tires than single axles ; therefore, they can carry a heavier load and put the same stress on the pavement as a single axle with a lighter load . Because pavement performance is related more accurately to axle loads and axle types than to GVW, the posting ofload limits should be based on a maximum load for a given axle type.
The development of a rational and comprehensive procedure for posting load limits is presented in this paper. The following methodology was used in the development of the procedure:
• Analysis of axle loads and axle types • Development of a performance prediction equation • Development of a structural evaluation procedure • Development of the load-limit analysis procedure
Framework for load-limit analysis
Transportation Research Record 1106
Determination of load limits Determination of damage responsibility for different
axle loads Development of a microcomputer program
The procedure was developed for implementation on a microcomputer and uses deflection measurements from either a road rater or a Falling Weight Deflectometer (FWD) to determine the expected pavement life for different axle-load limits. In addition, the percentage of total damage that resulted from a particular axle load was determined so that estimates of pavement-damage responsibility could be made.
ANALYSIS OF AXLE LOADS AND TYPES
An important step in the development of the procedure for determining load limits was the analysis of the effect of axle loads and types on pavement response_ This analysis was conducted by examining theoretical solutions of a linear, elastic pavement analysis computer program called BISAR (2). A three-layer pavement structure (surface, base, and subgrade) was selected for the analysis because it was representative of the typical pavements of low-volume roads in Pennsylvania. Three different levels (associated with low, medium, and high values) were chosen for five pavement parameters: surface thickness, surface modulus, base thickness, base modulus, and subgrade modulus. Because of its importance to this study, five different levels were selected for the variable of load magnitude. The values chosen for the different factor levels (Table I) represent a broad range of pavement and loading conditions, and include the range of surface and base thicknesses typically found in low-volume roads in the state.
TABLE 1 LEVELS OF VARIABLES USED IN THE STUDY
Variable
Load in kips (all dual tires) (a) Single axle (b) Tandem axle (c) Triple axle
Surface thickness T 1 (in) Surface modulus: El (psi)
Granular base thickness: T2 (in) Granular base modulus: E2 (psi)
Subgrade modulus: E3 (psi)
Levels
6; 12; 18; 24; 30 12; 24; 36; 48; 60 18; 36; 54; 72; 90 I: 5.5; 10 80 x 103; 540 x 103
1,000 x 103
3· 9· 15 I~ ~ 1 0~ 40 x 103
70 x 103
3 x 10~ 10 x 103
17 x 103
The possible combinations of all values of all factors result in 35 by 5, or 1,215 observations for each axle configuration included in the study. The pavement deflections, the horizontal strain at the bottom of the asphalt concrete layer, and the vertical strain at the top of the subgrade were calculated for all of these combinations. These pavement response parameters are commonly used to predict pavement performance, and it was therefore important to evaluate how they are affected by the different variables included in the study. In the discussions that follow, the findings from the analysis are presented. The discussions have been limited to subgrade strain because this

FERNANDO ET AL. 147
pavement response parameter has been strongly related to the performance of low-volume roads. In addition, the trends observed for the other performance prediction parameters were found to be similar to those for subgrade strain; they are therefore not reported separately.
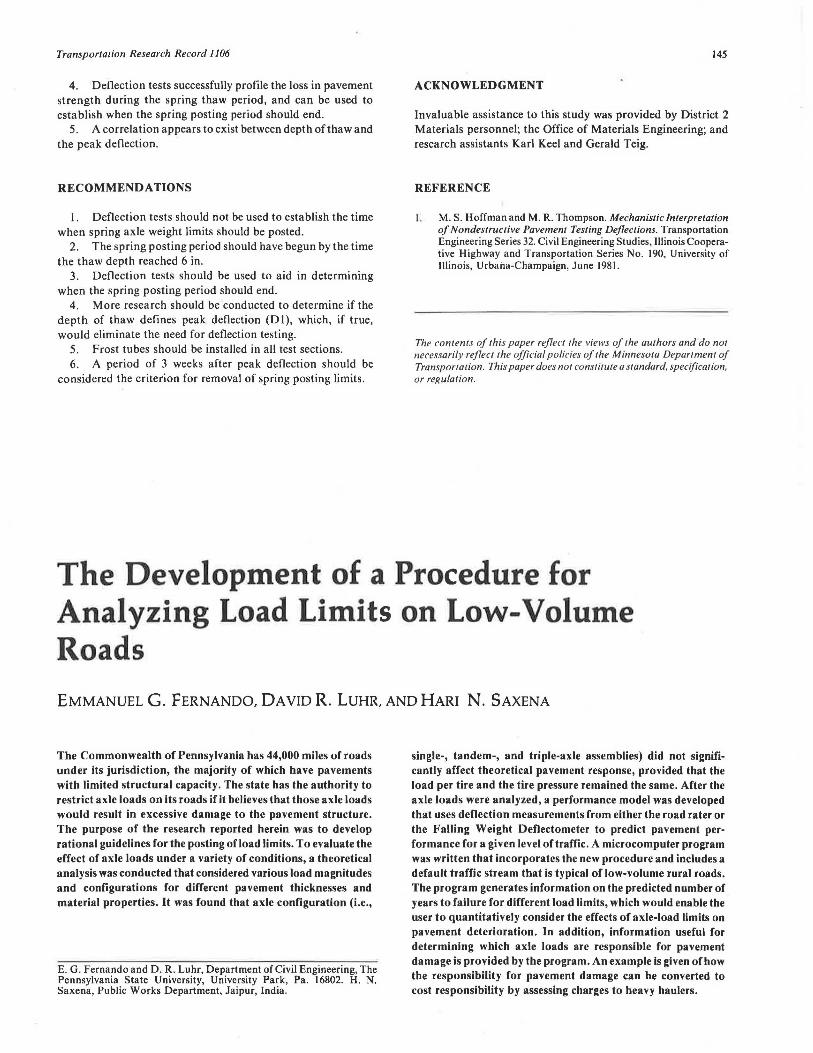
increase of subgrade strain, as would be expected. The significant observation is that the plots for the three, different axle configurations are almost identical, both in shape and in magnitude. This indicates that, theoretically, similar pavement response occurs with different axle configurations as long as the load per tire and the tire pressure are constant.
Effect of Variables on Pavement Response To study the effect of axle configuration on subgrade strain
along the direction of vehicle movement (longitudinal direction), plots of subgrade strain versus longitudinal position for 18-kip single, 36-kip tandem, and 54-kip triple axles were drawn using the same scale. The plots that resulted from all factors being at middle levels are presented in Figures 4 through 6. Observation of the plots indicates that the distribution of the sub grade strain along the longitudinal direction is different for the three axles. Although there is one cycle of strain for the single-axle
Plots are presented in Figures 1 through 3 of the maximum vertical sub grade strain versus the load per tire for the three axle configurations (single, tandem, and triple) in cases in which the layer moduli and thicknesses are fixed at the low, middle, and high levels selected for these variables, as shown in Table 1. These plots indicate that an increase in load results in an
.!::
' c
z <t n: 1-U)
w >
0.10000 1 - Loyer moduli and thickness at low levels
0.01000-
2 - Loyer moduli and thickness at middle levels 3- Loyer moduli and thickness at high levels
,----'
U) 0.00100· U)
w n:
-------2---2 ------~-2~~~----2 a.
:E 0 u
0 .00010 2 --------3-----------3 ---3 3-------3 0.00001 -1------~----~----~-----~---~
0.0 1.5 3.0 4.5 6.0 7.5
LOAD PER Tl RE ( kips
FIGURE I Maximum subgrade compressive strain versus load per tire for a single-axle configuration.
.!::
' c
z <t n: 1-U)
w >
0.10000 1 - Loyer moduli and thickness at low levels
0.01000·
2 -Layer moduli and thickness ot middle levels 3 - Loyer moduli and thickness ot high levels
,--------' ~ 0.00100· w
---------2--~-----2 -----2 2------2---------3-3------3-n: a. :E 0 u
0.00010--3-----3 -------
0.00001 -1-----~----~----~-----~----~ 0.0 1.5 3.0 4.5 6.0 7.5
LOAD PER Tl RE ( kips
FIGURE 2 Maximum subgrade compressive strain versus load per tire for a tandem-axle configuration.
148 Transportation Research Record I 106
0 .10000 1 - Loyer moduli and thickness at low levels .E 2 - Loyer moduli and thickness at middle levels ' 3 -Loyer moduli and thickness at high levels c:
z <t 0:
0.01000 ,----1 ti; w > ~ 0.00100-
2------2 -----w 0: a.. ~ 0 u ----2- ----3 2 ----3
0 .000 10-
3------3----3 0.00001 -t-----...----- - -.----- --..-----....-------.
0.0 1.5 3 .0 4 .5 6.0 7 .5
LOAD PER Tl RE ( kips FIGURE 3 Maximum subgrade compressive strain versus load per tire for a triple-axle configuration.
0.00005
O.OOOOO-t-------------,c=-1--1---i--:::i-- 1-1~ .~'
.E - 0.00005 -
-0.0001 0 -
z <i -0.00015-0: 1-(/) -0.00020- ./
w -0.00025- I ffi!t:J ~ -0.0003 0 -
I/
Load at position 0 in .
~ - 0 .0 0 035- ;1
-0.00040-
-o_00045-~1-~--~-~-~-~~-~-~-~--~-~-~-~ 0 6 12 18 24 30 36
POSITION
42
( in )
48 54 6 0 66 72
FIGURE 4 Subgrade compressive strain versus position, with factors at middle levels, for an 18-kip, single-axle load.
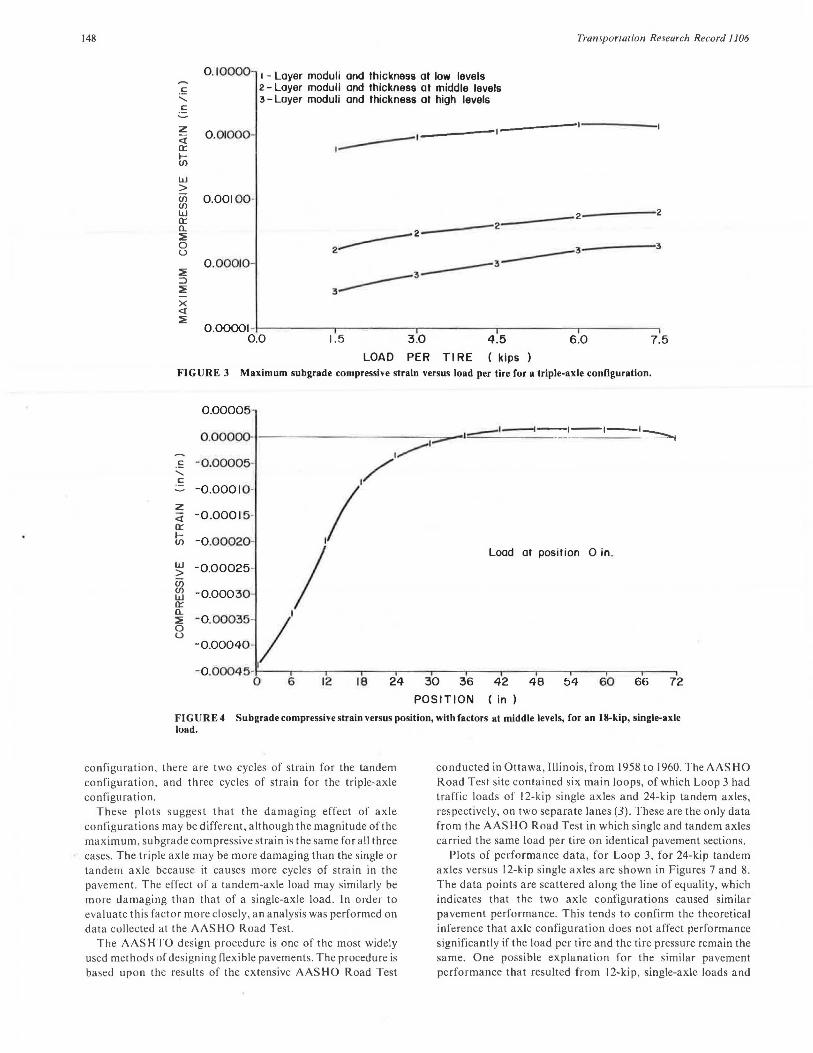
configuration, there are two cycles of strain for the tandem configuration, and three cycles of strain for the triple-axle configuration.
These plots suggest that the damaging effect of axle configurations may be different, although the magnitude of the maximum, subgrade compressive strain is the same for all three cases. The triple axle may be more damaging than the single or tandem axle because it causes more cycles of strain in the pavement . The effect of a tandem-axle load may similarly be more damaging th an that of a single-axle load. In order to evaluate this factor more closely, an analysis was performed on data collected at the AASHO Road Test.
The AASHTO design procedure is one of the most widely used methods of designing flexible pavements. The procedure is based upon the results of the extensive AASHO Road Test
conducted in Ottawa, Illinois, from 1958 to 1960. The AAS HO Road Test site contained six main loops, of which Loop 3 had traffic loads of 12-kip single axles and 24-kip tandem axles, respectively, on two separate lanes (3) . These are the only data from the AAS HO Road Test in which single and tandem axles carried the same load per tire on identical pavement sections.
Plots of performance data, for Loop 3, for 24-kip tandem axles versus 12-kip single axles are shown in Figures 7 and 8. The data points are scattered along the line of equality, which indicates that the two axle configurations caused similar pavement performance. This tends to confirm the theoretical inference that axle configuration does not affect performance significantly if the load per tire and the tire pressure remain the same. One possible explanation for the similar pavement performance that resulted from 12-kip, single-axle loads and
FERNANDO ET AL.
.~
......
.~
z <l a:: I-(/)
w > en (/) w a:: Cl. ::iE 0 (.)
0 .00005
.~ - 0 .00005-
w > i:l w a:: a. ::E 0 u
-0.00010
-0.00015
-0.00020
- 0.00025-
-0.00030
- 0 .00035
- 0.00040
Loads at positions 24 and -24 inches
-0.00045-...,_-.,....---.---r---.----r--..,..---,--..---..-----.,....---.---. 0 6 12 18 24 30 36 42 48
POSITION (in )
54 60 66 72
FIGURE 5 Subgrade compressive strain versus position, with factors at middle levels, for a 36-kip, tandem-axle load.
0 .00005 Loads at positions
0 .00000-0, 48 , and-48 inches ----
-0 .0 0 00 5 /3~ 3 3 3~ -0.00010-
-0 .00015- I 3
-0.00020-
-0.000 25·
-Q.00030 -
/ \ ,/' -0.00035
-0.00040·
-0 .00045-0 6 12 18 24 30 36 42 4 8 54 60 66 72
POSITION ( in ) FIG URE 6 Subgrade compressive strain versus position, with factors I at middle levels, for a 54-kip, triple-axle load.
149
24-kip , tandem-axle loads, even though Figures 4 and 5 indicate that the tandem axle causes two strain cycles versus one strain cycle for the single axle, is that the theoretical strain basins are calculated assuming static loading conditions. Under dynamic loading conditions, the stiffness of the pavement will be greater, and, as indicated in Figures 7 and 8, there will be smaller differences between the effects of single- and tandemaxle configurations.
into the new AASHTO guide for designing pavements for low-volume roads (5) . The performance model is given by the following:
In addition to the study on the effects of axle load and axle configuration, an evaluation was made of the effects of layer moduli and thicknesses on predicted pavement performance. For this evaluation, performance estimates were calculated using the Simplified Rational Pavement Design (SRPD) performance equation developed by Luhr et al. for the U.S . Forest Service ( 4). This performance equation was incorporated
log 10 N x = 2.151 22 - 597.662 (£5g)
- 1.32967 log 10 (£sg)
+ log 10 [(PSI; - TS/) / 2.7] 112
where
(I )
N x = number of weighted applications of axle load X before pavement reaches a specified terminal serviceability index (TS/),
£ sg = sub grade compressive strain due to axle load X,

150
Q .?!..
z Q I-ct 100 ~ ..J Cl. Cl. ct
ILi ..J x ct
:I ILi 0 z ;! e:: "' <t N
12 KIP SINGLE AXLE APPLICATIONS (XI03 )
FIGURE 7 Comparison of the performance of identical pavemcnl sections subjected lo 12-kip single-axle and 24-kip 1andem-asle loading (weighted axle applicnlions to PSI = 1.5).
I+-~~~~~-.-~~~~~.--~~~~--,
I 10 100 1000
NUMBER OF 12 KIP SINGLE AXLE APPLICATIONS ( x 103 )
FIGURE 8 Comparison of the performance of identical pa vcmcnt seCJions subjected to 12-kip single-axle and 24-kip 1andem-axle loading · (weighted II le applications to PSI = 2.5).
PSI; initial present serviceability index of pavement, and
TS! = terminal serviceability index.
Strain data generated in the factorial study were used with the S RPD equation to determine performance estimates for various combinations of the independent variables included in the sensitivity analysis. The independent variables considered were load, surface modulus (El), base modulus (£2), subgrade modulus (£3), surface thickness (Tl), and base thickness (T2). Only one type of axle configuration, single-axle, was considered because the results presented earlier indicated that this factor has no significant effect on subgrade strain as long as the load per tire is constant.
In the sensitivity analysis, each of the independent variables
Transpor/ation Research Record 1106
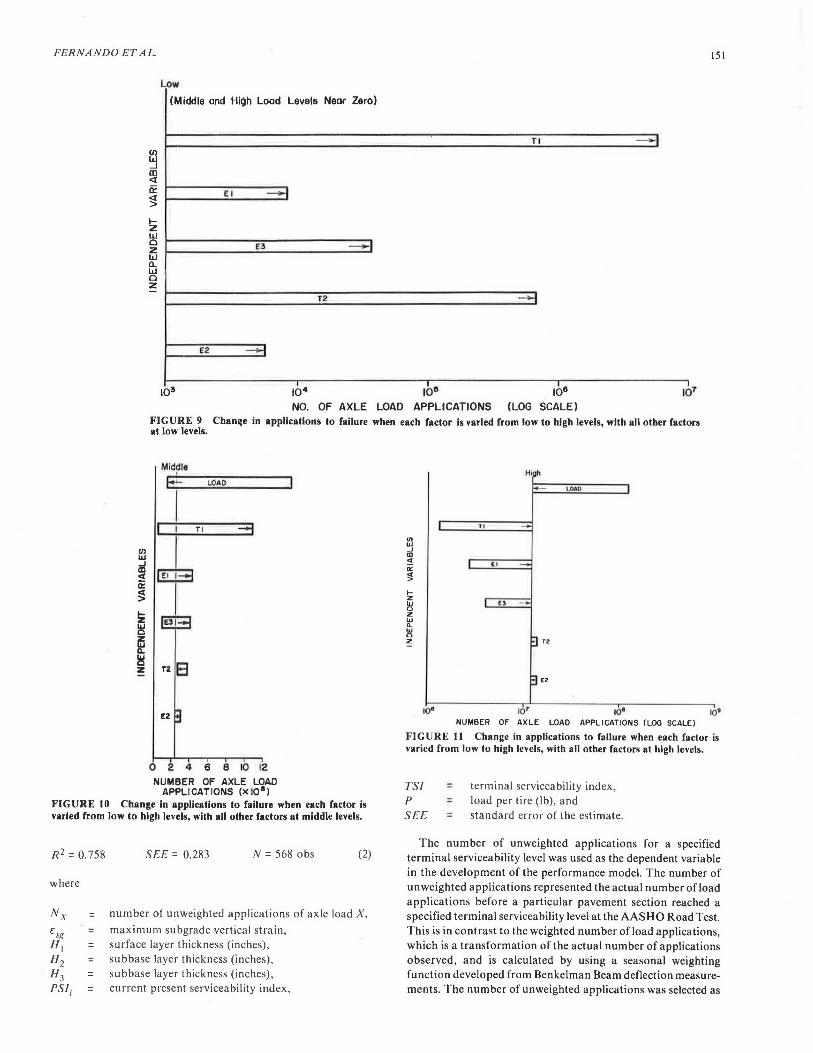
considered was varied from low to high levels, and the other independent variables were kept at one level (low, middle, or high) . The effect of each of the six independent variables on the predicted pavement perfor mance is shown in Figures 9 through I l . The arr ws in the boxes of th e figures indicate whether the independent variable in question had a positive (right arrow) or negative (left arrow) effect on the predicted number of axle applications necessary to reach a terminal serviceability index of 1.5, assuming that the initial PSI was 4.2. The vertical line in each of the figures indicates the value when all variables are held at one level. These figures give a fairly good indication of how sensitive predicted pavement performance is to a variation in any one of the independent variables.
It can be seen from Figure 9 that, at low levels, the predicted pavement performance is very sensitive to all of the independent variables considered , particularly to surface and base thickness. It can therefore be inferred that, for pavements constructed with weak materials and on poor sub grade, performance can be significantly improved by increasing the thickness of the surface and the base. At the middle and high levels of the independent variables, predicted pavement performance is highly sensitive to load, surface thickness, and, to a lesser degree, the surface and subgrndc moduli. I'or medium- am] good-quality pavements, therefore, performance can best be improved by increasing the thickness and improving the quality of the surface layer.
DEVELOPMENT OF A PERFORMANCE EVALUATION PROCEDURE
In order to justify load restrictions on low-volume roads and to determine the appropriate load-limit magnitude, a pavement engineer must be able to evaluate the effects of alternative load-limit policies on pavement life. A model for predicting pavement performance is therefore necessary. In this study, performance data from the AASHO Road Test were used to develop a performance prediction equation for a load-limit posting procedure to be used by the state of Pennsylvania. Data from various field sites within Pennsylvania were evaluated to determin if the available data could be used to de elop a performance model. After a omprehensive and detailed review, it was concluded that the AAS HO Road Test was the best source of data for the performance-modeling phase of the research project. Data from the field sites were not useful because no reliable traffic estimates were available on the sites , and the condition survey data were insufficient to evaluate performance trends. AAS H 0 Road Test data were consequently used to develop a performance model with the understanding that the model developed could be recalibrated to suit local conditions should field-performance data be available in the future.
The performance model developed in the study is given by the following:
log 10 N x = 4.508 - 436.992 (Esi;) + 0.092 (H2 + H 3)
+ 0.141 (PSl;*TSI) - 0.014 [TSl(H 1 + H 2
+ H 3)] + 3.382log 10(H 1 + H 2)
- 0.319log 10[(PS/;*H2) +I]
- l.987log 10 (TSl*H1
) - 0.299H2 - 0.00018P
+ 0.041 (H 1*H 2)
FERNANDO ET AL. 151
Low
(Middle and High Load Levels Near Zero)
~ m <l er ~
!z w 0 z w Q_ w 0 z
E2
El
E3
~
-i
-· T2
I I 104 1011
NO. OF AXLE LOAD APPLICATIONS
Tl
__,
I
1011
(LOG SCALE)
- 1
I 107
FIGURE 9 Chan11e in applications to failure when each factor Is varied from low to high levels, with all other factors at low levels.
Middle
i ~0.AO
!2
0 2 4 6 8 10 12 NUMBER OF AXLE LOAD
APPLICATIONS (X 108 )
(I)
"' _J m ~ Q:
~
!z "' 0 z "' a. "' 0 z
I
10•
Hi~h
- LOAD
ff -I El -
I (l ~
~ T2
El E2
10• 10• 10' NUMBER OF AXLE LOAD APPLICATIONS (LOG SCALE)
FIGURE II Change in applications to failure when each factor is varied from low to high levels, with all other factors at high levels.
TS! :: terminal serviceability index,
FIGURE 10 Change in applications to failure when each factor is varied from low to high levels, with all other factors at middle levels.
P :: load per tire (lb), and SEE = standard error of the estimate.
R 2 =0.758
where
Esg
H, = H2 H3 = PSI; =
SEE= 0.283 N = 568 obs (2)
number of unweighted applications of axle load X, maximum subgrade vertical strain, surface layer thickness (inches), subbase layer thickness (inches), subbase layer thickness (inches), current present serviceability index,
The number of unweighted applications for a specified terminal serviceability level was used as the dependent variable in the development of the performance model. The number of unweighted applications represented the actual number of load applications before a particular pavement section reached a specified terminal serviceability level at the AASHO Road Test. This is in contrast to the weighted number of load applications, which is a transformation of the actual number of applications observed, and is calculated by using a seasonal weighting function developed from Benkelman Beam deflection measurements. The number of unweighted applications was selected as

152
the dependent variable in the regression analysis primarily because it represented the actual data, and because vehicle counts conducted by transportation agencies are never weighted in actual practice.
A plot of the predicted number of unweighted applications from Equation 2 versus the observed number of applications from the AAS HO Road Test is shown in Figure 12. A similar plot using the AASHO, unweighted performance equation is given in Figure 13. A comparison of the figures shows that the performance model developed in this study better predicts the observed performance at the AAS HO Road Test than does the unweighted performance equation developed during the Road Test. Statistically, the coefficient of determination (R2) for Equation 2 is 0. 758, a'nd the standard error of the estimate is 0.283. In contrast, the AAS HO unweighted performance equation has an R 2 value of 0.48 and a standard error of the estimate of 0.36 (3). 1 n view of the results presented in this report, the performance model defined by Equation 2 was incorporated into the load-limit posting procedure.
7.0 Number of Observations = 568 en Standard Error of Estimate • 0.28 ~ 6.5 R2 = 0.76
~ u 6.0 -:::i R: <[ 5.5
~ er w
5.0
g] 4.5 ::J z D 4.0 -W
IJ 3.5 a w If 3.0
Transportation Research Record 1106
DEVELOPMENT OF A STRUCTURAL ANALYSIS PROCEDURE
An essential component of a procedure for determining load limits is a method for evaluating the structural response of existing pavements to various loading conditions. A simplified but rational methodology for determining pavement structural response was adopted. The methodology is based on linear elastic layer theory and the use of deflection measurements to directly estimate pavement structural response (i.e., asphalt concrete and subgrade strains). The same concept was used in the development of the PaDOT overlay design procedure for flexible pavements (6). This approach is rational and is much simpler than the deflection-basin-fitting methodology, which attempts to characterize the material properties of the pavement layers by comparing measured and calculated deflection measurements. The basin-fitting procedures require greater computer resources and are not suitable for practical implementation on a microcomputer.
..
I
.. ;t .. . .
· '." . .
2.5"1,-~~~~~~~~~~~~~~~~~~~~~~~~~~~~~
2.5 3.0 3.5 4.0 4.5 5.0 5.5 6.0 6.5 7.0
OBSERVED NUMBER OF APPLICATIONS
Fl GU RE 12 Predicted number of applications from new equation versus observed number of applications to failure from AASHO Road Test data.
7.0 Number of Observations = 568 en z Standard Error of Estimate = 0.36 Q 6.5 - R2 = 0 .48 ~ u :::i 6 .0 -Q. Q. <[
5.5 LL 0
er 5.0 w CD :::z: 4.5 ::J z
D 4.0 w f-u 3.5 a w er Q. 3.0
2.5 -~~~~~~~~~~~~~~~~~~~~~~~~~~~~~~
2.5 3.0 3.5 4 .0 4.5 5.0 5.5 6.0 6.5 7.0 OBSERVED NUMBER OF APPLICATIONS
FIGURE 13 Predicted number of applications from AASHO equation versus observed number of applications to failure from AASHO Road Test data.

FERNANDO ETAL.
Equations were developed for estimating subgrade compressive strain from surface deflection measurements taken with the road rater or the FWD. The vertical compressive strain at the top of the subgrade is the structural response variable used to predict pavement performance for the load-limit posting procedure. The three-layer, pavement structural model used in the evaluation of the effects of axle-load distribution was adopted to develop the equations for estimating subgrade compressive strain. A multi-layer, linear elastic program, BI SAR, which was developed by Shell Laboratories, was then used to generate theoretical deflection basins for each combination of layer moduli and thicknesses included in the factorial established to analyze the effects of axle-load distribution (2). A loading frequency of 25 Hz and a peak-to-peak displacement ofO. l inch was assumed for the road rater in the calculation of theoretical surface displacements. These assumed values for frequency and peak-to-peak displacement result in a peak-to-peak force of 500 lbs and are the values PaDOT normally uses when road rater deflection measurements are taken. Theoretical displacements were determined at four different positions that corresponded to the four sensors of the road rater, which are spaced at I-ft intervals.
A load level of9,000 lbs, applied through a circular plate with a radius of 5.9 in, was assumed for the FWD device in the computation of theoretical surface displacements. The displacements were determined at seven different positions that corresponded to the seven sensors of the FWD, assuming the sen so rs were spaced 1 ft apart.
The theoretical displacements calculated by Bl SAR for the road rater and FWD loading conditions, and for each combination of layer moduli and thicknesses included in the factorial study presented earlier, were subsequently correlated with theoretical strain values associated with various axle loads and axle configurations. The regression equations obtained are as follows:
log 10 (Ezz)x,FWD = -4.273 + 0.433 log 10 (W 1 - W2)
+0.560 log 10 (W1
+
R 2 = 0.9715
2W2 + 2W3 + W.J
-1.799 logio(H 1 +H2) + 0.912
1og 10(P1;,e)X +0.122-v'fi; + 0.285"Vii';
SEE= 0.088 N = 3645 obs (3)
log IO (E 22) x, RR = -2. 784 + 0.498 log IO ( W1 - W2)
+0.477 log 10 ( W1 + 2 W 2 + 2 W3 +
W.J -0.948°VH 1+H2
R 2 = 0.9703
where
=
=
+ 0.9121og 10(P1;,e)X +0.097 H 1 + 0.673"ViT;
SEE= 0.090 N = 3645 obs (4)
vertical compressive strain at top of subgrade due to tire load X, computed using FWD measured deflections, vertical compressive strain at top of subgrade due to tire load X, computed using road rater measured deflections,
Hi H2 (Ptire)X
SEE
=
= = = =
153
measured deflection at the ;th sensor of the deflection device used (inches), surface layer thickness (inches), base layer thickness (inches), tire load (lbs), and
standard error of estimate.
In the formulation of Equations 3 and 4, analyses of residuals were made to verify the assumptions of linearity, independence of error terms, and homogeneity of variance. In addition, correlations between independent variables were examined to prevent problems associated with multicollinearity. These steps were taken to ensure that the relationships established were statistically sound and robust.
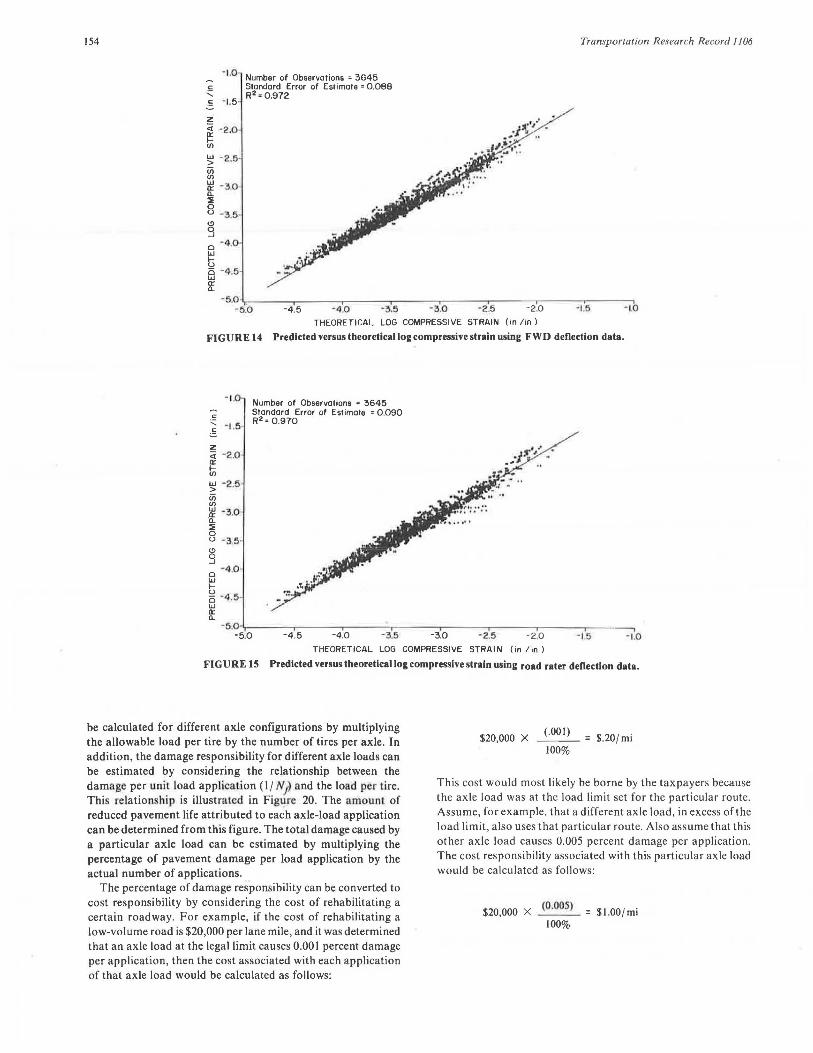
Plots of predicted versus theoretical strain values are shown in Figures 14 and 15. These plots show very good agreement and illustrate the accuracy of the predictions from Equations 3 (FWD) and 4 (road rater).
PROCEDURE FOR LOAD LIMIT ANALYSIS
After the strain versus deflection relationships were developed and the performance model was formulated, a rational framework for evaluating load restrictions was developed (see Figure 16). Deflection measurements that were taken with either the road rater or the FWD were used in the load-limit analysis procedure to determine subgrade compressive strains due to various tire loads in the traffic stream. The number of allowable applications for each tire load was then determined from the performance model. A curve such as that shown in Figure 17 can be constructed by following a procedure in which the cumulative pavement damage is successively calculated as tire loads of increasing magnitude in the traffic stream are considered. The load limits can then be determined by specifying a minimum time that a road must remain in service before rehabilitation is allowed.
The load-limit analysis procedure was implemented in a computer program. The program is interactive and is suitable for use on a microcomputer. The program requires road rater or FWD measurements and information on the distribution of axle loads in the traffic stream. This latter information is usually unavailable or is not collected on a regular basis, particularly for low-volume roads. Consequently, efforts were made to define a typical traffic distribution for low-volume roads using data obtained from Pa DOT. The traffic distribution determined was then included as a default in the load-limit analysis program in the absence of site-specific traffic data. However, the default traffic distribution should not be used indiscriminately, because it may be significantly different from actual traffic conditions. Actual truck traffic count and weight surveys are strongly recommended.
Output from the program includes a plot of the years to failure versus the load per tire curve, and a plot of the inverse of the number of allowable applications before failure versus the load per tire. A sample program output is shown in Figures 18 to 20. A load limit may be determined from the plot of the number of years to failure versus load per tire (Figure 19) by specifying the minimum, required service life before rehabilitation. If a pavement engineer, for example, specifies a minimum period of 5 yrs before rehabilitation is allowed, a load limit of approximately 2,000 lb per tire would be determined from the plot. Load-limit postings in terms of axle-load limits can then
154
c
' .~
-1.0
-1.5
Number of Observations = 3645 Standard Error of Estimate = 0.088 R2 • 0.972
Transporlation Research Record 1106
THEORETICAL LOG COMPRESSIVE STRAIN (in /in )
FIGURE 14 Predicted versus theoreticallog compressive strain using FWD deflection data.
z <i -2.0 Q: 1--UJ
~ - 2 .5· (jj UJ
.~ -3.0 CL ~ 0 u - 3.5 -<.!)
g 0 -4.0 -w 1--
~ - 4 .5 · w Q: CL
Number of Observations = 3645 Standard Error of Estimate = 0.090 R2 • 0.970
THEORETICAL LOG COMPRESSIVE STRAIN (in /in)
FIGURE 15 Predicted versus theoretical log compressive strain using road rater deflection duta.
be calculated for different axle configurations by multiplying the allowable load per tire by the number of tires per axle. In addition, the damage responsibility for different axle loads can be estimated by considering the relationship between the damage per unit load application (1/ N} and the load per tire. This relationship is illustrated in Figure 20. The amount of reduced pavement life attributed to each axle-load application can be determined from this figure. The total damage caused by a particular axle load can be estimated by multiplying the percentage of pavement damage per load application by the actual number of applications.
The percentage of damage responsibility can be converted to cost responsibility by considering the cost of rehabilitating a certain roadway. For example, if the cost of rehabilitating a low-volume road is $20,000 per lane mile, and it was determined that an axle load at the legal limit causes 0.001 percent damage per application, then the cost associated with each application of that axle load would be calculated as follows:
$20,000 x (.00 I)
100% = $.20/mi
This cost would most likely be borne by the taxpayers because the axle load was at the load limit set for the particular route. Assume, for example, that a different axle load, in excess of the load limit, also uses that particular route. Also assume that this other axle load causes 0.005 percent damage per application. The cost responsibility associated with this particular axle load would be calculated as follows :
$20,000 X (O.OO~) = $1.00/ mi
IOO%

FERNANDO ET AL.
NON-DESTRUCTIVE TESTING OF FLEXIBLE PAVEMENTS
• DEFLECTION MEASUREMENTS
~ TRAFFIC CHARACTERIZATION
• DETERMINATION OF AXLE LOAD DISTRIBUTION
i STRUCTURAL EVALUATION
• DETERMINATION OF STRAINS FOR VARIOUS TIRE LOADS FROM DEFLECTION MEASUREMENTS
~ PERFORMANCE EVALUATION
• CALCULATION OF PAVEMENT DAMAGE ATTRIBUTED TO EACH TIRE LOAD IN TRAFFIC STREAM
• APPLICATION OF MINER'S HYPOTHESIS TO - DETERMINE CUMULATIVE PAVEMENT DAMAGE,
• PAVEMENT LIFE CALCULATIONS FOR VARIOUS TIRE LOAD LIMITS
i OUTPUT
• YEARS TO FAILURE VERSUS TIRE LOAD LIMIT CURVES
• DAMAGE PER UNIT APPLICA-TION VERSUS LOAD PER TIRE CURVES
FIGURE 16 Rational framework for evaluating load restrictions.
TIME BEFORE REHABILITATION
(Years)
I I I ~Load Limit
POSTED LOAD LIMIT
FIGURE 17 Selection of load limit based on minimum time to next rehabilitation.
DA'::'E 03/2~/86
DIS'::'RIC':' NO. COUNT'! U LEGISLATIVE ROUTE NO. WH.C:EL ?ATH l
L 135
155
However, the degree of responsibility a local road authority is willing to accept to maintain a particular posted route should be considered to determine a fee schedule for axle loads in excess of the posted load limit. Consequently, in the example given, a fee of $0.80 per mile per axle-load application would be assessed, which is the amount in excess of what the local road authority is willing to pay to maintain the posted route (amount in excess of the cost of the legal load application).
SUMMARY AND CONCLUSIONS
The Commonwealth of Pennsylvania has 44,000 miles of roads under its jurisdiction. A bout two-thirds of these roads are lowvolume roads, which, in other states, are the responsibility of local governments. Because the majority of these low-volume roads have pavements with limited structural capacity, the state has the authority to restrict axle loads if it is believed that those axle loads would result in excessive damage to the pavement structure. A procedure for posting load limits is therefore necessary. The development of such a rational and comprehensive procedure for load-limit analysis has been presented in this paper.
In order to evaluate the effect of axle loads under a vari~ty of conditions, a theoretical analysis was conducted that considered various load magnitudes and configurations for different pavement thicknesses and material properties. It was found that axle configuration (i.e., single-, tandem-, and triple-axle assemblies) did not significantly affect pavement response, provided that the load per tire and the tire pressure remained the same. However, given an allowable value for load per tire, axle load limits for different axle configurations would still vary, depending on the number of tires per axle.
Following the analysis of axle loads, a performance model based on subgrade compressive strain was developed from AAS HO Road Test data. In addition, equations were developed to determine subgrade compressive strain from deflection measurements taken with either the road rater or the Falling Weight Deflectometer. The procedure used deflection measurements to predict pavement performance for a given level of traffic.
3EGINING Joa STA::oN 001:-00 ENDING JOB STAT:ON oo:J-25 :.iA:NTENANCE C:ASS A LANE R:G<iT
DEF:EC'::'ION DEV!CE USED IS ROAD RATER NC~3ER OF JEF:.::c::oN aAS:Ns TAKEN rs :o
T:RE LOAD DISTR:3UTION TIRE LOAD
500.00 1500.00 2500.00 3500.00 4500.00 5000.00
DAIL"{ APP!.!CATIONS 100.00
70.00 40.00 30.00 28.00 30.00
TOTAL DAILY LOAD APPLICATIONS (BOTH DIRECTIONS)
BASIN STATION INDEX BASIN STATION ID LAYER l THICKNESS LAYER 2 THICKNESS CURRENT PSI 3.50
FOR LOAD LIMIT ANALYSIS 0011+50
3. 00 4.00
TERMINAL SERVICEABILITY INDEX l. so FIGURE 18 Sample output from LOAD LIM showing input data for a particular problem.
298.00000000

156
T!rtE LOAD L!MIT (lbs) l/'S Y~ARS TO FA!LuRE 00ll+50
0.00 2 . 00 4.00 6.00 8.00 10.00 1000 : ... . •.... : •.•...... : •. ' .' '.' .: ......•. ':.'' ......•
2000
3000 •
4000
5000
6000 : .. .. . .. . . : ......... : ... . ... .. : ......... ; .. . .. .. .. :
SCALZ FACTOR OF X: E SCALE FACTOR OF 1 : E
FIGURE 19 Plot of load per tire versus number of years to failure.
A microcomputer program was written that incorporates the load-limit analysis procedure and includes a default traffic stream that is typical of low-volume rural roads. The program generates information on the predicted years to failure for different load limits. Load limits can be determined by specifying a minimum time that a road must remain in service before rehabilitation is required. In addition, the pcogram provides information that is useful for determining which axle loads are responsible for pavement damage. Appropriate charges can then be assessed to heavy haulers for permits, and bonds can be estimated by the pavement engineer.
ACKNOWLEDGMENT
This paper is based on results from a project sponsored by the Pennsylvania Department of Transportation and the U.S. Department of Transportation, Federal Highway Administration. The contents reflect the views of the authors, who are responsible for the facts and the accuracy oft he data presented
Transpor/ation Research Record 1106
T:~E LOAD L::<IT ( lbs ) VS l / Nf 001!.+50
o . oo s .o o io.oo ~s. o o 20.00 25.oo 30 .0 0 1000 : * . •• . ••• . : . .. •• . •.. : •. •••• . . . : .• ' •• . ••• : .. .•. •••• ; . . . .. . ••. : ••.
2000
3000
4000
5000
600 0 : .... ... .. : ... . .. .. . : .. ...... . : . .... . . . . : . ... ..... : ... ...... : .. . SCAL E fACTOR OF X : E 0 SCAL! EACTOR or ~ : E -5
FIGURE 20 Plot of load per tire versus damage per unit load application.
herein. The contents do not necessarily reflect the official views or policies of either the Federal Highway Administration, the U.S. Department of Transportation, or the Commonwealth of Pennsylvania.
REFERENCES
I. Weight Restrictions on Highways (Posted Highways). Maintenance Manual, Pennsylvania Department of Transportation, Harrisburg, Pennsylvania, Oct. 1985, Chapter 15 .
2. D. L. De Jong, M. G. F . Peutz, and A. R. Korswagen. Computer Program BISAR. External Report. Koninklijke/Shell-Laboratorium Amsterdam, The Netherlands, 1973.
3. The AAS HO Road Test: Report 5- Pavement Research. Highway Research Board Special Report 61£, 1962.
4. D. R. Luhr, B. F. McCullough, and A. Pelzner. Simplified Rational Pavement Design Procedure for Low-Volume Roads. In Transportation Research Record 898, TRB, National Research Council, Washington, D.C., 1983, pp. 202-206.
5. AASHTO Guide for Design of Pavement Structures: 1986. American Association of State Highway and Transportation Officials, Washington, D.C., 1986.
6. E. G. Fernando, D.R. Luhr, and D. A. Anderson. Development of an Overlay Design Procedure for Flexible Pavements. PTI Report 8416. Pennsylvania Transportation Institute, University Park, Pennsylvania, J 984.

![INDEX [onlinepubs.trb.org]onlinepubs.trb.org/Onlinepubs/trr/1977/633/633-006.pdf · 36 Figure 1. Detailed data sheet. PAVCM[NT EVALUATION FOR STATE ROUTE 016 SECl JON fHOM WOUORUFF-liORTtl-L.lMl](https://img.dokumen.tips/doc/110x75/5fc5151f4dd8c11bc64347c3/index-36-figure-1-detailed-data-sheet-pavcmnt-evaluation-for-state-route.jpg)