Embed Size (px)
Citation preview

THE DEVELOPMENT OF A LOW-COST INTEGRATED MARINE NAVIGATION SYSTEM FOR LEISURE CRAFTS AND SMALL BOATS
VOT 74159
MOHD RAZALI MAHMUD NORKHAIR IBRAHIM
ALIAS ABDUL RAHMAN RUSLI OTHMAN
USMUNI DIN ABDULLAH HISAM OMAR
UNIVERSITI TEKNOLOGI MALAYSIA

THE DEVELOPMENT OF A LOW-COST INTEGRATED MARINE
NAVIGATION SYSTEM FOR LEISURE CRAFTS AND SMALL BOATS
VOT 74159
MOHD RAZALI MAHMUD NORKHAIR IBRAHIM
ALIAS ABDUL RAHMAN RUSLI OTHMAN
USMUNI DIN ABDULLAH HISAM OMAR
A report submitted to the Research Management Centre Universiti Teknologi Malaysia
Faculty of Geoinformation Science and Engineering Universiti Teknologi Malaysia
SEPTEMBER 2006

ii
ABSTRAK
Carta-carta nautika yang dihasilkan masa kini kebanyakannya khusus untuk
kegunaan kapal-kapal besar yang mempunyai pelbagai peralatan dan kemudahan
untuk mengendalikan carta-carta tersebut. Namun, bagi bot-bot kecil seperti bot
nelayan dan perahu layar, kemudahan sebegini tidak ada bahkan masih menggunakan
carta nautika konvensional yang ternyata kurang efektif kerana maklumatnya tidak
kemas kini. Dalam era teknologi dan masyarakat bermaklumat masa kini, interaktif
serta kemas kini seharusnya diberi tumpuan dalam penyediaan carta-carta nautika
kontemporari. Sehubungan dengan ini, satu kajian ke arah pembangunan pangkalan
data carta nautika digital telah dilaksanakan bagi penghasilan carta nautika digital
bersifat vektor bagi kegunaan bot-bot kecil berkonsepkan Geographic Information
System (GIS). Model konseptual bagi pembangunan pangkalan data carta nautika
digital bagi kegunaan bot-bot kecil ini telah direalisasikan bersesuaian dengan
persekitaran perisian CARIS GIS berasaskan carta hidrografi konvensional MAL
5622 bagi kawasan Pulau Langkawi. Hasil kajian dapat membantu pengguna
membuat pelbagai pertanyaan (query) seperti untuk mencari laluan pelayaran
terpendek, selamat, masa yang singkat serta menentukan halangan-halangan serta
kawasan bahaya yang perlu dielakkan dan sebagainya. Tambahan pula, projeck ini
telah dibangunkan menjadi sistem Web-based dengan pembentukan Nautical
–WebGIS untuk perkongsian maklumat carta-carta dalam Malaysia dengan adanya
Notice to Mariners yang terbaru dari Tentera Laut Diraja Malaysia dan Jabatan Laut.
Kawasan kajian juga telah diluaskan ke kedua-dua MAL 5 (Semenanjung Malaysia)
dan MAL 6 (Sabah and Sarawak). Nautical –WebGIS akan mendorong pengguna
menganalisis maklumat menerusi beberapa cara, seperti drawing, zooming,
searching and viewing reports. Tambahan pula, Nautical –WebGIS telah diuji dan
dikaji dari empat aspek, iaitu capaian Web, antaramuka laman Web, pemaparan peta
dan fungsi Web laman Web.

iii
ABSTRACT
Nowadays, most nautical charts are specially produced for large vessels with
various equipments and facilities for chart handling. However, such equipments are
not available on small boats such as fisherman boats and yachts. In fact, these boats
still used conventional nautical charts that are less effective because the data is not
up to date. In this technological era with informative community, up to date,
interactive information should be given attention in providing contemporary nautical
charts. Therefore, a study towards the development of a digital nautical chart
database has been carried out to produce vector digital nautical chart for small boat
usage, with Geographic Information System (GIS) concept. The conceptual model
for the development of digital nautical chart for small boat usage has been
implemented that suits with CARIS GIS software environment based on
conventional hydrographic chart, MAL 5622 for Langkawi Island. The result of this
study can assists users to make many queries such as to find the safest and shortest
navigational route with least time period, and identifying obstacles and hazardous
areas that should be avoided. Furthermore, this project has developed Web-based
GIS system to manage and visualize nautical charts online studies on the creation of
Nautical –WebGIS for sharing the charts information throughout Malaysia with the
latest Notice to Mariners from the Royal Malaysian Navy and Marine Departments.
The area of this study covered both MAL 5 (Peninsular Malaysia) and MAL 6
(Sabah and Sarawak). The Nautical –WebGIS will enable users to analyses the
information through several tools, such as drawing, zooming, searching and viewing
reports. In addition, the Nautical –WebGIS is evaluated and tested from four aspects,
which are Web accessible, Web interface, map display and Web function.

i
ACKNOWLEDGEMENT
First of all, a sincere appreciation to the Ministry of Science, Technology and
Innovation (MOSTI) for funding this research project, and to the Research
Management Centre (RMC), Universiti Teknologi Malaysia for providing the
assistance and support during the whole duration of this project.
In addition, special thanks to the CARIS Technical Support Consultants, Miss
Elaine A. Doucette, Mr. France Castonguay and Mr. Jeff Sharpe for their
contribution, especially in implementing the software CARIS. Thanks are also due to
the software vendor of Autodesk MapGuide 6.3, Terradesic Sdn. Bhd. for providing
a research license to pursue the research into a Web environment stage.
Last but not least, a special thanks to all research assistants and staffs at the
Hydrographic Research and Training Office, Faculty of Geoinformation Science and
Engineering, Universiti Teknologi Malaysia for their helps and sacrificed involving
this project.

1
CHAPTER 1
INTRODUCTION
1.1 Background
Aspect of surveying and charting in hydrography field are closely related in
order to produce high quality data. In Peninsular Malaysia, navigational charts are
published by the Royal Malaysian Navy (RMN), Ministry of Defence, Kuala
Lumpur. They acted as a Hydrographic Office (HO) in the responsibility of
producing Electronic Navigational Chart (ENC) with S-57 format according to the
International Hydrographic Organisation (IHO).
With the improvement of Information Technology (IT), it has brought out the
changes to vary organisations in Malaysia including hydrography. The most
significant changes that can be seen are the technique of surveying. The instrumental
of surveying is become more comprehensive to advance the quality of seabed
surveying. Other than that, Global Positioning System (GPS) also implement in
hydrography surveying to obtain an accurate and updated data. Thus, the nautical
charts need to be managed in a systematic way so that it can be used as a reference
for long term. Currently, the hydrographic data that presented in nautical charting are
in the form of A0 size paper with different scales as shown in Table 1.1. The nautical
chart is playing an important role for vessel navigation. It is because it contains the

2
navigation information such as buoy and beacon, radio, radar station, restricted area
and shipping route. Data of depth also recorded in unit meter (m), fathoms or
contours. Besides, it also included some physical features.
Table 1.1: Function of nautical chart
Type Scales Function
Small scale More or same with
1:500000
For the planning of vessel navigation
Medium scale Between 1:150000 to
1:500000
For general uses
Big scale Less or same with
1:150000
To plan the route surrounding
coastlines when reaching port.
(Source: RMN, 2003)
Form time to time, latest information regarding to the water area, such as
damage of buoy or implementation of new port will be updated by the marine
department and published to navigator through Notice to Mariners. The Notice can
be checked directly by navigator through Web, which are http://www.marine.gov.my
for Peninsular Malaysia, http://www.jls.gov.my for Sarawak and
http://www.marine.gov.my/sabah/sbh.html for Sabah.
Nowadays, government of Malaysia hopes that Malaysia can be announced as
a superior maritime country with high reputation within Asia water area. Therefore,
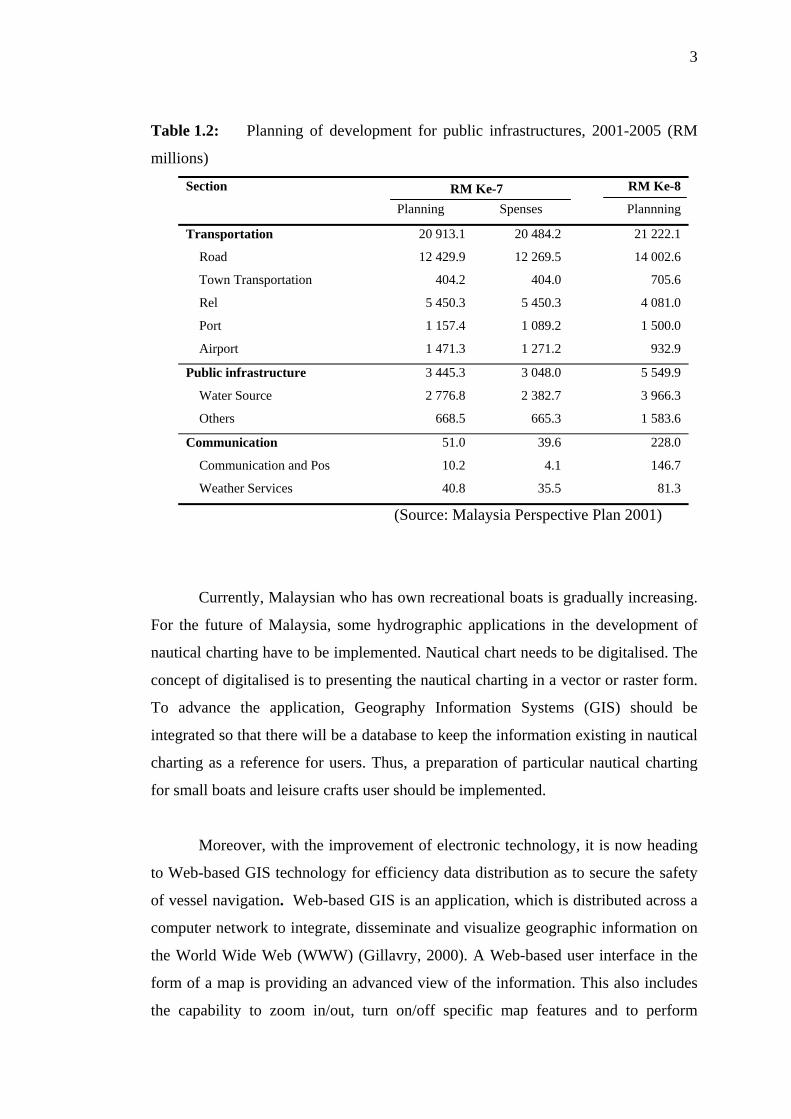
the Malaysia Perspective Plan 2001 has invested RM1, 500 million for preparing a
more completed and better infrastructures to compete with international vessels
(Table 1.2).
The development of infrastructures are not only focus on main ports in
Malaysia (e.g. Port Klang and Tanjung Pelepas) however it also pays attention to
some small ports that has potential to be succeed as attraction of recreation.
3
Table 1.2: Planning of development for public infrastructures, 2001-2005 (RM
millions)
Section
Planning
Spenses
RM Ke-8
Plannning RM Ke-7
Transportation
Road
Town Transportation
Rel
Port
Airport
20 913.1
12 429.9
404.2
5 450.3
1 157.4
1 471.3
20 484.2
12 269.5
404.0
5 450.3
1 089.2
1 271.2
21 222.1
14 002.6
705.6
4 081.0
1 500.0
932.9
Public infrastructure
Water Source
Others
3 445.3
2 776.8
668.5
3 048.0
2 382.7
665.3
5 549.9
3 966.3
1 583.6
Communication
Communication and Pos
Weather Services
51.0
10.2
40.8
39.6
4.1
35.5
228.0
146.7
81.3
(Source: Malaysia Perspective Plan 2001)
Currently, Malaysian who has own recreational boats is gradually increasing.
For the future of Malaysia, some hydrographic applications in the development of
nautical charting have to be implemented. Nautical chart needs to be digitalised. The
concept of digitalised is to presenting the nautical charting in a vector or raster form.
To advance the application, Geography Information Systems (GIS) should be
integrated so that there will be a database to keep the information existing in nautical
charting as a reference for users. Thus, a preparation of particular nautical charting
for small boats and leisure crafts user should be implemented.
Moreover, with the improvement of electronic technology, it is now heading
to Web-based GIS technology for efficiency data distribution as to secure the safety
of vessel navigation. Web-based GIS is an application, which is distributed across a
computer network to integrate, disseminate and visualize geographic information on
the World Wide Web (WWW) (Gillavry, 2000). A Web-based user interface in the
form of a map is providing an advanced view of the information. This also includes
the capability to zoom in/out, turn on/off specific map features and to perform

4
queries based on measurement units or related geographic names. By using a
compilation of Web technologies, such as JavaScript, XML and ASP, a customized
interface has been created for many mapping website. All users, regardless of skill
level, have the ability to retrieve and analyse a wide variety of information all
through their Web browser. For that reason, Web-based GIS is a useful tool in
presenting the nautical charts especially for data distribution.
1.2 Problem Statement
Till now, Malaysia still not publishes particular nautical charting for
recreation of coast area and also other users, navigator that using small boats and
leisure boats needs to refer the paper nautical charting that existed to obtain the latest
information. However, the information that obtained from paper nautical charting is
in static form. It made the manually chart work became sophisticated. Therefore,
initiative to the development of low-cost digital nautical charting application is the
main purpose in this research for the small boats and leisure crafts in Malaysia.
Producing of Electronic Navigational Chart (ENC) in Malaysia started by
Lim Joon Chai (2000). It was made to prepare a data set ENC S-57 in Malaysia
water area for Electronic Chart Display and Information System (ECDIS) on board.
According to the rules that fixed by International Convention for the Safety of Life at
Sea, 1974 (SOLAS), only vessels SOLAS that navigate across ocean must use a
completed ECDIS with the data source from ENC S-57. Thus, other transportation of
water that not related with SOLAS is excluded.
Therefore, small boats and leisure crafts are free to use any other systems that
are suitable for them with different size and cost. But, Electronic Chart System
(ECS) are different with ECDIS as mostly ECS could not help much in vessel
navigation to secure the safety of vessel. It makes the navigator has to be sensitive
and always update the chart information for their own ECS from time to time.

5
Furthermore, since the nautical charts are widely used, navigators will
definitely seek for the latest information about nautical chart and Notice to mariners
in order to success their works. The insufficiency way of distributing the updated
information from different departments in different method will take too long to
reach the end user and it would confuse the users as well. Thus, this would surely
affect their working progress.
To solve the first problem, it is needed to develop a low cost nautical charting
for small boats and leisure crafts in the form of vector based. The chart that going to
be developed are suitable to be used for planning application of small boats
navigation because it able to provide the accurate and useful information for
navigators.
For the second problem, these nautical charts and Notice to mariners should
be integrated for the needs of safety information. To overcome these problems, it is
important to propose Web-based GIS system to manage and visualize nautical charts
online.
1.3 Research Objective
There are some objectives have defined to success the two phases of research.
For the first phase (produce a low cost digital nautical charting in vector form for
small boats and leisure crafts in Malaysia), there are:
(i) Literature on the needed of hydrographic and topographic data that
will be included in presenting the digital nautical charting in vector
based particularly related with specification data S-57.

6
(ii) Develop a nautical charting with database of hydrographic
information for the needed of small boats and leisure boats navigation
using CARIS GIS 4.4a.
(iii) Implement some accurate analyses of spatial and attribute on the data
that has produced in the need of user.
For the second phase (produce a online system for displaying and analysing
nautical charts for Malaysia or), there are:
(i) To design and develop a Marine Information System that can integrate
updated nautical charts and the Notice to Mariners for publishing in a
Web platform.
(ii) Test and evaluate the result of application based on its performance.
(iii) To analyses the information of charts on various purpose such as
safety navigation, traffic control and obstructions.
1.4 Research Scope
In the first phase of this research, the study area is water area surrounding
Port Langkawi. Port Langkawi is chosen because it is one of the popular destinations
for small boats in Peninsular Malaysia. The source of data is the paper nautical chart
MAL 5622, which published by hydrographic department, TLDM. The information
of the study area is shown in Table1.3 and Figure 1.1.
Table 1.3: Geography reference for MAL 5622
Minimum Maximum
Latitude (φ) 6° 08' 19.084" N 6° 22' 00.480" N
Longitude (λ) 99° 38' 45.250" E 100° 00' 22.676" E

7
Figure 1.1: Study Area of Phase 1 - MAL 5622
To implemented this research, there are some software are needed:
(a) CARIS GIS 4.4a (including CARIS Setup, CARIS Tools, CARIS
SAMI, CARIS Editor, CARIS Information Manager, CARIS
Database Manager), by Universal System Limited, Canada.
(b) Microsoft Excel 2000, by Microsoft.
(c) Wide Image (for scanning uses).
(d) ScanPlus III 810c (Colour) Calcomp.
(e) Computer with the specification that can cope with CARIS GIS 4.4a:
(i) Using the Windows 2000.
(ii) Pentium II processor.
(iii) Random Access Memory with at least 64 RAM.
(iv) Three button mouse.
(v) Parallel port.
(vi) Monitor with 17” in size.
(vii) Video card of 8 MB.
(viii) CD-ROM drive.
CARIS GIS 4.4a was chosen to implement this research because it is
software that used to produce ENC S-57 by IHO. Other than that, it also prepares

8
some object codes, symbols that cope with S-57 specification and international
symbols for International Nautical Chart (INT1).
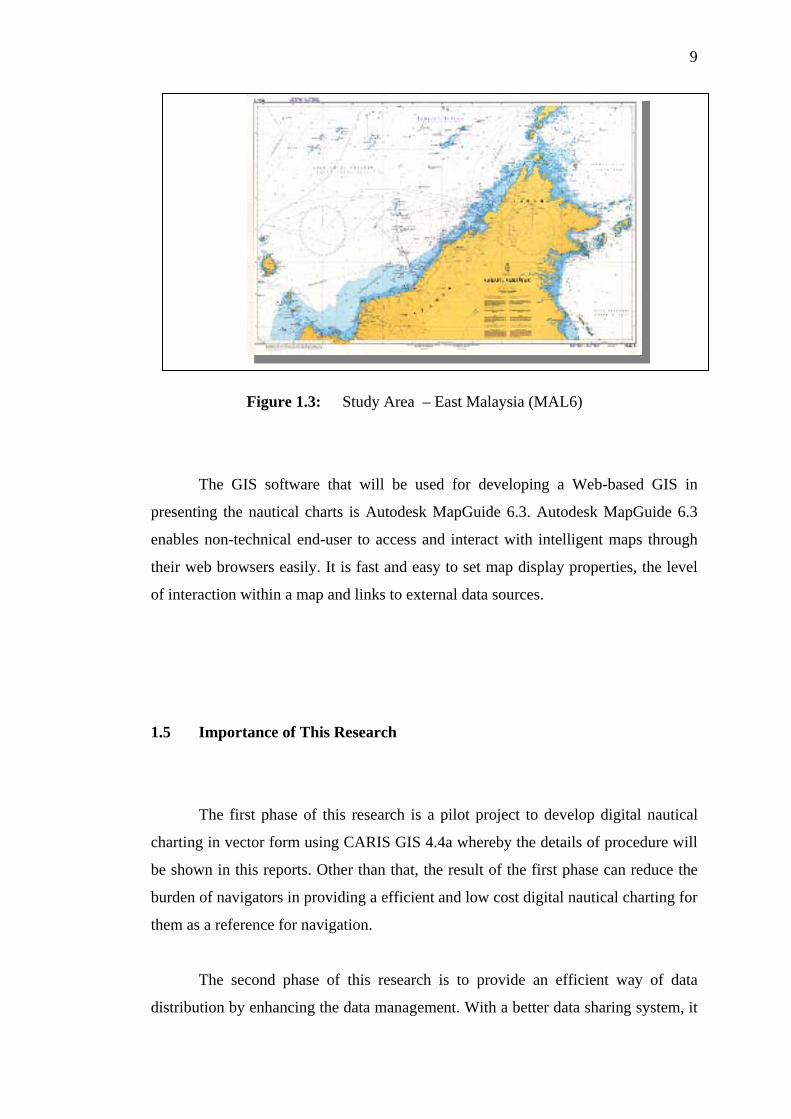
In the second phase of this research, the study area has expanded to a whole
Malaysia and in the form of nautical chart in paper format. Researcher will digitise
the latest edition of MAL 5 Peninsular Malaysia – 1: 1 250 000 (Figure 1.2) and
MAL 6 Sabah and Sarawak – 1: 1 250 000 (Figure 1.3) into digital format whereas
others nautical charts which contain small areas in Malaysia will be used in raster
image for developing the application.
Figure 1.2: Study Area of phase 2 – Peninsular Malaysia (MAL5)
9
Figure 1.3: Study Area – East Malaysia (MAL6)
The GIS software that will be used for developing a Web-based GIS in
presenting the nautical charts is Autodesk MapGuide 6.3. Autodesk MapGuide 6.3
enables non-technical end-user to access and interact with intelligent maps through
their web browsers easily. It is fast and easy to set map display properties, the level
of interaction within a map and links to external data sources.
1.5 Importance of This Research
The first phase of this research is a pilot project to develop digital nautical
charting in vector form using CARIS GIS 4.4a whereby the details of procedure will
be shown in this reports. Other than that, the result of the first phase can reduce the
burden of navigators in providing a efficient and low cost digital nautical charting for
them as a reference for navigation.
The second phase of this research is to provide an efficient way of data
distribution by enhancing the data management. With a better data sharing system, it

10
gives an opportunity for a better working environment, particularly to navigator.
Indirectly, it minimizes the cost of a project due to the proper data sharing system
that implemented.

CHAPTER 2
DEVELOPMENT OF NAUTICAL CHARTING
2.1 Background
As we know that, a paper chart or a nautical chart and the notices to mariners
are both necessary tools for vessel navigation. In this modern society, the
development of the technology has result in the rapid changes of the presentation for
nautical chart but the notices to mariners are still presented in hardcopy. Paper chart
has now become the electronic chart whereby it can be presented in a computer
instead of a paper. It can be used for developing Electronic Chart Display and
Information System (ECDIS), Electronic Chart System (ECS) and Raster Chart
Display System (RCD).
Those examples of systems that use electronic chart have introduced a new
level of performance into vessel navigation and it is now leading to major changes in
maritime navigation. It has the potential to present all necessary chart and
navigational-related information required for the safe operation of a vessel. With the
help of GIS, some of the functionalilties can be enhance particularly data
management.

12
2.2 Earliest Charts
The earliest chart that used for navigation was known as pertolan chart
created by Juan de la Cosa in 1500 (Figure 2.1). It was a miraculous product of the
late Middle Ages. When the use of compas has become universal, hundreds of copies
was produced because it was used with slight improvements for actual vessel
navigation for over three countries. Most charts have 16 or 32 compass roses with
radiating rhumb lines (lines showing compass direction), a motif often inserted on
modern maps as decoration.
Figure 2.1: Pertolan chart were the result of compass survey
In 1700, the charts were produced with more detail information and accurate
whereas they are far less decorative. When it turns to nineteenth century, the charts
has become diversify regarding to the certain needs and uses. Those charts were
nautical charts, submarine, thematic, magnetic, oceanography and others.

13
2.3 Nautical Charts
A nautical chart is actually more than a bathymetric chart or a land map. It
shall contains all data required for both position fixing and route finding, as well as
for the avoidance of dangers and the safety of navigation in general. For bathymetric
charts in hydrographic fair sheet or the data plot cannot be considered the end
product as it is not yet in the form most suitable to the use of navigator or the
oceanographer is expected to make of it. Nautical charts must be easily discernible
also during bad weather and minimal lighting on the bridge of a vessel. (Langeraar,
1984)
The totality of information on a nautical chart can roughly be divided into
three main components, namely:
(i) Under water topographic features, natural as well as man-made
ones.
(ii) Topography of the land as far as of interest to the navigator.
(iii) All further information related to the problems of positioning.
For all three components the main question will always be how to ascertain
the reliability of the basic information on which these three components have to be
found. With regard to component one, under water topography, the main source of
information will be either hydrographic survey results of the own service for sea
areas under national juristiction, or nautical charts prepared by foreign hydrographic
offices for other sea areas. Component two, land topography, comprises all
information of importance to the orientation or positioning of the navigator,
including coast lines, position of ports and harbours, contour lines and others. The
component three will consist information related to position fixing as far as not
covered under component two. It comprises the chart’s graticule of meridians and
parallels, possibly a metric grid and others.

14
2.3.1 Notice to Mariners
Due to the high cost and time consuming for the production of a nautical
charting, therefore Notice to Mariners was published as the correction for the current
nautical charting. In Malaysia, Marine Deparment of Malaysia publishes Notice to
Mariners; in contrast Royal Malaysian Navy publishes nautical charts.
Basically, some of the information that wrote in the Notices to Mariners are
new light beacons established, light beacon collapsed, relocation of buoys position,
installation works of pipeline or platform and others. The Notice to Mariners are in
the form of paper sheet and it will shows the position, chart affected, date, time and
also danger height related with the happening.
2.5 Electronic Chart
Electronic chart able to present a number of advantages compare to
traditional paper chart includes information from other sources (e.g. List of Lights
and sailing directions), vector structure of information allows maximum possible
automation of navigation safety control and combined with modern navigation
devices.
The term ‘electronic chart’ is a collective name that covers many types of
systems displaying chart information on a computer screen. There are two types of
electronic charts that are raster charts and vector charts.

15
2.5.1 Raster Charts
Graphic display of the data on a raster chart basically corresponds to that
contained on a paper chart. During the scanning process, a faithful reproduction is
obtained of all the information present on the paper chart. This primary applies to the
graphic elements of the chart including symbols, lines, wording and the chart
borders. The colours of the displayed raster chart can be modified and need not to be
identical to those of the paper chart. (Hecht et. al., 2002)
Since the colour of the raster data can be changed, it is possible to produce
colour sets to suit various light conditions on the symbol. However, this is best to be
accomplished when the chart original has been used for scanning.
2.5.2 Vector Charts
The process of graphic visualization for vector chart data is more complicated
but also more flexible than that for the raster charts. While, it is possible for raster
charts to change the colours of the pixels from the original, the text and symbols
remain the same of the paper chart. This is not so with vector charts. In this case, the
allocation of the graphic symbols is affected by the reading and interpretation of the
data by computer software. (Hecht et. al., 2002)
Vector chart is independent of the original paper chart. In this process, the
chart graphics of vector data are produced separate from the chart presentation and
are not dependent on the print or scan quality. Although one would not to do so for
acceptance reasons, it is even possible to produce graphic symbology completely
different from that of the traditional paper chart symbols.

16
2.5 Electronic Chart Systems
In many repects, electronic chart systems are the first shipboard
naviagational devices using the basic components of computer technology. The basic
hardware components and interfaces common to all electronic chart systems include
Central Processing Unit (CPU), colour monitor as a display device, keyboard and
track ball for human interface, data storage, communication interfaces and also
interfaces to other navigational devices. (Figure 2.2)
Figure 2.2: Basic components of an electronic chart display system and the
interfaced navigational devices
(Source : Document The Electronic Chart by Hecht et, al., 2002)

17
Special software programs control the operation of these components. Their
fundamental elements include Graphical User Interface (GUI) and also Kernel
software, which control data management and presentation of chart information.
The chart information is stored in the form of a database containing all the
geograhic hydrographic administrative and geophysical information for the area that
is traditionally provided by paper charts. Furthermore, all other information and
events of navigational importance are stored and made available for display under
operational conditions (e.g. waypoints, routes, position fixes and the past track of a
vessel). The general information flow of electronic chart system is shown in Figure
2.3.
Figure 2.3: Information flow within an electronic chart system
(Source : Document The Electronic Chart by Hecht et, al., 2002)
Well, there are sevaral types of electronic chart systems and not all have the
same capabilities or function in the same way. The mainly differences of between

18
various types of system are format and contencts of the chart data, chart display and
availability of navigational functions. Based on the above criteria, there are three
basic types of systems that are Electronic Chart Display and Information System
(ECDIS), Electronic Chart System (ECS) and Raster Chart Display System (RCDS),
2.5.1 Electronic Chart and Display Information System (ECDIS)
Electronic Chart and Display Information System (ECDIS) is a system that
consist the official chart. To be considered as official chart data must meet two
requirements. One that is authorized by a national government agency, normally the
national hydrographic office and two that is meets the specifications of the
Intenational Hydrographic Organization (IHO). In a simple way, ECDIS use
Electronic Navigational Chart (ENC) as its data and not electronic chart. It is in
vector format. The IHO has defined a uniform data exchange format – ‘Transfer
Standard for Hydrographic Data’ [IHO S-57, 1996] for ENC and presenting the ENC
on the screen is specified in another IHO standard, the ‘Colours and Symbols
Specifications for ECDIS’ [IHO S-52, 1996].
In order to be called as ECDIS, the equipment that is to be installed on
board must do much more than just properly display the stored chart data and it must
support the whole range of navigational functions that make use of the characteristics
of the chart data and their specific presentation. For this reason, the International
Maritime Organisation (IMO) has developed a standard describing the minimum of
functional requirement of an ECDIS – the ‘Peformance Standards for ECDIS’ [IMO
ECDIS, 1995]. In addition, it must pass type approval and test procedures developed
by the International Electrotechnical Comission (IEC) and based on the IMO and
IHO requirements. The Figure 2.4 shows an overview of co-operation of the three
above-mentioned organizations and the description of the standards developed by
them.

19
IMO
Performance Standards for ECDIS
IHO
IEC 61174
“Maritime navigation and radiocommunication equipment and systems- Electronic Chart and Information System (ECDIS) –
Operational and performance standards, methods of testing and required test result”.
S-52 Colour and Symbol
Specification for ECDIS
S-57 Transfer Standard for Digital Hydrographic
Data
Figure 2.4: International Standards for ECDIS and the participating orgranisations.
ECDIS acts as information system and offer additional information about
the characteristics of the displayed features besides the graphic presentation of the
chart. Within the ECDIS, the ENC database stores the chart information as lines,
areas or geographic objects. Appropriate mechanisms are built into the system to
query the data and then to use the obtained information to perform certain
navigationanl functions.
2.5.2 Electronic Chart System (ECS)
Generally, all of the systems that are not capable of meeting the ECDIS
performance standards can be generically defined as Electronic Chart System (ECS).
This can be happended because they do no use the official ENC data that has been

20
issued by a hydrographic office or they have limited functional capability that does
not match the requirements specsified by IMO.
ECS is using privately sourced data offer a good range of functionalities,
several also display the official vector data and raster data. However, the private
sources can only guarantee to a limited degree the completeness and correctness.
They are not capable of being considered equivalent to nautical paper charts. But,
this has not prevented ECS from getting widespread acceptance and considerable
success. Nowadays, number of ECS equipped SOLAS vessel is much higher
compared to the number vessel carrying and operating an IMO compliant ECDIS.
ECSs have firmly esablished the idea and the use of electronics charts display
systems onboard. Truly, for legal reasons the paper chart remains the official base for
navigation onboard and cannot be left home in case the vessel operates with ECS.
2.5.3 Raster Chart Display System (RCDS)
The data for the Raster Chart Display System (RCDS) is raster charts. Raster
charts can be obtained through a scanning process (e.g. an optical, electronic line-by
line capturing process of information containes on paper charts). When properly
displayed, raster data can be a faithful reproduction of the information contained in a
paper nautical chart.
However, the raster data allow only the screen display of the pictures of the
paper charts whereby the vector data containc the objects’ characterictics and open a
completely new dimension in chart display and navigational functions. Thus, an
electronic chart system in RCDS mode does not provide the full functionality of
ECDIS.
There are a lot of weaknesses for RCDS when it compares with the ECDIS. It
is because it does not provice the different scale charts, the look-ahead capability

21
may be somewhat limited and this may lead to some inconvenience when
determining range and bearing or th identity of distance objects. The orientation of
RCDS display will be affected the readability of chart text and symbols (e.g. course-
up, route-up) due to the excessive zooming in or zooming out. It is because the raster
charts are made up of cells or pixel. Therefore, it may not be possible to interrogate
Raster Navigational Charts (RNC) features to gain additional information about
charted objects.
2.6 Electronic Navigation Chart (ENC S-57)
ENC S-57 is a set of standard specification that developed to enable HO and
other private companies to produce ENC S-57 with a consisten format. Thus, the
ECDIS can be implemented in an efficient way with a completed set of ENC S-57
data that cope with IMO Performance Standard for ECDIS.
2.6.1 Data Model of S-57
Data model for ENC S-57 has been classed to four types of feature objects,
which are geo, metadata, collective and cartography as below:
(i) Geo Object
Including all the discriptive features that related with real world
entities.
(ii) Metadata

22
Including the background information for some objects or data (e.g.,
scale compilation, datum, publication date and others).
(iii) Collective
Information inter-related with other objects.
(iv) Cartography Object
Including the cartography information for the real world entities.
2.7 Process of Producing ENC S-57
Basically, the process of producing ENC S-57 involves three main
components; there are data source, data and product. The data source is referring to
the methods to obtain data such as hydrography surveying, paper charts or other
maps that related. Data means database of electronic navigational chart that based in
vector format and it is formed by varies set of data files. However, product means the
end product that will be received at the end of the process.
ENC S-57 also a kind of data for digital nautical chart in the form of vector
format. Vector data file able to keep the image on screen as a discriptive object.
Normally, it represents the information as below:
(i) A series of points (latitude/longitude) in explaining connected nodes
for different polyline segment surrounding coast area.
(ii) A point (latitude/longitude), which can provide the position of depth.
(iii) A point (latitude/longitude), which can provide the position of
navigational symbols.

23
(iv) Text (e.g., name of places) and its postitions.
One of the method in implementing the development of database for this
digital nautical chart data is through the on-screen digitization using CARIS GIS.
Different key or ID represents each object or feature but it could be in same or
different layers. The key or ID can act as primary key, which build the relationship
between data spatial and data attribute in database.
Source data that normally used to produce ENC S-57 must be paper nautical
charts and information from the latest surveying that published by HO.
In order to implement the development of ENC S-57, information that keep in
the nautical charts need to be arranged according to certain thematic layers, such as
depth information, topography, magnetic, tide, metadata, port ultilities, obstructions
or dangerous objects and others. The purpose of arranging is to smooth the query
towards data attribute in database as well as the data spatial that will be developed.
Figure 2.5 shows the example of implementation of ENC S-57 that practised by
Singapore Hydrographic Department.

24
Planning • Area • Usage • Name of sel
Digital nautical charts in CARIS NTX format
Exchange data format to ENC S-57 using NTXCONVERTER
Interactive process to edit object
Checking in first phase
Last phase checking
Certified by Head of financial
Publishing data ENC
OK
OK
Editing
Editing cell Others data Input:
• Singapore tide table and port information
• Information of Singapore navigatos
Figure 2.5: Flow chart of process in producing ENC S-57 (Edition 3 and 3.1)
by Singapore Hydrographic Department (Source: Wilson, 2002).

25
2.8 Problems in Producing Data ENC S-57
Producing data ENC S-57 is not a simple work. One of the problem that
always occured and related with producing data ENC S-57 is involve the standard
specification of S-57 itself. For earlier group that involved in producing ENC S-57,
they forced to go through three times of reproducing data ENC S-57 due to the
updating or correction towards the data structure in standard specification of ENC S-
57 that published in different edition. However, tha final standard specification had
published and compiled in standard specification of ENC S-57 Edition 3.0 whereby it
has explained in detail regarding the need of ENC as below:
(i) Product Specification for ENC
(ii) Updating Profile for ENC
There are some obvious problems that facing by all of the HO or private
publishers:
(i) The use of suitable tools to execute Quality Assessment (QA) and
Quality Control (QC).
(ii) The need of training for staff so that they can cope with the procedure
of producing ENC in short period.
(iii) Existing of different interpretation towards ENC contents.
(iv) Problems related with the need of data hydrography surveying for
critical areas such as port authorities to produce navigational chart in
super scale.

26
2.9 Status of Producing for ENC S-57
In the VI meeting of IHO WEND in Norfolk, Virginia within 18 to 19 May
2001, it was known that some of the produced ENC S-57 did not fulfil the
requestment of user completely and it led to the failed of functional ECDIS. In
details, attention paid more to existing ENC S-57 for commercial uses till the day
before that meeting began. Therefore, that meeting decided WEND to launch a study
on certain ENC S-57 in the whole world. The study included some aspect as below:
(i) Future planning for improving the publication of ENC S-57.
(ii) Inter-connected within the existing ENC S-57 with the main vessel
path.
(iii) The need of aid and training to solve the above problems.
The International Hydrographic Bureau (IHB) has requested the collection of
ENC for the countries that relevant with the problem. The result of that study
(Appendix A) shows the collection of ENC S-57 that has implemented and it could
be classed to three groups as below:
(i) ENC S-57 that still in process of planning or producing are shown in
red border.
(ii) ENC S-57 that has done, but not yet published in commercial way are
shown in blue border.
(iii) ENC S-57 that has been published for commercial used are shown in
black border.
However, the information of study is not enough to give a clear look,
whereby there will be some mistakes in grouping the classes cause some of the sel
that has classed is not accurate. In addition, the limitation of cell for ENC S-57 that
presented in Appendix A might not able to provide the real area of data ENC due to
lack of some area and chart (refer to Website http:// www.iho.shom.fr /ECDIS/
WebCatalogue/ ENC_Coverage.htm ). The coming sub topic will give an example of
ENC S-57 that has done in the planning for water area in some countries.

27
2.9.1 Example of ENC S-57 for Hong Kong Area
ENC S-57 for Hong Kong could be divided to 15-greography locations
included the whole water area of Hong Kong. Each geograhy location formed a cell
and each cell given a purpose of nacigational usage. Figure 2.6 shows the cells that
within Hong Kong water area whereby Table 2.1 shows the publication of cell that
has been finalised in 12 March 2004.
Figure 2.6 Cell of ENC S-57 for Hong Kong area
(Source: http://www.hydro.gov.hk/enc/images/encindex.png)

28
Table 2.1 List of ENC S-57 for Hong Kong area
(Source: http://www.hydro.gov.hk/enc/coverage.php)
Sel Title Usage Editi
on
Publication
Date
Numbers of
Update
C25E0001 Mirs Bay Harbour 1 2 Jan 2004 0
C24E0002 Tap Mun Approach 1 2 Jan 2004 0
C25E0003 Tolo Harbour Harbour 1 2 Jan 2004 0
C24E0004 High Island East Approach 2 2 Jan 2004 1
C25E0005 Sai Kung Harbour 2 2 Jan 2004 2
C24E0006 South Eastern
Approaches
Approach 2 2 Jan 2004 2
C25C0007 Harbour ¡V
Central Part
Harbour 2 2 Jan 2004 1
C25C0008 Harbour ¡V
Western Part
Harbour 2 2 Jan 2004 1
C24C0009 East Lamma Approach 2 2 Jan 2004 0
C24C0010 West Lamma Approach 2 2 Jan 2004 1
2.9.2 Example of ENC S-57 for Australia Area
In Australia, the first cell of ENC S-57 had published by Australian
Hydrographic Service (AHS) and it is known as Seafarer® ENC. It is the electronic
chart in vector format that developed by fulfiling IMO standard for uses in ECDIS.
In order to fulfil the need of users, the area of Seafarer® ENC has divided to
different types according to user requirement, as below:
(i) For limitation of navigation area that sensitive to natural environment
and main ports authorities.
(ii) Main path of navigation.
(iii) Entering and Exiting path around the ports.
(iv) Area along the coast.

29
The main case that implemented by AHS is to complete the area nearly to
1000 nautical miles withing the Torress Strait and Great Barrier Reef (GBR). It
included Great North East Channel, ports and other main navigational paths in that
country. Collection of premiere Seafarer® ENC publiched on 1st July 2002 whereby
it is the sel ENC for Great Barrier Reef from Weipa across the Torres Strait to
Claremont Isles. Figure 2.7 shows the latest publication of ENC for the north area of
Australia that contains the navigational path within Weipa Port at Carpentaria and
Whitsunday Group bay in Great Barrier Reef area (http://www.hydro.gov.au).
Figure 2.7: Cell ENC S-57 for North of Australia
(Source: http://www.hydro.gov.au/images/enc-availability.gif)
Sedia ada
Akan diterbitkan

30
2.9.3 Example of ENC S-57 for Italy Area
There are two strategies that used to produce ENC S-57 for Italy, which are:
(i) Temporary Paper Chart
Implement the compilation of digital data through importing source of
paper chart to the environment of ENC S-57.
(ii) Old Paper Chart
Using the digitization method on the old paper chart.
Therefore, the Italian Hydrographic Institute (IHI) launched a set of data compilation
for the port chart and its surrounding area as shown in Figure 2.8. Other than that,
development of Bathymetric Information System by IHI really helped much in the
object data for S-57 compilation (e.g., beach line, conture, depth and others) so that it
can be more accurate with the added information from the data surveying.

31
(a)
(b)
Figure 2.8: Area of ENC S-57 for Italy (a) General (b) coast and port
32
In 1st January 1997, IHI has launched Electronic Chart Division with the
activity of first phase that focus on the study towards standard of specification S-57.
Starting on March 1997, nearly 56 charts have chosen to be digitized and exchanged
to ENC S-57 format vertion 3.0. To produce a set a quality data, effort are needed to
optimized the process of data coding and cataloging to smooth the digitize operation
from time to time. IHI still keep on study the softwares that able to used for updating
data that can import or export in different format (e.g, DGN, DXF and ASCII). Till
now, 120 set of ENC S-57 has succeeded published for Italy water area by IHI
(www.marina.difesa.it/idro/index.htm).
2.10 Roles of GIS in Hydrography
Hydrographic GIS is an emerging utility, which not only promises
effectiveness and speed in providing hydrographic products and services but can also
provide much needed services to other emerging users of hydrographic and
oceanographic data likes administrators, oceanographer and engineers. This GIS
could be a backbone for ocean related data in the larger National Geospatial Data
Infrastructure (NGDI) (Mittal, 2002).
There are a number of considerations that must be taken in order to improve
a marine navigation (e.g. weather damage, tidal, water depth, machinery damages,
harmful obstructions and so forth). With the existence of GIS technology,
Hydrographic Information System (HIS) can integrate all the activities of a
hydrographic office on a single integrated digital platform. In addition, it could be
further integrated to oceanographic and topographical databases.

33
Besides, to enhance the safety of navigation, GIS has enabled hydrographic
offices to discharge their roles effectively in the fields of delineation of maritime
boundaries and also Coastal Zone Management (CZM).
The major usages of GIS in Hydrography are in processing of digital field
data, preparation of electronic chart and paper navigational charts (Mittal, 2002). The
electronic chart is usually used as a base map for oceanic/coastal GIS domain. The
electronic chart provides an enabling tool for building a comprehensive GIS enabled
database for the oceanic and coastal domain. It also provides a base-map for the sea.
Currently, the GIS trend if moving to Web environment and it do bring more
benefits for hydrography particularly in managing the electronic chart in a cost
effective way. The details of this topic will be discussed in more detail in Chapter 3,
which is elaborating the Web environment and its use for nautical charting.
2.11 Conclusion
From the literature, more and more nautical charts are now presented the
electronic chart that can bring benefits to users. Some of the elctronic charts can be
used in an interative way to help users in decision making and planning. Those
electronic charts can be used in whether ECDIS, ECS and RCD as a compile system
to assist user to obtain varies of information in vessel navigation.
Furthermore, there are many types of mechanisme can be used in producing
electronic charts or ENC S-57, all publishers have to make sure the cells of ENC S-
57 that produced are fulfiling with the standard specification of IHO. For the system
and software developer for ECDIS, they must obey all the standard specification that
set by IHO, IMO and IEC. Based on the literature, HO of each country responsible in
the producing ENC S-57 for water area. However, the effect of the problems that

34
have stated above has led the producing of ENC S-57 able to published by some
companies that chosen by IHO to smooth the rate of publishing in the world.
The evolution of techology in nautical charting has helped researcher in the
data collection. Therefore, it is possible for the researcher to obtain the latest nautical
charts and also the Notice to Mariners in order to yield the application that contains
latest information. However, the electronic chart is quite costly in the market, thus
resarcher needs to digitize the latest paper charts from RMN into the digital format
for application uses.

For lunc
CHAPTER 3
DATABASE DESIGN
3.1 Background
In order to build an application successfully, it is important for researcher to
focus on the database design before the system creation. Database design is to define
the needs of end user for the application in order to arrange the relevance information
into it.
It will determine the contents and also the final result of the application.
Therefore, this chapter will explain in detail regarding to the procedures of database
design for the research.
3.2 Need Assessment
Generally, there are three kinds of tasks included in need assesment, which
are need of market, need of users and need of system. However, researcher will focus

36
on need of users because the end result of the study will not be shown in the existing
market. One of the purposes to run the need of users is to ensure the real information
that really needed to a system or database.
Researcher needs to do a user need assessment for the related parties (e.g.
Port Authorities and Marine Departments). The purpose of the need assessment is to
ensure the information in the research fufill the need of users. Furthermore, a well
orgranised user needs assessment result in a well-presented structural database, with
query and storage supported. The list of port authorities that given quationnaires are:
(i) Marine Deparment of Middle Region
(ii) Marine Deparment of Eastern Region
(iii) Marine Deparment of Northern Region
(iv) Marine Deparment of Southern Region
(v) Marine Deparment of Sabah
(vi) Marine Deparment of Sarawak
(vii) Tanjung Pelepas Port
(viii) Sabah Port
(ix) Pasir Gudang Port
(x) Terminal FerryTanjung Belungkor
(xi) Bintulu Port
(xii) Kuantan Port
(xiii) Pulau Pinang Port
(xiv) Klang Multi-Terminal
(xv) Port Dickson Port
(xvi) Melaka Port
(xvii) Pulau Tioman Port
(xviii) Kuantan Port
(xix) Kuala Kedah Port
(xx) Kuala Perlis Port
(xxi) Pangkalan Kubor Port
(xxii) Pangkor Port
(xxiii) Kuah Port
(xxiv) Lumut Port

37
(xxv) Muar Port
(xxvi) Mersing Port
(xxvii) Teluk Intan Port
(xxviii)Tanjung Lembong Port
(xxix) Kerteh Port
(xxx) Sungai Rengit Port
(xxxi) Kukup Port
(xxxii) Tanjung Pengelih Port
(xxxiii)Tanjung Gemok Port
(xxxiv) Kuala Besut Port
(xxxv) Kemaman Port
For this research, around 36 copies of quationnaires have been distributed
to both staffs at Port Authorities and Marine Departments in Malaysia. The purpose
of this distribution is to obtain and understand the related information and their
opinions toward to the low cost digital nautical charting for small boats and leisure
crafts in Malaysia and Nautical – WebGIS application that would be developed. The
example set of questionnaires that have been created for need assessment is shown in
the Appendix B. In addition, the needed functions, data spatial and data attribute
also would be comprehended through the result of survey.
By referring to the result of the respond from related parties, there are some
main difficulties related with the vessel navigation activity that caused by several
factors as below:
(i) Problems in entering and exiting of vessel at port authorities that
nearby fishing activities.
(ii) Lack of modern navigational tools for small boats.
(iii) Unclear sight towards lighthouse signal particularly when fog
occurred.
(iv) Shallowness water area at certain jetty.
(v) Lack of statutory knowledge in navigation among fishermen, boat and
craft users.

38
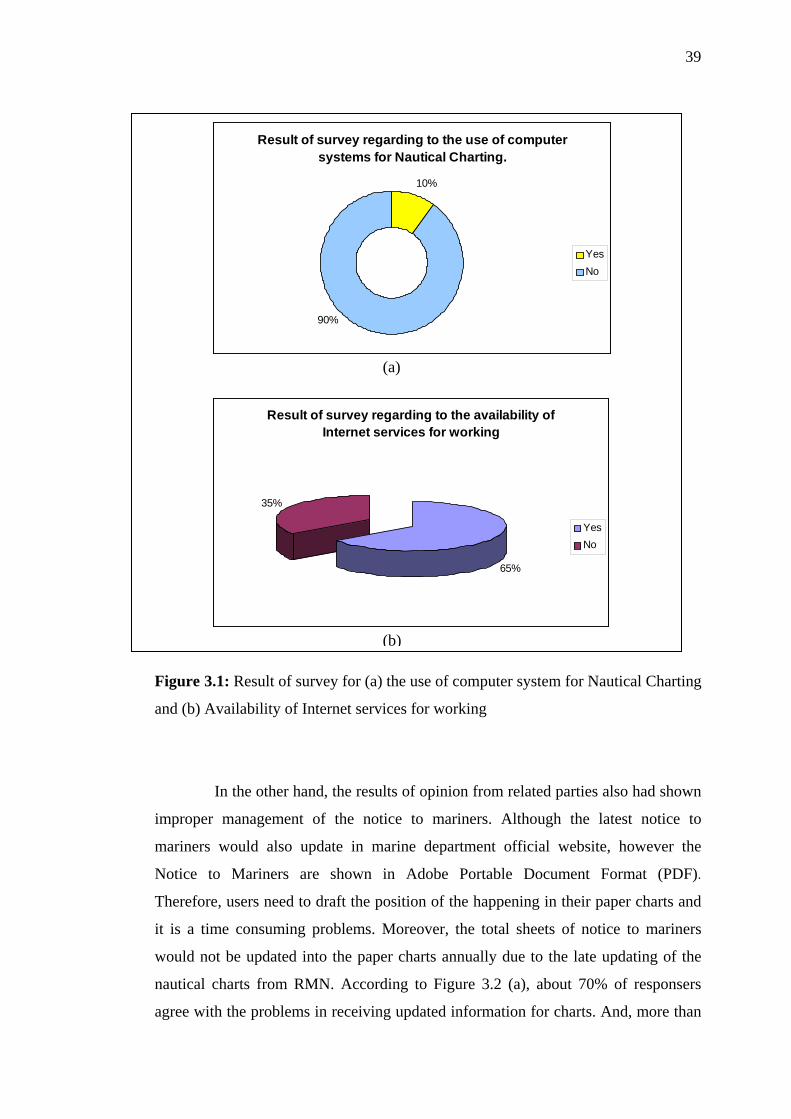
In addition, all of the nautical charts in the market are still in hardcopy but are
some of the charts already tendered by C-MAP Malaysia Sdn. Bhd to convert into
ENC format. In these related parties, most of the staffs are facing some problems like
lack of staffs and specialists, late update for nautical charts and improper data
management (see Figure 3.1). From the Figure 3.1(a), it is obvious that most staffs
are still using convensional method to manage the information. And, most of the
departments have the availabilities of Internet for staff (see Figure 3.1(b)). Therefore,
it is suitable for them to have a proper Web application for publishing the Malaysia
nautical charts in order to enhance the working performance. Other than that, the data
dissemination of nautical charts also can be achieved.
39
Result of survey regarding to the availability of Internet services for working
65%
35%
YesNo
(b)
Result of survey regarding to the use of computer systems for Nautical Charting.
10%
90%
YesNo
(a)
Figure 3.1: Result of survey for (a) the use of computer system for Nautical Charting
and (b) Availability of Internet services for working
In the other hand, the results of opinion from related parties also had shown
improper management of the notice to mariners. Although the latest notice to
mariners would also update in marine department official website, however the
Notice to Mariners are shown in Adobe Portable Document Format (PDF).
Therefore, users need to draft the position of the happening in their paper charts and
it is a time consuming problems. Moreover, the total sheets of notice to mariners
would not be updated into the paper charts annually due to the late updating of the
nautical charts from RMN. According to Figure 3.2 (a), about 70% of responsers
agree with the problems in receiving updated information for charts. And, more than

40
80% of responsers would always look into noticen to mariners for corrections of
nautical charts. Thus, it is a necessary to launch the Nautical – WebGIS to solve the
current difficulties.
0 20 40 60 80 100
Yes
No
Never
Frequency of referring Notice to Mariners for correction of Nautical Charts
(b)
Difficulties in receiving updated information for nautical charting.
30%
70%
YesNo
(a)
Figure 3.2: Result of survery for (a) Difficulties in receiving updated information for
nautical charts and (b) Frequency of referring notice to mariners for correction of
nautical charts.
The result of survey has been proved that there is no Web application for
nautical charts available in Malaysia, therefore this research will be a pioneering in
improving the working performance in both organizations and other related parties
through Web. From the comment and opinion that have been collected, researcher

41
understood clearer regarding to the information that should be in Nautical – WebGIS.
Some Information that is logically to be presented is as below:
(i) The presentation of chart should be in grid-based coordinates, which
is RSO due to the analysis must be established in meter unit. Thus,
the presentation for geography coordinates would also show up in
readable format. For the Malaysia Charts information, some of the
needed field names are scales, minimumand maximum geogeaphic
coordinates, code, date of production, date of edition, projection and
others.
(ii) Other informations that presented on chart like sounding, nature,
offshore installation, water area, swaping area and others also
needed to be kept in different table with related field names.
(iii) Information for notice to mariners should include coordinates,
happening, charts affected, position and date of notice.
(iv) For the spatial presentation, most of the layers should able to be
selectable and some of the less important layers such as nature and
text would be in readable only.
(v) Query of information based on code of Malaysia charts and Notice
to Mariners are compulsory.
(vi) The reference for symbols and abbreviations that publish in MAL 1
should be published on web.
3.3 Database Design
The database design is considered as an important phase to determine the
content of the application. The needs of user have to be defined before designing the
database structure. The database design phrase is aim to clarify the features of data
that are necessary to form the database modeling. In this phase, there are some steps

42
are needed to be focused such as conceptual design, logical design and physical
design.
3.3.1 Conceptual Design
The conceptual design includes all the required data that would be used for
system analysis. It shows the relationship between data elements in an Entity
Relationship Diagram (ER Diagram) and normalization. Furthermore, it certified the
data modeling in order to classify the database design. (Rob, 1997)
From the information that obtained from user need assessment, entities that
involved in the development of database for digital navigational charting for small
boats and leisure crafts have been defined in Table 3.1. Those classifications of
entities are referring to the information in MAL 1 – Symbolization and Abbreviation
for Malaysian Navigational Charts. (TLDM, 1997)
Table 3.1: Entities of Digital Navigational Charts (Malay Versions)
Entiti-entiti
HIDROGRAFI Kedalaman, Bahaya, Perahu_Layar, Laluan_harungan,
Kaw_batas, Pemasangan_Luarpesisir, Arus_dan_ps
TOPOGRAFI Semulajadi, Buatan, Mercutanda, Pelabuhan
BANTUAN DAN
PERKHIDMATAN
Stesen_isyarat, Kem_perahulayar, Marina, Bantuan
AM Metada (Tarikh_tahun_keluar, Negara, Tarikh_Ukuran,
Unjuran, Judul, NO_carta)
Explanation of design symbol is shown in Table 3.2
43
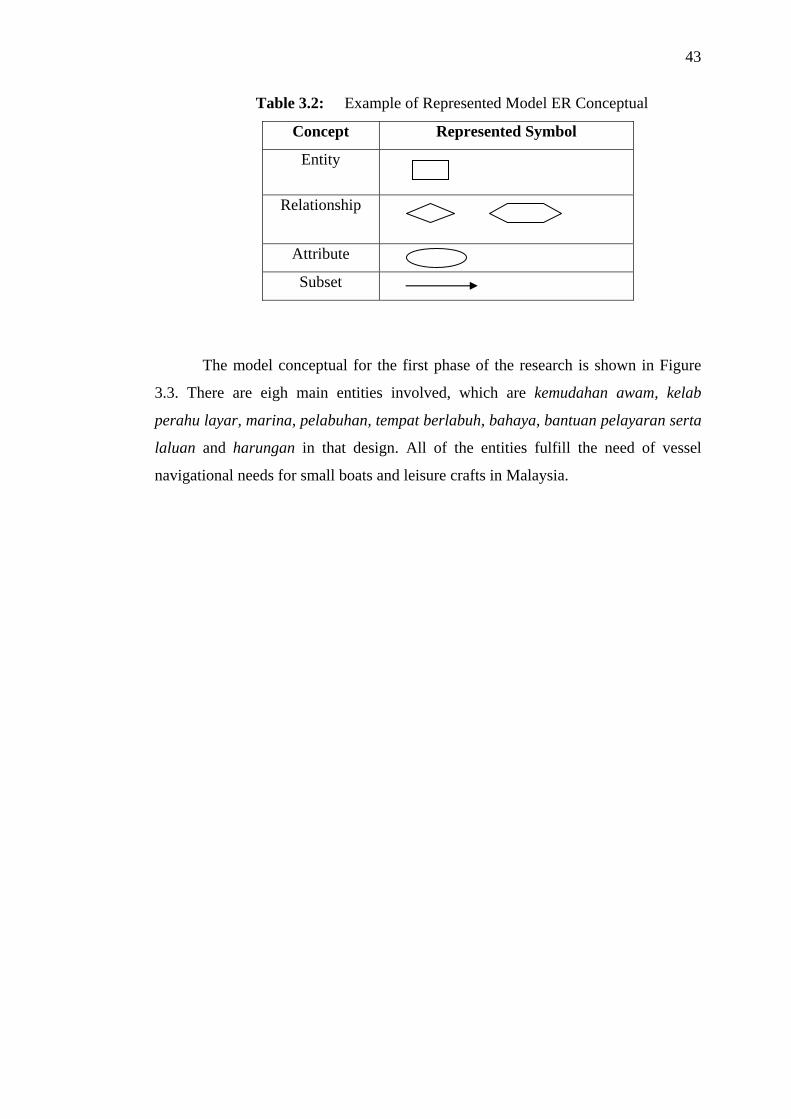
Table 3.2: Example of Represented Model ER Conceptual
Concept Represented Symbol
Entity
Relationship
Attribute
Subset
The model conceptual for the first phase of the research is shown in Figure
3.3. There are eigh main entities involved, which are kemudahan awam, kelab
perahu layar, marina, pelabuhan, tempat berlabuh, bahaya, bantuan pelayaran serta
laluan and harungan in that design. All of the entities fulfill the need of vessel
navigational needs for small boats and leisure crafts in Malaysia.

44
Pelabuhan
Kem_awam
Marina
mempunyai
berhampiran
Dobi
Hospital
Restoran
Pejabat Pos
Frekuensi _VHF
Frekuensi VHF
Alamat_ Pelabuhan
mempunyai
ID_Pelabuhan Fungsi_
Pelabuhan
mempunyai
mempunyai
Kelab_PL
mempunyai
mengandungi
Fea_code Jenis
berdekatan
Bahaya
No_tel Nama
Lain-lain
Kabel
Kapal_ karam
Overhead _ i
mempunyai
Bantuan_ Pelayaran
Boya
Berup
Suar
Pemasangan_ Luar_ Pesisir
Batuan
Nama
Frekuensi_VHF
Tempat_berlabuh
Dermaga
Kaw_berlabuh
Tambatan
Jeti
Laluan_HR
ID_Pelabuhan
ID_Pelabuhan
mempunyai
berhampiran
ID_Pelabuhan
ID_Pelabuhan
ID_Pelabuhan Nama_ kelab ID_Pelabuhan
ID_Pelabuhan
Entiti Medan Kekunci Atribut Perhubungan spatial Perhubungan non-spatial
Petunjuk
Figure 3.3: Relational entities for the development of database for digital nautical
charts. (Malay versions)

45
For the second phase of this research, some business rules for the main data
elements in the research are formed.
Malaysia Chart
Notice Corrected
(0, N) (1, N)
1 M
Figure 3.4: Business rules for entity Malaysia Chart and entity Notice
Based on Figure 3.4, the relationship between Malaysia Chart and Notice is :
(i) A Malaysia Chart can have none of the Notice or it can be many
Notices.
(ii) A Notice would minimum affected a Malaysia Chart or it can be
affected a series of Malaysia charts.
Malaysia Chart
Sounding Divided
(1, N) (1, N)
1 M
Figure 3.5: Business rules for entity Malaysia Chart and entity Sounding
Refer to Figure 3.5, the relationship between entity Malaysia chart and
entity sounding is:
(i) A Malaysia chart would minimum consist a sounding point or it can
be consist many sounding point.
(ii) A Sounding may only record in a Malaysia chart or many Malaysia
charts.

46
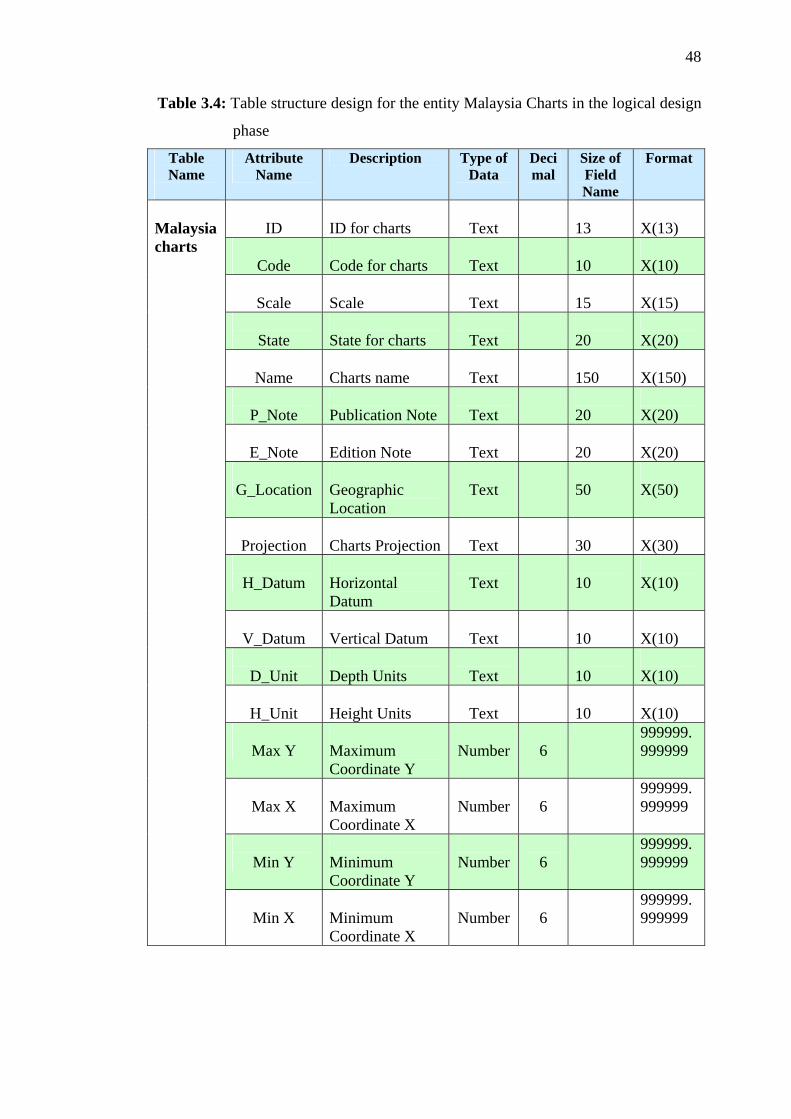
3.3.2 Logical Design
In this stage, the conceptual design that had been created previously would
convert into the internal modeling for a database management system such as Access,
Oracle or others. The relational database modeling has become a choice in the
development of current database because of its support the relationship of data) eg:
1:1, 1:M and M: N) that exist in database system. Besides, it also enable query for
searching related information.
Other than that, the structure of tables, indices and description also designed
in this stage. The table below shows the detail of entities and also attributes for the
development of digital navigatinal charting as a reference for this study (Table 3.3).
For the second phase in this study, the data has been expanded, thus there is another
example of details for the Malaysia charts table is shown in Table 3.4.
Table 3.3: Detail of entities and attribute (Malays versions)
Nama medan Atribut Jenis data Bentuk Data
Kedalaman Nilai_kedalaman (Z)
Lokasi_spatial (X,Y)
Fea_code
Jenis_kedalaman
Had_kedalaman(PK)
INT(4)
INT(6,6)
CHAR(6)
CHAR(1)
CHAR(6)
Point
Point
Polygon
Bahaya Id_bahaya(PK) Had_kedalaman(FK)
Jenis_bahaya
Fea_code
Lokasi_spatial
CHAR(4)
INT(1)
CHAR(6)
INT(6,6)
Point
Kelab_PL Id_Kelab(PK) Nama
CHAR(6)

47
Alamat
NO_Tel
Lokasi_spatial
CHAR(50)
CHAR(150)
INT(10)
INT(6,6)
Point
Kem_awam Id_Kemawam(PK) Jenis_Kemawam
Fea_code
Lokasi_spatial
CHAR(4)
INT(1)
CHAR(4)
INT(6,6)
Point
Marina Id_Marina(PK) Id_Kemawam(FK) Nama_marina
Frekuensi_VHF
Tahun_bina
NO_Tel
Alamat
Fea_code
Lokasi_spatial
CHAR(4)
CHAR(14)
INT(10)
INT(1)
INT(10)
INT(60)
CHAR(4)
INT(6,6)
Point
Pelabuhan Id_Pelabuhan(PK) Nama_Pelabuhan
Frekuensi_VHF
Jenis_Pelabuhan
NO_Tel
Fea_code
Lokasi_spatial
CHAR(4)
CHAR(14)
INT(10)
INT(1)
INT(10)
CHAR(4)
INT(6,6)
Point
Laluan_harungan Id_LH (PK)
Fea_code
Jenis_LH
Had_kedalaman(FK)
CHAR(4)
CHAR(6)
INT(1)
CHAR(6)
Line
Polygon
48
Table 3.4: Table structure design for the entity Malaysia Charts in the logical design
phase
Table Name
Attribute Name
Description Type of Data
Decimal
Size of Field Name
Format
ID
ID for charts
Text
13
X(13)
Code
Code for charts
Text
10
X(10)
Scale
Scale
Text
15
X(15)
State
State for charts
Text
20
X(20)
Name
Charts name
Text
150
X(150)
P_Note
Publication Note
Text
20
X(20)
E_Note
Edition Note
Text
20
X(20)
G_Location
Geographic Location
Text
50
X(50)
Projection
Charts Projection
Text
30
X(30)
H_Datum
Horizontal Datum
Text
10
X(10)
V_Datum
Vertical Datum
Text
10
X(10)
D_Unit
Depth Units
Text
10
X(10)
H_Unit
Height Units
Text
10
X(10)
Max Y
Maximum Coordinate Y
Number
6
999999.999999
Max X
Maximum Coordinate X
Number
6
999999.999999
Min Y
Minimum Coordinate Y
Number
6
999999.999999
Malaysia charts
Min X
Minimum Coordinate X
Number
6
999999.999999

49
3.3.3 Physical Design
Physical design is the stage to define the storage and accessible of data for
optimizing the database performance. The limitation of speed, hardisc space, period
of response and others would be comfirmed. The improper design of this stage will
consequently influence the location of data and the performance of overall system. In
the second phase of this research, the total storage of data for developing the
database is shown in Table 4.4.
Table 4.4: Summary of Storage data for the Research Database (2nd phase)
Table Name Storage of Table (KB)
Malaysia Charts 43.5
Notices 70
Shore 14
Water Area 61
Sounding 76
Offshore Installation 12
Lights 17
Obstruction 58
Nature 6
Mercator 8
Mercator Label 1
Swamping 15
Track 1
Services 1
Radio Radar 4
Limit Area 2
Total 413.5

50
3.3.4 Example in Query Planning
Within the analysing query that can be done through the Structured Query
Language (SQL) from this database are as below:
SELECT (*) FROM (nama jadual entiti) WHERE (medan)
The purpose is to find the spatial location that related with the specific
information in. Thus, user can do some queries on the specific information in the
database as below:
If user question is:
Where are the depth area that less than 5M in the navigatinal path?
SQL Query1:
SELECT (*) FROM (kedalaman) WHERE (kedalaman_dilaluanlayar <5m)
If user question is:
Where are the dangerous rocks located in MAL5622?
SQL Query2:
SELECT (*) FROM (bahaya) WHERE (jenis_bahaya=batuan)
If user question is:
Where are the ports in MAL5622?
SQL Query3:
SELECT (*) FROM (tempat_berlabuh) WHERE (nama_pelabuhan)

51
3.4 Conclusion
At the beginnning of database design, quentionnaires are designed and sent to
related parties. Fortunately, most of the quentionnaires are able to received back
from them and this helps to analyse to user requirement for the research to be
developed. In general, the process of database design for both phases in this study
has fulfilled the criteria of database development as researcher has went through the
designation for model conceptual, model logical and physical directly.
The relationships between the data spatial have been defined during the
conceptual design. And, most of the relationships between the data are 1: M such as
relationship between Malaysian Charts and sounding or offshore installation. In
logical design, the format and type of attribute data to be kept in each table in
database have been designed. Those data attributes for the study has kept in
Microsoft Excel. In addition, 413.5KB storage of database also been estimated in the
physical design of second phase in this research.

CHAPTER 4
PHASE I - VECTOR DATA PREPARATION USING CARIS GIS 4.4a
4.1 Background
As we know, CARIS GIS 4.4a prepares a lot of interactive programs such as
CARIS Editor, SAMI, Information Manager, Image Mosaic, V3D, Plot Composer,
Database Manager, Setup, Report and DDE Interface for users. Each program might
has same or different functions regarding to the aspect of application and related
references that can be reached through CARIS Help or CARIS Users Guide and
Tutorials (Figure 4.1). Other than that, understanding about the structure file CARIS
(*.des) and other files that related also needed to be focus because the data kept into
the CARIS file needs some interactive files to support the presentation of data
effectively.
Figure 4.1: Panel icon for CARIS GIS 4.4a

53
4.2 Structure File of CARIS
CARIS File included 12 components file that keep data using same file name
but different extensions. Those component files that form structure file of CARIS are
shown in Table 4.1 and they are all in binary code except note and record.
Table 4.1: Main components in CARIS file
Extension Type of File Description
.cel Cell Spatial query
.des Descriptor Identity data of CARIS
.dta Node Coordinate data X, Y, Z
.not Note Text
.ras Raster Raster data
.lin Line Polyline data
.nol Node Point data
.pol Polygon Polygon data
.idx Index Record index for feature data
.ix Working Index Related with above index
.rec Record Record file for each program in run
.ntx Interchange Exchange file format in CARIS
When user is using different data processing operation in CARIS, some of the
additional component file might be used as shown in Table 4.2.
Table 4.2: Additional components file in CARIS GIS 4.4a
Extension Type of File Description
.col Colour Table Text file that define colour for features
.con Control Text file for registration in CARIS file
.d_0 Display (visibility) Parameter menu that can be seen

54
parameters
.err error message Text file that keep topology error
.ntb Network Topology Text log that produce network topology
.plb Polygon Topology Text log that produce polygon topology
.cla DTM Class Text file that define colour for DTM
(Digital Terrain Model)
.dcl DTM Cell Improve the processing speed for DTM
file
.tri DTM Triangle Vertex Keep vertex information for triangular of
DTM
.tvx DTM Triangle Keep information for triangular of DTM
4.2.1 Creation of Header File
Basically, a CARIS file has 2 sections; there are header and data. Header has
the geographic reference information that needed for data source. Normally, header
will keep the these records:
(i) Digital chart or map name
(ii) Horizontal coordinate system
(iii) Parameter for map transformation
(iv) Ellipsoid reference
(v) Map scale
(vi) Resolution of coordinate (horizontal and vertical)
(vii) Text and graphic
Source data for header can be obtained from the map reference or
publication. Those information need to be recorded before a CARIS file prepared.
Example of header file for this study is shown in Figure 4. 2.

55
Figure 4.2: Header file for this study
4.3.1 Checking of Header File
The checking or correction of information in header file can be done using
CARIS Tools module through Map Information > List Map Header (Figure 4.3).
Users need to fill in the empty space that shown in CARIS file and click on Execute
button after finished. Later, the header file will be kept in text format as shown in
Figure 4.2.

56
Figure 4.3: Method of checking header file
4.3 Preparation of Data Using CARIS SAMI
To produce a digital nautical chart, CARIS SAMI is needed, whereby the
main objective is to convert the image from raster to vector. In short, the procedures
are shown in Figure 4.4. CARIS SAMI only support TIFF image for data
conversion.

57
Figure 4.4: Flow Chart to convert raster data to vector data using CARIS SAMI
Exchange Raster Data to Vektor
Thinning Raster Data
Vectorizing Raster Data
Inputting additional Data
Data Registration
Creation of Control File
Other than that, the main functions of CARIS SAMI are as below:
(i) Enable data input with a screen image as background.
(ii) Vectorise the polylines effectively in semi-automatic.
(iii) On-screen digitising.
(iv) Editing feature.
(v) Printing.
(vi) Customisation of menu, macros and icon.
(vii) Online help provided.
(viii) Conversion of data format.

58
4.3.1 Data Conversion (Raster to Vector)
In CARIS SAMI, users able on-screen digitising and converting data in semi-
automatic way. There are three main process has been went through in this study for
data conversion, such as:
(i) Scanning Chart into TIFF format.
(ii) Converting TIFF to CARIS raster data.
(iii) Implement thinning using CARIS SAMI.
After the scanning process, it is needed to convert the TIFF file into a file
that can be read in CARIS. In CARIS Tools, there is a menu named TIFF Image
Format to convert TIFF black and white (I byte per pixel) into CARIS raster object.
Other than that, TIFF Image Format also can convert colour image into CARIS
raster image (*.ipv). The procedures are shown in Figure 4.5. In this study, TIFF file
for MAL 5622 has saved as rebak_rn.tif in Source File. Then, REFOTIFF is used for
the process to convert TIFF image into CARIS file.
Figure 4.5: Converting TIFF Image into CARIS Raster Object
_rn
59
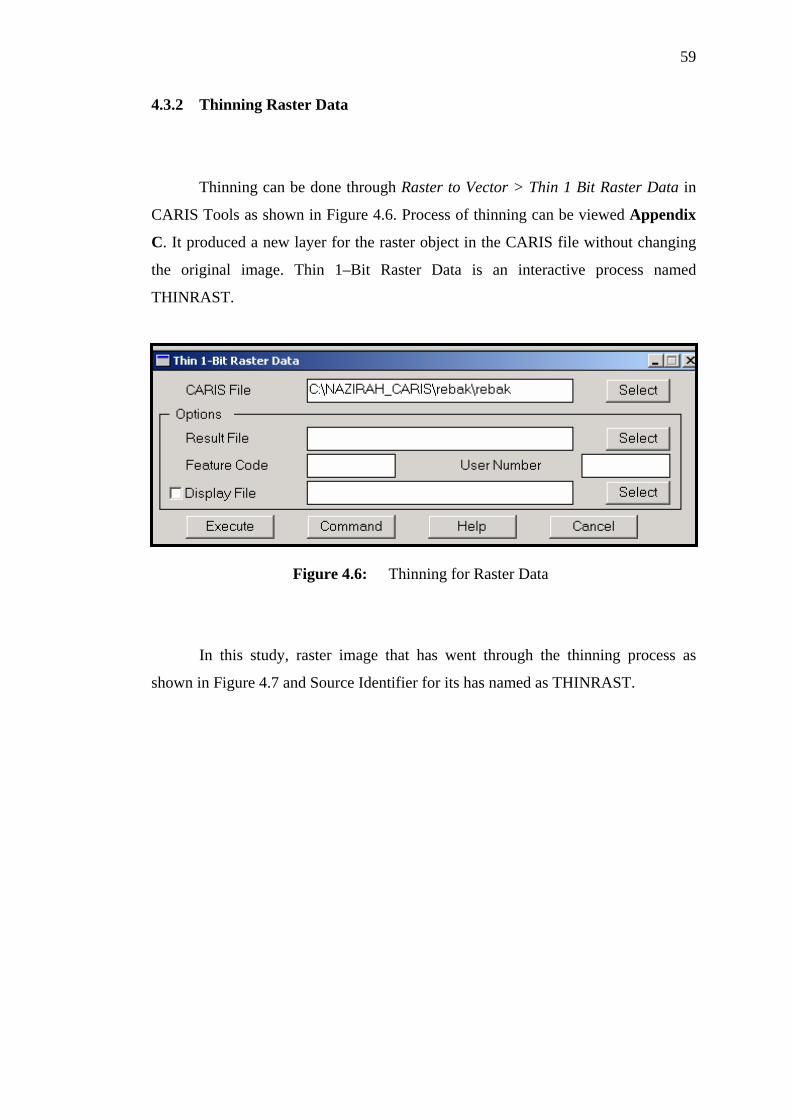
4.3.2 Thinning Raster Data
Thinning can be done through Raster to Vector > Thin 1 Bit Raster Data in
CARIS Tools as shown in Figure 4.6. Process of thinning can be viewed Appendix
C. It produced a new layer for the raster object in the CARIS file without changing
the original image. Thin 1–Bit Raster Data is an interactive process named
THINRAST.
Figure 4.6: Thinning for Raster Data
In this study, raster image that has went through the thinning process as
shown in Figure 4.7 and Source Identifier for its has named as THINRAST.

60
Figure 4.7: Image of THINRAST
4.3.3 Semi-automatic of Vectorising
There are two ways to produce vector data in semi-automatic, which are:
(i) Edit > Line > Add > Line Follow
(ii) Edit > Line > Add > Contour Follow
During the vectorisation, data input can be done using Edit menu in CARIS
SAMI. Symbols that included in this study are based on hydrographic symbols and
information of vessel navigation. It has been classified as below:
(i) Icon panel for water area (fishing port, dangerous rocks, platform,
limited fishing area and others).

61
(ii) Icon panel for IALA (buoy, light house, sectional lines, navigational
lines and others).
(iii) Icon panel for land (triangulation points, airports, buildings, offices
and others).
(iv) Icon panel for coastlines (coastlines that had surveyed, jetty, river,
coastlines that had not surveyed and others).
(v) Icon panel for landlines (contour, road, railway, bridge and others).
(vi) Icon panel for waterlines (dangerous lines, area that had not surveyed,
cable area, limited area, depth contour and others).
4.3.4 Inputting Additional data
There are several methods to input feature data into the CARIS file. Features
that included in the process of producing vector chart can be classified into
polylines, depth value, height points, symbols and texts.
For the input of polylines, it can be reached through menu Edit > Line > Add
> Point-to-point in CARIS SAMI as shown in Figure 4.8 and the result of
digitisation for all data in the form of polylines are shown in Appendix D.
Figure 4.8: Inputting Polylines using Add a Point-to-point Line

62
In CARIS SAMI, height points can be inputted using menu Edit > Spot
Height > Add as shown in Figure 4.9 or shortcut menu on SAMI Tools panel icon.
Figure 4.9: Inputting Height Pints using Add a Spot Height
Both of the symbol and text can be done in CARIS SAMI or CARIS Editor.
Inputting symbol in CARIS can be reached through menu Edit > Symbol > Add
(Figure 4.10). However, the inputting text as shown in Figure 4.11 can be done using
menu Edit > Text > Add > Straight (or Along a Curve and From File).

63
Figure 4.10 Method of Inputting symbol (a) Using menu Add a Symbol for
inputting building (b) Example of location for symbol building
(a)
(b)
Contoh bagi simbol bangunan

64
Figure 4.11: Inputting for Text
For the depth value, there are two ways can be done, which are semi-
automatic or using Add Sounding. In this study, Add sounding is used because it is
easier and able to provide an accurate depth value (Figure 4.12). For some specific
depth, their characters as shown in Table 4.3 are used as feature code before
inputting the depth value related and the result of the depth value for this study are
shown in Appendix E.
Table 4.3: Specific Characters for feature code of depth value
Feature Code Depth
Value
Specific Characters Description
-SGSL - Dry Height
SGSL None Surveyed Depth
KSGSL K Unknown Depth
DLDASWSW S Swept Depth
SGSLNB N Unexpected Seabed

65
(SGSL) ( ) Depth in Bracket
Figure 4.12: Inputting for Depth Value
4.4 Creation of Control File
The final process that needed to be done in CARIS SAMI is the creation of
control file. It needs user to produce a control file to register the digitized image into
a new map file. In this study, there are 2 types of control file, which are input file
and output file. The positions of four control points are shown in Table 4.4.

66
Table 4.4: Position of Four Control Points
No. Points Position X, Y
1 Above left 0.04352, 0.74176
2 Below left 0.04352, 0.09830
3 Below right 1.02938, 0.09830
4 Above right 1.02946, 0.74185
Next, File for Ground Control Point or GCP also has to be formed by
copying the input.con file into a new file called output.con and replace the four
initial control points into the ground coordinate that known. Example of control file
for input and output data that formed are shown in Figure 4.13.
(a)
(b)
Figure 4.13: Control File (a) Input Data (b) Output Data

67
4.5 Map Registration
Map registration in this study is to link the nautical chart to the real
coordinate so that it provides the real map orientation on ground. Therefore, next
step selected the menu Create A New Map from Map Creation and Management
Modular in CARIS Tools as shown in Figure 4.14. It will generate a header file that
kept metadata of chart. Process of Create A New Map can be viewed in Appendix F.
Figure 4.14: Generating New CARIS File Using Menu Create A New Map
Then, registration map can be done using menu Register a Map in Map
Creation and Management Modular (Figure 4.15). The process of registration can be
viewed in Appendix G.

68
Figure 4.15: Register MAL5622 Using Menu Register a Map
The result of this process is shown in Figure 4.16. Since MAL 5622 has been
registered, the next step will be generating topology for it.
Figure 4.16: Result of Chart after registration

69
4.6 Network Topology
Network topology is needed to build before generating polygon topology. It
can be divided to three steps, which are creation of thematic layers, creation of
network topology file and process of producing network topology. The details of
each step will be explained later.
4.6.1 Creation of Thematic Layers
Thematic layers able to present the data layer in a chart. Thus, each data that
inputted during digitisation has to define a reference number for each thematic layer.
The reference number will exist directly when user number inputted in CARIS GIS
4.4a, each user number represent the same value with theme number.
In this study, there are 6 groups of theme number generated and their
descriptions are shown in Table 4.5. Creation of this thematic layer is done with the
reference of Specification Product ENC S-57 Edition 3.0.
Before the process of network topology started, there are three steps have to
be implemented in creation of network topology file, which are:
(i) Generating arc from lines.
(ii) Locating intersection points.
(iii) Trimming arc at intersection points.

70
Table 4.5: Description for Theme Number
Theme
Number
Description
1000 Object involved land surface
2100 Sea area
2300 Direction tools
2400 Government management area
2500 Depth
2600 Contour of topography and road network
2800 Cable area
4.6.2 Creation of Network Topology File
First, all of the lines in the file have to convert into arc with topology for
some of the thematic layers that related. Figure 4.17 shows the procedures of
conversion in theme number 1000 with the help of CARIS Tools > Topology
Creation Module > Convert Lines to Arc.
Second, it is needed to locate the intersection points whereby some arcs will
be intersected. The menu for this step is CARIS Tools > Topology Creation > Locate
Arc Intersection (Figure 4.18)
In order to obtain the complete result as shown in Figure 4.17 and 4.18, each
step has to be followed consequently. After this, network relationship has to be
formed within these arcs.

71
Figure 4.17: Converting Lines to Arcs

72
Figure 4.18: Locating Arc Intersection
4.6.3 Process of Producing Network Topology
For producing network topology, menu Build Network Topology is selected
from Topology Creation modular. This process is shown in Figure 4.19.

73
Figure 4.19: Process of Producing Network Topology

74
From the process of create network topology as shown in Figure 4.19, some
useful information obtained. A statistic shows some processed data has occurred
network topology error in reported message. The correction of network topology can
be done through CARIS Editor with a log file produced (*.ntb) to report the error
condition.
4.7 Polygon Topology
Process of polygon topology will enable the polylines and arcs to form into
polygon with topology. But, this process can only be done after network topology
completely formed.
4.7.1 Labelling Polygon Keys
Before creating the polygon topology in Topology Creation modular, it is
needed to label the keys for each polygon with the help of menu Convert Names to
Polygon Label as shown in Figure 4.20.

75
Figure 4.20: Convert Name to Polygon Label
4.7.2 Building Polygon Topology
The polygon topology can be developed using the menu Build Polygon
Topology from Topology Creation modular as shown in Figure 4.21.

76
Figure 4.21: Method of Building Polygon Topology
However, the process of building polygon topology is advised to implement
twice for:
(i) Finding the topology error the related with networking.
(ii) Finding the error related with polygon labelling.
When the errors are found, it has to be corrected through CARIS Editor using
menu Edit > Topology > Highlight Error Markers, the location of errors will be
listed. The examples of listed error are shown in Figure 4.22. By using menu Edit >
Line > Delete > Whole Line, user able to erase those lines that are not related but
appeared after building polygon topology. Then, the process of building polygon
topology repeated to restructure all the arcs that have changed.

77
A completed digital nautical chart can present all of the contents in paper
charts into computer screen. Figure 4.23 (a) shows a small area from the digital chart
in vector form without topology and Figure 4.23(b) shows the small area from the
digital chart in vector form with network and polygon topology. The digital nautical
chart produced by CARIS SAMI and CARIS Editor can be coloured after building
network and polygon topology. A successful digital nautical chart for Langkawi Port
is shown in Appendix H.
4.8 Result of Digital Nautical Chart Using CARIS GIS 4.4a
Figure 4.22: Example of lines that are not related
Lines that are not related

(a) (b)
Small Area of Digital Nautical Chart that Digitised (a) Chart before process Building Topology (b) Chart after Process Building
78
Figure 4.23:
Topology

79
4.9 Conclusion
From the result that shown in Figure 4.23, the digital chart in vector form has
been produced successfully in this study although it is a time-consuming process.
Data preparation using CARIS GIS 4.4a is a complicated process to be implemented
especially during the initial stage if user lack of knowledge in scanning, digitise and
topology.
Although the process to produce a vector chart using CARIS GIS 4.4a is very
complicated, however it gives an experience and understanding toward conversion of
raster data to vector data that widely being used. In short, CARIS GIS 4.4a can
produce topological vector chart with completed hydrographic and cartographic
information for Malaysian Charts.

CHAPTER 5
PHASE I – RESULT AND ANALYSE
5.1 Background
Spatial Data in this study is digital nautical chart that kept under the file name
of langkawi_reg.des whereby its attribute data kept in the form of *.dbf tables that
produced using Microsoft Excel. The result of this study enable users to access the
digital nautical chart by clicking a new icon that set on CARIS panel icon as shown
in Figure 5.1.
‘MAL’ is the short form of country that produces chart, which is Malaysia
and 5622 is the chart reference number for a Langkawi in Malaysia. Thus, the icon
name for the presentation of result is named in MAL 5622. If there will be different
area charts developed in future, CARIS user able to add a new icon in CARIS icon
panel according to their chart number. Through this way, user will definitely obtain
the needed information in short time.

81
Figure 5.1: Example of Result Accessed through Icon MAL 5622
Using CARIS Setup, CARIS user could decide the type of data presentation
for client. Basically, clients really need some information as listed below:
(i) CARIS Information Manager
Enable user to access the related digital nautical chart directly and
execute spatial analyses using menus on that modular.
(ii) CARIS Database Manager
Enable user to access attribute data that related with the digital
nautical chart.
(iii) CARIS Report

82
Enable user to view the accessed data in the form of report directly.
5.2 Analyses for Updating Data
The development of electronic navigational chart normally need a mechanism
for updating data in order to help user in adding data or deleting data from time to
time. Nowadays, there are two kinds of method for updating data in electronic
navigational chart application, which are:
(i) Updating data by developer, and
(ii) Updating data by users based on the information of Notice to
Mariners.
For data that updated by user themselves, software developer will prepare a
modular for user to edit data and the way of implementation might be different
according to the software and system needs. CARIS GIS 4.4a enable user to edit and
update particular data spatial through CARIS Editor or CARIS SAMI. The aspect of
relevant data editing that been succeed in this study will be explained further later.
5.2.1 Adding Depth Information
As we know, the depth value will always change from time to time due to the
changes of tide. Therefore, related parties will execute digging task to remove
sediments occasionally depends on the need of certain navigational path especially
for those located nearby port or estuary.
83
After the execution of digging task, hydrographic surveying will be
implemented for that particular area to redefine the depth value. Those surveyed data
(bathymetry data) will then be processed and plotted on the relevant nautical chart. In
this study, bathymetry data could be edit and plotted on the relevant data layer using
menu Map Creation and Management > Merge Two Maps. However, user needs to
call out the new bathymetry data using menu Hydrographic Tools > Import Sounding
Data which located in CARIS Tools menu for converting the original bathymetry
data into CARIS file.
5.2.2 Interpolation of Contour Based on Latest Depth Value
Interpolation of contour for surveyed depth value can be done using menu
Digital Terrain Modeling > Interpolate Contour in CARIS Tools modular. In this
study, there is no re-surveyed depth value, thus a test was run on the digitised depth
value to generate new contour. The objective of this test is to compare the existing
contour line on nautical chart with the generated contour line.
Using menu Interpolate Contour and the result is showed in Figure 5.2.
From there, it is clear to see the generated contour lines are almost same with the
existing contour line on nautical chart. The generated contour lines are in blue and
the existing contour lines are in black. Interval for this contour interpolation is 5
meters.

84
Interval of 30 meters
Interval of 20 meters
Interval of 15 meters
Interval of 10 meters
Interval of 5 meters
Figure 5.2: Comparison between Generated Contour Lines with Original Contour
Lines on Nautical Chart.
Menu Query > Information about Features in CARIS Editor modular enable
user to view the information of both original and generated contour lines. Figure
5.3(a) and (b) shows the value of 15 meters for both types of contour lines. Result of
the generated contour with an interval of 5 meters shows only slightly different with
the original contour. Another result of comparison test for generated depth contour
lines with an interval of 2 meters shown in Appendix I.

85
(b)
(a)
Figure 5.3: Interpolation of Contour Lines for depth (a) Generated Contour Lines
(b) Original Contour Lines

86
5.3 Analyses For Vessel Navigation Information
Information of vessel navigation is a critical element for navigators in defining
the navigational direction. Therefore, navigators really need latest data source in
planning a safe navigation whether in the form of conversional or digital.
5.3.1 Calculate Distance between Two Points
Nautical mile (nm) is the unit for calculating distance at sea. As we know, the
shape of globe is wider at both poles, the curve distance on poles are more than
khatulistiwa (Figure 5.4). It causes the distance by one minute on centre curve
became 6,108 feet at poles and 6,046 feet at khatulistiwa (Motte and Stout, 1990).
1'
1'
6108 feet
6046 feet
Figure 5.4: Distance at Poles and Khatulistiwa that Calculated in One Minute (1')

87
According to Table 5.1, it shows the difference between poles and
khatulistiwa in one-minute records value is about 18.8976 meters or 0.010203888
nm. Despite that, the normal value used for nautical miles applications is 1,852
meters for 1 nm.
Table 5.1 Comparison of Distance for a nautical mile at Poles with
Khatulistiwa.
Distance Records in foot
(')
Records in
meter (m)
Records in nautical
mile (nm)
1' at Poles 6,108 1,861.7184 1.005247516
1' at Khatulistiwa 6,046 1,842.8208 0.995043628
Difference 62 18.8976 0.010203888
Referring to Figure 5.5, distance between two points can be obtained directly
through menu Map Query in CARIS Information Manager. Using that menu, user
will receive information such as Ground units, mm at map scales, geodetic distance,
range distance and bearing. Based on Figure 5.5, it shows the given distance in
nautical mile is not fully accurate.

88
Figure 5.5: Distance from A to B Obtained through Map Query Using CARIS
Information Manager Modular
B
A
Distance for a nautical mile should be same with 1,852 meters. Thus, the
actual distance in nautical mile between two points should be calculated in this
method:
We know that, 1 nm = 1852 m

89
Thus, Distance (nm) = Geodetic Distance (m)
1852 m
= 1223.940209 m
= 1852 m
= 0.660874842 nm
However, range distance given by CARIS in nautical mile is 0.000017 was
calculated in this method:
Distance (nm) = Map Scale Distance (mm)/1000
1852 m
Thus,= 30.5918/1000
= 1852 m
= 0.000016518 nm
Round off to 6 digits = 0.000017 nm
As a conclusion, if user needs an application without involving navigational
activities, the given geodetic distance value can be accepted. In contrast, if user
needs the actual value in nautical mile then correction must be calculated as showed
above based on the geodetic distance. Through this way, user will definitely obtain a
suitable reading value.
5.3.2 Result of Network Analyses
Menu CARIS Network Analysis in CARIS Information Manager helps user
to solve the network problems accurately. Example of Network Analyses included
relational analyses and dispatching need graphic presentation for showing a
complicated network. In this study, a suitable network analyses to be implemented is
to determine the shortest path between two harbours or ports. Due to the safety vessel
navigation is a critical issue, generating zone also needs to be done for surrounding

90
dangerous objects. Then, user could define a minimum distance to keep away from
it.
5.3.2.1 Calculating Shortest Path
The main purpose for this analysis is to calculate the shortest path with
minimum cost between two points in a network. Thus, some points are chosen to
form a waypoint. Since MAL 5622 has no recommended track, as a test, a passage
planning existed.
In this study, there are two essential elements to be searched, which are
distance in nautical mile and vessel speed in knot (nautical mile in an hour). Menu
distance between two points prepared in CARIS only given distance value for linear
lines. Anywhere, calculation of curve distance (for geodetic distance) to obtain the
actual value still can be done through network analyses.
Using menu calculate shortest, user will be requested to make waypoint
along the planning path, example for destination A to B as shown in Figure 5.6. At
the end point of path, user need to click on button ‘G’ to execute the automatic
calculation program. It will start calculating the cost distance from first point to the
ending point whereby distance A to B is 0.839 nautical miles.

91
A
B
5.3.2.2 Calculate Speed in Knot
When user wants to obtain the cost model for speed in knot, a formula has to
be formed. Speed (knot) is equal to total distance (nautical mile) in an hour, so the
formula is as below:
Speed (knot) = Distance (m)/1852
Time (hour)
Thus, formula for cost model = (Distance/1852)/1.5
Figure 5.6: Solution Cost for Distance A to B in Nautical Mile
Way point
A
B

92
After inputting formula, user could execute menu Network > Route >
Calculate Shortest to obtain the speed value from destination A to B in this case.
0.559 knots is the give speed when the time period defined as 1.5 hours (Figure 5.7).
A
B
Figure 5.7: Solution Cost for Speed Value from A to B
5.3.2.3 Calculate Period of Navigation
After determining the speed value, it is turn to calculate period of navigation
from one destination to another. Using the same method to obtain distance and speed
as mentioned above, user also could obtain the navigational period depending to the
waypoint along passage planning from A to B (as shown in Figure 5.8) if the speed
are in 3 knots.

93
Figure 5.8: Solution Cost for Navigational Period from A to B with Speed in 3
knots.
A
B
Program will calculate the total time taken along the navigational route
whereby the period of navigation for 0.28 hours is equal to 16 minutes and 48
seconds in this study.

94
5.3.2.4 Comparison between Obtained Distance and Speed with Calculated
Distance and Speed
Result of solution cost for distance between destinations A to B given by
CARIS is 0.839 nautical miles (Figure 5.6). Above distance value can be proved
through below calculation:
(i) Determining parameter to form formula
NM = Distance in nautical mile (nm)
M = Distance in meter (m)
(ii) Forming formula
NM (nm) = M (m)/ 1852 meter
Based on Figure 5.9, we knew that 0.039meters are the distance between
destinations A to B depending to map scales (1:40000). Thus, distance in nautical
mile should be calculated as below:
NM (nm) = ((39 mm x 40000 mm)/1000000)/1.852 meters
= 0.842333 nm
From the result of calculation, it is clear that calculated distance are same
with the distance value give by CARIS, which is 0.84 nautical miles (round off to 2
decimal places).

95
Figure 5.9: Checking Distance from Destinations A to B using query line
information
Next, comparison towards solution cost for speed between destinations A to
B has to be done. As we know that speed given by CARIS is 0.559 knots. The above
distance value can be proved through calculation
(i) Determining parameter to form formula
Distance = nautical mile (nm)
Speed = knot
(ii) Forming formula
Speed (knot) = Distance (nm)/ Time (hour)
Based on the period of navigation from destinations A to B is defined as 1.5
hours, speed should be calculated in this way:

96
Speed (knot) = 0.842333 nm /1.5 hours
= 0.561555 knots
The calculated speed obtained from the above formula is 0.56 knots (round
off to 2 decimal places). It shows that the value is same with the value given by
CARIS if round off to 2 decimals place.
5.4 Analyse Result of Zone for Vessel Navigation Path
The main purpose for this analyses is to find safety navigational route for
small boats and leisure crafts when they entering area of Langkawi Port.
Determination of zone is based on the polygons of both land area theme and water
area theme below 1000.
Some of the criteria related with small boats and leisure crafts are wide and
length of boat, under keel clearance and others. Normally, the wide of boat can be
divided to some categories, such as monohulls, catamarans and trimarans.
Underneath each boat, there is keel to control the position so that it won’t be
unbalanced to right or left side due to the wind or tide. At the stern of boat, there is a
tool called rudder to control its rotating direction whether to right or left side.
Therefore, there is no specialized or accurate method to present the actual
calculation for small boats and leisure crafts that fulfil its criteria. However, the
analyses zone helps user to suit small boat’s criteria with the completed result
analyses.
Other than that, user able to produce an analysis related with safety
navigational route based on suitable depth contour for their boat draft. As an

97
example, user needs to create zone for land area (Figure 5.10). Therefore, menu Zone
> Create > By Polygon is used. For each new zone, new name is given.
PULAU
Initially, there are 6 zones created in this study, which are PULAU, 0-2M, 2-
5M, 5-10M, 10-15M and 15-30M (Figure 5.11) whereby the result of above zone are
shown in Figure 5.12. Next steps are to operating these zones using menu Zone
Operation that involved Intersection, Union, Subtract and Exclusive OR.
Figure 5.10: Created Zone for Land Area
Figure 5.11: List of Created Zones

98
Zone Pulau Zone Depth 0-2 meters Zone Depth 2-5 meters Zone Depth 5-10 meters Zone Depth 10-15 meters Zone Depth More than 15 meters Dried Depth
Reference
Figure 5.12: Result of Created Depth Zones for MAL 5622
99

99
The aim to operate these zones is to merge certain zones to form a new zone.
In this study, some of the zones have to be merged such as zone 0-2M and 2-5M to
represent the depth value between 0 – 5 meters with the name of CETEK_0-5M
(Figure 5.13). Union is the operation to use for merging these two zones.
Figure 5.13 Operating Zones using Union
Next, the operation repeated for merging zone 5-10M and zone 10-15M to
become a new zone called CADANGAN. The result of first operated zone is in black
and the second operated zone is in light blue as shown in Figure 5.14. Thus, all small
boats and leisure crafts are safe to navigate around zone with light blue with the
minimum depth value of 5 meters.
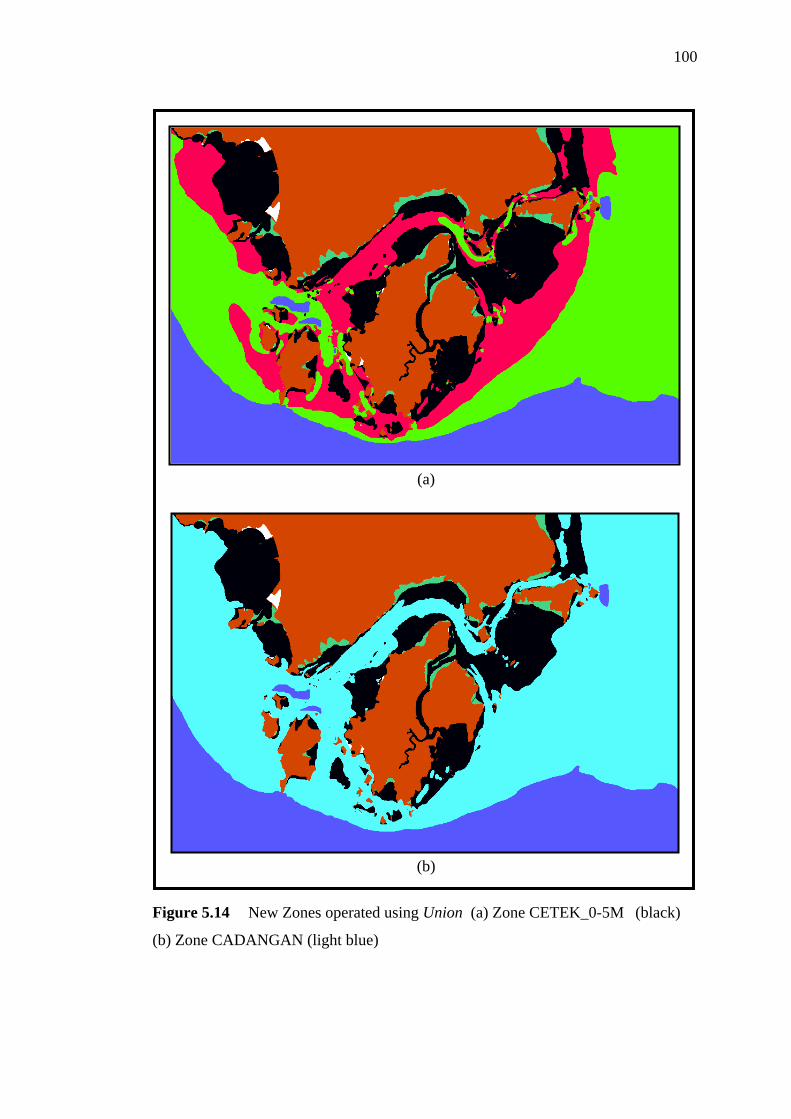
100
Figure 5.14 New Zones operated using Union (a) Zone CETEK_0-5M (black)
(b) Zone CADANGAN (light blue)
(a)
(b)

101
5.5 Analyse Result for Attribute Query
In this study, all of the attribute tables are formed in Microsoft Excel in the
name of MAL5622.dbf. After linking the both spatial and attribute data using CARIS
Setup, some of the analyses can be done.
Figure 5.15 show one of the analyses that executed using menu Query
Condition in CARIS Database Manager. A test was run to view the total sample
polygons between depth intervals of 15m to 20m using 15_20M as its polygon key.
Some tests also executed for other area and the results are shown in APPENDIX J.
Figure 5.15: Analyses using Query Condition
Second test is aims to find the area of land in digital nautical chart of MAL
5622. Some of the parameter was inputted as shown in Figure 5.16(a) to find the area
of land in the name of LNDARE. Next, program will find the information in
MAL5622.dbf automatically and list in Data List under CARIS Database Manager.
Result of this analyses shows in Figure 5.16(b).
Other than that, result showed in DataList15 has detected the land area using
operator ‘>=’ for data LNDARE. It also detected other land area using other keys
(e.g. REBAKB1 and REBAKB2) to add into the existing Data List. Thus, a statistic
test was executed using menu Data > Statistic to obtain the total sample of area and
perimeter that involved. Referring to Figure 5.16(b), about 100 samples are involved
and the area if 248.3 hectares with the perimeter of 326,975 meters.

102
Figure 5.16: CARIS Database Manager (a) Finding Area Information using
Query Condition (b) Statistic for Area that Involved
(a)
(b)
Another test was run using menu MapQuery > Polygon Area in CARIS
Information Manager to check on the accuracy of the statistic value. Result of the test

103
is shown in Figure 5.17 with the total land area of 24,837.938 hectares. The result
value is about 7 hectares more than the value given by CARIS Database Manager. It
is because the value for polygons that kept in *.dbf for this study are in integer value
only.
Figure 5.18: Result of Land Area using Menu Polygon Area
5.6 Conclusion
The result of this study shows that navigators also can do navigational
analyses surrounding Port Langkawi as an alternative for them to plan their route
efficiently. Using the network analyses, user able to plan speed and period of
navigation in short time. In addition, analyses zones also enable user to determine

104
safety zones for their boats. With that, objective of this study for developing a digital
nautical chart in an interactive way for user has been succeed.

CHAPTER 6
PHASE II -SYSTEM CONFIGURATION AND WEB BUILDING
6.1 Background
After obtaining the result of digital nautical chart for small boats and leisure crafts,
it will be more convenient for user to receive these data through Web. Thus, some of the
procedures have to be executed for building a Web application – Nautical –WebGIS to
publish digital nautical chart on Web. In the preparation for Web building, system
configuration has to be involved.
System configuration is to install the software that used for system creation,
besides that it is also needed to configure the server for web application. It is
recommended to set up a password during server configuration, thus the progress system
will be in protected. After configure the software, the Web can be developed. The Web
must have a user-friendly interface to help user in finding information. In order to have a
user-friendly interface, it needed to be customized using programming languages.

104
6.2 System Configuration
To build a Web application, researcher needs to install three servers, which are
IIS Internet Information Services acts as Web server, Autodesk MapGuide server act as
application server and also Map Server (MapAgent). The Map Server will act as a
medium between application server and Web Server for sending requests. In the phrase of
systems configuration, there are some procedures such as Installation of software and
server, server configuration, data format conversion, database configuration, loading data
spatial and database.
6.2.1 Installation of Software and Server
The Internet Information Services (IIS) is considered as software service to
support the development of Web application, configuration and manage with other
Internet functions. The IIS was installed in the Control Panel using Integrated Service
Pack 4 in Window 2000 Professional CD.
After installed the IIS, researcher needed to install the application server and also
the map server. Thus, Autodesk MapGuide 6.3 was installed with three components;
there were MapGuide server 6.3, MapGuide Author 6.3 and also MapGuide Viewer 6.3.
Some of the needed ultilities also installed. When the MapGuide server was installing,
there would be a wizard that showing the suitable MapAgent to be used for developers
(Figure 6.1).

105
Figure 6.1: Choosing the MapAgent from wizard installation
For this research, the CGI (Common Gateway Interface) and ISAPI (Internet
Server Application Programming Interface) would be chose instead of NSAPI (Netscape
Server API). CGI is works with any kinds of Web server and it can be installed easily.
ISAPI can be load by IIS with a faster performance compare with CGI. And, the NSAPI
is works with Netscape Enterprise Server with almost same functions with ISAPI. NSAPI
was not selected during installation because this research used the Internet Explorer 6.0
as is web browser. Both of the MapAgent that installed would act as Map Server between
IIS and Autodesk MapGuide Server.
6.2.2 Servers Configuration
After the IIS has been installed, a virtual directory needed to be created in IIS in
order to present the spatial data in Internet. For this research, the virtual directory that has
been created and the URL is http://localhost/mgweb/. Therefore, all of the websites or
scripts that developed would be saved in this directory for publishing. Furthermore, the

106
MapAgent also have to be comfirmed that it is located in IIS. The URL of MapAgent is
http/localhost/scripts/mapagent.exe for this project.
For the Autodesk MapGuide Server, there are some values have to be defined in
the properties wizard such as setting a new path for the source of data, setting a password
for security of project and others. The steps of Autodesk MapGuide Server configuration
are as Figure 6.2.
Step 1
Step 2
Step 3
Figure 6.2: Process of Autodesk MapGuide Server Configuration
From the Figure 6.2, the step one is mainly for developer to add in the email
address and some limitation of data path. Then, the step two is for developer to define the

107
location of data in computer to be used for the project, it can be defined from the
properties button. And, there are varies type of data provider can be chose such as Spatial
Data Provider for SDF (Spatial Data Format), Spatial Data Provider for SHP,
Connectivity Service Provider and others. There are two data providers were created for
this research, which are Autodesk Spatial Data Provider for SDF for the spatial data and
Microsoft OLE DB Provider for ODBC Drivers. The last step is to set up the password
and groups or users can create it.
6.2.3 Data Format Conversion
The CARIS had convert into coverage format after transforming its projection
into RSO in ArcGIS 8.3. For Autodesk MapGuide 6.3, it is recommended to use data
format in SDF because there would be no function limitation for this kind of data format
in. In order to convert the data format, Autodesk MapGuide SDF Loader is needed.
Autodesk MapGuide SDF Loader is a command-line utility that converts map data from a
variety of GIS data file formats to binary-format Spatial Data Files (SDF). Autodesk
MapGuide Server reads and serves SDF files to Autodesk MapGuide Author and
Autodesk MapGuide Viewer.
The data format conversion is run in MS DOS Prompt. The data file will be
separate to be converted in form of spatial and attribute. For the spatial data will be
convert into SDF format whereas the attribute would be convert into CSV (Microsoft
Excel Comma Separated Values Files). The converted SDF can be viewed in Autodesk
MapGuide Author for further development of research. In contrast, converted CSV files
for each layer have to open in Microsoft Access for combining all the tables and saved
them as MGdatabase.mdb.

108
6.2.4 Loading Data Spatial and Database
Before the data to be loaded in the Autodesk MapGuide Author, the
MGdatabase.mdb has to be configured in the ODBC data sources and drivers. The
configuration of database is to ensure database connectivity between networks would be
worked. The steps for ODBC configuration are shown in Figure 6.3.
Step 3
Step 2 Step 1
Figure 6.3: Process of database configuration

109
The Step one and two in the Figure 6.3 is to define the data types of the database.
When it comes to step 3, the path of the database needs to define as well as the data
source name for linking.
After the database and the data spatial have been prepared well, all of the layers
would be loaded in Autodesk MapGuide Author and save it as a MWF (Map Windows
File). Before the MWF file completed, there are some configuration needed for each
layer in the Map Window Properties and Map Layer Properties. For the Map Window
Properties, the projection of spatial data is defined as Arbitrary X-Y Coordinate
Projection. However, the steps for Layers configuration are shown in Figure 6.4.
Step 3 Step 4
Step 1 Step 2
Figure 6.4: Process of Map Layers configuration

110
The Step one in 6.4 is to name the layer name and whether or not it want to be
shown in the legend. Next, the step two is to link the layer with the table in Access
database. It can be linked with a secondary table or feature table. At the below of this
window, there is a line to set the location of MapAgent. The location of MapAgent must
be set as the same location in the IIS so that the chart will be shown online. For this
research, the URL of MapAgent is http/localhost/scripts/mapagent.exe. The next step is
to define the style of layer to be presented and also the label for layers. The final step for
the Map Layer Properties configuration is to set the layers and API security. Each of the
layers can own a password to secure the privacy of information.
The result of the layers presented in Autodesk MapGuide Author 6.3 is shown
in Figure 6.5 with a list layers legend and and different styles spatial data. This
combination of layers will be saved as Map.mwf for development of Web application.
Figure 6.5: Map Window in Autodesk MapGuide Author .

111
6.3 Web Building
When all of the data are well prepared, it is time to build up the Web for data
presentation. This phase is to determine the final presentation of Nautical – WebGIS in a
user friendly way. In addition, the Web that would be developed has to achieve the
objective of this research. Therefore, it is needed to start with Web design for planning
how to present all the information. Other than that, development of Nautical –WebGIS is
included in this phase.
6.3.1 Web Design
In the Nautical – WebGIS, the interactive between the end user with the Web
application have to be worked smoothly. Thus, some issues will be focused to build a
consistent design, such as presentation for map and information, text, colour, structure of
content and visualization for the Web. Figure 6.6 shows the sitemap design for the Web
structure.
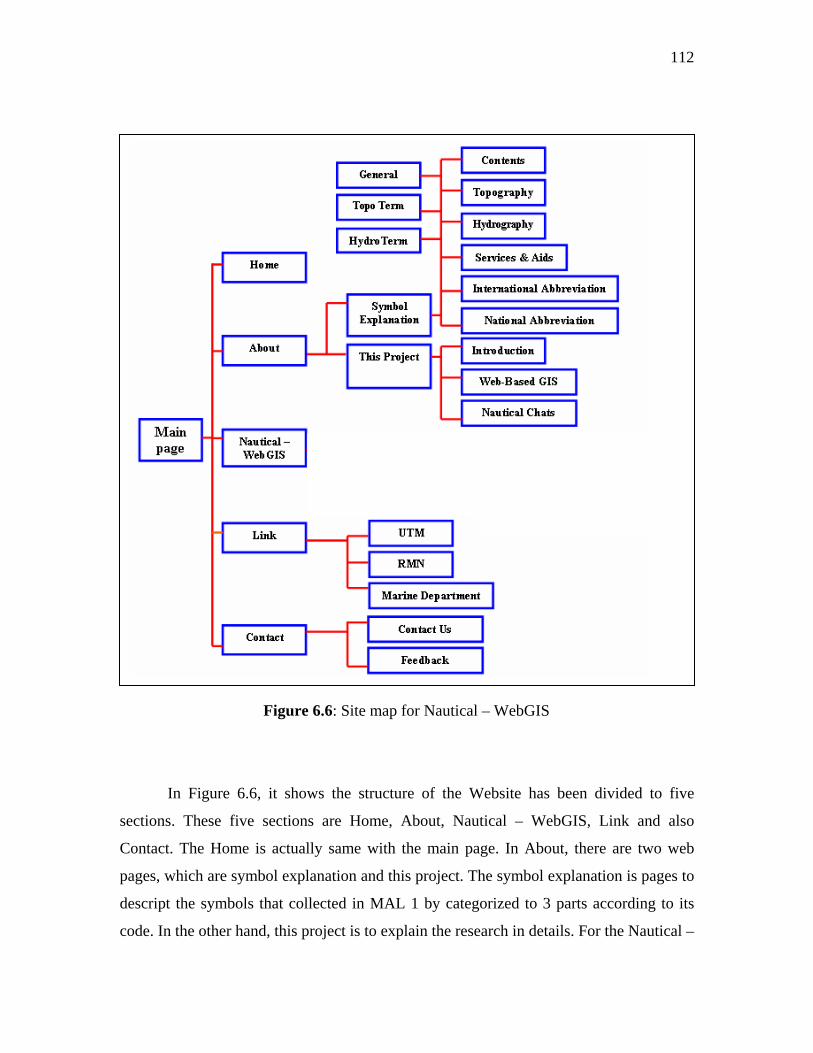
112
Figure 6.6: Site map for Nautical – WebGIS
In Figure 6.6, it shows the structure of the Website has been divided to five
sections. These five sections are Home, About, Nautical – WebGIS, Link and also
Contact. The Home is actually same with the main page. In About, there are two web
pages, which are symbol explanation and this project. The symbol explanation is pages to
descript the symbols that collected in MAL 1 by categorized to 3 parts according to its
code. In the other hand, this project is to explain the research in details. For the Nautical –

113
WebGIS, user will able to do some analyses on digital charts. The other two pages are
link and contact. Link is enable user to go to related Website and the Contact is to receive
feedback from users. Furthermore, the contact information also would be stated in this
page.
6.3.2 Development of Nautical –WebGIS
The Website for Nautical–WebGIS has been divided to different sections that
shown in Figure 5.6. Microsoft Office FrontPage 2003 is used for developing HTML
pages such as Home, Feedback, This Project, Symbol Explanation and others. These
pages can provide information to end-user in a simple way. Some of the components that
can present through the HTML are table, picture, button, icon, text and animation.
The static pages are written in HTML language whereas the dynamic pages are in
ASP, VBScript, JScript and Autodesk MapGuide Viewer API. In order to build up a
complete and user-friendly Website for Nautical–WebGIS, some dynamic pages are
included likes dynamic map, security module and also interactive query.
6.3.2.1 Development of Dynamic Map
During the software configuration, the output of spatial data has been saved as
Map Window File (MWF), which is MGmap.mwf. The file will need to be presented in
Autodesk MapGuide Viewer API and there are 3 types of viewer API, which are

114
Autodesk MapGuide Viewer Plug-in, Autodesk MapGuide viewer ActiveX Control and
Autodesk MapGuide Viewer Java Edition. Due to the web browser that in use is
Microsoft Internet Explorer, thus the Autodesk MapGuide Viewer ActiveX Control is
used for presenting the interactive map.
The process of displaying a map involves linking to or embedding the map in a
Web page. In this research, the map is displayed by embedding it in HTML page. There
is a list of parameters that control the way the map is displayed when it is embedded in an
HTML. The examples of parameters are MapScale, MapWidth, Coordinates, Units,
ToolBar, StatusBar, URL, LayersViewWidth and others. In the URL, the IP address and
the directory of the map.mwf need to define for presenting the output of spatial data.
Autodesk MapGuide provides a default map window with some default toolbars
for map viewer API. In developing the Nautical – WebGIS, some of the basic map
functionalities such as Select, Pan, Zoom In, Zoom Out, Zoom Previous, Zoom Select,
Full Map and Print are customized to be shown in dynamic graphic. In this way, the Web
page could be displayed attractively. The script of the dynamic map is shown in
Appendix K.
6.3.2.2 Development of Interactive Query
Based on the result of need assessment that have be done, there are 2 main layers
are needed for query function. These two layers are Malaysian nautical charts and Notice
to Mariners. However, the details of information for other layers are shown in the report
function.

115
The query functions for Malaysian nautical charts have been divided to two parts,
which are query by code and query by state. Whereas, the query functions for Notice to
Mariners are query by code and query by charts. Through this separation of query, users
are able to obtain the needed information easily. Besides, a zoom go to function also
would be shown in the result query, so that users can view the location of spatial data
directly from the result query.
The script for the result of interactive is shown in Appendix K.
6.4 Conclusion
In the system configuration, there are 3 servers are installed for this research
continuously, which are IIS Web server, MapAgent and the Autodesk MapGuide
application server. Other than that, both data spatial and database that have been fully
completed also need to configure in the server. The data spatial was configured through
the Autodesk MapGuide Author and the database is configured in the ODBC data sources
and drivers.
The designing of the Web application for this research has been discussed in two
kinds of development, which are development of dynamic map and development of
interactive query. Each of the development is playing an important role to success the
research.

CHAPTER 7
PHASE II - EVALUATION FOR NAUTICAL – WEBGIS
7.1 Background
The development of Nautical – WebGIS is mainly for providing updated nautical
charts information as well as the latest Notices to Mariners to the end users through Web
platform. Furthermore, the second objective of this research is to test and evaluate the
result of application based on its performance and the opinion from the users. Therefore,
testing and evaluate from both researcher and end users have to be done for ensuring the
variety interfaces of the Website are user-friendly.
7.2 Website for Nautical – WebGIS
The sitemap of the Website has been discussed in chapter 6. Thus, the result of
the Website can be divided to six main parts; there are Home, About – Symbol
Explanation, About – This Project, Nautical – WebGIS, Link and Contact (Figure 7.1).

117
All of these parts can be categorized into four types of interface, which are interface of
Website Information, interface of Map Display, interface of Authorization and interface
of Query Functions. Most of the Web pages for the Website Information are developed in
HTML. Others web pages are in ASP, VBScript and Jscript.
7.2.1 Interface of Website Information
Main Menu
Figure 7.1: Six main parts of the Website

118
7.2.1 Interface of Web Information
In this research, most of the Web pages are providing the Web information, such
as Home, About – Symbol Explanation, About – This Project, Link and Contact. The
main page for the Web site (Home) has a list of the menu bar at the top page to give an
easy way of selection. (Figure 7.2)
Figure 7.2: Home – main page of the Website
7.2.1.1 Interface of About – Symbol Explanation
For the About – Symbol Explanation, there is a list of symbol types based on
MAL 1 shows in the Website. The first column in About – Symbol Explanation is the
contents (Figure 7.3). It shows the symbol types according to their code (MA – MU).

119
Figure 7.3: Symbol Explanation – Content of the symbol types according code
Those symbols have been categorized to General, Topography, Hydrography,
Services and Aids, and Abbreviation. The General symbols (Figure 7.4) included
positions, distance, direction and also compass. The Topography (Figure 7.5) has the
descriptions for natural features, cultural features, landmarks, ports and also topography
terms (Figure 7.6). In the hydrography page (Figure 7.7), there are tides and currents,
depths, natural of seabeds, obstructions, offshore installations, tracks, areas and
hydrographic terms (Figure 7.8). Some symbols like lights, buoys, beacons, radar, radios,
small craft facilities and services are categorized in Services and Aids page (Figure 7.9).
The last symbols types are Abbreviations indexes; it has been divided to the International
Abbreviation page (Figure 7.10) and National Abbreviation page (Figure 7.11).

120
Figure 7.4: Symbol Explanation – General
Figure 7.5: Symbol Explanation – Topography

121
Figure 7.6: Symbol Explanation – Topography Term
Figure 7.7: Symbol Explanation – Hydrography

122
Figure 7.8: Symbol Explanation – Hydrography Term
Figure 7.9: Symbol Explanation – Services and Aids

123
Figure 7.10: Symbol Explanation – International Abbreviation
Figure 7.11: Symbol Explanation – National Abbreviation

124
7.2.1.2 Interface of About – This Project
The Web pages for about – This Project are mainly describing some issues that
are related with this research. It has been divided into Introduction (Figure 7.12), the
explanation of Web – Based GIS as well as Nautical Charts. In the Web – Based GIS
(Figure 7.13), users are able to view details through the link below. The explanation has
been separated to Web – Based GIS Architecture (Figure 7.14) and Map Server (Figure
7.15). However, the development of Nautical Charting (Figure 7.16) contents three sub
sections, which are Earliest Chart (Figure 7.17), Nautical Chart (Figure 7.18) and
Electronic Chart (Figure 7.19).
Figure 7.12: This Project – Introduction about Nautical WEBGIS
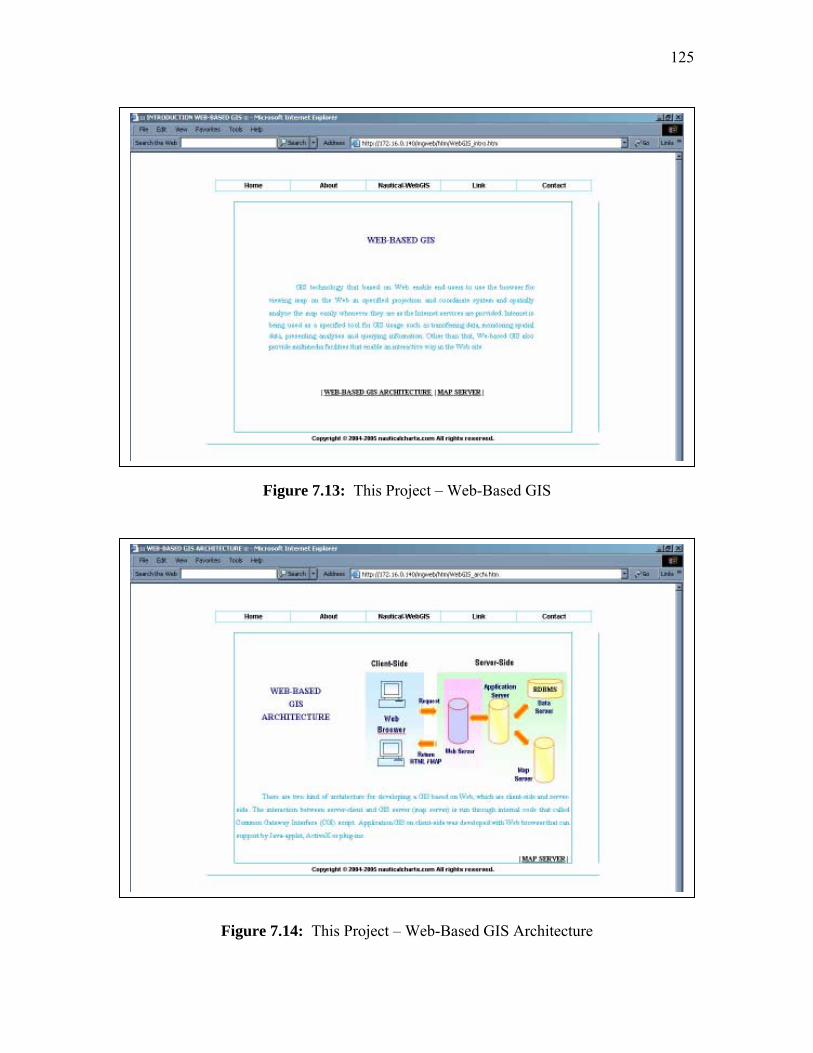
125
Figure 7.13: This Project – Web-Based GIS
Figure 7.14: This Project – Web-Based GIS Architecture

126
Figure 7.15: This Project – Map Server
Figure 7.16: This Project – Development of Nautical Charting

127
Figure 7.17: This Project – Earliest Chart
Figure 7.18: This Project – Nautical Chart

128
Figure 7.19: This Project – Electronic Chart
7.2.1.3 Interface of Contact
There are two Web pages are included in the Contact, which are Feedback and
also Contact Us. The Feedback is mainly for users to fill in their opinions, comments or
suggestions towards Website’s content to provide better performance. In these pages,
users need to fill in some information likes name, emails, subject of comment as a
reference to the Web administrator (Figure 7.20). On the other hand, the Contact Us page
list out the information of Web administrator likes address, emails and phone number.
Thus, users could contact with the Web administrator easily for further discussions
(Figure 7.21).

129
Figure 7.20: Contact – Feedback
Figure 7.21: Contact – Contact Us

130
7.2.2 Interface of Map Display
In the map display page as shown in Figure 7.22, there have the basic toolbars for
user to navigate the map. The uses of the basic toolbar are explained in Figure 7.23. By
clicking on the Help button in the basic toolbar, a new window will be displayed with the
explanation of button functionalities.
The Map has 8 basic tools above the map window and a list of legend beside the
map window. Besides the basic toolbar, there are two buttons called Log out and
Feedback. The Log out button is to exit from the map page whereas the Feedback button
is to give some comments and opinions towards the map display by filling in a form. At
the right hand site of the page, there is a list of query functions for user to access the
information that related with the map content. The interface of query functions will be
explained in 7.2.3.
Figure 7.22: Map Display

131
Figure 7.23: Help explanation for the basic toolbar
7.2.3 Interface of Query Functions
The interface of query functions is in the same page with the Map Display for
subscriber. Basically, the query functions can be divided into five sub-sections, which are
advance tools, drawing tools, searching tools, zooming to region and the view report.

132
(Figure 7.24) Each of the sub-suctions is being locked in order to save space, by clicking
on the small arrow at the corner will enable the list of functions to be showed.
Figure 7.24: Sub-sections for the query functions
In the advance tools, there are several tools such as zoom scale, buffer, select
within, clear selection, measuring and also copy map. The functionalities of these tools
are explained in the Table 7.1.
Table 7.1: Functionalities for advance tools
No Tools Description
1 Zoom Scale To specify the map scale to display through the zoom
scale dialog box.
2 Buffer To draw a polygon that locates its boundaries at a certain
distance from a point, line, or other polygon.
3 Select within To select features those fall within the currently selected
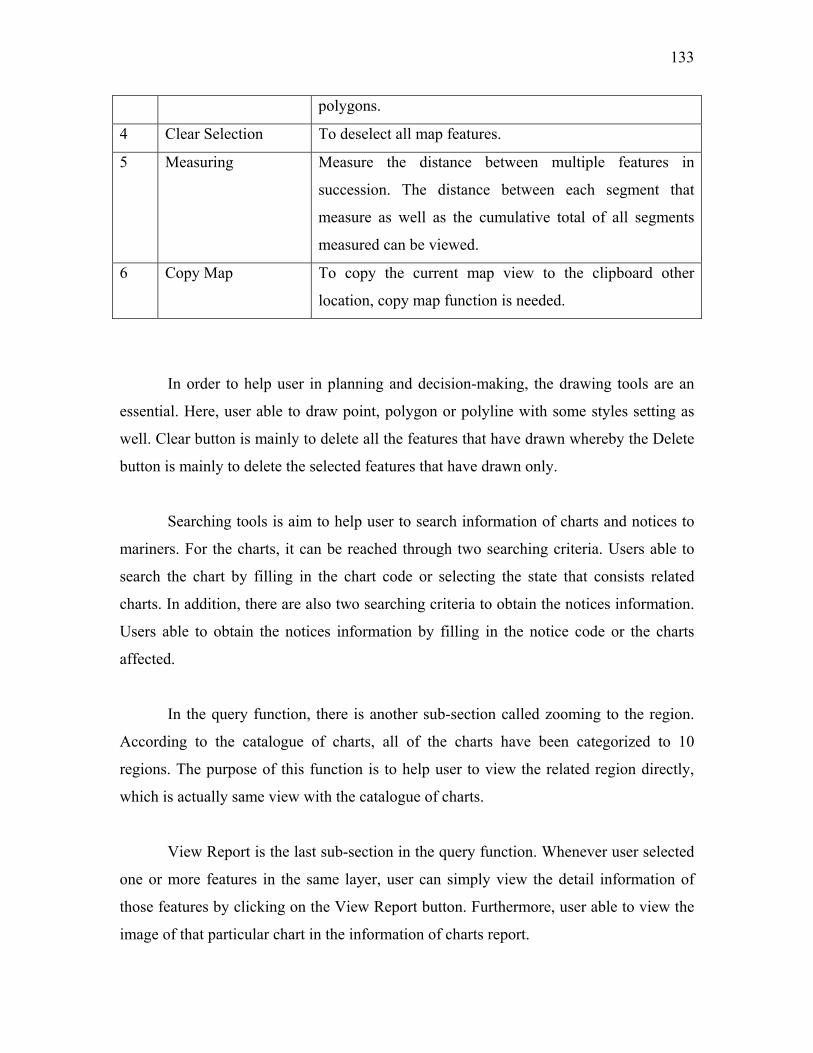
133
polygons.
4 Clear Selection To deselect all map features.
5 Measuring Measure the distance between multiple features in
succession. The distance between each segment that
measure as well as the cumulative total of all segments
measured can be viewed.
6 Copy Map To copy the current map view to the clipboard other
location, copy map function is needed.
In order to help user in planning and decision-making, the drawing tools are an
essential. Here, user able to draw point, polygon or polyline with some styles setting as
well. Clear button is mainly to delete all the features that have drawn whereby the Delete
button is mainly to delete the selected features that have drawn only.
Searching tools is aim to help user to search information of charts and notices to
mariners. For the charts, it can be reached through two searching criteria. Users able to
search the chart by filling in the chart code or selecting the state that consists related
charts. In addition, there are also two searching criteria to obtain the notices information.
Users able to obtain the notices information by filling in the notice code or the charts
affected.
In the query function, there is another sub-section called zooming to the region.
According to the catalogue of charts, all of the charts have been categorized to 10
regions. The purpose of this function is to help user to view the related region directly,
which is actually same view with the catalogue of charts.
View Report is the last sub-section in the query function. Whenever user selected
one or more features in the same layer, user can simply view the detail information of
those features by clicking on the View Report button. Furthermore, user able to view the
image of that particular chart in the information of charts report.

134
7.3 System Evaluation and Maintenance
When the interfaces have been customized, all of them need to be tested for
upgrading the efficient of Web. Referring to the second objective of this research, it is
needed to evaluate and test the Website from four aspects. These four aspects are testing
of Web accessible, testing of Web interface, testing of map display and testing of Web
function. In testing the application, it may occurred some problems such as certain
functions couldn’t be run well or users unsatisfied with the interfaces. Therefore, the Web
will re-test and re-evaluate if needed.
7.3.1 Testing of Web Accessible
In testing of Web accessible, a main server computer is a must to launch the
application. Then, the Web accessibility will be tested through several client computers in
LAN (Local Area Network). In order to enable client computer to access the Web, URL
in server computer has to be defined. For this research, the IP address in the server
computer will acted as the URL. The URL for client computer to access the Web is
http://172.16.0.140/mgweb/htm/index.htm. When they access, they will view the main
page of the Web as showed in Figure 7.25.
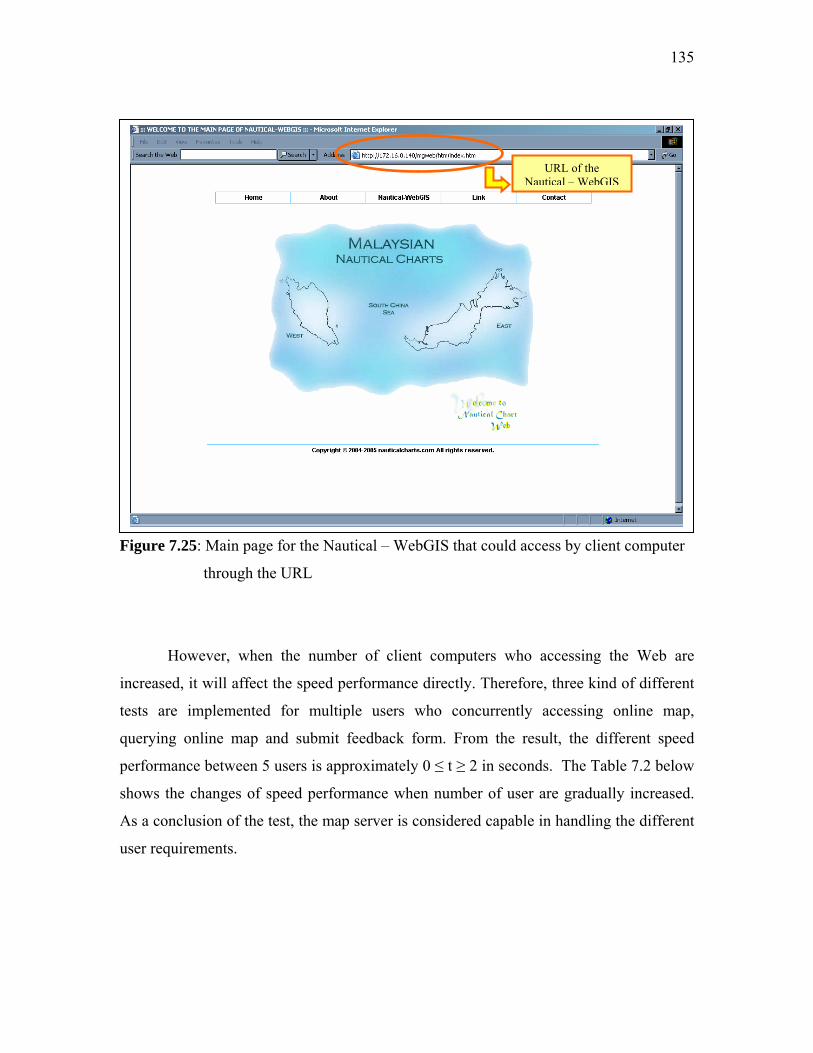
135
URL of the Nautical – WebGIS
Figure 7.25: Main page for the Nautical – WebGIS that could access by client computer
through the URL
However, when the number of client computers who accessing the Web are
increased, it will affect the speed performance directly. Therefore, three kind of different
tests are implemented for multiple users who concurrently accessing online map,
querying online map and submit feedback form. From the result, the different speed
performance between 5 users is approximately 0 ≤ t ≥ 2 in seconds. The Table 7.2 below
shows the changes of speed performance when number of user are gradually increased.
As a conclusion of the test, the map server is considered capable in handling the different
user requirements.

136
Table 7.2: Result of testing of Web accessibility
Number of client Concurrently Testing on Average Time (s)
1 Accessing online map 1.20
5 Accessing online map 2.10
10 Accessing online map 3.20
15 Accessing online map 4.50
Different: > 1.10
1 Querying online map 1.10
5 Querying online map 2.90
10 Querying online map 3.40
15 Querying online map 5.20
Different: > 1.03
1 Submit feedback form 1.4
5 Submit feedback form 2.2
10 Submit feedback form 2.9
15 Submit feedback form 3.5
Different: > 0.70
7.3.2 Testing of Web Interface
Most of the interfaces are mainly for providing information that related with this
research. There are some interface are closely connected with database to receive
information that given by users or verify password. Thus, there are three pages are
essential to be tested and evaluated for better performance. These three pages are
registration, feedback and also the authorization.

137
7.3.2.1 Feedback Page
In the Feedback page, when the users have some opinion or comment, they are
welcome to leave a message in the Feedback page. Their contact email must be filled for
further discussion if needed. In testing the comments can be received by the Web
administrator, some information as Figure 7.26 is filled as an example of comments.
When the user clicks on submit button, comments will be sent to the table
comment in subscriber.mdb that kept in server computer. Next, it will proceed to another
page for showing the appreciation to users (Figure 7.27). The result of the comments that
have been sent successfully through client computer is showed in Figure 7.28.
Figure 7.26: Comments filled by user in Feedback Page
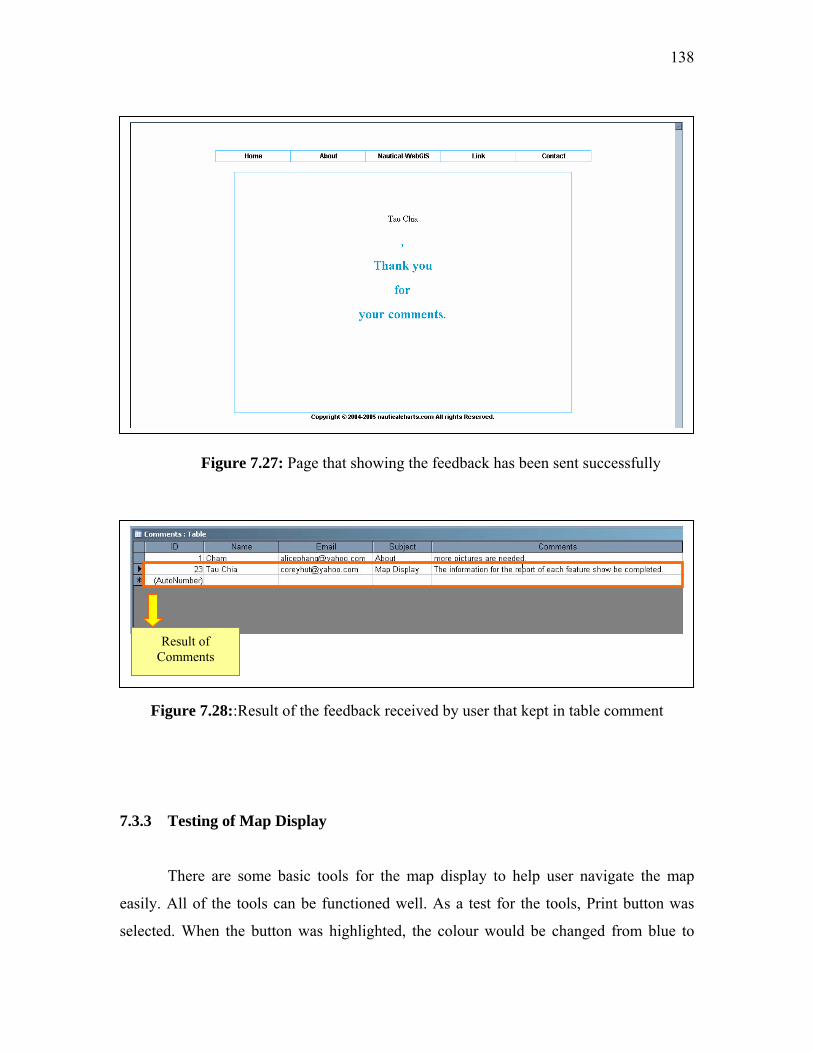
138
Figure 7.27: Page that showing the feedback has been sent successfully
Result of
Comments
Figure 7.28::Result of the feedback received by user that kept in table comment
7.3.3 Testing of Map Display
There are some basic tools for the map display to help user navigate the map
easily. All of the tools can be functioned well. As a test for the tools, Print button was
selected. When the button was highlighted, the colour would be changed from blue to

139
yellow as shown in Figure 7.29. After selected the button, a pop up dialog box will show
up for the configuration of printing. In the dialog box, user can define the print area,
layout, number of copies and others (Figure 7.30). The print result will show the current
view of the map window with legend and scale.
Figure 7.29::Basic toolbar in Map Display with Print button highlighted
Figure 7.30: Print Dialog box for configuration

140
7.3.4 Testing of Query Functions
Query functions are considered as one of the important part in this research. It
acts as an inter-connected component with the features in the map window for different
purposes. And, there are many functions need to be tested, as there are several sub-
sections in it.
For the advance tools, some of the functions like Measuring, Zoom Scale, Select
Within and Buffering will be tested. As a Measuring example in Figure 7.31, user will
obtain the distance between Pulau Tioman and the Marine Park nearby Pulau Seri Buat in
kilometer unit. Another example shown in Figure 7.32 is the result of Zoom Scale. When
user clicks on the Zoom Scale button, a dialog box will pop up to define to scale. Then,
the map window will zoom to the scale that defined by user immediately.
For the testing on Select Within, the marine park around Pulau Tioman was
selected initially, when the select within button was clicked, a dialog box will guide user
to choose features within the selected area (Figure 7.33). The result of Select Within is
shown in Figure 7.34 with Shore layer within the Marine Park selected. Another function
in advance tools to be tested is Buffer. A wreck was selected initially, then the Buffer
button will guide to a dialog box for configuration (Figure 7.35). Here, a buffer offshore
distance 10KM was defined with yellow colour. And, the result of the Buffer is shown in
Figure 7.36.

141
Figure 7.31: Result of Measuring between Pulau Tioman and the Marine Park nearby
Pulau Seri Buat
Same Scale
Figure 7.32: Result of Zoom scale of 1:200,000

142
Figure 7.33: Dialog box of Select Within to choose layer
Figure 7.34: Result of Select Within – Shore layer within the Marine Park selected

143
Figure 7.35: Buffer Dialog box for configuration
Figure 7.36: Result of 10km Buffer for a wreck

144
In order to test on the drawing tools can be run smoothly, a polygon was drawn.
When the Polygon button was highlighted, the colour will be changed from blue to
yellow, after clicking the button, a pop up dialog box will show up for the style of
drawing. In the dialog box, user can create a name for that polygon, define the colour,
background mode and the hatch pattern. During the test, red colour, and solid style was
defined. Thus, the style of drawing result will be exactly same with user defined.(Figure
7.37)
Figure 7.37: Result of drawing a polygon in red
As for the Searching tool, a test towards Nautical Charts was implemented. When
the Nautical Charts was selected, a dialog window will occur for choosing within
searching by Chart Code or State as shown in Figure 7.38. When the Chart Code was
clicked on, the current dialog window will turn to Chart Code Search page (Figure 7.39).
Here, MAL515 is the chart to be searched. The result will be viewed in the same dialog

145
window. In the information of the result, there is a Zoom icon to zoom into MAL515 in
the map window as shown in Figure 7.40.
Figure 7.38: Dialog window to choose searching criteria
Figure 7.39: Dialog window to search chart by code – MAL515

146
Figure 7.40: Result of search shows in a dialog window and zoom into MAL 515 in map
window
In testing the Zooming to Region, Zone Sarawak is selected. When the Zone
Sarawak selected, the view in the Map Window will directly zoom to Zone Sarawak as
shown in Figure 7.41.
The last sub-section in query functions to be tested is View Report. Here, a chart
named MAL5 is selected in the map widow. Then, click on the report button to view the
detail of information about MAL5. In seconds, a dialog window will appear with the
information of MAL5 together with a Picture column (Figure 7.42). By clicking on the
View in the Picture column, a new dialog window will show the scanned image of
MAL5. There is an icon in the corner for user to enlarge the image for a better view
(Figure 7.43).

147
Figure 7.41: Result of Zooming to Region – Zone Sarawak in small scale
Figure 7.42: Report of MAL5

148
Icon to enlarge the image for detail
view
Figure 7.43: Image of MAL5
7.4 Conclusion
Basically, the result and the evaluation of this research are discussed in this
chapter. Each result of the interface that content in this research has been shown and
explained regarding to its functionalities. The interfaces can be separated to dynamic and
static page. Most of the dynamic pages such as feedback page, registration page and
subscriber log in page are closely link with a database for processing certain information.
Furthermore, the functions that included in Map display page also discussed in detail.

149
The evaluation of this research was tested through four aspects. There are Web
accessible, testing of Web interface, testing of map display and testing of Web function.
The results of testing are shown as well and all of these four aspects can be run smoothly
through LAN.

For
CHAPTER 8
CONCLUSION AND RECOMMENDATION
8.1 Background
Basically, the obtained result from both phases in this study has achieved the
objectives of this research, which are (i) To develop a digital nautical chart in vector form
for small boats and leisure crafts in Malaysia using CARIS GIS 4.4a; (ii) To advance the
digital nautical chart into Web platform using Autodesk MapGuide 6.03. Thus, it has
brought up a variety of benefits to the end users.
Here, the conclusion and the recommendation of this study will be discussed in
detail. For the conclusion, there is a short and compact summary of the whole research
that regarding to both phases of the system creation. Other than that, some of the
recommendation for future development of this research also will be discussed.

151
8.2 Summary of the Research – Phase I
The processes of developing the vector nautical chart for MAL 5622 can be
divided into four steps, which are data digitisation, building topology, and development
of database and implementation of analyses.
Basically, the data digitisation can be done through CARIS SAMI in CARIS GIS
4.4a. In this study, researchers chose to digitise using on-screen digitisation method.
Actually, CARIS SAMI also prepared an application for converting data raster into
vector in a semi-automatic way. This application is mainly for geometry data in the form
of polylines, such as contour lines, coastlines and roads. However, researches might need
to spend more time in editing data if using the application to make sure the vectorised
polylines are truly link with other features. To solve the problem, all of the features were
digitised on-screen and divided to different themes.
Topology is aim to solve all of the error that caused by improper digitisation so
that it can form polygon from polylines and build up network between features. The two
main errors to be solved while building topology are undershoot and overshoot. Polygons
with topology enable user to identify each polygon or area based on its polygon keys that
kept in CARIS Information Manager. Besides, polygons also can be coloured filling after
building topology.
Microsoft Excel is the software to help researchers in building a database for e
attribute data in this study. It saved in to *.dbf format as dBASE IV file. The field name
of primary key to link the attribute data with the spatial data is called KEY. It aims to
help user to implement the query in CARIS Database Manager or CARIS Information
Manager.
From the obtained analytical result in this study, calculating distance provided by
menu Query > Distance Between 2 Points from CARIS Editor and CARIS Information

152
Manager gave the distance in nautical mile relayed on map scale. Therefore, users will
obtain inaccurate value from there and they need to calculate the actual value manually
using given geodetic value.
Other than that, network analyses and zone analyses also executed at the end of
the research. Some of the vital elements are the connection for CARIS DDE (CARIS
Dynamic Data Exchange) and menu load network should be active before implementing
network analyses. Based on the result of this study, an analytical study for navigational
reference can be done.
8.3 Summary of the Research – Phase II
In expanding this study, the data that added are the series of Malaysian nautical
charts and the latest 2004/2005 Notices to Mariners for MAL 5 and MAL 6. There are
about 65 sheets of charts included, whereby MAL 5 and MAL6 in vector format and
other are in raster format. The main softwares that used are Autodesk MapGuide 63 and
ArcInfo Workstation. Additionally, Javascript and ASP also used for the Web
customisation.
Data preparation and database design have been done in the first phase of
methodology. The certain data have been collected from both RMN and Marine
Departments. Then, the datasets are projected in RSO. For the database design, the
conceptual design has proved the relationship between the Malaysian charts and notices
are one to many, where by a Malaysia Chart can have none of the notices or it can be
many notices. In contrast, notices would minimum affected a Malaysia Chart or it can be
affected a series of Malaysia charts.

153
The second step of the methodology is system configuration and Web building.
There are three servers installed for this research, which are IIS Web server, Autodesk
MapGuide application server and MapAgent as a medium between Web server and
application server. The URL for this research is set in LAN during system configuration
to enable multiple users to view the application. Besides, the datasets are converted into
SDF format and loaded into Autodesk MapGuide Author. For the database that links with
spatial data is configured in ODBC data sources and drivers to enable it to be viewed
through the LAN.
The Web building has separately developed the content of the Web application
into dynamic pages and static pages. The dynamic pages can be divided into two sections.
There are development of dynamic map and development of interactive query. The
Dynamic map and the interactive query are both in the same page. The map to be
embedded are in dynamic map page with some related basic navigate tools. However, the
interactive query page is developed using programming languages, such as Jscript and
ASP for advance navigate and analyse tools. For the static pages, there are mainly for
providing some information to users. Some of the information that consisted in static
pages is symbol explanation, nautical charts and Web-based GIS.
The result of the research has been discussed regarding to its functionalities. And,
most of the dynamic pages such as feedback page is closely link with a database for
processing certain information. The results are being evaluated and tested through LAN
by some users to test on its accessibility, Web interface, map display and also Web
function. The testing result of Web accessible is considered well because the different
speed performance between 5 users is approximately 0 ≤ t ≥ 2 in seconds only. For other
test is being done in details and all of them can be run smoothly in LAN.

154
Along with the progress of this research, there are some difficulties that influence
the final result. These difficulties have led to the recommendation and suggestion for
further studies that related with this research.
8.4 Recommendation
In order to enhance the result of this research, there are some recommendations
have been suggested for future development. Some are the recommendations are
supporting ENC S-57 format, importing geoprocessing functionalities, self-monitoring
system, real time tide level, providing all charts in vector and others.
8.4.1 Supporting ENC S-57 Format
In order to produce high quality digital nautical chart, it should able to support
ENC S-57 data. Through this way, the operation of charts not only can be done in CARIS
but also in other navigational software. As a suggestion, CARIS HOM (Hydrographic
Object Manager) needs to add into CARIS GIS 4.4a package. CARIS HOM enable
conversion format for CARIS file, which is *.des and other supporting files into a smaller
format file named *.000 and fail *.hob.

155
8.4.2 Importing Geoprocessing Functionalities
Based on GIS concepts, there are a variety of functionalities can be implemented
to assist users in solving their certain problems. Geoprocessing is considered one of the
useful analyses tool that dealing with spatial data. It is a way to create new data based on
layers in map window. In most cases, users will alter the geometric properties of the
features in a dataset while controlling some aspects of how its attribute data is handled.
The functions of geoprocessing can be divided to three types with different
purposes, which are reduce the extent of the layer (e.g., intersect, clip), combine features
in same layers (e.g., dissolve) and combine features in different layers (e.g., merge,
union). The importing of geoprocessing functionalities into result should be considered to
improve the analyses of data.
8.4.3 Self-monitoring System
In order to enhance the studies in the aspect of updating marine data, it is
recommends to implement the self-monitoring systems to monitor the operation in real-
time. The monitoring system shows the direction of vessels in reality wherenever they are
within the boundaries of Malaysia. The vessel can be presented in different type of colour
or symbol to differentiate the vessel types.
The self-monitoring system provides an easiest and fastest way for updating data
on time. In additional, users or navigators are able to do a simulation to plan the route of

156
navigation. However, to launch this system, GPS (Global Positioning System) needs to
be installed in the servers as well as the vessel for tracking the location of vessel into the
Nautical – WebGIS in reality.
8.4.4 Real Time Tide Level
As we know that the tide level is an important issue for mariners because it will
affect vessel draft indirectly. The vessel draft will determine whether or not the vessel is
safe in approaching port channel. As an example, a vessel with heavier weight, it will
need to approach the port channel when the tide level is higher than normal.
Therefore, it is strongly recommended to further this studies with an add in
component, which allow user to input the under keel clearance and vessel draft for that
particular area for showing the real time tide level to assist mariners in decision making.
The result of can be shown in graph or animation and it will be updated in real time after
a period of time (user define).
8.4.5 Others Recommendation
Other than those recommendations that have been discussed in the above, there
are still some minor suggestions to improve the research. These suggestions are listed as
below:

157
(i) Improving the visualization of digital nautical chart through CARIS 3D
Viewer to present data in three dimensions.
(ii) Animated the user interface of the Web to provide information to users in
an effective way.
(iii) Improving the presentation of the spatial features in map window to be
more attractive
(iv) Adding more contents into the Web, such as latest news that regarding to
Malaysia, charts, notices, hydrography and others.
8.5 Conclusion
In order to improve the safety navigation for international water area, varieties of
efforts have done by different parties in integrating rules and standard related with
navigational aspects. Normally, a boat or vessel involved in navigation must bring along
paper charts as navigational aid. But, additional element for navigation also need for
boats and vessels based on the specification of SOLAS.
In this study, small boats and leisure crafts that discussed are not SOLAS vessel
that need to bring along ECDIS during navigation. Therefore, navigators for small boats
and leisure crafts mostly relay on paper charts or electronic chart for planning and
analyses. In another words, they are free from SOLAS rules during navigation for
bringing specific navigational aid tools except paper charts.

158
Navigators for small boats and leisure crafts can use any navigational aid during
their navigation. In order to improve their safety of navigation, it is better to use vector
digital nautical chart as produced in this research. The result of the first phase in this
study can help user in updating data from time to time and it can be kept longer than
paper charts.
In the second phase of this study, the integration of Web-Based GIS into nautical
charting has proved the GIS functionalities can really help users to reach or access
needed chart information in an interactive way without the need of GIS software.
Moreover, the charts information together with the Notice to Mariners is able to be
managing properly with a systematic Web system particularly in data sharing.
According to the recommendation mentioned above, this research is obviously has
the potential to expand in order to explore the new technology to the public.

iv
CONTENTS
CHAPTER TITLE PAGE
ACKNOWLEDGEMENT i
ABSTRAK ii
ABSTRACT iii
CONTENTS iv
LIST OF TABLES x
LIST OF FIGURES xi
LIST OF NOTATION xvi
LISTS OF APPENDICES xix
1 INTRODUCTION
1.1 Background 1
1.2 Problem Statement 4
1.3 Research Objective 5
1.4 Research Scope 6
1.5 Importance and Benefits of This Research 9
2 DEVELOPMENT OF NAUTICAL CHARTING
2.1 Background 11
iv

v
2.2 Earliest Charts 12
2.3 Nautical Charts 13
2.3.1 Notice to Mariners 14
2.4 Electronic Chart 14
2.4.1 Raster Charts 15
2.4.2 Vector Charts 15
2.5 Electronic Chart Systems 16
2.5.1 Electronic Chart Display and Information
Systems (ECDIS) 18
2.5.2 Electronic Chart System (ECS) 19
2.5.3 Raster Chart Display System (RCDS) 20
2.6 Electronic Navigation Chart (ENC S-57) 21
2.6.1 Data Model of S-57 21
2.7 Process of Producing ENC S-57 22
2.8 Problems in Producing Data ENC S-57 25
2.9 Status of Producing for ENC S-57 26
2.9.1 Example of ENC S-57 for Hong Kong Area 27
2.9.2 Example of ENC S-57 for Australia Area 28
2.9.3 Example of ENC S-57 for Italy Area 30
2.10 Roles of GIS in Hydrography 32
2.11 Conclusion 33
3 DATABASE DESIGN
3.1 Background 35
3.2 Need Assessment 35
3.3 Database Design 41
3.3.1 Conceptual Design 42
3.3.2 Logical Design 46
3.3.3 Physical Design 49
3.3.4 Example of Query Planning 50
v

vi
3.4 Conclusion 51
4 PHASE I - VECTOR DATA PREPARATION USING CARIS GIS
4.4a
4.1 Background 52
4.2 Structure File of CARIS 53
4.2.1 Creation of Header File 54
4.2.2 Checking of Header File 55
4.3 Preparation of Data Using CARIS SAMI 56
4.3.1 Data Conversion (Raster to Vector) 58
4.3.2 Thinning Raster Data 59
4.3.3 Semi-automatic of Vectorising 60
4.3.4 Inputting Additional Data 61
4.4 Creation of Control File 65
4.5 Map Registration 67
4.6 Network Topology 69
4.6.1 Creation of Thematic Layers 69
4.6.2 Creation of Network Topology File 70
4.6.3 Process of Producing Network Topology 72
4.7 Polygon Topology 74
4.7.1 Labelling Polygon Keys 74
4.7.2 Building Polygon Topology 75
4.8 Result of Digital Nautical Chart Using CARIS GIS 4.4a 77
4.9 Conclusion 79
5 PHASE I – RESULT AND ANALYSE
vi

vii
5.1 Background 80
5.2 Analyse for updating Data 82
5.2.1 Adding Depth Information 82
5.2.2 Interpolation of Contour based on Latest 83
Depth Value
5.3 Analyse for Vessel Navigation Information 86
5.3.1 Calculate Distance between two points 86
5.3.2 Result of Network Analyse 89
5.3.2.1 Calculate Shortest Path 90
5.3.2.2 Calculate Speed in Knot 91
5.3.2.3 Calculate Period of Navigation 92
5.3.2.4 Comparison between Obtained 94
Distance and Speed with
Calculated Distance and Speed
5.4 Analyse Result of Zone for Vessel Navigation Path 96
5.5 Analyse Result for Attribute Query 101
5.6 Conclusion 103
6 PHASE II - SYSTEM CONFIGURATION AND WEB
BUILDING
6.1 Background 105
6.2 System Configuration 104
6.2.1 Installation of Software and Server 104
6.2.2 System Configuration 105
6.2.3 Data Format Conversion 107
6.2.4 Loading Data Spatial and Database 108
6.3 Web Building 111
6.3.1 Web Design 111
6.3.2 Development of Nautical –WebGIS 113
6.3.2.1 Development of Dynamic Map 113
vii

viii
6.3.2.2 Development of Interactive Query 114
6.4 Conclusion 115
7 PHASE II - EVALUATION FOR NAUTICAL – WEBGIS
7.1 Background 116
7.2 Website for Nautical – WebGIS 116
7.2.1 Interface of Web Information 118
7.2.1.1 Interface of About – Symbol
Explanation 118
7.2.1.2 Interface of About – This Project 124
7.2.1.3 Interface of Contact 128
7.2.2 Interface of Map Display 130
7.2.3 Interface of Query Functions 131
7.3 System Evaluation and Maintenance 134
7.3.1 Testing of Web Accessible 134
7.3.2 Testing of Web Interface 136
7.3.2.1 Feedback Page 137
7.3.3 Testing of Map Display 138
7.3.4 Testing of Query Functions 140
7.4 Conclusion 148
8 CONCLUSION AND RECOMMENDATION
8.1 Background 150
8.2 Summary of the Research – Phase I 151
8.3 Summary of the Research – Phase II 15
viii

ix
8.4 Recommendation 154
8.4.1 Importing Geoprocessing Functionalities 154
8.4.2 Self-monitoring System 155
8.4.3 Real Time Tide Level 155
8.4.4 Providing all Charts in Vector 156
8.4.5 Others Recommendation 156
8.5 Conclusion 157
REFERENCES 158
APPENDIXES A - K 166- 195
ix

x
LIST OF TABLES
TABLES.NO TITLE PAGE
1.1 Function of nautical chart 2
1.2 Planning of development for public infrastructures, 3
2001-2005 (RM millions)
1.3 Geography reference for MAL 5622 6
2.1 List of ENC S-57 for Hong Kong area 28
3.1 Entities of Digital Navigational Charts (Malay Versions) 42
3.2 Example of Represented Model ER Conceptual 43
3.3 Detail of entities and attribute (Malays versions) 46
3.4 Table structure design for the entity Malaysia Charts
in the logical design phrase 48
3.4 Summary of Storage data for the Research Database
(2nd phase) 49
4.1 Main components in CARIS file 53
4.2 Additional components file in CARIS GIS 4.4a 53
4.3 Specific Characters for feature code of depth value 64
4.4 Position of Four Control Points 66
4.5 Description for Theme Number 70
5.1 Comparison of Distance for a nautical mile
at Poles with Khatulistiwa. 87
7.1 Functionalities for advance tools 132
7.2 Result of testing of Web accessibility 136
x

xi
LIST OF FIGURES
FIGURE.NO TITLE PAGE
1.1 Study Area of Phase 1 - MAL 5622 7
1.2 Study Area of Phase 2 – Peninsular Malaysia (MAL5) 8
1.3 Study Area of Phase 2 – East Malaysia (MAL6) 9
2.1 Pertolan chart were the result of compass survey 12
2.2 Basic components of an electronic chart display system
and the interfaced navigational devices 16
2.3 Information flow within an electronic chart system 17
2.4 International Standards for ECDIS and the participating
organisations 19
2.5 Flow chart of process in producing ENC S-57
(Edition 3 and 3.1) by Singapore Hydrographic Department 24
2.6 Cell of ENC S-57 for Hong Kong area 27
2.7 Cell of ENC S-57 for North of Australia 29
2.8 Area of ENC S-57 for Italy (a) General (b) beach and port 31
3.1 Result of survey for (a) the use of computer system for
Nautical Charting and (b) Availability of Internet services
for working 39
3.2 Result of survey for (a) Difficulties in receiving updated
information for nautical charts and (b) Frequency of referring
notice to mariners for correction of nautical charts 40
3.3 Relational entities for the development of database for
digital nautical charts.(Malay versions) 44
3.4 Business rules for entity Malaysia Chart and entity Notice 45
3.5 Business rules for entity Malaysia Chart and entity Sounding 45
4.1 Panel icon for CARIS GIS 4.4a 52
xi

xii
4.2 Header file for this study 55
4.3 Method of checking header file 56
4.4 Flow Chart to convert raster data to vector data using CARIS SAMI 57
4.5 Converting TIFF Image into CARIS Raster Object 58
4.6 Thinning for Raster Data 59
4.7 Image of THINRAST 60
4.8 Inputting Polylines using Add a Point-to-point Line 61
4.9 Inputting Height Pints using Add a Spot Height 62
4.10 Method of Inputting symbol
(a) Using menu Add a Symbol for inputting building
(b) Example of location for symbol building 63
4.11 Inputting for Text 64
4.12 Inputting for Depth Value 65
4.13 Control File (a) Input Data (b) Output Data 66
4.14 Generating New CARIS File Using Menu Create A New Map 67
4.15 Register MAL5622 Using Menu Register a Map 68
4.16 Result of Chart after registration 68
4.17 Converting Lines to Arcs 71
4.18 Locating Arc Intersection 72
4.19 Process of Producing Network Topology 73
4.20 Convert Name to Polygon Label 75
4.21 Method of Building Polygon Topology 76
4.22 Example of lines that are not related 77
4.23 Small Area of Digital Nautical Chart that Digitized
(a) Chart before process Building Topology
(b) Chart after Process Building Topology 78
5.1 Example of Result Accessed through Icon MAL 5622 81
5.2 Comparison between Generated Contour Lines with
Original Contour Lines on Nautical Chart. 84
5.3 Interpolation of Contour Lines for depth
(a) Generated Contour Lines
(b) Original Contour Lines 85
5.4 Distance at Poles and Khatulistiwa that Calculated
in One Minute (1') 86
xii

xiii
5.5 Distance from A to B Obtained through Map Query
Using CARIS Information Manager Modular 88
5.6 Solution Cost for Distance A to B in Nautical Mile 91
5.7 Solution Cost for Speed Value from A to B 92
5.8 Solution Cost for Navigational Period from A to B
with Speed in 3 knots. 93
5.9 Checking Distance from Destinations A to B
using query line information 95
5.10 Created Zone for Land Area 97
5.11 List of Created Zones 97
5.12 Result of Created Depth Zones for MAL 5622 98
5.13 Operating Zones using Union 99
5.14 New Zones operated using Union
(a) Zone CETEK_0-5M (black)
(b) Zone CADANGAN (light blue) 100
5.15 Analyses using Query Condition 101
5.16 CARIS Database Manager
(a) Finding Area Information using Query Condition
(b) Statistic for Area that Involved 102
5.17 Result of Land Area using Menu Polygon Area 103
6.1 Choosing the MapAgent from wizard installation 105
6.2 Process of Autodesk MapGuide Server Configuration 106
6.3 Process of database configuration 108
6.4 Process of Map Layers configuration 109
6.5 Map Window in Autodesk MapGuide Author 110
6.6 Site map for Nautical – WebGIS 112
7.1 Six main parts of the Website 117
7.2 Home – main page of the Website 118
7.3 Symbol Explanation – Content of the symbol types
according code 119
7.4 Symbol Explanation – General 120
7.5 Symbol Explanation – Topography 120
7.6 Symbol Explanation – Topography Term 121
xiii

xiv
7.7 Symbol Explanation – Hydrography 121
7.8 Symbol Explanation – Hydrography Term 122
7.9 Symbol Explanation – Services and Aids 122
7.10 Symbol Explanation – International Abbreviation 123
7.11 Symbol Explanation – National Abbreviation 123
7.12 This Project – Introduction about Nautical WEBGIS 124
7.13 This Project – Web-Based GIS 125
7.14 This Project – Web-Based GIS Architecture 125
7.15 This Project – Map Server 126
7.16 This Project – Development of Nautical Charting 126
7.17 This Project – Earliest Chart 127
7.18 This Project – Nautical Chart 127
7.19 This Project – Electronic Chart 128
7.20 Contact – Feedback 129
7.21 Contact – Contact Us 129
7.22 Map Display 130
7.23 Help explanation for the basic toolbar 131
7.24 Sub-sections for the query functions 132
7.25 Main page for the Nautical – WebGIS that could access
by client computer through the URL 135
7.26 Comments filled by user in Feedback Page 137
7.27 Page that showing the feedback has been sent successfully 138
7.28 Result of the feedback received by user that
kept in table comment 138
7.29 Basic toolbar in Map Display with Print button highlighted 139
7.30 Print Dialog box for configuration 139
7.31 Result of Measuring between Pulau Tioman and
the Marine Park nearby Pulau Seri Buat 141
7.32 Result of Zoom scale of 1:200,000 141
7.33 Dialog box of Select Within to choose layer 142
7.34 Result of Select Within – Shore layer within
the Marine Park selected 142
7.35 Buffer Dialog box for configuration 145
7.36 Result of 10km Buffer for a wreck 145
xiv

xv
7.37 Result of drawing a polygon in red 144
7.38 Dialog window to choose searching criteria 145
7.39 Dialog window to search chart by code – MAL515 145
7.40 Result of search shows in a dialog window and
zoom into MAL 515 in map window 146
7.41 Result of Zooming to Region – Zone Sarawak
in small scale 147
7.42 Report of MAL5 147
7.43 Image of MAL5 148
xv

xvi
LIST OF NOTATION
AHS - Australian Hydrographic Service
AIS - Automatic Identification System
ARCS - Admiralty Raster Chart System
API - Application Programming Interface
ASCII - American Standard Code for Information Interchange
ASP - Active Server Page
ADOs - ActiveX Data Objects
CARIS - Computer Aided Resource Information System
CHS - Canadian Hydrographic Service
CSV - Microsoft Excel Comma Separated Values Files
CGI - Common Gateway Interface
CPU - Central Processing Unit
COBRA - Common Object Request Broker Architecture
CAD - Computer Aided Design
CZM - Coastal Zone Management
DBMS - Database Management System
DGIWG - Digital Geographic Information Working Group
DLG - Digital Line Graph
DNC - Digital Nautical Chart
DSN - Data Source Name
DWG - Drawing file format
ENC - Electronic Navigational Chart
ECDIS - Electronic Chart Display and Information System
ECS - Electronic Chart System
ER Diagram - Entity Relationship Diagram
FTP - File Transfer Protocol
GPS - Global Positioning System
GCP - Ground Control Point
xvi

xvii
GIS - Geographic Information Systems
GUI - Graphical User Interface
HIS - Hydrographic Information System
HTML - Hypertext Markup Language
HTTP - Hypertext Transfer Protocol
HO - Hydrographic Office
IALA - International Association of Lighthouse Authorities
IEC - International Electrotechnical Commission
IENC - Inland-Waterway Electronic Navigation Chart
IHB - International Hydrographic Bureau
IHI - Italian Hydrographic Institute
IHO - International Hydrographic Organisation
IIS - Internet Information Services
IMO - International Maritime Organisation
IEC - International Electrotechnical Commission
IP - Internet Protocol
ISAPI - Internet Server Application Programming Interface
LAN - Local Area Network
LES - Land Earth Stations
LADA - Langkawi Development Authority
MWF - Map Windows File
NSAPI - Netscape Server API
NSF - National Science Foundation
NGDI - National Geospatial Data Infrastructure
ODBC - Data Source Administrator
PDF - Adobe Portable Document Format
POP - Points of Presence
RMN - Royal Malaysian Navy
RNS - Raster Navigational Charts
RSO - Rectified Skew Orthomorphic system (RSO)
RNC - Raster Navigational Chart
RTCM - Radio Technical Commision for Maritime Services
RCDS - Raster Chart Display System
xvii

xviii
S-57 - Standard 57
SENC - System Electronic Navigational Chart
SDTS - Spatial Data Transfer Standard
SOLAS - Safety Of Life At Sea
TIFF - Tagged Image File Format
TIN - Triangulated Irregular Network
TLDM - Tentera Laut Diraja Malaysia
TVP - Topological Vector Profile
TCP - Transmission Control Protocol
UTM - Universal Transverse Mercator
URL - Uniform Resource Locator
UKHO - United Kingdom Hydrographic Office
US NOAA - American National Oceanic and Atmospheric
Administration
VDR - Voyage Data Recorder
VLCC - Very Large Crude Carrier
VPF - Vector Product Format
WEND - World-wide Electronic Navigational Chart Database
WWW - World Wide Web
SGML - Standard Generalized Markup Language
SDF - Spatial Data File
SHP - Shape file format
xviii

xix
LIST OF APPENDICES
APPENDIX TITLE PAGE
A Study Area of ENC S-57 for Whole World
by IHO Till March 2003 166
B Example of questionnaires for
2nd phase research need assessment 167
C Process of Thinning Raster Data 169
D Result of Digitisation 171
E Depth Value that Inputted Using Add Sounding 172
F Process for Creating A New Map 173
G Process of Map Registration 175
H Result of Digital Nautical Chart for MAL 5622 176
I Comparison between Original Contour(Black) with
Generated Contour(Blue) with the Depth Interval
of 2 Moter 177
J Analyses of Attribute using Polygon Key 178
K Listing Program Nautical – WebGIS 179
xix

Study Area of ENC S-57 for Whole World by IHO Till March
APPE
ND
IX A
166

167
APPENDIX B
Example of questionnaires for Nautical – WebGIS need assessment
Please Tick at the answer that you choose :
1) Have you ever heard of using Web-Based GIS (Geographic Information System)
application to manage data?
2) Currently, is there any computer system to manage the Nautical Charts or Notice
to Mariners in your office?
Yes No
3) Is there Internet facility available for your work?
Yes No
4) Do you have trouble to access the needed Nautical Charts or Notice to Mariners in
other states (i.e. is there any difficulties in obtaining the required Nautical Charts
or Notice to Mariners)?
Yes No
5) What kind of information in a Nautical Chart do you usually look into?
Yes No
Water Area Beacon/ Light House Shore/ Nature Swamping Area Sounding Radio/ Radar Coordinates Offshore Installation Others (i.e.: _________________)
6) Based on question 5, according to your opinion what is the most important
information? Please list in order of importance starting from 1 onwards.
Water Area Beacon/ Light House Shore/ Nature Swamping Area Sounding Radio/ Radar Coordinates Offshore Installation Others (i.e.: _________________)

168
7) .Do you think that it is needed to launch a proper information system to manage
both nautical charts and notices to mariner?
7) Do you think there is a need to launch a proper information system to manage
both Nautical Charts and Notice to Mariners
8) How often do you look into Notice to Mariners for correction of Nautical Charts?
Yes No
Every time I look into Nautical Charts Seldom Never
9) Is there any insufficiency/ difficulties that you encounter with regards to the usage
of Notice to Mariners that have influenced your work?
10) Based on question 9, if the answer is yes, what is your opinion in order to solve
the above difficulties?
Yes No
11) In your opinion, what is the most needed analysis use for the Nautical Chart and
Notice to Mariners?
12) Do you think the management of Nautical Charts and Notice to Mariners based on
Web is a solution for data sharing?
Yes No
Thank you very much for your co-operation!

Result of Digitisation
LA
MPIR
AN
D
171

LA
MPIR
AN
E
172

Depth Value that Inputted Using Add Sounding

LA
MPIR
AN
H
Result of Digital Nautical Chart for MAL 5622
176

177
APPE
ND
IX I
Comparison between Original Contour(Black) with Generated Contour(Blue) with the Depth Interval of 2 Moter


169
APPENDIX C
Process of Thinning Raster Data
CARIS for Windows: THINRAST V 4.4 a Date: 17-Jul-2001 Copyright (c) 2003, Universal Systems Ltd., Fredericton, N.B. Canada. Initializing feature 1... 10 Percentage of iteration 1 on object 1 complete at 12:09:14 20 Percentage of iteration 1 on object 1 complete at 12:09:14 30 Percentage of iteration 1 on object 1 complete at 12:09:14 40 Percentage of iteration 1 on object 1 complete at 12:09:15 50 Percentage of iteration 1 on object 1 complete at 12:09:15 60 Percentage of iteration 1 on object 1 complete at 12:09:15 70 Percentage of iteration 1 on object 1 complete at 12:09:15 80 Percentage of iteration 1 on object 1 complete at 12:09:15 90 Percentage of iteration 1 on object 1 complete at 12:09:15 100 Percentage of iteration 1 on object 1 complete at 12:09:15 8424 pixels removed 10 Percentage of iteration 2 on object 1 complete at 12:09:16 20 Percentage of iteration 2 on object 1 complete at 12:09:16 30 Percentage of iteration 2 on object 1 complete at 12:09:16 40 Percentage of iteration 2 on object 1 complete at 12:09:16 50 Percentage of iteration 2 on object 1 complete at 12:09:16 60 Percentage of iteration 2 on object 1 complete at 12:09:16 70 Percentage of iteration 2 on object 1 complete at 12:09:16 80 Percentage of iteration 2 on object 1 complete at 12:09:16 90 Percentage of iteration 2 on object 1 complete at 12:09:16 100 Percentage of iteration 2 on object 1 complete at 12:09:16 2059 pixels removed 10 Percentage of iteration 3 on object 1 complete at 12:09:17 20 Percentage of iteration 3 on object 1 complete at 12:09:17 30 Percentage of iteration 3 on object 1 complete at 12:09:17 40 Percentage of iteration 3 on object 1 complete at 12:09:17 50 Percentage of iteration 3 on object 1 complete at 12:09:17 60 Percentage of iteration 3 on object 1 complete at 12:09:17 70 Percentage of iteration 3 on object 1 complete at 12:09:17 80 Percentage of iteration 3 on object 1 complete at 12:09:17 90 Percentage of iteration 3 on object 1 complete at 12:09:17 100 Percentage of iteration 3 on object 1 complete at 12:09:17 1 pixels removed

170 10 Percentage of iteration 4 on object 1 complete at 12:09:17 20 Percentage of iteration 4 on object 1 complete at 12:09:17 30 Percentage of iteration 4 on object 1 complete at 12:09:17 40 Percentage of iteration 4 on object 1 complete at 12:09:17 50 Percentage of iteration 4 on object 1 complete at 12:09:17 60 Percentage of iteration 4 on object 1 complete at 12:09:17 70 Percentage of iteration 4 on object 1 complete at 12:09:17 80 Percentage of iteration 4 on object 1 complete at 12:09:17 90 Percentage of iteration 4 on object 1 complete at 12:09:17 100 Percentage of iteration 4 on object 1 complete at 12:09:17 0 pixels removed Initializing feature 2... 10 Percentage of iteration 1 on object 2 complete at 12:09:28 20 Percentage of iteration 1 on object 2 complete at 12:09:28 30 Percentage of iteration 1 on object 2 complete at 12:09:28 40 Percentage of iteration 1 on object 2 complete at 12:09:28 50 Percentage of iteration 1 on object 2 complete at 12:09:28 60 Percentage of iteration 1 on object 2 complete at 12:09:29 70 Percentage of iteration 1 on object 2 complete at 12:09:29 80 Percentage of iteration 1 on object 2 complete at 12:09:29 90 Percentage of iteration 1 on object 2 complete at 12:09:29 100 Percentage of iteration 1 on object 2 complete at 12:09:29 0 pixels removed 500 descriptors output at 12:09:39 1000 descriptors output at 12:09:40 1500 descriptors output at 12:09:40 2000 descriptors output at 12:09:41 2500 descriptors output at 12:09:41 3000 descriptors output at 12:09:41 3500 descriptors output at 12:09:42 4000 descriptors output at 12:09:42 4500 descriptors output at 12:09:42 5000 descriptors output at 12:09:43 5500 descriptors output at 12:09:43 6000 descriptors output at 12:09:43 thinrast completed

173
APPENDIX F
Process for Creating A New Map
CARIS for Windows: MAKECARI V 4.4 a Date: 17-Jul-2001 Copyright (c) 2001, Universal Systems Ltd., Fredericton, N.B. Canada. Superseding existing CARIS file ... No default header. Please enter header information. Enter file title [DOS/16-Sep-2003 05:11:01] : Enter file ID (up to 12 chars) [LANGKAWI_HD]: PROJECT_ENC Enter horizontal coord system [NEMR]: CHMR Enter projection [UM]: TM 0-00-00.000E 0-00-00.000E | | 0-00-00.000N -(4)--------<--------(3)- 0-00-00.000N | | | MAP AREA | | | 0-00-00.000N -(1)-------->--------(2)- 0-00-00.000N | | 0-00-00.000E 0-00-00.000E Enter corner 1 latitude [ 0-00-00.000N]: 6-08-18N Enter corner 1 longitude [ 0-00-00.000W]: 99-38-48E Enter corner 2 latitude [ 6-08-18.000N]: Enter corner 2 longitude [ 0-00-00.000W]: 100-00-06E Enter corner 3 latitude [ 0-00-00.000N]: 6-22-12N Enter corner 3 longitude [100-00-06.000E]: Enter corner 4 latitude [ 6-22-12.000N]: Enter corner 4 longitude [ 99-38-48.000E]: 99-38-48.000E 100-00-06.000E | | 6-22-12.000N -(4)--------<--------(3)- 6-22-12.000N | | | MAP AREA | | | 6-08-18.000N -(1)-------->--------(2)- 6-08-18.000N | |

99-38-48.000E 100-00-06.000E 174
Are these corners ok? [Y]: Y Enter scaling factor for projection [0.9999]: Enter central meridian [ 99-49-27.000E]: Enter scaling latitude 1 [ 6-08-18.000N]: Enter scale denominator [50000.]: 40000 Enter ellipsoid [CL66]: EVRK Enter chart resolution (in metres) [0.00001016]: Enter resolution for elevations (in metres) [0.001]: =============================================================
Header ============================================================= 1. Title DOS/16-Sep-2003 05:11:01 2. File ID PROJECT_ENC 3. Horizontal coord system CHMR 4. Header length 184 5. Vertical coord system MR 6. Descriptor length 16 7. Sounding, Spot Ht units MR,M2 8. Coordinate resolutions 9. Coordinate shifts XY 0.0000101600 X 0.000000000 Y 0.000000000 Z 0.0010000000 Z 0.000000000 10. Projection TM 11. Central meridian 99-49-27.000E 12. Scale 40000.00 13. Scaling lat 1 6-08-18.000N 14. Scaling factor 0.999900 15. Scaling Lat 2 N/A 16. Ellipsoid EVRK 17. Vertical datum MSL 18. Alignment line XY 19. Alignment line Lat,Long 3680 3680 6-08-18.000N 99-38-48.000E 100344 3680 6-08-18.000N 100-00-06.000E 20. Graphic extent (3680,3680,100344,66709) (system) 21. Neatline corners (system) 21. Neatline corners Lat,Long X= 3680 Y= 3680 6-08-18.000N 99-38-48.000E X= 100344 Y= 3680 6-08-18.000N 100-00-06.000E X= 100323 Y= 66709 6-22-12.000N 100-00-06.000E X= 3701 Y= 66709 6-22-12.000N 99-38-48.000E 22. Format ID 5 23. Last edited 16-SEP-2003 05:11 Enter field number to change or Q to quit [list header]: Q Working ... makecari completed

175
APPENDIX G
Process of Map Registration
CARIS for Windows: RECTVECT V 4.4 a.2.1 Date: 2-May-2003 Copyright (c) 2003, Universal Systems Ltd., Fredericton, N.B. Canada. Input CARIS file will be C:\DATA\langkawi_vr Output CARIS file will be C:\DATA\langkawi_reg Reading coordinate data from control files. Loading data points into vertex arrays... Processing data ... 200 descriptors out of 2403 read at 14:34:37 400 descriptors out of 2403 read at 14:34:37 600 descriptors out of 2403 read at 14:34:37 800 descriptors out of 2403 read at 14:34:37 1000 descriptors out of 2403 read at 14:34:37 1200 descriptors out of 2403 read at 14:34:37 1400 descriptors out of 2403 read at 14:34:37 1600 descriptors out of 2403 read at 14:34:37 LANG 1033 not found in CARIS Language File 1800 descriptors out of 2403 read at 14:34:37 2000 descriptors out of 2403 read at 14:34:38 2400 descriptors out of 2403 read at 14:34:38 -- 500 Lines left at 14:34:38 -- 0 Lines left at 14:34:38 rectvect completed

178
APPENDIX J
Analyses of Attribute using Polygon Key

179
APPENDIX K
Listing Program Nautical – WebGIS
(i) Program of Dynamic Map <!DOCTYPE HTML PUBLIC "-//W3C//DTD HTML 4.0 Transitional//EN"> <html> <head> <meta http-equiv="Content-Language" content="en-us"> <title>::: NAUTICAL-WEBGIS FOR SUBSCRIBER :::</title> <LINK href="scripts/tempStyles.css" type="text/css" rel="stylesheet"> <SCRIPT language="javascript" src="scripts/dynamic.js"></SCRIPT> <SCRIPT language="javascript" src="scripts/mgcmd.js"></SCRIPT> </head> <body bgcolor="#B0C4DE"> <script language="JavaScript"> // preload images: if (document.images) { Select1 = new Image(50,50); Select1.src = "pic/select1.gif"; Select2 = new Image(50,50); Select2.src = "pic/select2.gif"; Pan1 = new Image(50,50); Pan1.src = "pic/pan1.gif"; Pan2 = new Image(50,50); Pan2.src = "pic/pan2.gif"; Zoomin1 = new Image(50,50); Zoomin1.src = "pic/zoomin1.gif"; Zoomin2 = new Image(50,50); Zoomin2.src = "pic/zoomin2.gif"; Zoomout1 = new Image(50,50); Zoomout1.src = "pic/zoomout1.gif"; Zoomout2 = new Image(50,50); Zoomout2.src = "pic/zoomout2.gif"; Zoomprev1 = new Image(50,50); Zoomprev1.src = "pic/zoomprev1.gif"; Zoomprev2 = new Image(50,50); Zoomprev2.src = "pic/zoomprev2.gif"; Fullmap1 = new Image(50,50); Fullmap1.src = "pic/fullmap1.gif"; Fullmap2 = new Image(50,50); Fullmap2.src = "pic/fullmap2.gif"; Zoomselect1 = new Image(50,50); Zoomselect1.src = "pic/zoomselect1.gif"; Zoomselect2 = new Image(50,50); Zoomselect2.src = "pic/zoomselect2.gif"; Print1 = new Image(50,50); Print1.src = "pic/print1.gif"; Print2 = new Image(50,50); Print2.src = "pic/print2.gif"; Help1 = new Image(50,50);Help1.src = "pic/help1.gif"; Help2 = new Image(50,50); Help2.src = "pic/help2.gif"; Point1 = new Image(70,18); Point1.src = "pic/point1.gif"; Point2 = new Image(70,18); Point2.src = "pic/point2.gif"; Polyline1 = new Image(70,18); Polyline1.src = "pic/polyline.gif"; Polyline2 = new Image(70,18); Polyline2.src = "pic/polyline2.gif"; Polygon1 = new Image(70,18); Polygon1.src = "pic/polygon1.gif"; Polygon2 = new Image(70,18); Polygon2.src = "pic/polygon2.gif";

180
} function getMap() { if (navigator.appName == "Netscape") return document.MGADVMap; else return document.all.map; } function gotoLocation() { var map = getMap(); var index = document.region.LocSel.selectedIndex; if (index == 1) map.zoomScale(500000, 400000, 6554000.0); if (index == 2) map.zoomScale(570000, 1800000, 7878600.0); if (index == 3) map.zoomScale(660700.0, 2130000.0, 3811000.0); if (index == 4) map.zoomScale(661600, 206000, 1243000.0); if (index == 5) map.zoomScale(394000, 343000, 1624400.0); if (index == 6) map.zoomScale(204421, 543310.0, 1300000.0); if (index == 7) map.zoomScale(180000, 650000, 807000.0); if (index == 8) map.zoomScale(464000, 558000, 1200000.0); if (index == 9) map.zoomScale(310000, 1540000, 2300000.0); if (index == 10) map.zoomScale(614630, 2170000, 2800000.0);

181
} function Hilite(imgName,imgObjName) { if (document.images) { document.images[imgName].src = eval(imgObjName + ".src"); }} </script> <script language="VBScript"> Sub map_onDigitizedPoint (map, point) onDigitizedPoint map, point End Sub Sub map_onDigitizedPolyline (map, numPoints, points) onDigitizedPolyline map, numPoints, points End Sub Sub map_onDigitizedPolygon (map, numPoints, points) onDigitizedPolygon map, numPoints, points End Sub </script> <script language="JavaScript"> function onDigitizedPolyline(map, numPoints, points) { var formText = reportWindow.parent.document.thePolylineForm.theTextbox.value; var selOptions = reportWindow.parent.document.thePolylineForm.theStyle.options; for (var i=0; i < selOptions.length; i++) { if (selOptions[i].selected) { var txtStyle = selOptions[i].value; } } var selOptions = reportWindow.parent.document.thePolylineForm.theColor.options; for (var i=0; i < selOptions.length; i++) { if (selOptions[i].selected) {

182
var txtColor = selOptions[i].value; } } var txtThickness = reportWindow.parent.document.thePolylineForm.theThickness.value; var myLayer = map.getMapLayer("Redline"); if (myLayer == null) myLayer = map.createLayer("redline", "Redline"); var myRedline = map.getRedlineSetup(); var myLine = myRedline.getLineAttr(); myLine.setStyle(txtStyle); myLine.setThickness(parseInt(txtThickness)); myLine.setColor(parseInt(txtColor)); var obj = myLayer.getMapObject(formText); if (obj == null) var obj = myLayer.createMapObject(formText, formText, ""); var user_vertices = map.createObject("mgcollection"); user_vertices.add(numPoints); obj.addPolylinePrimitive(points, user_vertices, false); } function onDigitizedPoint(map, point) { var formText = reportWindow.parent.document.thePointForm.theTextbox.value; var sizeValue = reportWindow.parent.document.thePointForm.theSize.value; var selOptions = reportWindow.parent.document.thePointForm.theSymbol.options; for (var i=0; i < selOptions.length; i++){ if (selOptions[i].selected) { var symbolType = selOptions[i].value; } } var selOptions = reportWindow.parent.document.thePointForm.theUnit.options; for (var i=0; i < selOptions.length; i++){ if (selOptions[i].selected) { var sizeUnit = selOptions[i].value; } } var myLayer = map.getMapLayer("Redline"); if (myLayer == null) myLayer = map.createLayer("redline", "Redline");
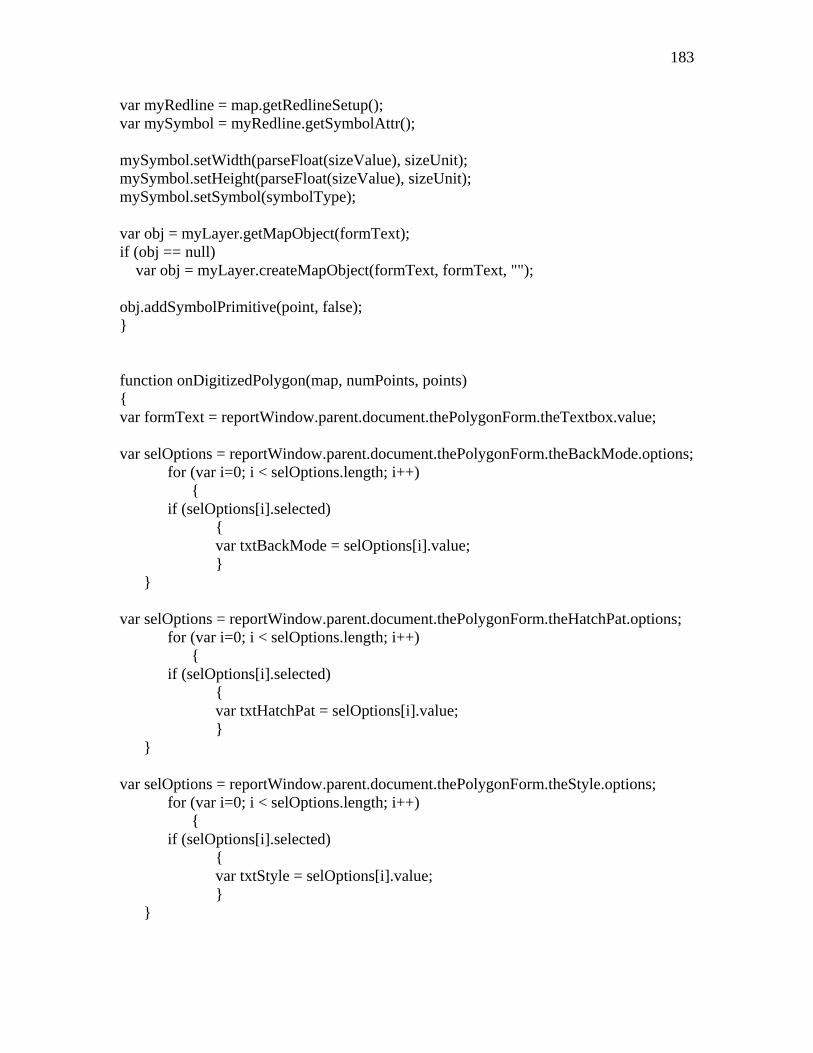
183
var myRedline = map.getRedlineSetup(); var mySymbol = myRedline.getSymbolAttr(); mySymbol.setWidth(parseFloat(sizeValue), sizeUnit); mySymbol.setHeight(parseFloat(sizeValue), sizeUnit); mySymbol.setSymbol(symbolType); var obj = myLayer.getMapObject(formText); if (obj == null) var obj = myLayer.createMapObject(formText, formText, ""); obj.addSymbolPrimitive(point, false); } function onDigitizedPolygon(map, numPoints, points) { var formText = reportWindow.parent.document.thePolygonForm.theTextbox.value; var selOptions = reportWindow.parent.document.thePolygonForm.theBackMode.options; for (var i=0; i < selOptions.length; i++) { if (selOptions[i].selected) { var txtBackMode = selOptions[i].value; } } var selOptions = reportWindow.parent.document.thePolygonForm.theHatchPat.options; for (var i=0; i < selOptions.length; i++) { if (selOptions[i].selected) { var txtHatchPat = selOptions[i].value; } } var selOptions = reportWindow.parent.document.thePolygonForm.theStyle.options; for (var i=0; i < selOptions.length; i++) { if (selOptions[i].selected) { var txtStyle = selOptions[i].value; } }

184
var selOptions = reportWindow.parent.document.thePolygonForm.theColor.options; for (var i=0; i < selOptions.length; i++) { if (selOptions[i].selected) { var txtColor = selOptions[i].value; } } var myLayer = map.getMapLayer("Redline"); if (myLayer == null) myLayer = map.createLayer("redline", "Redline"); var myRedline = map.getRedlineSetup(); var myFill = myRedline.getFillAttr(); myFill.setHatchPattern(txtHatchPat); myFill.setBackMode(txtBackMode); myFill.setStyle(txtStyle); myFill.setColor(parseInt(txtColor)); var obj = myLayer.getMapObject(formText); if (obj == null) var obj = myLayer.createMapObject(formText, formText, ""); var user_vertices = map.createObject("mgcollection"); user_vertices.add(numPoints); obj.addPolygonPrimitive(points, user_vertices, false); } function formHandler(form){ var URL = document.form.site.options[document.form.site.selectedIndex].value; window.open(URL,'WinName','toolbar=no,location=no,directories=no,status=no,menubar=no,scrollbars=yes,resizable=yes,width=500,height=200'); document.form.site.selectedIndex = 0; } </script> <div align="center"> <div align="left"> <TABLE Cellspacing="0" > <tr> <td ><a href="javascript:var dummy=getMap().selectMode()" onMouseOver="Hilite('Select','Select2')" onMouseOut="Hilite('Select','Select1')"> <img src="pic/select1.gif" width="50" height="50" border="0" ALT="" Name="Select"></a></td>

185
<td ><a href="javascript:getMap().panMode()" onMouseOver="Hilite('Pan','Pan2')" onMouseOut="Hilite('Pan','Pan1')"> <img src="pic/pan1.gif" width="50" height="50" border="0" ALT="" Name="Pan"></a></td> <td ><a href="javascript:var dummy=getMap().zoomPrevious()" onMouseOver="Hilite('Zoomprev','Zoomprev2')" onMouseOut="Hilite('Zoomprev','Zoomprev1')"> <img src="pic/zoomprev1.gif" width="50" height="50" border="0" ALT="" Name="Zoomprev"></a></td> <td ><a href="javascript:getMap().zoomInMode()" onMouseOver="Hilite('Zoomin','Zoomin2')" onMouseOut="Hilite('Zoomin','Zoomin1')"> <img src="pic/zoomin1.gif" width="50" height="50" border="0" ALT="" Name="Zoomin"></a></td> <td ><a href="javascript:getMap().zoomOutMode()" onMouseOver="Hilite('Zoomout','Zoomout2')" onMouseOut="Hilite('Zoomout','Zoomout1')" > <img src="pic/zoomout1.gif" width="50" height="50" border="0" ALT="" Name="Zoomout"></a></td> <td ><a href="javascript:getMap().zoomOut()" onMouseOver="Hilite('Fullmap','Fullmap2')" onMouseOut="Hilite('Fullmap','Fullmap1')" > <img src="pic/fullmap1.gif" width="50" height="50" border="0" ALT="" Name="Fullmap"></a></td> <td ><a href="javascript:getMap().zoomSelected()" onMouseOver="Hilite('Zoomselect','Zoomselect2')" onMouseOut="Hilite('Zoomselect','Zoomselect1')" > <img src="pic/zoomselect1.gif" width="50" height="50" border="0" ALT="" Name="Zoomselect"></a></td> <td ><a href="javascript:getMap().printDlg()" onMouseOver="Hilite('Print','Print2')" onMouseOut="Hilite('Print','Print1')" > <img src="pic/print1.gif" width="50" height="50" border="0" ALT="" Name="Print"></a></td> <td ><a href= 'javascript:var helpWindow=open("http://172.16.0.140/mgweb/htm/help.htm", "thewindow","width=400, height=500, scrollbars=yes")' onMouseOver="Hilite('Help','Help2')" onMouseOut="Hilite('Help','Help1')" > <img src="pic/help1.gif" width="50" height="50" border="0" ALT="" Name="Help"></a></td> </tr> </table> <div style="position: absolute; width: 95px; height: 59px; z-index: 2; left: 617px; top: 11px" id="layer2">

186
<a href= "http://172.16.0.140/mgweb/htm/index.htm"> <img border="0" src="pic/logout.gif" width="98" height="26"></a> <a href= "http://172.16.0.140/mgweb/htm/feedback.htm"> <img border="0" src="pic/feedback.gif" width="97" height="28"></div></a> </div> </div align> <object id="map" width="73%" height=500 classid="CLSID:62789780-B744-11D0-986B-00609731A21D" codebase="ftp://adeskftp.autodesk.com/webpub/mapguide/ver6/mgaxctrl.cab#Version=6,0,2,2" > <param name="URL" value="http://172.16.0.140/mgweb/mwf/MGmap.mwf"> <param name="Lat" value="0"> <param name="Lon" value="0"> <param name="MapScale" value="0"> <param name="MapWidth" value="0"> <param name="Units" value="M"> <param name="ToolBar" value="Off"> <param name="StatusBar" value="On"> <param name="LayersViewWidth" value="160"> <param name="URLListState" value="0"> <param name="AutoLinkDelay" value="20"> <embed src="http://172.16.0.140/mgweb/mwf/MGmap.mwf?toolbar=off&LayersViewWidth=0" align="baseline" border="0" width="100%" height="100%" name="map" type="application/x-mwf"> </embed> </object> <div style="position: absolute; width: 253px; height: 482px; z-index: 1; left: 740px; top: 73px" id="layer1"> <table id="Menu" cellspacing="0" cellpadding="0" width="200" border="0"> <tr> <td width="30" background="pic/nmnutitle-l.gif" height="20"> </td> <td class="mnuTitle" width="140" background="pic/nmnutitle.gif" height="20">Advanced Tools </td> <td width="30" background="pic/nmnutitle-l.gif" height="20"><img alt="" src="pic/arrow-d.gif"></td></tr> <tr> <td align="middle" colspan="3"> <table class="subMnu" id="table11" cellspacing="2" cellpadding="2" bgcolor="#0066ff" border="0"> <tr height="20"> <td><input class="button" type="button" value="zoom scale" id="Button1" name="Button1" onClick="getMap().zoomScaleDlg()"></td> <td><input class="button" type="button" value="clear selection" id="Button7" name="Button7" onClick="ClearSelection()"></td></tr>

187
<tr height="20"> <td><input class="button" type="button" value="buffer" id="Button3" name="Button32" onClick="ViewBuffer()"></td> <td><input class="button" type="button" value="measure" id="Button4" name="Button4" onClick="getMap().viewDistance('')"></td></tr> <tr height="20"> <td><input class="button" type="button" value="select within" id="Button5" name="Button5" onClick="SelectWithIn()"></td> <td><input class="button" type="button" value="copy map" id="Button8" name="Button8" onClick="getMap().copyMap()"></td></tr> </table> </td> </tr> <tr> <td width="30" background="pic/nmnutitle-l.gif" height="20"> </td> <td class="mnuTitle" width="140" background="pic/nmnutitle.gif" height="20">Drawing Tools </td> <td width="30" background="pic/nmnutitle-l.gif" height="20"><img alt="" src="pic/arrow-d.gif"></td> </tr> <tr> <td align="middle" colspan="3"> <table class="subMnu" id="table12" cellspacing="2" cellpadding="2" bgcolor="#0066ff" border="0" > <tr height="20"> <td><a href='javascript:var reportWindow=open("draw_point.htm", "theWindow", "width=220,height=200")' onMouseOver="Hilite('Point','Point2')" onMouseOut="Hilite('Point','Point1')"> <img border="0" src="pic/point1.gif" width="70" height="18" Name="Point"></a></td> <td class="inputText" width="81" > <input class="button" id="Button24" type="button" value="Delete" name="Button40" onClick="DeleteRedline()"></td></tr> <tr height="20"> <td><a href='javascript:var reportWindow=open("draw_polyline.htm", "theWindow", "width=250,height=200")' onMouseOver="Hilite('Polyline','Polyline2')" onMouseOut="Hilite('Polyline','Polyline1')"> <img border="0" src="pic/polyline.gif" width="70" height="18" Name="Polyline"></a></td> <td class="inputText" width="81"> <input class="button" id="Button25" type="button" value="Clear" name="Button41" onClick="ClearRedline()"></td> </tr> <tr height="20"> <td><a href='javascript:var reportWindow=open("draw_polygon.htm", "theWindow", "width=250,height=220")' onMouseOver="Hilite('Polygon','Polygon2')" onMouseOut="Hilite('Polygon','Polygon1')"> <img border="0" src="pic/polygon1.gif" width="70" height="18" Name="Polygon"></a></td> <td class="inputText" width="81"> <p></td> </tr> </table> </td></tr>

188
<tr> <td width="30" background="pic/nmnutitle-l.gif" height="20"> </td> <td class="mnuTitle" width="140" background="pic/nmnutitle.gif" height="20"> Search Tools </td> <td width="30" background="pic/nmnutitle-l.gif" height="20"><img alt="" src="pic/arrow-d.gif"></td></tr> <tr> <td align="middle" colspan="3"> <table class="subMnu" id="table15" cellspacing="2" cellpadding="2"
bgcolor="#0066ff" border="0"> <tr height="20"> <form name="form"><td valign="top"><div style="padding-top:2px; padding-
left:3px;"> <select name="site" size=1 onChange="javascript:formHandler()"> <option>Search For... <option value="search_chart.htm">Nautical Chart <option value="Search_notice.htm">Notice to Mariners </select> </div></td></form></td> </tr> </table> </td> </tr> <tr> <td width="30" background="pic/nmnutitle-l.gif" height="20"> </td> <td class="mnuTitle" width="140" background="pic/nmnutitle.gif" height="20"> Zooming To Region</td> <td width="30" background="pic/nmnutitle-l.gif" height="20"><img alt="" src="pic/arrow-d.gif"></td></tr> <tr> <td align="middle" colspan="3"> <table class="subMnu" id="table18" cellspacing="2" cellpadding="2" bgcolor="#0066ff" border="0"> <tr height="20"> <form name="region"><td valign="top"><div style="padding-top:2px; padding-left:3px;"> <SELECT NAME="LocSel" ONCHANGE="gotoLocation()"> <OPTION>Select a Region <OPTION>Peninsular Malaysia <OPTION>Sarawak <OPTION>Sabah <OPTION>Zone5-North West Coast <OPTION>Zone5-Center West Coast <OPTION>Zone5-South West Coast <OPTION>Zone5/6-Singapore <OPTION>Zone6- East Coast <OPTION>Zone7-Sarawak <OPTION>Zone8-Sabah

189
</SELECT></div></td></form></td> </tr> </table> </td> </tr> <tr> <td width="30" background="pic/nmnutitle-l.gif" height="20"> </td> <td class="mnuTitle" width="140" background="pic/nmnutitle.gif" height="20"> View Report</td> <td width="30" background="pic/nmnutitle-l.gif" height="20"><img alt="" src="pic/arrow-d.gif"></td></tr> <tr> <td align="middle" colspan="3"> <table class="subMnu" id="table21" cellspacing="2" cellpadding="2" bgcolor="#0066ff" border="0" width="158"> <tr height="20"> <form name="form0"><td valign="top"> <input class="button" type="button" value="Report" id="Button3" name="Button3" onClick="LaunchReport()"><p> <font color="#FF0000">** </font>Note: Please select features in only one layer to view the detail report.</td></form></td> </tr> </table> </td> </tr> </table> <SCRIPT language="javascript"> SetMenu('Menu'); </SCRIPT> </body> </html>

190
(iii) Program of Interactive Query
var refreshTimeout;
var pointType;
var objCounter = 0;
function getMap()
{
if (navigator.appName == "Netscape")
return document.MGADVMap;
else
return document.all.map;
}
function ViewBuffer()
{
if (getMap().getSelection().getMapObjectsEx(null).size() == 0)
alert('You must select an object before using this function');
else
var result = getMap().viewBufferDlg();
}
function SelectWithIn()
{
getMap().getSelectionMode()
getMap().setSelectionMode("Intersection")
getMap().selectWithinDlg ()
}
function ClearSelection(){
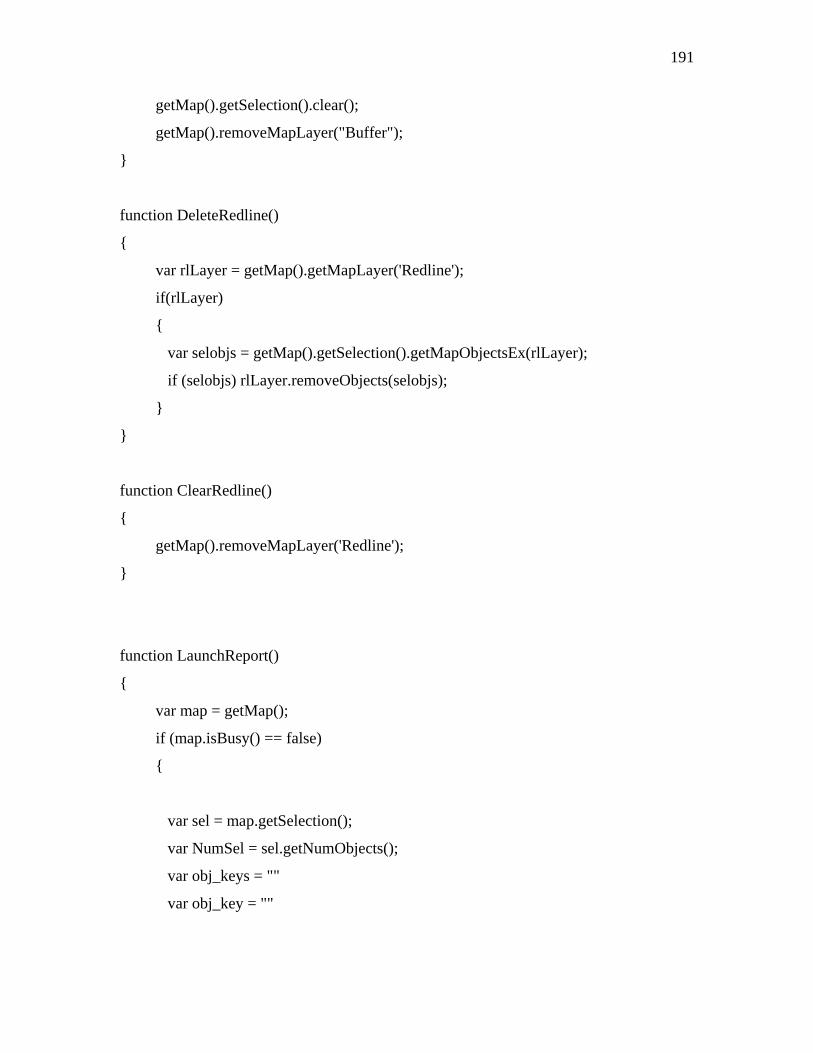
191
getMap().getSelection().clear();
getMap().removeMapLayer("Buffer");
}
function DeleteRedline()
{
var rlLayer = getMap().getMapLayer('Redline');
if(rlLayer)
{
var selobjs = getMap().getSelection().getMapObjectsEx(rlLayer);
if (selobjs) rlLayer.removeObjects(selobjs);
}
}
function ClearRedline()
{
getMap().removeMapLayer('Redline');
}
function LaunchReport()
{
var map = getMap();
if (map.isBusy() == false)
{
var sel = map.getSelection();
var NumSel = sel.getNumObjects();
var obj_keys = ""
var obj_key = ""

192
if (NumSel > 0)
{
var ObjectKeySelected = sel.getMapObjectsEx(layerReport);
var layerName = ObjectKeySelected.item(0).getMapLayer().getName();
var layerReport = map.getMapLayer(layerName);
for (i = 0; i < NumSel; i++)
{
obj_key = "\'" + ObjectKeySelected.item(i).getKey() + "\'"
obj_keys += obj_key
if (i < NumSel - 1) obj_keys += ","
}
//alert("Inside loop: " + obj_keys);
//alert("Outside loop: " + obj_keys);
var reportURL = ""
if (layerName == 'Shore')
reportURL =
"http://172.16.0.140/mgweb/htm/reportshore.asp?obj_keys=" + obj_keys;
else if (layerName == 'Chartframeline')
reportURL =
"http://172.16.0.140/mgweb/htm/reportchart.asp?obj_keys=" + obj_keys;
else if (layerName == 'Light')
reportURL =
"http://172.16.0.140/mgweb/htm/reportlight.asp?obj_keys=" + obj_keys;
else if (layerName == 'Track')

193
reportURL =
"http://172.16.0.140/mgweb/htm/reporttrack.asp?obj_keys=" + obj_keys;
else if (layerName == 'Obstructions')
reportURL =
"http://172.16.0.140/mgweb/htm/reportobstruction.asp?obj_keys=" + obj_keys;
else if (layerName == 'Services')
reportURL =
"http://172.16.0.140/mgweb/htm/reportservices.asp?obj_keys=" + obj_keys;
else if (layerName == 'Offshore Installation')
reportURL =
"http://172.16.0.140/mgweb/htm/reportoffshore.asp?obj_keys=" + obj_keys;
else if (layerName == 'Radio Radar')
reportURL =
"http://172.16.0.140/mgweb/htm/reportradar.asp?obj_keys=" + obj_keys;
else if (layerName == 'Limit Areas')
reportURL =
"http://172.16.0.140/mgweb/htm/reportlimitarea.asp?obj_keys=" + obj_keys;
else if (layerName == 'Notice to Mariners')
reportURL =
"http://172.16.0.140/mgweb/htm/reportnotice.asp?obj_keys=" + obj_keys;
else return;

194
window.open(reportURL, null, "height=350, width=700, status=no,
toolbar=no, menubar=no,location=no, scrollbars=yes, resizable=yes");
}
else
{
alert("You need to select map features before you can view the attribute
data.");
map.selectMode();
}
}
else
alert("The Autodesk MapGuide Viewer is busy. Please try again in a few
seconds.");
}
function zoomgoto(layername, X, Y, Key, Scale)
{
alert(("Got into zoomtoKey"))
map = opener.getMap();
map.setAutorefresh(false);
map.zoomscale( X, Y, Scale);
map.refresh();
window.setTimeout("zoomto( '" + layername + "', '" + Key + "')", 200);
map.setAutorefresh(true);
}

195
function zoomto(Key)
{
alert("Got into zoomto")
map = opener.getMap();
if (map.isBusy())
{
window.setTimeout("zoomto( '" + layername + "', '" + Key + "')", 150);
return;
}
var feature = map.getMapLayer('Chartframeline').getMapObject(Key);
var sel = map.getSelection();
sel.clear();
sel.addObject(feature, false);
map.setAutorefresh(false);
map.zoomSelected();
map.setAutorefresh(true);
map.refresh();
}

158
REFERENCES
Alexander, L. (1999). Electronic Charts: What, How and Why: An Update.
Proceedings:Fourth International Caris Conference (CARIS 99). September 23-
24. Fredericton, Canada.
Alexander, L. (1999). Thinking Like A Mariner. Hydro INTERNATIONAL. 3(2): 65.
Alexander, L. (2003). International ENCs: Just Do It. Hydro INTERNATIONAL. 7(3): 73.
Australian Hydrographic Service (2004). http://www.hydro.gov.au
Autodesk, Inc. (2002). Autodesk Questions and Answer . San Rafeal, CA 94903 USA.
Autodesk, Inc. (2001). Autodesk MapGuide User’s Guide, Singapore : Autodesk, Inc.
Autodesk, Inc. (2001). Autodesk MapGuide Developer’s Guide, Singapore : Autodesk,
Inc.
Andy, N. (2003). Using Electronic Charts in Shipping. In: Hydro INTERNATIONAL.
United Kingdom: GITC publication. 32 – 33.
Baranov, A. (1997). Some Limitations Of Raster Charts. Hydro INTERNATIONAL. 1(2):
44-47.
Bicking,B and East,R(1996). Towards Dynamically IntergratingSpatial Data And Its
Metadata.
Berg, O. (2003). We Visited You: Using Electronic Chart In Shipping. Hydro
INTERNATIONAL. 7(6): 32-33.
159
Bianchetti, F. (1997). A Refresher Course On ECDIS: Lost Memories Of Twelve Year
Process And The Paper Chart Equivalence Issue. Hydro INTERNATIONAL. 1(2):
24-27.
Bowers, D. S. (1988). From Data To Database. United Kingdom: VNR. 23.
Brenn, E. (2001). Chart Production Outsourcing: Blom’s Experience As A Contractor For
Paper Chart and ENC Production. Hydro INTERNATIONAL. 5(8): 49-51.
Burrough, P.A and Rachael, A. M (1998). Principles Of Geographical Information
Systems. New York: Oxford University Press. 27.
Canadian Hydrographic Services (2002). Proposed Structure Of S-57 Edition 4.0.
International Hydrographic Organization TSMAD Sub-Working Group On S-57.
Canada.
URL:http://www.iho.shom.fr/general/ecdis/COMMITTEE/TSMAD/S57structure.
pdf.
Canadian Marine Charts, Georgian Bay and North Channel (2005).
URL: http://www.sportsmansinn.ca/Great_Lakes_Marine_Charts_Dealer.html
Clarke, J. P. (1997). The Provision Of Electronic Chart Data: An Official Data
Producer’s View. Hydro INTERNATIONAL. 1(2): 22-23.
Dan, B. (2003). JavaScript for Web Professionals. United States of America: Pearson
Education, Inc.
Donegal Holdings Ltd,..Inc. (2004). INMARSAT. United States (Housten) : Donegal
Holdings Ltd,..Inc
160
Enabnit, D.B. (1999). NOAA and Electronic Charts: Market or Monopoly. Marine
Electronics Journal March/April 1999. 6-7.
Federal Publication Inc. (2004).
URL: http://www.fedpubs.com/subject/boat/aids.htm
Fred T. H. (2003). Advanced Web Design. New York : McGraw-Hill, Inc.
Gillavry, E.M. (2000). Cartographic Aspects of WebGIS-software. Department of
Cartography Utrecht University.
URL: http://cartography.geog.uu.nl/students/scripties.html
Horanont, T., Tripathi, N.K. and Raghavan, V. (2002). A Comparative Assessment of
Internet GIS Server Systems. India: School of Advanced Technologies Asian
Institute of Technology.
Hecht, H., Berking, B., Buttgenbach, G., Jonas, M. and Alexander, L. (2002). The
Electronic Chart, Functions, Potential And Limitations Of A New Marine
Navigation System. Netherlands: GITC Publication.
Hong Kong Hydrographic Office (2004). http://www.hydro.gov.hk
International Hydrographic Bureau (1997). Glossary Of ECDIS-RELATED TERMS, 3rd
Edition, Special Publication No. 52, Appendix 3 (Disember 1997). Monaco.
URL: http://www.iho.shom.fr.
International Hydrographic Bureau (2000). S-57 Maintenance Document (Number 3),
(Mac 2000), Colour & Symbol Specifications For ECDIS, Special Publication No.
52 (Appendix 2). Monaco.
URL: http://www.iho.shom.fr.

161
International Hydrographic Bureau (2001). S-57 Maintenance Document (Number 7),
(June 2001), IHO Transfer Standard For Digital Hydrographic Data, Special
Publication No. 57. Monaco.
URL: http://www.iho.shom.fr.
International Hydrographic Organization (2004).
URL: http://www.iho.shom.fr
International Maritime Organization (2004).
URL: http://www.imo.org
Jessica, E., Roger, H. (2000). Microsoft FrontPage 2000. Cambridge (US): Course
Technology .
Johari Ibrahim (2003). Kempen Agresif Tarik Pelancong Ke Langkawi. Berita Minggu
(19/10/2003). Malaysia.
Johnsen, R. H. (2003). Are the ENCs the Only Route to Paperless Navigation?. The
Digital Ship Seminar. Hamburg.
Langeraar, W. (1984). Surveying and Charting of The Sea. Tokyo : Elsevier Science
Publishing Company, Inc.
Ling, L.S. (2003). Speech at ISOA Night 2003 on 16 January 2003 at Sunway Pyramid
Convention Centre.
Lim, A.J. (2004). Web-based GIS for e-submission system in planning approval.
Malaysia : University of Technology Malaysia.

162
Mittal, S.K. (2002). Roles of a Hydrographic Office and GIS/GPS - An Outline Survey.
India Navy, National Hydrographic Office Dehradun.
Plewe, Brandon and Onword (1977). GIS Online, Information Retrieval, Mapping, and
Internet.
Brown, B.M. (2001). Developments in the NOAA Electronic Navigational Chart
Program. NOAA, 1-7.
MAIB (1999). MAIB Annual Report. MAIB.
Maritime and Coastguard Agency (2002). Safety Of Navigation, Implementing SOLAS
Chapter V, 2002. Southampton: Maritime And Coastguard Agency. 47.
Mohd Razali Mahmud and Nazirah Md. Tarmizi (2002). The Needs Of ECS For Safety
Navigation Enhancement In Malaysia Ports. International Symposium And
Exhibition On Geoinformation 2002 (ISG’02). October 22-24. Kuala Lumpur:
Universiti Teknologi Malaysia.
Mohd Razali Mahmud, Nazirah Md. Tarmizi and Muhammad Ariff Abdul Jalil (2003).
The Development Of Marina Database Model In Langkawi. International
Symposium And Exhibition On Geoinformation (ISG’03). October 13-14. Shah
Alam: Universiti Teknologi MARA and Institution Of Surveyours Malaysia.
Mohd Razali Mahmud, Nazirah Md. Tarmizi and Muhammad Ariff Abdul Jalil (2003).
Electronic Chart: Towards Enhancing The Safety Of Marine Navigation. The 2nd
National Conference On Transportation Management: Issue And Challenges.
October 20-21. Shah Alam: Universiti Utara Malaysia and Universiti Teknologi
MARA.

163
Motte, G. A. and Stout, T. M. (1990). Kerja Carta Dan Pelayaran Marin Bagi Nelayan
Dan Pengemudi Bot. Edisi Kedua. Kuala Lumpur: Dewan Bahasa Dan Pustaka.
Sakri Ibrahim. 23-24.
NOAA (1998). Promote Safe Navigation - A NOAA Strategic Goal, (NOAA). 4-1.
Malaysian Perspective Plan 2001-2005 (2001). Kuala Lumpur: Nasional Malaysia
Berhad. 318-319.
Marshall,J(2000). Developing Internet –Based GIS Application. Proceeding ESRI 2000.
URL: http://www.esri.com/userconference
Pillich, B. (2003). ECDIS For Ports And Coastal Zone New Applications For
Navigational Technology. Hydro INTERNATIONAL. 7(6).
Raisz, E., (1962). Principles of Cartography. United States of America : McGraw-Hill
Series in Geography. 4-6.
Rogoff, M. (2002). The ISO Standard For The ECS Database: ISO 19379. Hydro
INTERNATIONAL. 6(7): 40-43.
Rohde, M. (1986). Sea Sense And Ship Terminology. Hydrographic Training In Malaysia
Notes. Unpublished.
Rob. P and Coronel. C (1997). Database systems : design, implementation, and
management. Cambridge: Course Technology.
Sasaki, M. (1997). The Japanese View On ENC/ERC Development. Hydro
INTERNATIONAL. 1(2): 28-30.
Sleight, S. (2001). K.I.S.S Guide To Sailing. London: Dorling Kindersley Limited.
164
Smart, J. (2000). Raster Chart Production With CARIS. Universal System Ltd.
Unpublished Technical Paper.
Spoelstra, G.G. (1997). ECDIS And Standardisation: Reaching The Finish Line. Hydro
INTERNATIONAL. 1(2): 58-60.
Sumazly Sulaiman dan Noraida Hj. Ali (2002). Sistem Komputer Dan Aplikasi. Malaysia:
McGraw-Hill. 20-23.
Structural Planning for Langkawi (1990-2005) (1992).Alor Setar: Government
Publishers.
Soltanieh, S.M.K., Alesheikh, A.A. and Mohammadi, H. (2003). Design and
Implenmentation of A Web-Based GIS for the Iranian Roads Information. Iran:
K.N. University of Technology Vali_asr St, Tehran.
Shweta, B. (2002). Making Use of JavaScript. Canada : Wiley Publishing, Inc. 2002. 1-
13.
Scott, M., James, A. (2001). Sams Teach Yourself Active Server pages 3.0 in 21 Days.
United States of America : Sams Publishing.
Trinidad, G., Cole, I. and Chan,W. (1999). Developing Internet-Based GIS Applications.
Commonwealth Scientific and Industrial Research Organization (CSIRO)
Vatsa, G.S. and Rajesh, K. (2003). Integrated Marine GIS Approach in Navigational
Charting. Dehradun: National Hydrographic Office.

165
Taher Buyong (2000). Prinsip-prinsip GIS. Malaysia: Universiti Teknologi Malaysia.
The Canadian Government Publication (2003). The Canadian Aids To Navigation
System. Toronto: Federal Publications Inc.
URL: http://www.fedpubs.com/subject/boat/aids.htm.
Twiss, T. (1871). The Black Book of the Admiralty, with an Appendix. Monumenta
Juridica.. London: Longman & Co.
U.S Coast Guard Navigation Centre (2003). AIS Overview.
URL: http://www.navcen.uscg.gov/enav/ais/default.htm. Last accessed 18/7/2003.
van der Poel, L. (2002). We Visited For You: Electronic Chart Conference 2001. Hydro
INTERNATIONAL. 6(1): 30-31.
Wan Jailani Razak (2003). Dr M Tinjau Marina Terbaru. Berita Harian (3/9/2003).
Malaysia.
Wilson, Chua (1997). To Be Competetive in Singapore, A Surveyor Must Employ Fully
Automated Systems. Hydro INTERNATIONAL. 1(2): 31-33.
Wilson, Chua (2002). Electronic Chart Display And Information System (Ecdis): A
Navigational Tool To Further Enhance Safe Navigation. Maritime And Port
Authority of Singapore.
URL: http://www.ppa.gov.ph/apa-2002/papers/ECDIS.doc.
Woodford, P.(1997). ENC Data Production: A Technology Viewpoint. Hydro
INTERNATIONAL. 1(2): 40-41.
Yogendran, S. (2001). ECDIS–Approach For Paperless Navigation. Hydro
INTERNATIONAL. 5(8): 7-9.


