Embed Size (px)
Citation preview

The Determinants and Effects of Lifelong Learning
Andrew Jenkins, Anna Vignoles,
Alison Wolf and Fernando Galindo-Rueda
April 2002
ISSN 2045-6557

Published by Centre for the Economics of Education London School of Economics and Political Science Houghton Street London WC2A 2AE A. Jenkins, A. Vignoles, A. Wolf and F. Galindo-Rueda, submitted November 2001 ISBN 0 7530 1481 5 Individual copy price: £5 The Centre for the Economics of Education is an independent research centre funded by the Department for Education and Skills. The views expressed in this work are those of the authors and do not necessarily reflect the views of the DfES. All errors and omissions remain the authors.

Executive Summary
Despite the policy importance of lifelong learning, there is very little hard evidence from the
UK on a) the extent of lifelong learning, b) who undertakes lifelong learning and why, and c)
the benefits of lifelong learning. This paper attempts to address all three of these questions.
Specifically it identifies the factors that determine whether someone undertakes lifelong
learning, defined very narrowly for the purposes of this research as learning between the ages
of 33 and 42 that results in a qualification. It then models the effect of the different
qualifications acquired via lifelong learning on individuals’ economic outcomes, namely
wages and the likelihood of being employed.
The paper uses a rich longitudinal panel data set of individuals born in 1958, called
the National Child Development Study. The rich data arising from this cohort study enable
us to identify the effect of lifelong learning on wages and employment after allowing for a
myriad of other factors that also affect these labour market outcomes. A particular modelling
issue that we attempt to overcome is endogeneity bias. This bias arises if characteristics,
such as innate ability, make some people more likely to undertake lifelong learning and also
ensures that they earn more anyway. If we do not allow for these characteristics, e.g. by
including measures of ability in our model, then some of the apparent benefit of lifelong
learning may really be down to the fact that only very able individuals undertake lifelong
learning in the first place. We do not claim to have overcome this potential source of bias
and indeed our results suggest it may be a problem in our research. Future work will focus
further on this issue.
Our results provide strong evidence that there are employment effects associated with
lifelong learning. Those who were out of the labour market in 1991 were more likely to be in
work in 2000 if they had undertaken lifelong learning in the intervening period. We also
found convincing evidence that learning leads to learning. Undertaking one episode of
lifelong learning increased the probability of the individual undertaking more learning.
Conversely, those who had attempted a course leading to a qualification between the ages of
33 and 42 but failed to obtain the qualification were less likely to be current learners in the
2000 survey. The results also show that, for individuals with no qualifications in 1991, those
who undertook lifelong learning between 1991 and 2000 were earning higher wages in 2000
than those who had not engaged in lifelong learning over this period. We found only limited
evidence of positive wage effects from lifelong learning for other groups. For example,

women who obtain a degree or level 4 occupational qualifications (e.g. nursing, teacher
training) between the ages of 33 and 42 earn more than their otherwise similar peers who do
not, while for men, the results suggest that higher degrees yield a wage premium if taken as a
mature student.
Our research has highlighted some important research questions. Firstly, we need to
improve our understanding of who is undertaking lifelong learning, and why. We know that
adult learning may lead to more adult learning. However, we still know very little about the
motivation behind any lifelong learning. Only when we have a clearer picture of why people
undertake lifelong learning (and who pays for it) can we understand when and why lifelong
learning may or may not have effects on wages and employment outcomes. For instance, one
would not expect lifelong learning that is undertaken for non-economic and non-job related
reasons necessarily to lead to higher wages. In fact it may result in lower wages, if
individuals have to take time off work or become less focused on their work as a result of
being lifelong learners. This does not mean however that there are not non-economic
benefits associated with lifelong learning. Another point that needs to be borne in mind is
that our study focuses on qualification-oriented learning and this is a very particular subset of
all lifelong learning. Also, the possible differences between short-term and long-term effects
of lifelong learning have not been explored in this paper. For all these reasons, we propose to
continue our research in partnership with the DfES Centre for the Wider Benefits of Learning,
which will enable us to investigate lifelong learning in a more holistic manner. We intend to
consider other potential, non-economic, outcomes and to try to understand the motivation
behind the extensive amount of lifelong learning that is evident in the NCDS data.

The Determinants and Effects of Lifelong Learning
Andrew Jenkins, Anna Vignoles,
Alison Wolf and Fernando Galindo-Rueda
1. Introduction 1 2. Literature Review 2
2.1 Participation in lifelong learning 2 2.2 Changes over time in the extent of participation 4 2.3 International Evidence on participation in lifelong learning 4 2.4 Explaining participation and non-participation 5 2.5 The benefits of lifelong learning 7 2.6 International evidence on the benefits of lifelong learning 10 2.7 Summary 13
3. Methodology 14 4. Data 17
5. Participation in Lifelong Learning 20
5.1 Who is undertaking lifelong learning 20 5.2 Repeat spells of lifelong learning 22 5.3 Summary 23
6. The Effects of Lifelong Learning On Wages 24
6.1 Wage equations 24 6.2 Interaction effects 27 6.3 First difference equations 28 6.4 Wage effects by educational attainments in 1991 29 6.5 Summary 32
7. Employment Effects of Lifelong Learning 32 8. Conclusions and Ideas for Future Research 33
Tables 36 References 64

Acknowledgements
This paper builds on, and draws heavily from, previous work on measuring the impact of
qualifications on employment outcomes found in Dearden et al., (2000) and McIntosh and
Vignoles (forthcoming). The authors would also like to thank Gavan Conlon for his
comments. All errors and omissions remain our own.
Andrew Jenkins is a principal researcher for the Centre for the Economics of
Education and a member of the Institute of Education. Anna Vignoles is a strand leader at
the Centre for the Economics of Education and a Research Fellow at the Centre for Economic
Performance, London School of Economics. Alison Wolf is a strand leader at the Centre for
the Economics of Education and holds a Chair in Education at the Institute of Education. She
is also Director of the Demand for Skills research unit at the Institute of Education. Fernando
Galindo-Rueda is a principal researcher for the Centre for the Economics of Education and a
member of the Centre for Economic Performance, London School of Economics.
The Centre for the Economics of Education is an independent research centre funded by the
Department for Education and Skills. The views expressed in this work are those of the
authors and do not necessarily reflect the views of the DfES. All errors and omissions remain
the authors.

1
1. Introduction
During the last two decades, increasing emphasis has been placed by policy-makers,
employers and individuals alike, on the positive role of human capital in promoting economic
prosperity and social inclusion. There has also been a presumption that continual skill
formation (one aspect of lifelong learning) will become increasingly important for those who
are already in the labour market, if the skill needs of employers are to be adequately met.
Despite the rhetoric around lifelong learning however, most of the research emphasis in this
field has been on the acquisition of human capital by the young. This focus on the education,
qualifications and training of the young has largely been driven by lack of data on the
learning experiences of adults. In fact, despite the policy importance of lifelong learning that
has been stressed in numerous government reports (e.g. The DfES Learning Age Green
Paper), there is very little hard evidence on a) the extent of lifelong learning, b) who
undertakes lifelong learning and why, and c) the benefits of lifelong learning.
This paper attempts to address all three of these questions. To the best of our
knowledge, this research is unique in at least two respects. Firstly, unlike most of the limited
amount of published UK research on the outcomes associated with lifelong learning, we do
not focus specifically on mature graduates. Instead we assess the extent of lifelong learning
leading to the full range of qualifications, and try to assess the economic benefits of all
qualifications acquired through later learning. Secondly, we use a rich longitudinal panel
data set. This enables us to control for a huge array of factors that may influence whether
someone undertakes lifelong learning. This is crucial if (as discussed at length below) we are
to avoid endogeneity bias. We restrict our analysis to the labour market benefits of lifelong
learning and to qualification-oriented learning, namely the effect of adult learning on
employment prospects and wages. However, as we discuss at length below, our analysis
suggests that individuals may undertake lifelong learning for a variety of reasons unrelated to
the labour market. Hence we suggest that future work on this issue should also focus on the
non-economic benefits of adult learning, including any intergenerational transfers of
knowledge and ‘love of learning’, and should also investigate a range of different definitions
of lifelong learning in addition to learning which leads to qualifications. Indeed the two
DfES Centres for the Economics of Education (CEE) and the Wider Benefits of Learning
(WBL) intend to collaborate to take this preliminary research forward.
2
2. Literature Review
2.1 Participation in lifelong learning
Sources of information on the extent of participation in lifelong learning include surveys by
NIACE (Sargant et al., 1997; Sargant, 2000; Aldridge and Tuckett, 2001); the National Adult
Learning Survey (Beinart and Smith, 1998); the Labour Force Survey (see the discussion in
Hillage et al., 2000); and research based on IALS, the International Adult Literacy Survey
(O’Connell, 1999). These surveys adopt differing definitions of what constitutes an adult,
and more crucially, what constitutes learning and, as a result, present very different estimates
of the extent of participation in adult learning.
The NIACE (National Institute of Adult Continuing Education) studies surveyed
adults aged 17 and over in the UK. Learning was defined in a long statement at the
beginning of the questionnaire as:
Learning can mean practising, studying or reading about something. It can also mean being taught, instructed or coached. This is so you can develop skills, knowledge, abilities or understanding of something. Learning can also be called education or training. You can do it regularly (each day or month) or you can do it for a short period of time. It can be full time or part time, done at home, at work, or in another place like college. Learning does not have to lead to a qualification. We are interested in any learning you have done, whether or not it was finished (Sargant et al., 1997, p 119).
Those answering the questionnaire were asked to pick one response from:
You are currently doing some learning activity.
You have done some learning activity in the past three years.
You have studied/learned but it was over three years ago.
You have not studied/learnt since you left full time education.
On this broad definition of lifelong learning, in 1996, 23 per cent of adults said they
were in current learning and a further 17 per cent had done some learning in the last three
years. The 1999 survey, using an identical question, found that 22 per cent of adults were
current learners and 18 per cent were recent learners. Both surveys, then, suggest that 40 per
cent of adults could be described as either recent or current learners. The most recent survey,
conducted in March/April 2001 (Aldridge and Tuckett, 2001) found that current learning had
increased to 29 per cent, taking the total of current/recent learners up to 46 per cent.

3
The sampling frame for the National Adult Learning Survey (NALS) was all adults
ages 16 to 69. A distinction was made in the questionnaire between taught and non-taught
learning, and respondents were asked a series of questions about whether they had undertaken
various kinds of taught and non-taught learning in the three years prior to the interviews
(which took place in 1997). The definition of lifelong learning was extremely broad. It was
found that 68 per cent of 16 to 69 year olds had taken part in some kind of learning activity in
this time frame, and 62 per cent had done some vocational learning in the previous three
years.1
In a careful discussion of methodology, the NALS researchers showed that the
differences between their results and those in the NIACE survey were overwhelmingly
because of the broader definition of learning adopted in the NALS research (Beinart and
Smith, 1998, pp 35-37).
The Labour Force Survey (LFS) definition of adult learning is much narrower than
those adopted by either NIACE or NALS. It encompasses those adults between the ages of
25 and 64 who were either enrolled for part-time study at educational institutions, or
undertaking part-time correspondence courses, or had been involved in vocational training in
the last four weeks (Hillage et al., 2000, p 46). On this definition, some 3.3 million adults
were participating in learning at the end of 1998. This was about 13 per cent of all adults in
the age group, and there were a further 300,000 in full-time education (Hillage et al., 2000,
p 47).
The International Adult Literacy Survey (IALS) took place in 1994/95 and covered a
sample of adults, aged 25 to 64, in a range of countries. One question asked whether, over
the preceding twelve months, the respondent had received ‘any training or education
including courses, private lessons, correspondence courses, workshops, on-the-job training,
apprenticeship training, arts, crafts, recreation courses or any other training or education’. On
this basis, some 45 per cent of the UK sample were participants in adult education and
training.
Overall, given the variation in results from these four surveys it should be very clear that
measuring the extent of participation in lifelong learning is very sensitive to the definition of
lifelong learning adopted.
1 Since leaving full-time education in the case of those who had left full-time education less than three years previously.

4
2.2 Changes over time in the extent of participation
The NIACE surveys were conducted in 1990, 1996, 1999 and 2001. They suggest that, at the
aggregate level, participation was roughly cons tant in the 1990s. In 1990, 39 per cent of
respondents were engaged in current or recent learning, compared to 40 per cent in 1996 and
40 per cent in 2000.2 This rather static overall picture masked some variation by age, with
increasing participation by the under 25s, at least partly because more of them stayed on in
initial full-time further and higher education; more participation by those aged 25 to 64, and a
decline in participation among older members of the population, both in the 65 to 74 age
group and among the 75 and overs. However, as mentioned in the previous section, the most
recent survey, conducted in 2001, found a marked increase in the proportion of current
learners on the NIACE definition, taking the overall figure for current or recent learning up
from about 40 per cent in the 1990s to 46 per cent in 2001. Preliminary analysis of this very
recent data has suggested that the increase is quite broadly based across a wide range of ages
and occupational groups (Aldridge and Tuckett, 2001).
Data from the LFS suggest that the percentage of current/very recent adult learners
rose from about 11 per cent in 1990 to 13 per cent by 1998 (Hillage et al., 2000). Note,
however, that Green (1999) has shown that the average length of a training episode fell over
this period so that the volume of vocational training, at least, may not have increased in the
1990s.
2.3 International evidence on participation in lifelong learning
There is some evidence that participation in adult learning has been growing elsewhere, both
in North America and in other European countries. Field (2000) cites evidence suggesting
that in Canada the proportion of adults involved in organised learning rose from 20 per cent
in the mid-1980s to 38 per cent in the mid-1990s; estimates for the US are for a 46 per cent
participation rate in adult learning in 1999, which represents growth of about one-third since
1991. In Finland participation in organised adult learning increased 28 per cent between
1972 and 1995, while in the Netherlands participation rose from 15 per cent in the 1960s to
20 per cent in the 1980s and had reached almost 38 per cent in the mid-1990s (figures from
various authors, all cited in Field, 2000, p 39). These figures do clearly suggest increases in
2 The questions asked in 1996, 1999 and 2001 were identical, but the 1990 questions were slightly different.

5
participation over time. However, because of the sensitivity of estimates of participation in
lifelong learning to the definition of lifelong learning adopted, it would be extremely unwise
to use these figures to make cross-country comparisons of participation in adult learning.
An analysis of the IALS data by O’Connell (1999) provides a much better basis for
international comparisons. Admittedly, the sample sizes for each country, at only some 2,000
to 4,500 respondents, were on the small side for nationally representative surveys, but the
IALS was at least designed with international comparisons in mind. Eleven countries,
including seven European countries; Australia, New Zealand, Canada and the United States,
were covered by O’Connell’s study. At 45 per cent, the UK’s participation rate in adult
learning compared well with the (unweighted) mean for all countries in the study of 36 per
cent. The highest participation rates were in Sweden (54 per cent) and New Zealand (46 per
cent), while low participation rates were recorded for Poland, at only 14 per cent, Ireland and
Belgium (22 per cent each).
2.4 Explaining participation and non-participation
In the NIACE surveys, social class was found to be important for explaining participation.
For example, in the 1996 survey 53 per cent of those in the sample defined as social class AB
were either currently engaged in learning or had done some learning in the three years before
the study; the equivalent figure for those in social class DE was only 26 per cent. For the
whole sample, 36 per cent had done no learning since leaving full- time education, but this
figure varied from only 19 per cent of social class AB, 27 per cent for C1s, 42 per cent of C2s
and 53 per cent of those in social class DE (Sargant et al., 1997).
The more initial education and training people had received, the greater the likelihood
of their learning later on. Only 20 per cent of those leaving initial education before the age of
16 were found to be current or recent participants in adult learning, compared to 39 per cent
of those who had left initial education at the age of 16/17, and 59 per cent of those who had
stayed in education to the age of eighteen or beyond.
A number of other variables were also associated with participation in adult
education. These included age, with the elderly being less likely to participate; and gender,
with men being more likely to be involved in education and training than women; and there
were also variations according to the part of the country in which people lived, with those in
the south-east scoring highest for participation (Sargant et al., 1997). However, the NIACE

6
surveys venture no further than the compilation of frequency tables and cross-tabulations, so
it is unclear whether all these variables would remain significant in a multivariate analysis.
To control for the effects of interaction among explanatory variables, the NALS
presented results from logistic regressions with participation in vocational learning and
participation in non-vocational learning as the dependent variables (Beinart and Smith, 1998).
In this multivariate framework it was found that those who had left initial full-time education
with qualifications were more likely than those without qualifications to have undertaken
vocational learning, and the probability of participation increased the higher the level of
qualifications obtained. Participation also varied by current activity. People in full-time
work were more likely to undertake vocational learning than part-time workers, and much
more so than those who were looking after a family or retired. Non-manuals were more
likely to be participants than manual workers, people under 60 were more commonly in
vocational learning than the over-60s, males had a slightly higher probability of participation
than females and those of white ethnic background were more likely to have undertaken
vocational learning than those from other ethnic backgrounds.
As for non-vocational learning in the NALS the results of logistic regressions again
showed that obtaining qualifications from initial full-time education, white ethnic
background, and non-manual status were also predictors for this type of learning. However,
females were more likely than males to engage in non-vocational learning, and retired people
were more commonly non-vocational learners than those in work.
Studies of vocational training in Britain, using the LFS and other sources, generally
find that workers with higher levels of qualifications are far more likely to obtain training
than those with lower qualifications or no qualifications. Green (1999), summarising 1997
LFS data, reports that some 23 per cent of workers with degree level qualifications had
received training in the four weeks prior to the survey, and 20 per cent of those with A-level
qualifications had received some training. Less than 10 per cent of workers with NVQ1 level
qualifications, and a mere 4 per cent of those with no qualifications had received training on
the LFS definition. These figures imply a real danger of what Green refers to as ‘a chain of
cumulative advantage’ in the provision of training. Younger workers were also more likely
to obtain training than their older colleagues (Hillage, 1996). Another area of concern is the
difference in the incidence of training between large and small firms, with the provision of
training in large firms far higher than among small firms (Green, 1999; Hillage, 1996). There
is also some evidence that unionised firms are more likely to provide training than non-
unionised firms. This most likely occurs via the voice that unions provide for employees, and

7
also through union effects on worker tenure, rather than directly through the bargaining
process (Green, 1999). Prior qualifications, firm size and unionisation appear to be the main
sources of variation in the receipt of training, and variation by gender and employment status
(full-time/part-time) is less marked. By the late 1990s a marginally higher proportion of
women were receiving training than men, according to the LFS data, while slightly fewer
part-time workers obtained training than full- time workers (Green, 1999).
2.5 The benefits of lifelong learning
Although there are certainly hundreds, possibly thousands, of studies that evaluate the
economic returns to years of schooling, analysis of the economic benefits that adult learners
derive from investments in education and training has only begun to be undertaken very
recently, and accordingly the literature is still very sparse.3
In the UK, some research in this field was conducted for the Dearing Enquiry, and
focused on the earnings of mature graduates (Steel and Sausman, 1997). This work
attempted to compare the returns (both social and private) earned by mature graduates and
those who graduated at the ‘usual’ age of 21. Social returns for male graduates averaged over
all age groups were estimated at 6-8 per cent, compared to 7-9 per cent for males who had
entered higher education at age 18. The gap in private returns was slightly wider, at 9-11 per
cent for all entrants, compared to 11-13 per cent for 18-year-old males. The main conclusion
of the research, then, was that rates of return for more mature graduates were lower than, but
quite close to, those obtained by early graduates. The returns for mature graduates were
lower because they had higher foregone earnings than 18-21 year-olds and less time in the
labour market post-graduation. They were close to the estimates for 21-year-old graduates
because most ‘mature’ graduates were still relatively young, often under 30 on entry into
higher education (Steel and Sausman, 1997, pp 91-92).
More recent studies have continued to focus on the pay and career paths of mature
graduates. A series of papers by Egerton explore these topics, drawing mainly on data from
the General Household Survey (Egerton 2000a,b; 2001a,b). Egerton (2000a) analyses the
pay differentials between men who obtained a degree at the conventional age, and men who
obtained their degrees as mature students. Data were taken from the General Household
Surveys (GHS) for the years 1983 to 1992. A mature graduate was defined as one who had

8
obtained a first degree after the age of 25, or who completed a higher degree after the age of
28. The sample consisted of 3,733 early graduate males and 616 mature graduate males, all
in full-time employment and with good pay data (current net weekly earnings).
Mature male graduates earned more than those with A-levels but less than early
graduates, over most of their graduate careers. More precisely, in the first years of their
graduate careers, the mature graduates earned more than the early graduates, because of
greater labour market experience, but after ten years in the labour market and beyond, early
graduates earned more than mature graduates.
In an OLS wage equation with a dummy variable for mature graduate status, and a
dummy to measure whether or not the individual had obtained a higher or professional
degree, the initial estimate of the disparity between mature and early graduate net weekly
earnings was –0.098, or about £31 per week in 1999 prices. Adding in work experience (and
its square) reduced the disparity by about two-thirds but it was still significant at the 5 per
cent level. Further variables to reflect father’s social class and whe ther the degree-awarding
institution was a university or polytechnic further reduced the income disparity, and it
became statistically insignificant. Additional variables, including region and job
characteristics (especially whether public or private sector) improved the fit of the equation
and further reduced the differential between mature and early graduate pay. 4
These results, then, show that mature male graduates earned less than early graduates.
Lower mature graduate pay was explained by a number of factors. Social origin was
important, with fewer mature graduates having a middle class background. The institution of
education also mattered, since mature graduates had a higher probability of having attended a
polytechnic (note that the study covers the period up to 1992). Other important variables
were region, with the mature graduates more likely to be working outside the southeast, and
employment sector, since mature graduates were much more likely to be working in the
public sector.
Further analysis of the career paths of both male and female mature graduates, also
using data from the GHS (Egerton, 2001a) revealed that mature graduates were more
successful occupationally than those with just A-level or other sub-degree qualifications, but
the probability that mature graduates worked in ‘lower service’ rather than ‘higher service’
jobs was significantly greater than for early graduates. Moreover, analysis of the changing
3 A survey article by Cohn and Addison (1998) with the promising title ‘The Economic Returns to Lifelong Learning in OECD Countries’ actually turns out to be a review of the schooling and youth training literature and contains very little information on the returns to adult learning.

9
proportions entering the finance/business sector and the welfare sector (health, education,
social services) from the late 1950s through to the early 1990s, found that both male and
female early graduates increasingly went into business/finance and became less likely to enter
welfare services, while the opposite applied to mature graduates. So, mature graduates
became more likely to enter the less well-paid segments of the labour market. Mature
graduates are also likely to take longer to obtain work once they have graduated. This
appears to be partly because they have lower mobility than younger graduates and partly
because some employers, especially ‘fast track’ recruiters are unwilling to employ more
mature graduates, although other sectors, notably the public sector and retailing welcome
applications from older graduates (Pitcher and Purcell, 1998; Egerton, 2000a).
Egerton and Parry (2001) also utilise the GHS to obtain estimates of rates of return for
both male and female mature graduates. Separate earnings equations were estimated for early
graduates, mature graduates and matriculates (i.e. those with two A-levels or equivalent as
their highest qualification). The control variables included social class, region, ethnicity and
sampling year. Rates of return were then calculated as the differential in earnings between
graduates and matriculates, minus the costs of study, discounted to net present value. The
costs of study estimates assumed three years for completion of a degree course with foregone
earnings at the level of matriculates, and allowing for any student subsidy such as
maintenance grants. On this basis, mature male graduates had a rate of return of just 1.5 per
cent over matriculates, while for mature women the figure was 5.6 per cent.5 For men, the
return was not sufficient to compensate for loan repayments, with the researchers estimating a
loss in lifetime earnings of £9000 in 1987 prices. For women, on average, the return on their
investment was estimated to be just sufficient to repay the costs of loans and tuition fees.
However, for older women within the mature graduate group, with higher foregone earnings
and less post-study years in the labour market, the investment in education would probably
not be worthwhile in simple earnings terms.
Blundell et al., (1997) used data from the National Child Development Study (NCDS)
to examine the economic benefits of higher education in Britain. Details of the NCDS data
can be found in the next section. Broadly, the NCDS is a longitudinal panel of people born in
1958. The research compared the earnings of those with A-level qualifications only with
people who had completed higher education courses. Although the main focus of the study
4 These results do not control for any potential endogeneity bias. 5 For comparison, Egerton and Parry’s results show that male early graduates earned rates of return of between 6 and 10 per cent. Female early graduates earned returns of between 22 and 27 per cent.

10
was not mature students, a variable was included in some regressions to measure whether
those who had started their first higher education course after the age of 21 earned different
returns from those who completed higher education at a younger age.
Generally, large returns to higher education were found, of around 12 to 14 per cent
for men and 22 to 34 per cent for women. Men who began their course at over 21 earned a
return about seven percentage points lower, while starting late did not appear to have any
detrimental effect on women’s earnings. Since the cohort were only 33 at the time of the
study, it is not possible to say whether these effects would persist over the rest of their
working lives, nor do we know the consequences of getting a higher education qualification
much later in life as opposed to just a few years late. Nonetheless, the results are interesting,
and the difference between men and women is particularly striking. The contrast in the
results obtained by Egerton and Parry compared to those of Blundell et al may partly be
accounted for by differences in the ages of the people in their samples – all the individuals in
the NCDS study were 33, while those in the GHS were a range of ages up to 61, partly by
differences in the measurement of foregone earnings and by other differences of computation.
There appears to be little other UK work on this issue. Some UK research has looked
at the extent of earnings gains among students taking and/or completing part-time degree
courses. These studies have found earnings increases (relative to national average earnings
and controlling for gender, age and other variables) for those undertaking part-time degrees at
the Open University and other higher education institutions (Brennan et al., 2000; Woodley
and Simpson, 2001).6 There is also some related work which examines the perceptions of
adult learners about the benefits which they derived from their course of study – for more on
this, see Hillage et al., (2000).
2.6 International evidence on the benefits of lifelong learning
There also appears to be very little research conducted in the rest of Europe or the United
States on rates of return for adult learners. A paper by Leigh and Gill (1997) investigated the
returns for American adults taking two or four-year college courses after the age of 25, in
comparison to those who did the courses at a younger age. The data source was the National
Longitudinal Survey of Youth (NLSY) through to the 1993 wave, when respondents had
reached the ages of 28 to 35. The sample size was approximately 5,000. The researchers
6 The study by Brennan et al., was commissioned by DfEE.

11
defined a dummy variable ADULT to represent returning adults (i.e. those doing their course
over the age of 25), and essentially estimated an equation of the form:
LnW = a0 + a1POSTSEC + a2(POSTSEC*ADULT) + a3X + u
with POSTSEC representing post-secondary education, X a host of background variables,
and the interaction term picking up whether the returns for adults differed from those of
‘continuing’ students, who did their course as part of initial education. In practice, the
POSTSEC term shown here consisted of several variables representing different types of
education (AA degrees, BA degrees, two-year non-degree courses, four-year non-degree
courses).
The results obtained showed that, for males, two-year college programs gave higher
returns to adults than to continuing students, although this result was significant only at the
10 per cent level. For AA degrees (these are two-year courses, usually undertaken at
community colleges) there was no significant effect, while for BA degrees and four-year
college courses, the returns for adults were lower than for continuing students. For females,
the estimates of adult increments (i.e. the interaction term in the above equation) were
generally small and/or insignificant with the exception of BA degrees, which were found to
increase the wages of adult returners relative to continuing students (again at a 10 per cent
level of significance).
There is also a sizeable literature on students obtaining the GED, or General
Educational Development certificate. This certificate provides the main second chance for
Americans who drop out of high school prior to graduation. Cameron and Heckman (1994)
show that GED recipients do substantially less well in the labour market, in terms of
earnings, than high school graduates. More tentatively they suggest that those with GED
certification do somewhat better than ‘permanent’ dropouts. Subsequent analysis (Murnane
et al., 2000; Tyler et al., 2000) has revealed that different types of GED recipients obtain
varying benefits from certification. In these studies, obtaining a GED is associated with
higher earnings at age 27 for those male dropouts who had very weak cognitive skills at
school, as measured by maths test scores, but not those with stronger cognitive skills. The
intuition for this result seems to be that dropouts with low test scores who later increase their
skills are able to use the GED to signal this improvement to employers. By this means they
are able to increase their earnings level well beyond that of permanent dropouts with
similarly low school maths scores. There is also evidence that post-secondary education pays

12
off for GED holders as well as for high school graduates. However, in their sample, Murnane
et al., found that only some 8 per cent of GED recipients had completed two years of college
by age 27.
In interpreting this evidence it should be noted that many of the people obtaining
GED certification in these datasets are actually quite young when they do so, often in fact
only a little older than those who complete high school and graduate in the conventional way.
Studies of the outcomes of GED certification, then, only partially relate to adult learning.
A study by Hill (2001) focuses more specifically on the outcomes associated with
learning by mature students. She used US data from the National Longitudinal Survey (NLS)
Mature Women’s Cohort to examine the labour market effects of education and training on
women at pre-retirement ages. The cohort were first interviewed in 1967 when they were
aged between 30 and 44, and they were followed up at various dates up to 1984, when the
most senior of them were on the verge of retirement. The sample with pay data for 1984
consisted of some 3,422 women. Various waves of the survey asked about post-school-age
education and training, and by 1984, 62 per cent of the women had one or more incidents of
this (‘usual schooling age’ was defined as whatever age the respondent ceased going to
school full-time). Broken down by type of training incident, 26 per cent had received formal
education, 32 per cent on-the-job training, and 42 per cent other training.
A probit analysis found that several characteristics were significantly associated with
the likelihood of receiving any of these types of education and training during the survey
period; these included age, with older respondents obtaining less training. Those who had
received education and training after leaving school but before 1967, and those at higher
education levels were more likely to report education and training by all methods more
frequently than less educated women.7
As for wage effects, Hill reports equations with the log of the 1984 wage level as the
dependent variable, and including a Heckman selectivity model to control for the fact that not
all women were working in 1984. Younger women, those with more work experience and
women who lived outside the south tended to experience higher wages than other women.
All types of training obtained at early ages (prior to 1967) were associated with higher wages
in 1984. When occupational dummies were included, only those who received on-the-job
training between 1977 and 1984 were found to obtain higher wages. The other
education/training variables – formal education 1967 to 1984, and other training 1977 to 1984
7 These results included controls for work experience, marital status, and ethnic background.

13
– were not significant in the wage equation. However, when the occupational dummies were
omitted, both education 1967 to 1984, and on-the-job training 1977 to 1984 were found to be
significant, while other training remained insignificant. This may suggest that adult
education pays off by enabling women to shift into better-paying occupations. An equation
for the change in wages 1967 to 1984 again found that on-the-job training was significant,
while other kinds of education/training were not. In general, Hill’s results show that on-the-
job training was strongly associated with higher wages and wage growth, while there was
also some evidence for a positive relationship between adult education and wages.
A review of the literature on the economic benefits of vocational training by Barrett
and Hovels (1998), which examined studies from both the United States and Europe, found
that there were no papers reporting formal rates of return but a range of papers assessing the
wage and productivity changes associated with vocational training. Generally, vocational
training was found to have positive effects on wages and on productivity in most of the
research surveyed, and there was some evidence that, for those employees changing jobs,
training received from one employer increased productivity and wages with another employer
also.
2.7 Summary The main conclusion must be that research on the economic returns to lifelong learning has
only begun to be undertaken in the last few years, and that there is still a real shortage of
work in this field. For the UK such studies as exist concentrate on the returns obtained by
mature graduates. The evidence here shows that mature graduates do achieve higher earnings
as a result of their studies. However, most available studies suggest that the returns to a
degree for mature graduates are lower than for early graduates. Whether mature graduates
gain sufficiently to make learning a worthwhile investment remains undecided, with one
recent study suggesting that it may not be a good investment for many mature graduates, at
least when returns are measured solely in income terms. There is an absence of work on the
returns to other kinds of qualifications for adult learners in the British economy, and on
learning that may not result in a qualification. In this paper we focus particularly on the
former issue.

14
3. Methodology
In this paper we attempt both to explain participation in key types of lifelong learning,
specifically participation which leads to a qualification, and to estimate the wage and
employment returns to qualifications acquired in adult life, specifically between the ages of
33 and 42. Our exploration of the determinants of the decision to undertake lifelong learning
is modelled using a probit model, where the dependent variable takes the value of one if the
respondent acquired a qualification between 1991 and 2000, and zero otherwise. We then
estimate OLS wage equations, where the dependent variable is log earnings in 2000, which
we try to explain by (amongst many other factors) any qualifications acquired through
lifelong learning between 1991 and 2000. We also estimate OLS equations for the change in
real log earnings between 1991 and 2000, and investigate the impact of lifelong learning on
the extent of this change in wages. As for the effect of lifelong learning on employment in
2000 this is modelled using probit models, where the dependent variable takes the value of
one if the person is employed (in full- or part-time work) in 2000, and zero otherwise.
Note that, throughout the paper, we distinguish between a range of qualifications
obtained between 1991 and 2000, but we do not attempt to allow for variations in the time
elapsed since the lifelong learning qualification was obtained, i.e. we do not differentiate
between an individual who got, say, an ‘A’ level in 1993 and someone who got their ‘A’
level in 1997. The returns to qualifications which we estimate will therefore be averages, in
terms of time elapsed, over the period 1991 to 2000. Not taking account of the time elapsed
since obtaining the lifelong learning qualification may bias results. Assume, for example,
that the benefits of lifelong learning only become apparent five years after acquiring the
qualification. Then if in our sample, most qualifications were acquired early in the period
(close to age 33) the benefits of these qualifications will be quite obvious. If however, most
qualifications were acquired close to the end of the period (age 42), then we may not be able
to measure any apparent benefit. Our approach is a convenient simplification, given the data
currently available, but the time elapsed since obtaining the qualification is an issue which we
hope to explore further in future research.
A methodological issue that must be faced is the question of endogeneity bias. As has
been discussed in the literature (Blundell et. al., 1999 and 2001; Card, 1999) standard OLS
estimates of the wage returns to different qualifications may be biased. For example,
estimates may be upward biased due to ability bias or downward biased due to measurement

15
error. Upward ability bias occurs if more able individuals, who would earn more as a result
of being more able, also undertake more education. If one does not allow for their ability in a
model of wages, some of the positive effects associated with education will actually be due to
the greater inherent ability of the individual. In the context of our study, we are most
concerned that individuals who undertake lifelong learning are not a random subset of the
population. They may be more motivated and inherently more able, characteristics that may
themselves increase individuals’ wages and make them more likely to be employed. The bias
may however, be in the opposite direction. For example, lifelong learning may be largely
undertaken by those who missed out on adequate schooling first time around. Thus it may be
the most disadvantaged individuals who undertake lifelong learning, and they may have other
characteristics that depress their employment prospects.
To overcome the potential endogeneity of lifelong learning we use two separate
strategies. Firstly, we attempt to adequately control for factors that influence both the
likelihood of undertaking lifelong learning and also an individual’s employment prospects.
Using the extremely rich NCDS data, we condition for a large number of individual
characteristics in our wage and employment equations, thus attempting to control for all
factors that determine wages, other than lifelong learning itself, that are either observable or
well proxied by observable variables. We also attempt to allow for heterogeneity in our
modelling. We extend the basic OLS model to allow interactions between a person’s
characteristics and their participation in lifelong learning. Specifically, we investigate
whether the wage return to lifelong learning varies according to the initial education level of
the individual. Previous work has also suggested that these ability interactions are likely to
be particularly important. For example, Dearden et al., (2000) showed that certain vocational
qualifications had a higher pay off for lower ability individuals.

16
Our second strategy to overcome the potential problem of endogeneity of the lifelong
learning variables is to use a first difference equation. This utilises the panel nature of the
NCDS data, to allow for unobservable but fixed characteristics. Basically the strategy is to
estimate the effect of lifelong learning on the change in wages between 1991 and 2000. If an
individual is inherently more able and therefore likely to both earn more and undertake
lifelong learning, this unobserved ability is assumed to be the same in 1991 and 2000. By
focusing on the effect of lifelong learning on the change in wages between these two dates,
any unobserved fixed characteristics cancel themselves out. Suppose that the earnings of
individual i at time t (yi,t) can be written as
tiititiiti vuecxbfay ,,,, ++⋅+⋅+⋅= ., for t={1,2}
Here earnings depend on observable characteristics that are fixed (fi), for example gender;
observable characteristics that may change (xit), such as sector of work; a person’s education
level (eit) which may change over time (lifelong learning). The final two components of the
model are unobserved characteristics, with u representing an individual fixed capacity to
obtain earnings and v an unobserved source of heterogeneity across individuals and time
which is unrelated to any of the other variables.
The individual specific unobservable components (the ui terms) are likely to be
correlated with the observable characteristics we want to include as regressors. For example,
some dimensions of unobserved ability will affect earnings and may also be related
simultaneously to factors such as parental background information and job characteristics that
we do observe. The first differencing technique takes care of this since all the fixed factors
drop out of the equation. By first differencing, we obtain an expression for the changes in
earnings throughout the period.
)()()( 1,,1,,1,,1,, −−−− −+−⋅+−⋅=− titititititititi vveecxxbyy
This equation satisfies the assumptions required for OLS estimates to be consistent. Under
the assumptions that the changes in educational attainment (through lifelong learning) and the
changes in other observable time varying characteristics (such as marital status) are not
correlated with changes in unobservable characteristics, we can obtain more reliable
information on the effects of lifelong learning on an individual’s earnings than by simply
using the level of earnings in 2000.

17
However, it is worth noting that this method also has some disadvantages. Firstly, the
effects of any fixed observable variables are not identified, as they will be dropped from the
expression after first differencing. Secondly, standard errors will be larger and the statistical
significance of the estimates considerably reduced when the sample size is small.
Another analytical technique that we utilise in this paper is the matching approach.
Ideally, we wish to compare the earnings of individuals who do not undertake lifelong
learning with the earnings of the same individuals if they were to undertake lifelong learning.
However, we can only observe the earnings of a particular individual with or without lifelong
learning, not both. Matching methods are an alternative way to identify this hypothetical
difference in earnings between those with and without lifelong learning. Each individual who
has undertaken lifelong learning is matched to an otherwise extremely similar individual who
has not undertaken lifelong learning. Their earnings are then compared and the difference
attributed to lifelong learning. Individuals can be matched on each individual characteristic,
such as ability, gender, ethnicity etc. Alternatively, as here, one can model the likelihood or
propensity of an individual to undertake lifelong learning. Each individual who has not
undertaken lifelong learning is then assigned a propensity score and matched with an
individual with a similar score who has undertaken lifelong learning. Again, the difference in
their earnings is attributable to lifelong learning.
Other methods to overcome the potential endogeneity of lifelong learning include the
use of instrumental variables and other techniques summarised in Blundell et al., (2001).
Some proved impossible with our data. For example, we were unable to find instruments that
satisfied the necessary statistical criteria; i.e. we could not identify factors that influence the
propensity to undertake lifelong learning but do not influence earnings. However, future
work on this issue would need to explore the endogeneity issue further.
4. Data
Most of the data used in this paper come from the National Child Development Study
(NCDS). The NCDS is a continuing longitudinal survey of people living in Great Britain
who were born between 3 and 9 March 1958. Members of the NCDS cohort have been
interviewed six times, the last full survey having been undertaken in 2000 when the cohort

18
members were 42 years of age. A description of the samples obtained from each of these
surveys is given in Table 18.
We focus particularly on changes in individuals’ academic and vocational
qualifications that occurred between the 1991 sweep of the NCDS (age 33) and the 2000
survey (age 42). Hence our definition of lifelong learning is largely determined by the nature
of the NCDS data and is based on whether an individual acquired a qualification between
sweeps 5 and 6 of the NCDS survey.
The huge advantage of using the longitudinal NCDS data is the richness of the
information held about each cohort member, which includes their ability at the age of 7
(scores on tests taken in reading and mathematics), school and family background variables
(parents’ interest in child’s education, parents’ education, father’s social class, indicators of
financial difficulties and type of school). This array of data enables us to be more successful
in separating out the effect of lifelong learning on labour market outcomes from the effect of
other factors, such as early ability and initial education levels.
We investigate the impact of lifelong learning that occurred between 1991 and 2000
on the individuals’ employment outcomes in 2000, namely their wages and likelihood of
being employed. In addition, we are able to use labour market information from the 1991
survey to estimate a first difference equation (see below) and check the robustness of our
results. We drop from our sample self-employed individuals, those with missing
observations on wages in 1991 and 2000, those who did not sit ability tests at the age of 7 and
those with missing data on their qualifications. We also drop individuals who are in full-time
education. This yields a sample of 5127, although in most of the wage equations, due to
missing data on the explanatory variables, the sample is just 4382 (2378 males and 2004
females). For the estimates of employment effects we looked separately at a sample of 4,941
people who were in the labour market in 1991, and at a sample of 1,633 who were out of the
labour market in 1991.
In order to explore the impact of lifelong learning, we first coded the qualifications
acquired between the ages of 33 and 42 using the official National Qualifications Framework,
which distinguishes three types of qualifications, each with five levels. The categories used
are shown in Table 2.9 Although this framework produces a large number of different
8 Attrition from the NCDS (up to sweep 5) and the possible bias that may result are discussed in Ferri (ed.), (1993). 9 This coding is based on the National Qualifications Framework developed by the Department for Education and Skills and the Qualifications and Curriculum Authority. Qualifications not formally assigned to the

19
categories, it has the advantage of more precisely identifying the type of qualification
acquired. This proved very useful in understanding our estimation results.
Table 3 reports the numbers obtaining qualifications within each category. Although
only small numbers of individuals took each specific category of qualification, overall, as
much as one third of the cohort acquired a qualification of some description during the 1991-
2000 period. In the raw data 31 per cent of males and 37 per cent of females in the sample
undertook lifelong learning, according to our definition. Our estimates are somewhat lower
than the results of both the NIACE and NALS surveys. Recall however, that, compared to
those surveys, the definition of lifelong learning being applied here is relatively narrow,
namely that an individual acquired a recognised qualification between the ages of 33 and 42.
Most qualification-oriented lifelong learning led to occupational qualifications, rather
than academic or vocationally related qualifications. In particular, 16 per cent of the sample
obtained occupational qualifications at level one of the framework. These include NVQ level
one, lower level RSA qualifications and other low level qualifications such as Pitmans level
one and HGV licences. Some 7 per cent of the sample obtained occupational qualifications at
level two, which include City and Guilds part one and NVQ level two qualifications.
Relatively small numbers took academic qualifications between the age of 33 and 42,
the exception being the approximately 200 respondents (4 per cent of the sample) who
undertook a degree. Even fewer cohort members obtained vocationally related qualifications
such as BTEC diplomas and GNVQs.
Other descriptive statistics are given in Table 4, although it is noteworthy that most of
the variables (such as mean wages) do not differ significantly between the group that
undertook lifelong learning and the group that did not. However, those who undertook
lifelong learning between 1991 and 2000 were more likely to be in full time employment,
particularly amongst women. Those undertaking lifelong learning did appear to have higher
levels of initial qualifications, an issue we explore in more detail in the next section. We did
not find statistically significant differences in the ability or social class of the group who
undertook lifelong learning and the group that did not. This is encouraging in that it hints
that ability bias may not be a major issue, although this hypothesis is tested rigorously below.
Framework were aligned with their nearest equivalent. Advice on how best to do this was received from individuals in the DfES, the QCA and City & Guilds, and is gratefully acknowledged.

20
5. Participation in Lifelong Learning
5.1 Who is undertaking lifelong learning?
Table 5 shows the results of modelling the decision to undertake lifelong learning, (defined as
throughout the paper as learning between the ages of 33 and 42 and leading to a
qualification). The model is a standard probit, and the table shows the marginal effects of
each variable on the probability of undertaking lifelong learning, as we have defined it.
Initially, we estimated the model for males and females combined (Table 5), before showing
results separately for each gender (Tables 6 and 7). Our basic estimation strategy was to start
by considering the effect of a person’s initial qualification level (i.e. up to age 33) on the
likelihood of that person undertaking lifelong learning between the ages of 33 and 42. Then
we sequentially added various background factors to the model. Specifically, we added
variables describing the person’s attainment in mathematics and reading at age 7, the type of
school they attended, their parents’ own education and social class, as well as their parents’
interest in their child’s education. Lastly we added three variables describing the labour
market position of the individual in 1991, i.e. their sector of work (public or private sector),
size of firm and whether the respondent was a union member.
Column 1 of Table 5 indicates that initial education level is an important determinant
of the likelihood of undertaking a further qua lification as an adult10. The base case in this
equation is having no initial qualifications. Generally the higher the level of qualification in
1991, the more likely a person is to undertake lifelong learning. This, along with the
descriptive statistics in Table 3, suggest that a significant proportion of lifelong learning can
be characterised as more educated individuals undertaking occupationally related
qualifications, perhaps partially funded by their firms11. However, among the post-school
qualifications obtained prior to 1991, while vocational qualifications generally have a
significant effect of raising the probability of engagement in lifelong learning, surprisingly
10 Note however the overall low predictive power of this equation. We were unable to explain a lot of the variation in the decision to undertake lifelong learning. 11 As yet we have no hard evidence on the extent to which lifelong learning is funded by employers (either directly or indirectly by allowing time off for study). However, most lifelong learning in the NCDS does appear occupationally related and is focused on the types of courses that are often partially funded by employers. Further work is needed on this issue.

21
having obtained a degree does not appear to have any positive effect on lifelong learning.
Females are six percentage points more likely to undertake lifelong learning12.
These results remain robust when a myriad of background factors are added to the
model. By and large family background and type of school attended do not have an effect on
whether someone undertakes lifelong learning (column 2 Table 5). Reading attainment
(assessed at age 7) also does not make a significant difference to the probability of an adult
acquiring a qualification. However, mathematical attainment at age 7 does seem important.
For example, those in the top quintile of mathematical attainment at age 7 have a 5-
percentage point higher probability of undertaking lifelong learning. This is consistent with
the view that it is the more educated and able workers that are undertaking lifelong learning,
rather than those who missed out on school qualifications the first time around.
Parental interest in the child’s education also appears to have an impact, although
interpreting these results is difficult. Specifically, children whose fathers had some interest
in, or who were very interested in, their education (as compared to those with fathers who
were not interested) are less likely to undertake lifelong learning. Yet children with mothers
who had some interest in their child’s education (as compared to none) are more likely (by 4
percentage points) to undertake lifelong learning.
Lastly, in column 3 of Table 5, we added sector, firm size and union variables. The
data tell us about whether a worker was in the private or public sectors, a large or small firm,
and a unionised or non-unionised environment in 1991 and in 2000, but not in the intervening
period. Clearly, many workers will have changed jobs between 1991 and 2000, and some of
them will have done so before they obtained their lifelong learning qualifications. Hence
using the data from 1991 on sector, firm size, and union environment is an imperfect measure
of where workers were located when they did their lifelong learning. Future research will
attempt to construct work histories, which will provide better measures, but for the moment
the 1991 data are the best available and we utilise them. Bearing these caveats in mind, the
results suggest that individuals who worked in a large firm (more than 500 workers) in 1991,
and those who were union members, were around 6 percentage points more likely to acquire
a qualification between the ages of 33 and 42. Those working in the public sector in 1991
were three percentage points more likely to have obtained qualifications between age 33 and
12 This finding contradicts evidence from NIACE (Sargant et al., 1997) and possibly some of the evidence from NALS (Beinart and Smith, 1998). In the NALS females were less likely to undertake vocational learning but more likely to undertake non-vocational learning.

22
age 42. Again, this evidence is consistent with more educated/able workers who work in
large unionised and/or public sector firms undertaking more occupationally related training.
Tables 6 and 7 show similar models, for males and females separately. For males
(Table 6), it is school qualifications that have the largest apparent impact on the decision to
undertake lifelong learning13. Attainment at age 7 (in mathematics or reading) does not seem
to matter. Most of the family background variables are insignificant, although men from a
semi-skilled manual background are actually less likely (by 10 percentage points) to
undertake lifelong learning, as compared to the comparator group - those whose parents were
unskilled. For males, having a father who was very interested in their child’s education has a
negative effect on the probability of lifelong learning. However, the most consistently
significant variables in the model for males, other than school qualifications, are firm size and
union membership in 1991. Males who were in large firms in 1991 and who were union
members in 1991 are 5 percentage points more likely to acquire a qualification later in life.
Male public sector workers are 4 percentage points more likely to undertake lifelong learning,
although this is only significant at the 10 per cent level.
For females (Table 7), school qualifications are extremely important. Indeed school
qualification levels have a bigger impact on the likelihood of lifelong learning for women.
Some post school qualifications also have a big positive impact on the likelihood of
undertaking lifelong learning. Mathematical attainment at age 7 is also an important
determinant for women (but not for men). Women from higher social classes are also more
likely to undertake lifelong learning. The parental interest variables are confusing to interpret
for women. Some fatherly interest in a respondent’s education seems to have a negative
effect, as does having a mother who expects too much of her daughter, in terms of education.
Once again firm size and union membership in 1991 have a large positive impact (7
percentage points) on the likelihood of undertaking lifelong. Sector of work (again as
measured in 1991) does not matter for women.
5.2 Repeat spells of lifelong learning
The issue of repeat spells of lifelong learning was also investigated. We wanted to test
whether an individual who undertakes some lifelong learning is likely to come back for more.
We modelled this as a zero/one binary choice. Table 8 shows the results from a probit model
13 This is consistent with evidence from both NIACE and NALS (Sargant et al., 1997; Beinart and Smith, 1998).

23
where the dependent variable is equal to one if the person is a current learner (on a course
leading to a qualification), and zero otherwise. All coefficients are given as marginal effects.
About 11 per cent of the sample are current learners. Slightly fewer males are current
learners (10 per cent), as compared to women (12 per cent).
Obviously many factors determine whether an individual undertakes lifelong learning,
as we discussed earlier in this section. However, we are most interested in the impact of prior
lifelong learning on current lifelong learning. We therefore include a dummy variable
indicating whether the person acquired a qualification between 1991 and 2000, i.e. our usual
lifelong learning variable. Hence the model tests the impact of acquiring a qualification
between 1991 and 2000 on the likelihood of being a learner in 2000. The model also allows
for whether the person has failed a qualification as an adult, as well as their initial education
level (in 1991), gender, ability at age 7, school type, parental education and social class,
parental interest in the respondent’s early education, whether (in 2000) the worker is
employed in a large firm, is a union member and works in the public sector.
The results are consistent for males and females.14 A person who acquired a
qualification between 1991 and 2000 was 11 percentage points more likely to be a learner in
2000. Individuals who failed a qualification during the same period were three percentage
points less likely to be a current learner. Of the other explanatory variables, school
qualification levels remain important for women only. The higher the level of the woman’s
school qualifications, the more likely she was to be a learner in 2000, even after controlling
for the effects of lifelong learning in the 1991 to 2000 period. For males in particular, firm
size, union membership and sector of work are important determinants of being a learner.
Specifically men who worked in a large firm or who were union members in 2000 were 3
percentage points more likely to be a current learner. Males in the public sector were four
percentage points more likely to be a current learner. For women these variables were not
significant.
5.3 Summary
In general how well a person does at school does determine the likelihood of them acquiring
a qualification later in life, particularly for women. The more qualified you are when you
leave school; the more likely you are to go back to learning and obtain another qualification.
24
Women are also, on average, more likely to return to learning later in life. Most family
background factors do not have a large impact on the probability of acquiring qualifications
late in life, although more able women (as measured by mathematical attainment at age 7) are
more likely to undertake lifelong learning. However, it is the nature of the person’s
employment that seems to be particularly important in determining whether they acquire
qualifications later in life. Working for a large firm, being a union member and being in the
public sector all make it more likely that someone will gain a qualification as an adult. This
might be because larger, unionised and public sector organisations are more likely to fund
adult learning, or at least give workers time off to study. It may also be related to the greater
likelihood of large firms to offer, and to utilise, formal occupational qualifications. These
issues require further investigation. Our results also show that having undertaken lifelong
learning in the past has a positive and substantial effect on the probability of being a current
learner.
Some caution is required. The equations in Tables 5-7 might seem to imply that
lifelong learning, at least in the 1990s, was about improving the occupational skills of the
most educated, rather than a means of giving a second chance for those who missed out
educationally first time around. However, the model does not explain a great deal of the
variation in individuals’ likelihood of undertaking lifelong learning. Certainly further work is
needed to try to explain the motivation behind individuals’ decisions to undertake lifelong
learning.
6. The Effects of Lifelong Learning on Wages
6.1 Wage equations
Table 9 gives results from standard OLS wage regressions. The dependent variable is log
wages in 2000, and we attempt to explain earnings at age 42 by a number of factors,
including whether the person has undertaken lifelong learning between age 33 and age 42.
The base case is someone who undertakes no lifelong learning during this period i.e. we are
comparing the wage levels of those undertaking lifelong learning with those who do not, and,
as before, sequentially adding in controls for a range of other factors. We start by
14 They are also consistent with other studies which adopt different definitions of lifelong learning to the one

25
considering males and females together15. Column 1 presents the results from a model that
only includes gender and a series of lifelong learning dummy variables indicating the specific
qualifications (see Table 2) acquired by the individual between 1991 and 2000.
The results confirm, in line with the rest of the literature, that females are, on average,
paid nearly 40 per cent less than males. However, it is the lifelong learning variables that are
of primary interest. Interestingly those acquiring academic level 1 qualifications (CSE or
equivalent) between 1991 and 2000 actually earn 40 per cent less than those who do not
acquire any qualifications at all. Note however, that this specification does not attempt in
anyway to control for any other factors influencing wages. Hence it may be that individuals
who take these low-level academic qualifications have other characteristics that make them
low paid, such as innate ability or different prior work histories. Acquiring academic level 4
and 5 qualifications as an adult is associated with sizeable raw wage premiums, namely 13
per cent and 38 per cent respectively.
Low level vocationally related qualifications, e.g. foundation GNVQ, appear to yield
a positive wage premium (27 per cent), although the number taking this category of
qualification is so small (only six individuals) that no secure generalisations can be advanced.
Those taking vocationally related level 2 qualifications (e.g. BTEC first certificate) actually
earn 10 per cent less than those who take no qualifications. Lower level occupationally
related qualifications (such as NVQ1 and NVQ2) yield a negative wage premium, whilst
higher- level occupational qualifications (such as NVQ4 and professional qualifications at
NVQ5) yield sizeable 12 per cent and 19 per cent wage premiums respectively.
These results however, do not control for the numerous other factors that influence
earnings. Column 2 adds prior qualification level to the model, i.e. qualifications held in
1991. Prior qualification levels are very important determinants of earnings, as one would
expect. However, here we focus only on the effect on the lifelong learning variables from
adding these prior qualifications to the model. Basically, the magnitude of some coefficients
on the lifelong learning variables is reduced. In particular, higher- level academic
qualifications yield only a 5 per cent wage premium (level 4) and a 13 per cent wage
premium (level 5) respectively. Thus some of the high wage premium associated with high
used here – for example the most recent NIACE survey (Aldridge and Tuckett, 2001). 15 In this preliminary work, we have not allowed for the selectivity of women in the labour market. However, it is possible that women who are observed in work in 2000 are not representative of the entire female NCDS cohort. There may be factors that determine whether a woman works or is out of the labour market and these same factors may influence wages. Furthermore, in the context of lifelong learning, there may be domestic factors that simultaneously influence whether a woman works and whether she undertakes lifelong learning. This requires further investigation (see Section 7).
26
level academic lifelong learning is actually due to the fact that individuals who are already
more educated tend to undertake this type of lifelong learning. The coefficients on the higher
level occupationally related lifelong learning variables are also reduced in magnitude and
remain significant only at the 10 per cent level.
Adding family background variables and early attainment variables to the model
further reduces the effect of the lifelong learning variables (column 3 Table 9). Specifically,
level 4 and 5 academic qualifications acquired as an adult now yield a 5 per cent (significant
at 10 per cent level) and 12 per cent wage premium respectively. Academic qualifications at
level 3 now appear to yield a negative and statistically significant earnings premium of some
15 per cent for those who undertake them. This result is quite surprising. It indicates that
even allowing for the ability and initial education level of the worker, some lifelong learning
appears not to ‘pay off’ in the labour market. This may be because workers who undertake
these qualifications actually undertake them for reasons unrelated to their job, perhaps for
their own enjoyment. Such workers may need to be in less stressful and demanding jobs (and
may therefore be lower paid) in order to find the time to undertake lifelong learning for non-
job related purposes. However, at present this is speculation and serves to underscore the
difficulty of interpreting these results in the absence of contextual information about the
individuals undertaking the qualifications, such as their work histories. Clearly further
exploration of these matters is needed. Vocationally related level 1 qualifications continue to
have a large positive effect (26 per cent) but the numbers taking this category of qualification
are too small for one to be confident of this result. The positive wage premium associated
with occupationally related level 4 and 5 qualifications is just 5 to 6 per cent (significant at
the 10 per cent level only). These findings may suggest that some of the apparent value of
lifelong learning is due, not only to more educated workers undertaking lifelong learning, but
also to more able workers, and those with more positive family background factors being
more likely to undertake late learning.
Lastly, in column 4 (Table 9), variables describing the person’s current work are
included, namely union membership, firm size and firm sector. These variables have been
found to be important determinants of earnings (e.g. Hildreth, 1999; Green et al., 1996; Rees
and Shah, 1995; Choudhury, 1994). Furthermore, we found earlier that public sector workers
are more likely to undertake lifelong learning. Since public sector pay is lower for other
reasons, we need to allow for sector in our model. Only then can we be sure that we are
identifying the wage effects of lifelong learning, as opposed to the (negative) wage effects of
being in the public sector. Again, we only focus on the effect that adding these variables to

27
the model has on the lifelong learning variables. In fact although the sector, firm size and
unionisation variables are clearly important, they do not have a major effect on the
coefficients of other variables, including the lifelong learning variables. In this final
specification, those acquiring low-level academic qualifications (level 1 – CSE or equivalent)
still earn less (31 per cent) than those who do not do any lifelong learning at all. The
puzzling negative effect of level 3 academic qualifications, discussed earlier, continues to
hold.
By and large only those acquiring very high- level academic qualifications (level 5)
earn a wage premium from their lifelong learning (11 per cent). Low-level occupationally
related qualifications (NVQ1 and NVQ2) still result in a wage penalty (3 per cent and 8 per
cent respectively). Higher- level occupational qualifications no longer yield a wage premium
that is significant.
Tables 10 and 11 show results for males and females separately. In the final
specification (Table 10 column 4), males who undertake academic level 1 qualifications (an
admittedly small group) earn 60 per cent less than those who do no lifelong learning at all.
The effect for women from this qualification is negative but insignificant. For women,
acquiring an A-level (academic level 3 qualification) is associated with lower earnings (by 19
per cent). However, an academic level 4 qualification, i.e. a degree, boosts earnings by 7 per
cent. For males, obtaining a GCSE Grade A*-C boosts earnings by 15 per cent, as does
obtaining an academic level 5 qualification, which also has a wage premium of around 15 per
cent.
Comparing the results obtained for men and for women suggests that there are many
similarities, but also some important differences. Level 1 vocationally related qualifications
yield a premium for men and women of 31-32 per cent, although this result is not robust due
to small numbers. Level 2 occupational qualifications (NVQ2) yield a negative wage
premium of 11 per cent for men and 6 per cent for women, as compared to those who take no
qualifications at all. Higher- level occupational qualifications do not pay off for men, and
while level 4 occupational qualifications yield a positive significant premium (of 9 per cent)
for women.
6.2 Interaction effects
Table 12 shows the effect on wages from interacting each individual’s prior qualification
level (i.e. in 1991) with a single dummy variable indicating whether the person undertook

28
lifelong learning between 1991 and 2000. This tests whether lifelong learning (crudely
measured by a single dummy variable) yields a wage premium that varies with the person’s
initial level of education. Unfortunately sample sizes were too small to interact each lifelong
learning dummy with each prior qualification variable. Three specifications are shown;
males and females combined, males only and finally females only. In each model full
account is taken of prior qualification level, early ability, family background, parental interest
in the child, job characteristics in 2000 etc. The first overall lifelong learning variable
attempts to measure the average effect of undertaking lifelong learning on wages. It is
insignificant in all cases. In terms of the interactions, males who had a higher vocational
qualification (HND) already in 1991 and who then undertook lifelong learning between 1991
and 2000 actually earn 18 per cent less than those who undertook no lifelong learning at all.
6.3 First difference equations
In order to explore the endogeneity issue we estimated first difference equations, as discussed
in the methodology section above. The results are shown in Table 13. The only explanatory
variables that we include are the lifelong learning variables. This is because only factors that
change over the period 1991 to 2000 should be included, such as education level16. Again the
model is estimated for males and females combined, then separately for males and females.
For males, the vocationally related level one qualification is still yielding a positive
and significant coefficient. This is consistent with our main results, namely that lifelong
learning that results in a level one vocationally related qualification does boost earnings.
However, tiny small sample sizes for this category (only six members of the whole sample
took such a qualification) mean that this result is not at all robust. Again consistent with our
main results, for males, occupational level one and two qualifications (which were taken by
sizeable numbers of people in our sample) actually reduce earnings significantly. However,
unlike our main results, we find no positive and robust earnings effect from lifelong learning
for males at all, not even if the lifelong learning led to higher- level academic qualifications.
This hints that the apparently positive effect from academic level five qualifications that we
found in Table 10 may be because individuals with unobserved qualities that make them
likely to earn more also are more likely to undertake this higher level lifelong learning.
16 Other factors may change too but we have not yet been able to code up the 2000 NCDS data to allow for other things that may also be changing over the period.
29
Women who undertake lifelong learning leading to academic level three (A-levels) or
level five (higher degree) qualifications actually experience slower earnings growth over the
period. The first of these findings is consistent with the results in our wage level regressions,
but the results for academic level 5 is the reverse of that found in our wage level regressions.
Generally the positive wage effects found in our main results do not hold up using this first
difference specification. This leads to the suspicion that endogeneity bias may have
generated some of the apparent wage gains from certain qualifications. Further investigation
of this issue is needed, especially once we are able to look more closely at other observable
life and work history variables that have not as yet been coded for the 2000 sweep of the
NCDS data.
6.4 Wage effects by educational attainment in 1991
One potential problem with the estimates discussed in section 6.1 is that they do not control
for actual work experience or job tenure effects on wages. Even though all the individuals in
the NCDS sample are the same age, there will still be variation in the amount of work
experience that they have obtained. At present, it is not possible to control for work
experience or job tenure because the data are not yet available.17
We estimated wage regressions separately for each initial educational group, with the
results shown in Table 14. This method helps to reduce the size of the bias created because
we are unable to directly control for work experience or job tenure. Individuals with similar
levels of initial education will have had similar amounts of time out of the labour market for
study and will therefore have similar amounts of work experience. In addition, we are
controlling for the fact that lifelong learning will have different impacts for individuals with a
different educational attainment at the beginning of the period in which we are considering
learning decisions. We can therefore interpret the estimates in Table 14 as the effect of a
particular type of lifelong learning undertaken between 1991 and 2000 on a representative
individual from a group with a given level of initial education and a typical career path until
1991. The initial educational groups used are individuals with no qualifications; those with
CSEs; those with between two and five O levels; those with more than five O levels; those
with A-levels; those with a degree/higher degree.
17 The construction of life histories for the NCDS cohort is a task intended to form part of the research programme of the CEE and WBL research centres in the near future.

30
When using this method the results are somewhat limited by sample sizes, which can
affect the significance of estimates. To overcome this, we use more aggregate measures of
lifelong learning. Firstly, we use indicator variables that take a value of one for each distinct
type of lifelong learning between 1991 and 2000, namely, academic, vocationally related and
occupational lifelong learning. A second alternative measure used simply indicates whether
any lifelong learning took place during the period from 1991 to 2000 (this is reported in
Table 15). All estimations also control for whether the individual is currently undertaking
lifelong learning.
The estimates in Table 14 suggest that those with no qualifications obtain some
earnings benefits from lifelong learning undertaken between 1991 and 2000.18 In fact, for
those with no qualifications, academic learning brings rewards, and the interaction terms in
the equation imply that this effect is strongest for those with the higher maths attainment
scores at age 7. The results suggest that those with the highest qualifications who have
undertaken occupational or vocationally–related qualifications between 1991 and 2000
appear to obtain negative rewards for their efforts.
Table 15, which utilises a more aggregate measure of lifelong learning, also reports
some effect of lifelong learning on earnings for those with no qualifications in 1991. Among
those who had no qualifications in 1991, undertaking lifelong learning leading to a
qualification between 1991 and 2000 delivered a wage premium of about 12 per cent,
although this effect was only significant at the 10 per cent level. Lifelong learning did not
have a significant impact on the wages of other groups, except for those with degrees/higher
degrees. Here there appears to be a large negative effect associated with lifelong learning but
positive effects for those in the upper quintiles of mathematical attainment at age 7. Since
most of the people with a degree/higher degree are likely to be in the upper quintiles of maths
attainment, this suggests that there is only a small net negative effect for those in this
category undertaking lifelong learning, perhaps because the kind of courses taken by people
with degrees in 1991 could well be recreational courses or PhDs which would not lead to
increased earnings.
We also investigated the changes in earnings between 1991 and 2000 by the extent of
educational attainment in 1991. The mean changes, comparing lifelong learners and those
not engaged in lifelong learning are reported in Table 16. Generally the differences between
18 Note that we have included regional dummies (according where the individual lived in 1991) as additional controls in these equations. The base category for region is London.

31
the lifelong learners and those who did not participate in lifelong learning are quite small and
mostly insignificant. The exceptions were that females with more than five ‘O’ levels who
undertook lifelong learning had significantly faster wage growth than females with more than
five ‘O’ levels who did not undertake lifelong learning, and males with higher degrees who
engage in lifelong learning between 1991 and 2000 also had faster wage growth than males
with higher degrees who were not lifelong learners in this period. Table 17 reports the
impact of lifelong learning on wage changes in regression models for each level of
educational attainment. The lifelong learning variables are generally insignificant in these
equations, with the exception of those with CSEs in 1991 who were current learners in 2000.
Finally, we attempted to analyse the differences in wage growth between lifelong
learners and non-participants in lifelong learning using a matching approach (Table 18). The
intuition behind the matching estimator is that we would like to identify the effect of lifelong
learning by comparing individuals who obtain some type of qualification with individuals
who only differ from the former in terms of the learning outcome. It can be shown that, in
many cases, it is sufficient to compare individuals (learners and non learners) who have a
very similar propensity to be learners. The practicalities of this are that we firstly model the
decision to undertake learning, as discussed in section 5 above, in order to obtain estimates of
the probability of participating in learning for each individual. Then, for each learner in the
sample, we try to match them with a comparable individual who did not undertake learning in
the 1991 to 2000 period but who had a similar probability of participating given the
information which we have on their other characteristics, such as family background, initial
schooling, region and so on. Our assessment of the impact of learning is again based on the
change in earnings between 1991 and 2000, comparing the matched learners and non-
learners.
The results in Table 18 reveal that those people with no qualifications, people with
more than five O levels, and people with degrees/higher degrees who had undertaken lifelong
learning experienced wage growth of nine to 10 per cent more over the years 1991 to 2000
than their respective equivalents who had not participated in lifelong learning. However,
these differences were not statistically significant for the groups with no qualifications or
those with degrees, but were significant for the group with more than five O levels. There
was no evidence that lifelong learners in any of the educational groups had experienced
slower wage growth than people who had not undertaken lifelong learning.

32
6.5 Summary
The most encouraging finding of our analysis of the NCDS data was that those with no
qualifications in 1991 who undertook lifelong learning leading to a qualification between
1991 and 2000 obtained higher earnings than those with no qualifications in 1991 who did
not engage in lifelong learning (on this definition) between 1991 and 2000. Other evidence
of positive effects of lifelong learning on wages was quite limited. However, for women, in
the standard OLS wage equations, qualifications at academic level four (degree) did yield a
sizeable wage premium. This is consistent with Blundell et al., (1997) who found, also using
the NCDS, that late acquisition of a degree did not penalise women, in terms of its impact on
wages. Women also earned a wage premium of nearly 10 per cent for level four occupational
qualifications (e.g. NVQ4). For males, only good GCSEs and very high- level academic
qualifications (higher degree) generated a positive wage premium.
Caution needs to be applied however, for the following reasons. Firstly we found
evidence of negative wage premiums from certain qualifications, which may undermine our
results. It could be that less able individuals (who will earn less) are more likely to take
certain qualifications late in life and that our ability measures are not adequate to deal with
this problem. Secondly, our first difference equations and matching estimates generated very
mixed results, again suggesting that endogeneity bias may be an issue.
7. Employment Effects of Lifelong Learning
Does lifelong learning have any impact on the probability of being employed? To answer
this question, we first compared the likelihood of remaining in employment in 2000 for those
people who were in employment in 1991, according to whether they had undertaken some
lifelong learning in the intervening period. Tables 19 reports the results for men and women
combined, while Tables 20 and 21 provide information about men only and women only
respectively. The dependent variable is a dummy variable equal to one if the person is
employed (full- or part-time) in 2000. We use a probit model and all the coefficients are
estimated marginal effects. We follow the same strategy as for the wage regressions. We
start by evaluating the raw effect of the lifelong learning variables on the probability of being
employed in 2000. We then add variables indicating the individual’s prior (1991) education

33
level (column 2) and then various family background measures (column 3 – as described in
the previous section). In the sample 90 per cent are employed in 2000, although the
employment rate is higher for men (94 per cent) than for women (86 per cent).
Table 19 provides weak evidence that individuals who have taken vocationally related
level four qualifications later in life are more likely to be employed (by six percentage points
– significant at the 10 per cent level). Otherwise all the lifelong learning variables are
insignificant. When we look at men and women separately (Tables 20 and 21), lifelong
learning has no impact on the likelihood of remaining in employment, regardless of the
specification.
Table 22 models the likelihood of being in employment in 2000 for those individuals
who were out of the labour market in 1991. Again, this is a probit model. There were just
over 1,600 individuals in the NCDS sample who were not in the labour market in 1991, and
most of these (over 1,300) were females. The estimates show that all kinds of lifelong
learning, academic, vocationally-related and occupational, significantly raised the probability
of women returning to the labour market in 2000, while occupational qualifications obtained
between 1991 and 2000 increased the probability that men would return to the labour market.
Having obtained qualifications at school, including CSEs, O levels and A-levels, also tended
to increase the likelihood of returning to the labour market, for both men and women.
In summary, our main result is that there is quite compelling evidence that those who
were out of the labour market in 1991 were able to use lifelong learning to help them in their
transition into the labour market. However, undertaking lifelong learning did not have
significant effects on the probability of remaining in employment in 2000 for those who were
already in employment in 1991.
8. Conclusions and Ideas for Future Research
Our research has uncovered strong evidence of employment effects from lifelong learning.
Undertaking lifelong learning is associated with increases in the probability of being in the
labour market in 2000 for those who were out of the labour market in 1991. This result
applies for both men and women. We also found compelling evidence that learning leads to
learning. Undertaking one episode of lifelong learning increased the probability of the
individual undertaking more learning. Conversely failing a qualification as an adult was

34
associated with a lower probability of undertaking learning in the future. As for the earnings
effects of lifelong learning, we found that, for those with no qualifications in 1991, people
who undertook lifelong learning had faster earnings growth during 1991 to 2000 than those
with no qualifications in 1991 who did not undertake lifelong learning in this period.
Looking at results for the sample as a who le (rather than sub-groups) there was only limited
evidence of associations between lifelong learning and higher earnings. For women, taking a
degree or level 4 occupational qualifications (e.g. nursing, teacher training) later in life does
appear to yield a wage premium. For males, only higher degrees yield a wage premium if
taken as a mature student. However, these results were not robust to specification checks for
endogeneity bias.
Our work has highlighted some important questions that require further investigation.
Firstly, who is undertaking lifelong learning, and why, cannot be separated, at least from a
research perspective, from the potential benefits of lifelong learning. Most individuals may
acquire qualifications late in life for reasons that are not directly to do with bettering their
labour market prospects. The motivation behind an individual’s lifelong learning is critical
therefore. Is the person undertaking a degree for his or her own enjoyment? Is he or she
taking a health and safety course as a requirement of his/her job? In each case one might not
expect an economic return from this type of lifelong learning. The fact that we found very
little evidence of significant returns from lifelong learning may therefore be unsurprising.
For most of the 1991-2000 period there were very few government programmes promoting
lifelong learning to the disadvantaged/excluded as a means of improving their economic
situation. It might well be the case that lifelong learning during this period was not used as a
mechanism to reduce social and economic exclusion19 but rather was undertaken for personal
enjoyment or to serve the particular needs of companies. In each instance, one might not find
the gains from lifelong learning in individuals’ wage packets. Furthermore, we have focused
very much on learning that results in a qualification. Future research needs to include
broader definitions of lifelong learning, including lifelong learning that does not lead to a
recognised qualification.
We therefore propose to continue our research in partnership with the DfES Centre
for the Wider Benefits of Learning, which will enable us to investigate lifelong learning in a
more holistic manner. We intend to consider other potential, non-economic, outcomes and to
19 We may be able to investigate this further using the British Cohort Study data, which is a panel of individuals born in 1970, since it covers a more recent period during which there was greater government promotion of lifelong learning.

35
try to understand the motivation behind the extensive amount of lifelong learning that is
evident in the NCDS data. To do this we need to undertake the detailed work of constructing
comprehensive work and personal event histories for each NCDS cohort member, using the
latest 2000 NCDS survey. This will enable us to track domestic changes (children going to
school, divorce etc.), work changes (a job move) and relate this to the likelihood of
undertaking, and impact of, lifelong learning. For example, as noted earlier in the paper, we
do not allow for the selectivity of women in the labour market. If women in particular make
decisions to participate in the labour force simultaneously with decisions about lifelong
learning, then detailed event histories are needed to untangle the modelling issues raised by
this.
Even from the point of view of investigating the impact of lifelong learning on labour
market outcomes, our study is not complete. The NCDS, by nature of being a cohort data set,
does not enable us to test whether the return from a particular qualification differs according
to the age the qualification is acquired. All the respondents in the NCDS are the same age
and therefore one cannot make the necessary allowances for differences in labour market
experience and time since the qualification was acquired, when comparing early and late
learners. Future research might therefore focus, as we have done, on the wage premium
associated with different qualifications acquired later in life, but using a mixed age sample.
This would enable one to test whether someone who obtains a NVQ2 at the age of 18 and has
two years labour market experience since acquiring the qualification earns a higher or lower
return than someone who obtained the same qualification at the age of 35 and who also has
two years experience after acquiring the qualification.
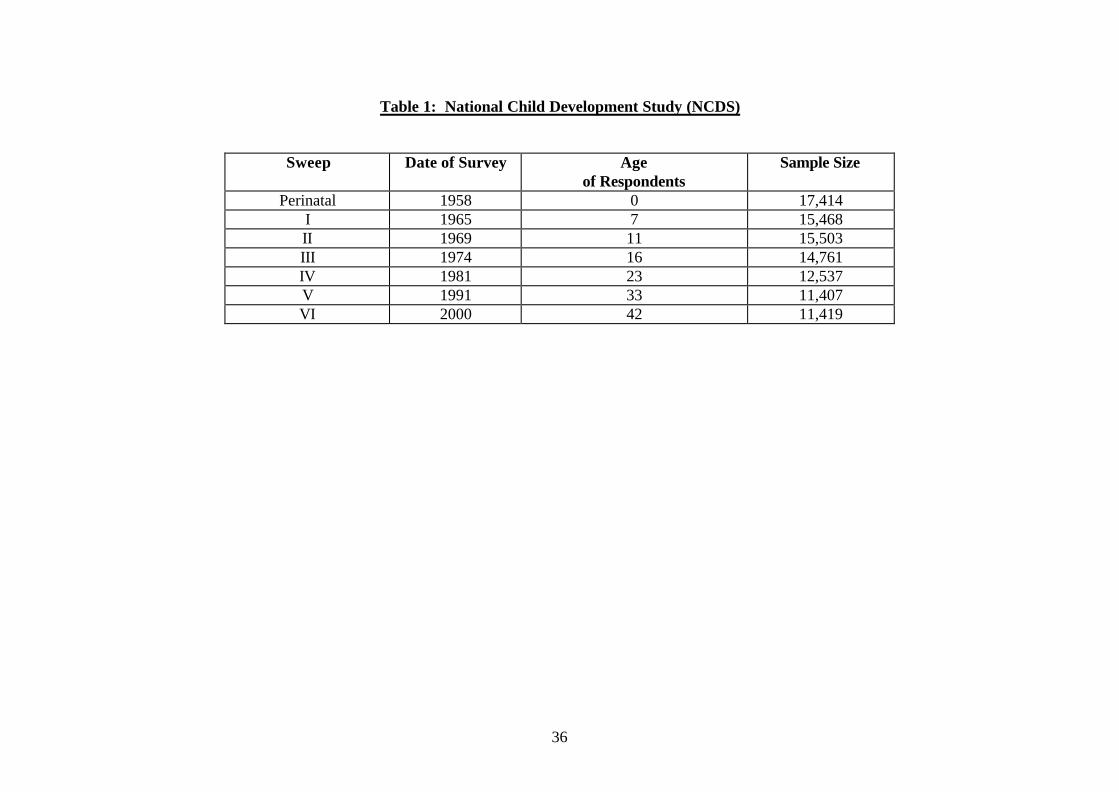
36
Table 1: National Child Development Study (NCDS)
Sweep Date of Survey Age of Respondents
Sample Size
Perinatal 1958 0 17,414 I 1965 7 15,468 II 1969 11 15,503 III 1974 16 14,761 IV 1981 23 12,537 V 1991 33 11,407 VI 2000 42 11,419

37
Table 2: National Qualifications Framework
Level of
Qualification General
(Academic) Vocationally-related
(Applied) Occupational (Vocational)
5 Higher Degree NVQ level 5 PGCE
Professional degree level qualifications 4 Degree
HE Diploma
BTEC Higher Certificate/Diploma HNC/HND
NVQ level 4 Nursing/paramedic
Other teacher training qualification City & Guilds Part 4/Career Ext/Full Tech
RSA Higher Diploma 3 A level
AS levels Scottish Highers
Scottish Cert of 6th Year Studies
Advanced GNVQ BTEC National Diploma
ONC/OND
NVQ level 3 City & Guilds Part 3/Final/Advanced Craft
RSA Advanced Diploma Pitmans level 3
2 GCSE grade A*-C O levels grade A-C O levels grade D-E
CSE grade 1 Scottish standard grades 1-3
Scottish lower or ordinary grades
Intermediate GNVQ BTEC First Certificate BTEC First Diploma
NVQ level 2 Apprenticeships
City & Guilds Part 2/Craft/Intermediate City & Guilds Part 1/Other
RSA First Diploma Pitmans level 2
1 GCSE grade D-G CSEs grades 2-5
Scottish standard grades 4-5 Other Scottish school qualification
Foundation GNVQ Other GNVQ
NVQ level 1 Other NVQ
Units towards NVQ RSA Cert/Other Pitmans level 1
Other vocational qualifications HGV
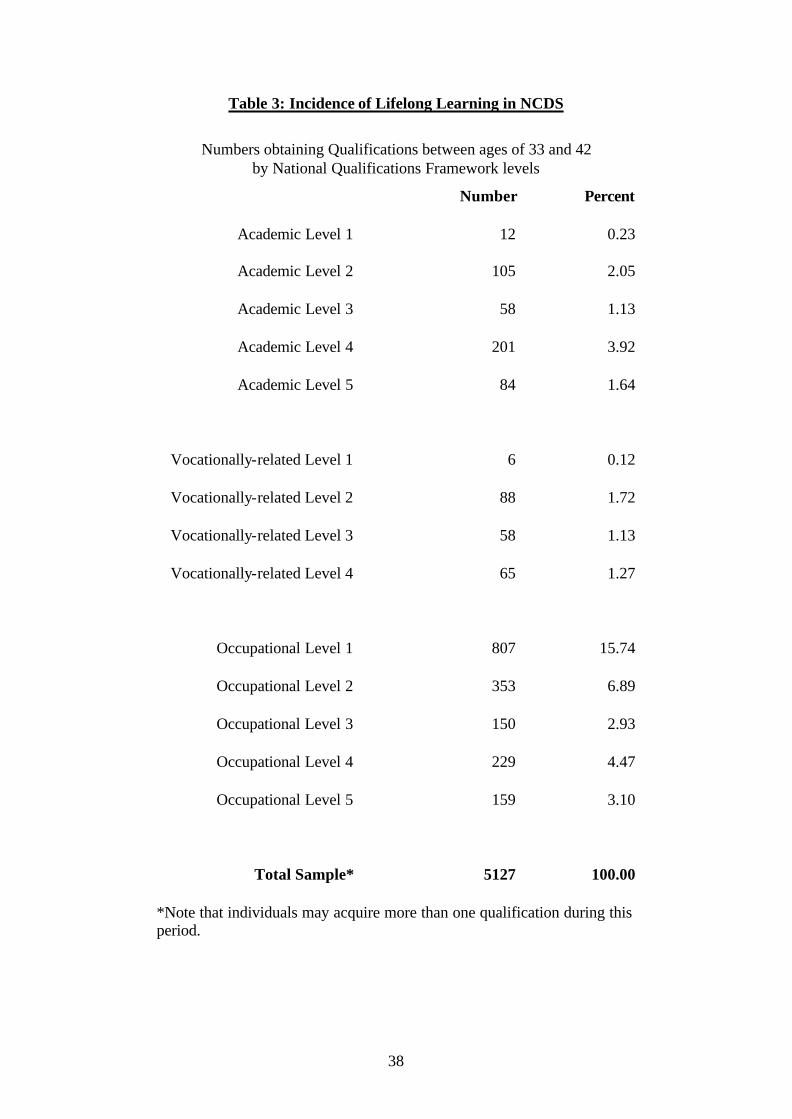
38
Table 3: Incidence of Lifelong Learning in NCDS
Numbers obtaining Qualifications between ages of 33 and 42 by National Qualifications Framework levels
Number Percent
Academic Level 1 12 0.23
Academic Level 2 105 2.05
Academic Level 3 58 1.13
Academic Level 4 201 3.92
Academic Level 5 84 1.64
Vocationally-related Level 1 6 0.12
Vocationally-related Level 2 88 1.72
Vocationally-related Level 3 58 1.13
Vocationally-related Level 4 65 1.27
Occupational Level 1 807 15.74
Occupational Level 2 353 6.89
Occupational Level 3 150 2.93
Occupational Level 4 229 4.47
Occupational Level 5 159 3.10
Total Sample* 5127 100.00
*Note that individuals may acquire more than one qualification during this period.

Combined SampleWages
Non- Lifelong Learners Lifelong Learners*N of Obs Mean Std. Dev. N of Obs Mean Std. Dev.
log wage 1991 3375 2.0266 0.4941 1734 2.0314 0.4722log wage 2000 2975 2.16 0.553 1541 2.172 0.491
Current Main ActivityNon- Lifelong Learners Lifelong Learners
N of Obs Percent N of Obs Percentf/t paid employee (30+ hrs) 2504 73.97 1317 75.65p/t paid employee (lt 30 hrs) 535 15.81 254 14.59unemployed seeking work 46 1.36 23 1.32f/t education 3 0.09 24 1.38government training scheme 3 0.09 2 0.11temporarily sick/disabled 9 0.27 12 0.69permanently sick/disabled 102 3.01 41 2.35looking after home/family 162 4.79 54 3.1wholly retired 3 0.09 3 0.17other 18 0.53 11 0.63Total 3385 100 1741 100
Prior QualificationsNon- Lifelong Learners Lifelong Learners
Prior School Qualifications: N of Obs % N of Obs %No prior school qualifications 440 13.45 114 6.80CSE grade 2-5 515 15.74 212 12.64< 5 O levels 1038 31.73 600 35.78> 5 O levels 506 15.47 329 19.62A levels 772 23.60 422 25.16Total 3271 100.00 1677 100.00
Table 4: Descriptives Statistics
39
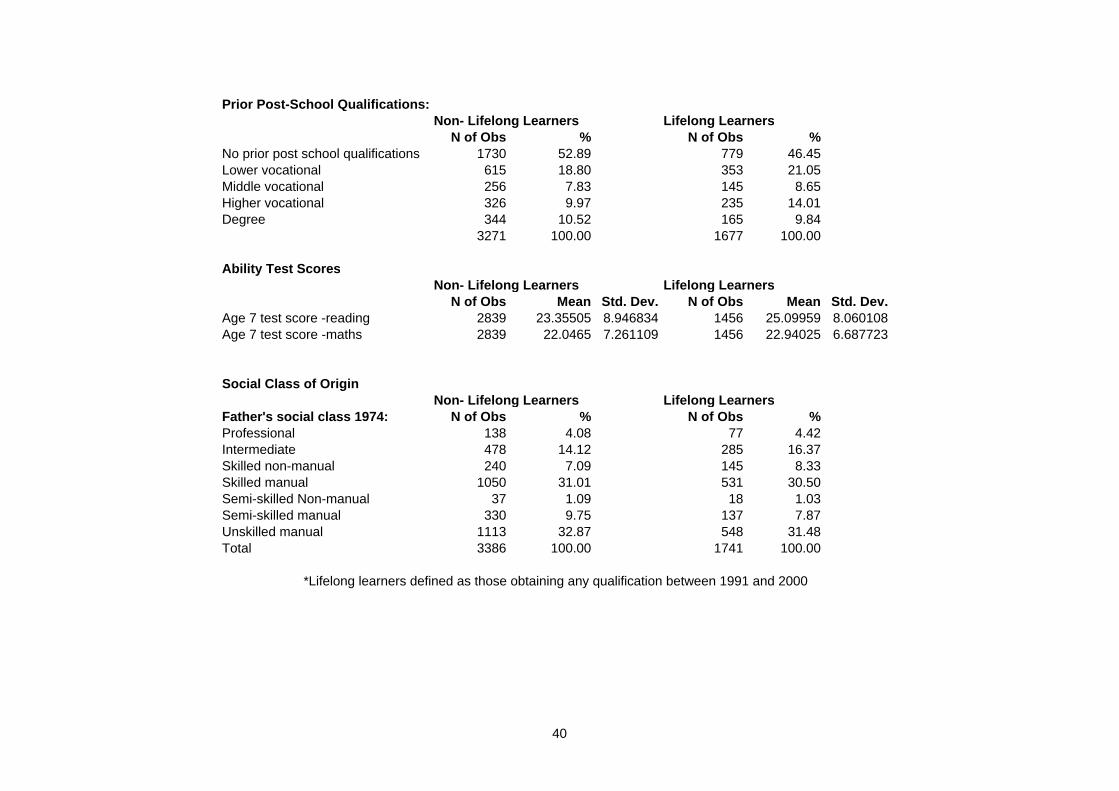
Prior Post-School Qualifications:Non- Lifelong Learners Lifelong Learners
N of Obs % N of Obs %No prior post school qualifications 1730 52.89 779 46.45Lower vocational 615 18.80 353 21.05Middle vocational 256 7.83 145 8.65Higher vocational 326 9.97 235 14.01Degree 344 10.52 165 9.84
3271 100.00 1677 100.00
Ability Test ScoresNon- Lifelong Learners Lifelong Learners
N of Obs Mean Std. Dev. N of Obs Mean Std. Dev.Age 7 test score -reading 2839 23.35505 8.946834 1456 25.09959 8.060108Age 7 test score -maths 2839 22.0465 7.261109 1456 22.94025 6.687723
Social Class of OriginNon- Lifelong Learners Lifelong Learners
Father's social class 1974: N of Obs % N of Obs %Professional 138 4.08 77 4.42Intermediate 478 14.12 285 16.37Skilled non-manual 240 7.09 145 8.33Skilled manual 1050 31.01 531 30.50Semi-skilled Non-manual 37 1.09 18 1.03Semi-skilled manual 330 9.75 137 7.87Unskilled manual 1113 32.87 548 31.48Total 3386 100.00 1741 100.00
*Lifelong learners defined as those obtaining any qualification between 1991 and 2000
40

MalesWages
Non- Lifelong Learners Lifelong Learners*N of Obs Mean Std. Dev. N of Obs Mean Std. Dev.
log wage 1991 1817 2.1979 0.4279 831 2.2262 0.3845log wage 2000 1681 2.327 0.513 773 2.339 0.461
Current Main ActivityNon- Lifelong Learners Lifelong Learners
N of Obs Percent N of Obs Percentf/t paid employee (30+ hrs) 1698 93.09 777 92.94p/t paid employee (lt 30 hrs) 13 0.71 8 0.96unemployed seeking work 29 1.59 16 1.91government training scheme 1 0.05 5 0.6temporarily sick/disabled 5 0.27 2 0.24permanently sick/disabled 56 3.07 4 0.48looking after home/family 10 0.55 18 2.15wholly retired 3 0.16 2 0.24other 9 0.49 4 0.48Total 1824 100 836 100
Prior QualificationsNon- Lifelong Learners Lifelong Learners
Prior School Qualifications: N of Obs % N of Obs %No prior school qualifications 237 13.46 60 7.57CSE grade 2-5 303 17.21 118 14.88< 5 O levels 530 30.10 268 33.80> 5 O levels 260 14.76 135 17.02A levels 431 24.47 212 26.73Total 1761 100.00 793 100.00
41

Prior Post-School Qualifications:Non- Lifelong Learners Lifelong Learners
N of Obs Mean N of Obs MeanNo prior post school qualifications 857 48.67 351 44.26Lower vocational 325 18.46 145 18.28Middle vocational 214 12.15 123 15.51Higher vocational 172 9.77 85 10.72Degree 193 10.96 89 11.22Total 1761 100.00 793 100.00
Ability Test ScoresNon- Lifelong Learners Lifelong Learners
N of Obs Mean Std. Dev. N of Obs Mean Std. Dev.Age 7 test score -reading 1534 22.80117 9.214214 702 24.21795 8.313547Age 7 test score -maths 1534 22.17992 7.417841 702 22.95299 6.854036
Social Class of OriginNon- Lifelong Learners Lifelong Learners
Father's social class 1974: N of Obs % N of Obs %Professional 74 4.05 44 5.26Intermediate 265 14.52 138 16.51Skilled non-manual 150 8.22 61 7.30Skilled manual 563 30.85 263 31.46Semi-skilled Non-manual 17 0.93 9 1.08Semi-skilled manual 180 9.86 64 7.66Unskilled manual 576 31.56 257 30.74Total 1825 100.00 836 100.00
*Lifelong learners defined as those obtaining any qualification between 1991 and 2000
42

FemalesWages
Non- Lifelong Learners Lifelong Learners*N of Obs Mean Std. Dev. N of Obs Mean Std. Dev.
log wage 1991 1558 1.8269 0.4912 903 1.8522 0.4746log wage 2000 1294 1.942 0.526 768 2.004 0.461
Current Main ActivityNon- Lifelong Learners Lifelong Learners
N of Obs Percent N of Obs Percentf/t paid employee (30+ hrs) 806 51.63 540 59.67p/t paid employee (lt 30 hrs) 522 33.44 246 27.18unemployed seeking work 17 1.09 7 0.77f/t education 3 0.19 19 2.1government training scheme 2 0.13 8 0.88temporarily sick/disabled 4 0.26 23 2.54permanently sick/disabled 46 2.95 52 5.75looking after home/family 152 9.74 3 0.33other 9 0.58 7 0.77Total 1561 100 905 100
Prior QualificationsNon- Lifelong Learners Lifelong Learners
Prior School Qualifications: N of Obs % N of Obs %No prior school qualifications 203 13.44 54 6.11CSE grade 2-5 212 14.04 94 10.63< 5 O levels 508 33.64 332 37.56> 5 O levels 246 16.29 194 21.95A levels 341 22.58 210 23.76Total 1510 100.00 884 100.00
43

Prior Post-School Qualifications:Non- Lifelong Learners Lifelong Learners
N of Obs % N of Obs %No prior post school qualifications 873 57.81 428 48.42Lower vocational 290 19.21 208 23.53Middle vocational 42 2.78 22 2.49Higher vocational 154 10.20 150 16.97Degree 151 10.00 76 8.60Total 1510 100.00 884 100.00
Ability Test ScoresNon- Lifelong Learners Lifelong Learners
N of Obs Mean Std. Dev. N of Obs Mean Std. Dev.Age 7 test score -reading 1305 24.00613 8.579829 754 25.92042 7.732344Age 7 test score -maths 1305 21.88966 7.07205 754 22.92838 6.533612
Social Class of OriginNon- Lifelong Learners Lifelong Learners
Father's social class 1974: N of Obs % N of Obs %Professional 64 4.10 33 3.65Intermediate 213 13.65 147 16.24Skilled non-manual 90 5.77 84 9.28Skilled manual 487 31.20 268 29.61Semi-skilled Non-manual 20 1.28 9 0.99Semi-skilled manual 150 9.61 73 8.07Unskilled manual 537 34.40 291 32.15Total 1561 100.00 905 100.00
*Lifelong learners defined as those obtaining any qualification between 1991 and 2000
44

45
Table 5: The Determinants of the Decision to Undertake Lifelong Learning - Combined Sample
Estimated using probit model Dependent variable takes value of 1 if person has acquired a qualification between the ages of 33 and 42, zero otherwise.
Explanatory Variables
dF/dx Robust Std. Err.
P>|z| dF/dx Robust Std. Err.
P>|z| dF/dx Robust Std. Err.
P>|z|
Female 0.0564 0.0138 0.000 **
* 0.0565 0.0141 0.000 *** 0.0617 0.0145 0.000 ***
Prior School Qualifications: CSE grade 2-5 0.0967 0.0302 0.001 **
* 0.0888 0.0306 0.003 *** 0.0870 0.0307 0.004 ***
< 5 O levels 0.1621 0.0260 0.000 ***
0.1504 0.0270 0.000 *** 0.1479 0.0271 0.000 ***
> 5 O levels 0.1873 0.0299 0.000 ***
0.1715 0.0321 0.000 *** 0.1631 0.0323 0.000 ***
A levels 0.1701 0.0302 0.000 ***
0.1576 0.0336 0.000 *** 0.1430 0.0338 0.000 ***
Prior Post-School Qualifications: Lower vocational 0.0428 0.0186 0.019 ** 0.0400 0.0187 0.030 ** 0.0417 0.0187 0.024 ** Middle vocational 0.0525 0.0273 0.050 ** 0.0518 0.0276 0.056 * 0.0475 0.0276 0.079 * Higher vocational 0.0700 0.0236 0.002 **
* 0.0641 0.0236 0.006 *** 0.0504 0.0236 0.030 **
Degree -0.0208 0.0273 0.450 -0.0237 0.0276 0.395 -0.0250 0.0277 0.372 Maths attainment at age 7: 5th quintile (highest) 0.0517 0.0263 0.046 ** 0.0489 0.0264 0.061 * 4th quintile 0.0354 0.0248 0.149 0.0332 0.0249 0.178 3rd quintile 0.0456 0.0249 0.063 * 0.0461 0.0250 0.061 * 2nd quintile 0.0233 0.0242 0.330 0.0234 0.0243 0.332 Reading attainment at age 7: 5th quintile (highest) 0.0026 0.0276 0.926 -0.0003 0.0276 0.990 4th quintile 0.0253 0.0265 0.337 0.0230 0.0266 0.383 3rd quintile 0.0385 0.0260 0.135 0.0375 0.0261 0.146 2nd quintile 0.0166 0.0254 0.511 0.0135 0.0254 0.594

46
Type of school 1974: Secondary modern -0.0113 0.0191 0.557 -0.0110 0.0192 0.568 Grammar -0.0168 0.0232 0.474 -0.0180 0.0232 0.442 Private -0.0521 0.0335 0.133 -0.0522 0.0333 0.130 Other -0.0736 0.0500 0.165 -0.0734 0.0504 0.170 Parents' education: Father's years of edn 0.0072 0.0050 0.151 0.0077 0.0050 0.128 Father's edn missing 0.0672 0.0720 0.343 0.0703 0.0722 0.323 Mother's years of edn -0.0037 0.0060 0.539 -0.0046 0.0060 0.444 Mother's edn missing -0.0532 0.0730 0.475 -0.0618 0.0727 0.406 Father's social class 1974: Professional/Intermediate 0.0188 0.0262 0.470 0.0223 0.0264 0.394 Skilled non-manual 0.0278 0.0317 0.375 0.0319 0.0319 0.311 Skilled manual -0.0079 0.0234 0.736 -0.0102 0.0234 0.664 Semi-skilled non-manual -0.0232 0.0691 0.740 -0.0229 0.0688 0.743 Semi-skilled manual -0.0500 0.0289 0.093 * -0.0503 0.0289 0.092 * Bad finances 1969 or 1974 -0.0007 0.0193 0.971 -0.0021 0.0193 0.913 Father's interest in education: Expects too much 0.0070 0.0681 0.918 0.0240 0.0694 0.727 Very interested -0.0378 0.0216 0.083 * -0.0386 0.0216 0.078 * Some interest -0.0546 0.0180 0.003 *** -0.0508 0.0181 0.006 *** Mother's interest in education: Expects too much 0.0076 0.0474 0.873 0.0058 0.0473 0.902 Very interested 0.0159 0.0249 0.524 0.0159 0.0250 0.525 Some interest 0.0456 0.0215 0.033 ** 0.0436 0.0215 0.042 ** Employed in large firm in 1991 0.0595 0.0173 0.000 *** Union member in 1991 0.0575 0.0150 0.000 *** Employed in private sector firm in 1991
-0.0335 0.0155 0.030 **
Number of observations 4951 4951 4951 Chi2 (8) 101.40 139.93 183.87 Log likelihood -
3117.63
-3098.50 -3073.92
Pseudo R2 0.02 0.02 0.03

Explanatory Robust Robust Robustvariables dF/dx Std. Err. P>|z| dF/dx Std. Err. P>|z| dF/dx Std. Err. P>|z|Prior School Qualifications:CSE grade 2-5 0.085 0.040 0.027 ** 0.077 0.040 0.048 ** 0.071 0.040 0.069 *< 5 O levels 0.142 0.035 0.000 *** 0.123 0.036 0.001 *** 0.120 0.037 0.001 ***> 5 O levels 0.151 0.041 0.000 *** 0.127 0.044 0.003 *** 0.123 0.044 0.004 ***A levels 0.153 0.040 0.000 *** 0.128 0.045 0.003 *** 0.120 0.045 0.006 ***Prior Post-School Qualifications:Lower vocational 0.020 0.026 0.446 0.017 0.026 0.520 0.021 0.026 0.414Middle vocational 0.062 0.030 0.033 ** 0.064 0.030 0.031 ** 0.067 0.031 0.026 **Higher vocational 0.012 0.033 0.717 0.005 0.033 0.889 0.011 0.033 0.736Degree -0.012 0.036 0.734 -0.021 0.036 0.561 -0.019 0.036 0.599Maths attainment at age 7:5th quintile (highest) 0.037 0.036 0.296 0.035 0.036 0.3274th quintile 0.013 0.034 0.693 0.009 0.034 0.7933rd quintile 0.014 0.034 0.676 0.012 0.034 0.7292nd quintile 0.014 0.033 0.666 0.012 0.034 0.715Reading attainment at age 7:5th quintile (highest) 0.035 0.038 0.349 0.033 0.038 0.3814th quintile 0.038 0.035 0.275 0.034 0.035 0.3343rd quintile 0.047 0.034 0.155 0.045 0.034 0.1762nd quintile 0.025 0.032 0.431 0.021 0.032 0.508Type of school 1974:Secondary modern -0.041 0.026 0.121 -0.041 0.026 0.125Grammar -0.041 0.031 0.196 -0.043 0.030 0.164Private -0.070 0.042 0.117 -0.069 0.042 0.123Other -0.087 0.063 0.204 -0.088 0.063 0.204Parents' education:Father's years of edn 0.007 0.007 0.278 0.007 0.007 0.305Father's edn missing 0.054 0.101 0.586 0.045 0.100 0.651Mother's years of edn -0.001 0.008 0.938 0.000 0.008 0.965Mother's edn missing -0.052 0.103 0.619 -0.047 0.103 0.658Father's social class 1974:Professional/Intermediate -0.019 0.035 0.595 -0.016 0.035 0.645Skilled non-manual -0.065 0.038 0.103 -0.063 0.038 0.112Skilled manual -0.034 0.032 0.295 -0.035 0.032 0.279Semi-skilled non-manual -0.006 0.096 0.951 -0.005 0.095 0.956Semi-skilled manual -0.097 0.036 0.013 ** -0.094 0.037 0.018 **Bad finances 1969 or 1974 0.001 0.027 0.973 0.001 0.027 0.960Father's interest in education:Expects too much -0.093 0.071 0.235 -0.081 0.073 0.304Very interested -0.060 0.030 0.047 -0.060 0.030 0.047 *Some interest -0.034 0.025 0.176 -0.033 0.025 0.192Mother's interest in education:Expects too much 0.114 0.065 0.067 * 0.111 0.065 0.072 *Very interested 0.045 0.035 0.199 0.045 0.035 0.196Some interest 0.040 0.030 0.170 0.040 0.030 0.178Employed in large firm in 1991 0.054 0.022 0.015 **Union member in 1991 0.045 0.020 0.025 **Employed in private sector firm in 1991 -0.039 0.021 0.066 *
Number of observations 2554 2554 2554Chi-squared 29.17 58.97 78.11log likelihood -1567 -1552 -1541Pseudo R2 0.009 0.019 0.026
***,**,* represent significant at 1%, 5%,10% respectively.
Table 6: The Determinants of the Decision to Undertake Lifelong Learning - MalesEstimated using probit modelDependent variable taking value of 1 if person has acquired a qualification between the ages of 33 and 42,zero otherwise.
47

Robust Robust RobustdF/dx Std. Err. P>|z| dF/dx Std. Err. P>|z| dF/dx Std. Err. P>|z|
Prior School Qualifications:CSE grade 2-5 0.108 0.046 0.016 ** 0.097 0.047 0.033 ** 0.103 0.047 0.025 **< 5 O levels 0.184 0.038 0.000 *** 0.174 0.040 0.000 *** 0.172 0.040 0.000 ***> 5 O levels 0.224 0.043 0.000 *** 0.218 0.047 0.000 *** 0.205 0.047 0.000 ***A levels 0.183 0.045 0.000 *** 0.180 0.051 0.000 *** 0.158 0.051 0.002 ***Prior Post-School Qualifications:Lower vocational 0.061 0.027 0.020 ** 0.060 0.027 0.025 ** 0.061 0.027 0.022 **Middle vocational -0.037 0.061 0.554 -0.044 0.062 0.485 -0.056 0.061 0.377Higher vocational 0.121 0.034 0.000 *** 0.118 0.034 0.000 *** 0.089 0.035 0.009 ***Degree -0.027 0.042 0.525 -0.016 0.044 0.714 -0.019 0.044 0.663Maths attainment at age 7:5th quintile (highest) 0.079 0.039 0.040 ** 0.074 0.039 0.056 *4th quintile 0.065 0.036 0.072 * 0.065 0.036 0.072 *3rd quintile 0.085 0.037 0.020 ** 0.089 0.037 0.014 **2nd quintile 0.033 0.035 0.336 0.036 0.035 0.296Reading attainment at age 7:5th quintile (highest) -0.031 0.042 0.463 -0.036 0.042 0.3894th quintile 0.010 0.041 0.806 0.007 0.041 0.8633rd quintile 0.027 0.041 0.509 0.022 0.041 0.5902nd quintile 0.006 0.041 0.885 0.001 0.041 0.986Type of school 1974:Secondary modern 0.021 0.028 0.449 0.022 0.028 0.428Grammar 0.005 0.035 0.875 0.007 0.035 0.837Private -0.039 0.053 0.473 -0.041 0.053 0.450Other -0.054 0.079 0.507 -0.051 0.079 0.525Parents' education:Father's years of edn 0.006 0.008 0.423 0.007 0.008 0.328Father's edn missing 0.082 0.105 0.433 0.100 0.106 0.341Mother's years of edn -0.007 0.009 0.430 -0.009 0.009 0.323Mother's edn missing -0.061 0.106 0.574 -0.082 0.105 0.448Father's social class 1974:Professional/Intermediate 0.065 0.039 0.096 * 0.069 0.040 0.078 *Skilled non-manual 0.151 0.050 0.002 *** 0.157 0.050 0.001 ***Skilled manual 0.022 0.034 0.530 0.017 0.034 0.616Semi-skilled non-manual -0.044 0.098 0.664 -0.038 0.099 0.706Semi-skilled manual -0.008 0.044 0.859 -0.012 0.044 0.789Bad finances 1969 or 1974 0.003 0.028 0.910 -0.001 0.028 0.977Father's interest in education:Expects too much 0.179 0.125 0.148 0.193 0.125 0.122Very interested -0.016 0.031 0.606 -0.017 0.032 0.584Some interest -0.082 0.026 0.003 *** -0.076 0.027 0.005 ***Mother's interest in education:Expects too much -0.146 0.063 0.040 ** -0.143 0.063 0.047 **Very interested -0.016 0.036 0.647 -0.016 0.036 0.654Some interest 0.052 0.031 0.097 * 0.049 0.031 0.120Employed in large firm in 1991 0.072 0.027 0.007 ***Union member in 1991 0.071 0.023 0.002 ***Employed in private sector firm in 1991 -0.020 0.023 0.391
Number of observations 2394 2394 2394Chi squared 67.71 106.66 130.15log likelihood -1542 -1521 -1508Pseudo R2 0.0217 0.0354 0.0434
Table 7: The Determinants of the Decision to Undertake Lifelong Learning - Females
*, **, *** indicates that the variable is significant at the 10%, 5% and 1% level respectively.
Estimated using probit modelDependent variable taking value of 1 if person has acquired a qualification between the ages of 33 and 42,zero otherwise.
48

Explanatory variables Robust Robust RobustdF/dx Std. Err. P>|z| dF/dx Std. Err. P>|z| dF/dx Std. Err. P>|z|
Female 0.008 0.010 0.376Lifelong Learning VariablesAny qualification 1991 to 2000 0.106 0.011 0.000 *** 0.107 0.015 0.000 *** 0.100 0.016 0.000 ***Failed qualification 1991 to 2000 -0.027 0.009 0.003 *** -0.025 0.012 0.042 ** -0.029 0.013 0.023 **Prior School Qualifications:CSE grade 2-5 0.034 0.025 0.148 -0.025 0.021 0.276 0.188 0.066 0.000 ***< 5 O levels 0.061 0.022 0.003 *** 0.020 0.023 0.379 0.154 0.046 0.000 ***> 5 O levels 0.061 0.028 0.014 ** 0.016 0.028 0.543 0.174 0.061 0.001 ***A levels 0.065 0.028 0.010 *** 0.021 0.028 0.434 0.170 0.060 0.001 ***Prior Post-School Qualifications:Lower vocational 0.007 0.012 0.583 0.026 0.018 0.118 -0.010 0.017 0.562Middle vocational 0.004 0.017 0.795 0.021 0.019 0.237 -0.054 0.030 0.170Higher vocational 0.003 0.015 0.843 0.010 0.021 0.634 0.002 0.021 0.917Degree 0.013 0.019 0.471 0.004 0.022 0.844 0.026 0.032 0.388Maths attainment at age 7:5th quintile (highest) 0.007 0.017 0.668 0.002 0.021 0.922 0.018 0.028 0.4914th quintile 0.011 0.017 0.505 -0.006 0.020 0.774 0.035 0.027 0.1673rd quintile 0.014 0.017 0.386 0.006 0.021 0.777 0.031 0.027 0.2222nd quintile -0.016 0.015 0.310 -0.017 0.019 0.398 -0.014 0.023 0.564Reading attainment at age 7:5th quintile (highest) 0.004 0.018 0.830 0.016 0.026 0.522 -0.019 0.026 0.4774th quintile -0.006 0.017 0.743 -0.004 0.021 0.848 -0.017 0.025 0.5033rd quintile -0.018 0.016 0.290 0.006 0.021 0.791 -0.053 0.022 0.031 **2nd quintile -0.018 0.016 0.282 -0.006 0.019 0.759 -0.043 0.022 0.092 *Type of school 1974:Secondary modern 0.027 0.014 0.041 ** 0.025 0.018 0.145 0.026 0.020 0.175Grammar -0.006 0.014 0.674 -0.014 0.017 0.432 0.007 0.023 0.760Private 0.003 0.023 0.890 0.002 0.028 0.952 0.013 0.039 0.726Other 0.019 0.038 0.599 0.017 0.044 0.673 0.021 0.064 0.731Parents' education:Father's years of edn 0.002 0.003 0.584 0.004 0.004 0.227 -0.004 0.005 0.482Father's edn missing 0.052 0.052 0.284 0.074 0.078 0.276 0.017 0.071 0.800Mother's years of edn -0.002 0.004 0.668 0.000 0.005 0.980 -0.003 0.006 0.586Mother's edn missing -0.036 0.042 0.431 -0.038 0.053 0.517 -0.035 0.063 0.608Father's social class 1974:Professional/Intermediate -0.008 0.016 0.608 -0.036 0.016 0.055 * 0.039 0.031 0.169Skilled non-manual -0.020 0.018 0.297 -0.037 0.018 0.097 * 0.013 0.032 0.670Skilled manual -0.011 0.015 0.450 -0.024 0.018 0.215 0.006 0.023 0.787Semi-skilled non-manual 0.013 0.051 0.788 0.009 0.060 0.876 0.021 0.084 0.791Semi-skilled manual -0.001 0.020 0.976 -0.020 0.021 0.385 0.027 0.035 0.403Bad finances 1969 or 1974 0.016 0.014 0.226 -0.011 0.016 0.526 0.053 0.022 0.010 ***Father's interest in education:Expects too much -0.027 0.035 0.498 -0.029 0.042 0.558 -0.025 0.055 0.681Very interested 0.015 0.015 0.300 0.012 0.019 0.524 0.015 0.022 0.470Some interest 0.027 0.014 0.036 ** 0.011 0.016 0.491 0.046 0.022 0.024 **Mother's interest in education:Expects too much 0.020 0.032 0.521 0.005 0.035 0.880 0.034 0.057 0.510Very interested -0.021 0.016 0.197 -0.024 0.019 0.229 -0.014 0.025 0.572Some interest -0.032 0.013 0.021 ** -0.040 0.016 0.018 ** -0.016 0.021 0.465
Union member in 2000 0.030 0.010 0.002 *** 0.028 0.012 0.022 ** 0.025 0.016 0.100 *Employed in large firm in 2000 0.021 0.011 0.048 ** 0.027 0.015 0.047 ** 0.017 0.017 0.291Employed in public sector in 2000 0.027 0.011 0.015 ** 0.044 0.017 0.004 *** 0.017 0.015 0.272
Number of observations 4466 2415 2051Wald chi-squared 229.49 144.47 122.08Pseudo R-squared 0.0766 0.0939 0.0873Log likelihood -1438.2 -714.33 -699.3
Table 8: Determinants of Current Learning ActivityEstimated using probit model
zero otherwise.
*, **, *** indicates that the variable is significant at the 10%, 5% and 1% level respectively.
Dependent variable takes value of 1 if person on a course leading to a qualification in 2000,
Combined Sample Males Females
49

Explanatory Robust Robust Robust RobustVariables Coef. Std. Err. P>|t| Coef. Std. Err. P>|t| Coef. Std. Err. P>|t| Coef. Std. Err. P>|t|Constant 2.331 0.011 0.000 *** 1.974 0.020 0.000 *** 1.817 0.073 0.000 *** 1.773 0.073 0.000 ***Female -0.368 0.015 0.000 *** -0.368 0.014 0.000 *** -0.364 0.014 0.000 *** -0.353 0.014 0.000 ***Qualifications since 1991 by NQF levelAcademic Level 1 -0.388 0.120 0.001 *** -0.337 0.135 0.013 ** -0.325 0.136 0.017 ** -0.307 0.132 0.020 **Academic Level 2 0.049 0.044 0.271 0.067 0.044 0.126 0.067 0.043 0.124 0.063 0.043 0.141Academic Level 3 -0.112 0.072 0.119 -0.146 0.064 0.022 ** -0.154 0.065 0.018 ** -0.152 0.064 0.017 **Academic Level 4 0.125 0.030 0.000 *** 0.055 0.029 0.057 * 0.049 0.029 0.095 * 0.036 0.029 0.209Academic Level 5 0.384 0.057 0.000 *** 0.134 0.057 0.020 ** 0.121 0.056 0.031 ** 0.109 0.057 0.055 *Vocationally-related Level 1 0.274 0.075 0.000 *** 0.230 0.069 0.001 *** 0.263 0.061 0.000 *** 0.245 0.060 0.000 ***Vocationally-related Level 2 -0.101 0.044 0.021 ** -0.075 0.044 0.087 * -0.066 0.042 0.115 -0.073 0.041 0.073 *Vocationally-related Level 3 -0.043 0.047 0.361 0.011 0.040 0.784 0.005 0.039 0.901 0.011 0.039 0.779Vocationally-related Level 4 -0.022 0.045 0.625 -0.002 0.048 0.959 -0.002 0.050 0.969 -0.015 0.050 0.769Occupational Level 1 -0.035 0.019 0.072 * -0.032 0.018 0.066 * -0.033 0.018 0.061 * -0.033 0.017 0.051 *Occupational Level 2 -0.137 0.024 0.000 *** -0.074 0.024 0.002 *** -0.076 0.024 0.002 *** -0.084 0.023 0.000 ***Occupational Level 3 0.008 0.038 0.829 0.024 0.035 0.506 0.032 0.036 0.367 0.032 0.035 0.363Occupational Level 4 0.121 0.033 0.000 *** 0.055 0.031 0.071 * 0.053 0.031 0.084 * 0.039 0.030 0.187Occupational Level 5 0.191 0.038 0.000 *** 0.067 0.038 0.074 * 0.060 0.037 0.108 0.051 0.036 0.160Prior School Qualifications:CSE grade 2-5 0.143 0.025 0.000 *** 0.132 0.025 0.000 *** 0.121 0.025 0.000 ***< 5 O levels 0.255 0.023 0.000 *** 0.223 0.024 0.000 *** 0.216 0.024 0.000 ***> 5 O levels 0.411 0.027 0.000 *** 0.351 0.029 0.000 *** 0.337 0.028 0.000 ***A levels 0.585 0.026 0.000 *** 0.499 0.029 0.000 *** 0.481 0.029 0.000 ***Prior Post-School Qualifications:Lower vocational 0.011 0.017 0.512 0.005 0.017 0.769 0.009 0.017 0.584Middle vocational 0.050 0.027 0.066 * 0.048 0.027 0.073 * 0.046 0.027 0.086 *Higher vocational 0.156 0.021 0.000 *** 0.153 0.021 0.000 *** 0.150 0.021 0.000 ***Degree 0.193 0.029 0.000 *** 0.165 0.029 0.000 *** 0.168 0.029 0.000 ***Maths attainment at age 7:5th quintile (highest) 0.090 0.025 0.000 *** 0.090 0.025 0.000 ***4th quintile 0.058 0.023 0.012 ** 0.056 0.023 0.015 **3rd quintile 0.029 0.023 0.220 0.028 0.023 0.2222nd quintile 0.039 0.023 0.087 * 0.042 0.022 0.059 *Reading attainment at age 7:5th quintile (highest) 0.008 0.027 0.762 0.006 0.027 0.8254th quintile 0.026 0.026 0.319 0.022 0.026 0.3903rd quintile 0.031 0.025 0.205 0.027 0.024 0.2742nd quintile 0.020 0.024 0.394 0.016 0.023 0.506Type of school 1974:Secondary modern -0.003 0.019 0.860 0.001 0.018 0.949Grammar 0.037 0.023 0.116 0.035 0.023 0.131Private 0.115 0.037 0.002 *** 0.119 0.037 0.001 ***Other 0.014 0.046 0.761 0.003 0.046 0.948Parents' education:Father's years of edn 0.006 0.005 0.277 0.006 0.005 0.231Father's edn missing 0.055 0.069 0.421 0.069 0.067 0.303Mother's years of edn 0.007 0.006 0.262 0.007 0.006 0.250Mother's edn missing 0.063 0.074 0.391 0.051 0.071 0.471Father's social class 1974:Professional/Intermediate -0.028 0.027 0.305 -0.026 0.027 0.323Skilled non-manual 0.024 0.030 0.422 0.028 0.030 0.354Skilled manual -0.041 0.023 0.079 * -0.040 0.023 0.081 *Semi-skilled non-manual 0.033 0.087 0.707 0.022 0.087 0.801Semi-skilled manual -0.061 0.028 0.030 ** -0.060 0.028 0.031 **Bad finances 1969 or 1974 -0.020 0.018 0.274 -0.021 0.018 0.257Father's interest in education:Expects too much 0.043 0.075 0.569 0.036 0.073 0.623Very interested 0.017 0.021 0.418 0.020 0.021 0.334Some interest -0.008 0.018 0.647 -0.007 0.018 0.694Mother's interest in education:Expects too much 0.061 0.048 0.208 0.062 0.048 0.192Very interested 0.029 0.024 0.228 0.029 0.024 0.221Some interest 0.034 0.021 0.102 0.037 0.021 0.075 *Union member in 2000 0.051 0.014 0.000 ***Employed in large firm in 2000 0.160 0.016 0.000 ***Employed in public sector in 2000 -0.026 0.016 0.101
Number of Observations 4382.000 4382.000 4382.000 4382.000R2 0.145 0.325 0.337 0.355
*, **, *** indicates that the variable is significant at the 10%, 5% and 1% level respectively.
Dependent variable is log hourly earnings in 2000Table 9: The Effect of Lifelong Learning on Wages - OLS Regression - Combined Sample
50

Explanatory variables Robust Robust Robust RobustCoef. Std. Err. P>|t| Coef. Std. Err. P>|t| Coef. Std. Err. P>|t| Coef. Std. Err. P>|t|
constant 2.340 0.012 0.000 *** 1.965 0.025 0.000 *** 1.821 0.103 0.000 *** 1.798 0.104 0.000 ***Qualifications since 1991 by NQF levelAcademic Level 1 -0.573 0.048 0.000 *** -0.621 0.070 0.000 *** -0.617 0.076 0.000 *** -0.604 0.051 0.000 ***Academic Level 2 0.151 0.081 0.063 * 0.115 0.080 0.152 0.159 0.081 0.049 ** 0.150 0.081 0.063 *Academic Level 3 -0.018 0.155 0.907 -0.093 0.125 0.459 -0.083 0.130 0.526 -0.084 0.128 0.509Academic Level 4 0.048 0.047 0.304 -0.008 0.045 0.861 -0.027 0.046 0.560 -0.039 0.045 0.393Academic Level 5 0.375 0.080 0.000 *** 0.153 0.080 0.056 * 0.158 0.078 0.042 ** 0.149 0.077 0.054 **Vocationally-related Level 1 0.241 0.094 0.011 ** 0.182 0.044 0.000 *** 0.250 0.090 0.005 *** 0.324 0.077 0.000 ***Vocationally-related Level 2 -0.094 0.062 0.130 -0.061 0.063 0.336 -0.051 0.061 0.406 -0.062 0.060 0.306Vocationally-related Level 3 0.006 0.063 0.926 0.037 0.058 0.518 0.032 0.057 0.573 0.057 0.058 0.325Vocationally-related Level 4 -0.051 0.058 0.381 -0.044 0.065 0.498 -0.050 0.069 0.467 -0.058 0.069 0.402Occupational Level 1 -0.018 0.027 0.513 -0.021 0.024 0.382 -0.023 0.024 0.356 -0.025 0.024 0.295Occupational Level 2 -0.179 0.033 0.000 *** -0.111 0.033 0.001 *** -0.110 0.033 0.001 *** -0.112 0.032 0.000 ***Occupational Level 3 -0.018 0.057 0.748 0.007 0.053 0.895 0.023 0.054 0.672 0.027 0.054 0.609Occupational Level 4 -0.100 0.050 0.043 ** -0.091 0.046 0.049 ** -0.094 0.047 0.043 ** -0.069 0.044 0.120Occupational Level 5 0.188 0.048 0.000 *** 0.077 0.046 0.094 * 0.065 0.046 0.162 0.062 0.044 0.155Prior School Qualifications:
CSE grade 2-5 0.185 0.032 0.000 *** 0.168 0.033 0.000 *** 0.163 0.033 0.000 ***< 5 O levels 0.300 0.030 0.000 *** 0.254 0.031 0.000 *** 0.253 0.031 0.000 ***> 5 O levels 0.431 0.037 0.000 *** 0.348 0.039 0.000 *** 0.340 0.039 0.000 ***A levels 0.586 0.034 0.000 *** 0.477 0.039 0.000 *** 0.469 0.039 0.000 ***Prior Post-School Qualifications:Lower vocational 0.000 0.025 0.989 -0.002 0.025 0.929 -0.002 0.025 0.947Middle vocational 0.048 0.029 0.105 0.047 0.029 0.108 0.045 0.029 0.118Higher vocational 0.119 0.030 0.000 *** 0.117 0.030 0.000 *** 0.120 0.030 0.000 ***Degree 0.171 0.039 0.000 *** 0.133 0.039 0.001 *** 0.137 0.039 0.000 ***Maths attainment at age 7:5th quintile (highest) 0.121 0.035 0.000 *** 0.125 0.034 0.000 ***4th quintile 0.068 0.031 0.029 ** 0.067 0.031 0.028 **3rd quintile 0.072 0.032 0.023 ** 0.075 0.031 0.016 **2nd quintile 0.088 0.030 0.003 *** 0.095 0.030 0.001 ***Reading attainment at age 7:5th quintile (highest) 0.022 0.037 0.551 0.021 0.037 0.5694th quintile 0.044 0.034 0.199 0.042 0.034 0.2193rd quintile 0.043 0.031 0.173 0.039 0.031 0.2072nd quintile 0.056 0.029 0.052 ** 0.056 0.028 0.050 **Type of school 1974:Secondary modern -0.012 0.025 0.644 -0.007 0.025 0.781Grammar 0.064 0.032 0.047 ** 0.058 0.032 0.068 *Private 0.135 0.053 0.011 *** 0.129 0.052 0.013 ***Other 0.062 0.061 0.308 0.045 0.060 0.455Parents' education:Father's years of edn 0.014 0.007 0.061 * 0.014 0.007 0.051 **Father's edn missing 0.128 0.098 0.189 0.139 0.097 0.152Mother's years of edn -0.005 0.009 0.603 -0.004 0.009 0.622Mother's edn missing -0.052 0.110 0.636 -0.054 0.109 0.621Father's social class 1974:Professional/Intermediate 0.006 0.038 0.871 0.007 0.038 0.845Skilled non-manual 0.061 0.042 0.153 0.066 0.042 0.115Skilled manual -0.050 0.032 0.118 -0.045 0.032 0.158Semi-skilled non-manual 0.068 0.154 0.659 0.043 0.154 0.780Semi-skilled manual -0.074 0.040 0.065 * -0.068 0.040 0.087 *Bad finances 1969 or 1974 -0.043 0.025 0.084 * -0.042 0.025 0.091 *Father's interest in education:Expects too much 0.046 0.101 0.650 0.038 0.097 0.693Very interested 0.023 0.031 0.467 0.025 0.031 0.412Some interest 0.007 0.024 0.772 0.005 0.024 0.821Mother's interest in education:Expects too much 0.025 0.059 0.670 0.035 0.058 0.543Very interested 0.001 0.033 0.966 0.011 0.032 0.740Some interest 0.017 0.027 0.521 0.024 0.027 0.366Union member in 2000 -0.022 0.019 0.245Employed in large firm in 2000 0.152 0.022 0.000 ***Employed in public sector in 2000 -0.072 0.021 0.001 ***
Number of Observations 2378 2378 2378 2378R2 0.0284 0.2155 0.2398 0.2581
Dependent variable is log hourly earnings in 2000TABLE 10: Wage Regression - OLS Regression - Males
*, **, *** indicates that the variable is significant at the 10%, 5% and 1% level respectively.
51

Robust Robust Robust RobustCoef. Std. Err. P>|t| Coef. Std. Err. P>|t| Coef. Std. Err. P>|t| Coef. Std. Err. P>|t|
constant 1.953 0.014 0.000 *** 1.623 0.031 0.000 *** 1.444 0.103 0.000 *** 1.424 0.100 0.000 ***Qualifications since 1991 by NQF levelAcademic Level 1 -0.298 0.169 0.078 * -0.174 0.175 0.322 -0.154 0.162 0.341 -0.197 0.157 0.212Academic Level 2 0.001 0.049 0.990 0.046 0.050 0.363 0.045 0.049 0.367 0.039 0.048 0.420Academic Level 3 -0.162 0.073 0.028 ** -0.186 0.074 0.012 ** -0.211 0.074 0.005 *** -0.188 0.070 0.007 ***Academic Level 4 0.171 0.037 0.000 *** 0.093 0.037 0.013 ** 0.079 0.038 0.037 ** 0.066 0.036 0.063 *Academic Level 5 0.412 0.068 0.000 *** 0.116 0.073 0.113 0.093 0.076 0.219 0.081 0.077 0.290Vocationally-related Level 1 0.405 0.080 0.000 *** 0.397 0.048 0.000 *** 0.394 0.043 0.000 *** 0.314 0.048 0.000 ***Vocationally-related Level 2 -0.092 0.064 0.150 -0.081 0.064 0.208 -0.083 0.061 0.176 -0.087 0.057 0.124Vocationally-related Level 3 -0.077 0.069 0.265 -0.004 0.054 0.937 0.017 0.055 0.761 0.013 0.054 0.811Vocationally-related Level 4 0.012 0.078 0.881 0.050 0.073 0.497 0.069 0.076 0.367 0.032 0.073 0.664Occupational Level 1 -0.048 0.027 0.078 * -0.040 0.025 0.111 -0.039 0.025 0.120 -0.034 0.024 0.148Occupational Level 2 -0.111 0.034 0.001 *** -0.048 0.033 0.151 -0.049 0.035 0.154 -0.062 0.033 0.065 *Occupational Level 3 0.041 0.049 0.399 0.041 0.047 0.383 0.055 0.047 0.244 0.041 0.048 0.389Occupational Level 4 0.252 0.040 0.000 *** 0.132 0.040 0.001 *** 0.135 0.041 0.001 *** 0.089 0.039 0.022 **Occupational Level 5 0.198 0.060 0.001 *** 0.053 0.062 0.390 0.059 0.060 0.330 0.033 0.059 0.579Prior School Qualifications:CSE grade 2-5 0.088 0.040 0.027 ** 0.080 0.040 0.047 ** 0.063 0.039 0.106< 5 O levels 0.208 0.036 0.000 *** 0.189 0.039 0.000 *** 0.168 0.038 0.000 ***> 5 O levels 0.387 0.040 0.000 *** 0.345 0.042 0.000 *** 0.311 0.041 0.000 ***A levels 0.585 0.042 0.000 *** 0.526 0.045 0.000 *** 0.476 0.044 0.000 ***Prior Post-School Qualifications:Lower vocational 0.022 0.025 0.360 0.020 0.024 0.417 0.032 0.024 0.182Middle vocational -0.029 0.074 0.696 -0.053 0.074 0.474 -0.043 0.074 0.561Higher vocational 0.172 0.031 0.000 *** 0.165 0.031 0.000 *** 0.127 0.030 0.000 ***Degree 0.214 0.042 0.000 *** 0.183 0.043 0.000 *** 0.180 0.043 0.000 ***Maths attainment at age 7:5th quintile (highest) 0.056 0.037 0.127 0.041 0.036 0.2594th quintile 0.049 0.035 0.161 0.046 0.034 0.1843rd quintile -0.018 0.035 0.603 -0.025 0.035 0.4712nd quintile -0.014 0.034 0.681 -0.010 0.034 0.769Reading attainment at age 7:5th quintile (highest) -0.015 0.044 0.726 -0.022 0.043 0.6164th quintile 0.004 0.043 0.931 -0.005 0.042 0.9083rd quintile 0.022 0.041 0.591 0.017 0.040 0.6802nd quintile -0.034 0.043 0.422 -0.048 0.041 0.242Type of school 1974:Secondary modern -0.003 0.028 0.922 -0.006 0.027 0.828Grammar 0.007 0.034 0.844 0.017 0.033 0.615Private 0.117 0.050 0.019 ** 0.137 0.049 0.005 ***Other -0.047 0.068 0.490 -0.047 0.070 0.502Parents' education:Father's years of edn -0.002 0.007 0.782 -0.002 0.007 0.711Father's edn missing -0.023 0.096 0.811 -0.026 0.090 0.774Mother's years of edn 0.019 0.008 0.016 ** 0.018 0.007 0.014 **Mother's edn missing 0.201 0.098 0.041 ** 0.181 0.092 0.050 **Father's social class 1974:Professional/Intermediate -0.069 0.037 0.063 * -0.072 0.036 0.045 **Skilled non-manual -0.021 0.042 0.621 -0.034 0.041 0.401Skilled manual -0.024 0.034 0.485 -0.034 0.033 0.303Semi-skilled non-manual 0.001 0.070 0.991 -0.019 0.070 0.791Semi-skilled manual -0.054 0.039 0.171 -0.058 0.038 0.123Bad finances 1969 or 1974 0.006 0.027 0.824 -0.005 0.027 0.846Father's interest in education:Expects too much 0.029 0.104 0.780 0.002 0.097 0.987Very interested 0.012 0.029 0.686 0.013 0.028 0.638Some interest -0.031 0.028 0.259 -0.022 0.027 0.420Mother's interest in education:Expects too much 0.097 0.080 0.228 0.093 0.080 0.245Very interested 0.059 0.036 0.096 0.054 0.035 0.115Some interest 0.057 0.031 0.070 * 0.052 0.031 0.090 *Union member in 2000 0.141 0.022 0.000 ***Employed in large firm in 2000 0.173 0.023 0.000 ***Employed in public sector in 2000 -0.004 0.023 0.877
Number of obs 2004 2004 2004 2004R-squared 0.0478 0.2691 0.2852 0.3243
TABLE 11: Wage Regression - OLS Regression - FemalesDependent variable is log hourly earnings in 2000
*, **, *** indicates that the variable is significant at the 10%, 5% and 1% level respectively.
52
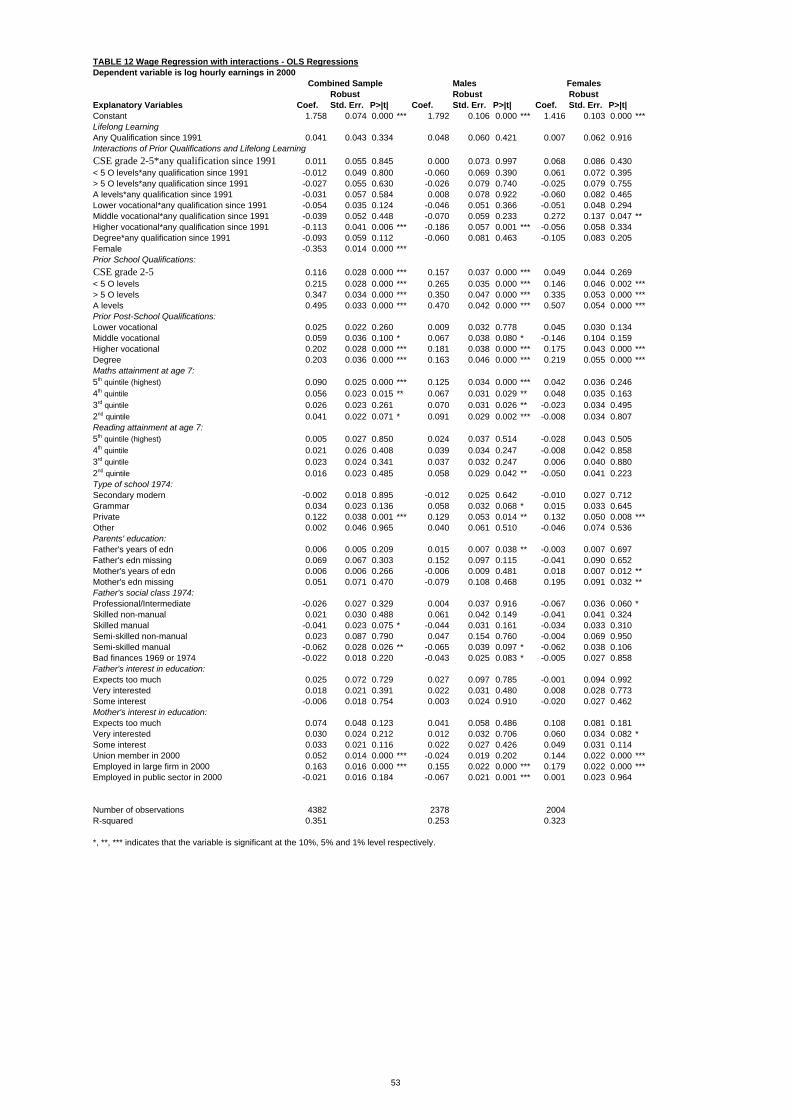
Robust Robust RobustExplanatory Variables Coef. Std. Err. P>|t| Coef. Std. Err. P>|t| Coef. Std. Err. P>|t|Constant 1.758 0.074 0.000 *** 1.792 0.106 0.000 *** 1.416 0.103 0.000 ***Lifelong LearningAny Qualification since 1991 0.041 0.043 0.334 0.048 0.060 0.421 0.007 0.062 0.916Interactions of Prior Qualifications and Lifelong LearningCSE grade 2-5*any qualification since 1991 0.011 0.055 0.845 0.000 0.073 0.997 0.068 0.086 0.430< 5 O levels*any qualification since 1991 -0.012 0.049 0.800 -0.060 0.069 0.390 0.061 0.072 0.395> 5 O levels*any qualification since 1991 -0.027 0.055 0.630 -0.026 0.079 0.740 -0.025 0.079 0.755A levels*any qualification since 1991 -0.031 0.057 0.584 0.008 0.078 0.922 -0.060 0.082 0.465Lower vocational*any qualification since 1991 -0.054 0.035 0.124 -0.046 0.051 0.366 -0.051 0.048 0.294Middle vocational*any qualification since 1991 -0.039 0.052 0.448 -0.070 0.059 0.233 0.272 0.137 0.047 **Higher vocational*any qualification since 1991 -0.113 0.041 0.006 *** -0.186 0.057 0.001 *** -0.056 0.058 0.334Degree*any qualification since 1991 -0.093 0.059 0.112 -0.060 0.081 0.463 -0.105 0.083 0.205Female -0.353 0.014 0.000 ***Prior School Qualifications:CSE grade 2-5 0.116 0.028 0.000 *** 0.157 0.037 0.000 *** 0.049 0.044 0.269< 5 O levels 0.215 0.028 0.000 *** 0.265 0.035 0.000 *** 0.146 0.046 0.002 ***> 5 O levels 0.347 0.034 0.000 *** 0.350 0.047 0.000 *** 0.335 0.053 0.000 ***A levels 0.495 0.033 0.000 *** 0.470 0.042 0.000 *** 0.507 0.054 0.000 ***Prior Post-School Qualifications:Lower vocational 0.025 0.022 0.260 0.009 0.032 0.778 0.045 0.030 0.134Middle vocational 0.059 0.036 0.100 * 0.067 0.038 0.080 * -0.146 0.104 0.159Higher vocational 0.202 0.028 0.000 *** 0.181 0.038 0.000 *** 0.175 0.043 0.000 ***Degree 0.203 0.036 0.000 *** 0.163 0.046 0.000 *** 0.219 0.055 0.000 ***Maths attainment at age 7:5th quintile (highest) 0.090 0.025 0.000 *** 0.125 0.034 0.000 *** 0.042 0.036 0.2464th quintile 0.056 0.023 0.015 ** 0.067 0.031 0.029 ** 0.048 0.035 0.1633rd quintile 0.026 0.023 0.261 0.070 0.031 0.026 ** -0.023 0.034 0.4952nd quintile 0.041 0.022 0.071 * 0.091 0.029 0.002 *** -0.008 0.034 0.807Reading attainment at age 7:5th quintile (highest) 0.005 0.027 0.850 0.024 0.037 0.514 -0.028 0.043 0.5054th quintile 0.021 0.026 0.408 0.039 0.034 0.247 -0.008 0.042 0.8583rd quintile 0.023 0.024 0.341 0.037 0.032 0.247 0.006 0.040 0.8802nd quintile 0.016 0.023 0.485 0.058 0.029 0.042 ** -0.050 0.041 0.223Type of school 1974:Secondary modern -0.002 0.018 0.895 -0.012 0.025 0.642 -0.010 0.027 0.712Grammar 0.034 0.023 0.136 0.058 0.032 0.068 * 0.015 0.033 0.645Private 0.122 0.038 0.001 *** 0.129 0.053 0.014 ** 0.132 0.050 0.008 ***Other 0.002 0.046 0.965 0.040 0.061 0.510 -0.046 0.074 0.536Parents' education:Father's years of edn 0.006 0.005 0.209 0.015 0.007 0.038 ** -0.003 0.007 0.697Father's edn missing 0.069 0.067 0.303 0.152 0.097 0.115 -0.041 0.090 0.652Mother's years of edn 0.006 0.006 0.266 -0.006 0.009 0.481 0.018 0.007 0.012 **Mother's edn missing 0.051 0.071 0.470 -0.079 0.108 0.468 0.195 0.091 0.032 **Father's social class 1974:Professional/Intermediate -0.026 0.027 0.329 0.004 0.037 0.916 -0.067 0.036 0.060 *Skilled non-manual 0.021 0.030 0.488 0.061 0.042 0.149 -0.041 0.041 0.324Skilled manual -0.041 0.023 0.075 * -0.044 0.031 0.161 -0.034 0.033 0.310Semi-skilled non-manual 0.023 0.087 0.790 0.047 0.154 0.760 -0.004 0.069 0.950Semi-skilled manual -0.062 0.028 0.026 ** -0.065 0.039 0.097 * -0.062 0.038 0.106Bad finances 1969 or 1974 -0.022 0.018 0.220 -0.043 0.025 0.083 * -0.005 0.027 0.858Father's interest in education:Expects too much 0.025 0.072 0.729 0.027 0.097 0.785 -0.001 0.094 0.992Very interested 0.018 0.021 0.391 0.022 0.031 0.480 0.008 0.028 0.773Some interest -0.006 0.018 0.754 0.003 0.024 0.910 -0.020 0.027 0.462Mother's interest in education:Expects too much 0.074 0.048 0.123 0.041 0.058 0.486 0.108 0.081 0.181Very interested 0.030 0.024 0.212 0.012 0.032 0.706 0.060 0.034 0.082 *Some interest 0.033 0.021 0.116 0.022 0.027 0.426 0.049 0.031 0.114Union member in 2000 0.052 0.014 0.000 *** -0.024 0.019 0.202 0.144 0.022 0.000 ***Employed in large firm in 2000 0.163 0.016 0.000 *** 0.155 0.022 0.000 *** 0.179 0.022 0.000 ***Employed in public sector in 2000 -0.021 0.016 0.184 -0.067 0.021 0.001 *** 0.001 0.023 0.964
Number of observations 4382 2378 2004R-squared 0.351 0.253 0.323
*, **, *** indicates that the variable is significant at the 10%, 5% and 1% level respectively.
FemalesDependent variable is log hourly earnings in 2000TABLE 12 Wage Regression with interactions - OLS Regressions
Combined Sample Males
53

Explanatory Variables Robust Robust RobustCoef. Std. Err. P>|t| Coef. Std. Err. P>|t| Coef. Std. Err. P>|t|
Qualifications since 1991 by NQF levelAcademic Level 1 -0.060 0.116 0.605 -0.042 0.168 0.803 -0.102 0.147 0.488Academic Level 2 0.063 0.042 0.135 0.130 0.066 0.049 ** 0.036 0.052 0.490Academic Level 3 -0.134 0.066 0.042 ** 0.006 0.097 0.952 -0.196 0.083 0.018 **Academic Level 4 0.005 0.032 0.889 -0.026 0.045 0.569 0.021 0.046 0.649Academic Level 5 0.013 0.055 0.820 0.089 0.077 0.253 -0.103 0.069 0.138Vocationally-related Level 1 0.247 0.164 0.133 0.404 0.163 0.013 ** 0.126 0.247 0.610Vocationally-related Level 2 0.038 0.035 0.277 -0.016 0.046 0.735 0.082 0.052 0.116Vocationally-related Level 3 -0.029 0.046 0.526 -0.006 0.058 0.924 -0.045 0.068 0.504Vocationally-related Level 4 0.099 0.044 0.024 ** 0.012 0.050 0.805 0.217 0.074 0.003 ***Occupational Level 1 0.000 0.017 0.988 -0.014 0.023 0.543 0.016 0.026 0.548Occupational Level 2 -0.018 0.024 0.451 -0.048 0.033 0.148 0.007 0.034 0.840Occupational Level 3 0.031 0.041 0.446 0.001 0.058 0.988 0.065 0.057 0.255Occupational Level 4 0.015 0.032 0.627 -0.050 0.045 0.263 0.051 0.044 0.241Occupational Level 5 0.025 0.035 0.474 0.014 0.044 0.751 0.042 0.057 0.456Constant 0.112 0.007 0.000 *** 0.116 0.010 0.000 *** 0.108 0.011 0.000 ***
Number of observations 4382 2378 2004R-squared 0.003 0.005 0.011
TABLE 13 First Difference Equations - OLS RegressionsDependent variable is the change in log hourly wage 1991 to 2000
*, **, *** indicates that the variable is significant at the 10%, 5% and 1% level respectively.
Combined sample Males Females
54

Educational attainment in 1991Coef. Std Error Coef. Std Error Coef. Std Error Coef. Std Error Coef. Std Error Coef. Std Error
Constant 1.814 [0.316]*** 2.071 [0.259]*** 2.155 [0.156]*** 2.206 [0.224]*** 2.239 [0.247]*** 2.854 [0.343]***Lifelong LearningAny academic qualification since 1991 0.479 [0.198]** -0.349 [0.181]* 0.368 [0.183]** 0.117 [0.140] 1.173 [0.861] 0.404 [0.262]Any vocationally-related qualification since 1991 0.023 [0.126] 0.261 [0.294] -0.029 [0.141] 0.026 [0.151] -0.161 [0.164] -0.546 [0.132]***Any occupational qualification since 1991 0.035 [0.077] 0.093 [0.104] 0.014 [0.079] 0.282 [0.146]* -0.426 [0.184]** -0.602 [0.271]**Currently on a course leading to qualification 0.101 [0.078] 0.103 [0.048]** 0.059 [0.038] -0.036 [0.056] 0.049 [0.049] -0.143 [0.068]**Maths attainment at age 75 quintile 0.013 [0.083] -0.011 [0.076] 0.128 [0.055]** 0.083 [0.091] 0.046 [0.080] -0.285 [0.215]4 quintile 0.062 [0.078] 0.053 [0.056] 0.116 [0.049]** 0.062 [0.092] -0.032 [0.077] -0.357 [0.225]3 quintile 0.044 [0.059] 0.023 [0.050] 0.076 [0.054] 0.073 [0.098] -0.101 [0.079] -0.363 [0.218]*2 quintile 0.082 [0.060] 0.03 [0.046] 0.109 [0.053]** 0.053 [0.090] -0.07 [0.087] -0.421 [0.221]*Reading attainment at age 75 quintile 0.003 [0.105] -0.011 [0.077] 0.008 [0.059] 0.221 [0.102]** 0.026 [0.147] -0.041 [0.229]4 quintile 0.08 [0.084] 0.124 [0.063]** 0.023 [0.061] 0.224 [0.101]** 0.041 [0.146] 0.006 [0.230]3 quintile 0.04 [0.064] 0.132 [0.059]** -0.014 [0.055] 0.176 [0.102]* 0.059 [0.146] -0.022 [0.231]2 quintile -0.053 [0.055] 0.095 [0.043]** 0.011 [0.058] 0.27 [0.115]** -0.015 [0.146] 0.057 [0.241]Learning/attainment interactionsAcad*math5 -0.333 [0.311] 0.303 [0.202] -0.214 [0.193] 0.12 [0.127] -0.176 [0.163] -0.335 [0.207]Acad*math4 0.455 [0.242]* -0.04 [0.189] -0.355 [0.193]* 0.086 [0.131] -0.122 [0.188] -0.209 [0.235]Acad*math3 -0.658 [0.206]*** 0.185 [0.179] -0.196 [0.182] 0.031 [0.123] -0.126 [0.192] -0.219 [0.266]Acad*math2 -0.524 [0.244]** 0.437 [0.179]** -0.232 [0.195] -0.119 [0.137] -0.82 [0.385]** 0 [0.000]Acad*read5 -0.172 [0.369] 0.683 [0.240]*** 0.109 [0.231] -0.128 [0.142] -1.102 [0.856] 0.006 [0.221]Acad*read4 -0.458 [0.263]* 0.157 [0.174] -0.105 [0.179] -0.169 [0.136] -1.068 [0.856] 0.056 [0.260]Acad*read3 -0.716 [0.329]** 0.411 [0.185]** -0.053 [0.179] -0.138 [0.143] -0.891 [0.837] -0.401 [0.316]Acad*read2 -0.008 [0.225] -0.023 [0.170] -0.135 [0.179] -0.115 [0.137] -1.19 [0.869] 0 [0.000]Voc*math5 0 [0.000] 0.488 [0.312] 0.035 [0.096] -0.073 [0.158] -0.057 [0.175] 0 [0.000]Voc*math4 -0.21 [0.169] -0.139 [0.172] 0.047 [0.095] -0.042 [0.190] 0.63 [0.260]** 0 [0.000]Voc*math3 -0.014 [0.155] -0.048 [0.189] 0.195 [0.101]* -0.204 [0.235] 0.202 [0.269] 0.568 [0.225]**Voc*math2 -0.559 [0.123]*** -0.028 [0.174] 0.194 [0.115]* 0.086 [0.161] 0 [0.000] 0.297 [0.300]Voc*read5 0.22 [0.301] -0.021 [0.312] -0.121 [0.144] -0.123 [0.194] -0.175 [0.186] 0 [0.000]Voc*read4 0.523 [0.280]* 0.06 [0.295] -0.065 [0.144] -0.165 [0.168] -0.26 [0.264] 0 [0.000]Voc*read3 0.497 [0.213]** -0.342 [0.288] -0.009 [0.149] 0.072 [0.232] -0.291 [0.280] -0.038 [0.398]Voc*read2 0.147 [0.149] -0.411 [0.270] -0.056 [0.138] -0.118 [0.182] 0 [0.000] 0 [0.000]Occ*math5 -0.3 [0.277] 0.185 [0.139] -0.054 [0.088] 0.006 [0.140] 0.012 [0.126] 0.53 [0.313]*Occ*math4 -0.21 [0.178] 0.071 [0.117] -0.032 [0.084] -0.004 [0.138] 0.018 [0.133] 0.604 [0.315]*Occ*math3 0.125 [0.114] 0.099 [0.111] -0.059 [0.087] -0.035 [0.134] 0.104 [0.124] 0.574 [0.328]*Occ*math2 0.01 [0.126] -0.093 [0.104] -0.056 [0.081] 0.006 [0.134] 0.204 [0.160] 0.504 [0.339]Occ*read5 0.437 [0.294] -0.181 [0.172] 0.056 [0.091] -0.307 [0.138]** 0.398 [0.189]** -0.03 [0.193]Occ*read4 -0.208 [0.177] -0.419 [0.154]*** 0.038 [0.089] -0.298 [0.136]** 0.316 [0.187]* -0.075 [0.204]Occ*read3 0.083 [0.154] -0.119 [0.114] 0.027 [0.089] -0.259 [0.141]* 0.364 [0.189]* 0.109 [0.286]Occ*read2 0.201 [0.148] -0.102 [0.102] -0.055 [0.084] -0.432 [0.151]*** 0.428 [0.205]** 0 [0.000]Female -0.299 [0.040]*** -0.411 [0.036]*** -0.404 [0.024]*** -0.352 [0.040]*** -0.24 [0.038]*** -0.162 [0.049]***Regionnorth -0.333 [0.106]*** -0.296 [0.094]*** -0.248 [0.066]*** -0.236 [0.096]** -0.305 [0.138]** -0.075 [0.159]north west -0.377 [0.098]*** -0.293 [0.083]*** -0.242 [0.054]*** -0.169 [0.087]* -0.22 [0.080]*** -0.025 [0.099]yorkshire & humberside -0.397 [0.093]*** -0.369 [0.079]*** -0.236 [0.058]*** -0.154 [0.089]* -0.239 [0.078]*** -0.162 [0.101]west midlands -0.372 [0.097]*** -0.337 [0.076]*** -0.212 [0.061]*** -0.125 [0.088] -0.285 [0.089]*** -0.08 [0.129]east midlands -0.457 [0.105]*** -0.271 [0.085]*** -0.319 [0.061]*** -0.24 [0.097]** -0.169 [0.091]* -0.075 [0.102]east anglia -0.429 [0.128]*** -0.259 [0.089]*** -0.339 [0.070]*** -0.007 [0.141] -0.195 [0.112]* 0.034 [0.151]south west -0.36 [0.118]*** -0.319 [0.079]*** -0.157 [0.060]*** -0.098 [0.099] -0.142 [0.091] -0.154 [0.104]south east -0.222 [0.101]** -0.146 [0.078]* -0.098 [0.053]* -0.043 [0.080] -0.097 [0.072] -0.101 [0.091]wales -0.174 [0.153] -0.589 [0.129]*** -0.239 [0.058]*** -0.272 [0.101]*** -0.064 [0.101] -0.033 [0.136]scotland -0.422 [0.097]*** 0.166 [0.119] -0.307 [0.056]*** -0.164 [0.097]* -0.266 [0.074]*** -0.017 [0.087]Type of school 1974Secondary modern 0.059 [0.050] -0.031 [0.033] -0.021 [0.033] -0.046 [0.052] 0.143 [0.086]* 0.09 [0.135]Grammar school 0.078 [0.135] -0.089 [0.137] -0.06 [0.043] 0.117 [0.054]** -0.004 [0.043] 0.01 [0.061]Public school -0.141 [0.188] 0.039 [0.201] -0.007 [0.082] 0.104 [0.077] 0.156 [0.067]** 0.08 [0.071]Other school 0.062 [0.092] -0.147 [0.132] 0.066 [0.088] -0.322 [0.095]*** -0.049 [0.150] -0.02 [0.133]Parent's educationFather's years of edn -0.008 [0.024] 0.023 [0.021] 0.002 [0.010] 0.01 [0.013] 0.012 [0.009] 0.003 [0.013]Father's edn missing -0.025 [0.286] 0.209 [0.220] 0.083 [0.118] 0.095 [0.162] -0.015 [0.170] -0.156 [0.223]Mother's years of edn 0.044 [0.025]* -0.02 [0.024] 0.002 [0.013] -0.021 [0.014] 0.011 [0.011] 0.016 [0.015]Mother's edn missing 0.281 [0.281] -0.138 [0.246] -0.06 [0.131] -0.274 [0.175] 0.27 [0.171] 0.37 [0.216]*Father's social class 1974intermediate 0.101 [0.120] -0.073 [0.078] -0.002 [0.050] -0.073 [0.057] -0.021 [0.062] 0.025 [0.074]skilled non-manual 0.033 [0.151] -0.014 [0.080] -0.016 [0.052] -0.034 [0.069] 0.091 [0.074] 0.102 [0.111]skilled manual -0.112 [0.103] -0.047 [0.048] -0.034 [0.039] -0.05 [0.052] 0.075 [0.066] 0.009 [0.079]semi-skilled non-man 0.011 [0.145] -0.107 [0.254] 0.024 [0.097] 0.227 [0.404] 0.008 [0.148] 0 [0.000]semi-skilled manual -0.082 [0.102] -0.022 [0.062] -0.046 [0.046] -0.092 [0.073] 0.014 [0.080] -0.015 [0.127]Bad finances 1969 or 1974 -0.074 [0.055] -0.008 [0.036] 0.012 [0.032] -0.05 [0.058] -0.018 [0.052] 0.04 [0.071]Father's interest in educationExpects too much 0 [0.000] -0.021 [0.093] 0.003 [0.071] 0.023 [0.158]** -0.003 [0.132] -0.203 [0.179]Very interested 0.135 [0.083] 0.1 [0.060] 0.026 [0.041] 0.052 [0.071] -0.008 [0.051] 0.112 [0.064]*Some interest 0.005 [0.051] 0.082 [0.036] -0.013 [0.036] -0.04 [0.059] 0.031 [0.053] 0.044 [0.107]Mother's interest in educationExpects too much -0.162 [0.107] 0.163 [0.099] -0.018 [0.109] 0.378 [0.238] 0.147 [0.110] 0.177 [0.133]Very interested -0.069 [0.060] 0.031 [0.051]** 0.041 [0.036] 0.003 [0.056] -0.004 [0.075] -0.096 [0.103]Some interest -0.039 [0.047] -0.023 [0.039]** 0.029 [0.030] 0.095 [0.047]** 0.016 [0.080] -0.051 [0.123]Firm sizeFrom 10 to 24 employees 0.076 [0.069] 0.09 [0.050]* 0.09 [0.042]** 0.155 [0.079]** 0.162 [0.072]** 0.07 [0.110]From 25 to 99 0.074 [0.069] 0.171 [0.051]*** 0.11 [0.038]*** 0.151 [0.067]** 0.214 [0.070]*** -0.003 [0.100]From 100 to 499 0.131 [0.071]* 0.144 [0.048]*** 0.15 [0.037]*** 0.238 [0.067]*** 0.243 [0.067]*** 0.143 [0.100]More than 500 0.215 [0.085]** 0.282 [0.056]*** 0.248 [0.040]*** 0.241 [0.067]*** 0.289 [0.069]*** 0.31 [0.097]***Union member in 2000 0.128 [0.041]*** 0.026 [0.037] 0.093 [0.025]*** 0.093 [0.040]** 0.009 [0.037] -0.15 [0.059]**Employed in public sector in 2000 0.081 [0.052] 0.027 [0.039] 0.026 [0.030] -0.007 [0.044] -0.058 [0.037] -0.088 [0.061]Observations 457 642 1445 747 641 433R-squared 0.39 0.4 0.28 0.26 0.27 0.29
Table 14 Wage Regressions by maximum educational attainment with ability interactions and on-going learning.Dependent variable is log hourly earnings in 2000
A levels Degree/Higher degreeNo Qualifications CSE <5 0-levels >5 0-levels
55

Table 15: Wage Regressions by maximum educational attainment with ability interactions and on-going learning. (General definition of LLL)Dependent variable is log hourly earnings in 2000
Coef. Std Error Coef. Std Error Coef. Std Error Coef. Std Error Coef. Std Error Coef. Std ErrorConstant 1.731 [0.288]*** 2.076 [0.249]*** 2.166 [0.156]*** 2.224 [0.222]*** 2.221 [0.243]*** 2.854 [0.339]***Any qualification since 1991 0.125 [0.071]* 0.106 [0.096] 0.027 [0.076] 0.214 [0.138] 0.026 [0.393] -0.694 [0.335]**Currently on a course leading to qualification 0.063 [0.071] 0.095 [0.047]** 0.061 [0.038] -0.046 [0.054] 0.04 [0.051] -0.14 [0.066]**Interactions LLL and attainment at age 7LLL*math5 -0.307 [0.219] 0.247 [0.132]* -0.032 [0.084] 0.062 [0.119] 0.006 [0.132] 0.587 [0.290]**LLL*math4 -0.096 [0.154] 0.046 [0.107] -0.052 [0.079] 0.059 [0.120] 0.078 [0.126] 0.676 [0.301]**LLL*math3 0.018 [0.100] 0.134 [0.099] -0.03 [0.083] -0.014 [0.120] 0.051 [0.122] 0.623 [0.308]**LLL*math2 -0.138 [0.115] -0.003 [0.099] -0.048 [0.078] 0.022 [0.120] -0.04 [0.145] 0.617 [0.307]**LLL*read5 0.302 [0.216] -0.031 [0.174] 0.034 [0.089] -0.277 [0.130]** -0.112 [0.424] 0.073 [0.166]LLL*read4 -0.282 [0.143]** -0.35 [0.135]*** 0.02 [0.085] -0.285 [0.128]** -0.116 [0.422] 0.006 [0.179]LLL*read3 0.053 [0.144] -0.167 [0.103] 0.019 [0.085] -0.194 [0.130] -0.108 [0.421] 0 [0.000]LLL*read2 0.112 [0.115] -0.202 [0.092]** -0.063 [0.082] -0.371 [0.143]*** 0.036 [0.424] 0.108 [0.220]Female -0.298 [0.038]*** -0.408 [0.035]*** -0.404 [0.024]*** -0.351 [0.037]*** -0.237 [0.038]*** -0.171 [0.049]***Regionnorth -0.306 [0.104]*** -0.284 [0.090]*** -0.243 [0.065]*** -0.228 [0.093]** -0.324 [0.137]** -0.065 [0.156]north west -0.359 [0.094]*** -0.272 [0.082]*** -0.243 [0.054]*** -0.16 [0.085]* -0.214 [0.083]*** -0.032 [0.094]yorkshire & humberside -0.377 [0.089]*** -0.353 [0.077]*** -0.227 [0.058]*** -0.138 [0.085] -0.241 [0.078]*** -0.175 [0.098]*west midlands -0.359 [0.094]*** -0.328 [0.073]*** -0.207 [0.061]*** -0.102 [0.086] -0.294 [0.088]*** -0.078 [0.126]east midlands -0.415 [0.101]*** -0.273 [0.082]*** -0.322 [0.062]*** -0.237 [0.095]** -0.188 [0.088]** -0.085 [0.100]east anglia -0.402 [0.125]*** -0.251 [0.087]*** -0.333 [0.070]*** 0.008 [0.136] -0.222 [0.112]** 0.043 [0.156]south west -0.305 [0.116]*** -0.321 [0.076]*** -0.146 [0.059]** -0.079 [0.096] -0.175 [0.089]* -0.15 [0.101]south east -0.22 [0.097]** -0.134 [0.077]* -0.092 [0.053]* -0.031 [0.078] -0.099 [0.072] -0.103 [0.090]wales -0.171 [0.148] -0.52 [0.121]*** -0.232 [0.058]*** -0.256 [0.099]*** -0.044 [0.103] -0.015 [0.131]scotland -0.421 [0.093]*** 0.127 [0.109] -0.305 [0.055]*** -0.159 [0.094]* -0.268 [0.075]*** -0.02 [0.085]Maths attainment at age 75 quintile 0.022 [0.080] -0.012 [0.076] 0.125 [0.056]** 0.073 [0.091] 0.048 [0.078] -0.28 [0.211]4 quintile 0.068 [0.076] 0.057 [0.056] 0.117 [0.050]** 0.042 [0.094] -0.034 [0.076] -0.357 [0.221]3 quintile 0.047 [0.057] 0.024 [0.050] 0.079 [0.055] 0.065 [0.100] -0.084 [0.078] -0.359 [0.213]*2 quintile 0.09 [0.060] 0.031 [0.045] 0.114 [0.054]** 0.04 [0.091] -0.039 [0.084] -0.416 [0.216]*Reading attainment at age 75 quintile -0.003 [0.102] -0.016 [0.077] 0.011 [0.059] 0.22 [0.104]** 0.02 [0.142] -0.052 [0.230]4 quintile 0.089 [0.082] 0.13 [0.063]** 0.019 [0.061] 0.223 [0.103]** 0.03 [0.140] 0.006 [0.231]3 quintile 0.044 [0.063] 0.143 [0.058]** -0.016 [0.055] 0.162 [0.104] 0.066 [0.141] -0.026 [0.233]2 quintile -0.046 [0.053] 0.105 [0.042]** 0.009 [0.058] 0.271 [0.118]** -0.055 [0.139] 0.031 [0.244]Type of school 1974Secondary modern 0.052 [0.048] -0.029 [0.032] -0.021 [0.032] -0.042 [0.052] 0.119 [0.082] 0.102 [0.143]Grammar school 0.12 [0.121] -0.081 [0.139] -0.055 [0.043] 0.112 [0.052]** 0.003 [0.042] -0.002 [0.059]Public school -0.274 [0.156]* 0.053 [0.197] -0.016 [0.082] 0.108 [0.077] 0.165 [0.072]** 0.075 [0.070]Other school 0.055 [0.090] -0.072 [0.148] 0.058 [0.088] -0.324 [0.093]*** -0.063 [0.145] 0.094 [0.181]Parent's educationFather's years of edn -0.011 [0.022] 0.02 [0.020] 0.002 [0.010] 0.008 [0.013] 0.009 [0.009] 0.004 [0.013]Father's edn missing -0.083 [0.260] 0.186 [0.212] 0.074 [0.117] 0.078 [0.158] -0.044 [0.169] -0.126 [0.218]Mother's years of edn 0.049 [0.024]** -0.02 [0.023] 0.001 [0.012] -0.021 [0.014] 0.013 [0.011] 0.013 [0.015]Mother's edn missing 0.381 [0.264] -0.138 [0.234] -0.07 [0.130] -0.272 [0.171] 0.302 [0.169]* 0.321 [0.211]Father's social class 1974intermediate 0.104 [0.114] -0.067 [0.080] -0.002 [0.050] -0.085 [0.055] -0.017 [0.061] 0.028 [0.073]skilled non-manual 0.085 [0.141] -0.003 [0.078] -0.017 [0.051] -0.035 [0.067] 0.081 [0.074] 0.102 [0.107]skilled manual -0.099 [0.096] -0.035 [0.048] -0.041 [0.038] -0.057 [0.050] 0.059 [0.066] 0.013 [0.079]semi-skilled non-man -0.004 [0.134] -0.101 [0.247] 0.015 [0.096] 0.223 [0.392] -0.006 [0.117] 0 [0.000]semi-skilled manual -0.081 [0.097] -0.016 [0.061] -0.05 [0.045] -0.096 [0.071] 0.014 [0.079] -0.001 [0.121]Bad finances 1969 or 1974 -0.064 [0.052] -0.012 [0.036] 0.01 [0.031] -0.056 [0.058] -0.036 [0.050] 0.037 [0.073]Father's interest in educationExpects too much 0 [0.000] 0.147 [0.096] 0.002 [0.070] 0.379 [0.235] 0.134 [0.127] -0.149 [0.176]Very interested 0.14 [0.079]* 0.03 [0.050]* 0.04 [0.035] 0.003 [0.055] 0.001 [0.049] -0.065 [0.065]Some interest -0.018 [0.049] 0.073 [0.036] -0.018 [0.035] 0.103 [0.057] 0.094 [0.059] 0.084 [0.120]Mother's interest in educationExpects too much -0.171 [0.108] -0.005 [0.094] -0.03 [0.108] 0.04 [0.155]** 0.049 [0.101] 0.112 [0.123]Very interested -0.061 [0.057] 0.087 [0.057] 0.026 [0.041] 0.053 [0.068] 0.026 [0.073] 0.093 [0.105]Some interest -0.02 [0.046] -0.028 [0.041]* 0.034 [0.029] -0.044 [0.046]** 0.001 [0.089] -0.07 [0.104]Firm sizeFrom 10 to 24 employees 0.107 [0.065]* 0.093 [0.048]* 0.092 [0.042]** 0.152 [0.077]** 0.155 [0.075]** 0.078 [0.111]From 25 to 99 0.096 [0.066] 0.17 [0.050]*** 0.112 [0.037]*** 0.15 [0.065]** 0.201 [0.076]*** -0.003 [0.101]From 100 to 499 0.157 [0.068]** 0.164 [0.046]*** 0.152 [0.037]*** 0.231 [0.066]*** 0.227 [0.075]*** 0.152 [0.102]More than 500 0.26 [0.080]*** 0.281 [0.054]*** 0.253 [0.040]*** 0.245 [0.065]*** 0.288 [0.074]*** 0.321 [0.099]***Union member in 2000 0.122 [0.040]*** 0.024 [0.036] 0.09 [0.025]*** 0.1 [0.038]*** 0.006 [0.037] -0.161 [0.059]***Employed in public sector in 2000 0.076 [0.051] 0.037 [0.038] 0.034 [0.029] -0.01 [0.043] -0.058 [0.036] -0.07 [0.060]Number of observations 457 642 1445 747 641 433R-Squared 0.36 0.37 0.27 0.26 0.23 0.27
A levels Degree/Higher degreeNo Qualifications CSE <5 0-levels >5 0-levels
56

Education in 1991 No LLL LLL Difference/Std Err No LLL LLL Difference/Std Err No LLL LLL Difference/Std Err
No Qualifications Mean change 0.0498 -0.0006 -0.05044 0.131 0.15 0.0189 0.0845 0.0628 -0.0216Observations 205 59 0.05425 153 43 0.07704 358 102 0.0454Std Deviation 0.334 0.496247 0.4603 0.3915 0.3944 0.4401
CSE Mean change 0.1147 0.0489 -0.0657 0.065 0.1008 0.0358 0.09579 0.0701 -0.0257Observations 285 108 0.0461 176 74 0.0531 461 182 0.03494Std Deviation 0.4388 0.3148 0.3351 0.4798 0.4027 0.39
<5 0-levels Mean change 0.1078 0.0779 -0.0298 0.1283 0.1639 0.0355 0.1175 0.1235 0.006Observations 488 247 0.03 437 279 0.0345 925 526 0.0228Std Deviation 0.3995 0.3542 0.4527 0.4463 0.4254 0.4076
>5 0-levels Mean change 0.1133 0.1353 0.022 0.0883 0.161 0.0727 0.1019 0.1498 0.0479Observations 245 131 0.046 205 170 0.0424 450 301 0.0312Std Deviation 0.4665 0.3522 0.4077 0.4111 0.4404 0.428634
A-levels Mean change 0.1708 0.1689 -2.00E-03 0.1117 0.1462 0.0345 0.1469 0.1578 0.0109Observations 238 123 0.4417 162 119 0.048 400 242 0.0323Std Deviation 0.3845 0.4223 0.3905 0.4055 0.3876 0.4134
Degree/ Mean change 0.1347 0.2461 0.1114 0.0576 0.04144 0.010755 0.1028 0.1525 0.05Higher degree Observations 173 76 0.0622 122 64 0.070121 295 140 0.045
Std Deviation 0.4229 0.5125 0.0161 0.0634 0.4188 0.4788
Table 16: Changes in real log hourly earnings from 1991 to 2000.
Males Females AllLifelong learners vs non lifelong learners, by highest educational attainment in 1991
57

Table 17: Effects of Lifelong Learning on Wage Changes, by educational attainment in 1991 Dependent Variable: Difference of real log hourly earnings between 1991 and 2000.
Explanatory variables Coef. Std Error Coef. Std Error Coef. Std Error Coef. Std Error Coef. Std Error Coef. Std ErrorLifelong Learning VariablesCurrently on course leading to a qualification 0.0818 0.0682 0.1322 0.0461 0.0092 0.0375 -0.0305 0.0496 0.0115 0.0605 -0.0931 0.0617Any qualification since 1991 0.1261 0.0767 0.0982 0.1058 0.0341 0.0725 0.1742 0.1154 0.1692 0.2830 -0.1129 0.2433Interactions LLL and age 7 attainment LLL*math5 -0.1264 0.2536 0.1239 0.1333 -0.0601 0.0861 -0.0247 0.1094 -0.0119 0.1177 0.0247 0.1957LLL*math4 -0.1604 0.1540 -0.0442 0.1045 -0.0723 0.0784 0.0012 0.1086 -0.1024 0.1214 0.2321 0.2050LLL*math3 -0.0604 0.1182 0.0853 0.1100 -0.0953 0.0833 0.0384 0.1124 0.0312 0.1098 0.1356 0.2256LLL*math2 -0.2463 0.1230 -0.0679 0.0991 -0.0855 0.0775 0.0175 0.1071 -0.0108 0.1437 0.0565 0.2186LLL*read5 0.1231 0.2157 -0.1906 0.1529 0.0561 0.0833 -0.0835 0.1097 -0.0931 0.3007 0.1602 0.1595LLL*read4 -0.2741 0.1642 -0.2475 0.1335 0.0454 0.0819 -0.1251 0.1134 -0.1652 0.2916 0.0238 0.1727LLL*read3 -0.0378 0.1506 -0.1508 0.1089 0.0589 0.0815 -0.1127 0.1149 -0.2737 0.2970 (dropped)LLL*read2 0.0568 0.1331 -0.1790 0.1012 -0.0147 0.0787 -0.3108 0.1238 0.0229 0.3009 0.0906 0.2176Female 0.1063 0.0401 -0.0228 0.0345 0.0477 0.0229 -0.0035 0.0307 -0.0386 0.0314 -0.1037 0.0423Regionnorth 0.0299 0.1202 -0.0130 0.0732 0.0396 0.0707 0.0324 0.0725 -0.0597 0.1030 0.1315 0.1622north west -0.1829 0.1042 -0.0225 0.0662 -0.0394 0.0591 0.0103 0.0653 -0.0201 0.0833 -0.0038 0.0807yorkshire & humberside -0.1703 0.1075 -0.0602 0.0664 0.0179 0.0607 0.0669 0.0660 -0.0278 0.0764 -0.0025 0.0871west midlands -0.2093 0.1112 -0.0580 0.0645 0.0041 0.0662 0.0553 0.0707 0.0124 0.0810 -0.0063 0.1108east midlands -0.3248 0.1205 -0.1035 0.0728 -0.0898 0.0654 0.0130 0.0723 0.0460 0.0879 0.1874 0.0842east anglia -0.3816 0.1277 0.0196 0.0673 -0.0774 0.0657 0.1378 0.1237 -0.1580 0.1011 0.1448 0.1349south west -0.1821 0.1228 -0.0269 0.0745 0.0326 0.0634 0.0489 0.0741 0.0785 0.0823 0.0925 0.0889south east -0.2345 0.1070 -0.0317 0.0668 -0.0842 0.0575 -0.0177 0.0561 -0.0874 0.0735 -0.0014 0.0750wales 0.1076 0.1461 -0.2019 0.1415 -0.0169 0.0642 0.0393 0.0747 0.0851 0.0813 0.0750 0.1128scotland -0.1862 0.1042 0.4453 0.0864 0.0097 0.0588 0.0454 0.0746 -0.0549 0.0718 0.0242 0.0773Maths attainment at age 72 quintile 0.0680 0.0575 0.0297 0.0515 0.0847 0.0482 0.0584 0.0650 -0.0019 0.0813 -0.1631 0.13733 quintile 0.0029 0.0575 -0.0252 0.0504 0.0368 0.0504 0.0570 0.0737 -0.0154 0.0779 -0.1349 0.12844 quintile 0.0307 0.0672 0.0705 0.0546 0.0717 0.0455 0.0535 0.0689 0.0505 0.0745 -0.2241 0.13195 quintile -0.1036 0.0839 -0.0838 0.0841 0.0845 0.0509 0.0773 0.0703 -0.0025 0.0779 -0.0608 0.1236Reading attainment at age 72 quintile -0.0801 0.0521 0.0891 0.0402 -0.0309 0.0518 0.0866 0.0801 -0.0963 0.0906 0.2355 0.21773 quintile -0.0023 0.0617 0.0702 0.0617 -0.0678 0.0477 -0.0433 0.0720 -0.0313 0.0919 0.1893 0.20994 quintile -0.0177 0.0726 0.0372 0.0673 -0.0729 0.0510 0.0480 0.0664 -0.1019 0.0875 0.1840 0.21005 quintile -0.0303 0.0856 -0.0029 0.0766 -0.0812 0.0504 -0.0415 0.0654 -0.0939 0.0864 0.1423 0.2099Constant 0.2097 0.0951 0.0886 0.0697 0.1146 0.0620 0.0166 0.0870 0.2677 0.1161 0.0689 0.2453
Observations 460 643 1450 751 642 434R-squared 0.136 0.05 0.022 0.04 0.05 0.066
A-levels Degree/Higher degreeNo Qualifications CSE <5 0-levels >5 0-levels
58

Table 18: Matching estimates of the effects of lifelong learning on wage changes from 1991 to 2000.Highest educational attainment in 1991 No qualifications CSE <5 O-levels >5 O-levels A levels Degree/Higher degree
Number of observations 537 719 1638 835 711 482Probit estimation of propensity to achieve qualificationPseudo R-squared 0.108 0.0743 0.0234 0.0553 0.0333 0.0869Log likelihood -247.63 -402.818 -1050.9 -528.895 -454.395 -277.09
Wage changes: Matching estimatesMatched lifelong learners 0.0628 0.06764 0.1235 0.1498 0.1578 0.15258Matched control group of non learners -0.02843 0.1269 0.124 0.05815 0.1797 0.06581Differences in wage changes 0.09132 -0.05927 -0.0005 0.0917 -0.02188 0.086776Standard Error 0.06734 0.0584 0.0334 0.0432 0.04673 0.069741
Note 1: Probit estimation includes gender, test scores at age 7, parental background information and regional dummies. Note 2: Estimation process: One-to-one matching with replacement. Estimates proved robust to caliper choice. Standard errors obtained through bootstrapping.
59

Explanatory Variables Robust Robust RobustdF/dx Std. Err. P>|z| dF/dx Std. Err. P>|z| dF/dx Std. Err. P>|z|
Female -0.089 0.008 0.000 *** -0.087 0.009 0.000 *** -0.086 0.009 0.000 ***Qualifications since 1991 by NQF levelAcademic Level 1 -0.050 0.096 0.542 -0.040 0.090 0.609 -0.038 0.087 0.614Academic Level 2 0.009 0.026 0.748 0.010 0.026 0.702 0.007 0.026 0.785Academic Level 3 -0.057 0.049 0.173 -0.059 0.050 0.162 -0.068 0.051 0.107Academic Level 4 0.002 0.021 0.937 -0.009 0.023 0.675 -0.008 0.022 0.700Academic Level 5 0.032 0.025 0.282 0.019 0.029 0.545 0.019 0.028 0.544Vocationally-related Level 2 0.008 0.029 0.799 0.009 0.028 0.752 0.009 0.028 0.765Vocationally-related Level 3 -0.016 0.041 0.688 -0.009 0.039 0.806 -0.009 0.038 0.811Vocationally-related Level 4 0.062 0.020 0.065 * 0.060 0.021 0.078 * 0.056 0.021 0.100 *Occupational Level 1 -0.005 0.011 0.643 -0.007 0.011 0.517 -0.009 0.011 0.408Occupational Level 2 0.001 0.016 0.930 0.003 0.015 0.827 0.005 0.015 0.754Occupational Level 3 0.003 0.024 0.907 0.003 0.023 0.882 0.005 0.022 0.813Occupational Level 4 0.031 0.015 0.076 * 0.021 0.016 0.252 0.021 0.016 0.244Occupational Level 5 0.031 0.019 0.158 0.024 0.020 0.290 0.024 0.020 0.282Prior School Qualifications:CSE grade 2-5 0.031 0.012 0.019 ** 0.027 0.012 0.042 **< 5 O levels 0.035 0.011 0.003 *** 0.028 0.012 0.026 **> 5 O levels 0.044 0.011 0.001 *** 0.033 0.013 0.018 **A levels 0.047 0.012 0.001 *** 0.036 0.014 0.022 **Prior Post-School Qualifications:Lower vocational 0.006 0.010 0.586 0.003 0.010 0.748Middle vocational 0.020 0.015 0.232 0.015 0.016 0.370Higher vocational 0.028 0.012 0.035 ** 0.025 0.012 0.061 *Degree 0.005 0.017 0.784 0.000 0.017 0.982Maths attainment at age 7:5th quintile (highest) 0.017 0.013 0.2104th quintile 0.013 0.012 0.2993rd quintile 0.010 0.013 0.4282nd quintile -0.001 0.013 0.955Reading attainment at age 7:5th quintile (highest) -0.007 0.016 0.6334th quintile -0.002 0.015 0.9113rd quintile -0.013 0.015 0.3802nd quintile -0.008 0.015 0.575Type of school 1974:Secondary modern -0.003 0.011 0.813Grammar -0.003 0.014 0.817Private -0.016 0.023 0.446Other 0.007 0.027 0.792Parents' education:Father's years of edn 0.002 0.003 0.608Father's edn missing 0.011 0.038 0.767Mother's years of edn -0.001 0.004 0.860Mother's edn missing -0.008 0.045 0.858Father's social class 1974:Professional/Intermediate 0.003 0.014 0.860Skilled non-manual 0.045 0.013 0.006 ***Skilled manual 0.017 0.013 0.194Semi-skilled non-manual -0.003 0.036 0.933Semi-skilled manual 0.010 0.016 0.536Bad finances 1969 or 1974 -0.021 0.012 0.058 *Father's interest in education:Expects too much -0.016 0.041 0.673Very interested -0.013 0.014 0.323Some interest -0.005 0.011 0.629Mother's interest in education:Expects too much -0.032 0.031 0.252Very interested 0.025 0.014 0.066 *Some interest 0.002 0.012 0.846
Number of Observations 4941 4941 4941Wald chi-squared 129.63 165.03 198.37Pseudo R-squared 0.0401 0.0486 0.0588Log likelihood -1509.788 -1496.403 -1480.295
*, **, *** indicates that the variable is significant at the 10%, 5% and 1% level respectively.
Table 19: Employment Equation - Combined SampleEstimated using probit modelDependent variable takes value of 1 if person in employment in 2000,zero otherwise.
60

Explanatory Variables Robust Robust RobustdF/dx Std. Err. P>|z| dF/dx Std. Err. P>|z| dF/dx Std. Err. P>|z|
Qualifications since 1991 by NQF levelAcademic Level 2 0.012 0.045 0.804 0.012 0.041 0.787 0.016 0.030 0.645Academic Level 3 -0.033 0.085 0.651 -0.048 0.098 0.534 -0.042 0.092 0.570Academic Level 4 0.007 0.029 0.814 -0.007 0.034 0.839 -0.012 0.035 0.695Vocationally-related Level 2 0.024 0.033 0.570 0.021 0.031 0.581 0.014 0.032 0.696Vocationally-related Level 3 0.006 0.049 0.901 0.004 0.049 0.937 -0.001 0.047 0.984Occupational Level 1 -0.007 0.014 0.589 -0.011 0.014 0.411 -0.010 0.013 0.421Occupational Level 2 0.016 0.018 0.446 0.018 0.016 0.340 0.016 0.015 0.347Occupational Level 3 -0.029 0.037 0.368 -0.020 0.032 0.493 -0.017 0.029 0.523Occupational Level 5 0.045 0.015 0.111 0.038 0.016 0.167 0.033 0.015 0.188Prior School Qualifications:CSE grade 2-5 0.021 0.012 0.115 0.016 0.011 0.188< 5 O levels 0.013 0.012 0.284 0.009 0.011 0.458> 5 O levels 0.037 0.010 0.005 *** 0.028 0.011 0.034 **A levels 0.039 0.012 0.008 *** 0.027 0.013 0.057 *Prior Post-School Qualifications:Lower vocational 0.007 0.011 0.527 0.005 0.010 0.604Middle vocational 0.026 0.010 0.036 ** 0.023 0.010 0.043 **Higher vocational 0.032 0.011 0.036 ** 0.029 0.010 0.040 **Degree 0.012 0.017 0.519 0.001 0.019 0.969Maths attainment at age 7:5th quintile (highest) 0.008 0.014 0.5844th quintile 0.014 0.012 0.2893rd quintile 0.000 0.013 0.9742nd quintile -0.010 0.014 0.484Reading attainment at age 7:5th quintile (highest) 0.012 0.015 0.4544th quintile -0.026 0.017 0.090 *3rd quintile -0.013 0.015 0.3442nd quintile -0.008 0.014 0.533Type of school 1974:Secondary modern 0.002 0.011 0.855Grammar 0.006 0.014 0.678Private 0.021 0.017 0.343Other 0.036 0.013 0.155Parents' education:Father's years of edn 0.006 0.004 0.170Father's edn missing 0.057 0.030 0.146Mother's years of edn -0.002 0.004 0.606Mother's edn missing -0.053 0.074 0.394Father's social class 1974:Professional/Intermediate 0.000 0.016 0.987Skilled non-manual 0.033 0.011 0.047 **Skilled manual 0.007 0.013 0.577Semi-skilled manual 0.011 0.014 0.477Bad finances 1969 or 1974 -0.021 0.014 0.092 *Father's interest in education:Expects too much -0.021 0.041 0.545Very interested -0.031 0.018 0.053 *Some interest 0.012 0.010 0.253Mother's interest in education:Expects too much -0.056 0.038 0.057 *Very interested 0.032 0.014 0.028 **Some interest 0.000 0.012 0.974
Number of observations 2396 2396 2372Wald chi-squared 4.45 34.3 70.92Pseudo R-squared 0.0054 0.0316 0.0723Log likelihood -524.966 -511.165 -488.356
*, **, *** indicate that the variable is significant at the 10%, 5% and 1% level respectively.
Table 20: Employment Equation - MalesEstimated using probit modelDependent variable takes value of 1 if person in employment in 2000,zero otherwise.
61

Explanatory variables Robust Robust RobustdF/dx Std. Err. P>|z| dF/dx Std. Err. P>|z| dF/dx Std. Err. P>|z|
Qualifications since 1991 by NQF levelAcademic Level 1 -0.102 0.149 0.426 -0.095 0.143 0.445 -0.086 0.135 0.462Academic Level 2 0.012 0.041 0.776 0.015 0.040 0.719 0.013 0.041 0.767Academic Level 3 -0.080 0.072 0.206 -0.083 0.073 0.192 -0.106 0.076 0.104 *Academic Level 4 0.003 0.035 0.941 -0.006 0.036 0.864 -0.008 0.036 0.814Academic Level 5 -0.005 0.061 0.934 -0.016 0.065 0.793 -0.008 0.061 0.894Vocationally-related Level 2 -0.008 0.053 0.871 -0.005 0.052 0.928 -0.012 0.054 0.823Vocationally-related Level 3 -0.039 0.073 0.571 -0.031 0.071 0.639 -0.034 0.070 0.601Vocationally-related Level 4 0.074 0.049 0.251 0.072 0.050 0.271 0.071 0.048 0.262Occupational Level 1 -0.004 0.019 0.825 -0.007 0.019 0.709 -0.011 0.019 0.577Occupational Level 2 -0.012 0.028 0.647 -0.012 0.028 0.650 -0.008 0.028 0.755Occupational Level 3 0.032 0.036 0.412 0.029 0.036 0.464 0.026 0.036 0.508Occupational Level 4 0.024 0.028 0.417 0.008 0.031 0.787 0.005 0.031 0.868Occupational Level 5 0.021 0.040 0.618 0.015 0.041 0.717 0.017 0.039 0.686Prior School Qualifications:CSE grade 2-5 0.040 0.024 0.120 0.034 0.024 0.198< 5 O levels 0.060 0.022 0.009 *** 0.047 0.023 0.053 **> 5 O levels 0.053 0.023 0.033 ** 0.034 0.026 0.217A levels 0.058 0.024 0.031 ** 0.043 0.028 0.158Prior Post-School Qualifications:Lower vocational 0.007 0.018 0.701 0.009 0.018 0.622Middle vocational -0.022 0.048 0.639 -0.037 0.051 0.437Higher vocational 0.031 0.023 0.200 0.028 0.023 0.244Degree -0.006 0.032 0.841 -0.006 0.032 0.858Maths attainment at age 7:5th quintile (highest) 0.032 0.024 0.1974th quintile 0.019 0.023 0.4303rd quintile 0.028 0.022 0.2252nd quintile 0.016 0.022 0.467Reading attainment at age 7:5th quintile (highest) -0.024 0.031 0.4144th quintile 0.018 0.027 0.5303rd quintile -0.022 0.029 0.4432nd quintile -0.019 0.029 0.499Type of school 1974:Secondary modern -0.010 0.020 0.603Grammar -0.007 0.026 0.791Private -0.059 0.045 0.146Other -0.052 0.063 0.362Parents' education:Father's years of edn -0.003 0.005 0.574Father's edn missing -0.068 0.078 0.350Mother's years of edn 0.001 0.006 0.860Mother's edn missing 0.030 0.069 0.678Father's social class 1974:Professional/Intermediate 0.004 0.026 0.892Skilled non-manual 0.053 0.027 0.093 *Skilled manual 0.028 0.022 0.228Semi-skilled non-manual -0.080 0.081 0.261Semi-skilled manual 0.005 0.030 0.858Bad finances 1969 or 1974 -0.018 0.020 0.345Father's interest in education:Expects too much -0.037 0.091 0.660Very interested -0.001 0.023 0.957Some interest -0.030 0.021 0.134Mother's interest in education:Expects too much 0.026 0.044 0.580Very interested 0.022 0.025 0.373Some interest 0.000 0.021 0.997
Number of observations 2391 2391 2391Wald chi-squared 5.58 17.15 45.79Pseudo R-squared 0.0028 0.0086 0.0233Log likelihood -976.778 -971.103 -956.693
zero otherwise.
*, **, *** indicates that the variable is significant at the 10%, 5% and 1% level respectively.
Table 21: Employment Equation - FemalesEstimated using probit modelDependent variable takes value of 1 if person in employment in 2000,
62

Explanatory variablesRobust Robust Robust Robust
dF/dx Std. Err. P>|z| dF/dx Std. Err. P>|z| dF/dx Std. Err. P>|z| dF/dx Std. Err. P>|z|Type of lifelong learningAcademic 0.122 0.046 0.016 ** 0.044 0.133 0.743 0.114 0.044 0.017 ** 0.107 0.045 0.026 **Vocationally-related 0.203 0.055 0.006 *** 0.053 0.150 0.727 0.183 0.054 0.006 *** 0.193 0.052 0.004 ***Occupational 0.138 0.030 0.000 *** 0.211 0.065 0.003 *** 0.144 0.027 0.000 *** 0.148 0.027 0.000 ***Prior school qualificationCSE grade 2-5 0.181 0.036 0.000 *** 0.084 0.083 0.329 0.165 0.033 0.000 *** 0.145 0.035 0.000 ***<5 O-levels 0.153 0.036 0.000 *** 0.213 0.071 0.005 *** 0.167 0.032 0.000 *** 0.142 0.034 0.000 ***>5 O levels 0.135 0.042 0.003 *** 0.330 0.073 0.002 *** 0.153 0.038 0.000 *** 0.140 0.040 0.001 ***A levels 0.182 0.044 0.000 *** 0.407 0.054 0.000 *** 0.205 0.039 0.000 *** 0.205 0.042 0.000 ***Post school qualificationLower vocational 0.074 0.034 0.035 ** 0.143 0.082 0.100 * 0.082 0.031 0.011 ** 0.083 0.032 0.012 **Middle vocational 0.023 0.076 0.770 0.177 0.099 0.110 0.077 0.060 0.223 0.065 0.062 0.316Higher vocational 0.094 0.050 0.080 * -0.375 0.150 0.036 ** 0.054 0.050 0.297 0.048 0.051 0.361Degree -0.055 0.071 0.431 -0.188 0.223 0.405 -0.059 0.069 0.380 -0.069 0.070 0.310Maths attainment at age 7Quintile 5 0.047 0.050 0.366 0.065 0.115 0.582 0.056 0.046 0.238 0.053 0.048 0.275Quintile 4 0.057 0.046 0.229 0.158 0.091 0.104 0.073 0.041 0.090 * 0.084 0.042 0.054 *Quintile 3 0.066 0.042 0.129 0.105 0.094 0.285 0.074 0.038 0.063 * 0.074 0.040 0.072 *Quintile 2 0.027 0.042 0.535 0.097 0.088 0.287 0.041 0.038 0.282 0.047 0.038 0.229Reading attainment at age 7Quintile 5 -0.052 0.054 0.326 0.038 0.121 0.756 -0.040 0.049 0.416 -0.058 0.052 0.256Quintile 4 0.060 0.046 0.204 0.047 0.111 0.677 0.074 0.041 0.085 * 0.053 0.044 0.243Quintile 3 -0.027 0.047 0.570 0.094 0.101 0.370 -0.001 0.042 0.989 -0.026 0.045 0.555Quintile 2 -0.016 0.046 0.733 0.126 0.086 0.160 0.017 0.040 0.681 -0.009 0.042 0.827Region north 0.088 0.067 0.220 -0.064 0.182 0.725 0.066 0.064 0.323 0.083 0.064 0.220north west 0.093 0.059 0.136 -0.164 0.165 0.321 0.053 0.058 0.369 0.058 0.059 0.336yorkshire & humberside 0.151 0.052 0.010 *** -0.085 0.162 0.596 0.117 0.052 0.036 ** 0.126 0.052 0.026 **west midlands 0.159 0.057 0.019 ** -0.059 0.182 0.744 0.125 0.058 0.051 ** 0.135 0.058 0.038 **east midlands 0.142 0.058 0.032 ** 0.106 0.158 0.523 0.142 0.054 0.020 ** 0.143 0.055 0.022 **east anglia 0.136 0.067 0.075 * 0.108 0.198 0.608 0.134 0.064 0.064 * 0.132 0.065 0.073 *south west 0.194 0.050 0.002 *** 0.002 0.199 0.993 0.174 0.051 0.004 *** 0.183 0.052 0.003 ***south east 0.146 0.052 0.008 *** -0.048 0.156 0.755 0.117 0.050 0.023 ** 0.126 0.050 0.017 **wales 0.084 0.064 0.217 -0.325 0.168 0.079 * 0.033 0.064 0.605 0.043 0.064 0.510scotland 0.099 0.065 0.157 -0.009 0.182 0.962 0.093 0.061 0.155 0.098 0.062 0.138Female 0.039 0.032 0.219 0.031 0.033 0.340Father's interest in educationVery interested 0.035 0.044 0.433Some interest 0.067 0.034 0.056 *Mother's interest in educationExpects too much -0.078 0.110 0.464Very interested -0.042 0.045 0.352Some interest -0.002 0.036 0.958Type of school 1974Secondary modern 0.004 0.034 0.914Grammar school -0.012 0.053 0.823Public school 0.006 0.064 0.923Other school -0.234 0.078 0.003 ***Parent's educationFather's years of edn -0.015 0.010 0.162Father's edn missing -0.021 0.135 0.873Mother's years of edn 0.000 0.012 0.983Mother's edn missing -0.117 0.148 0.423Father's social class 1974intermediate 0.071 0.047 0.145skilled non-manual 0.135 0.054 0.027 **skilled manual 0.012 0.041 0.777semi-skilled non-man 0.267 0.067 0.023 **semi-skilled manual -0.008 0.053 0.886Bad finances 1969 or 1974 -0.039 0.033 0.243
Number of observations 1323 310 1633 1619Pseudo R-squared 0.084 0.179 0.090 0.105Log-likelihood -780.198 -172.996 -969.927 -948.155
*, **, *** indicate that the variable is significant at the 10%, 5% and 1% level respectively.
AllEstimated using probit model. Dependent variable takes the value 1 if employed in 2000, zero otherwise
Table 22: Transition probability from non employment to employment (1991-2000).Sample is those out of the labour market (unemployed and 'inactive' ) in 1991
Females Males All
63
64
References
Aldridge, F. and Tuckett, A. (2001), Winners and Losers in an Expanding System: The NIACE Survey on Adult Participation in Learning, 2001. NIACE.
Barrett, A. and Hovels, B. (1998), Towards a Rate of Return on
Training: Assessing the Research on the Benefits of Employer-provided Training, European Journal of Vocational Training, 14, pp 28-35.
Beinart, S. and Smith, P. (1998), National Adult Learning Survey 1997, DfEE Research
Report 49. Blundell, R., Dearden, L., Goodman, A. and Reed, H. (1997), Higher Education, Employment
and Earnings in Britain. Institute for Fiscal Studies.
Blundell, R., Dearden, L., Meghir, C. and Sianesi, B. (1999), ‘The Returns from Education and Training to the Individual, the Firm and the Economy: A Review of the Theoretical and Empirical Literature’, Technical Report to the DfEE Skills Task Force, Institute for Fiscal Studies: London.
Blundell, R., Dearden, L. and Sianesi, B. (2001), “Estimating the Returns to Education: Models, Methods and Results”, working paper and presented at the RSS Meeting February 27th 2001.
Brennan, J., Mills, J., Shah, T. and Woodley, A. (2000), ‘Lifelong Learning for Employment
and Equity: the Role of Part-time Degrees’, Higher Education Quarterly, 54/4. Cameron, S. V. and Heckman, J. J. (1994), ‘Determinants of Young Males’ Schooling and
Training Choices’, in L. M. Lynch (ed.), Training and the Private Sector: International Comparisons, University of Chicago Press.
Card, D. (1999), “The Causal Effect of Education on Earnings”, in O. Ashenfelter, and D.
Card, (eds.), Handbook of Labour Economics.
Choudhury, S. (1994), ‘New Evidence on Public Sector Wage Differentials’, Journal of Applied Economics, 26/3, pp 259-266.
Cohn, E. and Addison, J. T. (1998), ‘The Economic Returns to Lifelong Learning in OECD
Countries’, Education Economics, Vol 6, No 3. Dearden, L., McIntosh, S., Myck, M. and Vignoles, A. (2000), ‘The Returns to Academic,
Vocational and Basic Skills in Britain’, DfEE Research Report No. 250 and Research Brief No. 250, and Centre for Economics of Education Discussion Papers Nos. 3 and 4.
Egerton, M. (2000a), ‘Pay Differentials between Early and Mature Graduate Men: the Role
of State Employment’, Journal of Education and Work, Vol 13, No 3.

65
Egerton, M. (2000b), ‘Monitoring Contemporary Student Flows and Characteristics: Secondary Analyses Using the Labour Force Survey and the General Household Survey’, Journal of the Royal Statistical Society, A, 163/1.
Egerton, M. (2001a), ‘Mature Graduates I: Occupational Attainment and the Effects of
Labour Market Duration’, Oxford Review of Education, 27/2. Egerton, M. (2001b), ‘Mature Graduates II: Occupational Attainment and the Effects of
Social Class’, Oxford Review of Education, 27/2. Egerton, M. and Parry, G. (2001), ‘Lifelong Debt: Rates of Return to Mature Study’, Higher
Education Quarterly, 55/1. Ferri, E (ed.), (1993), Life at 33: The Fifth Follow-up of the National Child Development
Study, National Children's Bureau and City University. Field, J. (2000), Lifelong Learning and the New Educational Order, Trentham Books. Green, F. (1999), ‘Training the Workers’, in P. Gregg, and J. Wadsworth, The State of
Working Britain, Manchester University Press. Green, F., Machin, S. and Manning, A. (1996), ‘The Employer Size-Wage Effect: Is
Monopsony the Explanation?’, Oxford Economic Papers, 48, pp 433-455. Hildreth, A. (1999), ‘What has Happened to the Union Wage Differential in Britain in the
1990s?’, Oxford Bulletin of Economics and Statistics, 61/1, pp 5-32. Hill, E. T. (2001), ‘Post-School-Age Training Among Women: Training Methods and
Labour Market Outcomes at Older Ages’, Economics of Education Review, Vol 20. Hillage, J. (1996), ‘Employers’ Approaches to Work-Based Training in Britain’, European
Journal of Vocational Training, 8/9, pp 43-49. Hillage, J., Uden, T., Aldridge, F. and Eccles, J. (2000), Adult Learning in England: a
Review, IES Report 369, Institute for Employment Studies. Leigh, D. E. and Gill, A. M. (1997), ‘Labour Market Returns to Community Colleges:
Evidence for Returning Adults’, Journal of Human Resources, 32/2. Mcintosh, S. and Vignoles, A. (forthcoming), ‘Measuring and Assessing the Impact of Basic
Skills on Labour Market Outcomes’, Oxford Economic Papers. Murnane, R. J., Willett, J. B. and Tyler, J. H. (2000), ‘Who Benefits from Obtaining a GED?
Evidence from High School and Beyond’, Review of Economics and Statistics, 82(1), pp 23-37.
O’Connell, P. J. (1999), Adults in Training: An International Comparison of Continuing
Education and Training, OECD: Paris.

66
Pitcher, J. and Purcell, K. (1998), ‘Diverse Expectations and Access to Opportunities: Is There a Graduate Labour Market?’, Higher Education Quarterly, 52/2.
Rees, H. and Shah, A. (1995), ‘Public-Private Sector Wage Differentials in the U.K’
Manchester School, 63/1, pp 52-68. Sargant, N., Field J., Francis, H., Schuller, T. and Tuckett, A. (1997), The Learning Divide:
A Study of Participation in Adult Learning in the United Kingdom, NIACE. Sargant, N. (2000), The Learning Divide Revisited: A Report on the Findings of a UK-wide
Survey on Adult Participation in Education and Learning, NIACE. Steel, J. and Sausman, C. (1997), ‘The Contribution of Graduates to the Economy – Rates of
Return’, National Committee of Inquiry into Higher Education (Dearing Committee), Report 7.
Tyler, J. H., Murnane, R. J. and Willett, J. B. (2000), ‘Estimating the Labor Market Signaling
Value of the GED’, Quarterly Journal of Economics, 115/2, pp 431-468. Woodley, A. and Simpson, C. (2001), ‘Learning and Earning: Measuring “Rates of Return”
Among Mature Graduates from Part-time Distance Courses’, Higher Education Quarterly, 55/1.

CENTRE FOR THE ECONOMICS OF EDUCATION Recent Discussion Papers
18 S. Gibbons Neighbourhood Effects on Educational Achievement
17 S. Gibbons Paying for Good Neighbours? Neighbourhood Deprivation and the Community Benefits of Education
16 R. Blundell L. Dearden B. Sianesi
Estimating the Returns to Education: Models, Methods and Results
15 S. Gibbons S. Machin
Valuing Primary Schools
14 C. Megir M. Palme
The Effect of a Social Experiment in Education
13 G. Conlon One in Three? The Incidence and Outcomes of LifelongLearners in the United Kingdom
12 A. Jenkins Companies Use of Psychometric Testing and the Changing Demand for Skills: A Review of the Literature
11 G. Conlon The Differential in Earnings Premia Between Academically and Vocationally Trained Males in the United Kingdom
10 P. Dolton O. D. Marcenaro L. Navarro
The Effective Use of Student Time: A Stochastic Frontier Production Function Case Study
9 P. Dolton M. Silles
Over-Education in the Graduate Labour Market: Some Evidence
8 A. Chevalier G. Lanot
The Relative Effect of Family and Financial Characteristics on Educational Achievement
7 A. Chevalier Graduate Over-Education in the UK
6 B. Sianesi J. Van Reenen
The Returns to Education: A Review of the Macro-Economic Literature
5 C. Harmon H. Osterbeek I. Walker
The Returns to Education: A Review of Evidence, Issues and Deficiencies in the Literature

4 L. Dearden S. McIntosh M. Myck A. Vignoles
The Returns to Academic and Vocational Qualifications in Britain
3 S. McIntosh A. Vignoles
Measuring and Assessing the Impact of Basic Skills on Labour Market Outcomes
2 A. Vignoles R. Levacic J. Walker S. Machin D. Reynolds
The Relationship Between Resource Allocation and Pupil Attainment: A Review
1 A. Vignoles T. Desai E. Montado
An Audit of the Data Needs of the DfEE Centres on the Economics of Education and the Wider Benefits of Learning
To order a discussion paper, please contact the Publications Unit Tel 020 7955 7673 Fax 020 7955 7595