Embed Size (px)
Citation preview

slide 0 CHAPTER 2 The Data of Macroeconomics
Chapter 2
The Data of Macroeconomics
(continued)

slide 1 CHAPTER 2 The Data of Macroeconomics
GDP:
An important and versatile concept
We have now seen that GDP measures
total output
total income
total expenditure
the sum of value-added at all stages
in the production of final goods

slide 2 CHAPTER 2 The Data of Macroeconomics
Investment vs. Capital
Note: Investment is spending on new capital.
Example (assumes no depreciation):
1/1/2006:
economy has $500b worth of capital
during 2006:
investment = $60b
1/1/2007:
economy will have $560b worth of capital

slide 3 CHAPTER 2 The Data of Macroeconomics
Stocks vs. Flows
A flow is a quantity measured per unit of time.
E.g., “U.S. investment was $2.5 trillion during 2006.”
Flow Stock
A stock is a
quantity measured
at a point in time.
E.g.,
“The U.S. capital stock
was $26 trillion on
January 1, 2006.”

slide 4 CHAPTER 2 The Data of Macroeconomics
Stocks vs. Flows - examples
the govt budget deficit the govt debt
# of new college
graduates this year
# of people with
college degrees
a person’s
annual saving a person’s wealth
flow stock

slide 5 CHAPTER 2 The Data of Macroeconomics
Now you try:
Stock or flow?
the balance on your credit card statement
how much you study economics outside of
class
the size of your compact disc collection
the inflation rate
the unemployment rate

slide 6 CHAPTER 2 The Data of Macroeconomics
Government spending (G)
G includes all government spending on goods
and services..
G excludes transfer payments
(e.g., unemployment insurance payments),
because they do not represent spending on
goods and services.

slide 7 CHAPTER 2 The Data of Macroeconomics
Net exports: NX = EX – IM
Remember, GDP is the value of spending on our
country’s output of goods & services.
Exports represent foreign spending on our country’s
output, so we include exports.
Imports represent the portion of domestic spending (C, I,
and G) that goes to foreign goods and services, so we
subtract off imports.
NX, therefore, equals net spending by the foreign sector
on domestically produced goods & services.

slide 8 CHAPTER 2 The Data of Macroeconomics
An important identity
Y = C + I + G + NX
aggregate
expenditure value of
total output

slide 9 CHAPTER 2 The Data of Macroeconomics
GNP vs. GDP
Gross National Product (GNP): Total income earned by the nation’s factors of production, regardless of where located, in a given time period.
Gross Domestic Product (GDP): Total income earned by domestically-located factors of production, regardless of nationality, in a given time period.
GNP = GDP + factor payments from abroad – factor payments to abroad

slide 10 CHAPTER 2 The Data of Macroeconomics
Discussion question:
In Turkey,
which would you want
to be bigger, GDP, or GNP?
Why?

slide 11 CHAPTER 2 The Data of Macroeconomics
Question:
In Turkey,
which statistic do you think is
bigger, GDP, or GNP?
Why?

slide 12 CHAPTER 2 The Data of Macroeconomics
Real vs. nominal GDP
What happens to GDP when prices change?
Recall: GDP= ∑PiQi
According to the above formula, GDP changes
whenever prices change.
When we measure GDP at current prices, it is
called nominal GDP.

slide 13 CHAPTER 2 The Data of Macroeconomics
Question
Why is it difficult to compare the value of
production in two years based on nominal GDP?

slide 14 CHAPTER 2 The Data of Macroeconomics
Example
GDPyear1=Pyear1xQyear1
Suppose Qyear1=Qyear2, but Pyear2>Pyear1
GDPyear2>GDPyear1, even though the quantity of
production is the same
Economists use the price level of a given base year to
calculate GDP in order to make comparison between
years.

slide 15 CHAPTER 2 The Data of Macroeconomics
Real vs. nominal GDP
GDP is the value of all final goods and services
produced.
nominal GDP measures these values using
current prices.
real GDP measure these values using the prices
of a base year.

slide 16 CHAPTER 2 The Data of Macroeconomics
Practice problem, part 1
Compute nominal GDP in each year.
Compute real GDP in each year using 2006 as
the base year.
2006 2007 2008
P Q P Q P Q
good A $30 900 $31 1,000 $36 1,050
good B $100 192 $102 200 $100 205

slide 17 CHAPTER 2 The Data of Macroeconomics
Answers to practice problem, part 1
nominal GDP multiply Ps & Qs from same year
2006: $46,200
2007: $51,400
2008: $58,300
real GDP multiply each year’s Qs by 2006 Ps
2006: $46,200
2007: $50,000
2008: $52,000
slide 18 CHAPTER 2 The Data of Macroeconomics
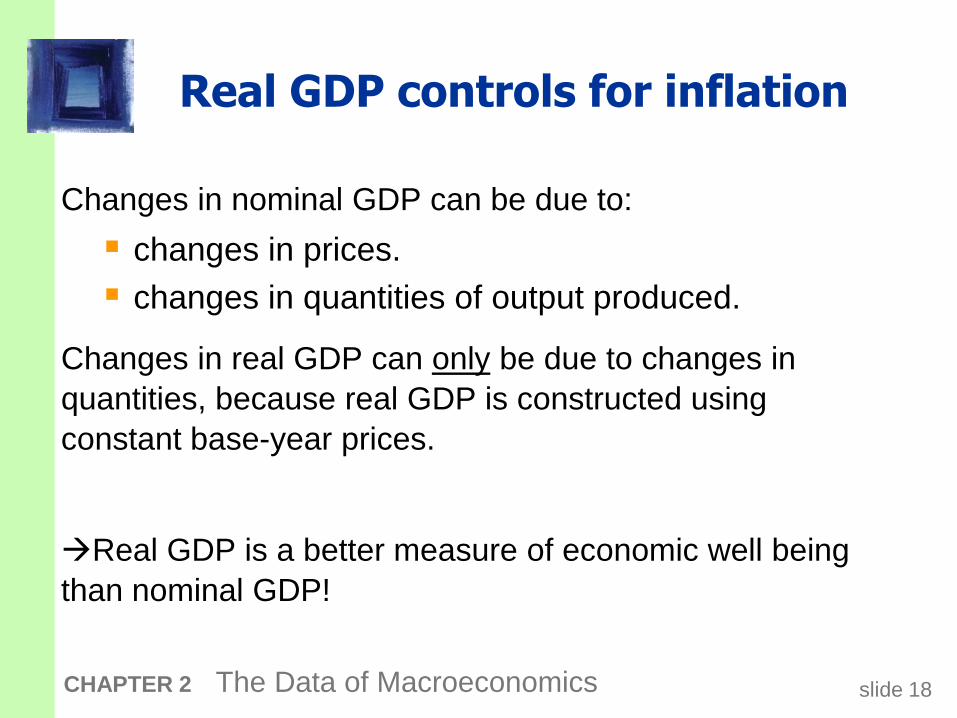
Real GDP controls for inflation
Changes in nominal GDP can be due to:
changes in prices.
changes in quantities of output produced.
Changes in real GDP can only be due to changes in
quantities, because real GDP is constructed using
constant base-year prices.
Real GDP is a better measure of economic well being
than nominal GDP!
slide 19 CHAPTER 2 The Data of Macroeconomics
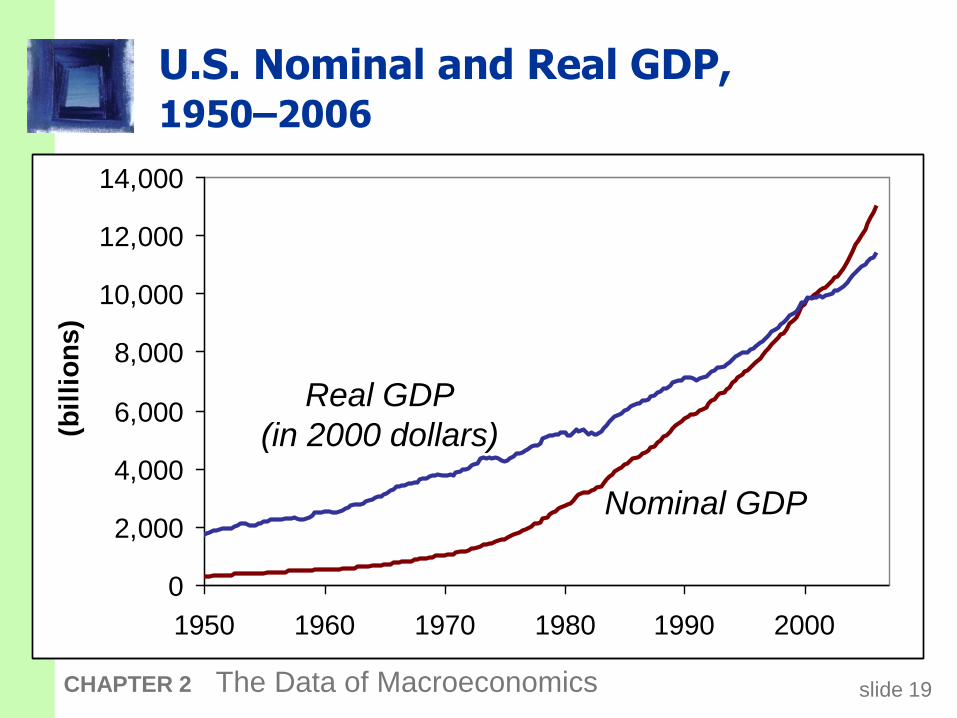
U.S. Nominal and Real GDP, 1950–2006
0
2,000
4,000
6,000
8,000
10,000
12,000
14,000
1950 1960 1970 1980 1990 2000
(bil
lio
ns)
Nominal GDP
Real GDP
(in 2000 dollars)

slide 20 CHAPTER 2 The Data of Macroeconomics
GDP Deflator
The inflation rate is the percentage increase in
the overall level of prices.
One measure of the price level is
the GDP deflator, defined as
GDP deflator= Nominal GDP/Real GDP
slide 21 CHAPTER 2 The Data of Macroeconomics
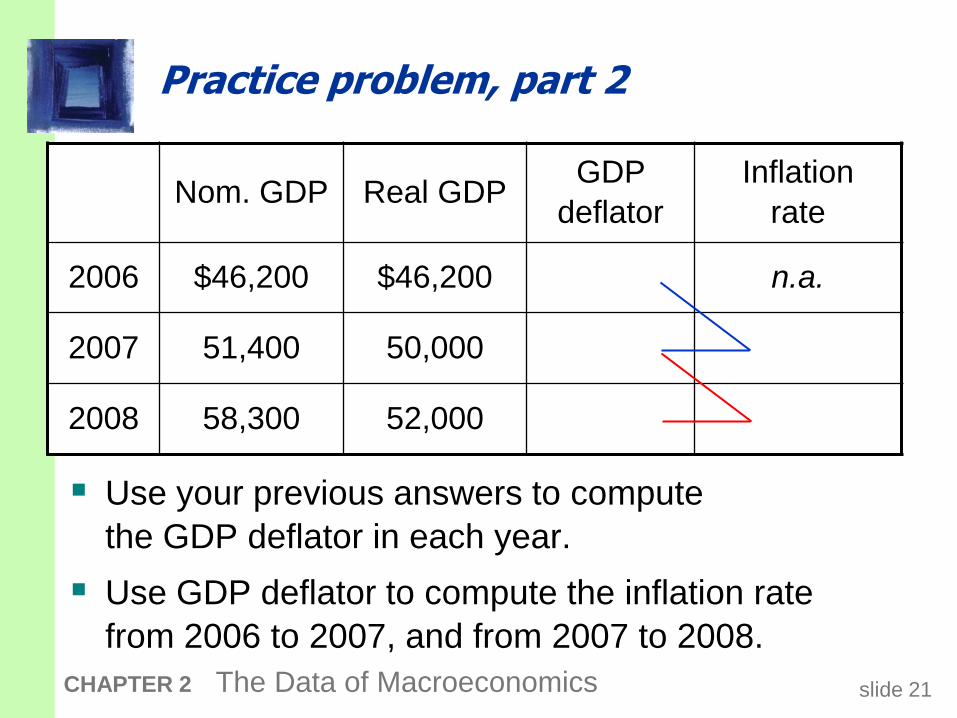
Practice problem, part 2
Use your previous answers to compute
the GDP deflator in each year.
Use GDP deflator to compute the inflation rate
from 2006 to 2007, and from 2007 to 2008.
Nom. GDP Real GDP GDP
deflator
Inflation
rate
2006 $46,200 $46,200 n.a.
2007 51,400 50,000
2008 58,300 52,000

slide 22 CHAPTER 2 The Data of Macroeconomics
Answers to practice problem, part 2
Nominal
GDP Real GDP
GDP
deflator
Inflation
rate
2006 $46,200 $46,200 1 n.a.
2007 51,400 50,000 1.028 2.8%
2008 58,300 52,000 1.121 9.1%

slide 23 CHAPTER 2 The Data of Macroeconomics
Chain-Weighted Real GDP
Over time, relative prices change, so the base
year should be updated periodically.
What happens if the prices of goods and services
change relative to their base year values (aside
from an inflation adjustment)?
For example, computer prices declined
significantly over the last decade. Should we use
the price of computers from 1996 (base year) in
calculating the GDP in 2010?

slide 24 CHAPTER 2 The Data of Macroeconomics
Chain-Weighted Real GDP
In essence, chain-weighted real GDP
updates the base year every year,
so it is more accurate than constant-price GDP.
Our textbook usually uses
constant-price real GDP, because:
the two measures are highly correlated.
constant-price real GDP is easier to compute.

slide 25 CHAPTER 2 The Data of Macroeconomics
Example: Chain Weighted RGDP
Chain-weighted index uses the average prices
between any consecutive years to calculate the
GDP.
Real GDP2002= [(P2001+P2002)/2] x Q2002
Real GDP2003= [(P2002+P2003)/2] x Q2003
RealGDP2004= [(P2003+P2004)/2] x Q2004

slide 26 CHAPTER 2 The Data of Macroeconomics
Consumer Price Index (CPI)
A measure of the overall level of prices
The CPI is the price of a basket of goods and
services purchased by a typical consumer.
The concept of a basket is necessary to select
the goods and services that are consumed by a
typical individual (among the millions of other
goods and services).

slide 27 CHAPTER 2 The Data of Macroeconomics
How to construct the CPI
1. Survey consumers to determine composition
of the typical consumer’s “basket” of goods.
2. Every month, collect data on prices of all items
in the basket; compute cost of basket
3. CPI in any month equals:
CPI=Cost of basket in that month /Cost of
basket in base period

slide 28 CHAPTER 2 The Data of Macroeconomics
Changes in the value of CPI from one period to
the next reflect inflation.
The quantities of the items in the basket are
determined based on the level of production in
the base year.

slide 29 CHAPTER 2 The Data of Macroeconomics
Exercise 1
Suppose that a typical individual consumes apples and oranges only
These are the goods that are inside the basket.
The CPI is calculated by estimating the value of goods in this basket in
the base year and current year.
Suppose 2002 is the base year
Q: How is the denominator different from Nominal GDP in 2002?
2002200220022002
2006200220062002
2006
ooAA
ooAA
PQPQ
PQPQCPI
slide 30 CHAPTER 2 The Data of Macroeconomics
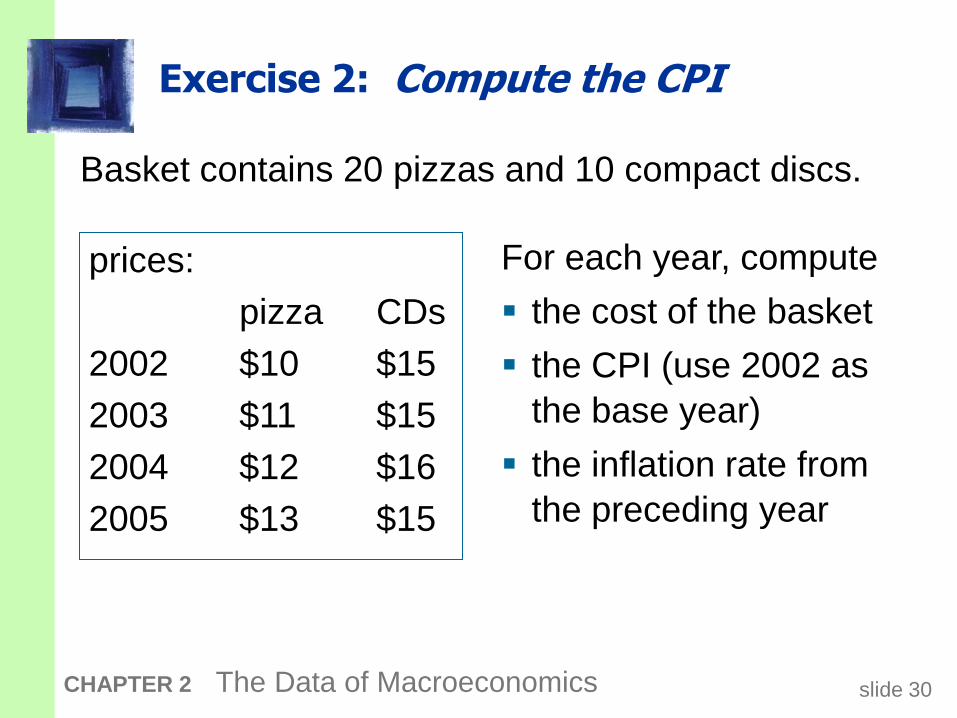
Exercise 2: Compute the CPI
Basket contains 20 pizzas and 10 compact discs.
prices:
pizza CDs
2002 $10 $15
2003 $11 $15
2004 $12 $16
2005 $13 $15
For each year, compute
the cost of the basket
the CPI (use 2002 as
the base year)
the inflation rate from
the preceding year

slide 31 CHAPTER 2 The Data of Macroeconomics
Cost of Inflation
basket CPI rate
2002 $350 1 n.a.
2003 370 1.057 5.7%
2004 400 1.143 8.1%
2005 410 1.171 2.5%
Answers: