Embed Size (px)
Citation preview

Macroeconomics IIMacroeconomics II
Ondřej Krčál
Department of Economics
Office 611Office 611
Consultation hours: Monday 17:00 – 18:30Consultation hours: Monday 17:00 – 18:30
E-mail: [email protected]: [email protected]
slide 0CHAPTER 1 The Science of Macroeconomics

LiteratureLiterature
MANKIW, G. (2010): Macroeconomics. 7th edition. Worth Publishers.
slide 1CHAPTER 1 The Science of Macroeconomics

ExamExam
� Test – 40 questions a/b/c/d (1 correct answer)
Correct answer +1 p., wrong answer -0.5 p., � Correct answer +1 p., wrong answer -0.5 p., no answer 0 p.no answer 0 p.
�A: 34 - 40 points
�B: 31 – 33,5 points�B: 31 – 33,5 points
�C: 28 – 30,5 points
�D: 25 – 27,5 points�D: 25 – 27,5 points
�E: 22 – 24,5 points
�F: 21,5 points and less
slide 2CHAPTER 1 The Science of Macroeconomics

C H A P T E R
1C H A P T E R
The Science of Macroeconomics
1The Science of Macroeconomics
MMACROECONOMICSACROECONOMICSMMACROECONOMICSACROECONOMICS SIXTH EDITIONSIXTH EDITION
NN. . GGREGORY REGORY MMANKIWANKIW
PowerPointPowerPoint®® Slides by Ron CronovichSlides by Ron Cronovich
NN. . GGREGORY REGORY MMANKIWANKIW
© 2008 Worth Publishers, all rights reserved
PowerPointPowerPoint®® Slides by Ron CronovichSlides by Ron Cronovich

Learning ObjectivesLearning Objectives
This chapter introduces you to
�� the issues macroeconomists study
� the tools macroeconomists use� the tools macroeconomists use
� some important concepts in macroeconomic � some important concepts in macroeconomic
analysis
slide 4CHAPTER 1 The Science of Macroeconomics
Important issues in Important issues in macroeconomics
Macroeconomics, the study of the economy as a whole, addresses many topical issues:
� What causes recessions?
a whole, addresses many topical issues:
� What causes recessions?
Can the government do anything to combat
recessions? Should it?recessions? Should it?
� What is the government budget deficit?
How does it affect the economy?
� Why does the U.S. have such a huge trade � Why does the U.S. have such a huge trade
deficit?
slide 5CHAPTER 1 The Science of Macroeconomics
Important issues in Important issues in macroeconomics
Macroeconomics, the study of the economy as a whole, addresses many topical issues:
� Why are millions of people unemployed,
a whole, addresses many topical issues:
even when the economy is booming?
� Why does the cost of living keep rising?� Why does the cost of living keep rising?
� Why are so many countries poor? � Why are so many countries poor?
What policies might help them grow out of
poverty?poverty?
slide 6CHAPTER 1 The Science of Macroeconomics
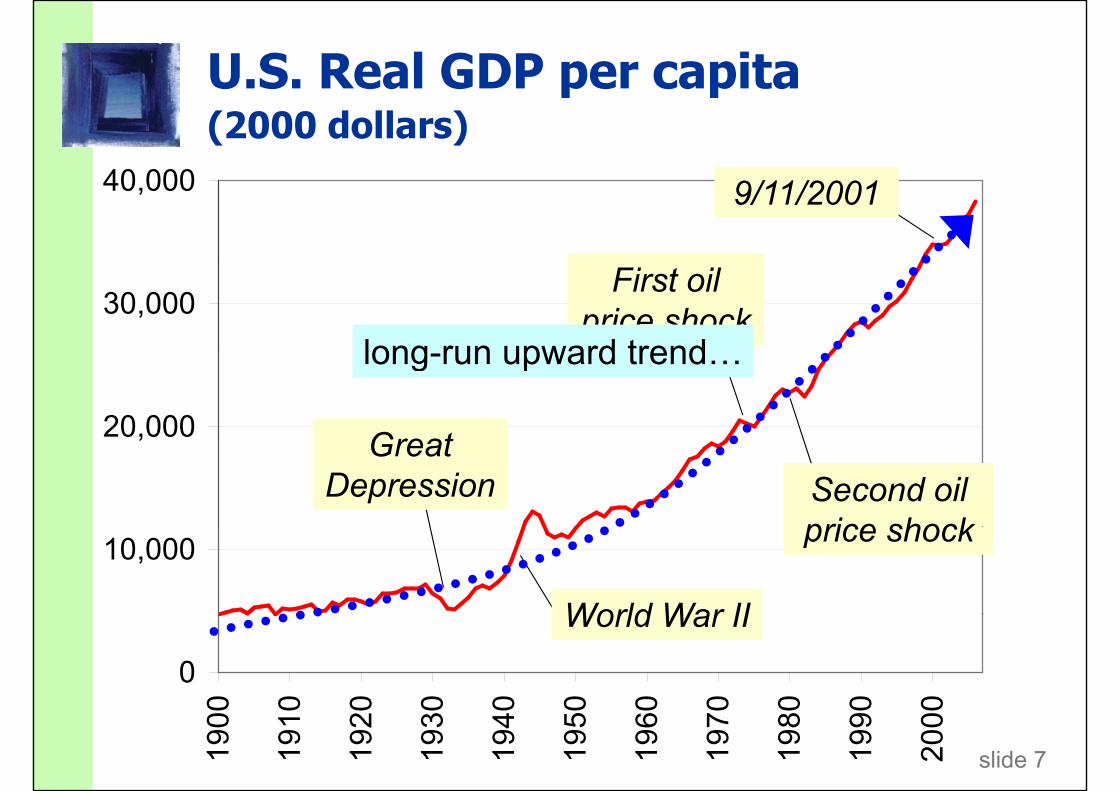
U.S. Real GDP per capita U.S. Real GDP per capita (2000 dollars)
40,000 9/11/200140,000
First oil
9/11/2001
30,000First oil
price shocklong-run upward trend…
20,000Great
long-run upward trend…
20,000Great
Depression Second oil price shock
10,000
World War II
price shock
0
1900
1910
1920
1930
1940
1950
1960
1970
1980
1990
2000
World War II
slide 7CHAPTER 1 The Science of Macroeconomics1900
1910
1920
1930
1940
1950
1960
1970
1980
1990
2000

U.S. inflation rateU.S. inflation rate(% per year)
25
20
25
15
20
5
10
0
5
-10
-5
-15
-10
1900
1910
1920
1930
1940
1950
1960
1970
1980
1990
2000
slide 8CHAPTER 1 The Science of Macroeconomics1900
1910
1920
1930
1940
1950
1960
1970
1980
1990
2000

U.S. unemployment rateU.S. unemployment rate(% of labor force)
25
20
15
10
5
0
1900
1910
1920
1930
1940
1950
1960
1970
1980
1990
2000
slide 9CHAPTER 1 The Science of Macroeconomics
1900
1910
1920
1930
1940
1950
1960
1970
1980
1990
2000

Why learn macroeconomics?Why learn macroeconomics?1. The macroeconomy affects society’s well-being.
Social problems like homelessness, Social problems like homelessness, 10
6000U.S. Unemployment and Property Crime RatesSocial problems like homelessness,
domestic violence, crime, and poverty are linked to the economy.
Social problems like homelessness, domestic violence, crime, and poverty are linked to the economy. 8
10
5000
percent of labor force
100,000 population
property crime (right scale)poverty are linked to the economy.
For example…
poverty are linked to the economy.
For example…6
8 5000
percent of labor force
crim
es per
100,000 population
(right scale)
For example…For example…
4
64000
percent of labor force
crim
es per
100,000 populationunemployment
2
4
3000
percent of labor force
crim
es per
100,000 populationunemployment
(left scale)
0
2
2000
percent of labor force
slide 10CHAPTER 1 The Science of Macroeconomics
0
1970 1980 1990 2000
2000

Why learn macroeconomics?Why learn macroeconomics?2. The macroeconomy affects your well-being.
4
5
3
5
change from 12 mos earlier
percent change from 12 mos earlierIn most years, wage growth falls
when unemployment is rising. In most years, wage growth falls when unemployment is rising.
3
4
1
3
change from 12 mos earlier
percent change from 12 mos earlier
when unemployment is rising. when unemployment is rising.
1
2
-1
1
change from 12 mos earlier
percent change from 12 mos earlier
0
1
-3
-1
change from 12 mos earlier
percent change from 12 mos earlier
-2
-1
-5
change from 12 mos earlier
percent change from 12 mos earlier
-3
-2
1965 1970 1975 1980 1985 1990 1995 2000 2005
-7
change from 12 mos earlier
percent change from 12 mos earlier
slide 11CHAPTER 1 The Science of Macroeconomics
1965 1970 1975 1980 1985 1990 1995 2000 2005
unemployment rate inflation-adjusted mean wage (right scale)
percent change from 12 mos earlier
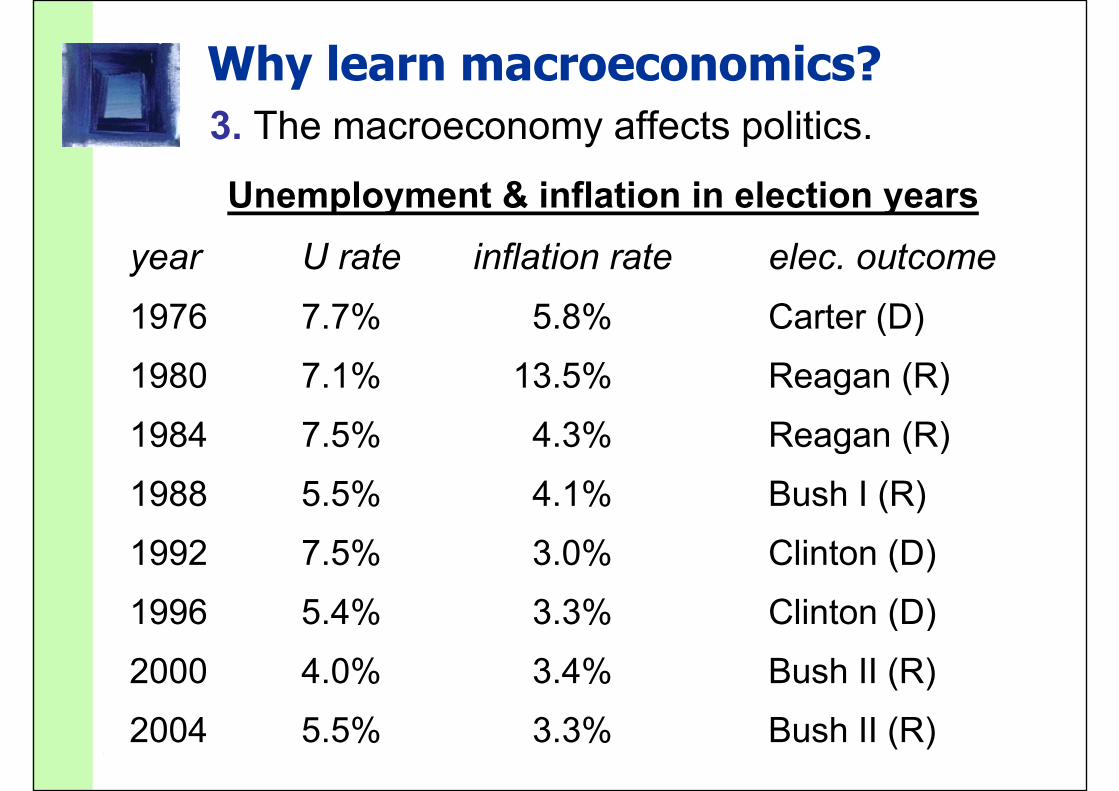
Why learn macroeconomics?Why learn macroeconomics?
Unemployment & inflation in election years
3. The macroeconomy affects politics.
Unemployment & inflation in election years
year U rate inflation rate elec. outcomeyear U rate inflation rate elec. outcome
1976 7.7% 5.8% Carter (D)
1980 7.1% 13.5% Reagan (R)
1984 7.5% 4.3% Reagan (R)1984 7.5% 4.3% Reagan (R)
1988 5.5% 4.1% Bush I (R)
1992 7.5% 3.0% Clinton (D)
1996 5.4% 3.3% Clinton (D)1996 5.4% 3.3% Clinton (D)
2000 4.0% 3.4% Bush II (R)
slide 12CHAPTER 1 The Science of Macroeconomics2004 5.5% 3.3% Bush II (R)

Economic modelsEconomic models
…are simplified versions of a more complex reality
� irrelevant details are stripped away� irrelevant details are stripped away
…are used to …are used to
� show relationships between variables
�� explain the economy’s behavior
� devise policies to improve economic � devise policies to improve economic performance
slide 13CHAPTER 1 The Science of Macroeconomics

Example of a model:
Supply & demand for new cars� shows how various events affect price and � shows how various events affect price and
quantity of cars
� assumes the market is competitive: each buyer and seller is too small to affect the market priceand seller is too small to affect the market price
� Variables:
Qd = quantity of cars that buyers demand
Qs = quantity that producers supplyQs = quantity that producers supply
P = price of new cars
Y = aggregate incomeY = aggregate income
Ps = price of steel (an input)
slide 14CHAPTER 1 The Science of Macroeconomics
Ps = price of steel (an input)

The market for cars: DemandThe market for cars: Demand
P demand equation: P Price
of cars
demand equation:
( , )=dQ D P Y of cars ( , )=Q D P Y
The demand curveshows the relationship
Q
Dshows the relationship between quantity demanded and price, Q
Quantity of cars
demanded and price, other things equal.
of cars
slide 15CHAPTER 1 The Science of Macroeconomics

The market for cars: SupplyThe market for cars: Supply
P supply equation: P Price
of cars
supply equation:
( , )=ssQ S P P Sof cars ( , )= sQ S P P S
The supply curve shows the relationship
Q
Dshows the relationship between quantity supplied and price, Q
Quantity of cars
supplied and price, other things equal.
of cars
slide 16CHAPTER 1 The Science of Macroeconomics

The market for cars: EquilibriumThe market for cars: Equilibrium
P P Price
of cars Sof cars S
equilibrium price
Q
Dprice
QQuantity of carsof cars
equilibriumquantity
slide 17CHAPTER 1 The Science of Macroeconomics

The effects of an increase in incomeThe effects of an increase in income
P demand equation: P Price
of cars S
demand equation:
( , )=dQ D P Yof cars S
An increase in income increases the quantity P
P1
increases the quantity of cars consumers demand at each price…
P2
Q
D1
demand at each price… D2
QQuantity of cars
Q1…which increases the equilibrium price
Q2
of carsthe equilibrium price and quantity.
slide 18CHAPTER 1 The Science of Macroeconomics

The effects of a steel price increaseThe effects of a steel price increase
P supply equation: P Price
of cars S1
S2
supply equation:
( , )=ssQ S P P
of cars S1
An increase in Ps
reduces the quantity of P
P1
reduces the quantity of cars producers supply at each price…
P2
Q
Dat each price…
QQuantity of cars
Q1…which increases the market price and
Q2
of carsreduces the quantity.
slide 19CHAPTER 1 The Science of Macroeconomics

Endogenous vs. exogenous Endogenous vs. exogenous variables
� The values of endogenous variables
are determined in the model.are determined in the model.
� The values of exogenous variables � The values of exogenous variables
are determined outside the model:
the model takes their values & behavior the model takes their values & behavior
as given.
� In the model of supply & demand for cars,
exogenous: , Y P
endogenous: , , d sP Q Q
exogenous: , sY P
slide 20CHAPTER 1 The Science of Macroeconomics
endogenous: , , P Q Q
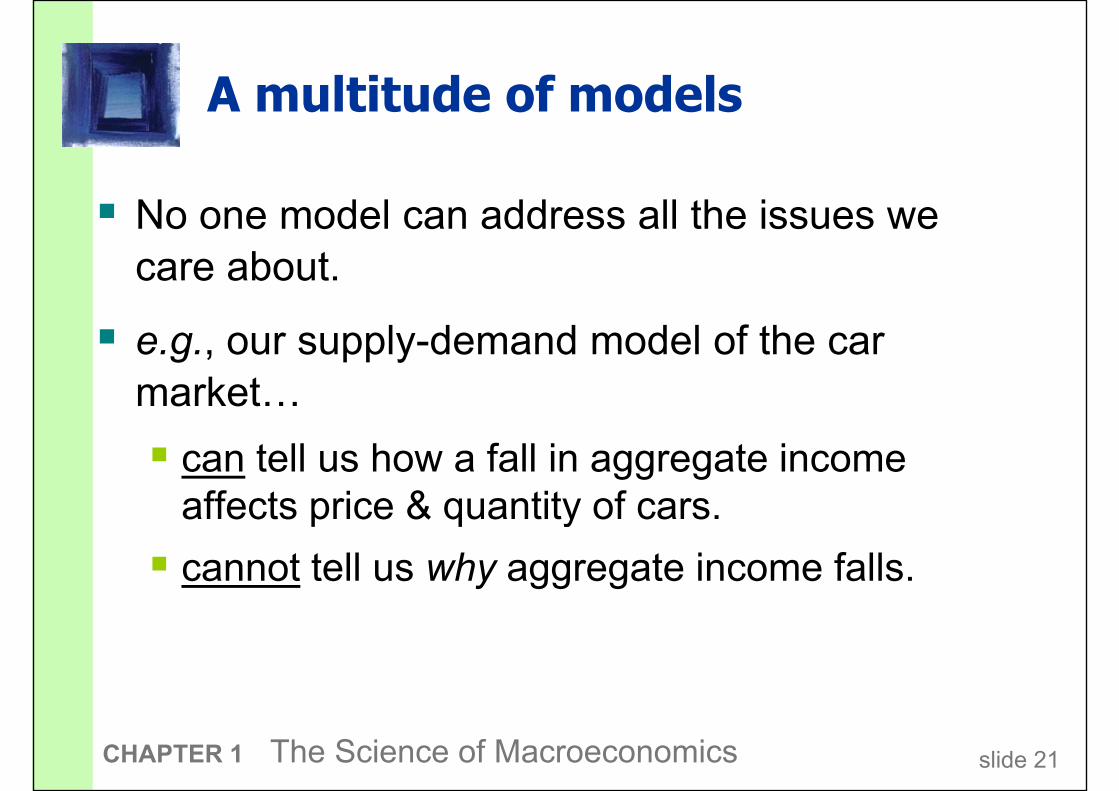
A multitude of modelsA multitude of models
� No one model can address all the issues we
care about. care about.
� e.g., our supply-demand model of the car � e.g., our supply-demand model of the car
market…
� can tell us how a fall in aggregate income � can tell us how a fall in aggregate income affects price & quantity of cars.affects price & quantity of cars.
� cannot tell us why aggregate income falls.
slide 21CHAPTER 1 The Science of Macroeconomics

A multitude of modelsA multitude of models
� So we will learn different models for studying
different issues (e.g., unemployment, inflation, different issues (e.g., unemployment, inflation,
long-run growth).
� For each new model, you should keep track of
� its assumptions � its assumptions
� which variables are endogenous, � which variables are endogenous, which are exogenous
� the questions it can help us understand, � the questions it can help us understand, and those it cannot
slide 22CHAPTER 1 The Science of Macroeconomics

Chapter SummaryChapter SummaryChapter SummaryChapter Summary
� Macroeconomics is the study of the economy as
a whole.a whole.
� Macroeconomists attempt to explain the � Macroeconomists attempt to explain the
economy and to devise policies to improve its
performance. performance.
� Economists use different models to examine � Economists use different models to examine
different issues.
CHAPTER 1 The Science of Macroeconomics slide 23

C H A P T E R
2C H A P T E R
The Data of Macroeconomics
2The Data of Macroeconomics
MMACROECONOMICSACROECONOMICSMMACROECONOMICSACROECONOMICS SIXTH EDITIONSIXTH EDITION
NN. . GGREGORY REGORY MMANKIWANKIW
PowerPointPowerPoint®® Slides by Ron CronovichSlides by Ron Cronovich
NN. . GGREGORY REGORY MMANKIWANKIW
© 2008 Worth Publishers, all rights reserved
PowerPointPowerPoint®® Slides by Ron CronovichSlides by Ron Cronovich
In this chapter, you will learn…In this chapter, you will learn…
…the meaning and measurement of the
most important macroeconomic statistics:most important macroeconomic statistics:
� Gross Domestic Product (GDP)� Gross Domestic Product (GDP)
� The Consumer Price Index (CPI)
�� The unemployment rate
slide 25CHAPTER 1 The Science of Macroeconomics

Gross Domestic Product: Gross Domestic Product: Expenditure and Income
Two definitions:
� Total expenditure on domestically-produced � Total expenditure on domestically-produced
final goods and services.
� Total income earned by domestically-located
factors of production. factors of production.
Expenditure equals income because Expenditure equals income because Expenditure equals income because every dollar spent by a buyer
Expenditure equals income because every dollar spent by a buyer every dollar spent by a buyer becomes income to the seller. every dollar spent by a buyer becomes income to the seller.
slide 26CHAPTER 1 The Science of Macroeconomics
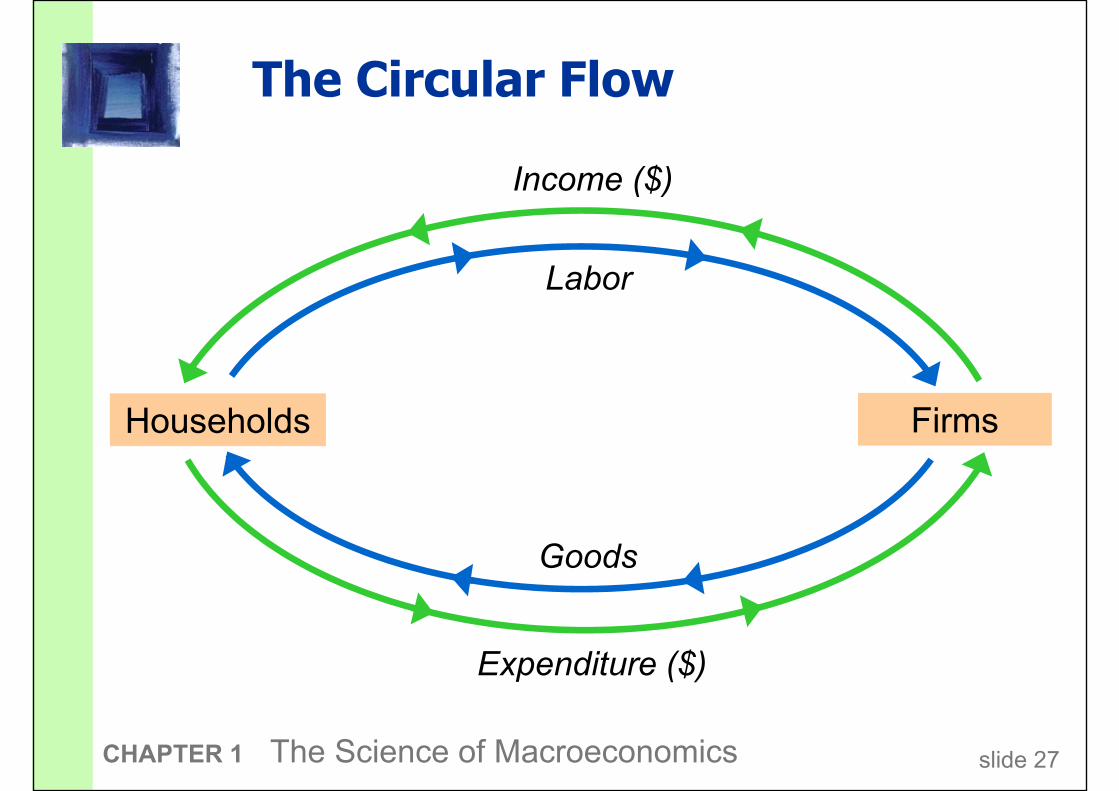
The Circular FlowThe Circular Flow
Income ($)
Labor
Income ($)
Labor
Households FirmsHouseholds Firms
Goods
Expenditure ($)
slide 27CHAPTER 1 The Science of Macroeconomics
The expenditure components of The expenditure components of GDP
� consumption
�� investment
� government spending� government spending
� net exports� net exports
slide 28CHAPTER 1 The Science of Macroeconomics

Consumption (C)Consumption (C)
� durable goodsdefinition: The value of all � durable goods
last a long time ex: cars, home
definition: The value of all goods and services bought by households. Includes: ex: cars, home
appliances
� nondurable goods
by households. Includes:
� nondurable goods
last a short time ex: food, clothingex: food, clothing
� services
work done for work done for consumers ex: dry cleaning, ex: dry cleaning, air travel.
slide 29CHAPTER 1 The Science of Macroeconomics

U.S. consumption, 2006U.S. consumption, 2006
% of GDP$ billions
70.0%$9,268.9Consumption
% of GDP$ billions
8.1
70.0%
1,070.3
$9,268.9
Durables
Consumption
20.5
8.1
2,714.9
1,070.3
Nondurables
Durables
41.4
20.5
5,483.7
2,714.9
Services
Nondurables
41.45,483.7Services
slide 30CHAPTER 1 The Science of Macroeconomics

Investment (I)Investment (I)
Definition 1: Spending on [the factor of production] Definition 1: Spending on [the factor of production] capital.
Definition 2: Spending on goods bought for future useDefinition 2: Spending on goods bought for future use
Includes:
� business fixed investment� business fixed investmentSpending on plant and equipment that firms will use to produce other goods & services.to produce other goods & services.
� residential fixed investment� residential fixed investmentSpending on housing units by consumers and landlords.landlords.
� inventory investmentThe change in the value of all firms’ inventories.
slide 31CHAPTER 1 The Science of Macroeconomics
The change in the value of all firms’ inventories.
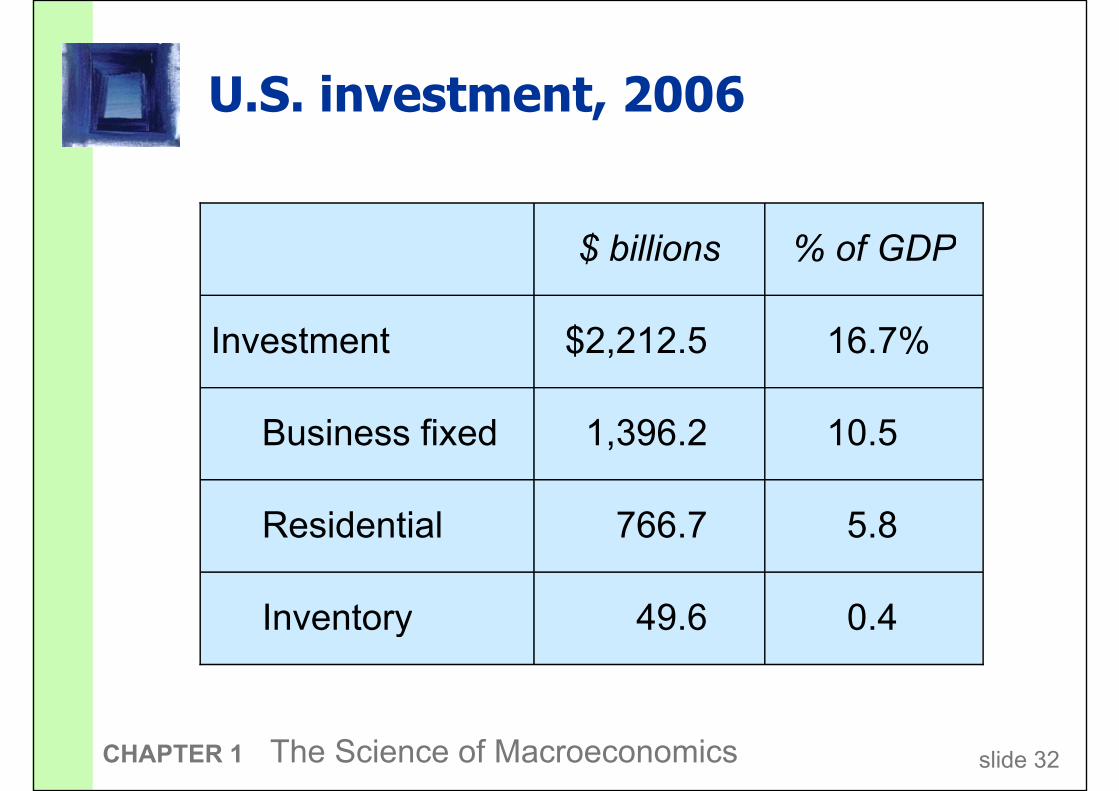
U.S. investment, 2006U.S. investment, 2006
% of GDP$ billions
16.7%$2,212.5Investment
% of GDP$ billions
10.5
16.7%
1,396.2
$2,212.5
Business fixed
Investment
5.8
10.5
766.7
1,396.2
Residential
Business fixed
0.4
5.8
49.6
766.7
Inventory
Residential
0.449.6Inventory
slide 32CHAPTER 1 The Science of Macroeconomics
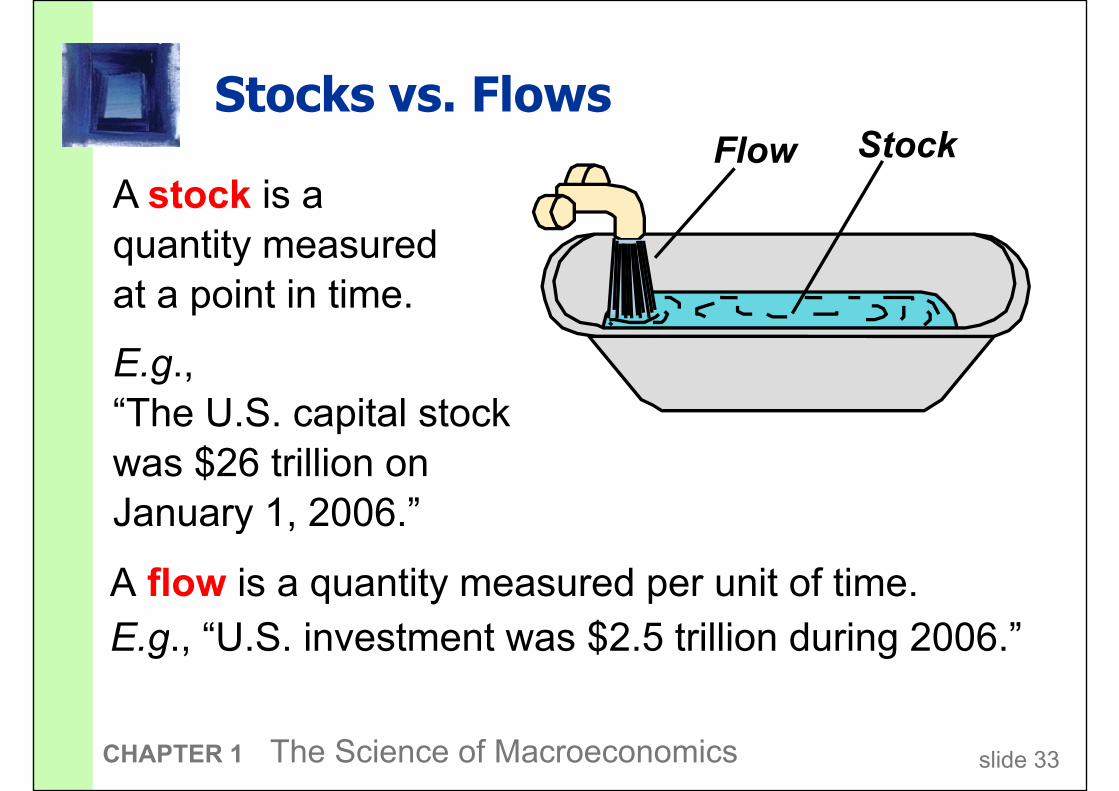
Stocks vs. FlowsStocks vs. FlowsFlow Stock
A stock is a A stock is a
quantity measured quantity measured
at a point in time.
E.g., E.g., “The U.S. capital stock
was $26 trillion on
January 1, 2006.”
A flow is a quantity measured per unit of time.
E.g., “U.S. investment was $2.5 trillion during 2006.”
January 1, 2006.”
E.g., “U.S. investment was $2.5 trillion during 2006.”
slide 33CHAPTER 1 The Science of Macroeconomics

Stocks vs. Flows - examplesStocks vs. Flows - examples
flowstock
a person’s a person’s wealth
flowstock
a person’s
annual savinga person’s wealth
# of new college
graduates this year
# of people with
college degrees
the govt budget deficitthe govt debt
graduates this yearcollege degrees
the govt budget deficitthe govt debt
slide 34CHAPTER 1 The Science of Macroeconomics

Government spending (G)Government spending (G)
� G includes all government spending on goods � G includes all government spending on goods
and services..
� G excludes transfer payments
(e.g., unemployment insurance payments), (e.g., unemployment insurance payments),
because they do not represent spending on
goods and services. goods and services.
slide 35CHAPTER 1 The Science of Macroeconomics
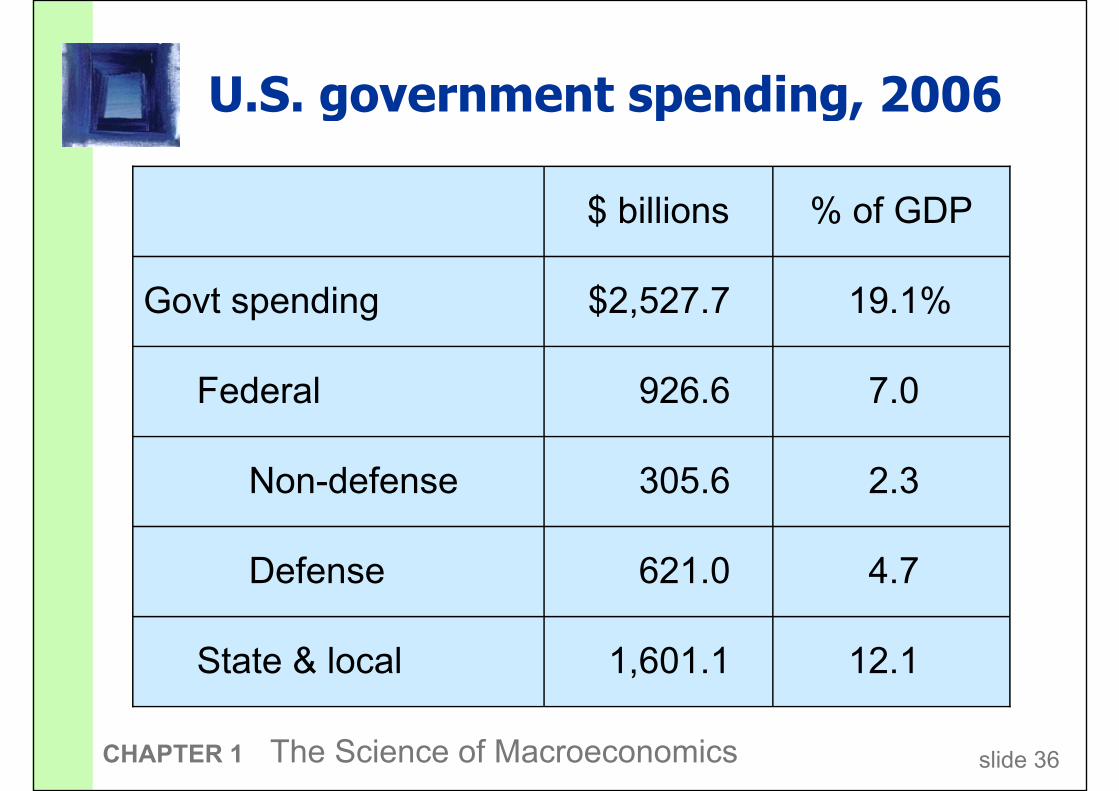
U.S. government spending, 2006U.S. government spending, 2006
% of GDP$ billions
19.1%$2,527.7Govt spending
Federal 7.0926.6
2.3305.6Non-defense
Defense 4.7621.0
State & local 12.11,601.1
slide 36CHAPTER 1 The Science of Macroeconomics

Net exports: NX = EX – IMNet exports: NX = EX – IM
def: The value of total exports (EX) def: The value of total exports (EX) minus the value of total imports (IM).
U.S. Net Exports, 1950-2007200 2%
-200
0
billions of dollars
-2%
0%
percent of GDP
-400
-200
billions of dollars
-4%
-2%
percent of GDP
-800
-600billions of dollars
-8%
-6% percent of GDP
-800
1950 1960 1970 1980 1990 2000
-8%
NX ($ billions) NX (% of GDP)NX ($ billions) NX (% of GDP)

An important identityAn important identity
Y = C + I + G + NX
aggregate aggregate expenditurevalue of
total outputtotal output
slide 38CHAPTER 1 The Science of Macroeconomics

A question for you:A question for you:
Suppose a firm
�� produces $10 million worth of final goods
� but only sells $9 million worth.� but only sells $9 million worth.
Does this violate the
expenditure = output identity?expenditure = output identity?
slide 39CHAPTER 1 The Science of Macroeconomics

Why output = expenditureWhy output = expenditure
� Unsold output goes into inventory, � Unsold output goes into inventory,
and is counted as “inventory investment”…and is counted as “inventory investment”…
…whether or not the inventory buildup was
intentional. intentional.
� In effect, we are assuming that � In effect, we are assuming that
firms purchase their unsold output.
slide 40CHAPTER 1 The Science of Macroeconomics

GNP vs. GDPGNP vs. GDP
� Gross National Product (GNP):� Gross National Product (GNP):Total income earned by the nation’s factors of Total income earned by the nation’s factors of
production, regardless of where located.
�� Gross Domestic Product (GDP):Total income earned by domestically-located Total income earned by domestically-located
factors of production, regardless of nationality.
(GNP – GDP) = (factor payments from abroad)
– (factor payments to abroad)– (factor payments to abroad)
slide 41CHAPTER 1 The Science of Macroeconomics

(HNP – HDP) jako % HDP (HNP – HDP) jako % HDP vybrané země, 2005
ČR: 2010
HNP mld. Kč 3.449
HDP 3.693HDP mld. Kč 3.693
Rozdíl % HDP -7.1
zdroje:
World Development World Development Indicators, World Bank
Makroekonomická predikce MFČRMFČR
slide 42CHAPTER 1 The Science of Macroeconomics

Real vs. nominal GDPReal vs. nominal GDP
� GDP is the value of all final goods and services
produced. produced.
� nominal GDP measures these values using � nominal GDP measures these values using
current prices.
�� real GDP measure these values using the prices
of a base year. of a base year.
slide 43CHAPTER 1 The Science of Macroeconomics

Practice problem, part 1Practice problem, part 1
2006 2007 2008
P Q P Q P Q
good A $30 900 $31 1,000 $36 1,050good A $30 900 $31 1,000 $36 1,050
good B $100 192 $102 200 $100 205
� Compute nominal GDP in each year.
good B $100 192 $102 200 $100 205
� Compute nominal GDP in each year.
� Compute real GDP in each year using 2006 as � Compute real GDP in each year using 2006 as
the base year.
slide 44CHAPTER 1 The Science of Macroeconomics

Answers to practice problem, part 1Answers to practice problem, part 1
nominal GDPnominal GDP multiply Ps & Qs from same year
2006: $46,200 = $30 × 900 + $100 × 192 2006: $46,200 = $30 × 900 + $100 × 192
2007: $51,400
2008: $58,300
real GDP multiply each year’s Qs by 2006 Ps
2006: $46,2002006: $46,200
2007: $50,000
2008: $52,000 = $30 × 1050 + $100 × 205
slide 45CHAPTER 1 The Science of Macroeconomics

Real GDP controls for inflationReal GDP controls for inflation
Changes in nominal GDP can be due to:
� changes in prices. � changes in prices.
� changes in quantities of output produced.� changes in quantities of output produced.
Changes in real GDP can only be due to Changes in real GDP can only be due to
changes in quantities,
because real GDP is constructed using because real GDP is constructed using
constant base-year prices.
slide 46CHAPTER 1 The Science of Macroeconomics
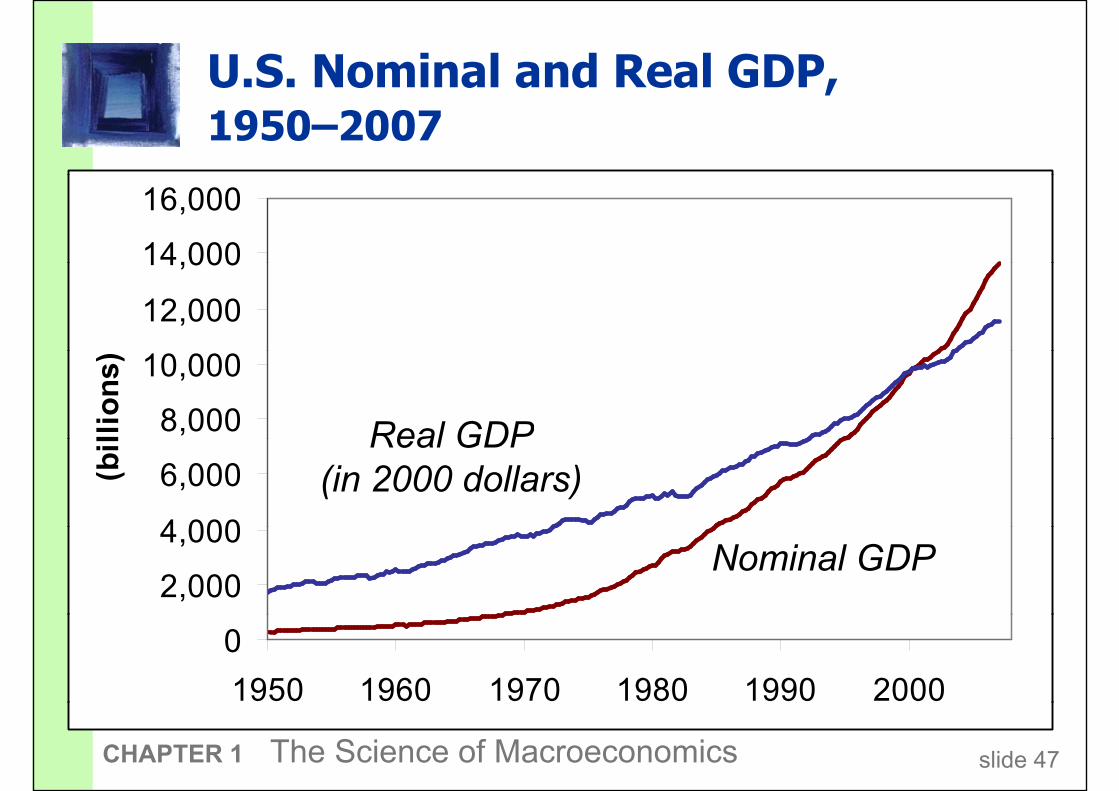
U.S. Nominal and Real GDP, U.S. Nominal and Real GDP, 1950–2007
14,000
16,000
10,000
12,000
14,000
8,000
10,000
(billions)
Real GDP
4,000
6,000(billions)
Real GDP(in 2000 dollars)
2,000
4,000Nominal GDP
0
1950 1960 1970 1980 1990 2000
slide 47CHAPTER 1 The Science of Macroeconomics
1950 1960 1970 1980 1990 2000
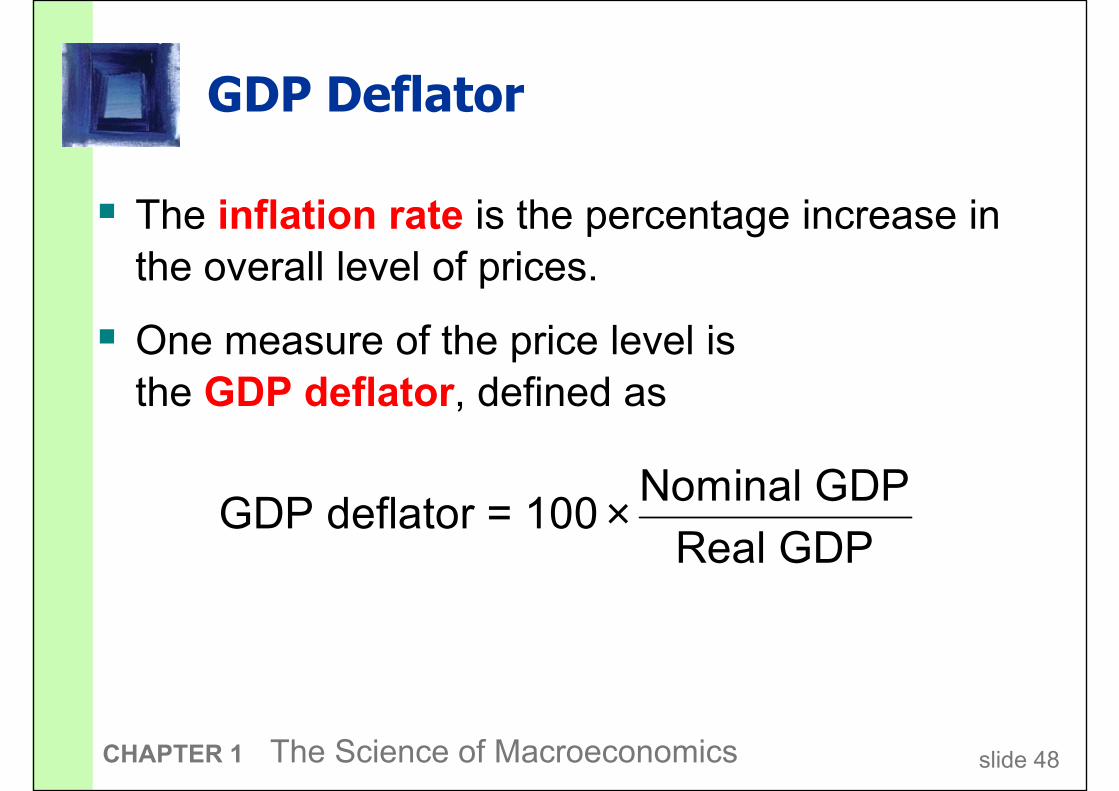
GDP DeflatorGDP Deflator
� The inflation rate is the percentage increase in
the overall level of prices.the overall level of prices.
� One measure of the price level is � One measure of the price level is
the GDP deflator, defined as
× Nominal GDPGDP deflator = 100
Real GDP×GDP deflator = 100
Real GDP
slide 48CHAPTER 1 The Science of Macroeconomics
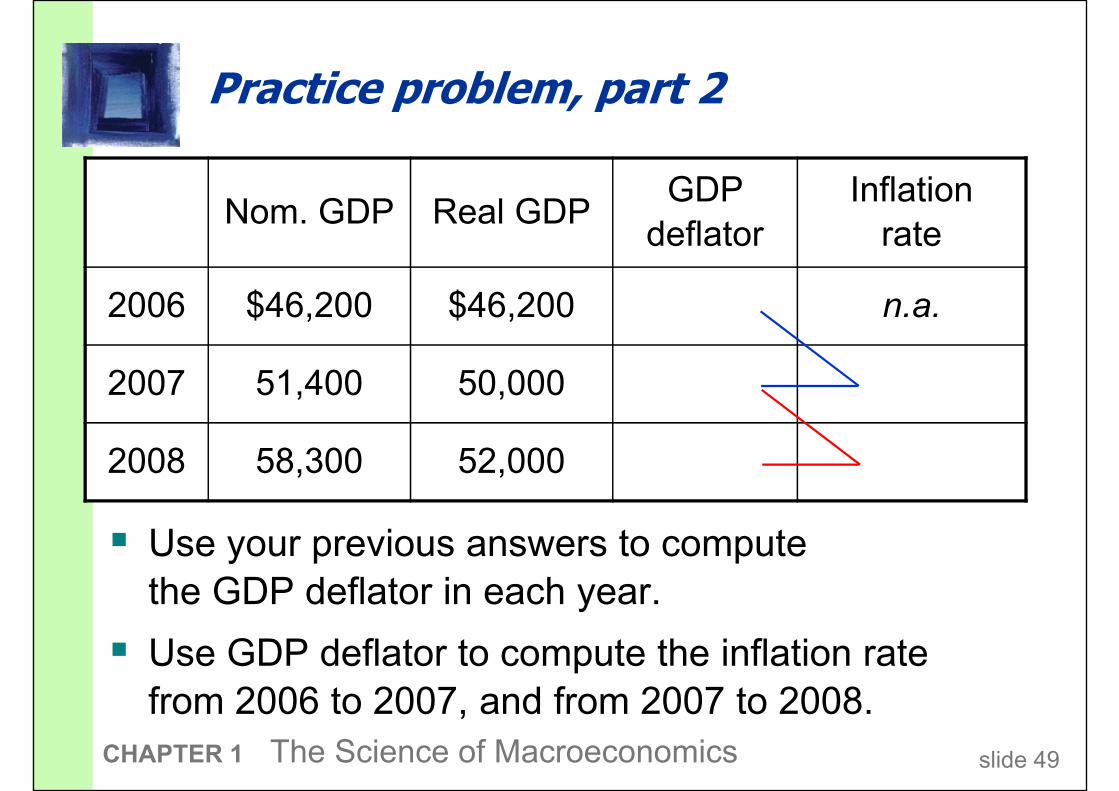
Practice problem, part 2Practice problem, part 2
GDP InflationNom. GDP Real GDP
GDP
deflator
Inflation
rate
2006 $46,200 $46,200 n.a.
2007 51,400 50,000
� Use your previous answers to compute
2008 58,300 52,000
� Use your previous answers to compute
the GDP deflator in each year.
� Use GDP deflator to compute the inflation rate
from 2006 to 2007, and from 2007 to 2008.
slide 49CHAPTER 1 The Science of Macroeconomics
from 2006 to 2007, and from 2007 to 2008.
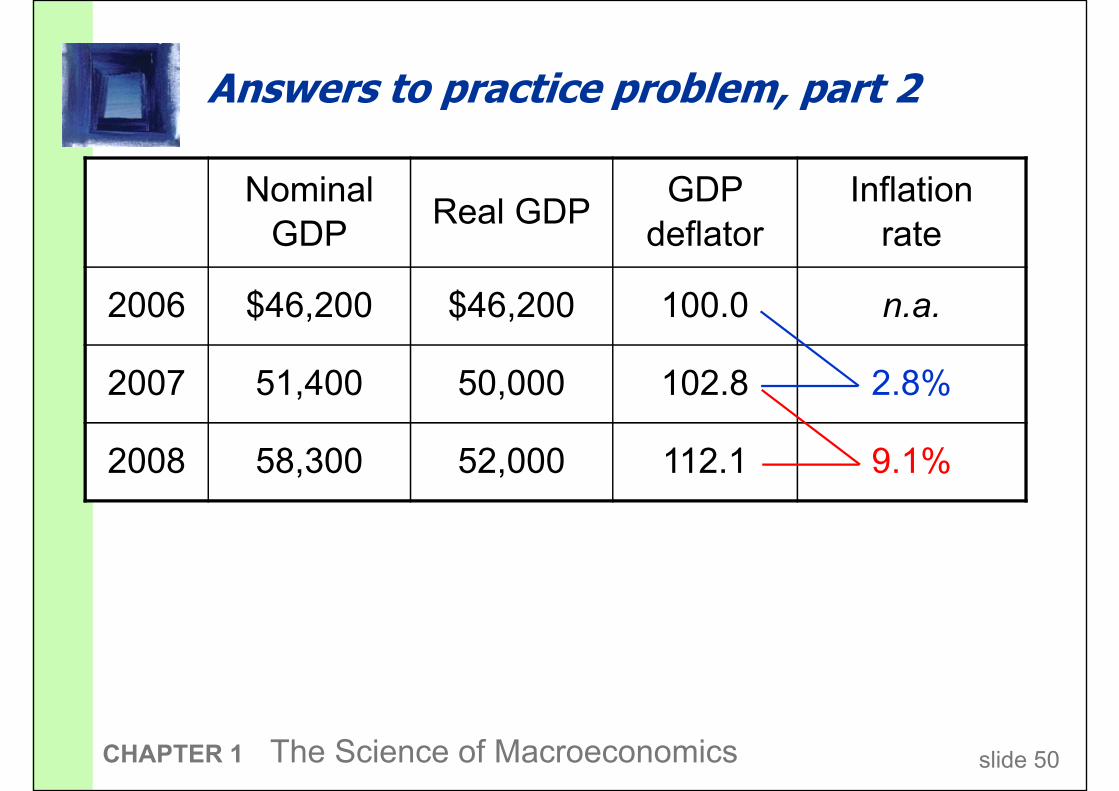
Answers to practice problem, part 2Answers to practice problem, part 2
Nominal GDP InflationNominal
GDPReal GDP
GDP
deflator
Inflation
rate
2006 $46,200 $46,200 100.0 n.a.
2007 51,400 50,000 102.8 2.8%
2008 58,300 52,000 112.1 9.1%
slide 50CHAPTER 1 The Science of Macroeconomics
Consumer Price Index (CPI)Consumer Price Index (CPI)
�� A measure of the overall level of prices
� Published by the Bureau of Labor Statistics � Published by the Bureau of Labor Statistics
(BLS)
� Uses:
�� tracks changes in the typical household’s cost of livingcost of living
� adjusts many contracts for inflation
�� allows comparisons of dollar amounts over time
slide 51CHAPTER 1 The Science of Macroeconomics
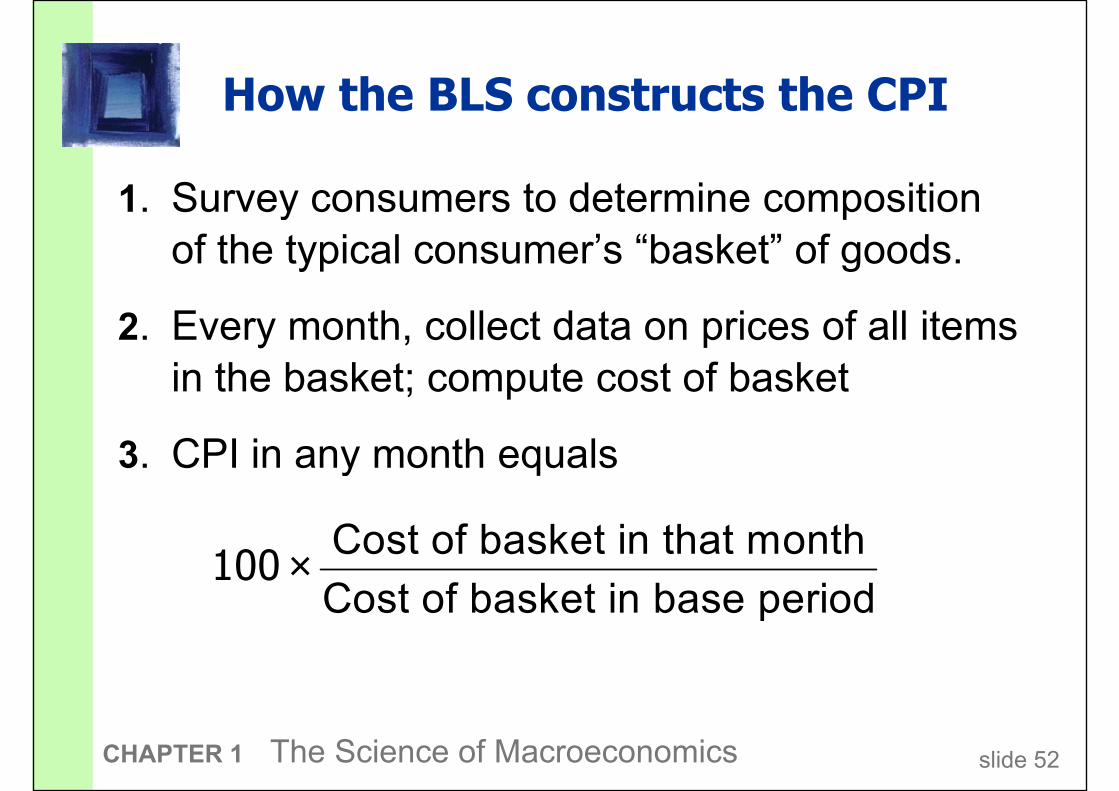
How the BLS constructs the CPIHow the BLS constructs the CPI
. Survey consumers to determine composition 1. Survey consumers to determine composition
of the typical consumer’s “basket” of goods.of the typical consumer’s “basket” of goods.
2. Every month, collect data on prices of all items in the basket; compute cost of basket
3. CPI in any month equals3. CPI in any month equals
Cost of basket in that monthCost of basket in that month
Cost of basket in base period100 ×
Cost of basket in base period
slide 52CHAPTER 1 The Science of Macroeconomics

Exercise: Compute the CPIExercise: Compute the CPI
Basket contains 20 pizzas and 10 compact discs. Basket contains 20 pizzas and 10 compact discs.
For each year, computeprices:
pizza CDs
For each year, compute
� the cost of the basketpizza CDs
2002 $10 $15
2003 $11 $15
� the cost of the basket
� the CPI (use 2002 as
the base year)2003 $11 $15
2004 $12 $16
the base year)
� the inflation rate from 2004 $12 $16
2005 $13 $15
� the inflation rate from
the preceding year
slide 53CHAPTER 1 The Science of Macroeconomics

Answers:
Cost of Inflation
Answers:
Cost of Inflation
basket CPI ratebasket CPI rate
2002 $350 100.0 n.a.
2003 370 105.7 5.7%
2004 400 114.3 8.1%
2005 410 117.1 2.5%2005 410 117.1 2.5%
slide 54CHAPTER 1 The Science of Macroeconomics
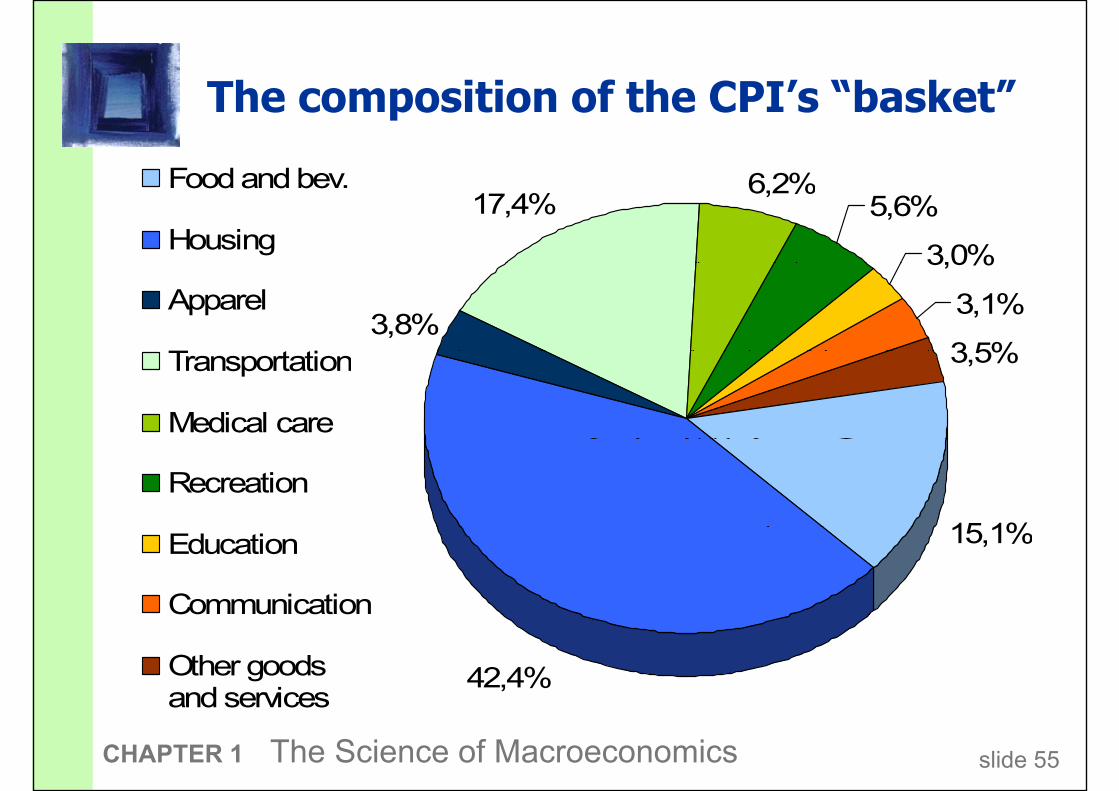
The composition of the CPI’s “basket”The composition of the CPI’s “basket”
6,2%Food and bev.17,4%
6,2%5,6%
3,0%
Food and bev.
Housing
3,8%
3,0%
3,1%
3,5%
Apparel
Transportation 3,5%Transportation
Medical care
15,1%
Recreation
15,1%Education
Communication
42,4%
Communication
Other goodsand services
slide 55CHAPTER 1 The Science of Macroeconomics
and services

Reasons why Reasons why the CPI may overstate inflation
� Substitution bias: The CPI uses fixed weights, � Substitution bias: The CPI uses fixed weights, so it cannot reflect consumers’ ability to substitute
toward goods whose relative prices have fallen.toward goods whose relative prices have fallen.
� Introduction of new goods: The introduction of � Introduction of new goods: The introduction of new goods makes consumers better off and, in effect,
increases the real value of the dollar. But it does not increases the real value of the dollar. But it does not
reduce the CPI, because the CPI uses fixed weights.
� Unmeasured changes in quality: Quality improvements increase the value of the dollar, Quality improvements increase the value of the dollar,
but are often not fully measured.
slide 56CHAPTER 1 The Science of Macroeconomics

The size of the CPI’s biasThe size of the CPI’s bias
� In 1995, a Senate-appointed panel of experts
estimated that the CPI overstates inflation by estimated that the CPI overstates inflation by
about 1.1% per year.
� So the BLS made adjustments to reduce the bias.
�� Now, the CPI’s bias is probably under 1% per
year. year.
slide 57CHAPTER 1 The Science of Macroeconomics

CPI vs. GDP DeflatorCPI vs. GDP Deflator
prices of capital goodsprices of capital goods
� included in GDP deflator (if produced domestically)� included in GDP deflator (if produced domestically)
� excluded from CPI
prices of imported consumer goodsprices of imported consumer goods
� included in CPI� included in CPI
� excluded from GDP deflator
the basket of goods
� CPI: fixed� CPI: fixed
� GDP deflator: changes every year
slide 58CHAPTER 1 The Science of Macroeconomics
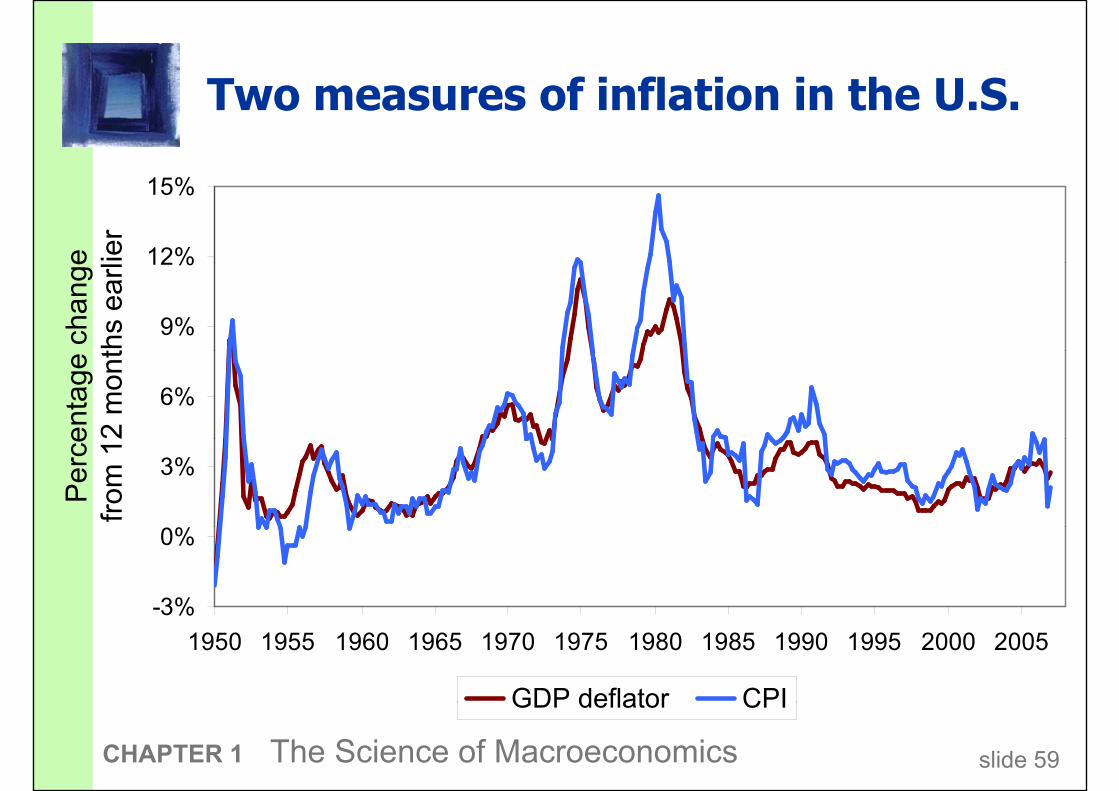
Two measures of inflation in the U.S.Two measures of inflation in the U.S.
15%
12%
15%
Percentage change
from 12 months earlier
9%
12%
Percentage change
from 12 months earlier
6%
Percentage change
from 12 months earlier
0%
3%
Percentage change
from 12 months earlier
-3%
0%
-3%
1950 1955 1960 1965 1970 1975 1980 1985 1990 1995 2000 2005
GDP deflator CPI
slide 59CHAPTER 1 The Science of Macroeconomics
GDP deflator CPI

Categories of the populationCategories of the population
� employed � employed working at a paid job
� unemployed not employed but looking for a job not employed but looking for a job
� labor force �
the amount of labor available for producing goods and services; all employed plus goods and services; all employed plus unemployed persons
� not in the labor force� not in the labor forcenot employed, not looking for work
slide 60CHAPTER 1 The Science of Macroeconomics

Two important labor force Two important labor force concepts
� unemployment rate percentage of the labor force that is unemployedpercentage of the labor force that is unemployed
� labor force participation rate � labor force participation rate the fraction of the adult population
that “participates” in the labor forcethat “participates” in the labor force
slide 61CHAPTER 1 The Science of Macroeconomics

Exercise: Compute labor force statistics
U.S. adult population by group, June 2007
Number employed = 146.1 millionNumber employed = 146.1 million
Number unemployed = 6.9 million
Adult population = 231.7 millionAdult population = 231.7 million
Use the above data to calculate
� the labor force� the labor force
� the number of people not in the labor force
� the labor force participation rate� the labor force participation rate
� the unemployment rate
slide 62CHAPTER 1 The Science of Macroeconomics

Answers:Answers:
� data: E = 146.1, U = 6.9, POP = 231.7� data: E = 146.1, U = 6.9, POP = 231.7
� labor force� labor force
L = E +U = 146.1 + 6.9 = 153.0
�� not in labor force
NILF = POP – L = 231.7 – 153 = 78.7NILF = POP – L = 231.7 – 153 = 78.7
� unemployment rate
U/L x 100% = (6.9/153) x 100% = 4.5%U/L x 100% = (6.9/153) x 100% = 4.5%
� labor force participation rate� labor force participation rate
L/POP x 100% = (153/231.7) x 100% = 66.0%
slide 63CHAPTER 1 The Science of Macroeconomics

Chapter SummaryChapter SummaryChapter SummaryChapter Summary
1. Gross Domestic Product (GDP) measures both
total income and total expenditure on the total income and total expenditure on the
economy’s output of goods & services.
2. Nominal GDP values output at current prices;
real GDP values output at constant prices. real GDP values output at constant prices.
Changes in output affect both measures,
but changes in prices only affect nominal GDP. but changes in prices only affect nominal GDP.
3. GDP is the sum of consumption, investment, 3. GDP is the sum of consumption, investment,
government purchases, and net exports.
slide 64CHAPTER 2 The Data of Macroeconomics

Chapter SummaryChapter SummaryChapter SummaryChapter Summary
4. The overall level of prices can be measured by
eithereither
� the Consumer Price Index (CPI), the price of a fixed basket of goods the price of a fixed basket of goods purchased by the typical consumer, or
� the GDP deflator, � the GDP deflator, the ratio of nominal to real GDP
5. The unemployment rate is the fraction of the labor
force that is not employed. force that is not employed.
slide 65CHAPTER 2 The Data of Macroeconomics