Embed Size (px)
Citation preview
Finance Division
Kaitlyn O’Hagan, Senior Financial Analyst
Dohini Sompura, Unit Head
Latonia McKinney, Director Regina Poreda Ryan, Deputy Director Nathan Toth, Deputy Director Paul Scimone, Deputy Director
Report of the Finance Division on the Fiscal 2020-2029 Ten-Year Capital Strategy, Fiscal 2020 Preliminary Capital Budget, Fiscal
2020 Preliminary Capital Commitment Plan, and the February 2019 Proposed Fiscal 2020-2024 Five-Year Capital Plan for the
Department of Education and the School Construction Authority
March 20, 2019
THE COUNCIL OF THE CITY OF NEW YORK
Hon. Corey Johnson Speaker of the Council
Hon. Mark Treyger Chair, Committee on Education

Finance Division Briefing Paper School Construction Authority
Table of Contents
School Construction Authority Overview .............................................................................................................. 1
DOE Preliminary Fiscal 2020-2029 Ten-Year Capital Strategy .............................................................................. 2
DOE Capital Budget and Commitment Plan .......................................................................................................... 4
Preliminary Capital Budget ............................................................................................................................... 4
Preliminary Capital Commitment Plan ............................................................................................................. 5
DOE Capital Funding Sources ............................................................................................................................ 6
Proposed DOE Fiscal 2020-2024 Five-Year Capital Plan ....................................................................................... 7
Changes from November Proposed Plan to February Proposed Plan .............................................................. 7
Council Priorities, Issues, and Concerns ................................................................................................................ 8
Appendices .......................................................................................................................................................... 11
A. DOE Preliminary Fiscal 2020-2029 Ten-Year Capital Strategy .................................................................... 11
B. DOE Adopted vs. Preliminary FY19-23 Capital Commitment Plan ............................................................. 11
C. Adopted Fiscal 2015-2019 Capital Plan vs. February Proposed Fiscal 2020-2024 Capital Plan ................. 12
Finance Division Briefing Paper School Construction Authority
1
School Construction Authority Overview
The Department of Education (DOE) provides primary and secondary education to over one million pre-Kindergarten to grade 12 students in over 1,800 schools. The School Construction Authority (SCA) was established by the New York State Legislature in 1988 to build new public schools and manage the design, construction, and renovation of capital projects in New York City's public school buildings. In 2002, state legislation consolidated management of the DOE’s capital program under the SCA. The SCA is the agency accountable for new school construction and major repairs and renovations to schools. SCA selects and acquires sites for new schools, including leases, and supervises major capital upgrades of existing DOE facilities.
State law requires the DOE to produce a Five-Year Capital Plan in addition to the City’s Capital Plan and budget for the DOE; the development of this Five-Year Capital Plan is coordinated by the SCA. This is a significant year for the DOE capital program, as SCA and DOE are completing the final year of the current Fiscal 2015-2019 Five-Year Capital Plan, and preparing a new Fiscal 2020-2024 Five-Year Capital Plan. The latest amendment to the 2015-2019 Plan was released in February 2018 and adopted by the Council in June 2018. The 2015-2019 Plan is in effect until the end of Fiscal 2019. In accordance with State law, the SCA released the first Proposed DOE Fiscal 2020-2024 Five-Year Capital Plan on November 1, 2018, and then released a revised proposed plan on February 1, 2019.
While State law only requires the creation of the DOE Capital Plan every five years, historically, the Council has executed a Memorandum of Understanding (MOU) with the Mayor and the Chancellor with the adoption of each new Five-Year Capital Plan, which outlines the annual amendment process and other terms for the Five-Year Capital Plan. A new MOU governing the annual amendment process for the Fiscal 2020-2024 Five-Year Capital Plan will be negotiated and enacted with the adoption of the Fiscal 2020-2024 Five-Year Capital Plan in June 2019.
This report provides a review of DOE’s Fiscal 2020-2029 Ten-Year Capital Strategy, Fiscal 2020 Preliminary Capital Budget, and Fiscal 2020 Preliminary Capital Commitment Plan. This is followed by a comparison of the February 2019 Proposed Fiscal 2020-2024 Five-Year Capital Plan (February Proposed Plan) to the November 2018 Proposed Fiscal 2020-2024 Five-Year Capital Plan (November Proposed Plan). For a more in-depth review of the DOE’s Proposed Fiscal 2020-2024 Five-Year Capital Plan, please see the report to the Committees on Education and Finance for the December 18, 2018 oversight hearing on the November Proposed Plan.1 Finally, the report concludes by highlighting the Council’s priorities for the new Five-Year Capital Plan and concerns with the proposal.
For Fiscal 2019, SCA currently has 816 employees, and a budgeted headcount of 909. SCA’s Fiscal 2019 $205 million operating budget is not included in the City’s Expense Budget. SCA funds its operations with capital funding, which the Office of Management and Budget (OMB) approves each year.
1 https://legistar.council.nyc.gov/LegislationDetail.aspx?ID=3764312&GUID=AA4A87C3-21AF-4855-94A6-E9E943AF2CC2&Options=&Search=

Finance Division Briefing Paper School Construction Authority
2
DOE Preliminary Fiscal 2020-2029 Ten-Year Capital Strategy
The City’s Preliminary Ten-Year Capital Strategy for Fiscal 2020-2029 (the Ten-Year Strategy) totals $104.1 billion. Of the total Ten-Year Strategy, $23 billion, or 22 percent, is for Education. The Ten-Year Strategy is the City’s long-term capital planning document which provides a framework for capital spending by agency. The Strategy is released every two years as mandated by the City Charter. DOE’s Ten-Year Strategy is broken down into categories which describe the general type of capital work being done therein. Figure 1 shows how DOE’s Ten-Year Strategy is distributed across the ten years, and highlights that the Ten-Year Strategy presents no planned spending on new schools in Fiscal 2025-2029. See Appendix A on page 11 for a breakdown of the DOE Ten-Year Capital Strategy across all categories.
By its own description the Ten-Year Strategy: “provides a venue for the City to demonstrate the comprehensive infrastructure planning that the City undertakes as part of its responsibility to all New Yorkers, across all neighborhoods, and explain the connections between capital investment and strategic priorities.” It strives to do this through four guiding principles:
1. Maintain New York City’s financial responsibility;
2. Promote forward-looking, holistic capital planning that anticipates neighborhood needs of tomorrow;
3. Advance a more equitable New York City through capital investment; and
4. Consider community perspectives in capital planning and decision-making.
However, the Ten-Year Strategy does not explicitly make connections between these guiding principles and each agency’s planned spending over the Ten-Year period. The narrative of the Ten-Year Strategy does cite work with SCA as an example of how the Strategy meets the second principle (promote forward-looking, holistic capital planning that anticipates neighborhood needs of tomorrow).
$0.68
$1.25
$1.62$1.35
$1.61
$0 $0 $0 $0 $0
$3.51 $3.42 $3.43 $3.41$3.24
$1.17 $1.17 $1.17 $1.22 $1.27
FY20 FY21 FY22 FY23 FY24 FY25 FY26 FY27 FY28 FY29
Do
llars
in B
illio
ns
Figure 1. DOE Preliminary Fiscal 2020-2029 Ten-Year Capital Strategy
System Expansion (New Schools) TOTAL
Finance Division Briefing Paper School Construction Authority
3
“As another example, the School Construction Authority (SCA) is now using updated pupil generation ratios (or “multipliers”) to estimate the number of public school students that could be introduced by new housing development…There were two major improvements to the multipliers. They now reflect (1) the most current household and school enrollment trends, and (2) differences among the 32 Community School Districts (CSDs) that were not captured by the borough averages used previously.”2
Updating the Project Public School Ratios (the “multipliers” referenced in the Ten-Year Strategy) was one of the key recommendations from the Council’s March 2018 Planning to Learn: The School Building Challenge report3, and the Council is pleased this recommendation has been implemented. However, the lack of any planned spending on new schools in the last five years of the Ten-Year Strategy reflects that OMB and the Department of City Planning (DCP) did not seriously engage with the SCA and DOE on planning for the ten-year period.
The DOE Ten-Year Strategy is incomplete, and reflects that the City does not plan for new school seats beyond the final year of the DOE Five-Year Capital Plan. OMB, DCP, and SCA did not even attempt to plan for the number of additional seats that might be needed between Fiscal 2025-2029 and estimate the associated cost. This appears to be in direct conflict with the guiding principle of the Ten-Year Strategy and its stated purpose to “demonstrate comprehensive infrastructure planning.”4 Only planning for the first half of the Ten-Year Strategy is not comprehensive. The Planning to Learn report recommended that the SCA project a rolling ten-year seat need in order to better facilitate long-term planning; implementing this recommendation would significantly improve the ability of the appropriate agencies to prepare a truly comprehensive Ten-Year Strategy for DOE.
In DOE’s own Proposed Fiscal 2020-2024 Five-Year Capital Plan, they anticipate requiring $600 million in the Fiscal 2025-2029 Five-Year Capital Plan to complete just the new school projects begun in Fiscal 2020-2024. Even if OMB, DCP, and SCA truly believed there would be no need for additional school seats to be constructed between Fiscal 2025-2029, the Ten-Year Strategy should have at least reflected the $600 million in planned spending needed to complete projects that begin in the first five years.
2 Office of Management and Budget and Department of City Planning, “Preliminary Ten-Year Capital Strategy Fiscal Years 2020-2029,” https://www1.nyc.gov/site/omb/publications/finplan02-19.page, p. I-8. 3 https://council.nyc.gov/land-use/plans/schools-working-group/ 4 Office of Management and Budget and Department of City Planning, “Preliminary Ten-Year Capital Strategy Fiscal Years 2020-2029,” https://www1.nyc.gov/site/omb/publications/finplan02-19.page, p. I-2.

Finance Division Briefing Paper School Construction Authority
4
As reflected in Figure 2, the Ten-Year Strategy’s planned spending on new schools is not the only area in which it fails to be a comprehensive planning document. In all categories planned spending in Fiscal 2025-2029 is dramatically lower than planned spending in Fiscal 2020-2024, $1.2 billion compared to $3.4 billion. Indeed, planned spending in Fiscal 2025-2029 is significantly lower than average annual commitments over Fiscal 2014-2018 of $2.8 billion. The
Ten-Year Strategy should anticipate spending in the outyears will be closer to actual spending in the past five years, a reasonable assumption given the need for ongoing state-of-good repair projects and growing construction costs. However, more than just simply projecting actual spending into the outyears, a truly comprehensive Ten-Year Strategy would develop better capital need assessment approaches that allowed for long-term planning on school capital projects and associated spending.
DOE Capital Budget and Commitment Plan
The Capital Budget and Commitment Plan determine the funding levels available to the DOE for its Five-Year Capital Plan. The legislation that established the SCA exempt the DOE from the City’s line-by-line annual Capital Budget. Instead, the City provides lump sum allocations for education capital expenditures, and the DOE determines how the funds will be used, subject to scope approval by the City. All funded projects must be listed in the DOE’s Five-Year Capital Plan.
Preliminary Capital Budget
As shown in Figure 3, the DOE Preliminary Capital Budget proposes $13.4 billion in new appropriations for Fiscal 2020-2023. This represents approximately 25 percent of the City’s total $52.8 billion Capital Budget for 2020-2023. Appropriations for Fiscal 2019 total $5.5 billion. This includes $1.1 billion in reauthorized prior appropriations and $4.4 billion in new Fiscal 2019 appropriations.5 While many City agencies have appropriations that far
5 Appropriations for Fiscal 2019 are calculated by summing the available appropriations listed in the commitment plan with actual commitments to date. Because commitments to date excludes inter-fund agreements (IFA), this figure may be slightly lower than the total appropriations for Fiscal 2019. In addition, a very small portion of the
$2.83
$3.40
$1.20
FY14-18 AverageAnnual
Commitments
FY20-24 Ten-YearStrategy Planned
Commitments
FY25-29 Ten-YearStrategy Planned
Commitments
Do
llars
in B
illio
ns
Figure 2. Outyears of DOE Ten-Year Strategy Inaccurate Compared to Past Actual Commitments
$5.55
$3.18 $3.40 $3.43 $3.41
FY19 FY20 FY21 FY22 FY23
Do
llars
in B
illio
ns
Figure 3. DOE FY19 Appropriations and Preliminary FY20-23 Capital Budget

Finance Division Briefing Paper School Construction Authority
5
exceed their planned spending, there is a relatively small difference between the DOE’s $5.5 billion in appropriations and Fiscal 2019 planned commitments of $5 billion, discussed below.
Preliminary Capital Commitment Plan
The Fiscal 2020 Preliminary Capital Commitment Plan (which is the plan to spend the appropriations in the Capital Budget) includes $18.8 billion in Fiscal 2019-2023 for the DOE. This represents approximately 22 percent of the City’s total $83.8 billion Preliminary Commitment Plan. DOE’s Preliminary Commitment Plan for Fiscal 2019-2023 is 34 percent more than the $14 billion scheduled in the Adopted Commitment Plan, an increase of $4.7 billion, as shown in Figure 4. This is due to additions supporting the Proposed DOE Fiscal 2020-2024 Five-Year Capital Plan. See Appendix B on page 11 for a table showing the variance between the Preliminary and Adopted DOE Capital Commitment Plans.
The City has historically frontloaded planned commitments for capital projects in the first year or two of the Commitment Plan; this is only marginally true for DOE’s Capital Commitment Plan. The DOE Commitment Plan shows 27 percent of total planned commitments in the first year, Fiscal 2019; the remaining four years of the Commitment Plan are evenly balanced with 18-19 percent of the total planned spending in each.
Figure 5 shows DOE’s capital commitment plan as of the Fiscal 2014-2018 Executive Budget and the actual commitments in the corresponding fiscal year. The chart also shows the capital commitment rate, which is the percentage of the capital plan committed per fiscal year. DOE does commit most of its planned commitments in any given year. In Fiscal 2018, DOE committed approximately $3.5 billion, or 84 percent of its $4.2 billion planned commitments. However, even with a very high commitment rate, DOE will end the year with some unmet commitment targets and appropriations available will be rolled into Fiscal 2020.
difference between appropriations and planned commitments are necessary to fund IFA, which are excluded from this planned commitments figure.
$5.1
$2.3 $2.3 $2.2 $2.2
$14.0
$5.0$3.5 $3.4 $3.4 $3.4
$18.8
FY19 FY20 FY21 FY22 FY23 Total
Do
llars
in B
illio
ns
Figure 4. DOE FY19-23 Adopted vs. Preliminary Capital Commitment Plan
Adopted Preliminary

Finance Division Briefing Paper School Construction Authority
6
Because the law authorizing the SCA exempts them from the City’s line-by-line Capital Budget, the structure of the DOE’s Capital Budget and Commitment Plan is different from most other City agencies. Almost all of the funding for each DOE Five-Year Capital Plan is included in one budget line (analogous to a unit of appropriation in the expense budget). Rather than representing specific projects, project IDs under this budget line reflect spending for each fiscal year. For example, funding for most of the DOE’s current Fiscal 2015-2019 Five-Year Capital Plan is in budget line E-2364, “Sixth Five-Year Educational Facilities Capital Plan.” This budget line currently has $4.8 billion, or 26 percent, of the Education Preliminary Commitment Plan. The Preliminary Commitment Plan also creates a budget line for the Fiscal 2020-2024 Five-Year Capital Plan. This budget line has $13.3 billion, or 71 percent, of the total Education Capital Commitment Plan.
Since some projects funded in the DOE’s fixed five-year capital plans continue beyond the final fiscal year of the plan, the Education Capital Budget includes budget lines for previous Five-Year Capital Plans. Uncommitted funds from these capital plans continue to roll into the next fiscal year, which is part of DOE’s overall Capital Commitment Plan roll. There are also budget lines for City Council additions to DOE’s Capital Budget and a budget line for each Borough President’s additions. Additionally, the Fashion Institute of Technology (FIT) is funded through DOE, and has budget lines in the Education Capital Commitment Plan. Finally, there are some relatively small budget lines based on project type (i.e. E-2500 “School Facilities Capital, Hurricane Sandy & Nor’easter”).
DOE Capital Funding Sources New York State funds approximately 50 percent of the City’s education capital costs through Building Aid. The City receives Building Aid funding in the operating budget, and this revenue finances debt service on education capital projects, or indirectly frees up City tax-levy to pay debt service. However, the Capital Budget, Capital Commitment Plan, and Proposed Amendment indicate that the City provides a majority of education capital funding. This is because most of the bonds currently being issued to finance DOE capital projects are City-backed bonds, such as
$2.5
$3.1 $3.2
$3.9$4.2
$2.1
$2.9$2.5
$3.1
$3.5
84%
0%
10%
20%
30%
40%
50%
60%
70%
80%
90%
100%
$0.0
$0.5
$1.0
$1.5
$2.0
$2.5
$3.0
$3.5
$4.0
$4.5
FY14 FY15 FY16 FY17 FY18
Do
llars
in B
illio
ns
Figure 5. DOE Capital Commitments, FY14-18
Planned Commitments Actual Commitments Commitment Rate
Finance Division Briefing Paper School Construction Authority
7
General Obligation, or GO, bonds. There are also State-backed bonds (Building Aid Revenue Bonds, or BARBs) issued to finance DOE capital projects.
The City also budgets for approximately $783 million in State capital funding for education through the Smart Schools Bond Act (SSBA). The City will use this funding for the removal of transportable classroom units ($300 million), the construction of pre-K capacity ($100 million), and for connectivity/classroom technology ($383 million). Currently all of this funding is budgeted in Fiscal 2019 only.
Proposed DOE Fiscal 2020-2024 Five-Year Capital Plan
As previously mentioned, the SCA and DOE released the proposed DOE Fiscal 2020-2024 Five-Year Capital Plan on February 1, 2019. The remainder of this report outlines changes made to this February Proposed Plan compared to the November Proposed Plan. For more details on the Proposed DOE Fiscal 2020-2024 Five-Year Capital Plan, please see the report to the Committee from the December 18, 2018 oversight hearing, available on the Council’s website.6
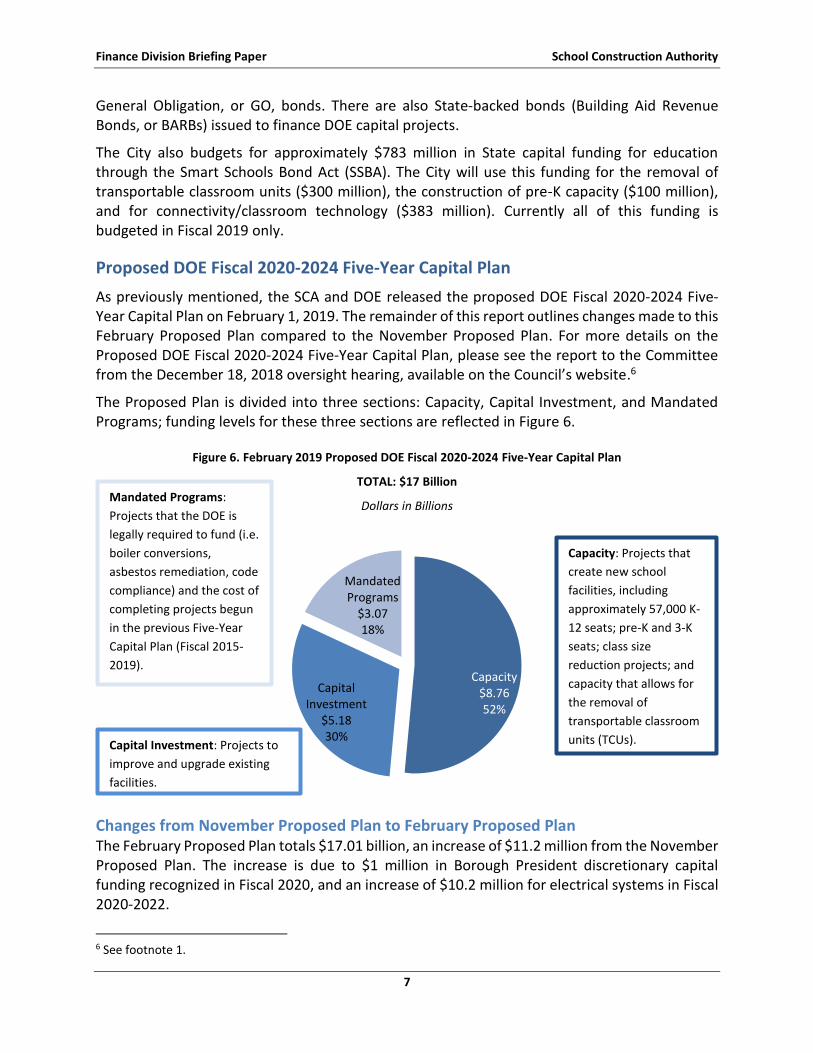
The Proposed Plan is divided into three sections: Capacity, Capital Investment, and Mandated Programs; funding levels for these three sections are reflected in Figure 6.
Changes from November Proposed Plan to February Proposed Plan The February Proposed Plan totals $17.01 billion, an increase of $11.2 million from the November Proposed Plan. The increase is due to $1 million in Borough President discretionary capital funding recognized in Fiscal 2020, and an increase of $10.2 million for electrical systems in Fiscal 2020-2022.
6 See footnote 1.
Capacity$8.7652%
Capital Investment
$5.1830%
Mandated Programs
$3.0718%
Figure 6. February 2019 Proposed DOE Fiscal 2020-2024 Five-Year Capital Plan
TOTAL: $17 Billion
Dollars in Billions
Capacity: Projects that
create new school
facilities, including
approximately 57,000 K-
12 seats; pre-K and 3-K
seats; class size
reduction projects; and
capacity that allows for
the removal of
transportable classroom
units (TCUs).
Mandated Programs:
Projects that the DOE is
legally required to fund (i.e.
boiler conversions,
asbestos remediation, code
compliance) and the cost of
completing projects begun
in the previous Five-Year
Capital Plan (Fiscal 2015-
2019).
Capital Investment: Projects to
improve and upgrade existing
facilities.

Finance Division Briefing Paper School Construction Authority
8
Beyond these funding additions, there are very few changes to the February Proposed Plan compared to the November Proposed Plan. Two additional sites are identified for K-12 capacity projects. Six new 3-K center projects are identified, all in school district 31 and all unsited. The list of capacity projects in-progress from the Fiscal 2015-2019 Five-Year Plan has been updated to include all class size projects and facility replacement projects, as well as four 3-K Centers opening in September 2019 in school District 31. These four 3-K projects were not listed in the Adopted Fiscal 2015-2019 Five-Year Capital Plan. These 10 total newly identified capacity projects funded across both plans are listed in Table 1.
Table 1. Newly Identified Capacity Projects in the February 2019 Proposed Plan
Dollars in Thousands
Plan in which the project is funded
School District School
Number of Seats Total Cost Est. Compl.
FY15-19 31 3-K Center at 1535 Richmond Ave. 225 not in plan Sep-19
FY15-19 31 3-K Center at 20 Ebbitts St. 105 not in plan Sep-19
FY15-19 31 3-K Center at 104 Housman Ave. 75 not in plan Sep-19
FY15-19 31 3-K Center at 1 Teleport Drive 60 not in plan Sep-19
FY20-24 31 3-K Center at Forest Ave. 150 $80 Aug-20
FY20-24 31 3-K Center at Bricktown Way 240 22,390 Aug-20
FY20-24 31 3-K Center at Bay St. 120 12,000 May-20
FY20-24 31 3-K Center at Amboy Road 60 4,500 Sep-20
FY20-24 31 3-K Center at Hylan Boulevard 345 34,700 Jul-20
FY20-24 31 3-K Center at Arthur Kill Road 105 $7,000 Sep-20
The February Proposed Plan identifies more capital improvement projects than the November Proposed Plan, and also makes changes to some project budgets and timelines for projects originally identified in the November Proposed Plan. See Appendix C on page 12 for a full list of funding by program area in the February Proposed Plan compared to the Adopted Fiscal 2015-2019 Five-Year Capital Plan.
Council Priorities, Issues, and Concerns
On October 31, 2018, the City Council Speaker and the Chairs of the Committee on Finance, Subcommittee on Capital Budget, and Committee on Education outlined the Council’s vision for the DOE Fiscal 2020-2024 Five-Year Capital Plan in a letter to the Mayor, DOE, and SCA. The vision consisted of five major recommendations, outlined below.
1. Implement the recommendations of the Council’s March 2018 report, Planning to Learn: The School Building Challenge. These recommendations included:
a formal identification of pre-K seat need (including seats for three year olds);
improving the integrity of the K-12 identified seat need; and
projecting seat need on a rolling ten-year basis in additional to the identified seat need, which was historically only through the final year of the Five-Year Capital Plan.
As previously mentioned, implementing these recommendations would facilitate holistic capital planning, one of the goals of the Ten-Year Strategy. Historic underinvestment in

Finance Division Briefing Paper School Construction Authority
9
school capacity has meant the City is constantly playing catch-up with seat need. The creation of a more accurate Ten-Year Capital Strategy is a bulwark against the City constantly lagging behind in school capacity. This challenge is exacerbated by the addition of Universal Pre-K and 3-K to the public school system.
2. Reset baseline expectations for safe and supportive learning environments. Accessibility, physical education spaces, and air conditioning are school essentials, not enhancements, and the Capital Plan should reflect that reality by formally assessing the need for these components across existing buildings and identifying a strategy to prioritize and fund these projects. Other critical components include play spaces for elementary students, cafeteria spaces, purpose-built therapy rooms, private treatment spaces, decent bathrooms, and basic components such as upgraded electrical systems, adequate bandwidth, and technology. Past practice has been to allocate a specific amount of funding to these program areas and simply fund as many projects as possible without clear goals or an assessment of overall need. This is inadequate planning for key City infrastructure: our schools. Reforming our approach to funding these kinds of projects to reflect holistic capital planning would also facilitate the creation of a more accurate Ten-Year Capital Strategy, while formal plans for prioritization speaks to the Ten-Year Strategy’s equity goals.
3. Adopt a more rigorous focus on efficiency and innovation. While the Council expected the school capital plan to increase in size, there are competing demands on the City’s capital budget and resources invested in education construction must be spent wisely. As reflected in Figure 7 below, the portion of capital improvement projects completed on-time and within budget has been decreasing, which is a major concern given how expensive education capital projects already are. Focusing on efficiency also aligns with the Ten-Year Strategy goal of maintaining New York City’s financial responsibility.
72% 72%
86%
72%
65%
56%
80%83%
73%
85%
76%
88%
40%
50%
60%
70%
80%
90%
100%
FY14 FY15 FY16 FY17 FY18 FY19
Actual
Figure 7. Capital Improvement Project Performance Indicators
Target
Capital improvement projects constructed on time or early (%)
Capital improvement projects constructed within budget (%)

Finance Division Briefing Paper School Construction Authority
10
4. Revise the presentation of the Five-Year Capital Plan and increase transparency. Most critically, SCA should publish the Five-Year Capital Plan in a universal machine-readable format. In addition, SCA should work with DOE to provide school communities with better, real-time information about the Capital Plan and capital projects. Providing better information to the Council and school communities would facilitate the goals of the Ten-Year Capital Strategy to “consider community perspectives in capital planning and decision-making.” The Council also requested the DOE and SCA provide the Fiscal 2015-2019 Five-Year Capital Plan closeout report by December 31, 2019.
5. Renew collaboration with the Council. The Administration and the Council should review the current capital project request process and identify improvements to ensure this is an impactful tool for highlighting otherwise overlooked areas of improvement. In addition, there may be opportunity for discretionary capital allocations to be more targeted and impactful with citywide coordination, and the Council and Administration should explore a mechanism to accomplish this.
The Council is concerned that the February Proposed Plan does not incorporate the Council’s major recommendations with regards to implementing the key recommendations of Planning to Learn, holistically assessing and funding essential school components, and providing the Five-Year Capital Plan and related documents in a more transparent format to the Council and school communities. In particular, the February Proposed Plan, like the November Proposed Plan, does not include an identified seat need. It also makes major changes to where seat need is funded compared to the November 2017 identified seat need without any explanation. For example, there are 3,961 less funded seats in District 24 than expected based on the most recent identified seat need (November 2017). The presentation of a Proposed Five-Year Capital Plan without identified seat need is a major concern to the Council, and reflects an uncooperative and non-transparent approach by the Administration to funding new schools, particularly given the Council’s extensive work on school planning.

Finance Division Briefing Paper School Construction Authority
11
Appendices
A. DOE Preliminary Fiscal 2020-2029 Ten-Year Capital Strategy Dollars in Thousands Strategy Category FY20 FY21 FY22 FY23 FY24 FY25 FY26 FY27 FY28 FY29 FY20-29
Emergency, Inspection And Miscellaneous $644,896 $487,050 $331,460 $331,410 $310,000 $318,605 $378,326 $329,494 $342,674 $356,380 $3,830,295
Educational Enhancements 395,580 343,890 365,140 360,840 347,050 68,530 115,881 92,560 96,262 100,113 2,285,846
Rehabilitation Of School Components 971,880 726,420 700,040 787,120 780,290 774,273 674,790 714,166 742,733 772,442 7,644,154
Safety And Security 70,990 68,400 66,350 68,400 67,970 12,592 5,003 37,780 39,291 40,863 477,639
System Expansion (New Schools) 678,290 1,254,770 1,622,850 1,350,230 1,609,750 0 0 0 0 0 6,515,890
System Expansion (Other) 745,170 543,370 340,480 516,380 124,720 0 0 0 0 0 2,270,120
TOTAL $3,506,806 $3,423,900 $3,426,320 $3,414,380 $3,239,780 $1,174,000 $1,174,000 $1,174,000 $1,220,960 $1,269,798 $23,023,944
B. DOE Adopted vs. Preliminary FY19-23 Capital Commitment Plan Dollars in Thousands FY19 FY20 FY21 FY22 FY23 Total
Adopted $5,132,168 $2,304,801 $2,277,769 $2,165,569 $2,165,569 $14,045,876
Preliminary 4,995,561 3,506,806 3,423,900 3,426,320 3,414,380 18,766,967
Change ($136,607) $1,202,005 $1,146,131 $1,260,751 $1,248,811 $4,721,091
% Change (3%) 52% 50% 58% 58% 34%

Finance Division Briefing Paper School Construction Authority
12
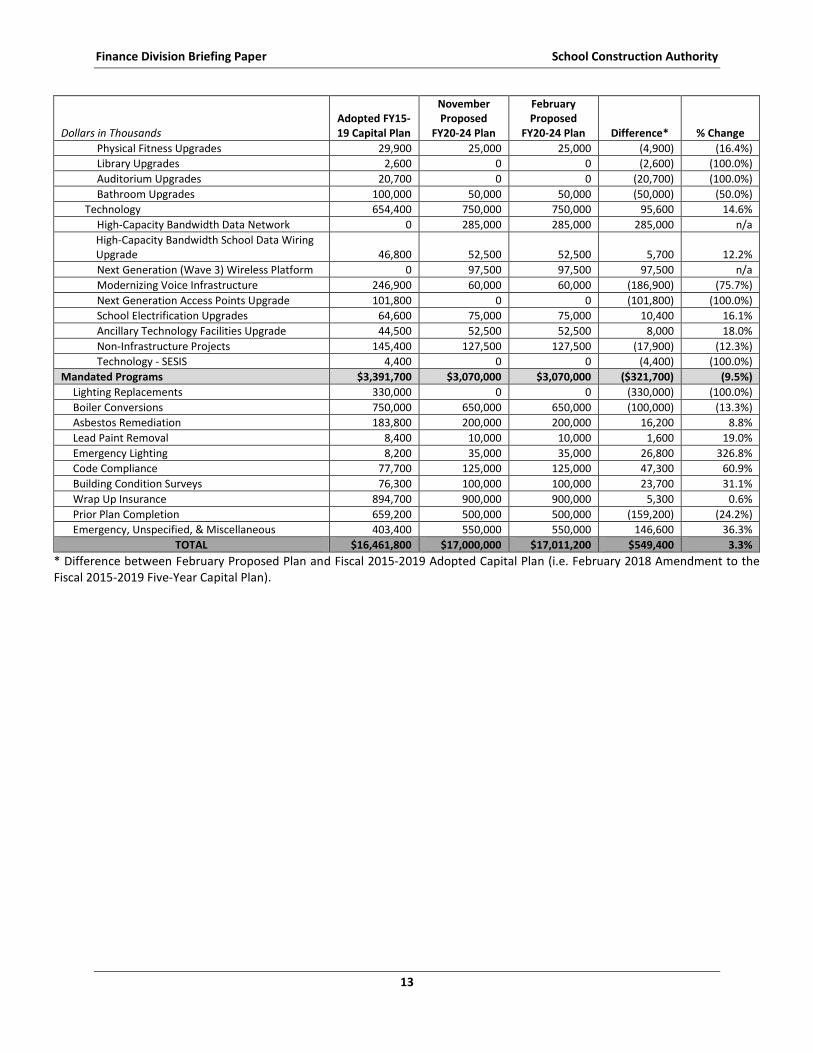
C. Adopted Fiscal 2015-2019 Capital Plan vs. February Proposed Fiscal 2020-2024
Capital Plan
Dollars in Thousands Adopted FY15-19 Capital Plan
November Proposed
FY20-24 Plan
February Proposed
FY20-24 Plan Difference* % Change
Capacity $6,446,500 $8,761,000 $8,761,000 $2,314,500 35.9%
New Capacity 4,797,500 7,881,000 7,881,000 3,083,500 64.3%
Pre-K for All 872,000 550,000 550,000 (322,000) (36.9%)
Class Size Reduction 490,000 150,000 150,000 (340,000) (69.4%)
Facility Replacement 287,000 0 0 (287,000) (100.0%)
Capacity to Support Removal of TCUs 0 180,000 180,000 180,000 n/a
Capital Investment $6,623,600 $5,169,000 $5,180,200 ($1,443,400) (21.8%)
Reso A 926,410 0 0 (926,410) (100.0%)
City Council (CC) 621,970 0 0 (621,970) (100.0%)
Borough President 301,670 0 0 (301,670) (100.0%)
Mayor/CC 2,770 0 0 (2,770) (100.0%)
Capital Improvement Program 4,068,400 2,747,500 2,757,700 (1,310,700) (32.2%)
Exteriors 2,706,100 1,856,400 1,856,400 (849,700) (31.4%)
Flood Elimination 370,900 226,600 226,600 (144,300) (38.9%)
Reinforcing Support Elements 25,300 20,500 20,500 (4,800) (19.0%)
Reinforcing Cinder Concrete Slabs 17,400 0 0 (17,400) (100.0%)
Roofs 496,200 234,900 234,900 (261,300) (52.7%)
Parapets 459,400 252,100 252,100 (207,300) (45.1%)
Exterior Masonry 1,081,400 902,800 902,800 (178,600) (16.5%)
Windows 255,500 219,500 219,500 (36,000) (14.1%)
Interiors 765,100 656,500 656,500 (108,600) (14.2%)
Low-Voltage Electrical System 158,500 80,000 80,000 (78,500) (49.5%)
Interior Spaces 56,000 27,300 27,300 (28,700) (51.3%)
Kitchen Areas 0 25,000 25,000 25,000 n/a
Climate Control (excludes mandated program) 58,000 0 0 (58,000) (100.0%)
Air Conditioning Retrofit 4,200 0 0 (4,200) (100.0%)
Boiler Conversions (excludes mandated program) 31,100 0 0 (31,100) (100.0%)
Elevators & Escalators 15,900 50,000 50,000 34,100 214.5%
Floor 7,200 27,300 27,300 20,100 279.2%
Electrical System (excludes projects under Facility Restructuring) 52,300 0 0 (52,300) (100.0%)
Lighting Fixtures (excludes Mandated Program) 41,500 0 0 (41,500) (100.0%)
Heating Plant Upgrade 276,500 414,800 414,800 138,300 50.0%
Domestic Piping (excludes Mandated Program) 56,700 0 0 (56,700) (100.0%)
Safety Systems 7,200 32,100 32,100 24,900 345.8%
Other 77,200 84,600 94,800 17,600 22.8%
TCU Removal/Playground Redevelopment 395,000 50,000 50,000 (345,000) (87.3%)
Athletic Field Upgrades 125,000 100,000 100,000 (25,000) (20.0%)
School Enhancement Projects 1,628,800 2,421,500 2,421,500 792,700 48.7%
Facility Enhancements 974,400 1,671,500 1,671,500 697,100 71.5%
Facility Restructuring 378,100 287,500 287,500 (90,600) (24.0%)
Universal Physical Education Initiative 105,500 25,000 25,000 (80,500) (76.3%)
Air Conditioning Initiative 50,000 284,000 284,000 234,000 468.0%
Safety & Security 100,000 200,000 200,000 100,000 100.0%
Science Lab Upgrades 50,000 50,000 50,000 0 0.0%
Accessibility 127,600 750,000 750,000 622,400 487.8%
Finance Division Briefing Paper School Construction Authority
13
Dollars in Thousands Adopted FY15-19 Capital Plan
November Proposed
FY20-24 Plan
February Proposed
FY20-24 Plan Difference* % Change
Physical Fitness Upgrades 29,900 25,000 25,000 (4,900) (16.4%)
Library Upgrades 2,600 0 0 (2,600) (100.0%)
Auditorium Upgrades 20,700 0 0 (20,700) (100.0%)
Bathroom Upgrades 100,000 50,000 50,000 (50,000) (50.0%)
Technology 654,400 750,000 750,000 95,600 14.6%
High-Capacity Bandwidth Data Network 0 285,000 285,000 285,000 n/a
High-Capacity Bandwidth School Data Wiring Upgrade 46,800 52,500 52,500 5,700 12.2%
Next Generation (Wave 3) Wireless Platform 0 97,500 97,500 97,500 n/a
Modernizing Voice Infrastructure 246,900 60,000 60,000 (186,900) (75.7%)
Next Generation Access Points Upgrade 101,800 0 0 (101,800) (100.0%)
School Electrification Upgrades 64,600 75,000 75,000 10,400 16.1%
Ancillary Technology Facilities Upgrade 44,500 52,500 52,500 8,000 18.0%
Non-Infrastructure Projects 145,400 127,500 127,500 (17,900) (12.3%)
Technology - SESIS 4,400 0 0 (4,400) (100.0%)
Mandated Programs $3,391,700 $3,070,000 $3,070,000 ($321,700) (9.5%)
Lighting Replacements 330,000 0 0 (330,000) (100.0%)
Boiler Conversions 750,000 650,000 650,000 (100,000) (13.3%)
Asbestos Remediation 183,800 200,000 200,000 16,200 8.8%
Lead Paint Removal 8,400 10,000 10,000 1,600 19.0%
Emergency Lighting 8,200 35,000 35,000 26,800 326.8%
Code Compliance 77,700 125,000 125,000 47,300 60.9%
Building Condition Surveys 76,300 100,000 100,000 23,700 31.1%
Wrap Up Insurance 894,700 900,000 900,000 5,300 0.6%
Prior Plan Completion 659,200 500,000 500,000 (159,200) (24.2%)
Emergency, Unspecified, & Miscellaneous 403,400 550,000 550,000 146,600 36.3%
TOTAL $16,461,800 $17,000,000 $17,011,200 $549,400 3.3%
* Difference between February Proposed Plan and Fiscal 2015-2019 Adopted Capital Plan (i.e. February 2018 Amendment to the Fiscal 2015-2019 Five-Year Capital Plan).