Embed Size (px)
Citation preview

Clinical Medicine and Diagnostics 2014, 4(3): 42-54 DOI: 10.5923/j.cmd.20140403.02
The Correlation of Body Mass Index, Age, Gender with Bone Mineral Density in Osteopenia and Osteoporosis:
A Study in the United Arab Emirates
Wasan A. M. Al Taie1,*, Abdulameer M. Rasheed2
1College of Education, American University in the Emirates, P.O. Box: 503000, Dubai, UAE 2Specialist Rheumatologists, Canadian Specialist Hospital, P.O. Box: 15881, Dubai, UAE
Abstract The primary objectives of this research are to explore and evaluate the correlation between the Body Mass Index (BMI) and Bone Mineral Density (BMD), to gauge the correlation between age and BMD and to investigate the effect of gender on BMD. Methods: BMD was determined in the femoral neck and lumbar (L2-L4) regions for 210 men and women with an average age of (57.41 ± 9.73) using dual energy X- ray absorptiometry (DEXA). Subsequently, 116 participants were determined to have osteopenia, and 94 participants had osteoporosis. We analyzed the data by multiple regression and ANOVA models. Results: We found the highest percentages of osteopenia and osteoporosis, 48.3% and 44.7%, respectively in obese patients. The statistical analysis of each independent variables (age, gender and BMI) indicated that there were no significant correlations between the BMI and BMD in osteopenia and osteoporosis (p-value = 0.2001 and p-value = 0.4622), respectively. Moreover, the correlation of the independent variables (age, gender and BMI) together and the dependent variable (BMD) was significant (p-value = 0.034, P ≤ 0.05) of osteoporosis only, but the correlation was not significant between BMD and each individual variables separately, compatible with a diagnosis of osteopenia and osteoporosis. Furthermore, the most effective variable on the BMD was the BMI (p-value= 0.02) of osteopenia, while the age (p-value = 0.011) was the most effective variable on the BMD of osteoporosis when they were tested jointly. Conclusions: The BMD was influenced significantly by all independent variables (age, gender and BMI) together in the osteoporosis not in osteopenia, so all variables together are considered as risk factors of osteoporosis. However, this effect could not be implied in the osteopenia patients.
Keywords Osteopenia, Osteoporosis, Obesity, Body mass index, Bone mineral density, Postmenopausal
1. Introduction Osteopenia and osteoporosis have become common global
health problems affecting millions of individuals, particularly those who are middle-aged and elderly [1, 2]. It has been estimated that fracture incidence exceeds 50% at age 50 years among women, and 20% among men [3]. In the United States, more than 14 million postmenopausal white women have osteopenia [4], which leads to fractures and fractures lead to extensive health problems if not diagnosed and treated early [5]. Statistical data have shown that 4-6 million (13%-18%) postmenopausal women in the United States have osteoporosis [6], whereas osteoporosis occurs in more than one-third of the women over 65 years old in western societies [7]. High levels of osteopenia and osteoporosis have been detected in screening programs in
* Corresponding author: [email protected] (Wasan A. M. Al Taie) Published online at http://journal.sapub.org/cmd Copyright © 2014 Scientific & Academic Publishing. All Rights Reserved
Dubai as of May 24 2007 [8]. Statistics show that an osteoporotic fracture occurs every three seconds, with one in three women and one in five men over 50 years old being at risk for osteoporotic fracture in the United Arab Emirates (UAE) [9]. Kiebzak et al. [10] have been revealed that osteoporotic- related hip fractures are predominant cause of death and are associated with a high incidence of disability in both men and women.
Although aging and hormone deficiency in women and men are the major causes of primary osteopenia and osteoporosis [7], numerous physiological factors could increase the incidence of secondary osteopenia and osteoporosis, including the following: hypercortisolism, hyperthyroidism, long–term glucocorticoid use, diabetes mellitus, premature ovarian failure, hypogonadism, Cushing’s syndrome, prolonged heparin treatment, anticonvulsant treatment, prolonged immobilization, eating disorders such as anorexia nervosa and a family history of the osteopenia and osteoporosis, weight loss, and being European or Asian [11, 12]. Other lifestyle factors that present risk parameters of osteopenia and osteoporosis

Clinical Medicine and Diagnostics 2014, 4(3): 42-54 43
include smoking, alcohol abuse, a diet low in dairy products or a calcium and vitamin D deficiency, excessive protein consumption, malabsorption, dieting and heavy consumption of caffeine in soft drinks and coffee [13, 14]. An important factor that affects bone mass and metabolism is physical activity [15]. Yamazaki et al. [16] demonstrated that walking exercise suppresses bone turnover in postmenopausal women with osteopenia and osteoporosis. Moreover, regular exercise and a stable weight in older age might delay the risk of fracture [17]. Al Attia et al. [18] studied the correlation between androgen levels and bone mineral density (BMD) in elderly Arab men and found that osteoporotic patients are significantly older than those with osteopenia or normal bone density. Moreover, several studies have reported that bone loss and low BMD are associated with advancing age and a low body mass index (BMI) which are considered as significant risk factors for osteoporosis in men, and menopausal, postmenopausal women [19-24].
Another serious health problem, especially for women in Arab countries, is obesity. The World Health Organization (WHO) estimated that more than 2.3 billion people will be overweight and 700 million will be obese by 2015, predominantly women [25]. Globally, the United Arab Emirates (UAE) is the fifth-ranked country in terms of obesity, particularly in women [26]. Statistics have shown that obesity and overweight in the UAE reached 25.6% in men and 39.9% in women [27]. Regarding studies on the relationships of osteopenia and osteoporosis with obesity, the results are inconsistent. Most work focuses on a positive correlation between obesity and increased bone density, especially in elderly women [28]. A high BMI is considered a protective factor on bone mineral density among elderly people [29, 30]. On the other hand, other researchers have mentioned that the risk of bone loss, osteopenia and osteoporosis are increased in overweight and obese older patients [31, 32]. Lin et al. [33] indicated that osteoporosis patients have a BMI higher than that of osteopenia patients. Age and female gender are other risk parameters in the increasing incidence of obesity and osteoporosis [34-36]. With this background and the global increase in obesity and osteoporosis; in this study, we investigated the effect of BMI, age and gender on BMD in 30-80-year old osteopenia and osteoporosis patients in the UAE. Research hypotheses Null hypotheses:
Ho: β1 = 0, there is no statistically significant effect between the independent variables (age, gender and BMI) and the dependent variable (femoral neck and the lumbar spine L2-L4) of osteopenia and osteoporosis patients.
Alternative hypotheses:
H1: β1 # 0, there is statistically significant effect between the independent variables (age, gender and BMI) and the dependent variable (femoral neck and the lumbar spine L2-L4) of osteopenia and osteoporosis patients.
The first hypothesis: Ho: There is no statistically significant effect of the BMI
on BMD in the femoral neck and the lumbar spine of osteopenia and osteoporosis patients. The second hypothesis:
Ho: There is no statistically significant effect of age on BMD in the femoral neck and the lumbar spine of osteopenia and osteoporosis patients. The Third hypothesis:
Ho: There is no statistically significant effect of gender on BMD in the femoral neck and the lumbar spine of osteopenia and osteoporosis patients.
2. Patients and Method With the approval of the Canadian specialty hospital in
Dubai which has Joint Commission International Accreditation (JCIA), the research was conducted on patients who attended the rheumatology clinic at the hospital from June 2010 till June 2012. A total of 210 patients aged 30-80 years, with an average age of (57.41 ± 9.73), were included in the study. All the patients were diagnosed as asymptomatic, with no history of fracture, and they did not suffer from other diseases including diabetes, hypertension and cardiovascular diseases. We excluded all the patients with other diseases, those who had had an organ transplant or who took medicine that might affect the BMD values. For each patient who suffered from bone pain and symptoms of osteopenia or osteoporosis, BMD was determined in the femoral neck and the lumbar spine (L2 - L4) using the dual energy X ray absorptiometry (DEXA) technique to diagnose the osteoporosis and osteopenia patients. According to the World Health Organization (WHO), osteopenia/osteoporosis is diagnosed based on the T-scores of BMD as follows: the T score of osteopenia is between -1 and -2.5, whereas the T score of osteoporosis is -2.5 or below [37, 38]. Among the 210 patients, there were 30 men and 180 women, and the BMD data were categorized into 116 patients with osteopenia and 94 patients with osteoporosis. The data of each disease were categorized based on patient age into the following four groups: group 1: 30-39; group 2: 40-49; group 3: 50-59; and group 4: 60 and above. The body weight of each patient was measured to the nearest 0.1 kg on an electronic beam scale, and the height was measured to the nearest 0.5 cm using a stadiometer. The body weight and height for each patient were measured twice per time point, and the average of the duplicate measures was calculated. The BMI was calculated using the following formula: the body weight in kg divided by the body height in meters square. The BMI was categorized by WHO as follows: underweight BMI is body weight of less than 18.5Kg/m2; normal weight BMI is body weight of 18.5-24.9 Kg/m2; overweight is body weight of 25-29.9 kg/m2; and obesity BMI is body weight of 30 Kg/m2 or more [39]. The data were analyzed without mention the names and personal details of

44 Wasan A. M. Al Taie et al.: The Correlation of Body Mass Index, Age, Gender with Bone Mineral Density in Osteopenia and Osteoporosis: A Study in the United Arab Emirates
the patients using multiple regression, ANOVA and Bivariate correlation models using Statistics Package for Social Sciences (SPSS program, version 20) to measure the correlation between BMD with the BMI, age and gender in osteopenia and osteoporosis patients. This study did not include the control samples because the diagnostic test (DEXA) of the BMD is expensive. So this test was required from the patients who had bone pain and risk factors of osteoporosis after physical examination.
3. Results A detailed description of the osteopenia and osteoporosis
patients is shown in Table (1). Among the 116 osteopenia patients, 86.2% were female and 13.8% were male, whereas
of the 94 patients with osteoporosis, 85.1% were female and 14.9% were male. The average of the BMI values of the osteopenia and osteoporosis patients was 29.05 ± 4.193 and 27.4 ± 5.363, respectively, which implies that most of the patients were under overweight category in osteopenia and osteoporosis. The average of the BMD of the osteopenia and osteoporosis patients was -1.664 ± 0.111 and -3.185 ± 0.438, respectively. Approximately 39.7% of the osteopenia participants were 50-59 years old, whereas 57.4% of the osteoporosis participants were 60 years old and above. More than 37.9% and 48% of the osteopenia patients were overweight and obese, respectively. As shown in Table (1), 19.2% of the patients were overweight and 44.7% of the osteoporosis patients were obese. A descriptive data are represented in Tables (1) and (2).
Table 1. Distribution of the patients according to Gender, Age, and BMI (Osteopenia and Osteoporosis Patients)
Patients Independent Variables Group Number Percentage
Osteopenia
Gender Male 16 13.8%
Female 100 86.2%
Age (year)
30-39 4 3.4% 40-49 25 21.6% 50-59 46 39.7% 60 + 41 35.3%
BMI
Underweight 3 2.6% Normal 13 11.2%
Overweight 44 37.9% Obese 56 48.3%
Osteoporosis
Gender Male 14 14.9%
Female 80 85.1%
Age (year)
30-39 6 6.4% 40-49 15 16.0% 50-59 19 20.2% 60 + 54 57.4%
BMI
Underweight 10 10.6% Normal 24 25.5%
Overweight 18 19.2% Obese 42 44.7%
Table 2. Association between Bone Mineral Density (BMD) and the independent variables (BMI and Age) (Osteopenia and Osteoporosis Patients)
Patients Independent variables Groups
Classification of bone mineral density (BMD) Normal Low Bone Desity Total No. % No. %
Osteopenia
BMI
Underweight 0 0 3 2.6 3 Normal 0 0 13 11.2 13
Overweight 0 0 44 37.9 44 Obese 0 0 56 48.3 56
Age (year)
30-39 0 0 4 3.4 4 40-49 0 0 25 21.6 25 50-59 0 0 46 39.7 46 60 + 0 0 41 35.3 41
Osteoporosis
BMI
Underweight 0 0 10 10.6 10 Normal 0 0 24 25.5 24
Overweight 0 0 18 19.2 18 Obese 0 0 42 44.7 42
Age (year)
30-39 0 0 6 6.4 6 40-49 0 0 15 16.0 15 50-59 0 0 19 20.2 19 60 + 0 0 54 57.4 54
Clinical Medicine and Diagnostics 2014, 4(3): 42-54 45
To test the validity of research hypotheses, we used linear multiple regression and ANOVA. The purposes for using multiple regressions were to determine the regression coefficients between the independent variables, BMI, age and gender and the dependent variable (BMD) of the osteopenia and osteoporosis patients. Cohen guidelines [40] were used to interpret the correlation among the independent variables (BMI, age and gender) looking at r- value as follows: 0.1 to 0.29 is weak, 0.30 to 0.49 is medium and 0.50 to 1.0 is large or strong correlation. ANOVA analysis is useful to study the influence of all variables jointly on the dependent variable (BMD) of the osteopenia and osteoporosis patients, looking at the p-value (sig.). In order to test the hypothesis for the model as a whole, we have to look at F-statistic and compare it with the tabulated F- statistic, if the calculated F- statistic is greater than the tabulated with two degree of freedom meaning the null hypothesis will be rejected and alternative hypothesis will be accepted The results of these statistical analyses were presented in following tables in this section. Null hypotheses:
Ho: β1 = 0, there is no statistically significant effect between the independent variables (age, gender and BMI) and the dependent variable (femoral neck and the lumbar spine L2-L4) of osteopenia and osteoporosis patients. Alternative hypotheses:
H1: β1 # 0, there is statistically significant effect between the independent variables (age, gender and BMI) and the dependent variable (femoral neck and the lumbar spine L2-L4) of osteopenia and osteoporosis patients.
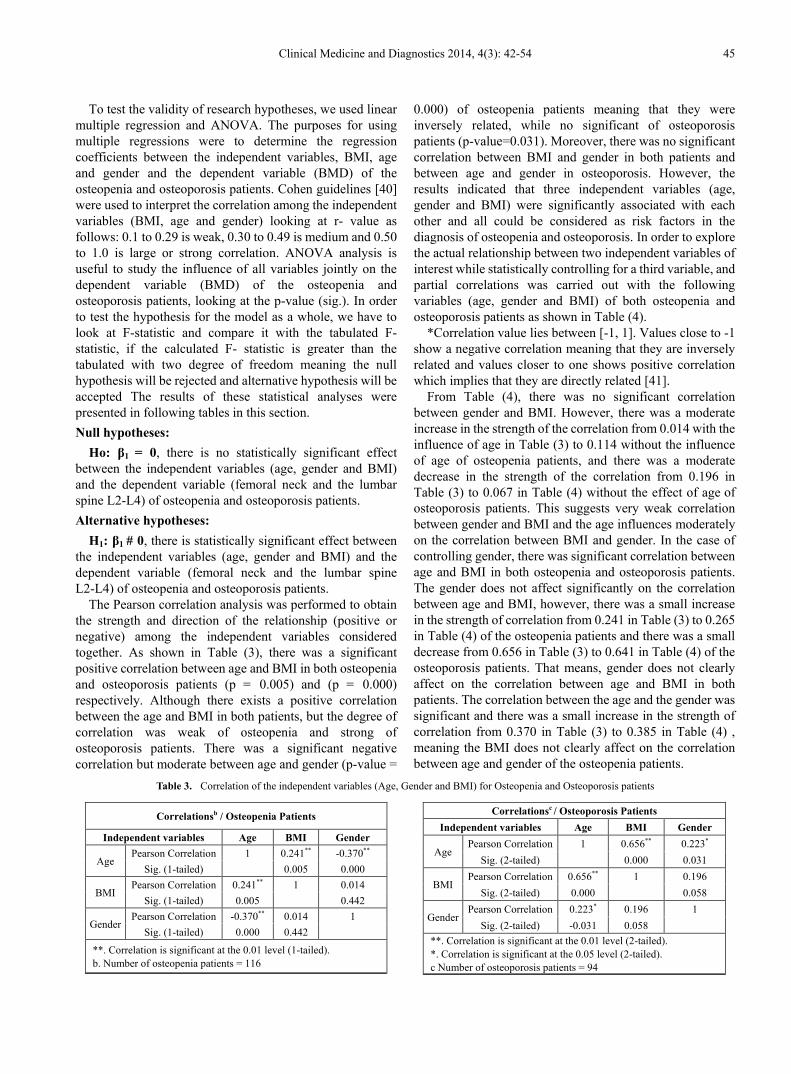
The Pearson correlation analysis was performed to obtain the strength and direction of the relationship (positive or negative) among the independent variables considered together. As shown in Table (3), there was a significant positive correlation between age and BMI in both osteopenia and osteoporosis patients (p = 0.005) and (p = 0.000) respectively. Although there exists a positive correlation between the age and BMI in both patients, but the degree of correlation was weak of osteopenia and strong of osteoporosis patients. There was a significant negative correlation but moderate between age and gender (p-value =
0.000) of osteopenia patients meaning that they were inversely related, while no significant of osteoporosis patients (p-value=0.031). Moreover, there was no significant correlation between BMI and gender in both patients and between age and gender in osteoporosis. However, the results indicated that three independent variables (age, gender and BMI) were significantly associated with each other and all could be considered as risk factors in the diagnosis of osteopenia and osteoporosis. In order to explore the actual relationship between two independent variables of interest while statistically controlling for a third variable, and partial correlations was carried out with the following variables (age, gender and BMI) of both osteopenia and osteoporosis patients as shown in Table (4).
*Correlation value lies between [-1, 1]. Values close to -1 show a negative correlation meaning that they are inversely related and values closer to one shows positive correlation which implies that they are directly related [41].
From Table (4), there was no significant correlation between gender and BMI. However, there was a moderate increase in the strength of the correlation from 0.014 with the influence of age in Table (3) to 0.114 without the influence of age of osteopenia patients, and there was a moderate decrease in the strength of the correlation from 0.196 in Table (3) to 0.067 in Table (4) without the effect of age of osteoporosis patients. This suggests very weak correlation between gender and BMI and the age influences moderately on the correlation between BMI and gender. In the case of controlling gender, there was significant correlation between age and BMI in both osteopenia and osteoporosis patients. The gender does not affect significantly on the correlation between age and BMI, however, there was a small increase in the strength of correlation from 0.241 in Table (3) to 0.265 in Table (4) of the osteopenia patients and there was a small decrease from 0.656 in Table (3) to 0.641 in Table (4) of the osteoporosis patients. That means, gender does not clearly affect on the correlation between age and BMI in both patients. The correlation between the age and the gender was significant and there was a small increase in the strength of correlation from 0.370 in Table (3) to 0.385 in Table (4) , meaning the BMI does not clearly affect on the correlation between age and gender of the osteopenia patients.
Table 3. Correlation of the independent variables (Age, Gender and BMI) for Osteopenia and Osteoporosis patients
Correlationsb / Osteopenia Patients
Independent variables Age BMI Gender
Age Pearson Correlation 1 0.241** -0.370**
Sig. (1-tailed) 0.005 0.000
BMI Pearson Correlation 0.241** 1 0.014
Sig. (1-tailed) 0.005 0.442
Gender Pearson Correlation -0.370** 0.014 1
Sig. (1-tailed) 0.000 0.442
**. Correlation is significant at the 0.01 level (1-tailed). b. Number of osteopenia patients = 116
Correlationsc / Osteoporosis Patients Independent variables Age BMI Gender
Age Pearson Correlation 1 0.656** 0.223*
Sig. (2-tailed) 0.000 0.031
BMI Pearson Correlation 0.656** 1 0.196
Sig. (2-tailed) 0.000 0.058
Gender Pearson Correlation 0.223* 0.196 1
Sig. (2-tailed) -0.031 0.058 **. Correlation is significant at the 0.01 level (2-tailed). *. Correlation is significant at the 0.05 level (2-tailed). c Number of osteoporosis patients = 94

46 Wasan A. M. Al Taie et al.: The Correlation of Body Mass Index, Age, Gender with Bone Mineral Density in Osteopenia and Osteoporosis: A Study in the United Arab Emirates
Table 4. Partial Correlation of independent variables (Age, Gender and BMI) for osteopenia and osteoporosis patients
Correlations between Gender & BMI / Osteopenia Patients Control Variables Gender BMI
Age
Gender
Correlation 1.000 0.114 Significance
(1-tailed) . 0.112
df 0 113
BMI
Correlation 0.114 1.000 Significance
(1-tailed) 0.112 .
df 113 0
Correlations between Age & BMI/ Osteopenia Patients Control Variables BMI Age
Gender
BMI
Correlation 1.000 0.265 Significance
(1-tailed) . 0.002
df 0 113
Age
Correlation 0.265 1.000 Significance
(1-tailed) 0.002 .
df 113 0
Correlations between Gender & BMI / Osteoporosis Patients Control Variables BMI Gender
Age
BMI
Correlation 1.000 0.067 Significance
(2-tailed) . 0.520
df 0 91
Gender
Correlation 0.067 1.000 Significance
(2-tailed) 0.520 .
df 91 0
Correlations between Age & BMI / Osteoporosis Patients Control Variables Age BMI
Gender
Age
Correlation 1.000 0.641 Significance
(2-tailed) . 0.000
df 0 91
BMI
Correlation 0.641 1.000 Significance
(2-tailed) 0.000 .
df 91 0
Correlations between Age & Gender/ Osteopenia Patients Control Variables Age Gender
BMI
Age
Correlation 1.000 -0.385 Significance
(1-tailed) . 0.000
df 0 113
Gender
Correlation -0.385 1.000 Significance
(1-tailed) 0.000 .
df 113 0
df = degree of freedom
Table 5. Multiple Regression Analysis and ANOVA of the independent variables (age, gender and BMI) and Dependent Variable (BMD)
Model Summaryb / Osteopenia Patients
Model R R Square Adjusted R Square
Std. Error of the Estimate
1 0.172a 0.029 0.003 0.33290
a. Predictors: (Constant), Age, BMI, Gender b. Dependent Variable: BMD
ANOVAb / Osteopenia Patients
Model Sum of Squares df Mean
Square F Sig.
1
Regression 0.376 3 0.125 1.132 .340a
Residual 12.412 112 0.111
Total 12.788 115
a. Predictors: (Constant), Age, BMI, Gender b. Dependent Variable: BMD
Model Summaryb / Osteoporosis Patients
Model R R Square Adjusted R Square
Std. Error of the Estimate
1 0.302a 0.091 0.061 0.42422
a. Predictors: (Constant), AGE, Gender, BMI b. Dependent Variable: BMD
ANOVAb / Osteoporosis Patients
Model Sum of Squares df Mean
Square F Sig.
1
Regression 1.622 3 0.541 3.005 .034a
Residual 16.197 90 0.180
Total 17.819 93
a. Predictors: (Constant), AGE, Gender, BMI b. Dependent Variable: BMD
Clinical Medicine and Diagnostics 2014, 4(3): 42-54 47
Coefficientsa / Osteopenia Patients
Model 1
Unstandardized Coefficients
Standardized Coefficients t Sig.
B Std. Error Beta
Constant -1.396 .318 -4.387 .000 BMI -.007 .006 -.115 -1.194 .235
Gender .048 .096 .050 .499 .619 Age -.003 .004 -.082 -.797 .427
a. Dependent Variable: BMD
Coefficientsa / Osteoporosis Patients
Model 1
Unstandardized Coefficients
Standardized Coefficients t Sig.
B Std. Error Beta
Constant -3.347 .366 -9.136 .000 BMI .026 .011 .315 2.367 .020
Gender .134 .124 .110 1.080 .283 Age -.013 .005 -.346 -2.584 .011
a. Dependent Variable: BMD
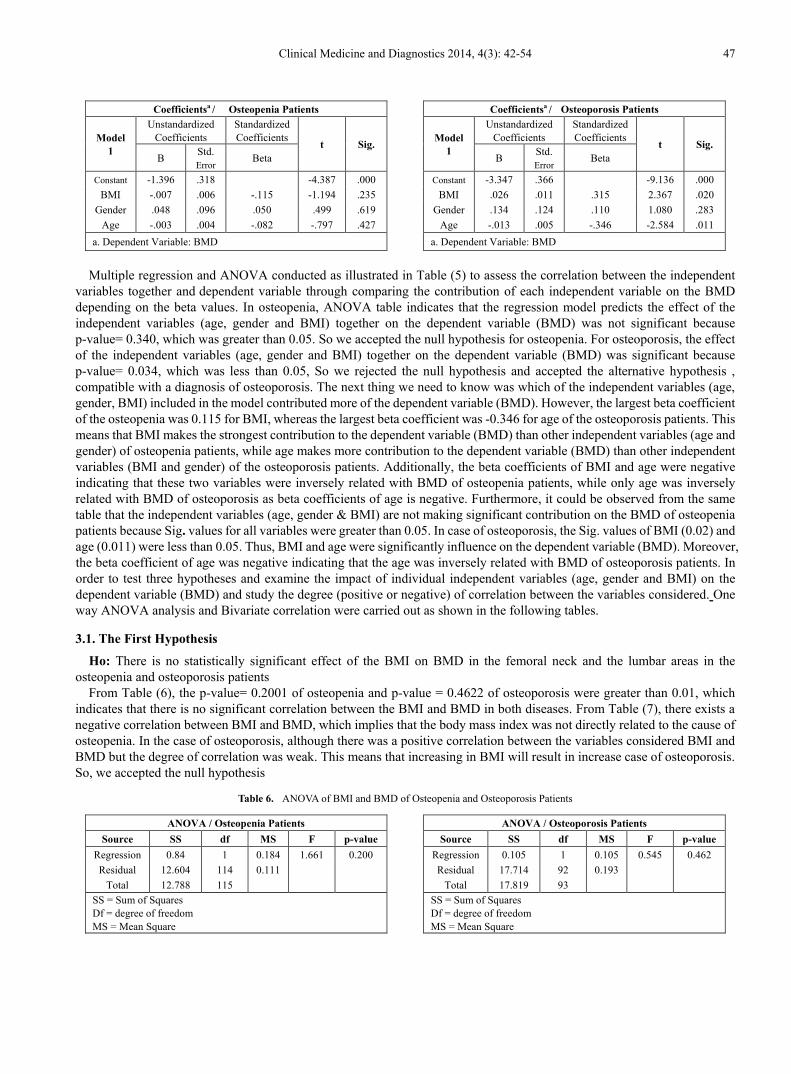
Multiple regression and ANOVA conducted as illustrated in Table (5) to assess the correlation between the independent
variables together and dependent variable through comparing the contribution of each independent variable on the BMD depending on the beta values. In osteopenia, ANOVA table indicates that the regression model predicts the effect of the independent variables (age, gender and BMI) together on the dependent variable (BMD) was not significant because p-value= 0.340, which was greater than 0.05. So we accepted the null hypothesis for osteopenia. For osteoporosis, the effect of the independent variables (age, gender and BMI) together on the dependent variable (BMD) was significant because p-value= 0.034, which was less than 0.05, So we rejected the null hypothesis and accepted the alternative hypothesis , compatible with a diagnosis of osteoporosis. The next thing we need to know was which of the independent variables (age, gender, BMI) included in the model contributed more of the dependent variable (BMD). However, the largest beta coefficient of the osteopenia was 0.115 for BMI, whereas the largest beta coefficient was -0.346 for age of the osteoporosis patients. This means that BMI makes the strongest contribution to the dependent variable (BMD) than other independent variables (age and gender) of osteopenia patients, while age makes more contribution to the dependent variable (BMD) than other independent variables (BMI and gender) of the osteoporosis patients. Additionally, the beta coefficients of BMI and age were negative indicating that these two variables were inversely related with BMD of osteopenia patients, while only age was inversely related with BMD of osteoporosis as beta coefficients of age is negative. Furthermore, it could be observed from the same table that the independent variables (age, gender & BMI) are not making significant contribution on the BMD of osteopenia patients because Sig. values for all variables were greater than 0.05. In case of osteoporosis, the Sig. values of BMI (0.02) and age (0.011) were less than 0.05. Thus, BMI and age were significantly influence on the dependent variable (BMD). Moreover, the beta coefficient of age was negative indicating that the age was inversely related with BMD of osteoporosis patients. In order to test three hypotheses and examine the impact of individual independent variables (age, gender and BMI) on the dependent variable (BMD) and study the degree (positive or negative) of correlation between the variables considered. One way ANOVA analysis and Bivariate correlation were carried out as shown in the following tables.
3.1. The First Hypothesis
Ho: There is no statistically significant effect of the BMI on BMD in the femoral neck and the lumbar areas in the osteopenia and osteoporosis patients
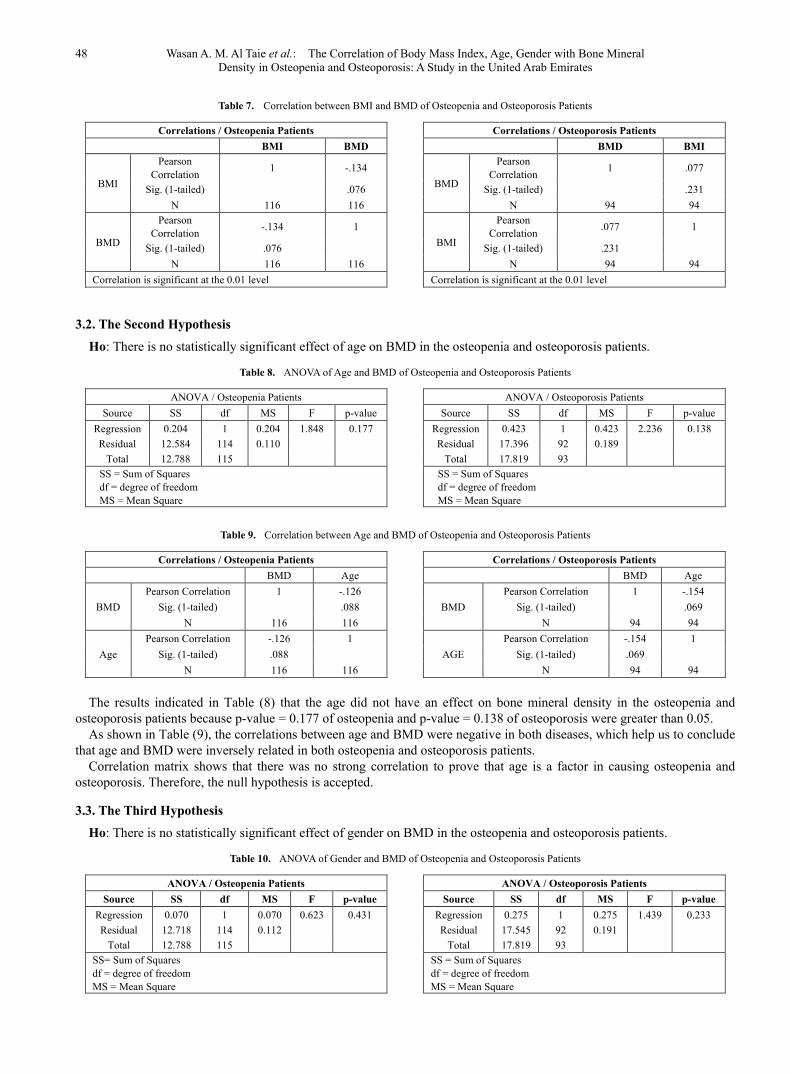
From Table (6), the p-value= 0.2001 of osteopenia and p-value = 0.4622 of osteoporosis were greater than 0.01, which indicates that there is no significant correlation between the BMI and BMD in both diseases. From Table (7), there exists a negative correlation between BMI and BMD, which implies that the body mass index was not directly related to the cause of osteopenia. In the case of osteoporosis, although there was a positive correlation between the variables considered BMI and BMD but the degree of correlation was weak. This means that increasing in BMI will result in increase case of osteoporosis. So, we accepted the null hypothesis
Table 6. ANOVA of BMI and BMD of Osteopenia and Osteoporosis Patients
ANOVA / Osteopenia Patients Source SS df MS F p-value
Regression 0.84 1 0.184 1.661 0.200 Residual 12.604 114 0.111
Total 12.788 115 SS = Sum of Squares Df = degree of freedom MS = Mean Square
ANOVA / Osteoporosis Patients Source SS df MS F p-value
Regression 0.105 1 0.105 0.545 0.462 Residual 17.714 92 0.193
Total 17.819 93 SS = Sum of Squares Df = degree of freedom MS = Mean Square
48 Wasan A. M. Al Taie et al.: The Correlation of Body Mass Index, Age, Gender with Bone Mineral Density in Osteopenia and Osteoporosis: A Study in the United Arab Emirates
Table 7. Correlation between BMI and BMD of Osteopenia and Osteoporosis Patients
Correlations / Osteopenia Patients BMI BMD
BMI
Pearson Correlation 1 -.134
Sig. (1-tailed) .076 N 116 116
BMD
Pearson Correlation -.134 1
Sig. (1-tailed) .076 N 116 116
Correlation is significant at the 0.01 level
Correlations / Osteoporosis Patients BMD BMI
BMD
Pearson Correlation 1 .077
Sig. (1-tailed) .231 N 94 94
BMI
Pearson Correlation .077 1
Sig. (1-tailed) .231 N 94 94
Correlation is significant at the 0.01 level
3.2. The Second Hypothesis
Ho: There is no statistically significant effect of age on BMD in the osteopenia and osteoporosis patients.
Table 8. ANOVA of Age and BMD of Osteopenia and Osteoporosis Patients
ANOVA / Osteopenia Patients Source SS df MS F p-value
Regression 0.204 1 0.204 1.848 0.177 Residual 12.584 114 0.110
Total 12.788 115 SS = Sum of Squares df = degree of freedom MS = Mean Square
ANOVA / Osteoporosis Patients Source SS df MS F p-value
Regression 0.423 1 0.423 2.236 0.138 Residual 17.396 92 0.189
Total 17.819 93 SS = Sum of Squares df = degree of freedom MS = Mean Square
Table 9. Correlation between Age and BMD of Osteopenia and Osteoporosis Patients
Correlations / Osteopenia Patients BMD Age
BMD Pearson Correlation 1 -.126
Sig. (1-tailed) .088 N 116 116
Age Pearson Correlation -.126 1
Sig. (1-tailed) .088 N 116 116
Correlations / Osteoporosis Patients BMD Age
BMD Pearson Correlation 1 -.154
Sig. (1-tailed) .069 N 94 94
AGE Pearson Correlation -.154 1
Sig. (1-tailed) .069 N 94 94
The results indicated in Table (8) that the age did not have an effect on bone mineral density in the osteopenia and osteoporosis patients because p-value = 0.177 of osteopenia and p-value = 0.138 of osteoporosis were greater than 0.05.
As shown in Table (9), the correlations between age and BMD were negative in both diseases, which help us to conclude that age and BMD were inversely related in both osteopenia and osteoporosis patients.
Correlation matrix shows that there was no strong correlation to prove that age is a factor in causing osteopenia and osteoporosis. Therefore, the null hypothesis is accepted.
3.3. The Third Hypothesis
Ho: There is no statistically significant effect of gender on BMD in the osteopenia and osteoporosis patients.
Table 10. ANOVA of Gender and BMD of Osteopenia and Osteoporosis Patients
ANOVA / Osteopenia Patients Source SS df MS F p-value
Regression 0.070 1 0.070 0.623 0.431 Residual 12.718 114 0.112
Total 12.788 115 SS= Sum of Squares df = degree of freedom MS = Mean Square
ANOVA / Osteoporosis Patients Source SS df MS F p-value
Regression 0.275 1 0.275 1.439 0.233 Residual 17.545 92 0.191
Total 17.819 93 SS = Sum of Squares df = degree of freedom MS = Mean Square

Clinical Medicine and Diagnostics 2014, 4(3): 42-54 49
Table 11. Correlation between Gender and BMD of Osteopenia and Osteoporosis Patients
Correlations / Osteopenia Patients BMD Gender
BMD Pearson Correlation 1 .074
Sig. (1-tailed) .216 N 116 116
Gender Pearson Correlation .074 1
Sig. (1-tailed) .216 N 116 116
Correlations/ osteoporosis patients BMD Gender
BMD Pearson Correlation 1 .124
Sig. (1-tailed) .117 N 94 94
Gender Pearson Correlation .124 1
Sig. (1-tailed) .117 N 94 94
As shown in Table (10), the p-values of osteopenia and
osteoporosis were greater than 0.05 as 0.431 and 0.233, respectively. We accepted the null hypothesis, which means that the gender did not have effect on the BMD. On the other hand, the results in Table (11) indicated that there was a positive weak correlation between the gender and the BMD. This helps us to conclude that the cases of osteopenia and osteoporosis are related to the gender of the patients, as they were found to be more common in the females compared to males.
*Correlation value lies between [-1, 1]. Values close to -1 show a negative correlation meaning that they are inversely related and values closer to one shows positive correlation which implies that they are directly related [41].
4. Discussion Osteopenia and osteoporosis affect millions of individuals.
Although many studies have been conducted to study the factors that influence the development of osteopenia and osteoporosis, especially the association between the BMI and BMD, the controversy is still continuous and the results are inconsistent. Therefore, further investigations and studies are necessary to prove or deny these hypotheses. In our study, we continue this investigation and selected three independent variables (age, gender and BMI) in order to assess their influences together and individually on the bone density. We found the highest percentages of osteopenia and osteoporosis, 48.3% and 44.7%, respectively, in obese patients. That means, when the BMI increases, the case of osteoporosis and osteopenia increases. The statistical analysis of each independent parameter indicated that there were no significant correlations between the BMI and BMD in osteopenia and osteoporosis (p-value = 0.2001 and p-value = 0.4622), respectively. That means there was a weak association between the BMI and BMD. Our explanation for this finding is that our patients had different BMI values, so we did not analyze the effect of only obesity on BMD only. Additionally, we did not separate the BMD data of the neck from that of the lumbar spine (LS. BMD), so we did not the study the effect of BMI separately on each area (neck and lumbar) as explained by AL-Maitah [42], who found a positive correlation between LS.BMD and neck BMD (R = 0.534, P ≤ 001) and positive correlation between lumbar BMD and BMI which is consistent with our data in term of
direction of the relationship between the independent variable (BMI) and dependent variable (BMD). Our results indicated that the individual variable BMI did not affect significantly on BMD of osteopenia (p-value = 0.200, p≤ 0.01) and of osteoporosis (p-value = 0.462, p≤0.01). Moreover, the correlation was weak and negative in osteopenia and weak positive in osteoporosis, but the strength of the relationship between BMI and BMD in osteopenia was greater than in the case of osteoporosis. Likewise in testing the contribution of independent variables jointly on the bone density (BMD), the most effective variable was BMI of osteopenia, while age was the most effective variable of osteoporosis as shown in Table (5). Our results indicated that the overweight and obesity do not have a protective effect on the bones in osteoporosis patients only as they are consistent with some studies in the literature [43]. Some of the previous studies mentioned the inverse relationship between body weight, BMI and osteoporosis [44-46]. The relationship between obesity and osteoporosis was explained by the suggestion that a high level of the obesity hormone “adiponectin” in the blood might increase the fragility of skeletons and the risk of fractures because of reduced muscle strength and lower muscle mass. Additionally, a high adiponectin level in the blood might increase functional aging [47, 48]. Zhao et al. [49] concluded in a study conducted on obese Chinese and Caucasian populations with osteoporosis that increasing fat mass does not have a valuable effect on the protection of bone mass. Many hypotheses have been used to explain the negative effect of obesity on bone metabolism. One of these hypotheses mentioned that obesity might increase the incidence of osteopenia and osteoporosis because of obstruction of intestinal calcium absorption by a high fat intake leading to reduced calcium availability for bone formation [50]. Another hypothesis mentioned that increased weight and body fat in postmenopausal women are related to decreased endogenous estrogen levels, which reduced the osteoblast count and accelerate bone loss [51-53]. Others studies support our results which illustrate that increased body weight and high BMI are positively correlated to high BMD [54], especially in postmenopausal women [55]. Contradictory, obese people lose bone slower than individuals with normal body weight [56, 57]. As a result, obesity has a protective effect on bone mass [58], as well as, overweight and obesity decrease the risk of osteoporosis [59].

50 Wasan A. M. Al Taie et al.: The Correlation of Body Mass Index, Age, Gender with Bone Mineral Density in Osteopenia and Osteoporosis: A Study in the United Arab Emirates
The identical results have been supported by Barrera et al. [60] who confirmed that high BMI has a protective effect on femoral neck BMD among elderly patients. Obesity and osteoporosis have a similar pathophysiological linkage [61]. Several hypotheses have been proposed to explain the protective effect of obesity on bone strength [62]. One hypothesis is that bone mass increases with increasing body mass to accommodate a greater mechanical loading on bone [63]. Adipose tissues produce estrogen in obese postmenopausal women, which inhibits bone resorption by osteoclasts, as a result increasing bones mass [64]. Sarkis et al. [65] explained the direct and indirect protective effect of endocrine changes on bone metabolism in healthy obese women in the general population. Another hypothesis associate’s obesity with insulin resistance, characterized by a high plasma insulin level that causes overproduction of ovarian androgen and estrogen and underproduction of sex hormone-binding globulin by the liver These abnormal changes might cause an elevated sex hormone level and increased bone mass because of reduced osteoclas activity and stimulated osteoblast action [66]. Migliaccio et al. [67] illustrated that obesity could be considered as a protective factor against bone loss and fractures if obesity is addressed by body mass index or body weight or it could be considered as a risk factor for osteoporosis if obesity reflects the percentage of body fat. Weight reduction might contribute to bone loss [68, 69]. Our results indicated that the incidences of osteopenia and osteoporosis were high in the 50-59 years age group (39.7%) and in the + 60 years age group (57.4%), respectively; however, there was no significant correlation between age and BMD as an individual variable for both osteopenia and osteoporosis patients with negative weak association in both cases. This result was consistent with AL-Maithah in term of direction of the relationship between the independent variable (age) and dependent variable (BMD) [42]. From our results, the multiple regression showed a significant correlation between age and BMD (p- value = 0.011, less than 0.05) when the three factors were used together in osteoporosis only. That means, the age was making a statistically significant contribution on the dependent variable (BMD) than other variables (gender and BMI) with weak correlation in the osteoporosis. Thus, this risk of osteoporosis is increased with increasing the age. The literature emphasized the effect of age on bone mass, mentioning that the risk of vertebral fracture in women above age 50 to 55 years is increased with low body weight and low BMI [70, 71] and the risk of any fracture exceeds 50% among women and 20% among men at 50 years of age [72]. This finding supported our results and is consistent with previous studies that indicated that the incidence of osteopenia and osteoporosis in men and women, especially in postmenopausal women, is increased in older age [73-75]. Balaguer and Olmos [76] found that the prevalence of osteopenia and osteoporosis in women 70-75 years old was 29.6% and 27.6%, respectively and the occurrence of osteoporosis in postmenopausal women younger than 75
years old was 82.8%. In general, osteoporosis is highly prevalent in India, and 30 million women are diagnosed with osteoporosis [77]. Unni et al. [78] assessed the bone mineral density in 105 Indian women above 40 years of age, finding that BMD decreases with increasing age and increases in obese women. Larijani, et al. [79] measured spinal BMD in women in 40-49-, 50-59, and 60-69- year old groups and found that BMD levels were lower by 3%, 1%, and 4%, respectively, than in the previous age decades. As a result of age, postural changes at the spinal column might contribute in the explanation of the relationship between obesity and obese osteoporotic women [80, 81]. Hsu et al. [82] illustrated in their research that a high percentage of body fat is the major risk for osteoporosis, osteopenia, and non-spine fractures, independently of body weight, physical activity, and age. Our data indicated that gender has no effect on BMD in osteopenia and osteoporosis (p-values = 0.431 and 0.233) respectively. However, the correlation between the gender and BMD was positive and weak of both diseases. Moreover, multiple regressions of the three variables together showed in Table (5) that the gender has lowest contribution on dependent variable (BMD) than other variables (age and BMI) with weak correlation in both diseases. According to the literature, older women suffer from osteoporosis more than men for two reasons, as follows: 1) the bones of women are smaller and have less mass than the bones of men; and 2) estrogen production in women decreases significantly at menopause. Older men have osteoporosis because of a gradual and slight decrease in the production of androgen and testosterone [2]. Our findings are consistent with AL Attia et al. in terms of gender and obesity that studied osteoporosis in men in a tertiary hospital in the UAE and concluded that osteoporosis is a disease of obese females [83].
5. Conclusions and Recommendations The prevalence of osteopenia, osteoporosis and obesity is
increasing globally. We could conclude that three independent variables (age, gender and BMI) are significantly associated with each other. Although the BMD was influenced significantly by all independent variables (age, gender and BMI) together in the osteoporosis not in osteopenia, the BMI makes more contribution to the BMD than age and gender of osteopenia and age makes more contribution to the BMD than gender and BMI of the osteoporosis. Moreover, BMD was not significantly correlated with each independent variable individually in osteopenia and osteoporosis. That means, all variables together are considered as risk factors of osteoporosis. But this effect could not be implied in the osteopenia patients. We recommend early diagnosis of osteopenia and osteoporosis for obese and non-obese men and women to prevent morbidity and mortality. Exercise and healthy nutrition at an early and older age are necessary to avoid the obesity and bone diseases.

Clinical Medicine and Diagnostics 2014, 4(3): 42-54 51
6. Disclosure Statement There is no conflict of interest regarding the publication of
this article.
ACKNOWLEDGEMENTS We thank Dr. Semiyu Aderibigbe and Dr. Alexander
Arguelles for reviewing and editing the paper.
REFERENCES [1] Guyton C., and Hall J. E. (1997) Human Physiology and
Mechanisms of Diseases, 6th edition, W. B. Saunders Company, pp 643.
[2] Tortora G. J., and Derrickson B. (2006) Principle of Anatomy and Physiology, 11th edition, John Wiley and Sons, Inc. pp189-190.
[3] Van Staa T.P., Dennison E.M., Leufkens H.G., and Cooper C. (2001) “Epidemiology of fractures in England and Wales”. Bone 29(6):517-522.
[4] Melton L.J., Chrischilles E.A., Cooper C. Lane A.W., and Riggs B. L. (2005) “How Many Women Have Osteoporosis?”. Journal of Bone and Mineral Research 20(5): 886–892. DOI: 10.1359/jbmr.2005.20.5.886.
[5] Osteoporosis. In: BergRL, Cassells JS (eds.) “The Second Fifty Years: Promoting Health and Preventing Disability”. National Academy Press, Washington, DC, pp. 76–100.
[6] K. Asomaning ER. Bertone-Johnson, P.C. Nasca , F. Hooven , and P.S. Pekow (2006) “The association between body mass index and osteoporosis in patients referred for a bone mineral density examination”, J Womens Health ( Larchmt), 15(9): pp1028-34.
[7] Reinhardt R.A., Payne J.B, Maze C.A., Patil K.D, Gallagher S.J., and Mattson J.S. (1999) “Influence of estrogen and osteopenia/osteoporosis on clinical periodontitis in postmenopausal women”. J Periodontol 70 (8): pp.823-8.
[8] Badsha H., “Osteoporosis UAE”; Dr. Humeira Badsha Medical Center, United Arab Emirates. (October 22nd 2007); available at: http://humeirabadsha.blogspot.com/2007/10/osteoporosis-uae.html (accessed 15 November 2012).
[9] Tawil T. (19 October 2011) Majority of Osteoporosis Cases Preventable, Say UAE Doctors. In: Dubib.com. Available at: http://www.dubib.com/news/15960_majority-of-osteoporsis-cases-preventable-say-uae-doctors#.UKRxg4ZEGSo (accessed 15 November 2012).
[10] Kiebzak G.M., Beinart G.A., Perser K., Ambrose C.G., Siff S.J., and Heggeness M.H., (2002) Undertreatment of Osteoporosis in Men With Hip Fracture. Arch Intern Med. 162(19):2217-2222. DOI:10.1001/archinte.162.19.2217.
[11] Marshall W. J., and Bangert S. K. (2008) “Clinical Chemistry”, 6th edition, Mosby Elsevier, pp:295,296.
[12] Fitzpatrick L.A. (2002) Secondary Causes of Osteoporosis. Mayo Clinic Proceedings 77(5): 453–468. DOI: http://dx.doi
.org/10.4065/77.5.453.
[13] Sampson H.W. (2003) Alcohol and Other Factors Affecting Osteoporosis Risk in Women. In: National Institute on Alcohol Abuse and Alcoholism. Available at: http://pubs.niaaa.nih.gov/publications/arh26-4/292-298.htm (accessed 11 June 2014).
[14] Tucker K.L., Morita K., Qiao N., Hannan M.T., Cupples L.A., Kiel D.P. (2006) “Colas, but not other carbonated beverages, are associated with low bone mineral density in older women: The Framingham Osteoporosis Study”. Am J Clin Nutr 84(4): 936-942.
[15] Watkins J. (2010) “Physical activity helps reduce bone loss: Structure and Function of the Musculoskeletal System”, 2nd edition; Hardback, pp. 408. ISBN-13: 9780736078900.
[16] Yamazaki, S., Ichimura S., Iwamoto J., Takeda T. and Toyama Y. (2004) “Effect of walking exercise on bone metabolism in postmenopausal women with osteopenia/ osteoporosis”. Clinical Rheumatology 23(5): 383-389. DOI: 10.1007/s10067-004-0881-z.
[17] Nguyen T.V., Sambrook P.N., and Eisman J.A. (1998) “Bone loss, physical activity and weight change in elderly women: The Dubbo Osteoporosis Epidemiology Study”. J Bone Miner Res. 13(9): 1458-67.
[18] AL Attia H. M., Jaysundaram K. and Saraj F. (2010) “Lack of biochemical hypogonadism in elderly Arab males with low bone mineral density disease”. Rheumatology International 30(3): 365-367, DOI: 10.1007/s00296-009-0970-z.
[19] Fawzy T., Muttappallymyalil J., Sreedharan J., Ahmed A., Alshamsi S. O. S., Bin Bader Al Ali M. S., and Al Balsooshi K. A. (2011) “Association between Body Mass Index and Bone Mineral Density in Patients Referred for Dual-Energy X-Ray Absorptiometry Scan in Ajman, UAE”. Journal of Osteoporosis, vol. 2011, Article ID 876309. DOI: 10.4061/2011/876309.
[20] De Laet C., Kanis J.A., Odén A., Johanson H., Johnell O., Delmas P., Eisman J.A., Kroger H., Fujiwara S., Garnero P., McCloskey E.V., Mellstrom D., Melton L.J. 3rd, Meunier P.J., Pols H.A., Reeve J., Silman A., and Tenenhouse A.(2005) “Body mass index as a predictor of fracture risk: a meta-analysis”, Osteoporos Int. 16: 1330-8.
[21] Poiana, M. Carsote, V. Radoi, C. Ene, D. Paun, and G. Voicu (2012) “The Body Mass Index and Bone Mineral Density Age Related Correlations – A study in 347 women. Osteoporos Int. Vol.23 (Suppl 2): S85- S386.
[22] Ravn P., Cizza G., Bjarnason V.H., Thompson D., Daley M., Wasnich R.D., Mc Clung M., Hosking D., Yates A.J., and Christiansen C. (1999) “Low body mass index is an important risk factor for low bone mass and increased bone loss in early postmenopausal women. Journal of Bone and Mineral Research 14(9):1622-7.
[23] S. I. Sofia Inez Iqbal, L. S. Mørch, M. Rosenzweig, and F. Dela, (2005) “The outcome of bone mineral density measurements on patients referred from general practice”, Journal of Clinical Densitometry 8(2): 178–182.
[24] S. Morin, J.F. Tsang, W. D. Leslie (2009) “Weight and body mass index predict bone mineral density and fractures in women aged 40 to 59 years”. Osteoporos Int. 20(3): 363-70.
[25] Center for strategic health care development (2009) “Obesity

52 Wasan A. M. Al Taie et al.: The Correlation of Body Mass Index, Age, Gender with Bone Mineral Density in Osteopenia and Osteoporosis: A Study in the United Arab Emirates
in the United Arab Emirates”. Available at: http://www.weightlosssurgery.ae/obesity-UAE.htm (accessed 5 November 2012).
[26] Saberi M. (2012) UAE the fifth most obese country in the world. In: Gulfnews.com. Available at: http://gulfnews.com/news/gulf/uae/health/uae-the-fifth-most-obese-country-in-the-world-1.1045224 (accessed 12 June 2014)
[27] Belal A. M. (2009) “Nutrition – related chronic diseasesepidemic in UAE: can we stand to stop it?”. Sudanese Journal of Public Health 4(4): 383-392.
[28] R Filip, and G. Raszewski (2009) “Bone mineral density and bone turnover in relation to serum leptin, alpha- ketoglutarate and sex steroids in overweight and obese postmenopausal women”. Clinical Endocrinol, vol. 70, pp. 214-20, ( Oxf).
[29] G.Barrera, D. Bunout, V. Gattas, M. Pía de la Maza, L. Leiva, and S. Hirsch (2004) “A high body mass index protects against femoral neck osteoporosis in healthy elderly subjects”, Nutrition 20(9): 769-771.
[30] S. L. Edelstein, and E. Barre_-Connor (1993) “Relation between body size and bone mineral density in elderly men and women”, Am J Epidemiol, vol. 138, pp. 160-9.
[31] T. Villareal, K. Shah, M. R Banks, D. R Sinacore and S. Klein (2008) “Effect of weight loss and exercise therapy on bone metabolism and mass in obese older adults: a one – year randomized controlled trial”, J Clin Endocrinol Metab, vol. 93, pp. 2181-7.
[32] Rosales-Aujang E, Muñoz-Enciso JM, and Arias-Ulloa R.(2014) Prevalence of osteopenia and osteoporosis in postmenopausal women and its relation to risk factors. Ginecol Obstet Mex. 82(4):223-8.
[33] H. Lin, Q Luo, C. He, L. Yang, H. He, Y. Wu , Q. Lan, W. Xie, E. Xiong, (2010) “On correlation between body mass index and lumbar spine average bone mineral density: a study in male patients with osteopenia and those with osteoporosis”, Sheng Wu Yi Xue Gong Cheng Xue Za Zhi, vol. 27(1): 138-41.
[34] F.B. Hu, (2003) “Overweight and obesity in women: health risks and consequences”, J Women Health, 12( 2): 163–172.
[35] C. Albala, M. Yanez, E. Devoto, C. Sostin, L. Zeballos, and J.L. Santos (1996) “ Obesity as a protective factor for postmenopausal osteoporosis”, Int J Obes Relat Metab Disord, vol. 20, pp. 1027–1032 [PubMed].
[36] NIH Consensus Development Panel (2001) “Osteoporosis prevention, diagnosis, and therapy” JAMA, vol. 285, pp. 785–795 [PubMed].
[37] J.A. Kanis, 3rd LJ Melton, C. Christiansen, C.C. Johnston, and N. Khaltaev (1994). “The diagnosis of osteoporosis”, J Bone Miner Res, vol. 9, pp. 1137–1141.
[38] Richmond B. (2003) DXA scanning to diagnose osteoporosis: Do you know what the results mean?. Cleveland Clinic Journal of Medicine 70(4).
[39] World Health Organization, adapted from WHO (1995), WHO (2000) and WHO (2004). BMI classification Available at: http://apps.who.int/bmi/index.jsp?introPage=intro_3.html (accessed 13 November 2012).
[40] Cohen, J. (1988). Statistical power analysis for the behavioral
sciences (2nd ed.). New Jersey: Lawrence Erlbaum.
[41] Pallant Julie (2010) SPSS Survival Manual, A step by step guide to data analysis using SPSS 4th edition. McGraw Hill companies.
[42] AL Maitah R. K. F. (2013) “The Relation Between T-score, Z-score, Bone Mineral Density and Body Mass Index”, Mathematical Theory and Modeling 3(5). ISSN 2224-5804 (Paper), ISSN 2225-0522 (Online).
[43] Wardlaw, G. M. (1996) “Putting body weight and osteoporosis into perspective”, Am J Clin Nutr, vol. 63, pp. 433S–436S. [PubMed]
[44] Holecki M., Markiewicz B.Z., Wiecek A., Nieszporek T., and Zak-Gołab A., (2008) “Obesity and bone metabolism”, Endokrynol Pol.59(3):218-23.
[45] M. Espallargues, l. S. – Colom L, M.D. Estrada, M. Sola, L. del Rio, J. Setoain, and A. Granados, “Identifying bone mass related risk factors for fracture to guide bone densitometry measurements: a systematic review of the literature”, Osteoporos Int, vol. 12, pp. 811-822, 2001.
[46] C. De Laet, J. A. Kanis, A. Oden, H. Johanson, O. Johnell, P. Delmas, J.A. Eisman, H. Kroger , S. Fujiwara, P. Garnero, E.V. Mc Closkey, D. Mellstrom, L.J. Melton LJ, P.J. Meunier, H.A. Pols, J. Reeve, A. Silman, and A. Tenenhouse , “Body mass index as a predictor of fracture risk: a meta – analysis”, Osteoporos Int, vol. 16, pp. 1330-1338, 2005.
[47] Mellström, “Obesity Hormone Adiponectin Increases the Risk of Osteoporosis in the Elderly”, (Nov. 2, 2011), Study Finds. Sahlgrenska Academy at the University of Gothenburg, Sweden and consultant at Sahlgrenska University Hospital. Available at: http:www.sciencedaily.com/releases/2011/11/111101171036.htm and http://www.sahlgrenska.gu.se/english/news_and_events/news/News_Detail/obesity-hormone-adiponectin-increases-the-risk-of-osteoporosis-in-the-elderly.cid1044806 (accessed 9 November 2012).
[48] L. Basurto, R. Galva´n, N. Cordova, R. Saucedo, C. Vargas, S. Campos, E. Halley, F. Avelar and A. Za´rate, (2009) “Adiponectin is associated with low bone mineral density in elderly men. European Journal of Endocrinology”, vol. 160, pp. 289–293, ISSN 0804-4643.
[49] L.-J. Zhao, Y.-J. Liu, P.-Y. Liu, J. Hamilton, R. R. Recker, and H.-W. Deng (2007) “Relationship of obesity with osteoporosis. J Clin Endocrinol Metab, vol. 92(5): 1640–1646, doi: 10.1210/jc.2006-0572.
[50] J. J Cao, “Effects of obesity on bone metabolism”, Journal of Orthopaedic Surgery and Research, vol. 6, pp. 30, 2011; doi:10.1186/1749-799X-6-30.
[51] A. Tchernof, J. C. Escandon, C.K. Sites, and E.T. Poehlman, “Menopause; Central body fatness and insulin resistance: Effects of hormone-replacement therapy”, Coron Artery Dis vol. 9: pp.503-511, 1998.
[52] J. Justesen, K. Stenderup, E.N. Ebbesen, L. Mosekilde, T. Steiniche and M. Kassem , “Adipocyte tissue volume in bone marrow is increased with aging and in patients with osteoporosis”, Biogerontology, vol. 2, pp.165- 171,2001.
[53] B.L. Riggs, S. Khosla, and L.J. Melton, “A unitary model for involutional osteoporosis: Estrogen deficiency causes both type I and type II osteoporosis in postmenopausal women and contributes to bone loss in aging men”, J Bone Miner Res. vol.
Clinical Medicine and Diagnostics 2014, 4(3): 42-54 53
13, pp.763-773, 1998.
[54] D.T. Felson, y. Zhang, M.T. Hannan, and J.J. Anderson, “Effects of weight and body mass index on bone mineral density in men and women: the Framingham study”, J Bomne Miner Res. ,vol 8, PP. 567-573, 1993.
[55] M. Steinschneider, P. Hagag, M. J Rapoport and M. Weiss, “Discordant effect of body mass index on bone mineral density and speed of sound”, BMC Musculoskeletal Disorders, vol. 4, pp. 15, 2003. doi:10.1186/1471-2474-4-15.
[56] J.E. Compston, M.A. Laskey, P.I. Croucher, A. Coxon, and S. Kreitzman, “Effect of diet – induced weight loss on total body bone mass”, Clin Sci 9 Lond , vol. 82, pp.429-432, 1992.
[57] T.L.Holbrook, and E. B. – Connor, “The association of lifetime weight and weight control patterns with bone mineral density in an adult community”, Bone Miner, vol.20, pp. 141-9, 1993.
[58] K. – C. Kim , D. – H. Shin , S.- Y. Lee , J.- A. Im , and D. – C. Lee , “Relation between Obesity and Bone Mineral Density and Vertebral Fractures in Korean Postmenopausal Women”, Yonsei Med J, vol. 51, no. 6, pp. 857-863, 2010.
[59] B. Tarquini, N. Navari ,F. Perfetto , A. Piluso , S. Romano , and R. Tarquini, “Evidence for bone mass and body fat distribution relationship in postmenopausal obese women” , Arch Gerontol Geriatr, 24(1):15-2, 1997.
[60] Barrera, D. Bunout , V. Gattás , M.P. de la Maza , L. Leiva , and S. Hirsch, “A high body mass index protects against femoral neck osteoporosis in healthy elderly subjects”, Nutrition 20 (9): 769-71,2004.
[61] L.-J. Zhao, H. Jiang, C. J Papasian, D. Maulik, B. Drees, J. Hamilton, and H.- W. Deng , “Correlation of obesity and osteoporosis : effect of fat mass on the determination of osteoporosis”, J Bone Miner Res , vol. 23, pp. 17-29, 2008.
[62] L.V. Shan, W.U. Lin, P. Cheng, Y.U. Jing, A. Zhang, J. Zha, J. Liu, L. Wang, W. Di, Miao Hu, H. Qi, Y. Li, and G. Ding, “ Correlation of obesity and osteoporosis: Effect of free fatty acids on bone marrow-derived mesenchymal stem cell differentiation”, Exp Ther Med, vol. 1( 4):603–610, 2010. doi: 10.3892/etm_00000095.
[63] L. J. Zhao, H. Jiang, C.J. Papasian, D. Maulik, B. Drees, J. Hamilton, H.W. Deng, and L.J. Zhao , “Correlation of obesity and osteoporosis: effect of fat mass on the determination of osteoporosis”, J Bone Miner Res, vol. 23, pp. 17–29, 2008.
[64] T. Kameda, H. Mano, T. Yuasa, Y. Mori, K. Miyazawa, M. Shiokawa, Y. Nakamaru, E. Hiroi, K. Hiura, A. Kameda, N.N. Yang, Y. Hakeda, and M. Kumegawa, “Estrogen inhibits bone resorption by directly inducing apoptosis of the bone-resorbing osteoclasts”, J Exp Med, vol. 186, pp. 489–495, 1997. [PubMed].
[65] K. S. Sarkis, L. A. Martini, V. L. Szejnfeld and M. M. Pinheiro, “Low fatness, reduced fat intake and adequate plasmatic concentrations of LDL-cholesterol are associated with high bone mineral density in women: a cross-sectional study with control group”, Lipids in Health and Disease, vol. 11, pp. 37, 2012. doi:10.1186/1476-511X-11-37.
[66] I.R. Reid, “Relationships among body mass, its components, and bone”, Bone, vol. 31, pp. 547–555, 2002. [PubMed]
[67] S. Migliaccio, E. A. Greco, R. Fornari, L. M. Donini, and
Andrea Lenzi, “Is obesity in women protective against osteoporosis?”, Diabetes Metab Syndr Obes., vol.4, pp. 273–282, 2011. Published online 2011 July 4. doi: 10.2147/ DMSO.S11920.
[68] O. L. Svendsen, C. Hassager, and C. Christiansen, “Effect of an energy restrictive diet, with or without exercise, on lean tissue mass, resting metabolic rate, cardiovascular risk factors, and bone in overweight postmenopausal women” , Am J Med , vol. 95, pp. 131-140, 1993.
[69] T. l. Radak, “Caloric restriction and calcium’s effect on bone metabolism and body composition in overweight and obese premenopausal women”, Nutr Rev, vol. 62, pp. 468–481, 2004. [PubMed].
[70] M. Van der Klift, C.E. de Laet, E.V. McCloskey, O. Johnell, J.A. Kanis, A. Hofman, and H.A. Pols, “Risk factors for incident vertebral fractures in men and women: the Rotterdam Study”, J Bone Miner Res, vol. 19, pp. 1172-1180, 2004.
[71] J. Finigan, D. M. Greenfield, A. Blumsohn, R.A. Hannon, N.F. Peel, G. Jiang, and R. Eastell, “Risk factors for vertebral and nonvertebral fracture over 10 years: a population – based study in women”, J Bone Miner Res, vol. 23, pp. 75-85, 2008.
[72] T.P. Van Staa, E.M. Dennison, H.G. Leufkens, and Cooper, “Epidemiology of Fractures in England and Wales”, Bone vol. 29, PP. 517-522, 2001.
[73] J. La Fleur, C. Mc Adam – Marx, C. Kirkness, D.I. Brixner DI, “Clinical risk factors for fracture in postmenopausal osteoporotic women: a review of the recent literature (March). Ann Pharmacother, vol. 29, 2008.
[74] A. Papaioannou, L. Joseph, G. Ioannidis, C. Berger, T. Anastassiades, J. P. Brown, D.A. Hanley, W. Hopman, R. G. Josse, S. Kirkland, T.M. Murray, W.P. Olszynski, L. Pickard, J. C. Prior, K. Siminoski, and J.D. Adachi, “Risk factors associated with incident clinical vertebral and nonvertebral fractures in postmenopausal women: the Canadian Multicentre Osteoporosis Study (CaMos)”, Osteoporos Int, vol. 16, pp. 568-578, 2005.
[75] R. Hollaender, F. Hartl , M.A. Krieg, A. Tyndall, C. Geuckel, C. Buitrago – Tellez, M. Manghani, M. Kraenzlin, R. Theiler, and D. Hans, “Prospective evaluation of risk of vertebral fractures using quantitative ultrasound measurements and bone mineral density in a population based sample of postmenopausal women: results of the basel Osteoporosis Study”, Ann Rheum Dis, 68, PP. 391-396, 2009.
[76] J. R. Balaguer, J. M. Olmos, “Prevalence of osteopenia and osteoporosis in postmenopausal women”, Aten Primaria, vol. 35, no. 7, pp. 342-5, 2005.
[77] R.S. Shah, and L.S Savardekar, “Symposium, Forum 9. Mumbai India”, Post menopausal osteoporosis in India: Growing public health concern; pp. 12–6, 2005.
[78] J. Unni, R. Garg, and R. Pawar, “Bone mineral density in women above 40 years”, J Midlife Health, vol.1, no.1, pp. 19–22. 2010; doi: 10.4103/0976-7800.66989.
[79] B. Larijani, A. Hossein-Nezhad, A. Mojtahedi, M. Pajouhi, M.H. Bastanhagh, A. Soltani, et al, “Normative data of bone mineral density in healthy population of Tehran, Iran: A Cross sectional study”, BMC Musculoskelet Disord, vol. 6, pp. 38, 2005. [PubMed]
[80] S.A. Fabris de Souza, J. Faintuch, A.C. Valezi, A.F. Sant’

54 Wasan A. M. Al Taie et al.: The Correlation of Body Mass Index, Age, Gender with Bone Mineral Density in Osteopenia and Osteoporosis: A Study in the United Arab Emirates
Anna, J.J.Gama Rodrigues, I.C. de Batista Fonseca, and R.D. de Melo, “Postural changes in morbidly obese patients”, Obes Surg, vol. 15, pp. 1013-1016, 2005.
[81] T.S. Keller, D. E. Harrison, C. J. Colloca, D.D. Harrison, and T.J. Janik, “Prediction of osteoporotic spinal deformity”, Spine, vol. 28, pp. 455-462, 2003.
[82] Y.-H. Hsu, S. A Venners, H. A Terwedow, Y. Feng, T. Niu, Z. Li, N. Laird, J. D Brain, S. R Cummings, M. L Bouxsein, C. J
Rosen, and X. Xu, “Relation of body composition, fat mass, and serum lipids to osteoporotic fractures and bone mineral density in Chinese men and women”, Am J Clin Nutr, vol. 83, pp.146 –54, 2006.
[83] H.AL Attia and B. Adams, “Osteoporosis in men: are we referring enough for DXA and how?”, Clinical Rheumatology, vol. 26, pp. 1123-1126, 2007. DOI: 10.1007/s 10067-006-0406-z.