Embed Size (px)
Citation preview
The concentrations, behaviour and fate of polycyclic aromatic hydrocarbons (PAHs) and their oxygenated
and nitrated derivatives in the urban atmosphere
by
Ian James Keyte
A thesis submitted to the University of Birmingham for the degree of Doctor of Philosophy
Division of Environmental Health and Risk Management, School of Geography, Earth and Environmental Sciences, University of
Birmingham, Edgbaston, B15 2TT, United Kingdom
December 2014

University of Birmingham Research Archive
e-theses repository This unpublished thesis/dissertation is copyright of the author and/or third parties. The intellectual property rights of the author or third parties in respect of this work are as defined by The Copyright Designs and Patents Act 1988 or as modified by any successor legislation. Any use made of information contained in this thesis/dissertation must be in accordance with that legislation and must be properly acknowledged. Further distribution or reproduction in any format is prohibited without the permission of the copyright holder.
ii
Abstract
Polycyclic aromatic hydrocarbons (PAHs) play an important role in urban air quality due to the toxic
and carcinogenic hazard they present. A class of pollutants receiving increasing interest from
researchers are oxygenated (OPAH) and nitrated (NPAH) derivative compounds. There is a need
for an improved understanding of the sources, concentrations, behaviour and fate of these
pollutants as they can pose a similar public health risk as PAHs and can enter the environment
both from primary combustion emissions and secondary formation from atmospheric reactions.
This study investigates the airborne concentrations of PAH, OPAH and NPAH compounds in U.K.
atmosphere at heavily trafficked and urban background sites. Sampling campaigns were
conducted to assess the spatial and temporal trends, primary and/or secondary sources, gas-
particle phase partitioning and atmospheric degradation of PAHs, NPAHs and OPAHs. Differences
in atmospheric concentrations between trafficked sites and the urban background site indicate a
variable influence of road traffic emissions between different PAH, OPAH and NPAH compounds.
Seasonal, diurnal and temporal patterns as well as positive matrix factorisation (PMF) source
apportionment provide evidence of the key influencing factors governing the concentrations of
PAHs, OPAHs and NPAHs in the urban atmosphere, in addition to the strength of road traffic
emissions. For example, specific non-traffic sources are identified at these sites including
combustion sources such as domestic and non-domestic wood combustion, and non-combustion
sources such as temperature-driven volatilisation from surfaces. Evidence for the occurrence of
PAH reactivity and atmospheric formation of NPAH and OPAH compounds between traffic and
background sites is also observed, with the relative rates of atmospheric degradation shown to
play a key role influencing the observed concentrations at these sites. It is also indicated that
emissions of NPAHs from road traffic relative to PAHs have increased substantially in the last 20
years, consistent with the increased proportion of diesel passenger vehicles in the U.K. traffic fleet.

iii
Acknowledgements
I would like firstly to say a huge thank you Professor Harrison. It was always going to take careful,
considered and wise supervision to guide someone as dense as me though a PhD. Thanks for
being up to the challenge. I would also be remiss if I didn’t say thanks to Mary for putting up with all
my stupid questions and sorting out things like infuriating international order requests and many
many other things.
In particular I need to thank Chris, whose guidance, support and infinite patience in the lab has
made this project possible. I literally could not have done it without him. I would also like to thank
Salim for being a friendly and reassuring presence in the frustrating and often miserable toil of lab
work and for being a good companion on our adventures in Munster and Oregon.
I am grateful to Gillian and Eimear for their help in the lab and especially to Richard and Jamie,
who have been amazingly helpful and kind and helped me avoid more than a few potential
disasters. I also need to thank Duick Young for his help with accessing Elms Cottage weather data
and the good folks at Amey for helping with the tunnel sampling,
To my great friends/co-conspirators for the last 4 years - Pallavi, Max, Barbara, Karima, Paul and
Anna - you are all truly insane and wonderful - in that order (especially you, Pallavi). There is no
way I could have made it through this without laughing so much with and/or at you (you again,
Pallavi). Lunchtime will never be as much fun without you. I also say thanks to all the members of
the 4th Floor Crew over the years, who it has been a pleasure to know.
Je dis un grand merci à Perrine for being so supportive and patient with me while I have been
working on this and for her important guidance on important complex technical issues like how to
use a computer.
But above all I want to thank my dad, who has always supported me and never given up on me
even during all the times I have given up on myself and even though I sometimes give him every
reason to. I am truly grateful. Cheers dad.
“Life is a ball of beauty that makes you want to just cry......then you die”. – Kurt Vile.

iv
Contents
Page No. 1. Introduction 1.1. Polycyclic aromatic hydrocarbons (PAHs), urban air quality and public health 1
1.1.1. Urban air quality and public health 1
1.1.2. The chemical and physical properties of PAHs, OPAHs and NPAHs 2
1.1.3. Policy issues 3 1.2. Sources of PAHs, OPAHs and NPAHs 8 1.2.1. Sources of PAHs 8 1.2.2. Sources of OPAHs and NPAHs 12 1.2.3. Emissions from road traffic 13 1.3. Health effects of PAHs, OPAHs and NPAHs 15 1.3.1. Exposure to PAHs 15
1.3.2. The metabolism and toxicity mechanism of PAHs, NPAHs and OPAHs 16
1.3.3. Heath effects of PAHs 17
1.3.4. The role of PAHs in the health effects of urban air 20
1.3.5. The role of atmospheric PAH reactions on toxic effects 23
1.4. Occurrence and behaviour of PAHs in the atmosphere 26
1.4.1. Occurrence in the environment 26
1.4.1.1. PAHs in the environment 26
1.4.1.2. OPAHs and NPAHs in the atmosphere 27
1.4.2. Gas-particle partitioning of PAH, OPAH and NPAH compounds 29
1.4.2.1. Phase partitioning of PAHs 29
1.4.2.2. Phase partitioning of OPAHs and NPAHs 31
1.4.3. Atmospheric transport of PAHs 32
1.4.4. Long-term concentration trends 33
1.4.5. Short term concentration variations 34
1.4.5.1. Seasonal patterns 34
1.4.5.2. Diurnal patterns 35
1.4.6. Ambient sampling of PAH in the U.K. atmosphere 36
1.4.6.1. PAH monitoring in the U.K. 36

v
1.4.6.2. PAHs from road traffic 37
1.5. Fate of PAHs, OPAHs and NPAHs in the atmosphere 37
1.5.1 Wet and dry deposition of PAHs 38
1.5.2. Photolysis 39
1.5.2.1. Photolysis of PAHs 39
1.5.2.2. Photolysis of OPAH and NPAH 41 1.5.3 Atmospheric reactivity of PAHs 42
1.5.3.1. Gas-phase PAH reactions 43
1.5.3.2. Heterogeneous reactions 51
1.5.3.3. Evidence for PAH reactions in ambient air samples 55
1.5.4. Reactions of OPAH and NPAH 57
1.6. Project aims and objectives 58
2. Methodology 61 2.1 Sampling Procedure 61 2.1.1. Background 61
2.1.1.1. Overview 61 2.1.1.2. Particle-phase sampling 62 2.1.1.3. Gas-phase sampling 62 2.1.2. Sampling sites 64
2.1.3. Sampling campaigns 67
2.1.3.1. Campaign 1 : seasonal 24 hour sampling 67
2.1.3.2. Campaign 2 : diurnal sampling study 70
2.1.3.3. Campaign 3: Queensway Road Tunnel sampling study 71
2.1.4. Meteorological data 72
2.1.5. Inorganic gaseous pollutants 72
2.1.6. Quality control : the potential impact of sampling artefacts 73
2.1.6.1. Gas-phase vs. particle-phase artefacts 73
2.1.6.2. Chemical reactivity during sampling 73
2.1.6.3. Artefact sampling experiment 75
2.2. Sample extraction and clean-up 76

vi
2.2.1. Materials and chemicals 76
2.2.2. Sample preparation 76
2.2.3. Sample extraction 76
2.2.3.1. Extraction background 76
2.2.3.2. Extraction method 78
2.2.4. Clean-up 78
2.2.4.1. Clean-up background 78
2.2.4.2. Clean-up method 79
2.3. Sample analysis 81
2.3.1. Background and analytical development 81
2.3.2. Analysis method for PAHs : GC-MS in EI mode 82
2.3.3. Analysis for OPAH and NPAHs : GC-MS in NICI mode 83
2.4. Sample Quantification 86
2.4.1. Sample concentrations 86
2.4.2. Validating analytical method 92
2.4.2.1. Recoveries 92
2.4.2.2. Standard reference material analysis (SRM) 92
2.4.2.3. Sample blanks 93
2.4.2.4. Detection Limits 93
3. Concentrations, behaviour and fate of PAHs, OPAHs and NPAHs in the ambient urban atmosphere 99
3.1. Measured concentrations of PAH, OPAH and NPAH 99
3.1.1 PAH and OPAH concentrations 99
3.1.2. NPAH concentrations 110
3.1.3. BROS/EROS ratio comparisons 111 3.1.4. Traffic increment 115 3.1.5. Annual BaP concentrations and the UK Air Quality Objective 118
3.2. Influencing factors governing observed concentrations 118 3.2.1. Inter-correlations of PAH, OPAH and NPAH concentrations 119
3.2.2. Correlations with inorganic air pollutants and meteorological parameters 123

vii
3.2.2.1. Correlations of PAH, OPAH and NPAH with TSP 123
3.2.2.2. Correlations of PAH, OPAH and NPAH with NOx 126
3.2.2.3. Correlations of PAH, OPAH and NPAH with O3 127
3.2.2.4. Temperature-dependence of PAH, OPAH and NPAH concentrations 127
3.2.2.5. Rainfall, Wind speed and wind direction 129
3.3. Seasonal variation in PAH, OPAH and NPAH levels 130
3.3.1. PAH seasonality 130
3.3.2. OPAH and NPAH seasonality 134
3.3.3. Factors influencing seasonal trends 137
3.3.3.1. Seasonal variation in source strength 137
3.3.3.2. Seasonality of atmospheric boundary layer height 138
3.3.3.3. Influence of volatilisation from surfaces 139
3.3.4. Seasonal trend in PAH reactivity 141
3.3.5. BROS/EROS ratio seasonality 142
3.4. Temporal trend of PAHs at BROS and EROS 145
3.4.1. Overview 145
3.4.2. Temporal trend in PAH and OPAH concentrations 148
3.4.3. Temporal trend in NPAH concentrations 153
4. Gas-particle partitioning, chemical reactivity and source apportionment of PAHs, OPAHs and NPAHs, and the influence of sampling artefacts 155
4.1. Gas-particle partitioning of PAHs, OPAHs and NPAHs 155
4.1.1. Phase partitioning overview 155
4.1.1.1. Phase partitioning of PAHs 155
4.1.1.2. Phase partitioning of OPAH and NPAH 156
4.1.2. Physiochemical properties influencing partitioning 157
4.1.3. Seasonality in partitioning behaviour 171
4.1.4. Phase partitioning equilibrium behaviour 173
viii
4.2. Assessing the importance of PAH reactivity in the urban atmosphere 178
4.2.1. PAH degradation rates 178
4.2.2. 2NFlt / 1NPyr ratios 179
4.2.3. 2NFlt / 2NPyr ratios 181
4.2.4. Product to reactant ratios 184
4.3. Source apportionment of PAH, OPAH, NPAH compounds using 188 Positive Matrix Factorization (PMF)
4.3.1 Introduction 188
4.3.2. Method 191
4.3.3. Results 193
4.3.1. Overview 193
4.3.3.2. Model uncertainty and rotational freedom 193
4.3.3.3. Source contributions 196
4.4. Sampling artefact study 201
4.4.1. Method 201
4.4.1.1. Sampling 201
4.4.1.2. Analysis 202
4.4.1.3. PAH recovery 203
4.4.1.4. OPAH and NPAH formation 203
4.4.2. Results 203
4.4.2.1. Observed PAH losses 203
4.4.2.2. Conversion of PAH to OPAH or NPAH during sampling 210
4.4.3. Summary 215
5. Diurnal profiles of PAH, OPAH and NPAH 216
5.1. BROS and EROS diurnal profiles 216
5.2. NOx-corrected diurnal profiles 225
5.3. Assessing role of PAH degradation and reactive input of NPAH and OPAH 229
5.3.1. PAH degradation 229
5.3.2. 2NFlt/1NPyr and 2NFlt/2NPyr Ratios 230

ix
5.3.3. Reactant/Parent Ratios 232
6. Concentrations of PAHs, OPAHs and NPAHs in the Queensway Road Tunnel 235
6.1. Tunnel concentrations of PAHs, OPAHs and NPAHs 235
6.1.1. PAH and OPAH concentrations 235
6.1.2. NPAH concentrations 238
6.1.3. Comparison with other Tunnel studies 242
6.1.4. Gas-particle phase partitioning 246
6.2. Temporal trend in PAH and NPAH concentrations 250
6.2.1. Temporal trend of PAHs 250
6.2.2. The driving force behind emission changes 254
6.2.3. Temporal trend of NPAHs 255
6.3. Comparison of tunnel vs. ambient concentrations 258
6.3.1. Overview 258
6.3.2. Tunnel/EROS ratios of PAHs 259
6.3.3. Tunnel/EROS ratios of OPAHs 262
6.3.4. Tunnel/EROS ratios of NPAHs 263
7. Conclusion 267
7.1. Investigation summary 267
7.2. Recommendations for future work 270
References 272
Appendix 1 : Reaction kinetics data for gas phase and heterogeneous PAH reactions 305
Appendix 2 : Sampler calibration and total air flow calculation 320
Appendix 3 : PAH, OPAH and NPAH gas chromatograph peaks 323
x
List of Figures
Figure 1.1. Estimated emissions of total PAH from key anthropogenic combustion sources, as provided from the NAEI.
Figure 1.2. Relative contributions of different anthropogenic combustion sources to total U.K. PAH emissions, as estimated by the NAEI.
Figure 1.3. Metabolic diol epoxide formation from PAHs via cytochrome P450 enzymes (CYP450) and epoxide hydrolase (EH) enzymes.
Figure 1.4. Metabolic formation of o-quinones from PAHs via dihydrol dehydrogenase (DD) enzymes.
Figure 1.5. Metabolic cation radical formation from PAHs via cytochrome P450 enzymes (CYP450) and peroxidase enzymes.
Figure 1.6. Mechanism for the formation of reactive oxygen species from OPAH quinones (Bolton et al., 2000).
Figure 1.7. Mechanism for the formation of toxic intermediate species from NPAH compounds (Fiedler and Mücke, 1991).
Figure 1.8. The distribution of total PAH burden in the U.K between different environmental compartments (tonnes) as estimated by Wild and Jones (1995).
Figure 1.9. Predicted contribution of different loss mechanisms for PAH compounds in the U.K. based on modelled flux rates.
Figure 1.10. Mechanism for the reaction of gas-phase PAHs with OH radicals ; a) H-atom abstraction; b) OH addition to substituent groups; c) OH addition to the aromatic ring.
Figure 1.11. Potential pathways for the reaction of PAHs with NO3 .
Figure 1.12. Proposed mechanisms for two possible further reaction pathways of the PAH-OH adduct: a) reaction with NO2; b) reaction with O2 .
Figure 1.13. Proposed mechanisms for two possible further reaction pathways of the PAH-NO3 adduct: a) reaction with NO2; b) reaction with O2.

xi
Figure 1.14. Suggested mechanisms for the heterogeneous reaction of anthracene with O3.
Figure 1.15. Suggested mechanisms for the heterogeneous reaction of pyrene with NO2.
Figure 2.1. Locations of Birmingham sampling and monitoring sites used in the present investigation.
Figure 2.2. Appearance and schematic of high volume samplers used in the present investigation.
Figure 2.3. Comparison between peak separation of MW 247 NPAH compounds using an Agilent DB5-MS column and the Restek®column.
Figure 2.4. Calibration curves for the quantification of all PAH, OPAH and NPAH compounds measured in the present investigation.
Figure 3.1. Box plots of PAH, OPAH and NPAH concentrations measured at BROS and EROS in Campaign 1.
Figure 3.2. Mean concentrations of PAH (P + V) compounds measures at EROS and BROS during Campaign 1.
Figure 3.3. Mean concentrations of OPAH (P + V) compounds measures at EROS and BROS during Campaign 1.
Figure 3.4. Mean concentrations of NPAH (P + V) compounds measures at EROS and BROS during Campaign 1.
Figure 3.5. Correlation of measured PAH, OPAH and NPAH compounds in the Queensway Road Tunnel (Campaign 3) with the BROS-EROS concentration traffic increment (Campaign 1) ; plots are shown including Phe (a) and excluding Phe (b).
Figure 3.6. Mean PAH concentrations (P+V) measured in winter and summer samples only.
Figure 3.7. Mean OPAH concentrations (P+V) measured in winter and summer samples only.
Figure 3.8. Mean NPAH concentrations (P+V) measured in winter and summer samples only.
Figure 3.9. The percentage change of PAH concentrations between mean annual values reported by Harrad and Laurie (2005) and the present study.

xii
Figure 3.10. NAEI estimates of PAH emissions from urban road traffic (tonnes).
Figure 4.1. Mean percentage of PAH, OPAH and NPAH compounds in the particulate (black) and gas (grey) phases at BROS (A) and EROS (B). Compounds are presented with increasing molecular weight from left to right.
Figure 4.2. Plots of %P vs MW for PAH, OPAH and NPAH.
Figure 4.3. Plots of %P vs VP for PAH, OPAH and NPAH.
Figure 4.4. Plots of %P vs log Kow for PAH and NPAH.
Figure 4.5. Plots of %P vs H for PAH and NPAH.
Figure 4.6. Plots of log Kp vs log PLo for PAHs (a), NPAHs (b) and OPAHs (c) in Campaign 1
sample W2 (10/2/12).
Figure 4.7. Relationship between the observed annual mean BROS/EROS concentration ratio for LMW PAHs and the corresponding OH reaction rate coefficient as derived by Reisen and Arey (2002) ; Brubaker and Hites (1998) ; Atkinson et al. (1990).
Figure 4.8. Ratios of measured OPAH or NPAH compounds to the parent PAH at BROS (black dot) and EROS (white dot) in each individual sample in Campaign 1.
Figure 4.9. Results of the 4 factor PMF model displaying the concentration of each species attributed to each factor (blue bar) and the percentage contribution of each factor to the total modelled concentration of each species (red marker).
Figure 4.10. Results of the PMF bootstrapping analysis for each factor.
Figure 4.11. Contributions of each individual factor to the modelled concentrations of each species, as predicyed by the PMF model.
Figure 5.1. Diurnal profiles of total PAH concentrations at BROS and EROS, O3 and NOx, derived from mean values taken during morning (0700 – 1100), daytime (1100 – 1600), afternoon (1600 – 1900) and night (1900 – 0700).
Figure 5.2. Diurnal profiles of PAHs, OPAHs and NPAHs at BROS and EROS.
Figure 5.3. NOx-corrected concentration profiles for key PAH, OPAH and NPAH compounds.
xiii
Figure 5.4. The diurnal profile of NPAH isomer ratios a) 2NFlt / 1NPyr and b) 2NFlt / 2NPyr measured at BROS and EROS.
Figure 5.5. Mean ratios of ‘reaction product’ OPAH and (NPAH x10) to ‘parent’ PAH in diurnal samples at BROS (a) and EROS (b).
Figure 6.1. Mean PAH concentrations measured inside the Queensway Road Tunnel.
Figure 6.2. Concentrations of OPAH compounds measured inside the Queensway Road Tunnel in Campaign 3.
Figure 6.3. Concentrations of NPAH compounds measured inside the Queensway Road Tunnel in Campaign 3.
Figure 6.4. Comparison of measured PAH concentrations inside the Queensway Tunnel in the present study with tunnel emission factors derived by Wingfors et al. (2001).
Figure 6.5. Plots of % of component in the particulate phase vs. molecular weight for a) PAHs, b) OPAHs and c) NPAHs, measured in the tunnel (black dots, solid black line) and at EROS (white dots, dotted line).
Figure 6.6. Contribution of individual PAHs to total PAH burden measured inside the Queensway Road Tunnel in a) 1992 (Smith and Harrison, 1996) and b) 2012 (present study).
Figure 6.7. Total number of gasoline and diesel fuelled passenger cars licensed in Great Britain
Figure 6.8. Mean ratios of concentrations measured in the Queensway Road Tunnel to those measured simultaneously at EROS for samples taken in Campaign 3.
xiv
List of Tables
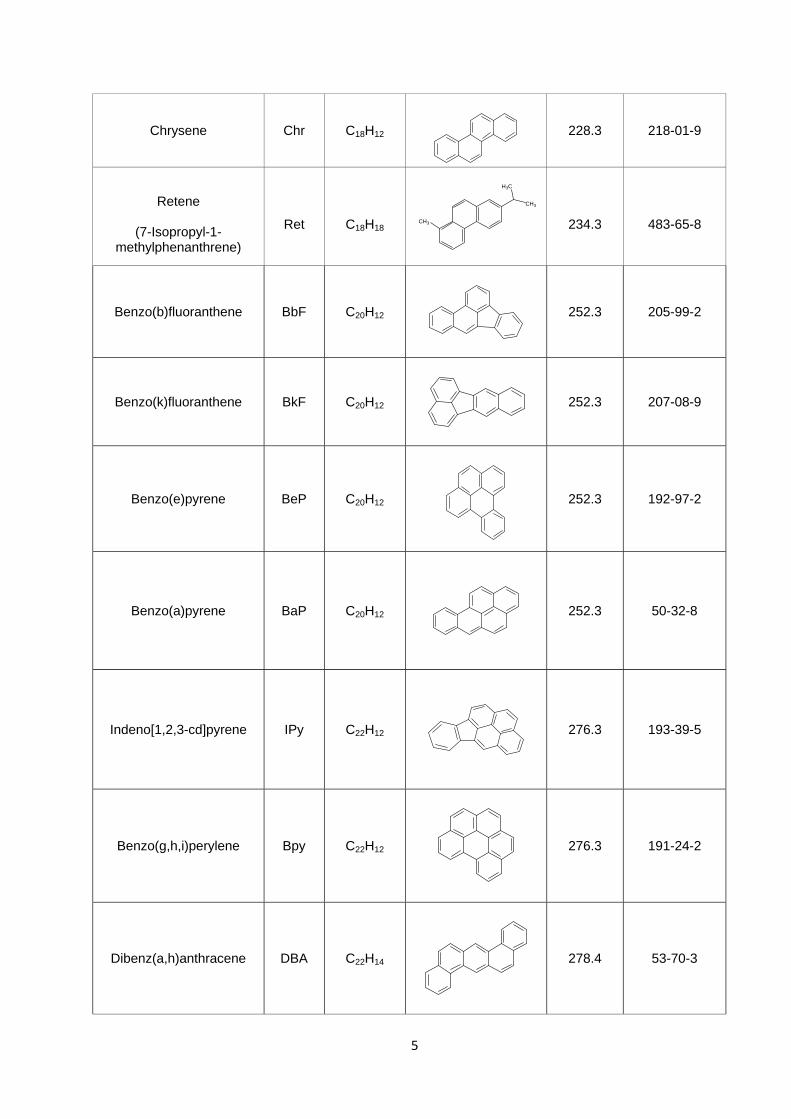
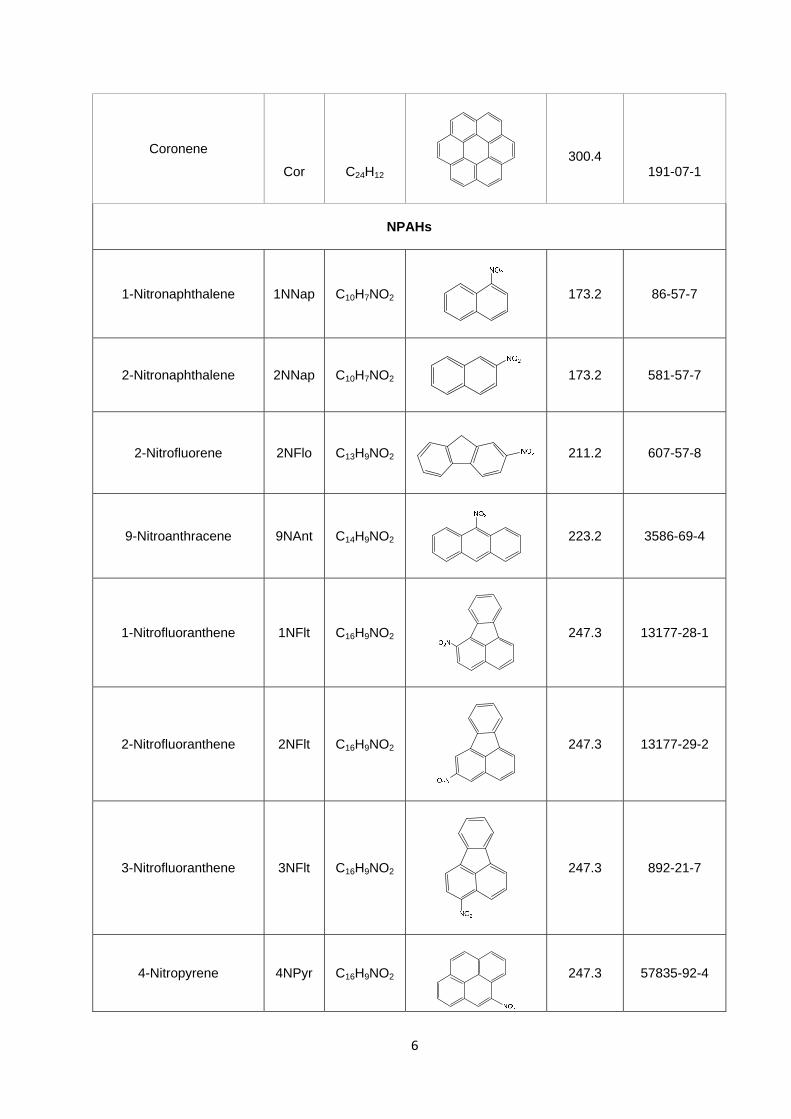
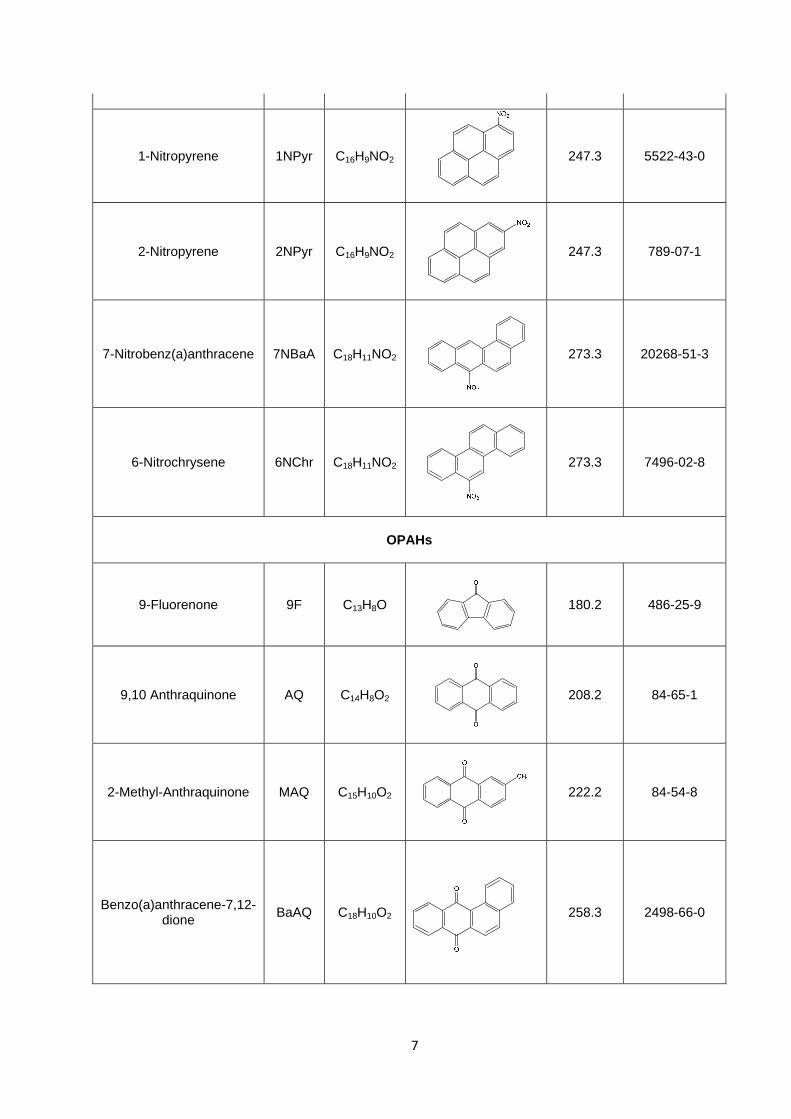
Table 1.1. Names, formulas and structures of the PAH, OPAH and NPAH compounds investigated in this study.
Table 1.2. Mutagenic and/or carcinogenic categorisation of PAH, OPAH and NPAH compounds studies in the present investigation.
Table 1.3. Half lives (hours) of PAH compounds absorbed on various substrates; carbon back (CB), fly ash (FA), silica gel (SG) and alumina (AL), as reported by Behymer and Hites (1988).
Table 2.1. Dates, approximate times and average meteorological parameters, temperature (T), relative humidity (RH), pressure (PRES), solar radiation (SRAD), rainfall (RF), wind speed (WS), wind direction (WD) for all samples taken during this investigation.
Table 2,2. Internal standards, molecular ions and approximate retention times used to identify and quantify target PAH, OPAH and NPAH compounds in sample extracts.
Table 2.3. Calculaed recoveries for all internal standards used in the analysis of samples from Campaigns 1, 2 and 3.
Table 2.4. Measured mean and standard deviation for concentrations of PAH, OPAH and NPAH compounds in NIST Standard Reference Material 1649b (urban dust).
Table 2.5. Sample blank concentrations (filters) and comparison with mean annual levels measured at EROS and BROS.
Table 2.5. Sample blank concentrations (PUF) and comparison with mean annual levels measured at EROS and BROS.
Table 2.7. Instrument detection limits (IDLs) and method detection limits (MDLs).
Table 3.1. The mean and (range) of particle-phase (P), vapour-phase (V) and total (T) PAH, OPAH and NPAH concentrations measured during Campaign 1.
Table 3.2. Comparison of total (particulate+gas) OPAH and NPAH concentrations (pg.m3) measured at different locations.
Table 3.3. Annual mean BROS/EROS concentration ratios for all PAH, OPAH and NPAH compounds.

xv
Table 3.4 Inter-correlations of PAH, OPAH and NPAH species at BROS and EROS.
Table 3.5. Correlations of PAH, OPAH and NPAH concentrations with meteorological parameters and concentrations of inorganic air pollutants at BROS and EROS.
Table 3.6. Mean BROS/EROS concentration ratios measured in each sampling season in Campaign 1.
Table 3.7. Mean total (particulate + vapour) NPAH concentrations (pg m3) measured by Dimashki et al. (2000) at Birmingham city centre in Nov 1995-Feb 1996 and in the present study during winter at BROS in 2011-2012.
Table 4.1. Physiochemical properties of the PAH, OPAH and NPAH compounds in the present study.
Table 4.2. Slope (m), intercept (b) and correlation coefficient (R2) values for the log Kp vs log PLo
plots produced for PAH, OPAH and NPAH sampling data.
Table 4.3. Summary of 2-NFlt/1-NPyr ratios from ambient measurements.
Table 4.4. Summary of 2-NFlt/2-NPyr ratios from ambient measurements.
Table 4.5. Deuterated PAH, OPAH, and NPAH compounds measured in the artefact study
Table 4.6. Mean filter recoveries of PAH compounds measured on sample test filters
Table 4.7. Mean total recoveries of PAHs measured on sample test filters + PUFs
Table 4.8. Mean values for meteorological measurements, temperature (TDRY), relative humidity (RELH), Pressure (PRES) and solar radiation (SRAD) and total rainfall (RTOT) for the sampling campaigns during autumn (A); winter (W); spring (Sp), summer (Su) and the artefact study (ART).
Table 4.9. Mean concentrations of inorganic pollutants (ug/m3) measured during autumn (A); winter (W); spring (Sp), summer (Su) samples in campaign 1 and artefact (ART) study.
Table 6.1. Mean±standard deviation of PAH, OPAH and NPAH concentrations measured in the Queensway Road Tunnel and EROS during Campaign 3.

xvi
Table 6.2. Comparison of total (P+V) PAH concentrations and percentage of concentration in the particulate phase (%P) in different road tunnel measurements.
Table 6.3. Comparison of total (particulate + vapour) PAH concentrations measured in the Queesnsway Road Tunnel in 1992 (Smith and Harrison, 1996) and 2012 (present study).
Table 6.4. Comparison of total (particulate + vapour) NPAH concentrations measured in the Queensway Tunnel in 1996 (Dimashki et al., 2000) and 2012 (present study).

xvii
List of Abbreviations
BROS – Bristol Road Observatory Site
DCM – dichloromethane
Defra – Department for Environment, Forestry and Rural Affairs
DfT – Department for Transport
EI – electron impact
EROS – Elms Road Observatory Site
FNF – 1-fluoro-7-nitrofluorene
GC-MS – gas chromatography mass spectrometry
HMW – high molecular weight
IDL – instrument detection limit
IS – internal standard
LMW – low molecular weight
MDL – method detection limit
MW – molecular weight
NAEI – National Atmospheric Emissions Inventory
NICI – negative ion chemical ionisation
NIST – National Institute of Standards and Technology
OPAH – oxygenated polycyclic hydrocarbon
NPAH – nitrated polycyclic aromatic hydrocarbon
P – particulate
PAH – polycyclic aromatic hydrocarbon
PFTBA – perfluoro-tri-n-butylamine
PT – p-terphenyl
PUF – polyurethane foam
RF – rainfall
RH – relative humidity
T – temperature
V – vapour
WD – wind direction
WS – wind speed

1
Chapter 1 : Introduction
1.1. Polycyclic aromatic hydrocarbons (PAHs), urban air quality and public health
1.1.1. Urban air quality and public health
Air pollution is a major threat to public health and failure to adequately tackle this problem could
have significant socio-economic consequences (POST, 2014). Poor ambient air quality is projected
to be the leading environmental cause of mortality by 2050 (OECD, 2012). In the UK, the potential
economic impact of poor air quality is considered to be comparable to that resulting from smoking
or obesity, potentially reducing life expectancy on average by 6 months, and costing around £16.4
billion per year (Defra, 2010). This highlights the importance of monitoring major air pollutants in
the U.K. atmosphere, in order to improve our understanding of the risks they present and how to
reduce these risks.
A specific class of pollutant of considerable interest due to its potential adverse health effects is
particulate matter (PM) (Anderson et al., 2012). Indeed, both short-term and long-term exposure to
ambient levels of PM is associated with respiratory and cardiovascular illness and mortality
(AQEG, 2005). It is estimated that exposure to PM caused up to 51 000 deaths in the U.K. in 2008
(COMEAP, 2010). It is suggested that the harmful effects of PM are predominantly associated with
combustion-derived components (AQEG, 2005).
Indeed, Harrison et al. (2004) indicated the presence of specific trace metal and organic pollutants
such as polycyclic aromatic hydrocarbons (PAHs) may be primarily responsible for lung cancers
associated with PM2.5. PAHs are therefore an important class of organic pollutants that require
careful monitoring and investigation to understand their concentrations, behaviour and fate in the
environment.
Due to the widespread presence of PAHs in the environment, and their potential contribution to
poor ambient air quality and public health, these compounds have been the subject to a
2
considerable amount of research by both toxicologists and atmospheric scientists for over a
century. This project focuses on the atmospheric concentrations, behaviour and fate of PAHs as
well as their oxygenated (OPAH) and nitrated (NPAH) derivative compounds in the urban
atmosphere.
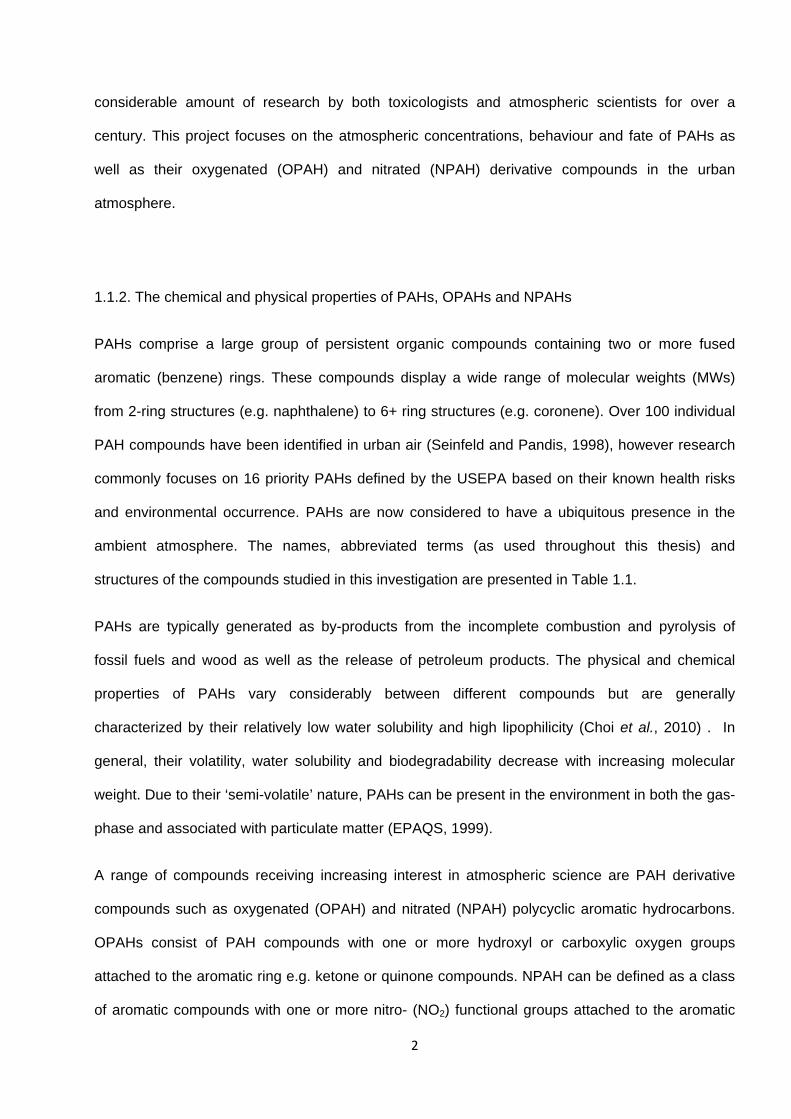
1.1.2. The chemical and physical properties of PAHs, OPAHs and NPAHs
PAHs comprise a large group of persistent organic compounds containing two or more fused
aromatic (benzene) rings. These compounds display a wide range of molecular weights (MWs)
from 2-ring structures (e.g. naphthalene) to 6+ ring structures (e.g. coronene). Over 100 individual
PAH compounds have been identified in urban air (Seinfeld and Pandis, 1998), however research
commonly focuses on 16 priority PAHs defined by the USEPA based on their known health risks
and environmental occurrence. PAHs are now considered to have a ubiquitous presence in the
ambient atmosphere. The names, abbreviated terms (as used throughout this thesis) and
structures of the compounds studied in this investigation are presented in Table 1.1.
PAHs are typically generated as by-products from the incomplete combustion and pyrolysis of
fossil fuels and wood as well as the release of petroleum products. The physical and chemical
properties of PAHs vary considerably between different compounds but are generally
characterized by their relatively low water solubility and high lipophilicity (Choi et al., 2010) . In
general, their volatility, water solubility and biodegradability decrease with increasing molecular
weight. Due to their ‘semi-volatile’ nature, PAHs can be present in the environment in both the gas-
phase and associated with particulate matter (EPAQS, 1999).
A range of compounds receiving increasing interest in atmospheric science are PAH derivative
compounds such as oxygenated (OPAH) and nitrated (NPAH) polycyclic aromatic hydrocarbons.
OPAHs consist of PAH compounds with one or more hydroxyl or carboxylic oxygen groups
attached to the aromatic ring e.g. ketone or quinone compounds. NPAH can be defined as a class
of aromatic compounds with one or more nitro- (NO2) functional groups attached to the aromatic
3
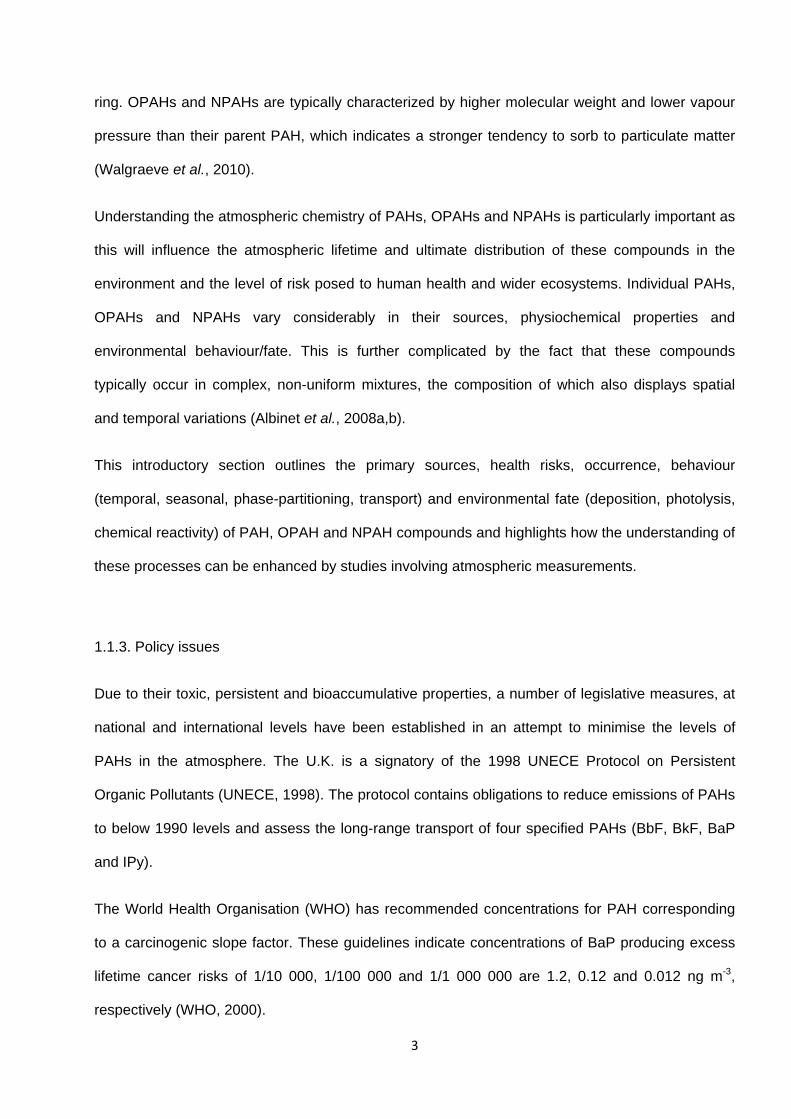
ring. OPAHs and NPAHs are typically characterized by higher molecular weight and lower vapour
pressure than their parent PAH, which indicates a stronger tendency to sorb to particulate matter
(Walgraeve et al., 2010).
Understanding the atmospheric chemistry of PAHs, OPAHs and NPAHs is particularly important as
this will influence the atmospheric lifetime and ultimate distribution of these compounds in the
environment and the level of risk posed to human health and wider ecosystems. Individual PAHs,
OPAHs and NPAHs vary considerably in their sources, physiochemical properties and
environmental behaviour/fate. This is further complicated by the fact that these compounds
typically occur in complex, non-uniform mixtures, the composition of which also displays spatial
and temporal variations (Albinet et al., 2008a,b).
This introductory section outlines the primary sources, health risks, occurrence, behaviour
(temporal, seasonal, phase-partitioning, transport) and environmental fate (deposition, photolysis,
chemical reactivity) of PAH, OPAH and NPAH compounds and highlights how the understanding of
these processes can be enhanced by studies involving atmospheric measurements.
1.1.3. Policy issues
Due to their toxic, persistent and bioaccumulative properties, a number of legislative measures, at
national and international levels have been established in an attempt to minimise the levels of
PAHs in the atmosphere. The U.K. is a signatory of the 1998 UNECE Protocol on Persistent
Organic Pollutants (UNECE, 1998). The protocol contains obligations to reduce emissions of PAHs
to below 1990 levels and assess the long-range transport of four specified PAHs (BbF, BkF, BaP
and IPy).
The World Health Organisation (WHO) has recommended concentrations for PAH corresponding
to a carcinogenic slope factor. These guidelines indicate concentrations of BaP producing excess
lifetime cancer risks of 1/10 000, 1/100 000 and 1/1 000 000 are 1.2, 0.12 and 0.012 ng m-3,
respectively (WHO, 2000).

4
Table 1.1. Names, formulas and structures of the PAH, OPAH and NPAH compounds
investigated in this study.
Compound Name Abbrev Empirical Formula
Chemical Structure Molecular
Weight (g mol-1)
CAS Number
PAHs
Naphthalene
Nap
C10H8
128.2 91-20-3
Acenaphthylene Acy C12H8
152.2 208-96-8
Acenaphthene Ace C12H10
154.2 83-32-9
Fluorene Flo C13H10
166.2 86-73-7
Phenanthrene Phe C14H10
178.2 85-01-8
Anthracene Ant C14H10
178.2 120-12-7
Fluoranthene Flt C16H10
202.3 206-44-0
Pyrene Pyr C16H10
202.3 129-00-0
Benzo(a)anthracene BaA C18H12
228.3 56-55-3
5
Chrysene Chr C18H12
228.3 218-01-9
Retene
(7-Isopropyl-1-
methylphenanthrene)
Ret
C18H18
234.3
483-65-8
Benzo(b)fluoranthene BbF C20H12
252.3 205-99-2
Benzo(k)fluoranthene BkF C20H12
252.3 207-08-9
Benzo(e)pyrene BeP C20H12
252.3 192-97-2
Benzo(a)pyrene BaP C20H12
252.3 50-32-8
Indeno[1,2,3-cd]pyrene IPy C22H12
276.3 193-39-5
Benzo(g,h,i)perylene Bpy C22H12
276.3 191-24-2
Dibenz(a,h)anthracene DBA C22H14
278.4 53-70-3
CH3
H3C
CH3
6
Coronene
Cor
C24H12
300.4
191-07-1
NPAHs
1-Nitronaphthalene 1NNap C10H7NO2
173.2 86-57-7
2-Nitronaphthalene 2NNap C10H7NO2
173.2 581-57-7
2-Nitrofluorene 2NFlo C13H9NO2
211.2 607-57-8
9-Nitroanthracene 9NAnt C14H9NO2
223.2 3586-69-4
1-Nitrofluoranthene 1NFlt C16H9NO2
247.3 13177-28-1
2-Nitrofluoranthene 2NFlt C16H9NO2
247.3 13177-29-2
3-Nitrofluoranthene 3NFlt C16H9NO2
247.3 892-21-7
4-Nitropyrene 4NPyr C16H9NO2
247.3 57835-92-4
7
1-Nitropyrene 1NPyr C16H9NO2
247.3 5522-43-0
2-Nitropyrene 2NPyr C16H9NO2
247.3 789-07-1
7-Nitrobenz(a)anthracene 7NBaA C18H11NO2
273.3 20268-51-3
6-Nitrochrysene 6NChr C18H11NO2
273.3 7496-02-8
OPAHs
9-Fluorenone 9F C13H8O
180.2 486-25-9
9,10 Anthraquinone AQ C14H8O2
208.2 84-65-1
2-Methyl-Anthraquinone MAQ C15H10O2
222.2 84-54-8
Benzo(a)anthracene-7,12-dione
BaAQ C18H10O2
258.3 2498-66-0

8
The European Community’s fourth Air Quality Daughter Directive (2005/107/EC) set a legally
binding target value of 1 ng m-3 for the annual mean concentration of BaP as a marker for total
PAH levels. BaP is typically used as a representative PAH as it typically constitutes a substantial
proportion of the total carcinogenic potential of the PAH mixture present (Delgado-Saborit et al.,
2011). It is estimated that 20-29% of the urban population of the EU is exposed to BaP levels
higher than the 1 ng m-3 EU limit and 93-94% is exposed to levels higher than the 0.12 ng m-3
WHO guide level (EEA, 2012).
The National Air Quality Strategy (Defra, 2007) in the U.K. includes an Air Quality Objective for
PAHs, stating a maximum annual air concentration average of 0.25 ng m-3 BaP (EPAQS, 1999). In
order to ensure compliance with the policy drivers described, the levels and trends of PAHs need
to be regularly measured and monitored, especially in areas where pollution levels are likely to be
highest e.g. busy roads.
No specific obligations or targets are currently in place for OPAHs and NPAHs. However, there is
growing concern these compounds may pose a similar threat to public health as their ‘parent’ PAH
compounds. This highlights the need to improve our understanding of the levels and behaviour of
PAHs as well as their OPAH and NPAH derivatives in the atmosphere, in order to inform policy
makers of new or growing risks relating to these compounds and the potential need for new or
amended policies to reduce their negative effects on public health.
1.2. Sources of PAHs, OPAHs and NPAHs
1.2.1. Sources of PAHs
PAHs predominantly result during the burning of fossil fuels and are also found in coal tar, crude
oil, creosote and roofing tar, as well as being used in manufacturing dyes, plastics and pesticides
(Ravindra et al., 2008). Their specific sources can be divided into the following categories (WHO,
2000 ; Choi et al., 2011 ; Ravindra et al., 2008 and references therein) :
9
i) Natural e.g. non-anthropogenic fires caused by lightning strikes, volcanic emissions, diagenesis
of sedimentary organic material and biosynthesis by microbes and plants.
ii) Accidental e.g. spillage of petroleum products.
iii) Domestic e.g. burning of wood, coal and other fuels for space heating and cooking.
iv) Mobile e.g. exhaust emissions from vehicles including automobiles, trains, ships, aircraft, and
machinery.
v) Industrial and power plants e.g. aluminium production, coke production (e.g. in iron and steel
works), creosote and wood preservation, cement production, incineration of waste, fossil fuel and
biomass burning for commercial heat and electricity production.
vi) Agricultural e.g. open burning of agricultural or forest residues.
A global emissions inventory for PAH has been produced by Zhang and Tao (2009) with total
emission of the 16 USEPA PAHs in 2004 estimated to be ~4 kg km-2 yr-1. Biomass burning and
wildfires are the two key contributing sources (57% and 17% respectively) with smaller
contributions from traffic (5%), domestic coal combustion (4%) and agricultural waste burning (3%)
(Zhang and Tao, 2009).
For the U.K., a preliminary source inventory was provided by Wild and Jones (1995) which
suggests the majority of PAH result from anthropogenic activity with negligible contribution from
natural sources. Data regarding individual sources of PAHs (both total and individual compounds)
in the U.K. are provided by the National Atmospheric Emissions Inventory (NAEI), funded by Defra.
Estimated PAH emissions in the U.K. from key combustion sources are presented in Figure 1.1.
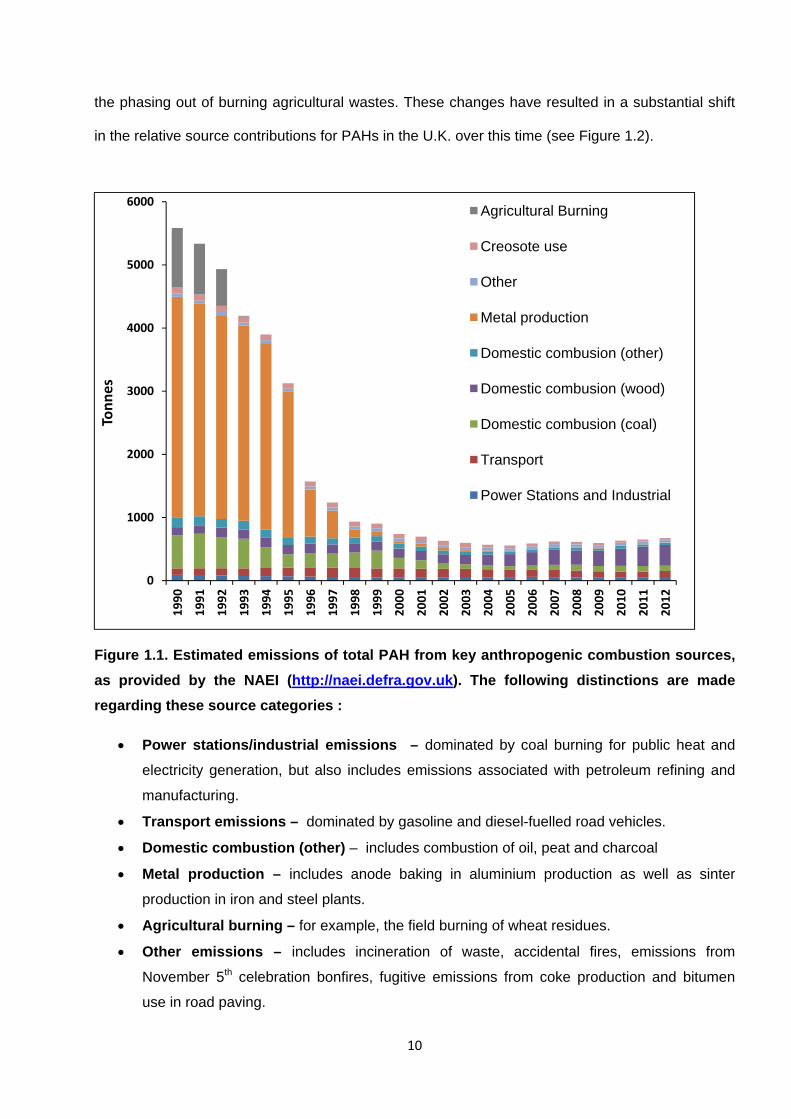
It is shown that PAH emissions in the U.K. declined by ~88% between 1990 and 2012. This has
resulted due to the almost complete reduction of PAH emissions from anode baking for aluminium
production, as a result of production plant closure and improved abatement technologies (Murrells
et al., 2010). Emissions reductions have also resulted from reduced domestic coal combustion and
10
the phasing out of burning agricultural wastes. These changes have resulted in a substantial shift
in the relative source contributions for PAHs in the U.K. over this time (see Figure 1.2).
Figure 1.1. Estimated emissions of total PAH from key anthropogenic combustion sources,
as provided by the NAEI (http://naei.defra.gov.uk). The following distinctions are made
regarding these source categories :
Power stations/industrial emissions – dominated by coal burning for public heat and
electricity generation, but also includes emissions associated with petroleum refining and
manufacturing.
Transport emissions – dominated by gasoline and diesel-fuelled road vehicles.
Domestic combustion (other) – includes combustion of oil, peat and charcoal
Metal production – includes anode baking in aluminium production as well as sinter
production in iron and steel plants.
Agricultural burning – for example, the field burning of wheat residues.
Other emissions – includes incineration of waste, accidental fires, emissions from
November 5th celebration bonfires, fugitive emissions from coke production and bitumen
use in road paving.
0
1000
2000
3000
4000
5000
6000
1990
1991
1992
1993
1994
1995
1996
1997
1998
1999
2000
2001
2002
2003
2004
2005
2006
2007
2008
2009
2010
2011
2012
Tonnes
Agricultural Burning
Creosote use
Other
Metal production
Domestic combusion (other)
Domestic combusion (wood)
Domestic combusion (coal)
Transport
Power Stations and Industrial

11
a
b
Figure 1.2. Relative contributions of different anthropogenic combustion sources to total
U.K. PAH emissions, as estimated by the NAEI (http://naei.defra.gov.uk) in 1992 (a) and 2012
(b).
1% 2%
9% 2%
3%
63%
2%
17%
1%
1991 Power Stations and Industrial
Transport
Domestic combusion (coal)
Domestic combusion (wood)
Domestic combusion (other)
Metal production
Creosote use
Agricultural Burning
Other
9%
14%
12%
48%
6%
1%4%
6%
2012 Power Stations and Industrial
Transport
Domestic combusion (coal)
Domestic combusion (wood)
Domestic combusion (other)
Metal production
Creosote use
Agricultural Burning
Other
12
The key contributor of PAHs nationally in the U.K. is domestic combustion of wood (~48%)
however vehicular traffic and regional-specific industries frequently dominate in urban and
suburban areas (Keyte et al., 2013; WHO, 2000). Indeed, it has been estimated that motor vehicle
emissions account for between 46 and 90% of total PAHs in ambient PM in urban areas (Nikolaou
et al., 1984).
It should be noted that emissions inventories are likely to be subject to considerable uncertainty
and may not be applicable in specific urban areas, where traffic has been shown to be a more
dominant source (Harrison et al., 1996; Lim et al., 1999; Nielsen, 1996). Furthermore, emission
inventories do not consider evaporative ‘recycling’ of PAH from vegetation, soils or impermeable
surfaces, which can be an important factor and is not possible to quantify (Prevedouros et al.,
2004a). It is also noted that certain sources display seasonality (e.g. domestic burning, natural
fires), while some do not (e.g. industrial emissions, petroleum refining, road traffic).
It is suggested therefore, that in order to assess the sources of PAH influencing urban or suburban
areas, and the processes driving their long- and short-term variability, physical sampling data on
atmospheric levels need to be obtained with careful assessment and/or modelling of these data.
1.2.2. Source of OPAHs and NPAHs
OPAHs and NPAHs also result from primary combustion emissions. A comprehensive overview of
primary combustion sources for individual OPAH and NPAH compounds is provided in the
supplementary information of the Keyte et al. (2013) review paper. Compared with ‘parent’ PAHs,
relatively little data are available on primary sources of OPAH and NPAH, and no source inventory
or quantitative emission estimates from different sources at national or global scales have yet been
provided.
OPAHs can result from burning of domestic waste (Sidhu et al., 2005); coal combustion (Bi et al.,
2008; Simoneit et al., 2007), biomass burning (Hays et al., 2005; Iinuma et al., 2007; Shen et al.,
13
2012) , diesel and gasoline vehicle exhaust (Cho et al., 2004; Fraser et al., 1998a; Hays et al.,
2005; Iinuma et al., 2007; Jakober et al., 2007; Oda et al., 1998; Rogge et al., 1993a; Shen et al.,
2012; Strandell et al., 1994; Zielinska et al., 2004b) ; brake wear from vehicles (Rogge et al.,
1993b) ; domestic wood combustion (Fine et al., 2002; Fitzpatrick et al., 2007; Rogge et al., 1998) ;
and domestic natural gas burning in home appliances (Rogge et al., 1993c)
NPAH have been measured in vehicular emissions (Dimashki et al., 2000; Gibson, 1982;
Hayakawa et al., 1994; Karavalakis et al., 2009; Ratcliff et al., 2010) and are primarily associated
with diesel exhaust (Campbell and Lee, 1984; Ciccioli et al., 1989; Draper, 1986; Hayakawa et al.,
1994; Murahashi and Hayakawa, 1997; Schuetzle et al., 1981; 1982; Zhu et al., 2003) but have
also been observed in gasoline vehicle emissions (Ciccioli et al., 1989; Hayakawa et al., 1992;
IARC, 1989) but generally at much lower levels (Zielinska et al., 2004b).
NPAHs are also detected in emissions from carbon electrode manufacture (Liberti and Ciccioli,
1986), stack gases from aluminium smelters and coal-fired power plants (IARC, 1989) as well as
emissions of kerosene heaters, fuel gas and liquefied petroleum gas (LPG) burners and coal-
fuelled stoves (Tang et al., 2002; WHO, 2000).
However, in addition to these primary combustion emissions, OPAHs and NPAHs can have a
secondary input from photochemical atmospheric reactions of PAH (see Section 1.5.3).
1.2.3. Emissions from road traffic
PAHs can be emitted from road vehicles by a number of different pathways (Collier et al., 1995) :
i) PAHs that survive the combustion process are emitted with unburned fuel components.
ii) PAHs are formed via pyrolytic or pyrosynthetic reactions of other fuel components in the high
temperature, oxygen deficient conditions of the vehicle engine.
iii) PAHs are emitted via the ‘leakage’ of unburned fuel into the lubricating oil on the engine walls.
14
It has been suggested survival of unburned fuel is dominant route of PAH in both gasoline and
diesel emissions (Collier et al., 1995; Marr et al., 1999; Tancell et al., 1995a; Williams et al., 1986;
1989). For example, (Tancell et al., 1995b) indicated that fuel survival during combustion was the
principal source of BaP in diesel emissions with a lower (<20%) resulting from pyrosynthesis or
lubricating oil.
However, studies also indicate the potential importance of PAH formation from aliphatic
compounds (Cole et al., 1984) or methyl-PAH (Rhead and Pemberton, 1996) or formation of HMW
PAH from LWM PAH during combustion (Williams et al., 1989). Potentially high contribution from
lubricating oil has also been indicated (Pedersen et al., 1980; Williams et al., 1989).
For example, Rhead and Pemberton (1996) indicated that 24% of Nap emissions from diesel
vehicles resulted from unburned fuel and 76% resulted from pyrosynthesis, possibly from
dealkylation from methyl-Nap compounds. Additionally, Westerholm and Egebäck (1994)
discussed the key parameters governing the extent and nature of PAH emissions from vehicles
and indicated that >50% of PAH emitted are formed during combustion.
For all internal combustion engines of gasoline and diesel vehicles, the emissions may vary
considerably. The magnitude of PAH emissions from vehicle exhausts and the relative
contributions of these formation mechanisms will be a function of the engine operating conditions
(type, load, age, speed and temperature); fuel type (gasoline, diesel), quality (e.g. aromatic
content, air/fuel ratio) and mode (direct or indirect injection system) (Collier et al., 1995; Marr et al.,
1999; Ravindra et al., 2008; Schauer et al., 2002; Westerholm and Egebäck, 1994; Westerholm
and Li, 1994).
Emissions of NPAH from diesel emissions is shown to be much higher than from gasoline
emissions (Gibson, 1982; Gorse et al., 1983; Hayakawa et al., 1994; Westerholm and Egebäck,
1994; Westerholm and Li, 1994; Zielinska et al., 2004b) and this route is considered to be the
principal source of NPAH in the urban environment (Ciccioli et al., 1989).

15
More than 200 NPAH have been detected in the diesel exhaust gases and it is suggested that
NPAHs are formed via reaction of PAH with NO2 and/or HNO3 in the combustion chamber or
exhaust system (Fiedler and Mücke, 1991). For example, Sjogren et al. (1996) observed a
negative correlation between 1NPyr emission rates and the concentrations of NOx and pyrene,
suggesting 1NPyr results from the reaction between pyrene and NOx.
However, it is suggested that NPAHs are not formed in the engine chamber, but rather in the
exhaust system where PAH, NOx and catalytic acid species will be present together under high
temperature and low oxygen conditions (Rosenkranz and Mermelstein, 1983). It is suggested that
NOx present in diesel exhaust contains a higher proportion (30%) of NO2 compared with gasoline
exhaust (<1%), resulting in greater emission of NPAH from diesel-fuelled vehicles relative to
gasoline-fuelled vehicles (Schuetzle and Perez ,1983).
1.3. Health effects of PAHs, OPAHs and NPAHs
The exposure, toxicokinetics and health effects of PAHs, OPAHs and NPAHs have been widely
discussed and reviewed in the literature (see Finlayson-Pitts and Pitts, 2000 ; WHO, 2000; Choi et
al., 2012; IARC, 1983, 1989, 2010; Walgraeve et al., 2010).
1.3.1. Exposure to PAHs
Humans are exposed to PAHs, OPAHs and NPAHs though various routes including consumption
of contaminated food or water, inhalation of air and/or re-suspended dust or soil, cigarette
smoking, and dermal contact (Choi et al., 2012). It is considered that food ingestion is the principal
exposure route for non-smokers, depending on specific diet and cooking mode used (WHO, 2000 ;
Choi et al., 2012 and references therein).
For example, the inhalation daily dose of BaP for non-smokers in the homes of industrialised
counties has been estimated to be 0.15-21 ng/day compared with estimated dietary intake of 4.2 –
16
320 ng/day in various European studies (Choi et al., 2012 and referenced therein). However, a
significant exposure contribution from outdoor air pollution could occur in heavily polluted urban
and industrial areas (WHO, 2000).
1.3.2. The metabolism and toxicity mechanism of PAHs, NPAHs and OPAHs
Gas-phase pollutants are likely to be inhaled and exhaled more easily and will tend to associate
with the mucus lining of the lung, while PM is more likely to settle on the lung surface and be
absorbed more readily. Hence it is suggested that HMW PAH, associated predominantly with
particulates, will pose the greater health risk (Finlayson-Pitts and Pitts, 2000). Upon absorption into
the body from the lungs, gut or skin, PAHs can deposit in fatty tissues and have been observed in
most internal organs (WHO, 2000).
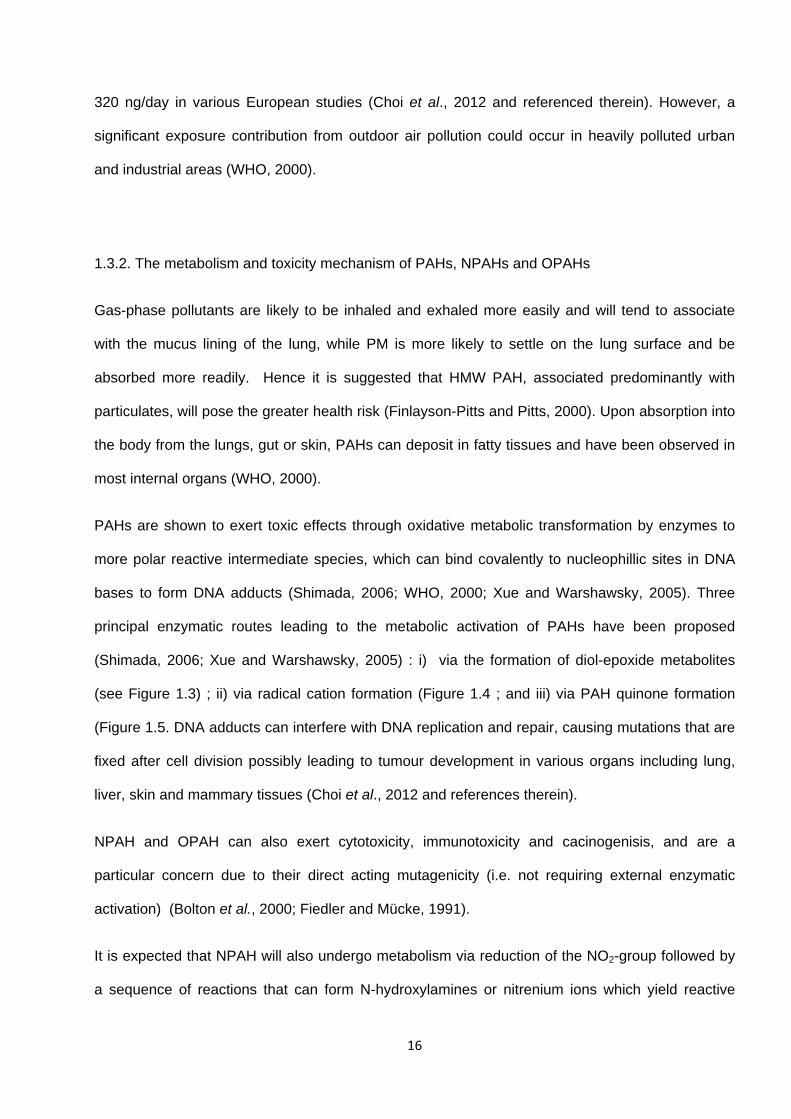
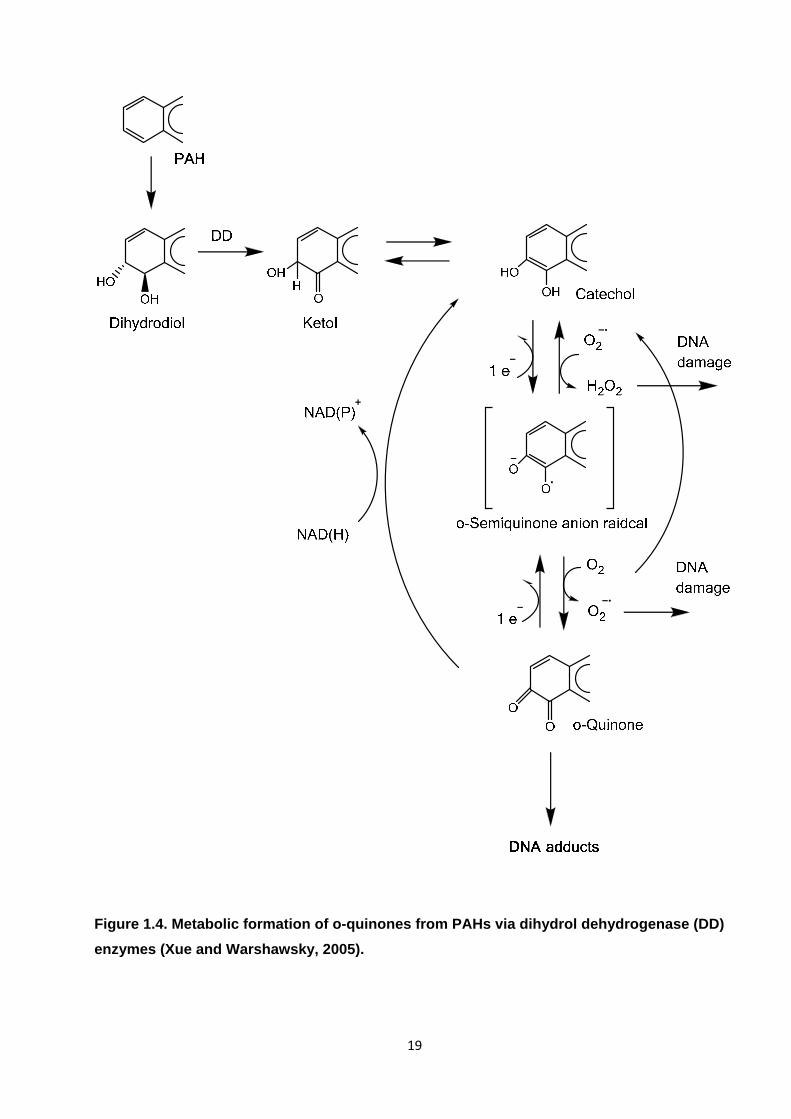
PAHs are shown to exert toxic effects through oxidative metabolic transformation by enzymes to
more polar reactive intermediate species, which can bind covalently to nucleophillic sites in DNA
bases to form DNA adducts (Shimada, 2006; WHO, 2000; Xue and Warshawsky, 2005). Three
principal enzymatic routes leading to the metabolic activation of PAHs have been proposed
(Shimada, 2006; Xue and Warshawsky, 2005) : i) via the formation of diol-epoxide metabolites
(see Figure 1.3) ; ii) via radical cation formation (Figure 1.4 ; and iii) via PAH quinone formation
(Figure 1.5. DNA adducts can interfere with DNA replication and repair, causing mutations that are
fixed after cell division possibly leading to tumour development in various organs including lung,
liver, skin and mammary tissues (Choi et al., 2012 and references therein).
NPAH and OPAH can also exert cytotoxicity, immunotoxicity and cacinogenisis, and are a
particular concern due to their direct acting mutagenicity (i.e. not requiring external enzymatic
activation) (Bolton et al., 2000; Fiedler and Mücke, 1991).
It is expected that NPAH will also undergo metabolism via reduction of the NO2-group followed by
a sequence of reactions that can form N-hydroxylamines or nitrenium ions which yield reactive

17
DNA-binding species or alternatively to toxic acetylamine species (see Figure 1.6) (Fiedler and
Mücke, 1991 ; WHO, 2000).
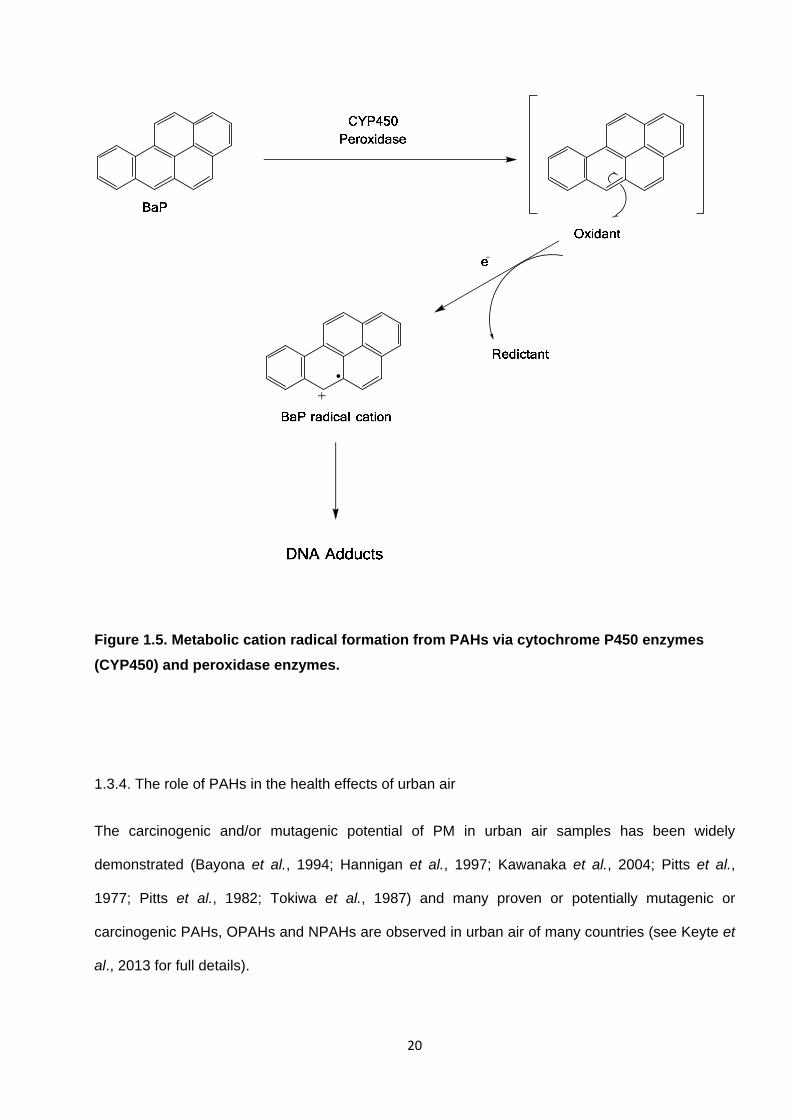
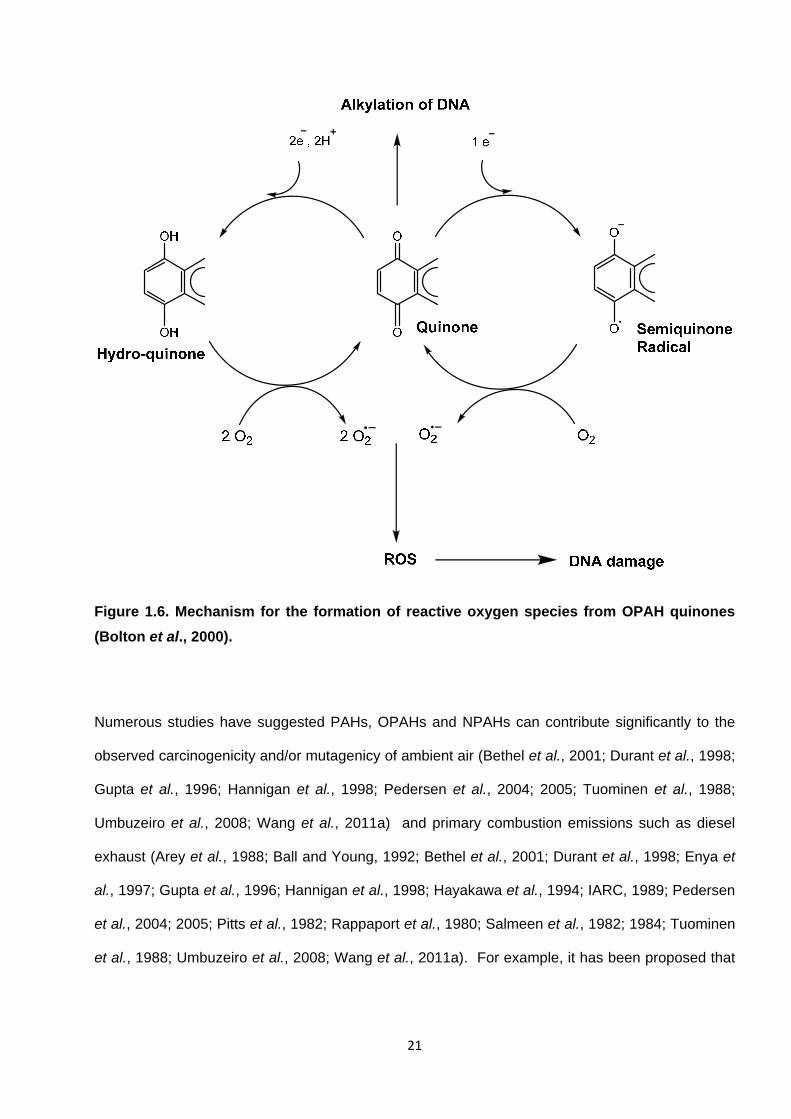
OPAH quinones can undergo enzymatic and non-enzymatic redox cycling with their semiquinone
radicals, leading to the formation of reactive oxidative species (ROS) including superoxide,
hydrogen peroxide and ultimately the hydroxyl radical (see Figure 1.7) (Bolton et al., 2000;
Kumagai, 2009). ROS can cause severe oxidative stress in cells and cause DNA damage
(Walgraeve et al., 2010 and references therein). Kumagai (2009) also details the potential for
quinones to cause arylation of cellular proteins resulting in protein adduct formation.
1.3.3. Heath effects of PAHs
Data from in vitro and in vivo bioassays using non-mammalian (e.g. bacteria), mammalian non-
human (e.g. rodent) and human cells have demonstrated the mutagenicity, immunotoxicity,
genotoxicity and carcinogenicity of PAH, OPAH and NPAH exposure (Busby et al., 1994a; 1994b;
1995; Deutschwenzel et al., 1983; Durant et al., 1996; Enya et al., 1997; IARC, 1983 1989;
Rosenkranz and Mermelstein, 1983; Ross et al., 1995; Sato et al., 1986; Tokiwa et al., 1987; Wei
et al., 1993).
The most significant health effect expected from inhalation exposure to PAHs is excess risk of lung
cancer (WHO, 2000). However, PAH exposure is also associated with numerous other negative
human health effects including bronchitis, asthma, heart disease and reproductive toxicity (Choi et
al., 2012).
The nature and magnitude of health effects caused by PAHs varies between individual compounds
and their presence in the atmosphere as mixtures, of varying composition, means evaluating
health risks and influence of specific components in the environment is complex (Keyte et al.,
2013). The IARC has categorised various PAH and NPAH compounds according to their
carcinogenicity (see Table 1.2).

18
Figure 1.3. Metabolic diol epoxide formation from PAHs via cytochrome P450 enzymes
(CYP450) and epoxide hydrolase (EH) enzymes (Shimada, 2006).
19
Figure 1.4. Metabolic formation of o-quinones from PAHs via dihydrol dehydrogenase (DD)
enzymes (Xue and Warshawsky, 2005).
20
Figure 1.5. Metabolic cation radical formation from PAHs via cytochrome P450 enzymes
(CYP450) and peroxidase enzymes.
1.3.4. The role of PAHs in the health effects of urban air
The carcinogenic and/or mutagenic potential of PM in urban air samples has been widely
demonstrated (Bayona et al., 1994; Hannigan et al., 1997; Kawanaka et al., 2004; Pitts et al.,
1977; Pitts et al., 1982; Tokiwa et al., 1987) and many proven or potentially mutagenic or
carcinogenic PAHs, OPAHs and NPAHs are observed in urban air of many countries (see Keyte et
al., 2013 for full details).
21
Figure 1.6. Mechanism for the formation of reactive oxygen species from OPAH quinones
(Bolton et al., 2000).
Numerous studies have suggested PAHs, OPAHs and NPAHs can contribute significantly to the
observed carcinogenicity and/or mutagenicy of ambient air (Bethel et al., 2001; Durant et al., 1998;
Gupta et al., 1996; Hannigan et al., 1998; Pedersen et al., 2004; 2005; Tuominen et al., 1988;
Umbuzeiro et al., 2008; Wang et al., 2011a) and primary combustion emissions such as diesel
exhaust (Arey et al., 1988; Ball and Young, 1992; Bethel et al., 2001; Durant et al., 1998; Enya et
al., 1997; Gupta et al., 1996; Hannigan et al., 1998; Hayakawa et al., 1994; IARC, 1989; Pedersen
et al., 2004; 2005; Pitts et al., 1982; Rappaport et al., 1980; Salmeen et al., 1982; 1984; Tuominen
et al., 1988; Umbuzeiro et al., 2008; Wang et al., 2011a). For example, it has been proposed that

22
PAHs are a principal contributor to the carcinogenic potential of PM in urban air (Bonfanti et al.,
1996; Harrison et al., 2004).
Pedersen et al. (2004; 2005) investigated the mutagenicity of individual PAH compounds present
in collected airborne PM samples. They indicated that PAH compounds accounted for 13-22% of
the mutgenicity potential of the total PM extract, with key contributing compounds including BaP,
BbF, BkF, IPy, BPy as well as OPAH ketone 6H-benzo(cd)pyren-6-one.
Figure 1.7. Mechanism for the formation of toxic intermediate species from NPAH compounds (Fiedler and Mücke, 1991).
However, a number of studies have indicated that semi-polar fractions or atmospheric PM extracts
(likely to contain OPAH and NPAH compounds) display higher direct acting mutagenicity than non-
polar extracts (likely to contain PAH compounds) (Lewtas et al., 1990; Nishioka et al., 1985;
23
Pedersen et al., 2004; Umbuzeiro et al., 2008; Wang et al., 2011a). Furthermore, it has also been
demonstrated that ROS generation in airborne PM samples correlates with measured
concentrations of OPAH quinones (Chung et al., 2006).
These studies suggest that NPAH and OPAH may pose more toxic hazard in the urban
environment than PAH. However it is noted that a significant proportion of compounds potentially
responsible for the observed mutagenicity of PM have not yet been identified (Pedersen et al.,
2005).
1.3.5. The role of atmospheric PAH reactions on toxic effects
Gas-phase LMW PAHs e.g. Phe, Flo, Pyr and Flt typically dominate the total atmospheric burden
of PAHs. While these compounds do not appear to cause significant mutagenicity or
carcinogenicity (Durant et al., 1996; Finlayson-Pitts and Pitts, 2000) they may act as precursors to
powerful mutagens. PAHs can be transformed in the atmosphere to a wide range of different
products including OPAH and NPAH via gas-phase or heterogeneous reactions (see Section
1.5.3).
Albinet et al. (2008a) indicate that formation of secondary NPAH from chemical reactions could
significantly increase the carcinogenic risk of PM for people exposed far from original sources of
direct emissions. For example, 2NFlt is a potent human cell mutagen (Durant et al., 1996 ;
Pedersen et al., 2004; 2005) and is typically present in air samples at levels that may contribute to
human cell mutagenicity in many areas of the world (Finlayson-Pitts and Pitts, 2000).
Furthermore, it has been demonstrated that products from the OH-initiated reactions of 2-3 ring
PAHs such as NPAHs, NPAH lactones and nitrodibenzopyranones identified in experimental gas
chamber studies can contribute significantly to the observed mutagenicity of ambient air samples
(Helmig et al., 1992a; 1992b; 1992c; Sasaki et al., 1997a).

24
Table 1.2. Mutagenic and/or carcinogenic categorisation of PAH, OPAH and NPAH
compounds studies in the present investigation.
Human cell
mutagenicitya IARC
classificationb Relative human cell
mutagenicity (ratio to BaP)a Acy (+) ND 0.00056 Ace ND ND n/a Flo ND ND n/a Phe (-) ND n/a Ant ND ND n/a Flt (-) ND n/a Pyr (-) ND n/a BaA (+) 2B 0.082 Chr (+) 3 0.017 BbF (+) 2B 0.25 BkF (+) 2B 0.11 BeP (+) 2B 0.0017 BaP (+) 2B 1 IPy (+) 2B 0.31 BPy (+) 2B 0.19 DBA (+) 2A 0.29 Cor (-) ND n/a
1NNap (-) 3 n/a 2NNap (-) 3 n/a 2NFlo (+) 2B n/a 9NAnt (+) 3 0.0032 1NFlt ND ND n/a 2NFlt (+)c ND n/a 3NFlt (+) 3 0.0026 4NPyr ND 2B n/a 1NPyr (+) 2B 0.025 2NPyr (-) ND n/a 7NBaA ND ND n/a
1,3-DNP (+) ND 0.031 1,6-DNP (+) 2B 0.28 1,8-DNP (+) 2B 0.046 6NChr (+) 2B n/a
9F ND ND n/a AQ (-) ND n/a
MAQ (+) ND n/a BaAQ (-) ND n/a
a – Durant et al. (1996) - (+) indicates compound is mutagenic; (-) indicates compound is not mutagenic at the doses tested; ND indicates the compound was not tested.
b – IARC (1983, 1989, 2010) : 1 = carcinogenic to humans ; 2A = probably carcinogenic to humans ; 2B = possibly carcinogenic to humans ; 3 = not possible to classify ; ND = not determined
c – Pedersen et al. (2005)
25
Gupta et al. (1996) demonstrated that ambient concentrations of NNap and MNNap compounds,
known to form from atmospheric reactions (Phousongphouang and Arey, 2002,2003b) contributed
18% and 32% of daytime and nighttime vapour phase mutagenicity respectively.
It has also been indicated from sampling in urban and ‘receptor’ sites that changes in PAH burden
are ‘mirrored’ by changes in observed mutagenicity of the collected PM, (Atkinson and Arey, 1994
and references therein). Indeed, Feilberg et al. (2002) indicated that the ratio of BaP concentration
to measured mutagenicity of air samples taken in Central Europe rapidly decreased as a function
of photochemical age in urban areas. These studies therefore suggest the potential importance of
mutagens formed via atmospheric reactions such as OPAH and NPAH.
Jariyasopit et al. (2014) also indicated the direct acting mutagenicity of aerosol increased upon
laboratory formation of NPAH from PAHs on collected PM exposed to NO2/NO3/N2O5 in a study
simulating long range atmospheric transport.
It is clear that the overall health risk posed by PAH, OPAH and NPAH in urban air will be
influenced not only by source strength of primary emissions but also on the atmospheric processes
influencing their phase-partitioning, and the secondary input of potentially mutagenic reaction
products as well as seasonal, spatial and meteorological variations (Finlayson-Pitts and Pitts,
2000).
This demonstrates the importance of improving our understanding of these processes and the
need for interaction between atmospheric chemists and toxicologists in order to provide adequate
risk assessments regarding the possible human health effects of PAH, OPAH and NPAH in urban
areas (Finlayson-Pitts and Pitts, 2000).

26
1.4. Occurrence and behaviour of PAHs in the atmosphere
1.4.1. Occurrence in the environment
1.4.1.1. PAHs in the environment
A preliminary budget for PAHs in the U.K. between different environmental compartments was
described Wild and Jones (1995). This estimates a total PAH burden (sum of 12 compounds) of
~53 000 tonnes, the vast majority (>90%) of which is found in soils with the bulk of the remainder
associated with freshwater sediments (3-5%) (see Figure 1.8).
Figure 1.8. The distribution of total PAH burden in the U.K between different environmental
compartments (tonnes) as estimated by Wild and Jones (1995).
While only a relatively small (<0.1%) proportion of the total PAH burden is predicted to be present
in the atmosphere at a given time, this environmental compartment is important as combustion
sources typically emit directly to the atmosphere (Ravindra et al., 2008). The subsequent
27
atmospheric processing of PAHs will dictate their overall environmental fate and/or transfer to other
environmental compartments. For example Jones et al. (1989) indicated the PAH concentration in
the upper soil level (top 0-23 cm) increased by around four-fold from the 1880s to the 1980s, and
attributed this to increased emissions to the atmosphere and subsequent deposition over this time.
Total PAH concentrations in the atmosphere typically range from low (<1 to 10) ng m-3 values in
remote rural locations to high (10 to >100) ng m-3 values in heavy urban and traffic locations,
depending on the specific location, nature and strength of primary sources and ambient conditions
(Finlayson-Pitts and Pitts, 2000; Liu et al., 2006a; Mastral et al., 2003a; Prevedouros et al., 2004a).
PAHs are typically found within the ultrafine (aerodynamic diameter <0.1 μm) or accumulation
(aerodynamic diameter 0.1 to 1 μm) fraction of the particle mass size distribution (Keyte et al.,
2013). In urban and rural locations, the median diameter is predominantly found in the
accumulation mode, however PAHs may be more associated with the ultrafine mode in closer
proximity to primary combustion emissions (Baek et al., 1991; Cancio et al., 2004; Chrysikou et al.,
2009; Kawanaka et al., 2004; Kawanaka et al., 2009; Kiss, 1996; Miguel et al., 2004; Schnelle et
al., 1995; Venkataraman and Friedlander, 1994).
1.4.1.2. OPAHs and NPAHs in the atmosphere
The presence of NPAHs in air samples has been reported in wide range of urban, suburban, rural
and trafficked locations in the U.K. (Dimashki et al., 2000); Continental Europe (Albinet et al.,
2006,2007a; 2008a; Bayona et al., 1994; Cecinato, 2003; Di Filippo et al., 2010; Feilberg et al.,
2001; Marino et al., 2000; Niederer, 1998; Nielsen, 1984; Ringuet et al., 2012c; Tsapakis and
Stephanou, 2007) ; North America (Arey et al., 1987; Arey et al., 1989a; Bamford and Baker, 2003;
Ramdahl et al., 1986; Reisen and Arey, 2005; Wilson et al., 1995); South America (Sienra and
Rosazza, 2006; Valle-Hernandez et al., 2010); Asia (Dimashki et al., 2000; Hien et al., 2007;
Kakimoto et al., 2000; 2001; Murahashi and Hayakawa, 1997; Tang et al., 2002; 2005; Wang et
al., 2011a; Wei et al., 2012); Africa (Nassar et al., 2011).
28
Atmospheric concentration of NPAHs are typically reported to be generally 10-100 times lower
than concentrations of PAH (Albinet et al., 2008a; Bamford and Baker, 2003; Feilberg et al., 2001),
while OPAHs are typically observed in ambient air at similar concentrations to their parent PAHs
(Albinet et al., 2007,2008a; Walgraeve et al., 2010, references and supplementary material
therein).
OPAHs have been reported in ambient sampling studies in the U.K. (Alam et al., 2013; 2014;
Delgado-Saborit et al., 2013; Harrad et al., 2003; Lewis et al., 1995) ; Continental Europe (Albinet
et al., 2006,2007a; Albinet et al., 2008a; Andreou and Rapsomanikis, 2009; Castells et al., 2003;
Delhomme et al., 2008; Liu et al., 2006b; Neususs et al., 2000; Schnelle-Kreis et al., 2007;
Shimmo et al., 2004b; Valavanidis et al., 2006) ; North America (Allen et al., 1997; Cho et al.,
2004; Chung et al., 2006; Eiguren-Fernandez et al., 2008a; Wilson et al., 1995) ; South America
(Sienra, 2006; Tsapakis et al., 2002) ; Asia (Lee et al., 2012; Park et al., 2008; Wang et al., 2011a;
Wingfors et al., 2001); Africa (Yassaa et al., 2001).
However, relatively few studies have measured both PAH and OPAH or NPAH derivative
compounds in the same environmental samples, despite this being necessary in order to gain a
clearer understanding of the atmospheric processing of these compounds (Alam et al., 2014).
The majority (>85%) of OPAH and NPAH are shown to be associated with particles with an
aerodynamic diameter <0.25 μm (Albinet et al., 2008b; Di Filippo et al., 2010; Kawanaka et al.,
2004; 2009; Ringuet et al., 2012c). For example, the mass size distribution of a number of NPAH
and OPAH was assessed in various urban, trafficked, suburban and rural locations in France by
Albinet and co workers. Albinet et al. (2008b) indicated that 60-90% of OPAH and NPAH are
associated with the fine (aerodynamic diameter >1.3 μm) mass fraction in both summer and winter.
However, Ringuet et al. (2012c) noted that, while NPAH compounds are observed in both ultra fine
and accumulation mass fractions, OPAHs are predominantly found in the ultra fine mode at traffic
(77%) and suburban (64%) sites.
29
As with unsubstituted PAHs, OPAH and NPAH particle mass size distribution is shown to exhibit
seasonal and spatial variations. For example, the extent of particle aging between urban and
suburban or rural sites can result in a shift in mass size distribution towards coarser particles
(Albinet et al., 2008b; Allen et al., 1997; Ringuet et al., 2012c).
Albinet et al. (2008b) indicated fractions in the finest particles (aerodynamic diameter <0.39 μm)
were higher for OPAH (56%) and NPAH (63%) than for PAHs (45%) therefore suggesting that
these derivative compounds can pose a more toxic threat than PAH as they will penetrate deeper
into the human respiratory system (Ringuet et al., 2012c; Walgraeve et al., 2010).
1.4.2. Gas-particle partitioning of PAH, OPAH and NPAH compounds
1.4.2.1. Phase partitioning of PAHs
The wide range of physiochemical properties between compounds mean PAHs can exist in both
the free vapour phase and associated with atmospheric particulate matter. In the atmosphere,
PAHs range from relatively small 2-ring species (e.g. Nap) that exist almost entirely in the vapour-
phase to relatively large molecules with 6 or more rings (e.g. Cor) compounds which are present
almost entirely in the particulate phase.
However, the majority of PAH compounds, especially those with 3-4 rings are considered to be
semi-volatile and can hence undergo a significant degree of partitioning between these two phases
in the atmosphere (Keyte et al., 2013). The dynamics and factors influencing PAH phase
partitioning has previously been discussed by Keyte et al. (2013) and Finlayson-Pitts and Pitts
(2000).
Phase partitioning of PAH can be quantified by defining a gas-particle partitioning coefficient :
Kp = Cp / (Cg x Cm) (1.1)
where :
30
Kp = partitioning coefficient (m3 μg-1)
Cp = concentration in the particulate phase (μg m-3)
Cg = concentration in the gas phase (μg m-3)
Cm = particulate matter mass concentration (μg m-3)
The value of Kp can be influenced by the extent and nature both adsorption and adsorption
processes and is strongly temperature dependent (Baek et al., 1991; Yamasaki et al., 1982) and
can exhibit a pronounced seasonal variation (Baek et al., 1991; Halsall et al., 1993; Keller and
Bidleman, 1984; Smith and Harrison, 1996; Yamasaki et al., 1982). The degree of gas-particle
partitioning can also be influenced by sampling artefacts (see Sections 2.1.6 and 4.4).
Quantitative analysis suggests PAH phase partitioning can be described by the sum of absorbtive
(characterised by the octanol-air partitioning coefficient) and adsorptive (characterised by the soot-
air partitioning coefficient) contributions (Keyte et al., 2013 and references therein) :
Kp = 10-12 [fOM/oct Koa + fBC/BC (SBC/Ssoot) Ksoot-air] (1.2)
where :
fBC and fOM = the mass fraction of soot (black carbon) and organic matter in particulate matter
respectively
Ksoot-air = the soot-air partitioning coefficient
Koa = the octanol-air partition coefficient
oct and BC = the densities of octanol and soot, respectively
SBC and Ssoot = available specific surface areas
The extent of gas-particle partitioning of PAHs is influenced by a number of physical and chemical
factors. As discussed by Baek et al. (1991) phase partitioning is a function of : i) the molecular
31
weight and associated vapour pressure of the compound at ambient temperature; ii) the
concentration and nature (e.g. organic matter content) of particulate matter and the available
surface area for PAH adsorption ; iii) the affinity of the compound for the organic matrix within
particulate matter ; iv) the state of the compound upon emission (e.g. gas-phase, adsorbed at
particle surface, or contained within the core particle); v) the reactivity and/or stability of the
compound ; vi) meteorological conditions (e.g. temperature, humidity, and precipitation).
1.4.2.2. Phase partitioning of OPAHs and NPAHs
Experimental data regarding the phase partitioning of NPAH and OPAH is relatively lacking
compared with unsubstituted PAHs as only a relatively small number of studies have conducted
atmospheric measurements in both particulate and vapour phases (Albinet et al., 2007a; Albinet et
al., 2008a; Bamford and Baker, 2003; Eiguren-Fernandez et al., 2008a; Lintelmann et al., 2006;
Wilson et al., 1995).
OPAH and NPAH typically exhibit higher molecular weight and lower vapour pressures than their
‘parent’ PAHs, which may lead to a higher tendency to sorb to atmospheric PM (Walgraeve et al.,
2010).
Albinet et al. (2008a) reported PM associated fractions of a wide range of OPAH and NPAH as a
function of molecular weight and sampling season in a French Alpine valley region. It was indicated
that 2-3 ring compounds are mainly present in the gas-phase (>50%), while 4+ ring compounds
are mostly (>90%) associated with PM. Similar observations have been reported by Liu et al., 2006
and Delgado-Saborit et al. (2013).
As with ‘parent’ PAH, the fraction of OPAH and NPAH in the particle-phase is strongly dependent
on the specific physiochemical properties of the molecule e.g. molecular weight and associated
vapour pressure, meteorological factors e.g. temperature, and the concentration of particles.
It is indicated that, especially in winter these compounds have a stronger tendency to sorb to PM
and the seasonal effects on the extent of gas-particle partitioning is more pronounced for OPAH
32
and NPAH than for parent PAH (Albinet et al., 2008a). However, the specific partitioning behaviour
observed is shown to be highly dependent on sampling site and methodology (Albinet et al.,
2008a; Delgado-Saborit et al., 2013; Walgraeve et al., 2010).
Improving the understanding of gas-particle partitioning behaviour is important as this process will
influence the extent and nature of potential loss mechanism for PAH, OPAH and NPAH such as
chemical reactivity and deposition.
1.4.3. Atmospheric transport of PAHs
Relatively slow photochemical degradation and limited deposition rates can allow PAHs to undergo
relatively long range atmospheric transport (LRAT) from their source region (typically the more
polluted mid-latitudes in the Northern Hemisphere) to more remote high latitude locations (Keyte et
al., 2013 and references therein).
Evidence for LRAT has come from numerous observations of PAHs in air and
precipitation/deposition samples at remote continental and mountain sites (Albinet et al., 2008a;
Delgado-Saborit et al., 2013; Fernandez et al., 2002; Halse et al., 2011; Klanova et al., 2009;
Lammel, 2010; Primbs et al., 2008; Van Drooge et al., 2010; Walgraeve et al., 2010; Xiao et al.,
2010) ; marine sites (Ding et al., 2007; Nizzetto et al., 2008; Tsapakis and Stephanou, 2005) and
Arctic or Antarctic sites (EMEP, 2011; Halsall et al., 1997; Halsall et al., 2001; Hung et al., 2005;
Jaffrezo et al., 1993; Patton et al., 1991) where local sources are expected to be minimal.
Numerical multimedia modelling has also assessed and in some cases quantified the extent of
LRAT (Aulinger et al., 2007; Gusev et al., 2011; Halsall et al., 2001; Prevedouros et al., 2004b;
Silibello et al., 2012).
However, investigation of PAH LRAT is hindered by a lack of data on atmospheric processes such
as PAH reactivity and volatilisation from surfaces, which are not incorporated into these models
(Keyte et al., 2013). For example, volatilisation is estimated to contribute >10% of total global

33
emissions of Ant and Flt, therefore the gas exchange with vegetation, soils, and surface waters
could therefore enhance the LRAT of PAHs (Lammel et al., 2009).
The potential importance of PAH reactivity during long-range transport on the formation of NPAHs
and OPAHs has been indicated in ambient sampling (Eiguren-Fernandez et al., 2008b) and
experimental (Jariyasopit et al., 2014) studies. However the LRAT behaviour of OPAH and NPAH
compounds has not been widely investigated (Yaffe et al., 2001).
1.4.4. Long-term concentration trends
In most developed countries a substantial decline in PAH concentrations has been reported over
the last 40 years (WHO, 2000). This downward trend has been observed for most U.K. monitoring
sites at urban and suburban locations (Brown et al., 2013; Meijer et al., 2008; Prevedouros et al.,
2004a) and at sites in North America (Cortes et al., 2000; Sun et al., 2006) ; Europe (Holoubek et
al., 2007) and the Arctic (Becker et al., 2006).
Brown et al. (2013) reported than BaP concentrations from monitoring stations in the U.K. have
fallen significantly in the last 20 years and that this decline correlates strongly with changes in
NAEI-estimated primary emissions (see Figure 1.1). Indeed, a reported decrease in PAH
concentrations in Birmingham was attributed to a reduction in emissions as a result of more
stringent legislation and cleaner industrial technologies and power generation (Smith and
Harrison, 1996).
Specifically, lower PAH concentrations have been linked to the introduction and increased use of
catalytic converters for motor vehicles, reduction in coal combustion as an energy source with an
increased movement towards oil and natural gas as well as the elimination of emissions from
agricultural burning and aluminium production (Murrells et al., 2010; Smith and Harrison, 1996).
There are currently no available data on the long-term concentration trends for OPAH and NPAH
compounds in atmospheric samples.
34
1.4.5. Short term concentration variations
1.4.5.1. Seasonal patterns
PAH, OPAH and NPAH typically exhibit seasonal variations in atmospheric concentration. PAHs
have been found at higher concentrations in winter months at urban, suburban and rural sites,
particularly for HMW compounds (Brown et al., 2013; Dimashki et al., 2001; Halsall et al., 1993;
Harrison et al., 1996; Meijer et al., 2008; Prevedouros et al., 2004a; Smith and Harrison, 1996).
Higher atmospheric concentrations during winter compared to summer at urban sites have also
been observed for OPAHs (Albinet et al., 2008a; Andreou and Rapsomanikis, 2009; Brown et al.,
2013; Dimashki et al., 2001; Halsall et al., 1993; Harrison et al., 1996; Meijer et al., 2008;
Prevedouros et al., 2004a; Schnelle-Kreis et al., 2007; Sienra, 2006; Smith and Harrison, 1996; G
Wang et al., 2007) and NPAHs (Albinet et al., 2008a; Bamford and Baker, 2003; Marino et al.,
2000; Sienra and Rosazza, 2006; Wei et al., 2012).
Higher winter concentrations can be attributed to increased primary emissions during the colder
months when domestic combustion of solid fuels for space heating is expected to be higher (Brown
et al., 2013).
The height of the atmospheric boundary layer (ABL) has an important influence on the
concentrations of urban air pollutants as this will dictate the extent of dispersion and dilution of
atmospheric species (Williams, 2001 ; Holloway and Wayne, 2010). For example, a lower
boundary layer will result in pollutants being confined at a higher concentration close to the surface
rather than being diluted throughout the free troposphere (Holloway and Wayne, 2010).
It is suggested the colder months will exhibit reduced vertical mixing due to temperature inversion
and/or lower atmospheric boundary layer (ABL) height resulting in reduced atmospheric dispersion
(Bamford and Baker, 2003; Reisen and Arey, 2005) ; and slower rate of chemical degradation
processes (Barbas et al., 1996; Kamens et al., 1989; Prevedouros et al., 2004a).

35
However, in some instances, higher concentrations of LMW PAHs have been observed in summer,
particularly at more remote sites, attributed to local sources due to volatilisation from soil or
vegetation sources or sea outgassing (Prevedouros et al., 2004a; Meijer et al., 2008 and
references therein). Furthermore, seasonality of NPAH and OPAH concentrations can be
influenced by secondary input due to PAH reactivity in the atmosphere (see Section 1.5).
A number of sampling studies have observed enhanced concentrations of NPAH or OPAH
compounds at locations downwind of major urban areas, which is more pronounced during
summer, suggesting the concentrations of these compounds can increase in the warmer months
when levels of atmospheric oxidants (e.g. OH, NO3, O3) are higher (Bamford and Baker, 2003;
Eiguren-Fernandez et al., 2008a; Reisen and Arey, 2005).
1.4.5.2. Diurnal patterns
Diurnal or nocturnal patterns of PAH, OPAH and NPAH concentrations have been studied in
various environments. The diurnal variation of parent PAHs is likely to reflect direct source
emission signals e.g. from domestic combustion, biomass burning or road traffic and modification
by reactive and/or deposition loss processes as well as the relative height of the ABL (Lee et al.,
1998; Reisen and Arey, 2005; Ringuet et al., 2012a; Souza et al., 2014).
In contrast, OPAH and NPAH compounds may display distinct diurnal patterns from those of
parent PAH due to the influence of secondary input, for example due to daytime OH and/or
nighttime NO3 reactions, and/or differences in dominant primary sources or photodegradation
processes (Arey et al., 1989a; Hien et al., 2007; Reisen and Arey, 2005; Souza et al., 2014;
Tsapakis and Stephanou, 2005).
Studies of diurnal patterns commonly focus on 12 hourly ‘daytime’ and ‘nighttime’ sampling (Arey
et al., 1989a; Hien et al., 2007; Souza et al., 2014). Relatively few studies have investigated
shorter-term sampling frequency (Reisen and Arey, 2005 ; Lee et al., 1998 ; Tsapakis and
36
Stephanou, 2005, which means identifying factors influencing short-term variations in
concentration is more difficult. Diurnal sampling over higher resolution time scales is clearly
required.
1.4.6. Ambient sampling of PAH in the U.K. atmosphere
1.4.6.1. PAH monitoring in the U.K.
Air sampling campaigns in different locations and over different time scales can provide valuable
information regarding the sources, behaviour and fate of PAHs as well as key long-term, short-term
and seasonal trends in their concentrations. In the U.K., regular measurements of PAHs have been
carried out since 1991, when the Toxic Organic Micropollutants (TOMPS) program was established
(Brown et al., 2013).
The TOMPS network began with four sampling locations, but the growing focus and concern over
PAHs in the atmosphere led to an expansion of the program in the interceding years, eventually
resulting in the establishment of a separate ‘PAH Network’, funded by the UK Government
Department of Farming, Environment and Rural Affairs (Defra). In 2011 there were a total of 36
monitoring sites taking regular measurements of PAHs (Brown et al., 2013), covering a range of
location types (including urban, rural, industrial, trafficked and background sites).
These monitoring data have been used to produce publications assessing the concentrations,
seasonality, long-term temporal trends and source profiles of PAHs in the UK atmosphere (Jang et
al., 2013; Meijer et al., 2008; Prevedouros et al., 2004a) and have been augmented by a number
of additional individual sampling studies measuring PAHs (Alam et al., 2013; 2014; Baek et al.,
1991; Delgado-Saborit et al., 2013; Dimashki et al., 2000; 2001; Harrad et al., 2003; Harrad and
Laurie, 2005; Jang et al., 2013; Jones et al., 1992; Meijer et al., 2008; Prevedouros et al., 2004a;
Smith and Harrison, 1996).
37
Only a very limited data are available for OPAHs and NPAHs in the U.K. atmosphere and no
regular or long-term monitoring has been undertaken for these compounds. There is therefore a
lack of knowledge regarding the sources, behaviour and fate of OPAH and NPAH in the U.K.
atmosphere, or the long- or short-term trends in their atmospheric concentrations.
1.4.6.2. PAHs from road traffic
Road traffic is shown to be a key source of PAHs, OPAHs, NPAHs in urban areas (Fraser et al.,
1998a; Jakober et al., 2007; Lim et al., 1999; Oda et al., 1998; Rogge et al., 1993a; Staehelin et
al., 1998; Zhu et al., 2003). There is therefore a need accurately assess emission factors of these
compounds from vehicle exhausts and to estimate the relative and overall contribution of road
traffic to the concentrations of different PAHs, OPAHs and NPAHs present in the ambient urban
atmosphere in relation to other combustion sources (e.g. industrial emissions, domestic burning)
and influencing factors (e.g. chemical reactivity, volatilisation from surfaces).
However, accurately measuring on-road vehicular emissions of PAHs, OPAHs and NPAHs is
complicated by the mixture of engine and fuel types and emission control technologies present.
Sampling in road tunnels can provide a more realistic traffic profile than using dynamometer tests
(Oda et al., 2001; Wingfors et al., 2001). Experimental studies in a laboratory will only yield data on
specific vehicles, engine characteristics and/or fuel formulations, whereas a tunnel will contain a
realistic range of different vehicles. Additionally, repeated monitoring in a tunnel environment can
assess changes in PAH emission profiles in response to changes in fuel usage or emission control
measures (Ravindra et al., 2008).
Road tunnels provide an ideal environment to assess traffic emission profiles as tunnels are
assumed to have :
High traffic density
Realistic distribution of on-road vehicles

38
Relatively low dispersion rate
Relatively low sunlight and chemical reactivity
Lack of inputs from other primary sources
1.5. Fate of PAHs, OPAHs and NPAHs in the atmosphere
1.5.1 Wet and dry deposition of PAHs
PAHs can be lost from the atmosphere via direct settling to the surface (dry deposition) or via
precipitation in rain droplets or snow fall (wet deposition). This can occur either in the gas-phase or
by loss of particulate matter to which the PAH compounds are associated (Bidleman, 1988). The
wet and dry deposition processes are discussed in detail by Keyte et al. (2013).
The relative rates of wet or dry deposition of PAHs from the atmosphere is dependent on the
physiochemical properties of the PAH (solubility in water, Henry’s Law constant, vapour pressure),
degree of phase partitioning, meteorological parameters (rainfall levels, temperature) and
concentration and composition of particulate matter (Keyte et al., 2013).
Wet deposition of PAHs is not expected to be an efficient process unless the substance is
associated with PM (Bidleman, 1988; Ligocki et al., 1985). The removal rate of PAH at a Central
European site ranged between <2 weeks and >2 weeks for dry and wet deposition respectively
(Skrdlikova et al., 2011) indicating dry deposition as the potentially more important process.
Modelling predictions of the relative loss rates of PAHs to various loss processes in the U.K. were
made by Prevedouros et al. (2004b). The relative percentage loss rates for a number of PAHs
predicted are shown in Figure 1.9, which indicate that for LMW (3-4 ring) PAH, wet and dry
deposition are minor loss processes relative to OH radical reactivity. However, for HMW (5+ ring)
PAHs, which are associated primarily with PM, wet and dry deposition is indicated to be a more
important process.

39
1.5.2. Photolysis
1.5.2.1. Photolysis of PAHs
Direct photolysis is not expected to be a significant sink for PAHs in the gas phase (Atkinson and
Arey, 1994 and references therein). However, PAH adsorbed on PM may be susceptible to
photolysis due to the wide electron delocalization of PAHs, enabling them to absorb solar radiation
and undergo photooxidation (Vione et al., 2006). The chemistry (rates, products and mechanisms)
of direct photolytic PAH decomposition has been investigated for PAHs associated with organic
aerosols, inorganic substrates, and the air-ice interface (please see Keyte et al., 2013 for full list of
references; the reader is directed to Finlayson-Pitts and Pitts, 2000 and Vione et al., 2006 for
discussion of PAH photolysis reactions).
Half lives of PAH compounds towards photolysis on various substrates measured by (Behymer
and Hites, 1985,1988) are shown in Table 1.3. Degradation rates are influenced strongly by
substrate type with relatively faster rates observed on mineral surfaces (e.g. silica gel) than on
carbonaceous particles (e.g. fly ash and carbon black). A number of PAHs (e.g. Ace, Acy, Ant,
BaA, BaP) are shown to display relatively fast (<5 hr) photolysis on silica and alumina (Behymer
and Hites, 1985;1988) while other compounds appear to degrade slowly on all substrates.
It is indicated that PAHs associated with carbonaceous particles (fly ash or carbon black) are less
susceptible to photooxidation (Behymer and Hites, 1985,1988; Korfmacher et al., 1980; Yokley et
al., 1986) due to higher carbon content and darker colour of the substrate. Kamens et al. (1988)
also demonstrated that rate of PAH photodegradation is influenced by solar intensity, humidity and
pressure.
The ability for carbonaceous particles to shield radiation, means that photo-degradation of PAHs is
believed to be minimal relative to gas-phase reaction with OH or NO3 radicals (Vione et al., 2006).
However, it is noted that relatively rapid sensitised photolysis processes can be initiated by
compounds such as PAH quinones and carbonyls, either present in direct emissions or partially
derived from PAH photooxidation (Vione et al., 2006).
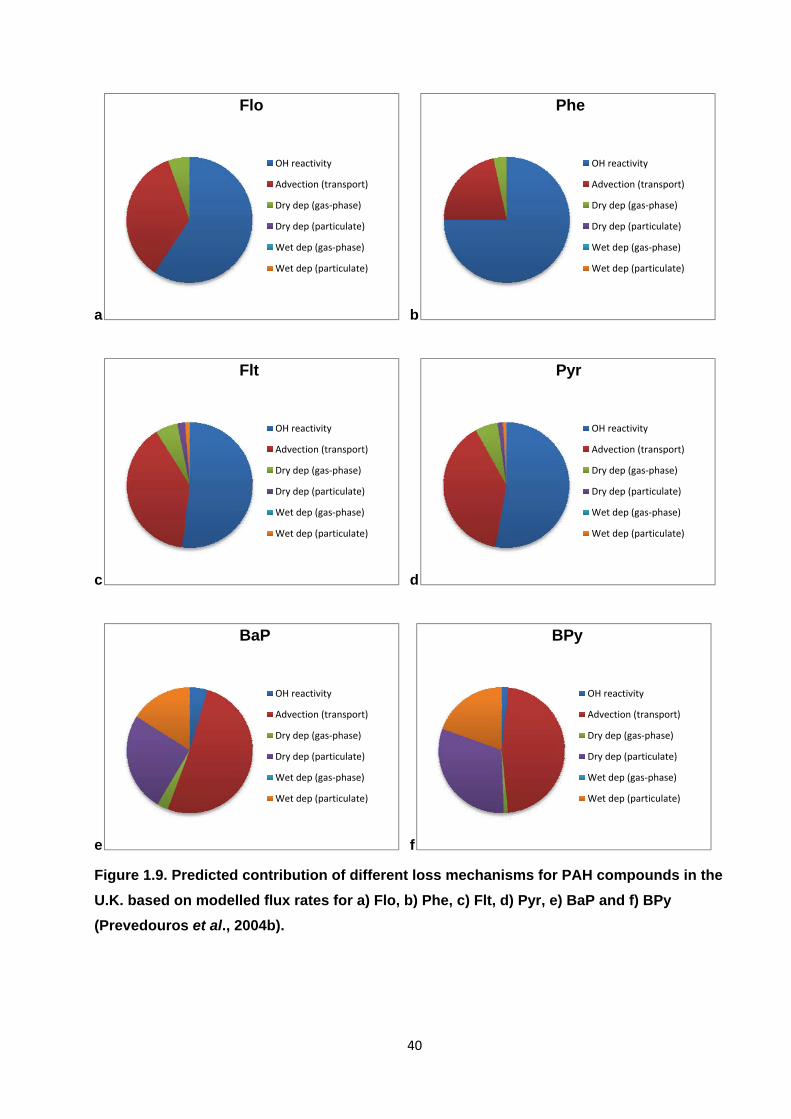
40
a b
c d
e f
Figure 1.9. Predicted contribution of different loss mechanisms for PAH compounds in the
U.K. based on modelled flux rates for a) Flo, b) Phe, c) Flt, d) Pyr, e) BaP and f) BPy
(Prevedouros et al., 2004b).
Flo
OH reactivity
Advection (transport)
Dry dep (gas‐phase)
Dry dep (particulate)
Wet dep (gas‐phase)
Wet dep (particulate)
Phe
OH reactivity
Advection (transport)
Dry dep (gas‐phase)
Dry dep (particulate)
Wet dep (gas‐phase)
Wet dep (particulate)
Flt
OH reactivity
Advection (transport)
Dry dep (gas‐phase)
Dry dep (particulate)
Wet dep (gas‐phase)
Wet dep (particulate)
Pyr
OH reactivity
Advection (transport)
Dry dep (gas‐phase)
Dry dep (particulate)
Wet dep (gas‐phase)
Wet dep (particulate)
BaP
OH reactivity
Advection (transport)
Dry dep (gas‐phase)
Dry dep (particulate)
Wet dep (gas‐phase)
Wet dep (particulate)
BPy
OH reactivity
Advection (transport)
Dry dep (gas‐phase)
Dry dep (particulate)
Wet dep (gas‐phase)
Wet dep (particulate)

41
Table 1.3. Half lives (hours) of PAH compounds absorbed on various substrates; carbon
back (CB), fly ash (FA), silica gel (SG) and alumina (AL), as reported by Behymer and Hites
(1988) for PAH absorbed at 25 μglg.
CB FAa FAb FAc FAd SG AL
Acy 166 1000 70 89 17 0.6 1.5
Ace nm 1000 105 76 18 1.6 1.4
Flo 1000 1000 332 500 38 245 55
Phe 1000 1000 500 500 244 268 44.5
Ant 313 608 132 51 19 1.6 0.4
Flt 1000 1000 437 235 330 99.1 22.5
Pyr 1000 1000 357 201 119 35.5 22.5
BaA 651 1000 201 137 19 2.4 1.6
Chr 688 1000 172 334 500 101 59.5
BeP 1000 1000 163 409 338 64.5 79.1
BaP 574 805 125 213 28 2.7 1
IPy 1000 1000 120 304 492 62 38.9
BPy 1000 1000 119 373 224 10.5 20.4
Cor 1000 1000 115 335 487 97.1 104
a – black fly ash, high (59% bulk) carbon content
b – black fly ash, low (22% bulk) carbon content
c – grey fly ash
d – white fly ash
1.5.2.2. Photolysis of OPAH and NPAH
Photolysis of NPAHs has been indicated as a potentially important loss process for both gas-phase
and particle-associated compounds (WHO, 2003). The gas-phase N-Nap compounds are shown to
be highly susceptible to photolysis with an atmospheric lifetime of <1 to 2 hrs (Atkinson et al.,
1989; Feilberg and Nielsen, 2000; Niu et al., 2005; Phousongphouang and Arey, 2003a). For
example, Atkinson et al. (1989) noted atmospheric lifetimes for NNap compounds due to photolysis
were ~38 and ~28 times lower respectively than for their corresponding gas-phase reaction with
OH.
42
Photolysis of NPAHs associated with particles has been studied to assess the mechanisms,
products and atmospheric significance of this process (Arce et al., 2008; Chapman et al., 1966;
Fan et al., 1995; Fan et al., 1996a; Feilberg and Nielsen, 2000; Healy et al., 2012; Holloway et al.,
1987; Ioki, 1977; Kameda, 2011; Pitts, 1983; Stark et al., 1985).
While Holloway et al. (1987) noted relatively long photolysis half lives for 1NPyr and 3NFlt of 1.2 to
6 days and 12.5 to >20 days respectively, other studies suggest this process can be a potentially
significant atmospheric sink for particle-bound NPAHs. Fan et al. (1996a) derived half-lives due to
photolytic decay for 1NPyr, 2NFlt and 2NPyr on diesel soot and wood smoke in an outdoor
chamber of 0.8 to 1.2 hr with faster reaction noted for 1NPyr on wood smoke particles.
Photolysis of OPAH has received comparatively little attention in the literature. It is indicated that
gas-phase compounds such as 1,4-naphthoquinone are degraded at a comparable rate to gas-
phase NNap compounds (Atkinson et al., 1989). However, particle-associated OPAHs are believed
to be relatively stable towards solar irradiation (Kamens et al., 1989).
1.5.3 Atmospheric reactivity of PAHs
Chemical reactions represent a key atmospheric loss process for both gas-phase and particle-
phase PAH and can be an important secondary source for a number of OPAH and NPAH
compounds (Atkinson and Arey, 1994; 2007; Finlayson-Pitts and Pitts, 2000). The reaction
kinetics, mechanisms and OPAH or NPAH formation products of gas-phase and heterogeneous
PAH reactions has been reviewed by Keyte et al. (2013). Included here is a summary of key points
discussed in the review. For a more detailed discussion the reader is directed to the specific
sections of the review paper.
43
1.5.3.1. Gas-phase PAH reactions
Atmospheric reactions of gas phase PAHs with key atmospheric oxidants (OH, NO3 and O3) and
the relative importance of these processes in the removal of PAHs from the atmosphere and
conversion to derivative compounds have been widely investigated in laboratory experiments (Arey
et al., 1986; 1989b; Atkinson and Aschmann, 1986; Atkinson et al., 1987a; 1988; 1990a; 1990b;
1994; Brubaker and Hites, 1998; Helmig and Harger, 1994; Kwok et al., 1994a,1997;
Phousongphouang and Arey, 2002,2003b; Reisen and Arey, 2002).
Rate coefficients have been derived for the gas phase reaction of OH, NO3 and O3 with 2-4 ring
PAHs (Table A1, A2 and A3 in Appendix 1 respectively) in laboratory investigations. Reactions of
PAHs with OH proceed up to 5 orders of magnitude faster than the corresponding reactions with
NO3, suggesting that OH-initiated reactions represent a more important degradation process for
PAHs than reactions with NO3.
There is shown to be considerable variability in reactivity and hence the expected atmospheric
lifetime of different PAHs. Acy and Ant are shown exhibit the fastest reactivity towards OH. The
rate and products of the reactions are dependent upon the precise reaction mechanism and can be
influenced by factors such as steric hindrance of reactive sites (Brubaker and Hites, 1998) and the
number and type of substituted groups. For example, the presence of alkyl-groups on Nap and Phe
has been shown to increase reactivity towards OH and NO3 relative to parent PAH, following
general order of reactivity dimethyl-PAH > ethyl-PAH > methyl-PAH > PAH (Lee et al., 2003;
Phousongphouang and Arey, 2003b).
OH-initiated PAH reactions are considered to be important only during daytime due to the
photolytic nature of atmospheric OH formation (Atkinson and Arey, 2007; Krol and Lelieveld, 2003;
Prinn et al., 2005). NO3 radicals are formed via the sequential reactions of NO and NO2 with O3
(Atkinson and Lloyd, 1984; Atkinson et al., 1986; Atkinson et al., 1990b; Geyer et al., 2001; Geyer
et al., 2003) :
44
NO + O3 → NO2 + O2 (1.3a)
NO2 + O3 → NO3 + O2 (1.3b)
NO3 can be removed from the troposphere via photolysis by solar radiation (Atkinson and
Aschmann, 1986; Atkinson et al., 1990a; Graham and Johnston, 1978) or via reaction with NO.
NO3 + hv → NO + O2 (1.4a)
NO3 + hv → NO2 + O (3P) (1.4b)
NO3 + NO → 2 NO2` (1.4c)
Atmospheric reactions with NO3 are therefore only expected to occur during evening and night time
hours when photolysis is absent and NO levels are low (Atkinson et al., 1984; Atkinson and Arey,
1994; 2007). The reactions of PAHs with OH radicals are shown to proceed via the same initial
mechanism, initiated via two pathways (Figure 1.10); (1) OH radical interaction with substituent
groups either through H-atom abstraction from C-H groups (1a), or, in the case of Acy which
contains an unsaturated cyclopentafused ring, addition to the >C=C< bond of this substituent (1b) ;
or (2) OH addition to the aromatic ring, forming an initially energy-rich PAH-radical adduct radical
intermediate, which can further react with NO2 or O2, to form products (Atkinson and Arey, 1994).
For OH reactions, the radical-addition mechanism is shown to dominate at room temperature,
while at elevated temperatures, H-atom abstraction from the C-H bonds will become increasingly
import (Ananthula et al., 2006,2007; Atkinson et al., 1987a; Goulay et al., 2005; Lee et al., 2003;
Lorenz and Zellner, 1983). It is suggested that reactions of the PAH-OH adduct with NO2 and O2
may be competitive for NO2 mixing ratios down to 60 ppbV (Nishino et al., 2008).

45
1a.
1b.
1c.
Figure 1.10. Mechanism for the reaction of gas-phase PAHs with OH radicals ; a) H-atom
abstraction; b) OH addition to substituent groups; c) OH addition to the aromatic ring
(Atkinson and Arey, 1994). Originally presented in Keyte et al. (2013).

46
It is indicated that the NO3 reaction proceeds via an analogous radical addition or H-atom
abstraction mechanism as the OH reaction. The competing reaction pathways of the NO3-addition
mechanism are depicted in Figure 1.11. As discussed by Atkinson and Arey (2007), studies
investigating PAH reaction kinetics with NO3 radicals have used N2O5 as a precursor for NO3
radicals, which will also result in the formation of NO2 in these systems. Measured second order
rate coefficients for the reactions of NO3 radicals with naphthalene and alkyl-naphthalenes (see
Appendix 1) have been shown to be proportional to the NO2 concentration (Atkinson, 1991), with
the rate of reaction described as :
−d[PAH]/dt = kobs[PAH][NO3][NO2] (1.5)
The reaction rate of the NO3 reaction can therefore be defined in terms of the reactions routes in
Figure 1.11. (Atkinson and Lloyd, 1984; Atkinson et al., 1994; Pitts et al., 1985a; Wallington et al.,
1987) :
−d[PAH]/dt = ka(kc[NO2] + kd[O2] + ke) [PAH] [NO3] / (kb + kc[NO2] +kd[O2] + ke) (1.6)
where :
ka = rate coefficient of of PAH-NO3 adduct formation
kb = rate coefficient of PAH- NO3 adduct dissocation
kc = rate coefficient of PAH- NO3 adduct reaction with NO2 to form products
kd = rate coefficient of PAH- NO3 adduct reaction with O3 to form products
ke = rate coefficient of PAH- NO3 unimolecular decomposition to form products
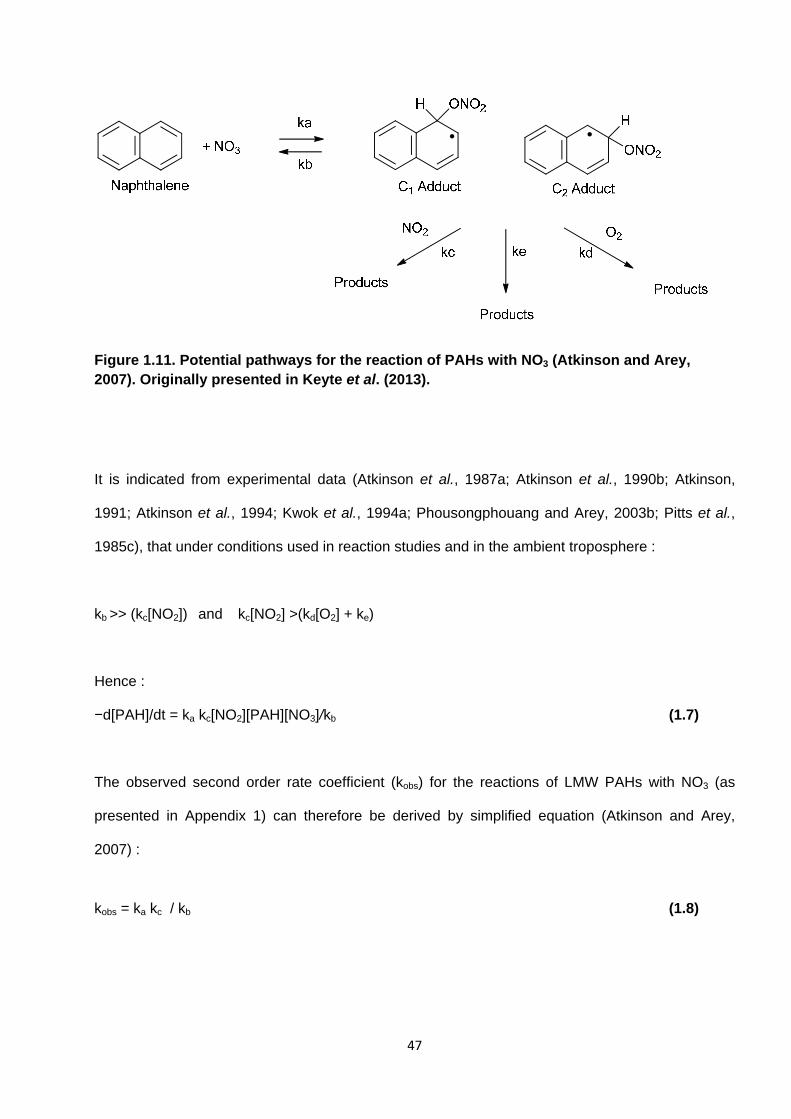
47
Figure 1.11. Potential pathways for the reaction of PAHs with NO3 (Atkinson and Arey, 2007). Originally presented in Keyte et al. (2013).
It is indicated from experimental data (Atkinson et al., 1987a; Atkinson et al., 1990b; Atkinson,
1991; Atkinson et al., 1994; Kwok et al., 1994a; Phousongphouang and Arey, 2003b; Pitts et al.,
1985c), that under conditions used in reaction studies and in the ambient troposphere :
kb >> (kc[NO2]) and kc[NO2] >(kd[O2] + ke)
Hence :
−d[PAH]/dt = ka kc[NO2][PAH][NO3]/kb (1.7)
The observed second order rate coefficient (kobs) for the reactions of LMW PAHs with NO3 (as
presented in Appendix 1) can therefore be derived by simplified equation (Atkinson and Arey,
2007) :
kobs = ka kc / kb (1.8)
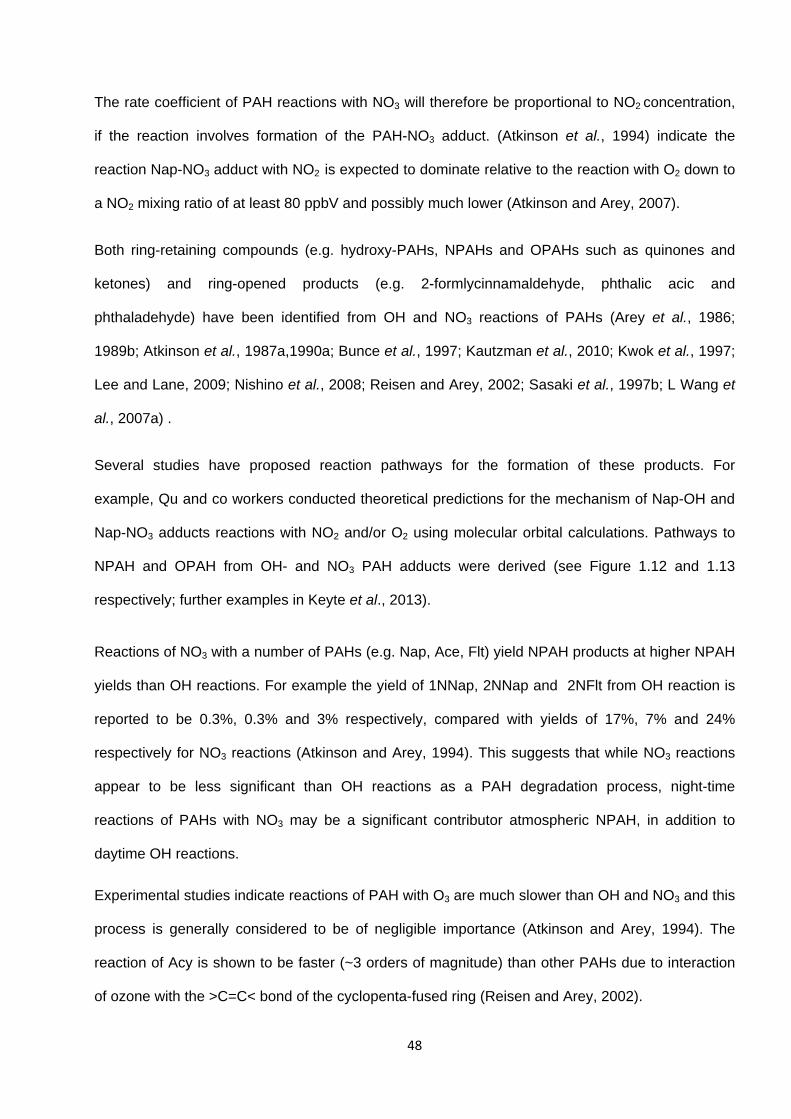
48
The rate coefficient of PAH reactions with NO3 will therefore be proportional to NO2 concentration,
if the reaction involves formation of the PAH-NO3 adduct. (Atkinson et al., 1994) indicate the
reaction Nap-NO3 adduct with NO2 is expected to dominate relative to the reaction with O2 down to
a NO2 mixing ratio of at least 80 ppbV and possibly much lower (Atkinson and Arey, 2007).
Both ring-retaining compounds (e.g. hydroxy-PAHs, NPAHs and OPAHs such as quinones and
ketones) and ring-opened products (e.g. 2-formlycinnamaldehyde, phthalic acic and
phthaladehyde) have been identified from OH and NO3 reactions of PAHs (Arey et al., 1986;
1989b; Atkinson et al., 1987a,1990a; Bunce et al., 1997; Kautzman et al., 2010; Kwok et al., 1997;
Lee and Lane, 2009; Nishino et al., 2008; Reisen and Arey, 2002; Sasaki et al., 1997b; L Wang et
al., 2007a) .
Several studies have proposed reaction pathways for the formation of these products. For
example, Qu and co workers conducted theoretical predictions for the mechanism of Nap-OH and
Nap-NO3 adducts reactions with NO2 and/or O2 using molecular orbital calculations. Pathways to
NPAH and OPAH from OH- and NO3 PAH adducts were derived (see Figure 1.12 and 1.13
respectively; further examples in Keyte et al., 2013).
Reactions of NO3 with a number of PAHs (e.g. Nap, Ace, Flt) yield NPAH products at higher NPAH
yields than OH reactions. For example the yield of 1NNap, 2NNap and 2NFlt from OH reaction is
reported to be 0.3%, 0.3% and 3% respectively, compared with yields of 17%, 7% and 24%
respectively for NO3 reactions (Atkinson and Arey, 1994). This suggests that while NO3 reactions
appear to be less significant than OH reactions as a PAH degradation process, night-time
reactions of PAHs with NO3 may be a significant contributor atmospheric NPAH, in addition to
daytime OH reactions.
Experimental studies indicate reactions of PAH with O3 are much slower than OH and NO3 and this
process is generally considered to be of negligible importance (Atkinson and Arey, 1994). The
reaction of Acy is shown to be faster (~3 orders of magnitude) than other PAHs due to interaction
of ozone with the >C=C< bond of the cyclopenta-fused ring (Reisen and Arey, 2002).
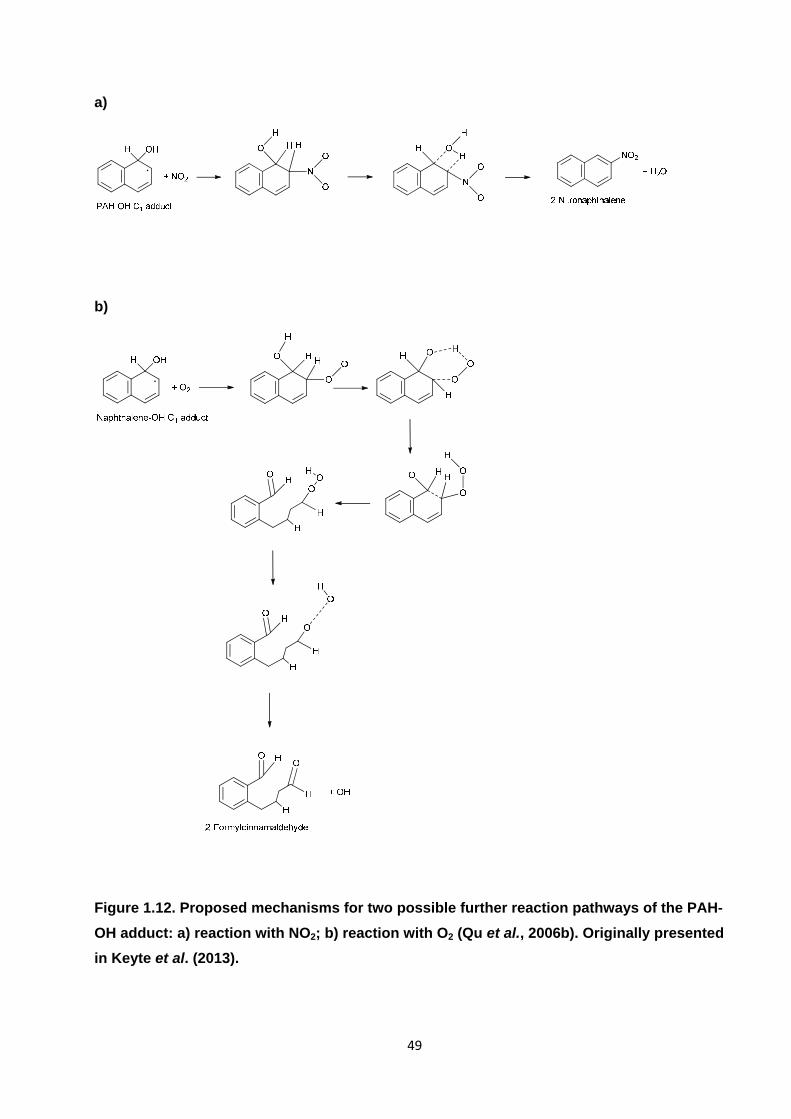
49
a)
b)
Figure 1.12. Proposed mechanisms for two possible further reaction pathways of the PAH-
OH adduct: a) reaction with NO2; b) reaction with O2 (Qu et al., 2006b). Originally presented
in Keyte et al. (2013).
50
a)
b)
Figure 1.13. Proposed mechanisms for two possible further reaction pathways of the PAH-
NO3 adduct: a) reaction with NO2; b) reaction with O2 (Qu et al., 2006a) . Originally presented
in Keyte et al. (2013).
51
1.5.3.2. Heterogeneous reactions
The reaction kinetics, mechanisms and products of PAHs on solid substrates has been studied
extensively in laboratory experiments.
Substrate surfaces studied include both carbonaceous (graphite, soot, and diesel exhaust) and
mineral (silica, MgO) particles for reactions with OH (Bedjanian et al., 2010; Bertram et al., 2001;
Estéve et al., 2003,2004,2006; Jariyasopit et al., 2014; Miet et al., 2009a; Ringuet et al., 2012b),
NO3/N2O5 (Karagulian and Rossi, 2007; Liu et al., 2012; Mak et al., 2007; Pitts et al., 1985a;
1985b; 1985c; Zimmermann et al., 2013) , NO2 (Brorstrom-Lunden and Lindskog, 1985; Butler and
Crossley, 1981; Guo and Kamens, 1991; Inazu et al., 1997; Jariyasopit et al., 2011; 2014; Ma et
al., 2011; Miet et al., 2009c; Nguyen et al., 2009; Perraudin et al., 2005; Pitts et al., 1978; Ramdahl
et al., 1984; Tokiwa et al., 1981; Wang et al., 2000; Zimmermann et al., 2013), , O3 (Brorstrom et
al., 1983; Kahan et al., 2006; Katz et al., 1979; 2004; Kwamena et al., 2006; Lane and Katz, 1977;
Lindskog et al., 1985; Miet et al., 2009b; Mmereki and Donaldson, 2003; Mmereki et al., 2004;
Perraudin et al., 2007; Pitts et al., 1977; 1980). Derived rate coefficients for these processes are
presented in Table A4 in Appendix 1.
The rate, mechanism and products of atmospheric gas-particle PAH reactions are shown to
depend strongly on the structure and UV-vis absorption spectra of the PAH compound as well as
the physical and chemical nature of the particle surface to which they are associated (Finlayson-
Pitts and Pitts, 2000; Keyte et al., 2013). Reactions with OH and NO3/N2O5 are indicated to be the
dominant pathway for heterogeneous degradation of PAHs compared with reactions with NO2 and
O3. However, loss rates are shown to be more comparable when expected atmospheric
concentrations of the oxidants are considered (Keyte et al., 2013).
Particles are shown to exhibit an ‘inhibiting factor’ on PAH reactivity (Estéve et al., 2004,2006; E.
Perraudin et al., 2007). For example OH reactions on carbonaceous particles are shown to
proceed 1-3 orders of magnitude lower than corresponding gas-phase reactions. This stabilisation
is shown to be variable between species and substrates and has been attributed to the relatively

52
slow diffusion of the oxidant or inaccessibility of PAHs in the bulk particle (Jariyasopit et al., 2014;
Zimmermann et al., 2013).
A wide variety of ring-opened and ring-retaining products have been identified from heterogeneous
reactions of PAH including OPAH and NPAH compounds.
In some cases, a distinction is noted between the products of gas-phase and particle-phase
reactions. For example 1NPyr has been observed as a reaction product in the reaction of particle-
bound PAH (Miet et al., 2009c; Ramdahl et al., 1984; Wang et al., 2000), which is not observed in
gas-phase reactions.
However, other OPAH and NPAH e.g. 2NFlt, 2NPyr have been observed in both gas-phase and
particle-phase reactions (Arey et al., 1986; Atkinson et al., 1990a; Inazu et al., 1997; Ringuet et al.,
2012b). Reaction pathways in the formation OPAH (Figure 1.14) and NPAH (Figure 1.15) products
have been proposed for reactions of NO2 and O3 respectively (Keyte et al., 2013).
Heterogeneous PAH reactivity with atmospheric oxidants is complex and is influenced by a number
of factors including the PAH molecule, the nature (chemical composition, surface area, porosity) of
the matrix, presence of other species (e.g. nitric acid, water or other organic species), oxidant
concentration, and PAH surface concentration (Keyte et al., 2013 and references therein). For
example, the reactivity of PAHs towards NO2 is shown to be enhanced by the presence of nitric
acid and/or HNO2 gas on the particle surface (see Figure 1.15).
It is suggested from these studies that particle-phase reaction can contribute to PAH degradation
and OPAH or NPAH formation in the atmosphere. However, the wide diversity in chemical
composition (organic, mineral, biogenic), sources (combustion, erosion, gas phase condensation),
origin (natural, anthropogenic), formation conditions (temperature, pressure), physical properties
(size, porosity, specific surface area) and surface coatings (water, nitric acid, organic molecules) of
particles mean heterogeneous PAH reactivity will be extremely difficult to predict or assess in the

53
ambient atmosphere and the relative importance of these factors will be highly variable across
different environments (Keyte et al., 2013).
Figure 1.14. Suggested mechanisms for the heterogeneous reaction of anthracene with O3
(Mmereki et al., 2004). Originally presented in Keyte et al. (2013).
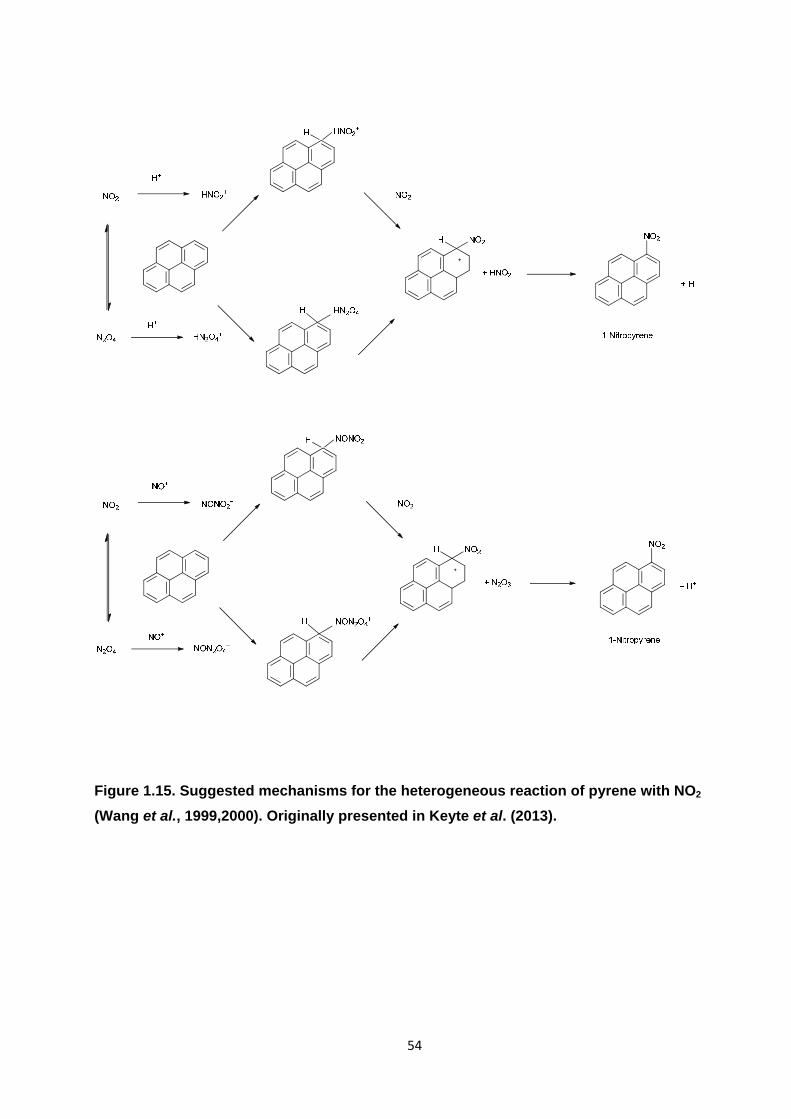
54
Figure 1.15. Suggested mechanisms for the heterogeneous reaction of pyrene with NO2
(Wang et al., 1999,2000). Originally presented in Keyte et al. (2013).
55
1.5.3.3. Evidence for PAH reactions in ambient air samples
Laboratory investigations strongly indicate that gas- and particle-phase atmospheric reactions of
PAHs can contribute to observed atmospheric levels of NPAH and OPAH. However, the
applicability of laboratory data in the ambient environment is uncertain. For example recent studies
observing heterogeneous formation of NPAHs on atmospheric PM from reactions of PAH with
NO3/NO2/N2O5 have used oxidant concentrations that are >100 times higher than typically
observed in the ambient atmosphere (Jariyasopit et al., 2014; Zimmermann et al., 2013).
A number of ambient sampling approaches, in addition to or in conjunction with, laboratory reaction
kinetics data, have been conducted to answer the key questions : i) To what extent do PAH
reactions occur under ambient atmospheric conditions? ii) What is the relative contribution of
reactions to observed atmospheric levels of OPAH and NPAH compared with primary combustion
emissions?
As discussed by Keyte et al. (2013), the position on the aromatic ring where PAH oxidation or
nitration occurs will determine the specific OPAH or NPAH isomer formed. Differences in NPAH
formation mechanism between combustion and atmospheric photoreaction processes are
observed leading to distinct NPAH isomer distributions. Assessing the relative levels of these
different NPAH isomers in the ambient atmosphere could therefore indicate the relative
contribution of primary and secondary inputs.
For example, in the case of Pyr and Flt, electrophilic nitration, expected to occur during primary
combustion processes (Nielsen, 1984; Ruehle, 1985) is shown to produce 1NPyr and 3NFlt. 1NPyr
has been identified in a number of combustion sources but is not observed as a gas phase
reaction product, making it suitable as a marker for direct emissions (IARC, 1989). Conversely, the
products of the gas phase OH and/or NO3 radical initiated reactions are 2NPyr and 2NFlt (Atkinson
and Arey, 1994), which are typically not observed in primary combustion emissions.
56
2NFlt has been observed in a direct industrial emission from carbon electrode manufacture (Liberti
and Ciccioli, 1986) but this is not considered to be a major contributor on a large scale. (Zhu et al.,
2003) also identified 2NFlt in diesel vehicle emissions but with an emission rate significantly lower
(~0.2%) than that of 1NPyr.
Due to their distinct origins, the ratio of 2NFlt to 1NPyr concentration ratio can be used to assess
the relative contributions of atmospheric reactions (OH and/or NO3) and direct emissions (Ciccioli
et al., 1989; Ciccioli et al., 1996; Feilberg et al., 2001; Marino et al., 2000; Wang et al., 2011a).
Similarly, isomer profiles of NPAH products of Nap, methyl-Naps and ethyl-Naps (Reisen and Arey,
2005; Wang et al., 2010) as well as nitro-triphenylenes (Kameda, 2011) have also been used to
assess the relative importance of daytime OH and nighttime NO3 reactions and primary emissions.
The ratios of OPAH or NPAH to their parent PAH in ambient samples and the temporal or seasonal
trend in these ratios have also been used to assess the relative importance of atmospheric
reactions (Alam et al., 2013; 2014; Reisen and Arey, 2005; Walgraeve et al., 2010).
Diurnal profiles of NPAH and OPAH have been shown to be distinct from those of PAH (Hien et al.,
2007; Reisen and Arey, 2005; Tsapakis and Stephanou, 2005). Studies suggest that profiles of
PAH and 1NPyr are driven by emission strength and losses due to reactivity, while 2NFlt and
2NPyr are driven by atmospheric formation and loss processes.
(Kojima et al., 2010) observed strong correlations between OPAH concentrations and primary
emissions such as PAHs and CO in Tokyo in winter, while a much weaker correlation was
observed in summer. Concentration ratios in summer:winter were shown to be higher for 2NFlt
(0.36) than for 1NPyr (0.19-0.27), indicating the relative dominance of direct emissions in winter
and a greater importance of atmospheric reactivity in summer.
The ratio of ‘night time’ to ‘daytime’ PAH concentrations measured in the atmosphere have been
shown to correlate with OH radical reaction rate coefficients, with the largest ratios being observed
for PAHs most reactive towards OH radicals (Arey et al., 1989a; Phousongphouang and Arey,
2002).
57
Atmospheric levels of NPAHs have been predicted based on calculations using experimental data
(OH reaction rate coefficients, NPAH formation yields, measured parent PAH concentrations and
NPAH photolysis rate) and have been observed to be in good agreement with concentrations in
ambient air samples (Arey et al., 1990; Atkinson and Arey, 2007). Furthermore, the concentration
profile of NNap, methyl-NNap, dimethyl-NNap and ethyl-NNap isomer product profiles observed in
laboratory OH and NO3 reaction experiments have been shown to closely resemble those of
daytime (Reisen et al., 2003) and nighttime (Gupta et al., 1996) profiles from ambient sampling
respectively.
While PAH levels are shown to be higher in urban areas during winter compared to summer,
OPAH and NPAH levels have been observed at higher levels downwind of an urban source area in
summer (Reisen and Arey, 2005) indicating the influence of photochemical reactions. Eiguren-
Fernandez et al. (2008b) investigated the changes in phenanthrequinone (PQ) concentration with
increasing distance downwind of the highly polluted Los Angeles basin. A significant increase in
PQ concentration was observed along this trajectory with an estimated ~90% of PQ at the receptor
site resulting from photochemical reactions.
1.5.4. Reactions of OPAH and NPAH
It is indicated that reaction with OH, NO3 and O3 is not a significant loss process for gas-phase
NPAHs or OPAHs (Atkinson et al., 1989). Photodegradation is considered to be the primary loss
process for NPAH in the atmosphere in both gas- and particle-phases (Atkinson et al., 1989; Fan
et al., 1995; Fan et al., 1996a; Feilberg and Nielsen, 2000; Phousongphouang and Arey, 2003a).
While photolysis is expected to be the major loss process for during daylight hours, particle-bound
NPAHs are shown to react with O3, which could present an additional degradation pathway at night
(Fan et al., 1996b; Miet et al., 2009b; Ringuet et al., 2012b).
Heterogeneous formation and decay have been observed for NPAHs due to reactions of OH, and
O3/NO2 on natural aerosol particles (Ringuet et al., 2012b). The reaction particle-associated NPAH
58
and OPAH compounds with NO3 have been observed and product identification has been noted
(Zhang et al., 2011) but this has not been investigated in terms of a potential atmospheric loss
process.
Relatively few data are available on the reaction processes of OPAHs in the atmosphere. Kamens
et al. (1989) indicated that OPAHs such as AQ on wood smoke particles are relatively stable
towards photolysis but are shown to decay when exposed to O3. (Ringuet et al., 2012b)
demonstrated OPAHs are also degraded by OH radicals on natural aerosol particles. However, the
kinetics of these processes are yet to be fully investigated.
1.6. Project aims and objectives
This introductory section has highlighted the following issues :
PAHs, OPAHs and NPAHs are important pollutants influencing ambient air quality and public
health, particularly in urban areas where source strength and population density is greatest. These
compounds are likely to present a substantial toxic hazard, comprising a potentially important
proportion of the mutagenicity and/or carcinogenicity of ambient air. An appropriate understanding
of their sources, behaviour and fate is required in order to assess the exposure and risk presented
to humans and the wider environment.
PAHs, OPAHs and NPAHs display a wide range of physiochemical properties and can exist in both
gas-phase and associated with atmospheric particulate matter. The nature and extent of their
atmospheric processing will largely dictate their overall fate in the environment and the extent of
human exposure.
PAHs are emitted to the atmosphere via incomplete combustion of organic materials, mainly due to
anthropogenic activities. The concentration of PAHs in the U.K. has declined significantly in the
past 25 years, which has resulted in a shift in relative source profile. Current emissions are
dominated by domestic wood combustion and vehicular traffic.

59
OPAH and NPAH can result both from primary combustion emissions and secondary input from
gas-phase and heterogeneous reactions of PAH with atmospheric oxidants (e.g. OH, NO3,and O3)
Therefore assessing the sources and behaviour of these compounds is rather more complex.
PAH atmospheric reactivity is dependent on the specific PAH molecule, the concentration of
atmospheric oxidants, the concentration and nature of particulate matter and the degree of phase
partitioning. While the extent to which reactions can produce OPAH and NPAH compounds has
been widely investigated in laboratory studies, limited work has been done in terms of field studies
of the ambient atmosphere.
While, PAHs have been monitored in the UK atmosphere for over 25 years, and much has been
learned regarding their long- and short-term trends, much less is known regarding the levels of
OPAH and NPAH in the U.K. atmosphere and the factors influencing their input and loss.
The overall aim of this project was to investigate the concentrations of PAHs as well as key OPAH
and NPAH derivative compounds in the U.K. urban atmosphere, and to interpret their observed
levels and atmospheric behaviour to assess the importance of different primary (e.g. emissions
from road traffic or other combustion activities) or secondary (e.g. reactive formation) sources and
atmospheric sinks of these compounds.
The specific objectives of the project were to :
Measure concentrations of PAHs, OPAHs and NPAHs at urban background and trafficked
sites and investigate their sources, behaviour and trends and the factors governing these
processes.
Investigate temporal trends and assess potential factors affecting long- and short-term
variations in observed concentrations, with particular reference to changes in overall and
relative source profiles.
Obtain a ‘traffic profile’ for target compounds from a trafficked environment to compare with
ambient locations in order to gain a clearer understanding of the influence of primary traffic
60
sources to observed atmospheric concentrations in comparison with other input and loss
mechanisms.
Obtain a diurnal profile for target compounds to provide more insight into the sources,
meteorological factors and degradation processes influencing observed concentrations.
Investigate the potential influence of atmospheric reactions on the levels of OPAH and
NPAH in comparison with primary combustion emissions.
Carry out a source apportionment analysis of PAH, OPAH and NPAH compounds using
positive matrix factorisation (PMF).
61
Chapter 2 : Methodology
2.1. Sampling Procedure
2.1.1. Background
2.1.1.1. Overview
PAHs, OPAHs and NPAHs are present in the atmosphere in both particulate and gaseous phases
and have the propensity to partition between the two phases (as discussed in Section 1.4.2). It is
desirable, therefore, to collect samples of both gas-phase and particle-phase PAH simultaneously
to gain clearer insights into key processes driving their atmospheric behaviour and fate (e.g. phase
partitioning, chemical reactivity and/or wet and dry deposition).
It is now common for air samples to be collected using high-volume air samplers adapted to collect
both particle-phase and gas-phase pollutants separately (Finlayson-Pitts and Pitts, 2000). In this
method, a motor-driven pump draws air through the inlet at the top of the sampler; the air passes
first through a filter where airborne particulates are deposited, followed by an absorbent material to
collect gas-phase components downstream (Finlayson-Pitts and Pitts, 2000 ; see Figure 2.2b).
This approach has been utilised in a large number of ambient sampling studies for PAHs
(Dimashki et al., 2000; 2001; Harrad and Laurie, 2005; Harrison et al., 2003; Keller and Bidleman,
1984; Smith and Harrison, 1996; Wilson et al., 1995) as well as OPAHs and NPAHs (Albinet et al.,
2007a; 2008a; Bamford and Baker, 2003; Liu et al., 2006b; Wilson et al., 1995). This sampling
approach was utilised in the present investigation.

62
2.1.1.2. Particle-phase sampling
Particle-bound PAH compounds have been collected on a variety of different filter types (Liu et al.,
2007) including :
Glass fibre filters (GFFs) (Bamford and Baker, 2003; Barrado et al., 2012; Bi et al., 2005;
Feilberg et al., 2001; Kim et al., 2012; Lin et al., 2002; Simcik et al., 1998);
Polytetrafluoroethylene (Teflon) membrane filters (TMFs) (Alam et al., 2013; Delgado-
Saborit et al., 2013; Ligocki and Pankow, 1989; Smith and Harrison, 1996) ;
Teflon coated glass fibre filters (TGFFs) (Alam et al., 2013; Allen et al., 1997; Arey et al.,
1987; Delgado-Saborit et al., 2013; Dimashki et al., 2000; 2001; Feilberg et al., 1999;
Harrad et al., 2003; Harrad and Laurie, 2005; Harrison et al., 2003; Ligocki and Pankow,
1989; Lim et al., 1999; Reisen and Arey, 2005; Smith and Harrison, 1996);
Quartz fibre filter (QFFs) (Fraser et al., 1998b; Lee et al., 2012; Nassar et al., 2011; Ringuet
et al., 2012a; 2012c; Sienra, 2006; Wilson et al., 1995).
Quartz fibre filters were chosen in the present study due to their relative cheapness and availability
as well as their high retention efficiency and compatibility with available sampling equipment.
2.1.1.3. Gas-phase sampling
The desired sorbent material for collecting the gas-phase component should have large absorption
capacity, low airflow resistance, reasonable chemical stability and ease of preparation and
handling (Liu et al., 2007). Common sorbent materials used to collect gaseous PAHs include :
Tenax-GC and Tenax-TA solid absorbents (Arey et al., 1989a; Baek et al., 1991; Hart and
Pankow, 1994);
XAD material (Alam et al., 2013; Delgado-Saborit et al., 2013; 2014; Eiguren-Fernandez et al.,
2008a; Wilson et al., 1995);
63
Polyurethane foams (PUFs) (Albinet et al., 2008a; Bamford and Baker, 2003; Dimashki et al.,
2000; 2001; Harrad and Laurie, 2005; Harrison et al., 1996; Kim et al., 2012; Reisen and Arey,
2005; Yamasaki et al., 1982).
PUF are commonly used due to their advantages of low-cost, ease of preparation and handling.
Flame retardant (FR)-free PUF material is preferable as this will reduce air flow resistance and
content of impurities in sample extracts. However, some breakthrough of LMW through PUFs can
occur (Arey et al., 1989a). As noted by Finlayson-Pitts and Pitts (2000), PUFs may not be suitable
for sampling highly volatile 2-ring PAH e.g. Nap and methyl-Nap (MNap) isomers. Indeed,
evidence of significant evaporative losses of Nap, 1MNap and 2MNap was observed during the
present study (see Section 6.1 for a discussion) therefore the concentrations of these compounds
were not included in the results of this study.
A number of studies have utilised diffusive denuders for the sampling of PAH, OPAH and NPAH
(Delgado-Saborit et al., 2013; 2014; Eiguren-Fernandez et al., 2003; Goriaux et al., 2006; Liu et
al., 2006b; Tsapakis and Stephanou, 2003). Denuders collect the gas-phase component using a
solid sorbent coated on the surface of the trap, with the particulate-phase component collected on
a filter downstream. These can therefore provide the dual function of separating out the gas- and
particle-phase components of semi-volatile species (e.g. PAHs) and removing reactive oxidant
species (e.g. O3) to prevent transformation of species during sampling (Delgado-Saborit et al.,
2014).
For example, the design of sampling system utilising a micro orifice uniform deposit impactor
(MOUDI) to collect the particulate phase with upstream multi-parallel denuder plates coated with
XAD-4 to collect the gas phase component has been described (Delgado-Saborit et al., 2014;
Eiguren-Fernandez et al., 2003). This approach has been demonstrated to perform accurate,
repeatable sampling with low-denuder breakthrough. However it has been noted that artefact
formation (see Section 2.1.6) occurred during both denuded and un-denuded sampling (Delgado-
Saborit et al., 2014; Eiguren-Fernandez et al., 2003).

64
Liu et al. (2006b) measured atmospheric PAH and OPAH concentrations using samplers with and
without a MnO2 denuder. The undenuded sampler was shown to underestimate PAH
concentrations and overestimate HMW OPAH concentrations. The authors attributed this to the
occurrence of PAH reactivity with oxidants such as O3 during sampling. However, higher
concentration of LMW OPAH e.g. 9F and AQ were found on the filters of denuded samplers,
suggesting catalytic formation on the denuder surface. Therefore OPAH artefact can be formed in
both denuded and undenuded samplers.
Furthermore, the flow rate achieved by a MOUDI sampler would sample <50 m3 of air in a 24 hour
period. While this would be adequate to obtain a sample large enough to provide analytically
detectable levels of PAH and OPAH (Alam et al., 2013; Delgado-Saborit et al., 2014), this may not
provide detectable concentrations of some NPAH compounds, which are typically observed at
much lower (~1-2 orders of magnitude) concentrations. Therefore a non-denuded sampling system
was used in the present study.
2.1.2. Sampling sites
The sampling locations for the principal campaigns in this study were situated on the University of
Birmingham campus (Latitude: 52.4797; Longitude: -1.8965). The University is located
approximately 3 km south of Birmingham city centre (see Figure 2.1).
Air sampling was conducted at two sites termed the Bristol Road Observatory Site (BROS) and the
Elms Road Observatory Site (EROS). BROS is located on the south edge of the University
adjacent to the A38 main road (Bristol Road). This road is a major commuting route to Birmingham
city centre, with approximately 27,000 vehicles passing by per day, as estimated by the
Department of Transport (http://www.dft.gov.uk/traffic-counts).

65
Figure 2.1a. Locations of Birmingham sampling and monitoring sites used in the present
investigation. West Midlands conurbation (upper) and central Birmingham (lower). Obtained
from Ordnance Survey Getamap online resource.
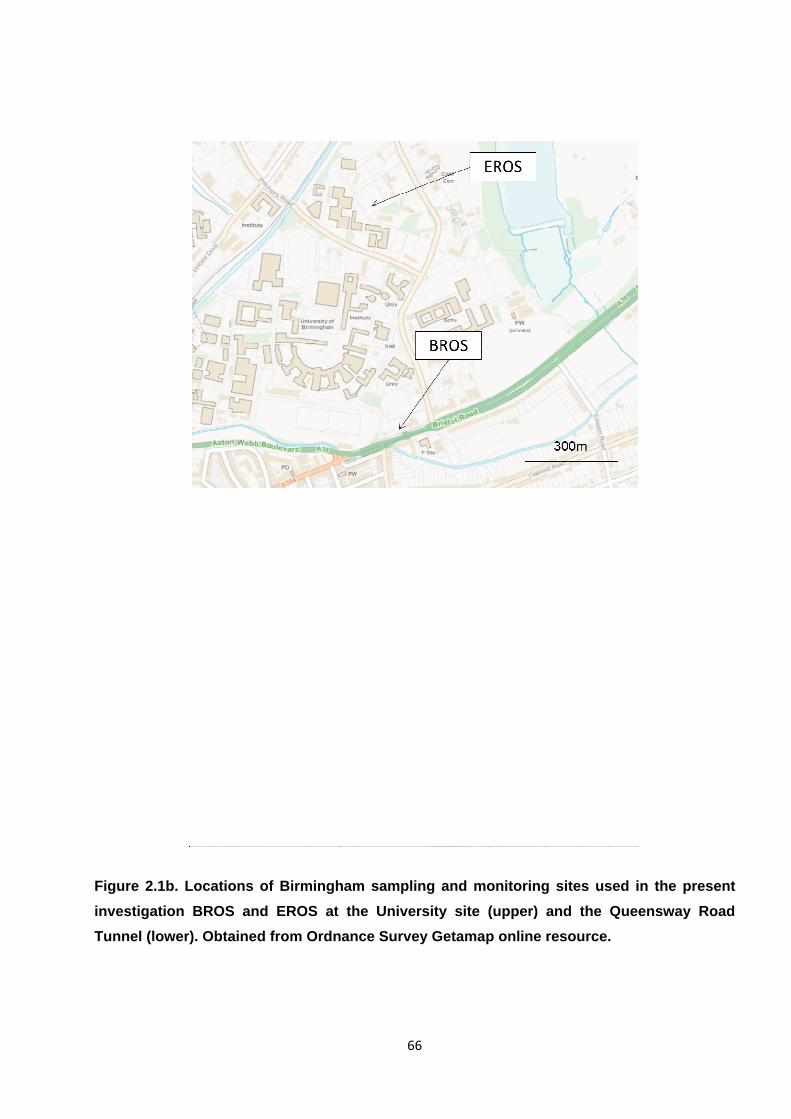
66
Figure 2.1b. Locations of Birmingham sampling and monitoring sites used in the present
investigation BROS and EROS at the University site (upper) and the Queensway Road
Tunnel (lower). Obtained from Ordnance Survey Getamap online resource.
67
It is assumed that, due to the proximity of this site to a major traffic emission source, this site acts
as a ‘polluted’ site. EROS is located on the north-west side of the campus in an open field ~1km
north of BROS. The lack of major primary pollution sources in close proximity allows EROS to act
as an ‘urban background’ site.
2.1.3. Sampling campaigns
The project consisted of a number of individual sampling campaigns at the sites described in
Section 2.1.2. Details (e.g. dates, times, meteorological conditions) for all individual samples taken
during these campaigns are presented in Table 2.1 and a description of the different campaigns is
provided below.
2.1.3.1. Campaign 1 : seasonal 24 hour sampling
For the principal period of this study, sampling was conducted during specific seasonal campaigns
in October 2011 (autumn) ; Jan-Feb 2012 (winter) ; April-May 2012 (spring) ; and July 2012
(summer). ~24 hour air samples were collected simultaneously at the BROS and EROS sites on
weekdays during these campaigns. Samples were taken using high volume air samplers (Tisch
Environmental Inc., Cleves, Ohio, USA) adapted to sample both particle-phase and gas-phase
pollutants. The appearance and design of these samplers is shown in Figure 2.2.
Total particulate matter was collected on quartz fibre filters (Whatman Int. Ltd, UK, obtained from
VWR International Ltd, Lutterworth, Leicestershire, UK ; dimensions, 8” x 10”; retention efficiency
>99%), loaded inside a slotted metal filter plate (filter holder). Gas-phase sample was collected
using cylindrical PUF plugs (dimensions 3” x 3 3/8”, FR-free, Tisch Environmental Inc., Cleves,
Ohio, USA). Two PUF plugs were loaded in series inside a cylindrical metal tube (PUF holder)
fitted below the filter holder. This sampling apparatus was enclosed inside an aluminium casing to
shelter equipment from sunlight and rainfall.

68
Table 2.1. Dates, approximate times and average meteorological parameters, temperature
(T), relative humidity (RH), pressure (PRES), solar radiation (SRAD), rainfall (RF), wind
speed (WS), wind direction (WD) for all samples taken during this investigation.
Start Date
Start Time
approx.
End Date End Time
approx.
T (oC)
RH (%)
PRES (hPa)
SRAD (W/m2)
RF (mm)
WS (m/s)
WD (deg)
Campaign 1 A1 18/10/11 11:58 19.10/11 12:30 7.6 69.8 1013 200 0.0 1.9 256 A2 19/10/11 14:10 20/10/11 14:20 6.2 74.7 1023 222 0.2 1.2 269 A3 01/11/11 11:30 02/11/11 11:46 9.7 87.1 1009 170 0.2 1.3 190 A4 03/11/11 11:35 04/11/11 11:39 12.6 92.4 995 79 7.0 1.1 173 W1 08/02/12 13:34 09/02/12 09:30 -1.4 81.6 1035 91 0.0 1.1 162 W2 09/02/12 15:55 10/02/12 16:07 -0.4 91.8 1033 33 1.2 1.0 157 W3 15/02/12 13:31 16/02/12 13:55 7.5 71.9 1026 111 0.0 1.8 290 W4 20/02/12 10:00 21/02/12 10:14 6.2 78.4 1025 93 0.0 2.6 221 W5 21/02/12 12:10 22/02/12 12:49 8.2 82.4 1022 43 0.8 3.7 215 W6 22/02/12 14:48 23/02/12 15:19 12.0 85.0 1019 181 0.4 2.4 234 W7 27/02/12 08:55 28/02/12 09:27 9.9 87.6 1021 57 1.0 1.6 246 Sp1 30/04/12 09:07 01/05/12 09:30 12.1 72.9 999 145 8.4 2.9 41 Sp2 01/05/12 09:45 02/05/12 09:55 8.7 94.7 1003 46 3.2 1.6 43 Sp3 02/05/12 10:18 03/05/12 10:22 9.9 74.9 1000 127 1.4 2.5 33 Sp4 03/05/12 10:43 04/05/12 11:22 6.4 93.8 994 34 7.6 0.9 37 Sp5 07/05/12 10:11 08/05/12 10:25 11.9 62.4 991 219 0.0 1.4 118 Sp6 08/05/12 10:44 09/05/12 10:52 11.9 62.4 991 219 0.0 1.4 118 Sp7 16/05/12 10:31 17/05/12 11:00 8.6 65.1 1004 167 0.0 0.9 90 Su1 05/07/12 13:33 06/07/12 13:47 17.5 77.6 993 106 0.4 0.9 86 Su2 09/07/12 09:53 10/07/12 09:54 14.5 82.7 995 113 1.8 1.0 130 Su3 12/07/12 13:17 13/07/12 13:30 13.6 88.7 989 107 12.8 1.0 76 Su4 17/07/12 09:50 18/07/12 10:22 17.2 80.9 1001 160 0.6 2.8 115 Su5 23/07/12 10:02 24/07/12 09:59 19.2 65.9 1003 324 0.0 1.6 118 Su6 26/07/12 11:50 27/07/12 12:10 20.0 66.1 999 265 0.0 1.1 105 Su7 30/07/12 11:08 31/07/12 11:13 13.5 72.5 998 205 4.6 1.3 116
Campaign 2 D1 07/08/12 07:08 07/08/12 11:11 15.1 84.1 1002 232 0.2 1.9 117 D2 07/08/12 11:25 07/08/12 15:29 18.5 60.5 1003 536 0.0 2.5 117 D3 07/08/12 15:44 07/08/12 18:36 16.3 74.3 1003 141 0.0 2.5 111 D4 07/08/12 18:50 07/08/12 06:57 14.6 94.0 1004 15 1.8 0.5 89 D5 08/08/12 07:13 08/08/12 10:46 17.1 78.2 1005 274 0.0 0.8 95 D6 08/08/12 11:01 08/08/12 15:05 19.6 59.2 1006 417 0.0 1.1 115 D7 08/08/12 15:21 08/08/12 18:37 20.8 50.2 1006 286 0.0 0.8 131 D8 08/08/12 18:52 08/08/12 06:50 13.9 89.2 1007 18 0.0 0.3 45 D9 09/08/12 06:55 09/08/12 10:48 18.6 60.4 1009 508 0.0 1.1 69 D10 09/08/12 11:02 09/08/12 14:52 22.1 44.9 1009 622 0.0 1.2 109 D11 09/08/12 15:07 09/08/12 18:51 22.3 42.0 1008 287 0.0 0.9 89
Campaign 3 Q1 11/09/12 07:36 12/09/12 07:34 10.5 70.9 998 152 0.6 1.6 126 Q2 12/09/12 07:44 13/09/12 07:36 10.8 80.3 999 118 3.0 1.6 133 Q3 13/09/12 07:45 14/09/12 unk 14.7 69.2 998 179 0.0 2.7 121 Q4 18/09/12 09:22 19/09/12 09:10 9.8 68.6 1001 155 0.2 1.6 136
Artefact Campaign AR1 01/10/13 10:20 02/10/13 10:35 14.4 81.3 1000 90 0.0 0.9 130 AR2 04/10/13 16:40 05/10/13 17:00 14.1 78.7 993 43 0.8 1.3 63 AR3 08/10/13 09:30 09/10/13 09:30 14.9 74.4 1006 100 0.0 1.3 133 unk = unknown

69
Figure 2.2a. High volume sampler at the EROS location.
Figure 2.2b. Schematic diagram of a high volume sampler used in the present investigation.
Adapted from Finlayson-Pitts and Pitts (2000).

70
PUF and filter holders were pre-rinsed with solvent prior to loading PUFs and filter. Filters were
pre-treated by heating at 450oC for 24 hours and were accurately weighed before and after
sampling in order to obtain TSP concentration for collected samples. PUFs were pre-cleaned by
ultrasonication twice (30 minutes) in a solvent mixture of DCM, hexane and methanol (1:1:1 by
volume) followed by ultrasonication in hexane only (60 minutes).
Sampler flow rates were calibrated according to manufacturer guidelines (Tisch TE-5000
Operations Manual). Sampler calibrations were carried out each time a sampler motor was
changed. The procedure for sampler calibration is described in detail in Appendix 2. Air flow rates
during sampling were measured using a flow chart recorder and manometer readings were taken
at the beginning and ending of sampling duration to assess change in flow rate during sampling.
Total air volume sampled during ~24 hour sampling periods during this study varied from ~800-
1200 m3.
After sampling, filters and PUFs were removed from the filter plate or PUF holder using pre-
cleaned stainless steel forceps, wrapped in aluminium foil and transported to the laboratory in a
cool box. Samples were contained inside a sealed polythene bag and stored at -10oC prior to
extraction and analysis.
2.1.3.2. Campaign 2 : diurnal sampling study
A diurnal sampling study was conducted at the BROS and EROS sites on August 7th, 8th and 9th
2012. Sampling during this campaign was conducted following the procedure detailed in Section
2.1.3.1.
Multiple samples were collected on these days to assess how concentrations of target pollutants
vary throughout the day in response to different factors (variations in primary emission strength,
levels of other gaseous pollutants, and meteorological conditions). The sampling times in this
campaign were as follows (specific times of each sample are presented in Table 2.1) :
71
07:00 – 11:00 (morning) – period of ‘rush hour’ with maximum traffic flow
11:00 – 15:00 (daytime) – period of maximum sunlight/radiation levels, lower traffic flow
15:00 – 19:00 (afternoon) – period of temperature maxima and afternoon traffic input
19:00 – 07:00 (night-time) – period of low traffic and absence of sunlight
2.1.3.3. Campaign 3: Queensway Road Tunnel sampling study
As discussed in Section 1.4.6.2, it is important to obtain an accurate traffic profile of traffic-related
PAH emissions in order to assess the relative importance of these compounds in the urban
atmosphere. Road tunnels are expected to provide an ideal environment to assess traffic
emissions of PAHs as the tunnel is assumed to be an ‘enclosed’ atmosphere containing only
diluted exhausts from a realistic mixture of on-road vehicles.
The aims of this campaign were to :
Measure levels of selected PAHs, OPAHs and NPAHs in a road tunnel.
Obtain a ‘traffic signature’ for these compounds for comparison with ambient
measurements.
Assess the temporal trend of these compounds in the tunnel and relate this to observed
changes in traffic characteristics.
A sampling campaign was conducted inside the Queensway Road Tunnel (see Figure 2.1b) in
central Birmingham in September 2012. The tunnel passes under Birmingham city centre,
providing a main through route for the A38 dual carriageway, which constitutes part of the A4400
inner city ring road. The tunnel is approximately 544m long with natural ventilation (Amey,
pers.comm.). The speed limit in the tunnel is 30 mph. The average number of vehicles passing

72
through the tunnel per day is estimated to be 89,000. This value is an estimate for 2010
extrapolated from Birmingham City Council data from 2005 (Amey, pers. comm.).
24 hour air samples were collected during this campaign, following the procedure detailed in
Campaign 1. The sampler was set up in an emergency breakdown lay-by in the southbound
section of the tunnel. The two carriageways were separated by a concrete dividing wall.
Concurrent sampling was conducted at EROS to provide ‘background’ concentrations to be
subtracted from the tunnel concentrations to calculate a ‘traffic’ concentration.
2.1.4. Meteorological data
For sampling periods during each campaign, mean values for key meteorological parameters
(temperature, pressure, relative humidity, wind speed, wind direction, solar radiation), as well as
total rainfall, were measured. These data were obtained from the Elms Cottage Automated
Weather Station, which is located adjacent to the EROS sampling site. These data are used for
both EROS and BROS samples.
2.1.5. Inorganic gaseous pollutants
For each sampling period during each campaign, mean concentrations of key gaseous pollutants
(NOx , O3 and SO2) were obtained. These data were derived from measurements at the
Birmingham Tyburn monitoring site (UKA00479), operated as part of the Defra Automatic Urban
and Rural Network (AURN) (http://uk-air.defra.gov.uk/networks). Birmingham Tyburn is located to
the north-west of Birmingham city centre (see Figure 2.1a) and is designated an ‘urban
background’ site.
73
2.1.6. Quality control : the potential impact of sampling artefacts
Ambient sampling of PAHs using the filter/sorbent technique, as performed in the present study,
can be subject to positive or negative ‘artefacts’ that may lead to significant deviations away from
‘true’ concentrations present in the atmosphere, particularly for semi-volatile 3-4 ring compounds
(Finlayson-Pitts and Pitts, 2000 and references therein). This can be caused by disruptions in gas-
particle partitioning equilibrium or by chemical reactivity of adsorbed PAHs during sampling.
2.1.6.1. Gas-phase vs. particle-phase artefacts
Two key phenomena can occur during a relatively long (i.e. 24 hr) sampling study to disrupt
‘natural’ gas-particle phase equilibrium conditions, thus creating sampling artefacts (Finlayson-Pitts
and Pitts, 2000 and references therein) :
i) Vapour-phase PAH can adsorb to the filter or adsorbed particles due to either a decrease in
temperature or increase in pollutant concentration during sampling (Finlayson-Pitts and Pitts, 2000
and references therein). This would therefore overestimate particle-phase concentrations and
underestimate gas-phase concentrations. For example, Hart and Pankow (1994) demonstrated
that the use of quartz fibre filters can lead to gas-phase adsorption leading to an overestimation of
the particle-phase component by a factor of 1.3 to 1.6.
ii) Volatilisation (“blow off”) of PAH collected on filter and/or breakthrough of ultrafine particles
though the filter and collection by the absorbent can occur (Kavouras et al., 1999; Wilson et al.,
1995). This may result from temperature increase, concentration decrease or drop in pressure
during sampling. This would result in an underestimate of particle-phase PAH and an overestimate
of gas-phase PAH concentrations (Finlayson-Pitts and Pitts, 2000 and references therein).
2.1.6.2. Chemical reactivity during sampling
As discussed in Section 1.5.3 PAH degradation and OPAH or NPAH formation on solid surfaces in
laboratory experiments has been observed to occur due to chemical reactions, for example with O3
74
(Brorstrom et al., 1983; Katz et al., 1979; Lane and Katz, 1977; Lindskog et al., 1985; Pitts et al.,
1978; 1980; 1986; Van Vaeck and Van Cauwenberghe, 1984) or NO2-N2O5-HNO3 (Jariyasopit et
al., 2014; Pitts et al., 1985b; Pitts et al., 1985c; Zimmermann et al., 2013).
If such chemical reactivity of filter-bound PAHs occurred during sampling, this could lead to
underestimation of PAH concentrations and overestimation of observed levels of OPAHs and
NPAHs formed. The occurrence and extent of this artefact formation during sampling experiments
has been investigated but is subject to a number of conflicting observations in the literature.
For example, several studies have reported contrasting or inconclusive results from O3 exposure
studies for PAHs deposited on glass filters, diesel exhaust particles and ambient particles
(Brorstrom et al., 1983; Grosjean, 1983). Coutant et al. (1988) reported that PAHs reacted readily
with O3 in laboratory studies, but no evidence was found for reaction of O3 with particulate matter
during the field sampling experiments.
In more recent studies (Goriaux et al., 2006; Liu et al., 2006b; Schauer et al., 2003; Tsapakis and
Stephanou, 2003) the impact of oxidation reactions during sampling on the concentrations filter-
bound PAHs and OPAHs has been investigated by sampling with and without an upstream
denuder to remove atmospheric oxidants.
These studies indicate ozonation reactions could result in an underestimation of particulate-phase
PAH concentrations by up to a factor 2. Furthermore, Liu et al. (2006) indicated particle-bound
concentrations of certain OPAHs (e.g. AQ and BaAQ) were 10-40% higher without a denuder,
indicating artefact formation of OPAHs due to the reaction of collected PAHs with ozone during
sampling.
Arey et al. (1988) observed formation of deuterated NPAHs on particulate samples deposited on
glass fibre filter surfaces pre-spiked with deuterated PAHs, collected in a sampling study for 7-10 h
with an NO2 concentration of ~160 ppb. However, the maximum NPAH formation rates observed
were generally very low (<3% for 1-nitropyrene-d9 ; 0.1% for 3-nitroperylene-d12) and no formation
of NFlt isomers was observed. It was concluded that formation of nitro-pyrenes and nitro-

75
fluoranthenes during high volume sampling does not significantly affect the measured
concentrations.
Similarly, Dimashki et al. (2000) carried out an artefact study in a road tunnel in Birmingham, UK. It
was observed that, even in this high NO2 environment (~0.2 ppmv) the maximum NPAHs artefact
formation during sampling was <0.1%. Formation of NPAH artefacts generally does not seem
problematic in high volume sampling studies.
Albinet et al. (2007b) measured concentrations of PAH, OPAH and NPAH using two different
samplers (cascade impactor and conventional hi-vol) during summer and winter periods. It was
shown that during winter, the sampler ‘underestimated’ concentrations of NPAHs by a factor of 3-4.
This was attributed to the heating of the sampler PM10 head during winter, causing enhanced
chemical degradation of particle-bound NPAHs collected on filters. No external heating was used
in the present study so it is assumed this level of degradation did not occur during sampling.
2.1.6.3. Artefact sampling experiment
An experiment to assess the potential influence of sampling artefacts on the results obtained in this
project was carried out. The aim of this experiment was to assess the extent to which sampling
artefacts may have affected the measured concentrations of PAHs, OPAH and NPAH compounds
during the sampling campaigns carried out in this project. This involved conducting a sampling
campaign to monitor the possible loss of PAHs from the filter and the formation of OPAH and
NPAH derivatives during sampling.
Details of the methodology and a discussion of observed results from this experiment can be found
in Section 4.4.
76
2.2. Sample extraction and clean-up
2.2.1. Materials and chemicals
All solvents (DCM, hexane, methanol) used in this study were HPLC grade (purity >98%), obtained
from Fisher Scientific UK Ltd. Sodium sulphate absorbent and aminopropyl solid phase extraction
tubes were obtained from Sigma-Aldrich Company Ltd., Gillingham, UK. Standards of
perdeuterated and native PAH and NPAH compounds (>98% purity in toluene or isooctane) and p-
terphenyl-d14 recovery standard (>99% purity, in toluene) were obtained from Greyhound
Chromatography, Merseyside, UK, as pre-prepared solutions by Chiron AS, Trondheim, Norway.
Perdeuterated and native OPAH internal standards and 1-fluoro-7-nitrofluorene recovery standard
(purity >98%) were obtained initially as solids from Sigma-Aldrich Company Ltd., Gillingham, UK
and solutions prepared by dilution with hexane. Methane gas (99.9% purity) was obtained from
Argo International Ltd, UK.
2.2.2. Sample preparation
The extraction, clean-up and preparation of samples prior to analysis was conducted according to
a standard operating procedure, previously produced by members of this research group
(Delgado-Saborit and Baker, 2006) incorporating a solid phase extraction step developed from
methods described by Albinet et al. (2006) and Cochran et al. (2012). All glassware was cleaned
using this procedure; soaked and cleaned in Lipsol detergent (SciLabware Ltd), rinsing with
deionised water and drying for >2 hr at 100 oC in a glass oven.
2.2.3. Sample extraction
2.2.3.1. Extraction background
Extraction of PAH and related compounds from environmental samples is commonly achieved
using an organic solvent such as dichloromethane (DCM), acetonitrile, benzene, toluene or
cyclohexane (Liu et al., 2007).
77
Soxhlet extraction using DCM or other solvents (e.g. acetonitrile/acetone/benzene) is a common
method (Becker et al., 2006; Dachs et al., 2002; Dimashki et al., 2001; Harrad et al., 2003; Harrad
and Laurie, 2005; Harrison et al., 2003; Kim et al., 2012; Lim et al., 1999) and NPAH and OPAH
derivatives (Andreou and Rapsomanikis, 2009; Arey et al., 1987; Bamford and Baker, 2003;
Bamford et al., 2003; Dimashki et al., 2000; Gibson, 1982; Marino et al., 2000; Sienra, 2006;
Wilson et al., 1995). This method is favoured due to high extraction efficiency (Yang, 1999),
however, this approach is time-consuming and solvent- and energy-intensive, requiring
considerable sample concentration prior to analysis (Liu et al., 2007).
Ultrasonication offers reduced extraction time (0.25 – 1.5 hr), and utilises less solvent (15-20 mL)
while maintaining satisfactory analyte recovery. This method has been utilised for PAH extraction
using DCM (Bi et al., 2003; 2005; Chetwittayachan et al., 2002; Guo et al., 2003; Hayakawa et al.,
2002; Ohura et al., 2004; 2005; Park et al., 2002; Schnelle-Kreis et al., 2001; Tang et al., 2005). as
well as toluene (Sharma et al., 2007) and dimethylformamide (DMF) (Mastral et al., 2003b)
Ultrasonication has also been used for the extraction of OPAHs and NPAHs using DCM (Allen et
al., 1997; Castells et al., 2003; Delgado-Saborit et al., 2013; Feilberg et al., 2001; Nielsen et al.,
1984; Schnelle-Kreis et al., 2001; Wei et al., 2012) as well as benzene/ethanol (3/1, v/v) (Hien et
al., 2007; Murahashi and Hayakawa, 1997; Nassar et al., 2011; Tang et al., 2002; 2005),
dichloromethane:acetonitrile (2:1 v/v) (Eiguren-Fernandez et al., 2008a) and methanol (Kishikawa
et al., 2006).
Pressurised liquid extraction has also been investigated for PAHs (Hien et al., 2007; Murahashi
and Hayakawa, 1997; Nassar et al., 2011; Tang et al., 2002; 2005) and OPAHs and NPAHs
(Albinet et al., 2006,2007a; 2008a; Wang et al., 2011a). However, this approach may lead to
chemical degradation or rearrangement (Lintelmann et al., 2006) and the reproducibility of this
method has been questioned (Walgraeve et al., 2010). Microwave-assisted extraction has also
been applied for PAH and OPAH compounds (Barrado et al., 2012; McDonald et al., 2002) but this
method is expensive and requires specific instrumentation.
78
Supercritical fluid extraction (SFE) has been shown to exhibit high extraction efficiency and good
selectivity (Peltonen and Kuljukka, 1995) and has been applied for extraction of PAHs (Jonker et
al., 2005; Romero et al., 2002; Shimmo et al., 2002; 2004a), OPAH and NPAH (Castells et al.,
2003). However, it has been noted that SFE displays poor recovery of polar compounds if CO2 is
used, so requires a multi-step process involving solvent modifiers (Shimmo et al., 2004a; 2004b).
2.2.3.2. Extraction method
In accordance with Delgado-Saborit and Baker (2006), one quarter of the filter from each sample
was used for extraction and analysis. Filters were cut into small pieces with a stainless steel
scalpel, placed inside a glass flask and spiked with a known amount of internal standard (IS)
mixture (deuterated PAH, NPAH and OPAH compounds; see Table 2.2 for details). Approximately
15 mL DCM was added and the flask was covered with aluminium foil to prevent any evaporative
loss of analyte and standard. PUFs were placed and compressed inside a large glass beaker and
spiked with a known amount of IS mixture. Approximately 300 mL dichloromethane was added for
PUF extraction.
Filter and PUF samples were extracted by ultrasonication in a water bath (~20oC, 30 minutes). Due
to the larger volume of solvent used in PUF extractions, samples were initially transferred to
Turbovap apparatus (Biotage Ltd, Uppsala, Sweden) and blown down under a gentle stream of
nitrogen (~20oC) to reduce sample volume ~5 mL prior to sample clean-up.
2.2.4. Clean-up
2.2.4.1. Clean-up background
Sample pre-treatment is a crucial step in order to remove impurities that may interfere with analysis
of target compounds and/or create a high GC baseline. Preliminary clean-up methods for PAH
compounds have been reviewed and discussed previously (Liu et al., 2007). PAHs can generally
undergo analysis without substantial clean-up, however, polar derivatives, particularly NPAH often
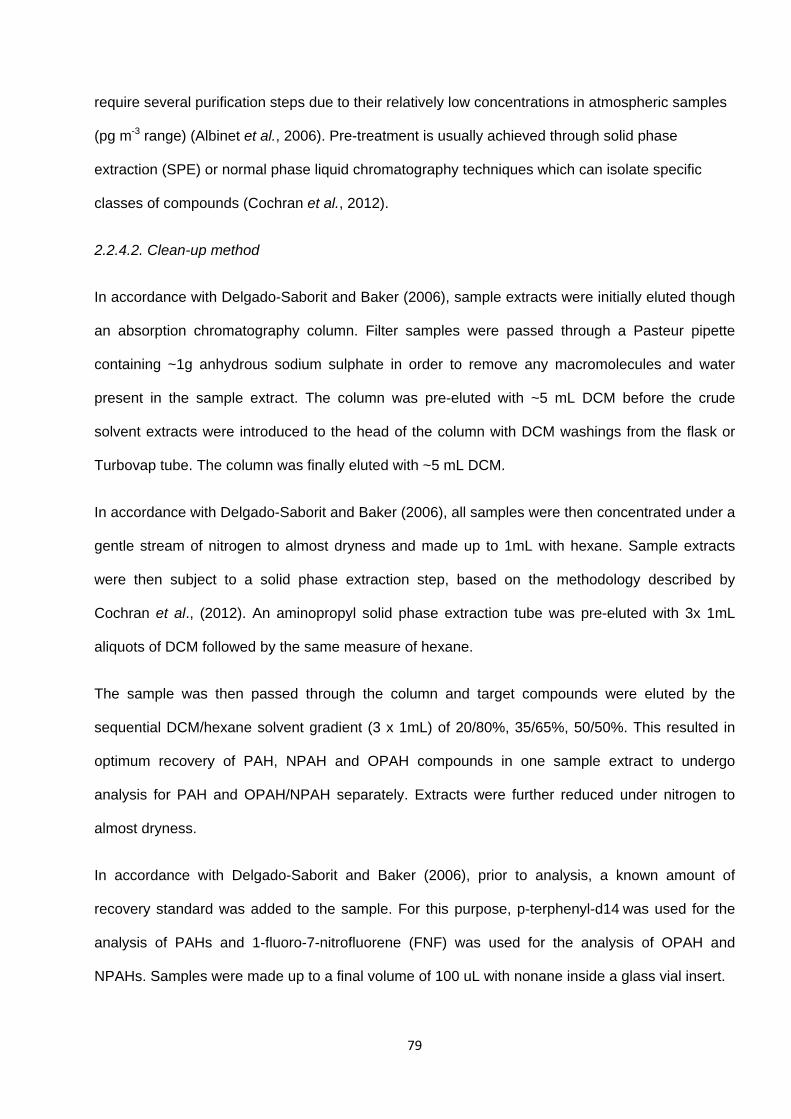
79
require several purification steps due to their relatively low concentrations in atmospheric samples
(pg m-3 range) (Albinet et al., 2006). Pre-treatment is usually achieved through solid phase
extraction (SPE) or normal phase liquid chromatography techniques which can isolate specific
classes of compounds (Cochran et al., 2012).
2.2.4.2. Clean-up method
In accordance with Delgado-Saborit and Baker (2006), sample extracts were initially eluted though
an absorption chromatography column. Filter samples were passed through a Pasteur pipette
containing ~1g anhydrous sodium sulphate in order to remove any macromolecules and water
present in the sample extract. The column was pre-eluted with ~5 mL DCM before the crude
solvent extracts were introduced to the head of the column with DCM washings from the flask or
Turbovap tube. The column was finally eluted with ~5 mL DCM.
In accordance with Delgado-Saborit and Baker (2006), all samples were then concentrated under a
gentle stream of nitrogen to almost dryness and made up to 1mL with hexane. Sample extracts
were then subject to a solid phase extraction step, based on the methodology described by
Cochran et al., (2012). An aminopropyl solid phase extraction tube was pre-eluted with 3x 1mL
aliquots of DCM followed by the same measure of hexane.
The sample was then passed through the column and target compounds were eluted by the
sequential DCM/hexane solvent gradient (3 x 1mL) of 20/80%, 35/65%, 50/50%. This resulted in
optimum recovery of PAH, NPAH and OPAH compounds in one sample extract to undergo
analysis for PAH and OPAH/NPAH separately. Extracts were further reduced under nitrogen to
almost dryness.
In accordance with Delgado-Saborit and Baker (2006), prior to analysis, a known amount of
recovery standard was added to the sample. For this purpose, p-terphenyl-d14 was used for the
analysis of PAHs and 1-fluoro-7-nitrofluorene (FNF) was used for the analysis of OPAH and
NPAHs. Samples were made up to a final volume of 100 uL with nonane inside a glass vial insert.
80
Table 2.2. Internal standards, molecular ions and approximate retention times used to
identify and quantify target PAH, OPAH and NPAH compounds in sample extracts.
PAH Internal Standard M+ Retention time (min) Target compounds M+
Retention time (min)
p-Terphenyl-d14 244 31.2 n/a
Acenaphylene-d8 160 12.7 Acenaphthylene 152 12.8
Acenaphthene-d10 162 13.6 Acenaphthene 153 13.6
Fluorene-d10 176 16.8 Fluorene 166 16.9
Phenanthrene-d10 188 21.5 Phenanthrene 178 21.6
Anthracene-d10 188 21.7 Anthracene 178 21.8
Fluoranthene-d10 212 28.2 Fluoranthene 202 28.3
Pyrene-d10 212
29.4
Pyrene 202
29.5
Retene 219
Benzo(a)anthracene-d12 240 36.5 Benzo(a)anthracene 228 36.6
Chrysene-d12 240 36.6 Chrysene 228 36.7
Benzo(b)fluoranthene-d12 264 42.3 Benzo(b)fluoranthene 252 42.4
Benzo(k)fluoranthene-d12 264 42.4 Benzo(k)fluoranthene 252 42.5
Benzo(e)pyrene-d12 264 43.5 Benzo(e)pyrene 252 43.6
Benzo(a)pyrene-d12 264 43.8 Benzo(a)pyrene 252 43.9
Indeno(1,2,3-cd)pyrene-d12 288 48.8 Indeno(1,2,3-cd)pyrene 276 48.9
Dibenz(a,h)anthracene-d12 292 49.1 Dibenz(a,h)anthracene 278 49.3
Benzo(ghi)perylene-d12 288 49.9 Benzo(ghi)perylene 276 50.2
Coronene-d12 312 56.2 Coronene 300 56.4
NPAH Internal Standard M- Target compounds M-
1-Fluoro-Nitro-Fluorene 229 29.8 n/a
1-Nitronaphthalene-d7 180 17.7
1-Nitronaphthalene 173 17.8
2-Nitronaphthalene 173 18.8
2-Nitrofluorene-d8 220 30.7 2-Nitrofluorene 211 30.9
3-Nitrofluoranthene-d9 256
40.8
1-Nitrofluoranthene 247 39.5
2-Nitrofluoranthene 247 40.5
3-Nitrofluoranthene 247 40.9
1-Nitropyrene-d9 256
42.3
4-Nitropyrene 247 41.4
1-Nitropyrene 247 42.4
2-Nitropyrene 247 42.8
6-Nitrochrysene-d11 284 47.2 6-Nitrochrysene 273 47.4
OPAH Internal Standard M- Target compounds M-
9-Fluorenone-d8 188 21.0 9-Fluorenone 180 21.1
Anthraquinone-d8 216
27.6
Anthraquinone 208 27.7
Methyl-anthraquinone 222 30.7Benzo(a)anthracene-7,12-dione 258 41.7
81
2.3. Sample analysis
2.3.1. Background and analytical development
Sample analysis during this study was conducted using gas chromatography-mass spectrometry
(GC-MS) techniques, developed according to a standard operating procedure previously produced
by members of this research group (Delgado-Saborit and Baker, 2006). GC-MS has been
established as method of PAH detection and quantification for over 50 years and remains a widely
used method for the analysis of environmental samples for PAH (Lee, 1995; Liu et al., 2007;
Poster et al., 2006); OPAHs (Walgraeve et al., 2010) and NPAHs (Dimashki et al., 2000; Albinet et
al., 2006, 2007a, 2008a).
GC-MS analysis of PAH is commonly achieved operating in electron impact (EI) mode. As
discussed by (Rood, 2001), this process involves the collision between relatively high energy
electrons (~70 eV) and sample molecules, removing their outer shell electron(s) producing
primarily positive molecular ions [M+] :
M + e- → M+ + 2 e- (2.1)
However, the energy imparted by this ionization can result in molecular ion disintegration to a
number of smaller fragmented ions, the nature and extent being dependent on the structure of
parent molecule:
M+ → F+ (2.2)
An alternative technique has been adopted using negative ion chemical ionisation (NICI). This
method involves the utilisation of a large amount of reagent gas (e.g. methane) in the ion source,
which acts as a moderator to the high-energy electrons. In this process, methane is introduced to
the ionisation chamber and collisions occur between methane molecules and high energy electron
stream forming the CH4 molecular ion (CH4+) and low-energy (thermal) electrons:
CH4 + e- (high energy) CH4+ 2e- (thermal) (2.3)

82
Molecules with high electron affinities (e.g. those containing electronegative substituent groups)
such as oxy- or nitro- groups efficiently capture the electrons produced, forming negative ions:
MX + e- (thermal) MX- (2.4)
Because NICI formation involves a much lower energy transfer, this usually results in less
molecular ion fragmentation so molecular ions (M-) are predominantly produced. Furthermore, no
negative reagent gas ions are formed, reducing the number of background peaks. The collision
rate of sample molecules with these low energy electrons is much faster than the rate of ion-
molecule collisions. Therefore this ‘softer’ ionization method allows lower detection limits for target
compounds, with sensitivity up 10-1000 times higher than other CI and EI techniques (Albinet et
al., 2006 ; Cochran et al., 2012).
This is particularly pertinent for the analysis of NPAH which requires low detection limits to analyse
levels in environmental samples. NICI methods have been widely used to analyse atmospheric
samples for both OPAH and NPAH compounds (Dimashki et al., 2000; Cochran et al., 2012;
Albinet et al., 2006, 2007a, 2008a ; Bezabeh et al., 1997 ; 2003 ; Bonfanati et al., 1996 ; Bamford
et al., 2003 ; Dušek et al., 2003 ; Siegmund et al., 2003 ; Ramdahl and Urdal, 1982 ; Newton et al.,
1982). This method also allows direct analysis of these compounds without requiring additional
modifications e.g. conversion to diacetyl derivatives that has previously been required (Cho et al.,
2004; Delgado-Saborit et al., 2013).
2.3.2. Analysis method for PAHs : GC-MS in EI mode
This method was used for the analysis of PAH compounds in extracts of filter and PUF samples, in
accordance with Delgado-Saborit and Baker (2006). GC-MS analysis was carried out using an
Agilent 5973 Network Mass Selective Detector (MSD) coupled to an Agilent 6890N Network GC
system, operated in electron impact (EI) mode. 1 uL of sample was injected in splitless mode and

83
non-pulsed injection. Separation was carried out using an Agilent HP-5MS (5% phenyl methyl
siloxane) capillary column (30m x 0.25 mm i.d. x 0.25 um film thickness).
The ion source, inlet and transfer line temperatures were 230°C, 300°C and 280°C respectively.
Helium was used as a carrier gas with a set flow rate of 1.0 mL min-1 The oven temperature was
programmed as follows : starting temperature 100°C (held for 2 minutes), increased with a
temperature gradient of 4°C min-1 to a final temperature of 300°C (held for 7 minutes). The total run
time was 59.0 minutes.
The mass selective detector was operated in Selective Ion Monitoring (SIM) mode, allowing
detection of specific ions in set time windows, allowing optimum selectivity and sensitivity of the
method. The molecular weight (MW) values of each peak used to identify PAH compounds and
internal standards are shown in Table 2.2. Examples of the gas-chromatograph peaks for each
target and internal standard compound, detected in prepared standards and sample extracts are
shown in Appendix 3.
In accordance with Delgado-Saborit and Baker (2006), before and after sample runs, a
quantification standard containing all target compounds, internal standards and the recovery
standard p-terphenyl-d14 was analysed to assess any changes in GC-MS performance. Tuning
checks were also carried out with the reference compound perfluoro-tri-n-butylamine (PFTBA) on a
regular basis and after any GC-MS maintenance was performed in order to maintain optimum
detector response. Calibrations were routinely carried out for all target compounds and method
adjustments made as required.
2.3.3. Analysis for OPAH and NPAHs : GC-MS in NICI mode
This method was used for the analysis of OPAH and NPAH in extracts of filter and PUF samples.
GC-MS analysis was carried out using an Agilent 5973 Network Mass Selective Detector (MSD)
coupled to an Agilent 6890N Network GC system operated in negative ion chemical ionisation
(NICI) mode. The GC-MS configuration utilised a Gerstel Multipurpose auto sampler MPSL.
84
Compound separation was carried out using an Rxi®-PAH GC (Restek Ltd, UK) column (60m,
0.25 mm i.d., 0.10 um film thickness). This column displayed notably improved separation of 2-NFlt
and 3-NFlt compound peaks, which previous studies have failed to achieve (Albinet et al., 2007).
Improved peak separation achieved by the Restek®column was attributed to the narrower bore
column and higher phenyl content of the column stationary phase. A comparison of the 2NFlt and
3NFlt peak separation on the Restek®column and a conventional Agilent DB5-MS 60m column
can be seen in Figure 2.3.
The ion source, inlet and transfer line temperatures were 250°C, 300°C and 280°C respectively.
Helium was used as a carrier gas with a set flow rate of 1.0 mL min-1. Methane was used as the
reagent gas with a set flow rate of 2 mL min-1. The oven temperature was programmed as follows :
starting temperature 60°C (held for 2 minutes), increased with a temperature gradient of 45°C min-1
to 150 (held for 2 minutes) and further increased with a temperature gradient of 4°C min-1 to a final
temperature of 320°C (held for 11 minutes). The total run time was 59.5 minutes.
As with the EI GC-MS method, the mass selective detector was operated in SI mode. The
molecular weight (MW) values of each peak used to identify OPAH and NPAH compounds and
internal standards are shown in Table 2.1. Examples of the gas-chromatograph peaks for each
target and internal standard compound, detected in prepared standards and sample extracts are
shown in Appendix 3.
As detailed above, in accordance with Delgado-Saborit and Baker (2006), tuning checks were also
carried out with the reference compound perfluoro-tri-n-butylamine (PFTBA) on a regular basis and
after any GC-MS maintenance was performed in order to maintain optimum detector response.
Before and after sample runs, a quantification standard containing all target compounds, internal
standards and the recovery standard 1-fluoro-7-nitrofluorene (FNF) was analysed to assess any
changes in GC-MS performance. Calibrations were routinely carried out for all target compounds
and method adjustments made as required.

85
Figure 2.3. Comparison between peak separation of MW 247 NPAH compounds using an
Agilent DB5-MS 60m column (upper) and the Restek® 60m column (lower). 1 = 1NFlt, 2 =
2NFlt, 3= 3NFlt, 4 = 4NPyr, 5 = 1NPyr, 6 = 2NPyr.
1
2
3
4
5
6
1
2
d1
5
6
Time (mins)
Time (mins)
Response
Response
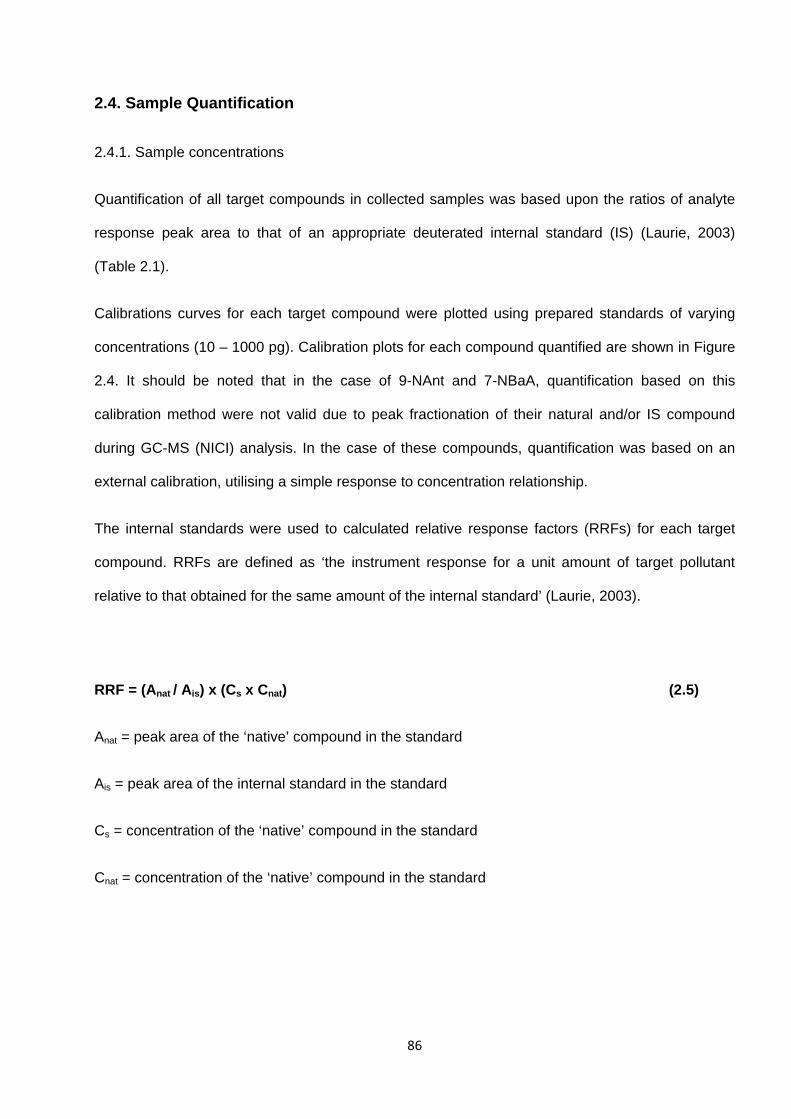
86
2.4. Sample Quantification
2.4.1. Sample concentrations
Quantification of all target compounds in collected samples was based upon the ratios of analyte
response peak area to that of an appropriate deuterated internal standard (IS) (Laurie, 2003)
(Table 2.1).
Calibrations curves for each target compound were plotted using prepared standards of varying
concentrations (10 – 1000 pg). Calibration plots for each compound quantified are shown in Figure
2.4. It should be noted that in the case of 9-NAnt and 7-NBaA, quantification based on this
calibration method were not valid due to peak fractionation of their natural and/or IS compound
during GC-MS (NICI) analysis. In the case of these compounds, quantification was based on an
external calibration, utilising a simple response to concentration relationship.
The internal standards were used to calculated relative response factors (RRFs) for each target
compound. RRFs are defined as ‘the instrument response for a unit amount of target pollutant
relative to that obtained for the same amount of the internal standard’ (Laurie, 2003).
RRF = (Anat / Ais) x (Cs x Cnat) (2.5)
Anat = peak area of the ‘native’ compound in the standard
Ais = peak area of the internal standard in the standard
Cs = concentration of the ‘native’ compound in the standard
Cnat = concentration of the ‘native’ compound in the standard
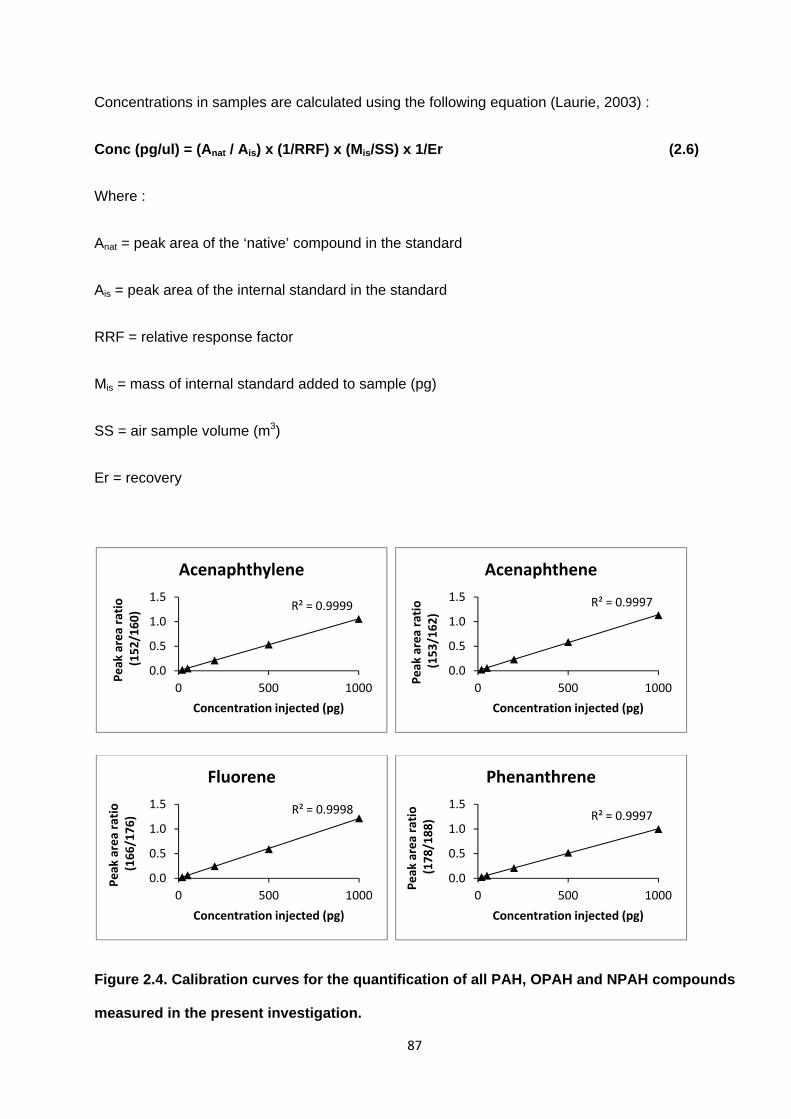
87
Concentrations in samples are calculated using the following equation (Laurie, 2003) :
Conc (pg/ul) = (Anat / Ais) x (1/RRF) x (Mis/SS) x 1/Er (2.6)
Where :
Anat = peak area of the ‘native’ compound in the standard
Ais = peak area of the internal standard in the standard
RRF = relative response factor
Mis = mass of internal standard added to sample (pg)
SS = air sample volume (m3)
Er = recovery
Figure 2.4. Calibration curves for the quantification of all PAH, OPAH and NPAH compounds
measured in the present investigation.
R² = 0.9999
0.0
0.5
1.0
1.5
0 500 1000
Peak area ratio
(152/160)
Concentration injected (pg)
Acenaphthylene
R² = 0.9997
0.0
0.5
1.0
1.5
0 500 1000
Peak area ratio
(153/162)
Concentration injected (pg)
Acenaphthene
R² = 0.9998
0.0
0.5
1.0
1.5
0 500 1000
Peak area ratio
(166/176)
Concentration injected (pg)
Fluorene
R² = 0.9997
0.0
0.5
1.0
1.5
0 500 1000
Peak area ratio
(178/188)
Concentration injected (pg)
Phenanthrene
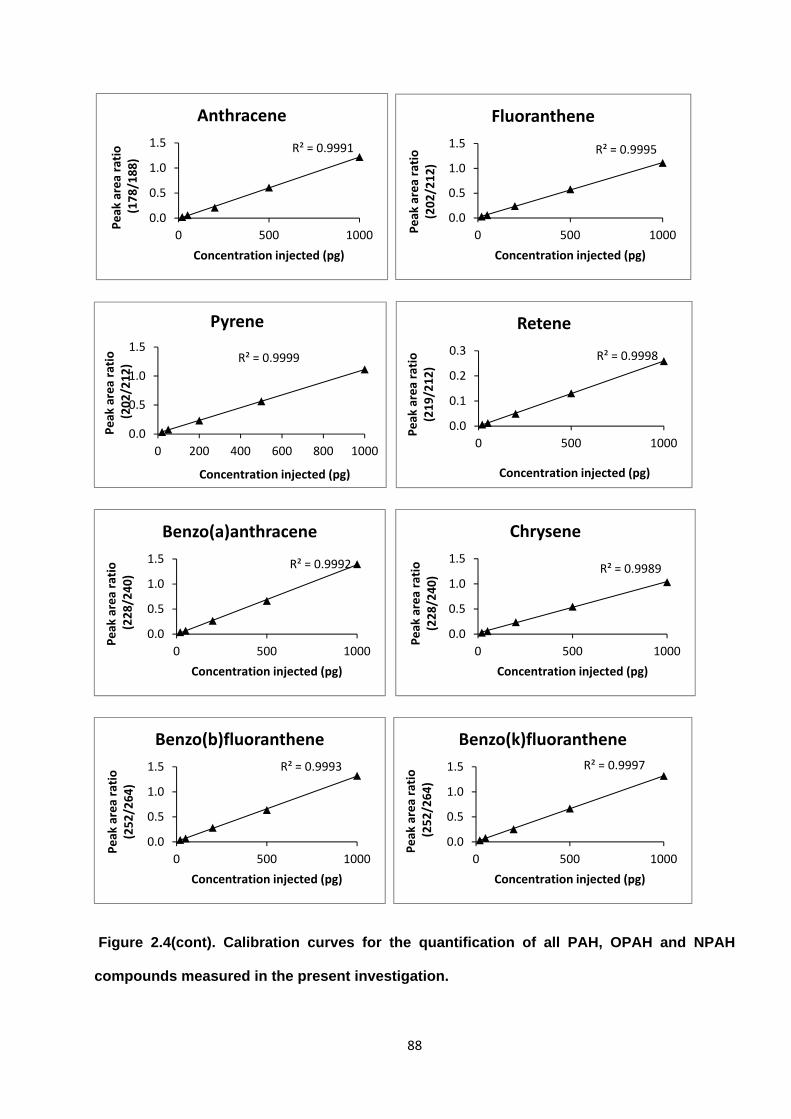
88
Figure 2.4(cont). Calibration curves for the quantification of all PAH, OPAH and NPAH
compounds measured in the present investigation.
R² = 0.9991
0.0
0.5
1.0
1.5
0 500 1000
Peak area ratio
(178/188)
Concentration injected (pg)
Anthracene
R² = 0.9995
0.0
0.5
1.0
1.5
0 500 1000Peak area ratio
(202/212)
Concentration injected (pg)
Fluoranthene
R² = 0.9999
0.0
0.5
1.0
1.5
0 200 400 600 800 1000
Peak area ratio
(202/212)
Concentration injected (pg)
Pyrene
R² = 0.9998
0.0
0.1
0.2
0.3
0 500 1000
Peak area ratio
(219/212)
Concentration injected (pg)
Retene
R² = 0.9992
0.0
0.5
1.0
1.5
0 500 1000
Peak area ratio
(228/240)
Concentration injected (pg)
Benzo(a)anthracene
R² = 0.9989
0.0
0.5
1.0
1.5
0 500 1000
Peak area ratio
(228/240)
Concentration injected (pg)
Chrysene
R² = 0.9993
0.0
0.5
1.0
1.5
0 500 1000
Peak area ratio
(252/264)
Concentration injected (pg)
Benzo(b)fluoranthene
R² = 0.9997
0.0
0.5
1.0
1.5
0 500 1000
Peak area ratio
(252/264)
Concentration injected (pg)
Benzo(k)fluoranthene
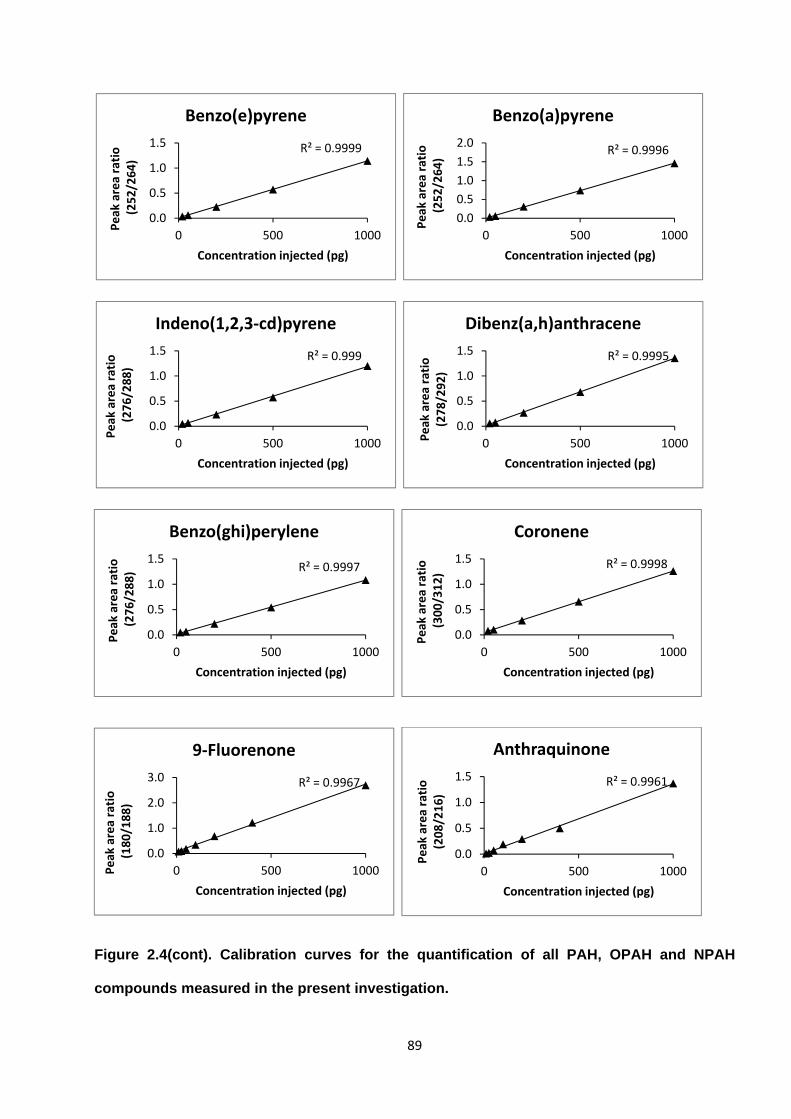
89
Figure 2.4(cont). Calibration curves for the quantification of all PAH, OPAH and NPAH
compounds measured in the present investigation.
R² = 0.9999
0.0
0.5
1.0
1.5
0 500 1000
Peak area ratio
(252/264)
Concentration injected (pg)
Benzo(e)pyrene
R² = 0.9996
0.0
0.5
1.0
1.5
2.0
0 500 1000
Peak area ratio
(252/264)
Concentration injected (pg)
Benzo(a)pyrene
R² = 0.999
0.0
0.5
1.0
1.5
0 500 1000
Peak area ratio
(276/288)
Concentration injected (pg)
Indeno(1,2,3‐cd)pyrene
R² = 0.9995
0.0
0.5
1.0
1.5
0 500 1000Peak area ratio
(278/292)
Concentration injected (pg)
Dibenz(a,h)anthracene
R² = 0.9997
0.0
0.5
1.0
1.5
0 500 1000
Peak area ratio
(276/288)
Concentration injected (pg)
Benzo(ghi)perylene
R² = 0.9998
0.0
0.5
1.0
1.5
0 500 1000
Peak area ratio
(300/312)
Concentration injected (pg)
Coronene
R² = 0.9967
0.0
1.0
2.0
3.0
0 500 1000Peak area ratio
(180/188)
Concentration injected (pg)
9‐Fluorenone
R² = 0.9961
0.0
0.5
1.0
1.5
0 500 1000
Peak area ratio
(208/216)
Concentration injected (pg)
Anthraquinone

90
Figure 2.4(cont). Calibration curves for the quantification of all PAH, OPAH and NPAH
compounds measured in the present investigation.
R² = 0.9974
0.0
0.5
1.0
1.5
2.0
0 500 1000
Peak area ratio
(222/216)
Concentration injected (pg)
Methyl‐Anthraquinone
R² = 0.996
0.0
5.0
10.0
0 500 1000
Peak area ratio
(258/216)
Concentration injected (pg)
Benzo(a)anthracene‐7,12‐dione
R² = 0.9996
0.0
0.5
1.0
1.5
2.0
0 500 1000
Peak area ratio
(173/180)
Concentration injected (pg)
1‐Nitronaphthalene
R² = 0.9992
0.0
0.5
1.0
1.5
0 500 1000
Peak area ratio
(173/180)
Concentration injected (pg)
2‐Nitronaphthalene
R² = 0.9998
0.0
0.5
1.0
1.5
0 500 1000
Peak area ratio
(211/220)
Concentration injected (pg)
2‐Nitrofluorene
R² = 0.9999
0.00
0.02
0.04
0.06
0 200 400 600 800 1000
Peak respose
Concentration injected (pg)
9‐Nitroanthracene
R² = 0.9983
0.0
0.5
1.0
0 500 1000
Peak area ratio
(247/256)
Concentration injected (pg)
1‐Nitrofluoranthene
R² = 0.9988
0.0
0.5
1.0
1.5
2.0
0 500 1000
Peak area ratio
(247/256)
Concentration injected (pg)
2‐Nitrofluoranthene
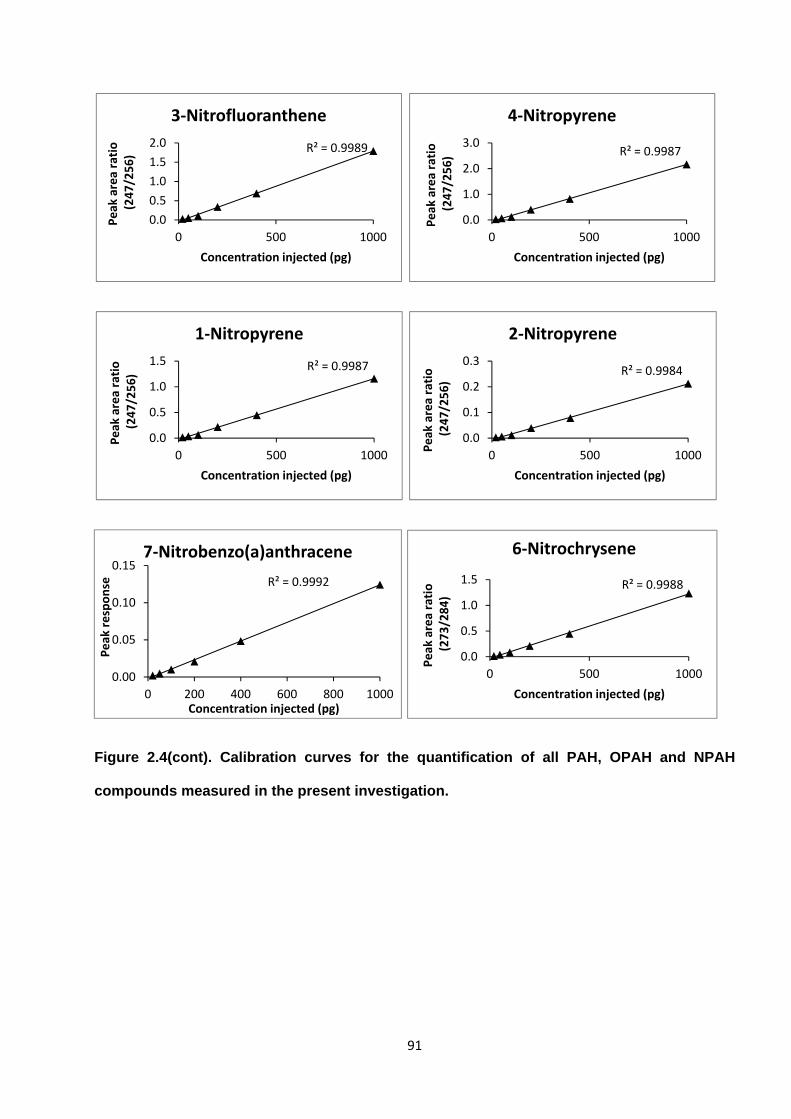
91
Figure 2.4(cont). Calibration curves for the quantification of all PAH, OPAH and NPAH
compounds measured in the present investigation.
R² = 0.9989
0.0
0.5
1.0
1.5
2.0
0 500 1000
Peak area ratio
(247/256)
Concentration injected (pg)
3‐Nitrofluoranthene
R² = 0.9987
0.0
1.0
2.0
3.0
0 500 1000
Peak area ratio
(247/256)
Concentration injected (pg)
4‐Nitropyrene
R² = 0.9987
0.0
0.5
1.0
1.5
0 500 1000
Peak area ratio
(247/256)
Concentration injected (pg)
1‐Nitropyrene
R² = 0.9984
0.0
0.1
0.2
0.3
0 500 1000
Peak area ratio
(247/256)
Concentration injected (pg)
2‐Nitropyrene
R² = 0.9992
0.00
0.05
0.10
0.15
0 200 400 600 800 1000
Peak response
Concentration injected (pg)
7‐Nitrobenzo(a)anthracene
R² = 0.9988
0.0
0.5
1.0
1.5
0 500 1000
Peak area ratio
(273/284)
Concentration injected (pg)
6‐Nitrochrysene
92
2.4.2. Validating analytical method
2.4.2.1. Recoveries
Percentage recoveries of internal standards were calculated to assess loss of target compounds
during extraction and clean-up procedure (Table 2.3). This was based on the calculation (Laurie,
2003) :
% Recovery = [(Ais / Ards)s x (Ards / Ais)std] x [(Cis / Crds)std x (Crds / Cis)s] x 100 (2.7)
Where :
(Ais/Ars)s = response ratio of internal standard to recovery standard (sample)
(Ars/Ais)std = response ratio of recovery standard to internal standard (standard)
(Cis/Crs)std = the concentration ratio of recovery standard to internal standard (standard)
(Crs/Cis)s = the concentration ratio of internal standard to recovery standard (sample)
Acceptable recoveries were considered to be in the range 30-150%. In some cases where
recoveries fell outside of this range, the analyte concentration for the IS compound in question was
removed when calculating the mean of this compound.
2.4.2.2. Standard reference material analysis (SRM)
In order to test the accuracy, precision and reproducibility of the extraction, clean-up and analysis
methods, a validation experiment was carried out by performing replicate analysis of NIST
Standard Reference Material 1649b (urban dust). 10 samples of ~10mg SRM 1649b material were
weighed and extracted, cleaned up and analysed for all target compounds using the procedure
described above.

93
Table 2.4. shows the mean concentrations measured in these samples and, where available, these
are compared with the certified or reference concentrations provided by NIST. It can be seen that
in all cases, the mean concentration measured with this method fell within or close to one standard
deviation of the certified value. Therefore we can be reasonably confident of the precision and
accuracy of the applied method in this investigation.
2.4.2.3. Sample blanks
In order to provide ‘blank’ field samples, filters and PUFs were prepared for sampling, as described
in Section 1.3.1, transported to the sampling site(s) and installed inside the sampler. In these
cases, the sampler was not run and the filters and PUFs were immediately transported to the
laboratory. As these ‘samples’ had not been exposed to ambient air, they were used as sample
blanks, representing concentrations of compounds resulting from contamination that may have
occurred during preparation and transport of filters and PUFs.
A total of eight sample blanks (filters and PUFs) were prepared in this way during the campaigns.
Blank concentrations were calculated assuming a sampling volume of 1043 m3, the mean air
volume of all air samples measured. The mean concentrations of target compounds in sample
blanks in filters and PUFs, and their relative levels to annual mean measured concentrations, is
shown in Table 2.4 and Table 2.5 respectively. These mean values were then subtracted from
measured sample concentrations to take into account this background contamination.
2.4.2.4. Detection Limits
Instrument detection limits (IDLs) (i.e. the minimum analyte concentration required to obtain an
instrument response) were calculated for each target compound for a signal to noise ratio of 5:1.
Method Detection Limits (MDLs) (i.e. the minimum detectable atmospheric concentration in the for
each target compound) were calculated assuming a final sample volume of 100uL and an air
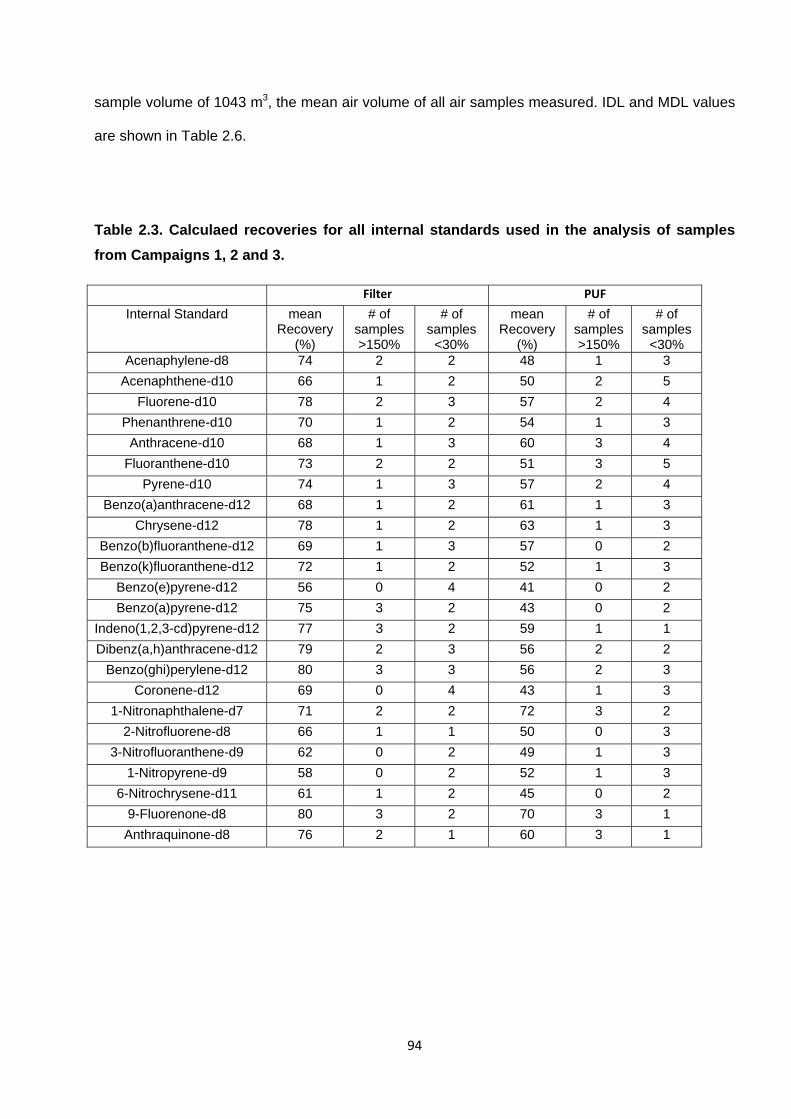
94
sample volume of 1043 m3, the mean air volume of all air samples measured. IDL and MDL values
are shown in Table 2.6.
Table 2.3. Calculaed recoveries for all internal standards used in the analysis of samples
from Campaigns 1, 2 and 3.
Filter PUF
Internal Standard mean Recovery
(%)
# of samples >150%
# of samples
<30%
mean Recovery
(%)
# of samples >150%
# of samples
<30% Acenaphylene-d8 74 2 2 48 1 3
Acenaphthene-d10 66 1 2 50 2 5
Fluorene-d10 78 2 3 57 2 4
Phenanthrene-d10 70 1 2 54 1 3
Anthracene-d10 68 1 3 60 3 4
Fluoranthene-d10 73 2 2 51 3 5
Pyrene-d10 74 1 3 57 2 4
Benzo(a)anthracene-d12 68 1 2 61 1 3
Chrysene-d12 78 1 2 63 1 3
Benzo(b)fluoranthene-d12 69 1 3 57 0 2
Benzo(k)fluoranthene-d12 72 1 2 52 1 3
Benzo(e)pyrene-d12 56 0 4 41 0 2
Benzo(a)pyrene-d12 75 3 2 43 0 2
Indeno(1,2,3-cd)pyrene-d12 77 3 2 59 1 1
Dibenz(a,h)anthracene-d12 79 2 3 56 2 2
Benzo(ghi)perylene-d12 80 3 3 56 2 3
Coronene-d12 69 0 4 43 1 3
1-Nitronaphthalene-d7 71 2 2 72 3 2
2-Nitrofluorene-d8 66 1 1 50 0 3
3-Nitrofluoranthene-d9 62 0 2 49 1 3
1-Nitropyrene-d9 58 0 2 52 1 3
6-Nitrochrysene-d11 61 1 2 45 0 2
9-Fluorenone-d8 80 3 2 70 3 1
Anthraquinone-d8 76 2 1 60 3 1
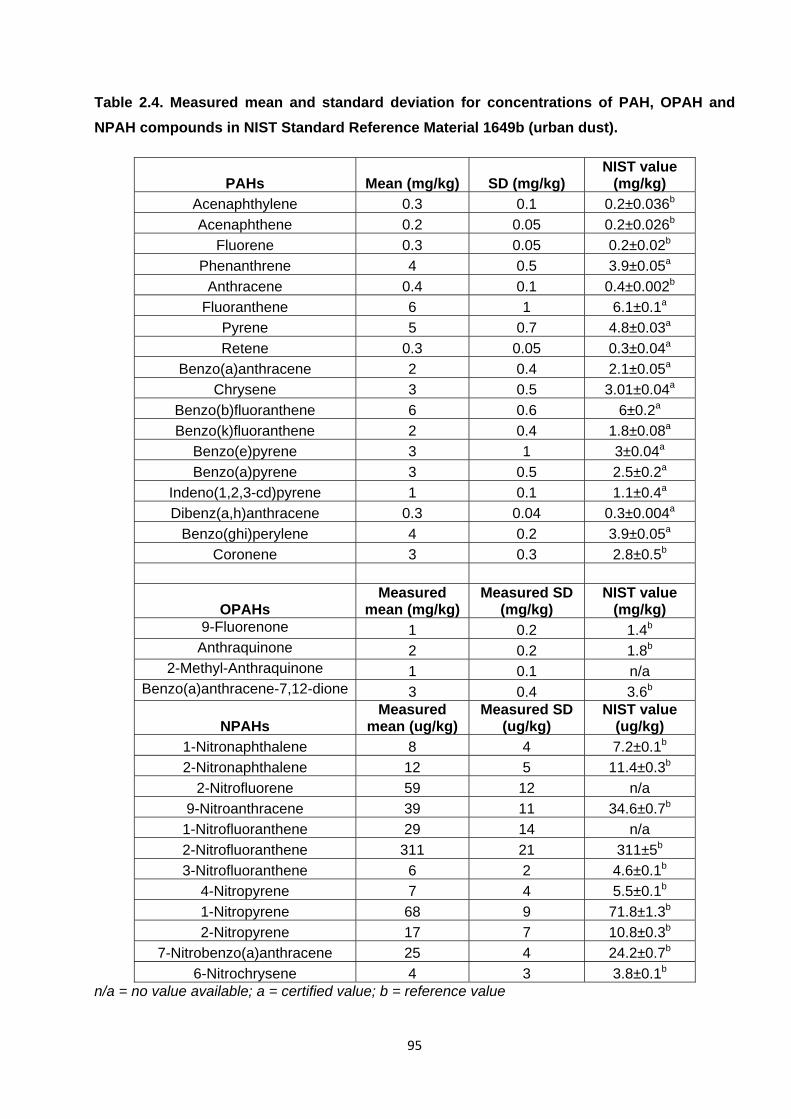
95
Table 2.4. Measured mean and standard deviation for concentrations of PAH, OPAH and
NPAH compounds in NIST Standard Reference Material 1649b (urban dust).
PAHs Mean (mg/kg) SD (mg/kg) NIST value
(mg/kg)
Acenaphthylene 0.3 0.1 0.2±0.036b
Acenaphthene 0.2 0.05 0.2±0.026b
Fluorene 0.3 0.05 0.2±0.02b
Phenanthrene 4 0.5 3.9±0.05a
Anthracene 0.4 0.1 0.4±0.002b
Fluoranthene 6 1 6.1±0.1a
Pyrene 5 0.7 4.8±0.03a
Retene 0.3 0.05 0.3±0.04a
Benzo(a)anthracene 2 0.4 2.1±0.05a
Chrysene 3 0.5 3.01±0.04a
Benzo(b)fluoranthene 6 0.6 6±0.2a
Benzo(k)fluoranthene 2 0.4 1.8±0.08a
Benzo(e)pyrene 3 1 3±0.04a
Benzo(a)pyrene 3 0.5 2.5±0.2a
Indeno(1,2,3-cd)pyrene 1 0.1 1.1±0.4a
Dibenz(a,h)anthracene 0.3 0.04 0.3±0.004a
Benzo(ghi)perylene 4 0.2 3.9±0.05a
Coronene 3 0.3 2.8±0.5b
OPAHs Measured
mean (mg/kg) Measured SD
(mg/kg) NIST value
(mg/kg) 9-Fluorenone 1 0.2 1.4b
Anthraquinone 2 0.2 1.8b 2-Methyl-Anthraquinone 1 0.1 n/a
Benzo(a)anthracene-7,12-dione 3 0.4 3.6b
NPAHs Measured
mean (ug/kg) Measured SD
(ug/kg) NIST value
(ug/kg)
1-Nitronaphthalene 8 4 7.2±0.1b
2-Nitronaphthalene 12 5 11.4±0.3b
2-Nitrofluorene 59 12 n/a
9-Nitroanthracene 39 11 34.6±0.7b
1-Nitrofluoranthene 29 14 n/a
2-Nitrofluoranthene 311 21 311±5b
3-Nitrofluoranthene 6 2 4.6±0.1b
4-Nitropyrene 7 4 5.5±0.1b
1-Nitropyrene 68 9 71.8±1.3b
2-Nitropyrene 17 7 10.8±0.3b
7-Nitrobenzo(a)anthracene 25 4 24.2±0.7b
6-Nitrochrysene 4 3 3.8±0.1b n/a = no value available; a = certified value; b = reference value
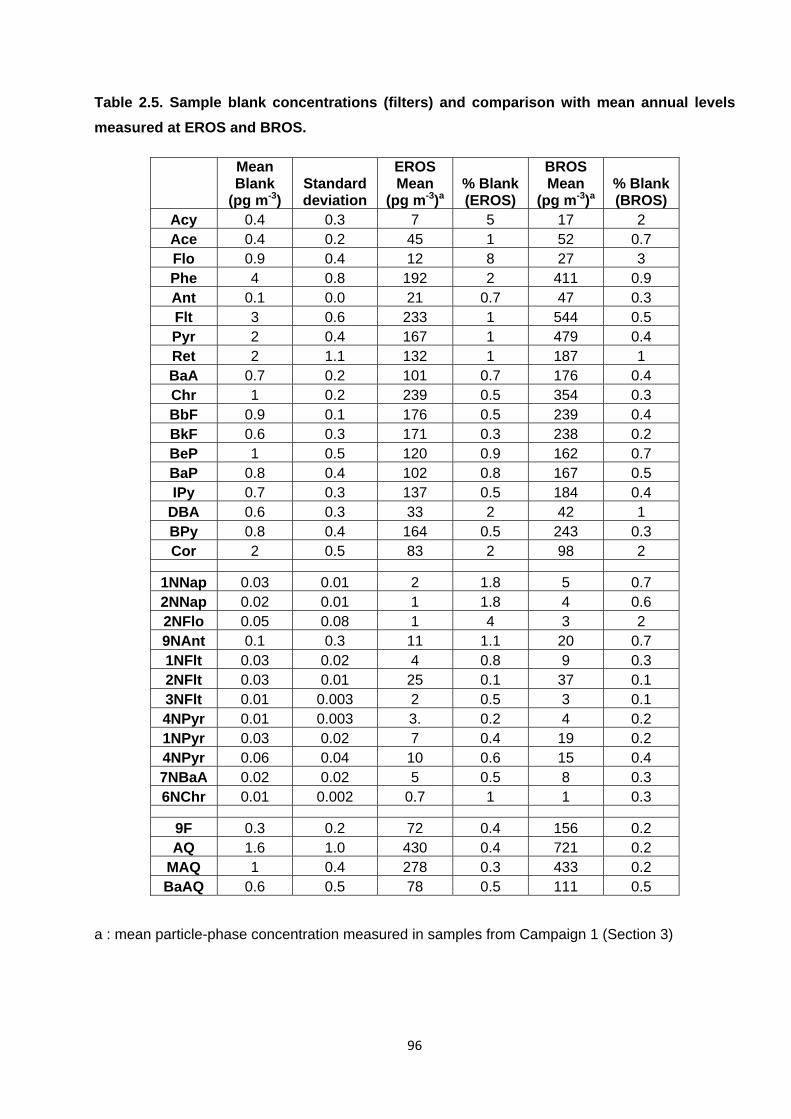
96
Table 2.5. Sample blank concentrations (filters) and comparison with mean annual levels
measured at EROS and BROS.
Mean Blank
(pg m-3) Standard deviation
EROS Mean
(pg m-3)a % Blank (EROS)
BROS Mean
(pg m-3)a % Blank (BROS)
Acy 0.4 0.3 7 5 17 2 Ace 0.4 0.2 45 1 52 0.7 Flo 0.9 0.4 12 8 27 3 Phe 4 0.8 192 2 411 0.9 Ant 0.1 0.0 21 0.7 47 0.3 Flt 3 0.6 233 1 544 0.5 Pyr 2 0.4 167 1 479 0.4 Ret 2 1.1 132 1 187 1 BaA 0.7 0.2 101 0.7 176 0.4 Chr 1 0.2 239 0.5 354 0.3 BbF 0.9 0.1 176 0.5 239 0.4 BkF 0.6 0.3 171 0.3 238 0.2 BeP 1 0.5 120 0.9 162 0.7 BaP 0.8 0.4 102 0.8 167 0.5 IPy 0.7 0.3 137 0.5 184 0.4
DBA 0.6 0.3 33 2 42 1 BPy 0.8 0.4 164 0.5 243 0.3 Cor 2 0.5 83 2 98 2
1NNap 0.03 0.01 2 1.8 5 0.7 2NNap 0.02 0.01 1 1.8 4 0.6 2NFlo 0.05 0.08 1 4 3 2 9NAnt 0.1 0.3 11 1.1 20 0.7 1NFlt 0.03 0.02 4 0.8 9 0.3 2NFlt 0.03 0.01 25 0.1 37 0.1 3NFlt 0.01 0.003 2 0.5 3 0.1 4NPyr 0.01 0.003 3. 0.2 4 0.2 1NPyr 0.03 0.02 7 0.4 19 0.2 4NPyr 0.06 0.04 10 0.6 15 0.4 7NBaA 0.02 0.02 5 0.5 8 0.3 6NChr 0.01 0.002 0.7 1 1 0.3
9F 0.3 0.2 72 0.4 156 0.2 AQ 1.6 1.0 430 0.4 721 0.2
MAQ 1 0.4 278 0.3 433 0.2 BaAQ 0.6 0.5 78 0.5 111 0.5
a : mean particle-phase concentration measured in samples from Campaign 1 (Section 3)
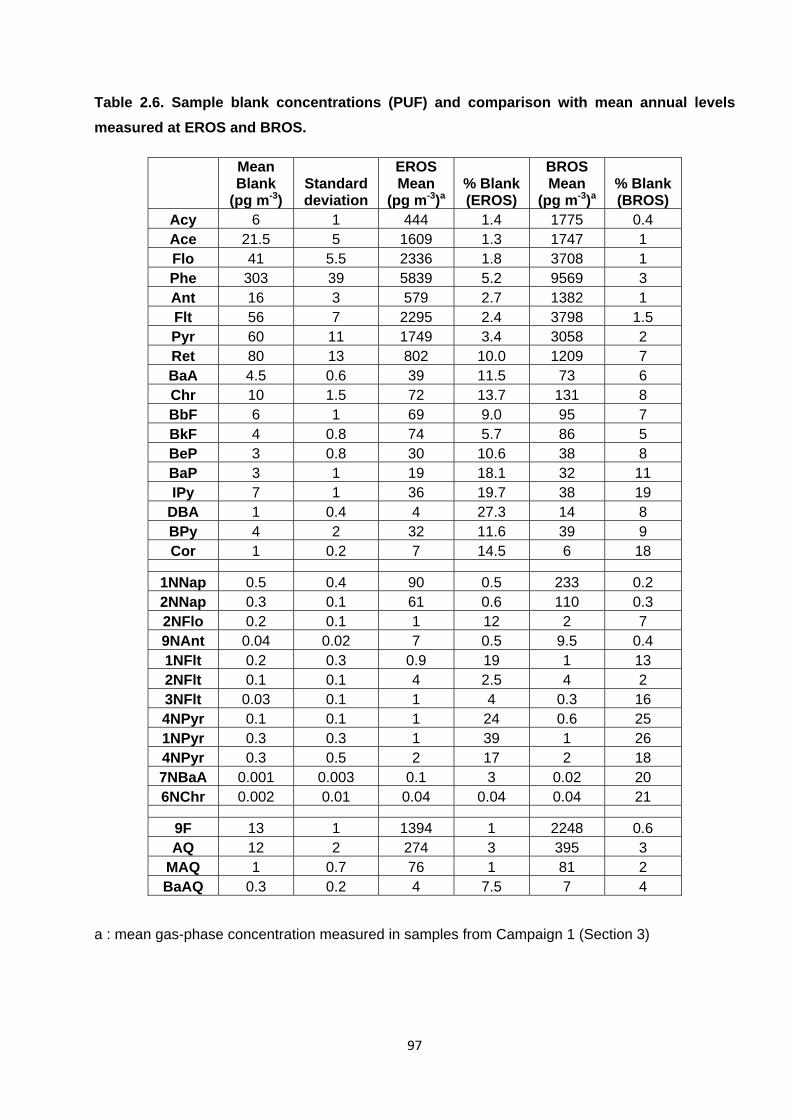
97
Table 2.6. Sample blank concentrations (PUF) and comparison with mean annual levels
measured at EROS and BROS.
Mean Blank
(pg m-3) Standard deviation
EROS Mean
(pg m-3)a % Blank (EROS)
BROS Mean
(pg m-3)a % Blank (BROS)
Acy 6 1 444 1.4 1775 0.4 Ace 21.5 5 1609 1.3 1747 1 Flo 41 5.5 2336 1.8 3708 1 Phe 303 39 5839 5.2 9569 3 Ant 16 3 579 2.7 1382 1 Flt 56 7 2295 2.4 3798 1.5 Pyr 60 11 1749 3.4 3058 2 Ret 80 13 802 10.0 1209 7 BaA 4.5 0.6 39 11.5 73 6 Chr 10 1.5 72 13.7 131 8 BbF 6 1 69 9.0 95 7 BkF 4 0.8 74 5.7 86 5 BeP 3 0.8 30 10.6 38 8 BaP 3 1 19 18.1 32 11 IPy 7 1 36 19.7 38 19
DBA 1 0.4 4 27.3 14 8 BPy 4 2 32 11.6 39 9 Cor 1 0.2 7 14.5 6 18
1NNap 0.5 0.4 90 0.5 233 0.2 2NNap 0.3 0.1 61 0.6 110 0.3 2NFlo 0.2 0.1 1 12 2 7 9NAnt 0.04 0.02 7 0.5 9.5 0.4 1NFlt 0.2 0.3 0.9 19 1 13 2NFlt 0.1 0.1 4 2.5 4 2 3NFlt 0.03 0.1 1 4 0.3 16 4NPyr 0.1 0.1 1 24 0.6 25 1NPyr 0.3 0.3 1 39 1 26 4NPyr 0.3 0.5 2 17 2 18 7NBaA 0.001 0.003 0.1 3 0.02 20 6NChr 0.002 0.01 0.04 0.04 0.04 21
9F 13 1 1394 1 2248 0.6 AQ 12 2 274 3 395 3
MAQ 1 0.7 76 1 81 2 BaAQ 0.3 0.2 4 7.5 7 4
a : mean gas-phase concentration measured in samples from Campaign 1 (Section 3)
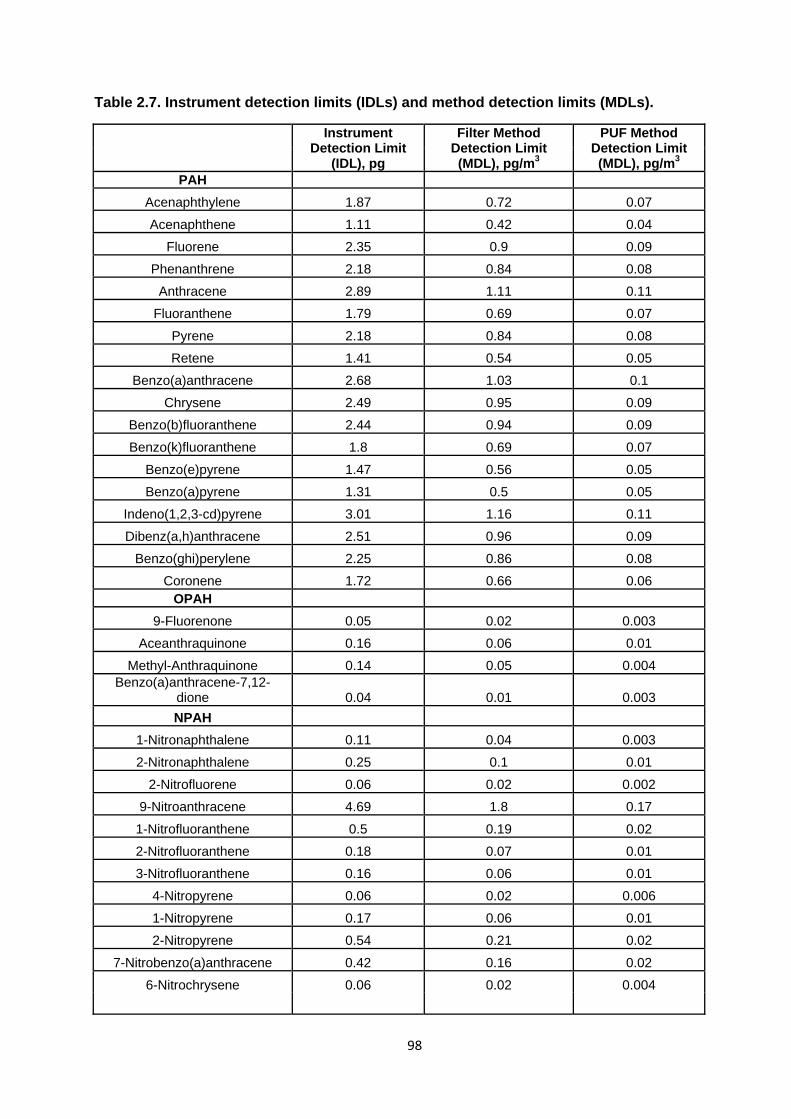
98
Table 2.7. Instrument detection limits (IDLs) and method detection limits (MDLs).
Instrument Detection Limit
(IDL), pg
Filter Method Detection Limit (MDL), pg/m3
PUF Method Detection Limit (MDL), pg/m3
PAH
Acenaphthylene 1.87 0.72 0.07
Acenaphthene 1.11 0.42 0.04
Fluorene 2.35 0.9 0.09
Phenanthrene 2.18 0.84 0.08
Anthracene 2.89 1.11 0.11
Fluoranthene 1.79 0.69 0.07
Pyrene 2.18 0.84 0.08
Retene 1.41 0.54 0.05
Benzo(a)anthracene 2.68 1.03 0.1
Chrysene 2.49 0.95 0.09
Benzo(b)fluoranthene 2.44 0.94 0.09
Benzo(k)fluoranthene 1.8 0.69 0.07
Benzo(e)pyrene 1.47 0.56 0.05
Benzo(a)pyrene 1.31 0.5 0.05
Indeno(1,2,3-cd)pyrene 3.01 1.16 0.11
Dibenz(a,h)anthracene 2.51 0.96 0.09
Benzo(ghi)perylene 2.25 0.86 0.08
Coronene 1.72 0.66 0.06 OPAH
9-Fluorenone 0.05 0.02 0.003
Aceanthraquinone 0.16 0.06 0.01
Methyl-Anthraquinone 0.14 0.05 0.004 Benzo(a)anthracene-7,12-
dione 0.04 0.01 0.003
NPAH
1-Nitronaphthalene 0.11 0.04 0.003
2-Nitronaphthalene 0.25 0.1 0.01
2-Nitrofluorene 0.06 0.02 0.002
9-Nitroanthracene 4.69 1.8 0.17
1-Nitrofluoranthene 0.5 0.19 0.02
2-Nitrofluoranthene 0.18 0.07 0.01
3-Nitrofluoranthene 0.16 0.06 0.01
4-Nitropyrene 0.06 0.02 0.006
1-Nitropyrene 0.17 0.06 0.01
2-Nitropyrene 0.54 0.21 0.02
7-Nitrobenzo(a)anthracene 0.42 0.16 0.02
6-Nitrochrysene 0.06 0.02 0.004
99
Chapter 3 : Concentrations and trends of PAHs, OPAHs
and NPAHs in the ambient urban atmosphere
3.1. Measured concentrations of PAH, OPAH and NPAH
Details of the samples taken in Campaign 1 are provided in Table 2.1. The mean concentrations
for all PAH, OPAH and NPAH compounds measured in Campaign 1 are presented in Table 3.1.
Box plots of the measured concentrations for all compounds during this campaign are presented in
Figure 3.1. Because sampling was conducted during all four seasons of the year, the mean
concentrations measured are assumed to represent an ‘annual mean’ concentration.
3.1.1 PAH and OPAH concentrations
Annual mean concentrations (sum of particulate and vapour phases) of PAHs measured in
Campaign 1 at BROS and EROS are shown in Figure 3.2. Annual mean total PAH concentrations
(sum of 18 compounds measured) were 30.5 ng m-3 and 18.2 ng m-3 at BROS and EROS
respectively. The most abundant PAHs at both sites were the 3- or 4-ring compounds Phe, Flo, Flu
and Pyr. These compounds are shown to contribute >70% to the total PAH load at both sites.
PAH concentrations observed at these sites are broadly of the same magnitude as levels typically
observed in the UK atmosphere at urban, suburban and roadside locations (Brown et al., 2013;
Halsall et al., 1993; Meijer et al., 2008; Prevedouros et al., 2004a). LMW (3-4 ring) PAHs, present
predominantly in the gas-phase, dominate the total PAH load compared with HMW (5+ ring) PAHs,
which are present mostly in the particulate phase. The average gas-phase/particulate-phase ratio
for total PAH measured in this campaign was 8.8 and 9.6 for BROS and EROS respectively. The
higher ratio at EROS may indicate an influence of phase-partitioning to the gas-phase occurred
between sites (discussed further in Section 3.5).
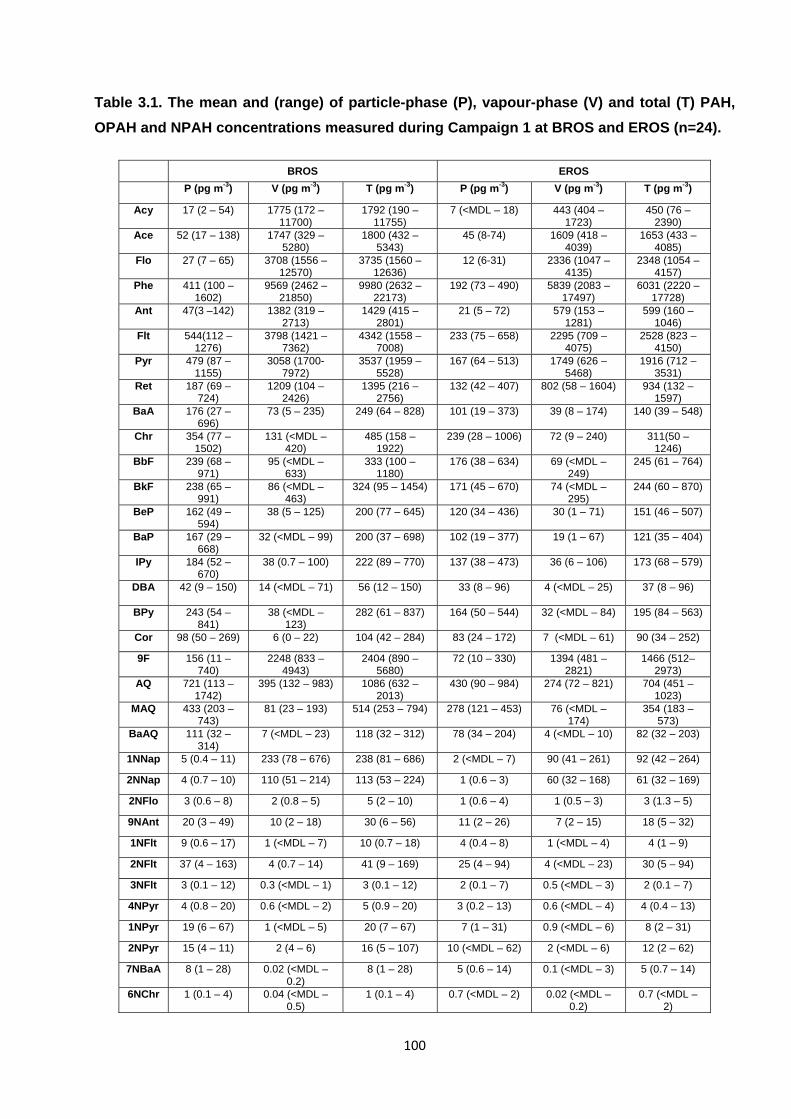
100
Table 3.1. The mean and (range) of particle-phase (P), vapour-phase (V) and total (T) PAH,
OPAH and NPAH concentrations measured during Campaign 1 at BROS and EROS (n=24).
BROS EROS
P (pg m-3) V (pg m-3) T (pg m-3) P (pg m-3) V (pg m-3) T (pg m-3)
Acy 17 (2 – 54) 1775 (172 – 11700)
1792 (190 – 11755)
7 (<MDL – 18) 443 (404 – 1723)
450 (76 – 2390)
Ace 52 (17 – 138) 1747 (329 – 5280)
1800 (432 – 5343)
45 (8-74) 1609 (418 – 4039)
1653 (433 – 4085)
Flo 27 (7 – 65) 3708 (1556 – 12570)
3735 (1560 – 12636)
12 (6-31) 2336 (1047 – 4135)
2348 (1054 – 4157)
Phe 411 (100 – 1602)
9569 (2462 – 21850)
9980 (2632 – 22173)
192 (73 – 490) 5839 (2083 – 17497)
6031 (2220 – 17728)
Ant 47(3 –142) 1382 (319 – 2713)
1429 (415 – 2801)
21 (5 – 72) 579 (153 – 1281)
599 (160 – 1046)
Flt 544(112 –1276)
3798 (1421 – 7362)
4342 (1558 – 7008)
233 (75 – 658) 2295 (709 – 4075)
2528 (823 – 4150)
Pyr 479 (87 – 1155)
3058 (1700-7972)
3537 (1959 – 5528)
167 (64 – 513) 1749 (626 – 5468)
1916 (712 – 3531)
Ret 187 (69 – 724)
1209 (104 – 2426)
1395 (216 – 2756)
132 (42 – 407) 802 (58 – 1604) 934 (132 – 1597)
BaA 176 (27 – 696)
73 (5 – 235) 249 (64 – 828) 101 (19 – 373) 39 (8 – 174) 140 (39 – 548)
Chr 354 (77 – 1502)
131 (<MDL – 420)
485 (158 – 1922)
239 (28 – 1006) 72 (9 – 240) 311(50 – 1246)
BbF 239 (68 – 971)
95 (<MDL – 633)
333 (100 – 1180)
176 (38 – 634) 69 (<MDL – 249)
245 (61 – 764)
BkF 238 (65 – 991)
86 (<MDL – 463)
324 (95 – 1454) 171 (45 – 670) 74 (<MDL – 295)
244 (60 – 870)
BeP 162 (49 – 594)
38 (5 – 125) 200 (77 – 645) 120 (34 – 436) 30 (1 – 71) 151 (46 – 507)
BaP 167 (29 – 668)
32 (<MDL – 99) 200 (37 – 698) 102 (19 – 377) 19 (1 – 67) 121 (35 – 404)
IPy 184 (52 – 670)
38 (0.7 – 100) 222 (89 – 770) 137 (38 – 473) 36 (6 – 106) 173 (68 – 579)
DBA 42 (9 – 150)
14 (<MDL – 71) 56 (12 – 150) 33 (8 – 96) 4 (<MDL – 25) 37 (8 – 96)
BPy 243 (54 – 841)
38 (<MDL – 123)
282 (61 – 837) 164 (50 – 544) 32 (<MDL – 84) 195 (84 – 563)
Cor 98 (50 – 269) 6 (0 – 22) 104 (42 – 284) 83 (24 – 172) 7 (<MDL – 61) 90 (34 – 252)
9F 156 (11 – 740)
2248 (833 – 4943)
2404 (890 – 5680)
72 (10 – 330) 1394 (481 – 2821)
1466 (512– 2973)
AQ 721 (113 – 1742)
395 (132 – 983) 1086 (632 – 2013)
430 (90 – 984) 274 (72 – 821) 704 (451 – 1023)
MAQ 433 (203 – 743)
81 (23 – 193) 514 (253 – 794) 278 (121 – 453) 76 (<MDL – 174)
354 (183 – 573)
BaAQ 111 (32 – 314)
7 (<MDL – 23) 118 (32 – 312) 78 (34 – 204) 4 (<MDL – 10) 82 (32 – 203)
1NNap 5 (0.4 – 11) 233 (78 – 676) 238 (81 – 686) 2 (<MDL – 7) 90 (41 – 261) 92 (42 – 264)
2NNap 4 (0.7 – 10) 110 (51 – 214) 113 (53 – 224) 1 (0.6 – 3) 60 (32 – 168) 61 (32 – 169)
2NFlo 3 (0.6 – 8) 2 (0.8 – 5) 5 (2 – 10) 1 (0.6 – 4) 1 (0.5 – 3) 3 (1.3 – 5)
9NAnt 20 (3 – 49) 10 (2 – 18) 30 (6 – 56) 11 (2 – 26) 7 (2 – 15) 18 (5 – 32)
1NFlt 9 (0.6 – 17) 1 (<MDL – 7) 10 (0.7 – 18) 4 (0.4 – 8) 1 (<MDL – 4) 4 (1 – 9)
2NFlt 37 (4 – 163) 4 (0.7 – 14) 41 (9 – 169) 25 (4 – 94) 4 (<MDL – 23) 30 (5 – 94)
3NFlt 3 (0.1 – 12) 0.3 (<MDL – 1) 3 (0.1 – 12) 2 (0.1 – 7) 0.5 (<MDL – 3) 2 (0.1 – 7)
4NPyr 4 (0.8 – 20) 0.6 (<MDL – 2) 5 (0.9 – 20) 3 (0.2 – 13) 0.6 (<MDL – 4) 4 (0.4 – 13)
1NPyr 19 (6 – 67) 1 (<MDL – 5) 20 (7 – 67) 7 (1 – 31) 0.9 (<MDL – 6) 8 (2 – 31)
2NPyr 15 (4 – 11) 2 (4 – 6) 16 (5 – 107) 10 (<MDL – 62) 2 (<MDL – 6) 12 (2 – 62)
7NBaA 8 (1 – 28) 0.02 (<MDL – 0.2)
8 (1 – 28) 5 (0.6 – 14) 0.1 (<MDL – 3) 5 (0.7 – 14)
6NChr 1 (0.1 – 4) 0.04 (<MDL – 0.5)
1 (0.1 – 4) 0.7 (<MDL – 2) 0.02 (<MDL – 0.2)
0.7 (<MDL – 2)

101
Total PAH
BROS EROS
ng/m
3
0
20
40
60
80
100
120
Acy
BROS EROSng
/m3
0
2
4
6
8
10
12
14
Ace
BROS EROS
ng
/m3
0
1
2
3
4
5
6
Flo
BROS EROS
ng/m
3
0
2
4
6
8
10
12
14
Phe
BROS EROS
ng/m
3
0
5
10
15
20
25
Ant
BROS EROS
ng/m
3
0.0
0.5
1.0
1.5
2.0
2.5
3.0
Flt
BROS EROS
ng/m
3
0
2
4
6
8
10
Pyr
BROS EROS
ng/m
3
0
1
2
3
4
5
6
Ret
BROS EROS
ng/m
3
0.0
0.5
1.0
1.5
2.0
2.5
3.0
Figure 3.1. Box plots of PAH concentrations measured at BROS and EROS in Campaign 1 (n=24). The upper and lower boundaries of the box represent the 75th and 25th percentile values respectively. The upper and lower
boundaries of the whiskers represent the 90th and 10th percentile values respectively. The median value is represented by the vertical line within the box. Black dots represent outlier values.
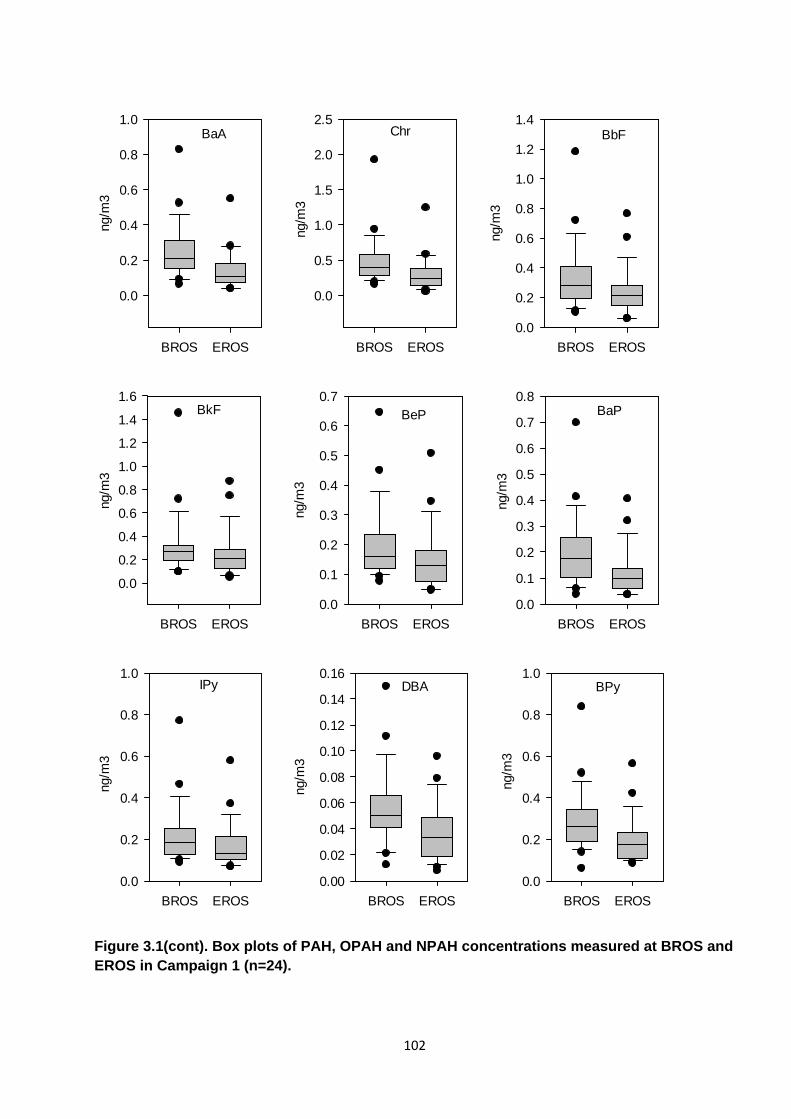
102
BaA
BROS EROS
ng/m
3
0.0
0.2
0.4
0.6
0.8
1.0
Chr
BROS EROS
ng/m
30.0
0.5
1.0
1.5
2.0
2.5
BbF
BROS EROS
ng/m
3
0.0
0.2
0.4
0.6
0.8
1.0
1.2
1.4
BkF
BROS EROS
ng/m
3
0.0
0.2
0.4
0.6
0.8
1.0
1.2
1.4
1.6
BeP
BROS EROS
ng/m
3
0.0
0.1
0.2
0.3
0.4
0.5
0.6
0.7
BaP
BROS EROS
ng/m
3
0.0
0.1
0.2
0.3
0.4
0.5
0.6
0.7
0.8
IPy
BROS EROS
ng/m
3
0.0
0.2
0.4
0.6
0.8
1.0
DBA
BROS EROS
ng/m
3
0.00
0.02
0.04
0.06
0.08
0.10
0.12
0.14
0.16
BPy
BROS EROS
ng/m
3
0.0
0.2
0.4
0.6
0.8
1.0
Figure 3.1(cont). Box plots of PAH, OPAH and NPAH concentrations measured at BROS and EROS in Campaign 1 (n=24).
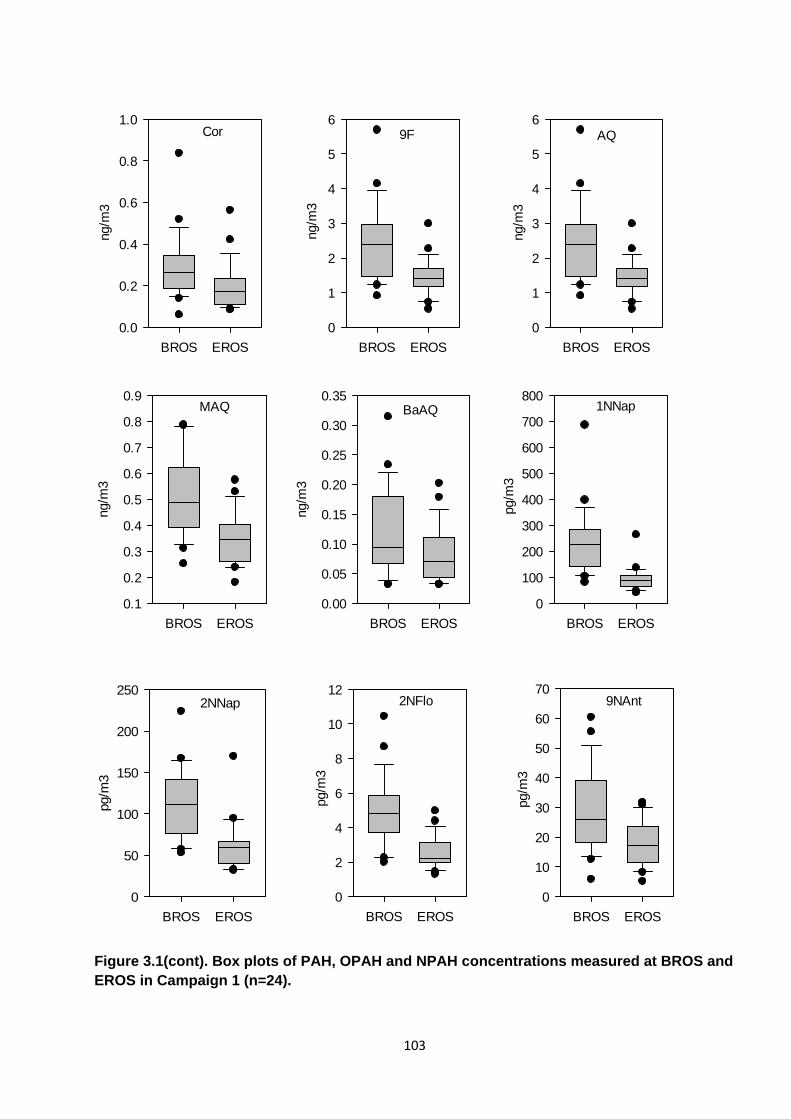
103
Cor
BROS EROS
ng/m
3
0.0
0.2
0.4
0.6
0.8
1.0
9F
BROS EROS
ng/m
30
1
2
3
4
5
6
AQ
BROS EROS
ng/m
3
0
1
2
3
4
5
6
MAQ
BROS EROS
ng/m
3
0.1
0.2
0.3
0.4
0.5
0.6
0.7
0.8
0.9BaAQ
BROS EROS
ng/m
3
0.00
0.05
0.10
0.15
0.20
0.25
0.30
0.35
1NNap
BROS EROS
pg/m
3
0
100
200
300
400
500
600
700
800
2NNap
BROS EROS
pg/m
3
0
50
100
150
200
2502NFlo
BROS EROS
pg/m
3
0
2
4
6
8
10
12
9NAnt
BROS EROS
pg/m
3
0
10
20
30
40
50
60
70
Figure 3.1(cont). Box plots of PAH, OPAH and NPAH concentrations measured at BROS and EROS in Campaign 1 (n=24).
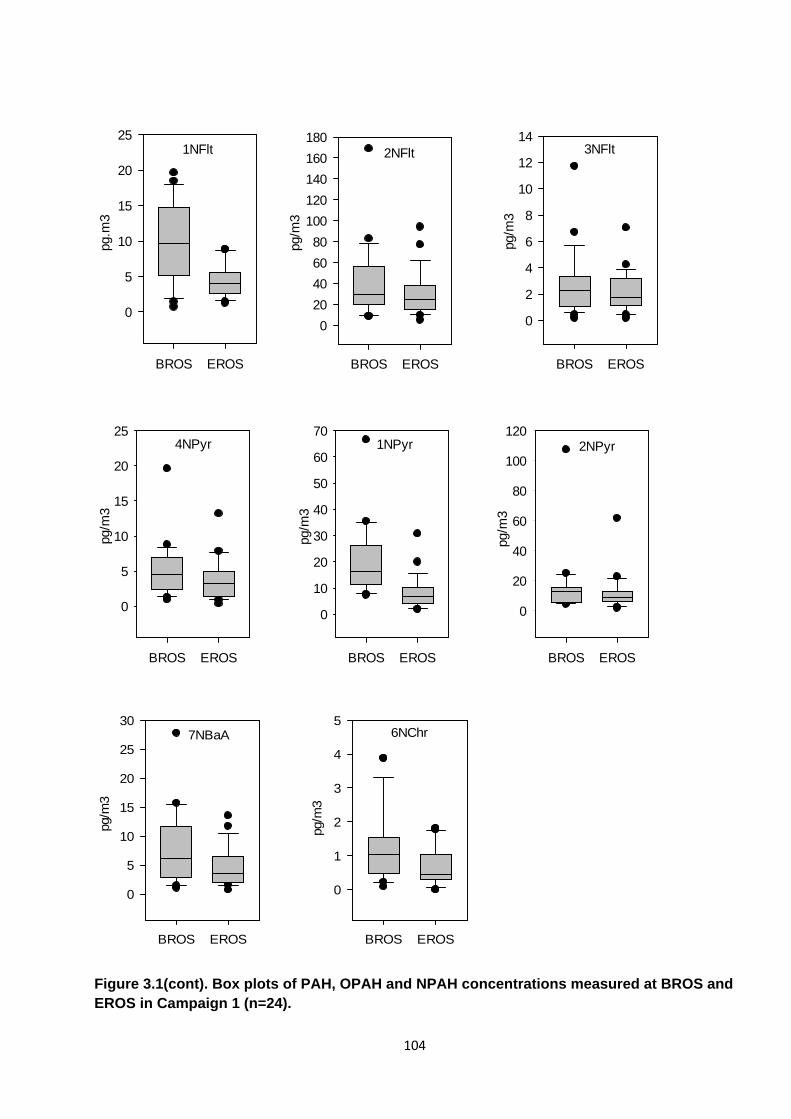
104
1NFlt
BROS EROS
pg.m
3
0
5
10
15
20
25
2NFlt
BROS EROS
pg/m
3
0
20
40
60
80
100
120
140
160
180
3NFlt
BROS EROS
pg/m
3
0
2
4
6
8
10
12
14
4NPyr
BROS EROS
pg/m
3
0
5
10
15
20
251NPyr
BROS EROS
pg/m
3
0
10
20
30
40
50
60
702NPyr
BROS EROS
pg/m
3
0
20
40
60
80
100
120
7NBaA
BROS EROS
pg/m
3
0
5
10
15
20
25
30
6NChr
BROS EROS
pg/m
3
0
1
2
3
4
5
Figure 3.1(cont). Box plots of PAH, OPAH and NPAH concentrations measured at BROS and EROS in Campaign 1 (n=24).

105
Figure 3.2. Mean concentrations (P + V) of PAH compounds measured at BROS and EROS
and the ‘traffic increment’ (i.e. the BROS – EROS concentration) during Campaign 1 (n=24).
The relative distribution of compounds is very similar at BROS and EROS, suggesting a common
emission source is dominating both sites. These observations are in good agreement with the
typical species distribution of PAHs observed previously at these sites (Alam et al., 2013; Delgado-
Saborit et al., 2013; Harrad and Laurie, 2005; Harrison et al., 2003), at other sites in the
Birmingham area (Dimashki et al., 2001; Smith and Harrison, 1996), and at other urban and
Acy Ace Flo Phe Ant Flt Pyr Ret BaA Chr BbF BkF BeP BaP IPy DBA BPy Cor
ng/m
3
0
2
4
6
8
10
BbF BkF BeP BaP IPy DBA BPy Cor
ng
/m3
0.0
0.1
0.2
0.3
0.4
BROS EROS Traffic increment
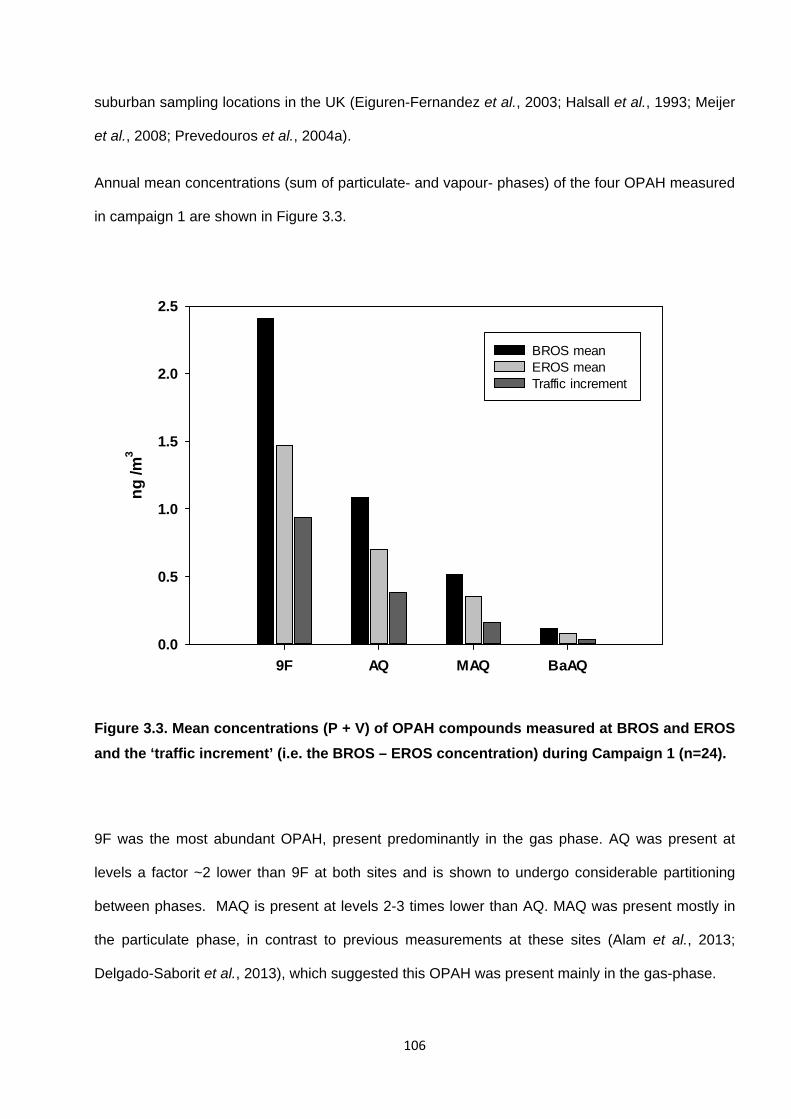
106
suburban sampling locations in the UK (Eiguren-Fernandez et al., 2003; Halsall et al., 1993; Meijer
et al., 2008; Prevedouros et al., 2004a).
Annual mean concentrations (sum of particulate- and vapour- phases) of the four OPAH measured
in campaign 1 are shown in Figure 3.3.
9F AQ MAQ BaAQ
ng
/m3
0.0
0.5
1.0
1.5
2.0
2.5
BROS mean EROS mean Traffic increment
Figure 3.3. Mean concentrations (P + V) of OPAH compounds measured at BROS and EROS
and the ‘traffic increment’ (i.e. the BROS – EROS concentration) during Campaign 1 (n=24).
9F was the most abundant OPAH, present predominantly in the gas phase. AQ was present at
levels a factor ~2 lower than 9F at both sites and is shown to undergo considerable partitioning
between phases. MAQ is present at levels 2-3 times lower than AQ. MAQ was present mostly in
the particulate phase, in contrast to previous measurements at these sites (Alam et al., 2013;
Delgado-Saborit et al., 2013), which suggested this OPAH was present mainly in the gas-phase.

107
Table 3.2 provides a comparison between measured OPAH and NPAH concentrations with those
reported in previous studies. Relatively few previous studies have measured OPAHs and NPAHs
in the ambient atmosphere in both particulate and gas phases. Furthermore, many previous
measurements have been carried out as seasonal campaigns, collecting samples in summer and
winter months only so comparisons must be made with caution.
Concentrations of 9F, AQ and BaAQ (P+V) concentrations measured at BROS in this study fall
within the range of concentrations measured by (Albinet et al., 2008a) during winter and summer
months in two Alpine valley locations in France. When just particulate-phase is considered, OPAH
concentrations measured at BROS are generally similar to those measured previously in Paris,
France (Nicol et al., 2001) ; Basel, Switzerland (Niederer, 1998) ; Munich, Germany (Schnelle-
Kreis et al., 2001); Augsberg, Germany (Liu et al., 2006b; Schnelle-Kreis et al., 2005; Sklorz et al.,
2007) ; Santiago, Chile (Sienra, 2006; Tsapakis et al., 2002); Finokalia, Crete (Tsapakis and
Stephanou, 2007); Helsinki, Finland (Kallio et al., 2003; Shimmo et al., 2004a); Southern
California, USA (Cho et al., 2004; Chung et al., 2006); Athens, Greece (Andreou and
Rapsomanikis, 2009; Valavanidis et al., 2006); Tempe, Arizona, USA (Delhomme et al., 2008); and
southern China (Wei et al., 2012; Yassaa et al., 2001). OPAH concentrations were lower than in
more heavily polluted cities of less developed countries e.g. Algiers, Algeria (Yassaa et al., 2001)
and in road tunnel studies (Oda et al., 2001).
PAHs and OPAHs have been measured at these sites previously (Alam et al., 2013; Delgado-
Saborit et al., 2013; Harrad and Laurie, 2005). Concentrations of individual PAHs measured in the
present study are shown to exhibit a strong (R2 > 0.9) correlation with concentrations measured by
Harrad and Laurie (2005) at both BROS and EROS in 1999-2001. Similarly there is a strong
correlation (R2 =0.94 and 0.98 for BROS and EROS respectively) between the mean winter
concentrations measured in this study and those measured during the same period by (Alam et al.,
2013). This suggests the dominant sources and processes governing the observed levels of PAH
and OPAH at these sites have not changed significantly in the last 15 years.
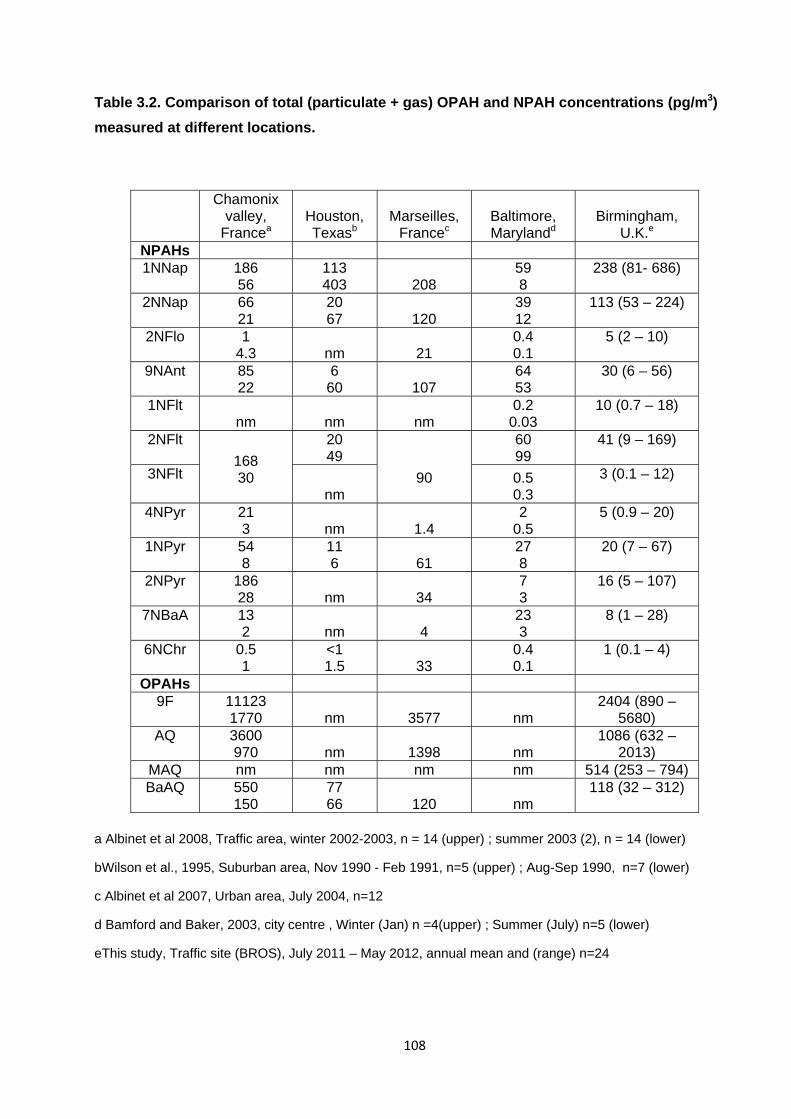
108
Table 3.2. Comparison of total (particulate + gas) OPAH and NPAH concentrations (pg/m3)
measured at different locations.
Chamonix valley,
Francea Houston, Texasb
Marseilles, Francec
Baltimore, Marylandd
Birmingham,
U.K.e NPAHs 1NNap 186
56 113 403 208
59 8
238 (81- 686)
2NNap 66 21
20 67 120
39 12
113 (53 – 224)
2NFlo 1 4.3 nm 21
0.4 0.1
5 (2 – 10)
9NAnt 85 22
6 60 107
64 53
30 (6 – 56)
1NFlt nm nm nm
0.2 0.03
10 (0.7 – 18)
2NFlt
168 30
20 49
90
60 99
41 (9 – 169)
3NFlt
nm 0.5 0.3
3 (0.1 – 12)
4NPyr 21 3 nm 1.4
2 0.5
5 (0.9 – 20)
1NPyr 54 8
11 6 61
27 8
20 (7 – 67)
2NPyr 186 28 nm 34
7 3
16 (5 – 107)
7NBaA 13 2 nm 4
23 3
8 (1 – 28)
6NChr 0.5 1
<1 1.5 33
0.4 0.1
1 (0.1 – 4)
OPAHs 9F 11123
1770 nm 3577 nm 2404 (890 –
5680) AQ 3600
970 nm 1398 nm 1086 (632 –
2013) MAQ nm nm nm nm 514 (253 – 794) BaAQ 550
150 77 66 120 nm
118 (32 – 312)
a Albinet et al 2008, Traffic area, winter 2002-2003, n = 14 (upper) ; summer 2003 (2), n = 14 (lower)
bWilson et al., 1995, Suburban area, Nov 1990 - Feb 1991, n=5 (upper) ; Aug-Sep 1990, n=7 (lower)
c Albinet et al 2007, Urban area, July 2004, n=12
d Bamford and Baker, 2003, city centre , Winter (Jan) n =4(upper) ; Summer (July) n=5 (lower)
eThis study, Traffic site (BROS), July 2011 – May 2012, annual mean and (range) n=24
109
PAH and OPAH concentrations were measured at these sites most recently in January 2010 (Alam
et al., 2013; Delgado-Saborit et al., 2013). The concentrations of LWM (3-4 ring) PAH measured in
these previous studies were a factor of 2-11 higher, and HMW (5+ ring) PAHs 0.7 - 4 times higher,
compared with the mean concentrations measured during the winter months in the present study.
The OPAHs MAQ and BaAQ were 1.2-5.1 times higher in the previous studies. In contrast AQ was
measured at higher levels in the present study. This may be due to a greater proportion of AQ
observed in the particle-phase in the present study which may protect it from photo degradation
processes. Higher levels of AQ could also have resulted due to inputs from atmospheric reactivity
or volatilisation from soil, vegetation or road surfaces.
It should be noted that the range of ambient temperature during sampling was narrower (1oC to
4oC) in the studies by Alam et al. (2013) and Delgado-Saborit et al. (2013) compared to the winter
sampling in the present study (-1 oC to 12oC). The higher concentrations of PAH and OPAH
observed in the previous studies may therefore be partly explained by lower temperatures and
associated lower mixing height resulting in slower advective dispersion. However, if the
differences in concentrations were governed by temperature-driven variation in mixing height it
may be expected that higher proportion of PAHs and OPAHs would be observed in the particle-
phase than in this study. In contrast the proportion of particle-phase component for most PAH and
OPAH is lower than in the present study.
As noted in Section 2.1.6, Alam and co-workers utilised a deunded sampling system, with
upstream collection of the gas-phase component with XAD-4 (Delgado-Saborit et al., 2014). The
results of the present study may therefore not be directly comparable with those of Alam et al.
(2013) and Delgado-Saborit et al. (2013) as the differences in concentrations of, and overall
contribution from, gas-phase PAH and OPAH compounds in these studies may have resulted due
to differences in the sampling technique used to collect the gas-phase component.
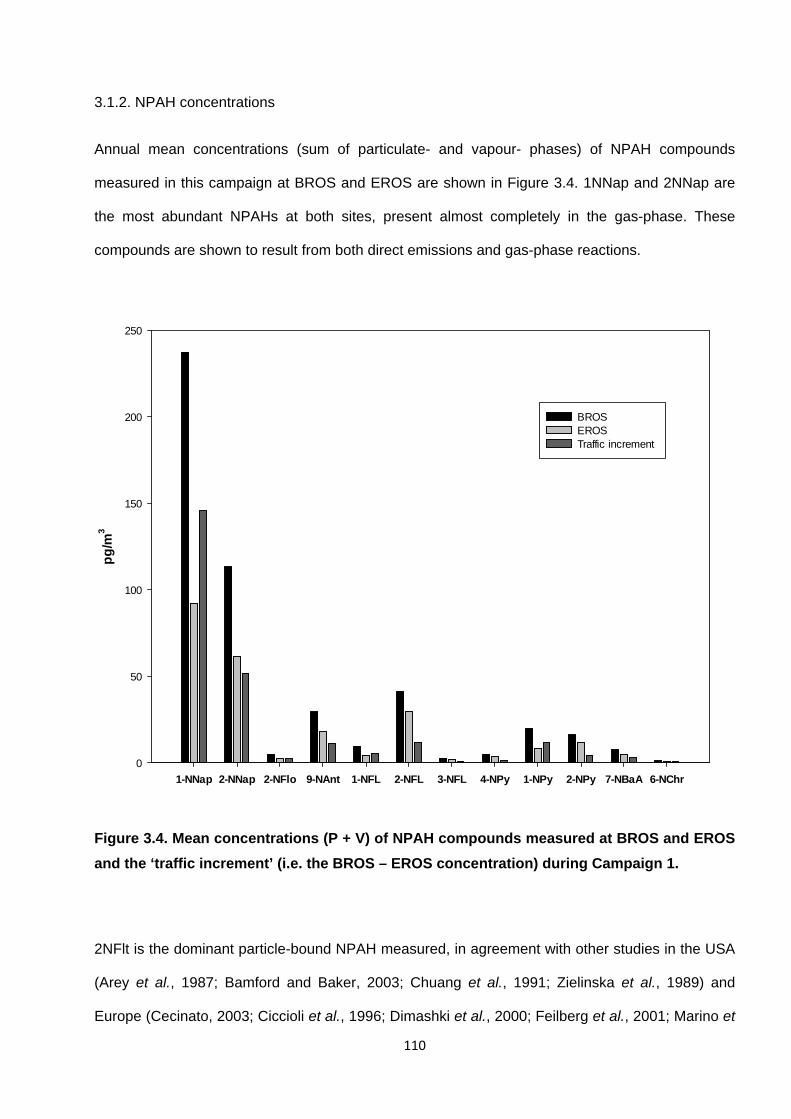
110
3.1.2. NPAH concentrations
Annual mean concentrations (sum of particulate- and vapour- phases) of NPAH compounds
measured in this campaign at BROS and EROS are shown in Figure 3.4. 1NNap and 2NNap are
the most abundant NPAHs at both sites, present almost completely in the gas-phase. These
compounds are shown to result from both direct emissions and gas-phase reactions.
1-NNap 2-NNap 2-NFlo 9-NAnt 1-NFL 2-NFL 3-NFL 4-NPy 1-NPy 2-NPy 7-NBaA 6-NChr
pg
/m3
0
50
100
150
200
250
BROS EROS Traffic increment
Figure 3.4. Mean concentrations (P + V) of NPAH compounds measured at BROS and EROS
and the ‘traffic increment’ (i.e. the BROS – EROS concentration) during Campaign 1.
2NFlt is the dominant particle-bound NPAH measured, in agreement with other studies in the USA
(Arey et al., 1987; Bamford and Baker, 2003; Chuang et al., 1991; Zielinska et al., 1989) and
Europe (Cecinato, 2003; Ciccioli et al., 1996; Dimashki et al., 2000; Feilberg et al., 2001; Marino et

111
al., 2000). 2NPyr is also present, mostly in the particulate-phase at lower levels than 2NFlt. Both of
these compounds are expected to be present solely as a result of gas-phase PAH reactions in the
atmosphere (Atkinson and Arey, 1994).
1NPyr and 9NAnt, which result primarily from diesel exhaust emissions, were also observed in
relatively high concentrations, predominantly in the particulate phase at both sites.
NPAH concentrations have previously been measured simultaneously in gas- and particulate
phases in urban , suburban or traffic locations in Maryland, USA (Bamford and Baker, 2003) the
Chamonix Valley, France (Albinet at al., 2008a) Los Angeles and Riverside, USA (Reisen and
Arey, 2005) Houston, USA (Wilson et al., 1995) in both summer and winter months (see Table
3.3). Concentrations measured at BROS in this study were within the range or of the same order of
magnitude of those reported in these previous studies.
NPAH concentrations in the present study were lower than observed during photochemical smog
events in California, USA (Arey et al., 1987, 1989) and those reported in more highly polluted
urban centres or high traffic areas such as Copenhagen, Denmark (Feilberg et al., 2001); Ho Chi
Minh City, Vietnam (Hien et al., 2007); Tokyo, Japan (Kakimoto et al., 2000; 2001; Kojima et al.,
2010); Beijing, China (Wang et al., 2011b) and Cairo, Egypt (Nassar et al., 2011).
The presence of NPAH compounds that result from gas-phase reactions (2NFlt, 2NPyr), direct
emissions (1NPyr) and a combination of both (1NNap, 2NNap) indicates that concentrations of
OPAH (e.g. 9F, AQ) and NPAH compounds at these sites will be influenced by both direct
emissions from traffic and secondary reactions of parent PAH with atmospheric oxidants e.g. OH,
NO3, O3.
3.1.3. BROS/EROS ratio comparisons
The relative magnitude and seasonal variability of BROS/EROS concentration is dependent on a
number of factors : the emission source strength from traffic, the influence of other non-traffic
112
combustion or non-combustion sources, levels of mobility and/or reactivity in the atmosphere, and
the relative input of some NPAH and OPAH compounds from atmospheric PAH reactions.
The mean BROS/EROS ratios for each compound measured in Campaign 1 are presented in
Table 3.3. The annual mean concentrations of all PAH, OPAH and NPAH compounds measured
were higher at BROS than at EROS. This is consistent with BROS being in closer proximity to the
major local emission source (i.e. road traffic) and levels at EROS being depleted to a greater
degree due to dispersion, deposition and/or chemical reactivity.
Statistical analysis of results indicates a significant (p<0.01) correlation exists between the
measured concentrations at BROS and EROS for all compounds (with the exception of Ant and
Cor). A paired t-test of the BROS and EROS samples indicates that concentrations at BROS are
significantly (p<0.01) higher at BROS for nearly all measured compounds. This is in agreement
with the work of Alam et al. (2013) Alam et al. (2013) and Harrad and Laurie (2005) where
significant inter-site differences were also reported. These results strongly indicate that traffic is
the dominant source influencing the observed concentrations of most compounds measured at
these sites.
However, no significant difference between sites was observed for Ace and Cor. Cor is typically
used as a marker for traffic emissions, so higher levels at BROS may be expected. However, the
lack of a statistical difference between sites may be explained by the relatively low volatility and
reactivity of this compound, which may result in relatively low inter-site difference in concentration.
For Ace, this may indicate a relatively low traffic input at these sites and the possibility of a non-
traffic input that is more prominent at EROS masking a traffic-related input.
The magnitude of BROS/EROS ratios varies considerably between compounds. For PAHs,
BROS/EROS ratios are generally higher for the LMW PAHs with 3-4 rings (1.1-3.8) compared to
HMW PAH with 5+ rings (1.3 – 2.0). These ratios are broadly in good agreement those observed
previously by Harrad and Laurie (2005) and Alam et al. (2013).
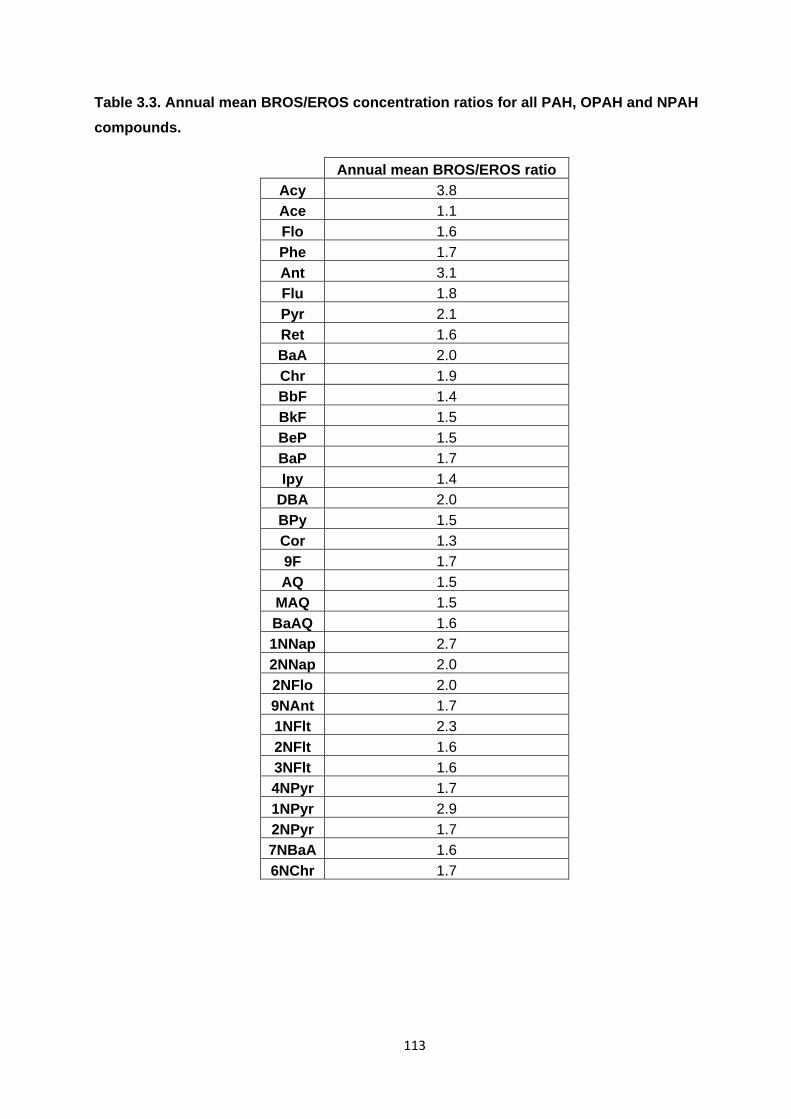
113
Table 3.3. Annual mean BROS/EROS concentration ratios for all PAH, OPAH and NPAH
compounds.
Annual mean BROS/EROS ratio
Acy 3.8
Ace 1.1
Flo 1.6
Phe 1.7
Ant 3.1
Flu 1.8
Pyr 2.1
Ret 1.6
BaA 2.0
Chr 1.9
BbF 1.4
BkF 1.5
BeP 1.5
BaP 1.7
Ipy 1.4
DBA 2.0
BPy 1.5
Cor 1.3
9F 1.7
AQ 1.5
MAQ 1.5
BaAQ 1.6
1NNap 2.7
2NNap 2.0
2NFlo 2.0
9NAnt 1.7
1NFlt 2.3
2NFlt 1.6
3NFlt 1.6
4NPyr 1.7
1NPyr 2.9
2NPyr 1.7
7NBaA 1.6
6NChr 1.7

114
The higher ratios observed for LWM PAHs may reflect the higher proportion of these compounds in
the gas-phase and their subsequent susceptibility to reactive losses and more rapid dispersion.
The relative magnitude of BROS/EROS ratios for different compounds may be due to their relative
reactivity towards atmospheric oxidants (see Section 4.2).
The lower ratios observed for HMW PAH are expected due their greater association with the
particulate phase and greater stability towards degradation. Ace displays a relatively low ratio,
possibly indicating a minor traffic input and/or additional source influencing predominantly at
EROS. Ret is not expected to result from a traffic emission source, being a typical marker for wood
combustion (Ramdahl, 1983). However, the BROS/EROS ratio observed for Ret is similar to those
of other semi-volatile PAHs. This may indicate a non-traffic combustion source that displays a
similar high input in close proximity to BROS relative to EROS.
OPAHs generally display BROS/EROS ratios similar to those of semi-volatile 3-4 ring PAHs,
suggesting the levels of these derivative compounds are governed by similar emission source and
inter-site processing as ‘parent’ PAHs.
For many NPAHs e.g. 1NNap, 2NNap, 2NFlo and 1NPyr, the BROS/EROS ratios are relatively
high compared with corresponding semi-volatile 3-4 ring PAHs. This may be attributed to the
prominence of these compounds in diesel exhaust emissions and relatively low proportions in other
combustion sources and/or more rapid degradation in the atmosphere relative to ‘parent’ PAHs.
It is expected that photolysis will be the dominant loss process for most gas-phase and particle-
phase NPAHs (Atkinson et al., 1989; Fan et al., 1996a; Feilberg et al., 1999; Nassar et al., 2011;
Phousongphouang and Arey, 2003a). Indeed it has been indicated that the atmospheric lifetime of
gas-phase NNaps towards photolytic degradation is comparable or faster than that of gas-phase
PAH towards OH reactions (Atkinson and Arey, 1994).
The mean inter-site ratio is shown to be larger for 1NNap than for 2-NNap. Experimental studies
indicate 1NNap exhibits a rate of photolysis ~1.3 – 8 times higher than that of 2NNap (Atkinson et
al., 1989; Niu et al., 2005; Phousongphouang and Arey, 2003a), which may partly explain this
115
observation. However, there is relatively little quantitative data on the rate of loss for particle-
phase NPAH towards photolysis or other reactive loss processes.
Gas-phase reaction products 2NFlt and 2NPyr exhibit lower ratios than primary emission-related
1NPyr. This may indicate the possible input of the former two compounds between sites, while the
latter is enhanced considerably at the roadside location and is expected to undergo relatively rapid
degradation (see following sections for further discussion). A similar observation was made by
Feilberg et al. (2001) where the ratios between urban and suburban areas were reported to be
higher for 1NPyr than for 2NPyr, 2NFlt and 9NAnt which the authors attributed to direct emissions
dominating the former and reactivity influencing the latter.
3.1.4. Traffic increment
It is assumed that if road traffic is the main emission source of PAHs, OPAHs and NPAHs
measured in this campaign, the [BROS] – [EROS] value will represent a ‘traffic increment’
concentration for each compound (Alam et al., 2013). Analysis of these [BROS] – [EROS] values
will therefore help to assess the potential influence of additional input from either primary or
secondary sources and/or losses due to deposition or reactivity between sites. The traffic
increment of PAH, OPAH and PAH compounds in the present study are shown in Figures 3.2, 3.3
and 3.4 respectively.
The highest traffic increments were observed for Phe, Flu and Pyr, in agreement with the results of
Alam et al. (2013) and Harrad and Laurie (2005). Concentrations of all compounds measured in
BROS and EROS were also measured in the Queensway Road Tunnel in Campaign 3 (see
Section 5). The levels measured in the tunnel represent those expected from on-road vehicle
emissions only, with losses due to dispersion, inputs from other combustion sources and losses
due to chemical reactivity or photolysis all assumed to be minimal.
116
There is shown to be a strong positive correlation between the annual mean [BROS]-[EROS] traffic
increment measured in Campaign1 and the mean concentrations measured in the Queensway
Road Tunnel (see Figure 3.5). This indicates that for most compounds, observed concentrations
are governed by traffic source input. This is in agreement with previous assessments of source
contributions at the Birmingham University sampling sites (Harrad and Laurie, 2005; Harrison et
al., 2003; Mari et al., 2010).
Interestingly, the correlation is much stronger when Phe is removed from the regression analysis
(see Figure 3.5). It is indicated that the traffic increment of Phe is a factor ~3 lower than expected,
based on linear regression of the mean tunnel concentrations against the mean [BROS]-[EROS]
plot. This result could possibly indicate a substantial input of Phe at EROS from non-traffic source,
thus driving the observed B-E value lower than would be predicted. It has been suggested
previously that this could be due to volatilisation of Phe previously deposited on soils/vegetation
(Harrad and Laurie, 2005; Dimashki et al., 2001). This is discussed further in Section 3.3.
There are other notable outliers to this ‘traffic increment’ regression. Ret displays a higher-than-
expected BROS-EROS traffic increment. Ret is typically used as a marker for wood combustion
(Fine et al., 2002; McDonald et al., 2000; Ramdahl, 1983; Simoneit et al., 1993). These results
indicate input from wood combustion activity may be higher at BROS than EROS. This is
consistent with BROS being in relatively close proximity to local houses that may use wood as a
domestic heating fuel or have greater frequency of fires to dispose of garden waste.
Ace displays a lower-than-expected BROS-EROS traffic increment. This suggests there is a
relatively high non-traffic related input at EROS. This is consistent with the relatively low
BROS/EROS ratio that is observed for Ace. The higher input of this compound at EROS relative to
BROS suggests the source may not be wood combustion related as the converse is observed for
Ret.
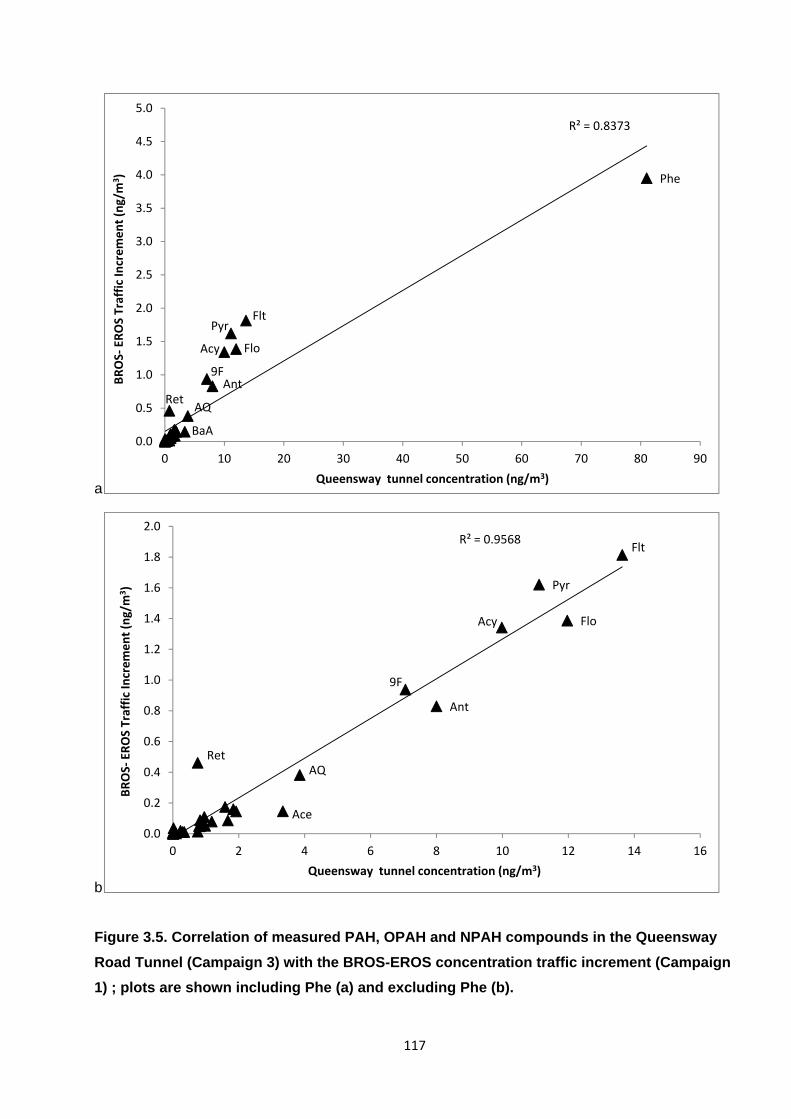
117
a
b
Figure 3.5. Correlation of measured PAH, OPAH and NPAH compounds in the Queensway
Road Tunnel (Campaign 3) with the BROS-EROS concentration traffic increment (Campaign
1) ; plots are shown including Phe (a) and excluding Phe (b).
Acy Flo
Phe
Ant
FltPyr
Ret
BaA
9F
AQ
R² = 0.8373
0.0
0.5
1.0
1.5
2.0
2.5
3.0
3.5
4.0
4.5
5.0
0 10 20 30 40 50 60 70 80 90
BROS‐ER
OS Traffic Increment (ng/m
3)
Queensway tunnel concentration (ng/m3)
Acy
Ace
Flo
Ant
Flt
Pyr
Ret
9F
AQ
R² = 0.9568
0.0
0.2
0.4
0.6
0.8
1.0
1.2
1.4
1.6
1.8
2.0
0 2 4 6 8 10 12 14 16
BROS‐ER
OS Traffic Increment (ng/m
3)
Queensway tunnel concentration (ng/m3)
118
3.1.5. Annual BaP concentrations and the UK Air Quality Objective
The annual mean concentrations of BaP measured at BROS and EROS were 0.2 and 0.12 ng m-3
respectively. These concentrations are of the same magnitude as reported for other sampling sites
in urban and suburban locations in the UK in 2011 (Brown et al., 2013).
Annual mean BaP levels in Birmingham therefore appear to be in compliance with the UK’s PAH
Air Quality Objective of 0.25 ng m-3 annual mean for BaP. However, samples in the autumn and
winter months at BROS and winter months at EROS display concentrations that often exceed 0.25
ng m-3. It is suggested, therefore that areas of higher traffic flow and/or areas influenced
significantly by other primary sources in the Birmingham area may exceed the objective value for
BaP.
However, monitoring data from other heavily trafficked areas in 2013 (e.g. Birmingham Tyburn and
London Marylebone Road) display a similar seasonal pattern to that observed at the sites in this
study. BaP concentrations tend to exceed 0.25 ng m-3 in winter months but tend to fall well below
this value during spring and summer. Overall, annual mean concentrations appear to comply with
the annual objective value in most urban and heavy traffic locations.
3.2. Influencing factors governing observed concentrations
Assessing how the measured concentrations of PAHs, OPAHs and NPAHs relate to each other as
well as with other atmospheric species and meteorological variables can help gain further insight
into the origins, behaviour and fate of these compounds. This section presents a statistical analysis
of measured concentrations and atmospheric parameters from samples in Campaign 1 at both
sites.
119
3.2.1. Inter-correlations of PAH, OPAH and NPAH concentrations
Table 3.4a and 3.4b present the Pearson coefficients for the correlations between individual PAH,
OPAH and NPAH compounds measured during Campaign 1 at BROS and EROS locations
respectively. It is noted that Ret does not correlate significantly with other compounds at BROS.
This is consistent with Ret resulting predominantly from a wood combustion-related source rather
than a traffic-related source, with the latter expected for most other compounds. However it is also
noted that Ant does not correlate with other compounds, possibly indicating the presence of a
different source in addition to vehicle exhaust for this compound.
Phe correlates significantly at BROS with Flu and Pyr, which display a common diesel source, as
well as Acy, Flo, BbF and BkF. Correlation between Phe and gasoline-related HMW PAH e,g, BaP,
IPy, DBA, BPy, Cor as well as most OPAH and NPAH compounds is weaker or absent. At EROS,
Phe does not display a significant correlation with other compounds, consistent with the deviation
of Phe away from expected ‘traffic profile’, suggesting the influence of a different source at this site.
Acy, Ace, Flo, BaA, Chr, BbF, BkF, BeP, BaP, IPy, DBA, BPY and Cor display significant (p<0.05)
inter-correlations at both sites, suggesting a common source amongst these compounds. This is
consistent with road traffic being the dominant emission source for these compounds at both
BROS and EROS. Similar inter-correlations were noted by Kakimoto et al. (2001) in highly
trafficked urban areas in Japan.
Ace, Acy and Flo display stronger correlation with gasoline related HMW PAH such as Cor and
BPy than for diesel-related compounds Phe, Flu and Pyr at both sites, as well as correlating
strongly with each other. Pyr, Flth and Ret correlate strongly at EROS but do not correlate with
other PAH, OPAH and NPAH compounds, suggesting Pyr and Flth may be influenced by a similar
wood combustion-related source at this site.
For each of the four OPAH measured, relatively weak or absent correlations are noted with diesel
related Phe, Flt, Pyr. Stronger and more significant correlations are noted with gasoline-related
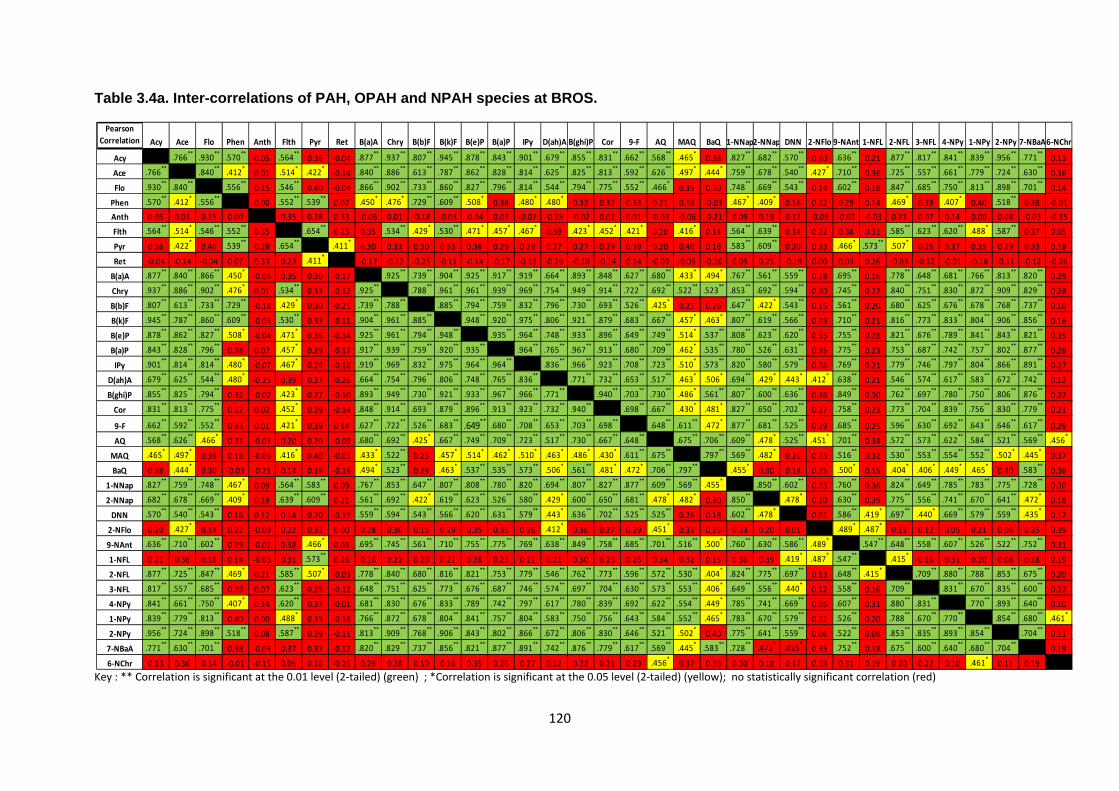
120
Table 3.4a. Inter-correlations of PAH, OPAH and NPAH species at BROS.
Key : ** Correlation is significant at the 0.01 level (2‐tailed) (green) ; *Correlation is significant at the 0.05 level (2‐tailed) (yellow); no statistically significant correlation (red)
Pearson
Correlation Acy Ace Flo Phen Anth Flth Pyr Ret B(a)A Chry B(b)F B(k)F B(e)P B(a)P IPy D(ah)A B(ghi)P Cor 9‐F AQ MAQ BaQ 1‐NNap2‐NNap DNN 2‐NFlo 9‐NAnt 1‐NFL 2‐NFL 3‐NFL 4‐NPy 1‐NPy 2‐NPy 7‐NBaA6‐NChr
Acy 1.00 .766**
.930**
.570**
0.05 .564**
0.36 ‐0.04 .877**
.937**
.807**
.945**
.878**
.843**
.901**
.679**
.855**
.831**
.662**
.568**
.465*
0.38 .827**
.682**
.570**
0.20 .636**
0.21 .877**
.817**
.841**
.839**
.956**
.771**
0.13
Ace .766**
1.00 .840**
.412*
0.01 .514*
.422*
‐0.14 .840**
.886**
.613**
.787**
.862**
.828**
.814**
.625**
.825**
.813**
.592**
.626**
.497*
.444*
.759**
.678**
.540**
.427*
.710**
0.36 .725**
.557**
.661**
.779**
.724**
.630**
0.36
Flo .930**
.840**
1.00 .556**
0.15 .546**
0.40 ‐0.04 .866**
.902**
.733**
.860**
.827**
.796**
.814**
.544**
.794**
.775**
.552**
.466*
0.39 0.30 .748**
.669**
.543**
0.14 .602**
0.18 .847**
.685**
.750**
.813**
.898**
.701**
0.14
Phen .570**
.412*
.556**
1.00 0.00 .552**
.539**
0.07 .450*
.476*
.729**
.609**
.508*
0.38 .480*
.480*
0.32 0.32 0.33 0.21 0.18 ‐0.03 .467*
.409*
0.16 0.22 0.29 0.14 .469*
0.39 .407*
0.40 .518**
0.38 ‐0.01
Anth 0.05 0.01 0.15 0.00 1.00 0.35 0.28 0.33 ‐0.06 0.01 ‐0.18 ‐0.03 ‐0.04 0.07 ‐0.07 ‐0.25 ‐0.02 0.02 0.01 ‐0.03 ‐0.06 ‐0.21 0.09 0.19 0.12 ‐0.09 ‐0.02 ‐0.03 0.21 0.07 0.14 0.00 0.08 ‐0.03 ‐0.15
Flth .564**
.514*
.546**
.552**
0.35 1.00 .654**
0.23 0.35 .534**
.429*
.530**
.471*
.457*
.467*
0.39 .423*
.452*
.421*
0.20 .416*
0.14 .564**
.639**
0.14 0.22 0.38 0.31 .585**
.623**
.620**
.488*
.587**
0.37 0.05
Pyr 0.36 .422*
0.40 .539**
0.28 .654**
1.00 .411*
0.30 0.33 0.30 0.33 0.36 0.29 0.29 0.27 0.27 0.29 0.39 0.20 0.40 0.16 .583**
.609**
0.20 0.33 .466*
.573**
.507*
0.25 0.37 0.35 0.29 0.33 0.18
Ret ‐0.04 ‐0.14 ‐0.04 0.07 0.33 0.23 .411*
1.00 ‐0.17 ‐0.12 ‐0.25 ‐0.11 ‐0.14 ‐0.17 ‐0.18 ‐0.26 ‐0.10 ‐0.14 0.14 ‐0.09 ‐0.05 ‐0.16 0.09 0.21 ‐0.19 0.00 0.03 0.26 ‐0.03 ‐0.12 ‐0.01 ‐0.18 ‐0.11 ‐0.12 ‐0.26
B(a)A .877**
.840**
.866**
.450*
‐0.06 0.35 0.30 ‐0.17 1.00 .925**
.739**
.904**
.925**
.917**
.919**
.664**
.893**
.848**
.627**
.680**
.433*
.494*
.767**
.561**
.559**
0.28 .695**
0.16 .778**
.648**
.681**
.766**
.813**
.820**
0.29
Chry .937**
.886**
.902**
.476*
0.01 .534**
0.33 ‐0.12 .925**
1.00 .788**
.961**
.961**
.939**
.969**
.754**
.949**
.914**
.722**
.692**
.522**
.523**
.853**
.692**
.594**
0.30 .745**
0.22 .840**
.751**
.830**
.872**
.909**
.829**
0.28
B(b)F .807**
.613**
.733**
.729**
‐0.18 .429*
0.30 ‐0.25 .739**
.788**
1.00 .885**
.794**
.759**
.832**
.796**
.730**
.693**
.526**
.425*
0.25 0.26 .647**
.422*
.543**
0.15 .561**
0.20 .680**
.625**
.676**
.678**
.768**
.737**
0.10
B(k)F .945**
.787**
.860**
.609**
‐0.03 .530**
0.33 ‐0.11 .904**
.961**
.885**
1.00 .948**
.920**
.975**
.806**
.921**
.879**
.683**
.667**
.457*
.463*
.807**
.619**
.566**
0.29 .710**
0.21 .816**
.773**
.833**
.804**
.906**
.856**
0.16
B(e)P .878**
.862**
.827**
.508*
‐0.04 .471*
0.36 ‐0.14 .925**
.961**
.794**
.948**
1.00 .935**
.964**
.748**
.933**
.896**
.649**
.749**
.514*
.537**
.808**
.623**
.620**
0.35 .755**
0.28 .821**
.676**
.789**
.841**
.843**
.821**
0.35
B(a)P .843**
.828**
.796**
0.38 0.07 .457*
0.29 ‐0.17 .917**
.939**
.759**
.920**
.935**
1.00 .964**
.765**
.967**
.913**
.680**
.709**
.462*
.535**
.780**
.526**
.631**
0.35 .775**
0.23 .753**
.687**
.742**
.757**
.802**
.877**
0.26
IPy .901**
.814**
.814**
.480*
‐0.07 .467*
0.29 ‐0.18 .919**
.969**
.832**
.975**
.964**
.964**
1.00 .836**
.966**
.923**
.708**
.723**
.510*
.573**
.820**
.580**
.579**
0.36 .769**
0.21 .779**
.746**
.797**
.804**
.866**
.891**
0.27
D(ah)A .679**
.625**
.544**
.480*
‐0.25 0.39 0.27 ‐0.26 .664**
.754**
.796**
.806**
.748**
.765**
.836**
1.00 .771**
.732**
.653**
.517**
.463*
.506*
.694**
.429*
.443*
.412*
.638**
0.21 .546**
.574**
.617**
.583**
.672**
.742**
0.12
B(ghi)P .855**
.825**
.794**
0.32 ‐0.02 .423*
0.27 ‐0.10 .893**
.949**
.730**
.921**
.933**
.967**
.966**
.771**
1.00 .940**
.703**
.730**
.486*
.561**
.807**
.600**
.636**
0.36 .849**
0.30 .762**
.697**
.780**
.750**
.806**
.876**
0.22
Cor .831**
.813**
.775**
0.32 0.02 .452*
0.29 ‐0.14 .848**
.914**
.693**
.879**
.896**
.913**
.923**
.732**
.940**
1.00 .698**
.667**
.430*
.481*
.827**
.650**
.702**
0.27 .758**
0.23 .773**
.704**
.839**
.756**
.830**
.779**
0.21
9‐F .662**
.592**
.552**
0.33 0.01 .421*
0.39 0.14 .627**
.722**
.526**
.683**
.649**
.680**
.708**
.653**
.703**
.698**
1.00 .648**
.611**
.472*
.877**
.681**
.525**
0.29 .685**
0.25 .596**
.630**
.692**
.643**
.646**
.617**
0.29
AQ .568**
.626**
.466*
0.21 ‐0.03 0.20 0.20 ‐0.09 .680**
.692**
.425*
.667**
.749**
.709**
.723**
.517**
.730**
.667**
.648**
1.00 .675**
.706**
.609**
.478*
.525**
.451*
.701**
0.34 .572**
.573**
.622**
.584**
.521**
.569**
.456*
MAQ .465*
.497*
0.39 0.18 ‐0.06 .416*
0.40 ‐0.05 .433*
.522**
0.25 .457*
.514*
.462*
.510*
.463*
.486*
.430*
.611**
.675**
1.00 .797**
.569**
.482*
0.26 0.33 .516**
0.32 .530**
.553**
.554**
.552**
.502*
.445*
0.37
BaQ 0.38 .444*
0.30 ‐0.03 ‐0.21 0.14 0.16 ‐0.16 .494*
.523**
0.26 .463*
.537**
.535**
.573**
.506*
.561**
.481*
.472*
.706**
.797**
1.00 .455*
0.30 0.18 0.25 .500*
0.15 .404*
.406*
.449*
.465*
0.40 .583**
0.36
1‐NNap .827**
.759**
.748**
.467*
0.09 .564**
.583**
0.09 .767**
.853**
.647**
.807**
.808**
.780**
.820**
.694**
.807**
.827**
.877**
.609**
.569**
.455*
1.00 .850**
.602**
0.33 .760**
0.36 .824**
.649**
.785**
.783**
.775**
.728**
0.30
2‐NNap .682**
.678**
.669**
.409*
0.19 .639**
.609**
0.21 .561**
.692**
.422*
.619**
.623**
.526**
.580**
.429*
.600**
.650**
.681**
.478*
.482*
0.30 .850**
1.00 .478*
0.20 .630**
0.39 .775**
.556**
.741**
.670**
.641**
.472*
0.18
DNN .570**
.540**
.543**
0.16 0.12 0.14 0.20 ‐0.19 .559**
.594**
.543**
.566**
.620**
.631**
.579**
.443*
.636**
.702**
.525**
.525**
0.26 0.18 .602**
.478*
1.00 0.01 .586**
.419*
.697**
.440*
.669**
.579**
.559**
.435*
0.17
2‐NFlo 0.20 .427*
0.14 0.22 ‐0.09 0.22 0.33 0.00 0.28 0.30 0.15 0.29 0.35 0.35 0.36 .412*
0.36 0.27 0.29 .451*
0.33 0.25 0.33 0.20 0.01 1.00 .489*
.487*
0.13 0.12 0.05 0.21 0.06 0.35 0.39
9‐NAnt .636**
.710**
.602**
0.29 ‐0.02 0.38 .466*
0.03 .695**
.745**
.561**
.710**
.755**
.775**
.769**
.638**
.849**
.758**
.685**
.701**
.516**
.500*
.760**
.630**
.586**
.489*
1.00 .547**
.648**
.558**
.607**
.526**
.522**
.752**
0.31
1‐NFL 0.21 0.36 0.18 0.14 ‐0.03 0.31 .573**
0.26 0.16 0.22 0.20 0.21 0.28 0.23 0.21 0.21 0.30 0.23 0.25 0.34 0.32 0.15 0.36 0.39 .419*
.487*
.547**
1.00 .415*
0.16 0.31 0.20 0.08 0.18 0.19
2‐NFL .877**
.725**
.847**
.469*
0.21 .585**
.507*
‐0.03 .778**
.840**
.680**
.816**
.821**
.753**
.779**
.546**
.762**
.773**
.596**
.572**
.530**
.404*
.824**
.775**
.697**
0.13 .648**
.415*
1.00 .709**
.880**
.788**
.853**
.675**
0.20
3‐NFL .817**
.557**
.685**
0.39 0.07 .623**
0.25 ‐0.12 .648**
.751**
.625**
.773**
.676**
.687**
.746**
.574**
.697**
.704**
.630**
.573**
.553**
.406*
.649**
.556**
.440*
0.12 .558**
0.16 .709**
1.00 .831**
.670**
.835**
.600**
0.22
4‐NPy .841**
.661**
.750**
.407*
0.14 .620**
0.37 ‐0.01 .681**
.830**
.676**
.833**
.789**
.742**
.797**
.617**
.780**
.839**
.692**
.622**
.554**
.449*
.785**
.741**
.669**
0.05 .607**
0.31 .880**
.831**
1.00 .770**
.893**
.640**
0.10
1‐NPy .839**
.779**
.813**
0.40 0.00 .488*
0.35 ‐0.18 .766**
.872**
.678**
.804**
.841**
.757**
.804**
.583**
.750**
.756**
.643**
.584**
.552**
.465*
.783**
.670**
.579**
0.21 .526**
0.20 .788**
.670**
.770**
1.00 .854**
.680**
.461*
2‐NPy .956**
.724**
.898**
.518**
0.08 .587**
0.29 ‐0.11 .813**
.909**
.768**
.906**
.843**
.802**
.866**
.672**
.806**
.830**
.646**
.521**
.502*
0.40 .775**
.641**
.559**
0.06 .522**
0.08 .853**
.835**
.893**
.854**
1.00 .704**
0.11
7‐NBaA .771**
.630**
.701**
0.38 ‐0.03 0.37 0.33 ‐0.12 .820**
.829**
.737**
.856**
.821**
.877**
.891**
.742**
.876**
.779**
.617**
.569**
.445*
.583**
.728**
.472*
.435*
0.35 .752**
0.18 .675**
.600**
.640**
.680**
.704**
1.00 0.19
6‐NChr 0.13 0.36 0.14 ‐0.01 ‐0.15 0.05 0.18 ‐0.26 0.29 0.28 0.10 0.16 0.35 0.26 0.27 0.12 0.22 0.21 0.29 .456*
0.37 0.36 0.30 0.18 0.17 0.39 0.31 0.19 0.20 0.22 0.10 .461*
0.11 0.19 1.00
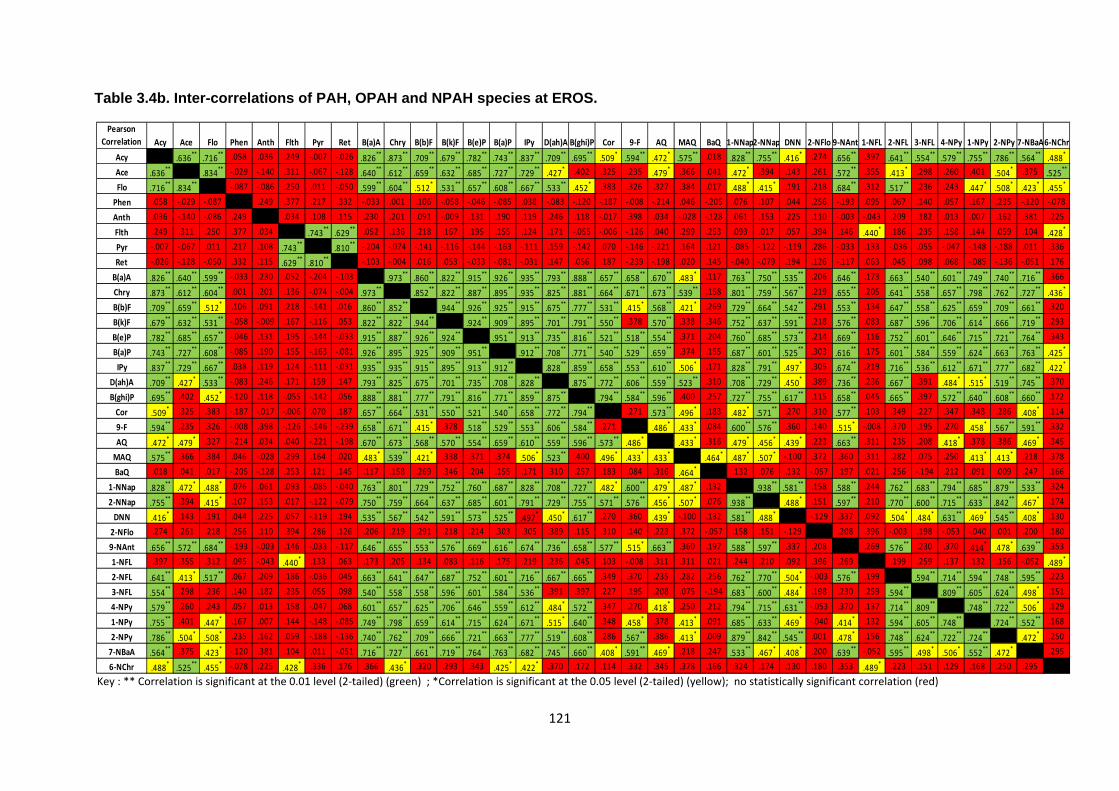
121
Table 3.4b. Inter-correlations of PAH, OPAH and NPAH species at EROS.
Key : ** Correlation is significant at the 0.01 level (2‐tailed) (green) ; *Correlation is significant at the 0.05 level (2‐tailed) (yellow); no statistically significant correlation (red)
Pearson
Correlation Acy Ace Flo Phen Anth Flth Pyr Ret B(a)A Chry B(b)F B(k)F B(e)P B(a)P IPy D(ah)A B(ghi)P Cor 9‐F AQ MAQ BaQ 1‐NNap2‐NNap DNN 2‐NFlo 9‐NAnt 1‐NFL 2‐NFL 3‐NFL 4‐NPy 1‐NPy 2‐NPy 7‐NBaA6‐NChr
Acy 1 .636**
.716** .058 .036 .249 ‐.007 ‐.026 .826
**.873
**.709
**.679
**.782
**.743
**.837
**.709
**.695
**.509
*.594
**.472
*.575
** .018 .828**
.755**
.416* .274 .656
** .397 .641**
.554**
.579**
.755**
.786**
.564**
.488*
Ace .636** 1 .834
** ‐.029 ‐.140 .311 ‐.067 ‐.128 .640**
.612**
.659**
.632**
.685**
.727**
.729**
.427* .402 .325 .235 .479
* .366 .041 .472* .394 .143 .261 .572
** .355 .413* .298 .260 .401 .504
* .375 .525**
Flo .716**
.834** 1 ‐.087 ‐.086 .250 .011 ‐.050 .599
**.604
**.512
*.531
**.657
**.608
**.667
**.533
**.452
* .383 .326 .327 .384 .017 .488*
.415* .191 .218 .684
** .312 .517** .236 .243 .447
*.508
*.423
*.455
*
Phen .058 ‐.029 ‐.087 1 .249 .377 .217 .332 ‐.033 .001 .106 ‐.058 ‐.046 ‐.085 .038 ‐.083 ‐.120 ‐.187 ‐.008 ‐.214 .046 ‐.205 .076 .107 .044 .256 ‐.193 .095 .067 .140 .057 .167 .235 ‐.120 ‐.078
Anth .036 ‐.140 ‐.086 .249 1 .034 .108 .115 .230 .201 .091 ‐.009 .131 .190 .119 .246 .118 ‐.017 .398 .034 ‐.028 ‐.128 .061 .153 .225 .110 ‐.003 ‐.043 .209 .182 .013 .007 .162 .381 .225
Flth .249 .311 .250 .377 .034 1 .743**
.629** .052 .136 .218 .167 .195 .155 .124 .171 ‐.055 ‐.006 ‐.126 .040 .299 .253 .093 .017 .057 .394 .146 .440
* .186 .235 .158 .144 .059 .104 .428*
Pyr ‐.007 ‐.067 .011 .217 .108 .743** 1 .810
** ‐.204 ‐.074 ‐.141 ‐.116 ‐.144 ‐.163 ‐.111 .159 ‐.142 .070 ‐.146 ‐.221 .164 .121 ‐.085 ‐.122 ‐.119 .286 ‐.033 .133 ‐.036 .055 ‐.047 ‐.148 ‐.188 .011 .336
Ret ‐.026 ‐.128 ‐.050 .332 .115 .629**
.810** 1 ‐.103 ‐.004 .016 .053 ‐.033 ‐.081 ‐.031 .147 .056 .187 ‐.239 ‐.198 .020 .145 ‐.040 ‐.079 .194 .126 ‐.117 .063 .045 .098 .068 ‐.085 ‐.136 ‐.051 .176
B(a)A .826**
.640**
.599** ‐.033 .230 .052 ‐.204 ‐.103 1 .973
**.860
**.822
**.915
**.926
**.935
**.793
**.888
**.657
**.658
**.670
**.483
* .117 .763**
.750**
.535** .206 .646
** .173 .663**
.540**
.601**
.749**
.740**
.716** .366
Chry .873**
.612**
.604** .001 .201 .136 ‐.074 ‐.004 .973
** 1 .852**
.822**
.887**
.895**
.935**
.825**
.881**
.664**
.671**
.673**
.539** .158 .801
**.759
**.567
** .219 .655** .205 .641
**.558
**.657
**.798
**.762
**.727
**.436
*
B(b)F .709**
.659**
.512* .106 .091 .218 ‐.141 .016 .860
**.852
** 1 .944**
.926**
.925**
.915**
.675**
.777**
.531**
.415*
.568**
.421* .269 .729
**.664
**.542
** .291 .553** .134 .647
**.558
**.625
**.659
**.709
**.661
** .320
B(k)F .679**
.632**
.531** ‐.058 ‐.009 .167 ‐.116 .053 .822
**.822
**.944
** 1 .924**
.909**
.895**
.701**
.791**
.550** .378 .570
** .338 .346 .752**
.637**
.591** .218 .576
** .083 .687**
.596**
.706**
.614**
.666**
.719** .293
B(e)P .782**
.685**
.657** ‐.046 .131 .195 ‐.144 ‐.033 .915
**.887
**.926
**.924
** 1 .951**
.913**
.735**
.816**
.521**
.518**
.554** .371 .204 .760
**.685
**.573
** .214 .669** .116 .752
**.601
**.646
**.715
**.721
**.764
** .343
B(a)P .743**
.727**
.608** ‐.085 .190 .155 ‐.163 ‐.081 .926
**.895
**.925
**.909
**.951
** 1 .912**
.708**
.771**
.540**
.529**
.659** .374 .155 .687
**.601
**.525
** .303 .616** .175 .601
**.584
**.559
**.624
**.663
**.763
**.425
*
IPy .837**
.729**
.667** .038 .119 .124 ‐.111 ‐.031 .935
**.935
**.915
**.895
**.913
**.912
** 1 .828**
.859**
.658**
.553**
.610**
.506* .171 .828
**.791
**.497
* .305 .674** .219 .716
**.536
**.612
**.671
**.777
**.682
**.422
*
D(ah)A .709**
.427*
.533** ‐.083 .246 .171 .159 .147 .793
**.825
**.675
**.701
**.735
**.708
**.828
** 1 .875**
.772**
.606**
.559**
.523** .310 .708
**.729
**.450
* .389 .736** .236 .667
** .391 .484*
.515*
.519**
.745** .370
B(ghi)P .695** .402 .452
* ‐.120 .118 ‐.055 ‐.142 .056 .888**
.881**
.777**
.791**
.816**
.771**
.859**
.875** 1 .794
**.584
**.596
** .400 .257 .727**
.755**
.617** .115 .658
** .045 .665** .397 .572
**.640
**.608
**.660
** .172
Cor .509* .325 .383 ‐.187 ‐.017 ‐.006 .070 .187 .657
**.664
**.531
**.550
**.521
**.540
**.658
**.772
**.794
** 1 .271 .573**
.496* .183 .482
*.571
** .270 .310 .577** .103 .349 .227 .347 .348 .286 .408
* .114
9‐F .594** .235 .326 ‐.008 .398 ‐.126 ‐.146 ‐.239 .658
**.671
**.415
* .378 .518**
.529**
.553**
.606**
.584** .271 1 .486
*.433
* .084 .600**
.576** .360 .140 .515
* ‐.008 .370 .195 .270 .458*
.567**
.591** .332
AQ .472*
.479* .327 ‐.214 .034 .040 ‐.221 ‐.198 .670
**.673
**.568
**.570
**.554
**.659
**.610
**.559
**.596
**.573
**.486
* 1 .433* .316 .479
*.456
*.439
* .223 .663** .311 .235 .208 .418
* .378 .386 .469* .345
MAQ .575** .366 .384 .046 ‐.028 .299 .164 .020 .483
*.539
**.421
* .338 .371 .374 .506*
.523** .400 .496
*.433
*.433
* 1 .464*
.487*
.507* ‐.100 .372 .360 .311 .282 .075 .250 .413
*.413
* .218 .378
BaQ .018 .041 .017 ‐.205 ‐.128 .253 .121 .145 .117 .158 .269 .346 .204 .155 .171 .310 .257 .183 .084 .316 .464* 1 .132 .076 .132 ‐.057 .197 .021 .256 ‐.194 .212 .091 .009 .247 .166
1‐NNap .828**
.472*
.488* .076 .061 .093 ‐.085 ‐.040 .763
**.801
**.729
**.752
**.760
**.687
**.828
**.708
**.727
**.482
*.600
**.479
*.487
* .132 1 .938**
.581** .158 .588
** .244 .762**
.683**
.794**
.685**
.879**
.533** .324
2‐NNap .755** .394 .415
* .107 .153 .017 ‐.122 ‐.079 .750**
.759**
.664**
.637**
.685**
.601**
.791**
.729**
.755**
.571**
.576**
.456*
.507* .076 .938
** 1 .488* .151 .597
** .210 .770**
.600**
.715**
.633**
.842**
.467* .174
DNN .416* .143 .191 .044 .225 .057 ‐.119 .194 .535
**.567
**.542
**.591
**.573
**.525
**.497
*.450
*.617
** .270 .360 .439* ‐.100 .132 .581
**.488
* 1 ‐.129 .337 .092 .504*
.484*
.631**
.469*
.545**
.408* .130
2‐NFlo .274 .261 .218 .256 .110 .394 .286 .126 .206 .219 .291 .218 .214 .303 .305 .389 .115 .310 .140 .223 .372 ‐.057 .158 .151 ‐.129 1 .208 .396 ‐.003 .198 ‐.053 ‐.040 .001 .200 .180
9‐NAnt .656**
.572**
.684** ‐.193 ‐.003 .146 ‐.033 ‐.117 .646
**.655
**.553
**.576
**.669
**.616
**.674
**.736
**.658
**.577
**.515
*.663
** .360 .197 .588**
.597** .337 .208 1 .269 .576
** .230 .370 .414*
.478*
.639** .353
1‐NFL .397 .355 .312 .095 ‐.043 .440* .133 .063 .173 .205 .134 .083 .116 .175 .219 .236 .045 .103 ‐.008 .311 .311 .021 .244 .210 .092 .396 .269 1 .199 .259 .137 .132 .156 ‐.052 .489
*
2‐NFL .641**
.413*
.517** .067 .209 .186 ‐.036 .045 .663
**.641
**.647
**.687
**.752
**.601
**.716
**.667
**.665
** .349 .370 .235 .282 .256 .762**
.770**
.504* ‐.003 .576
** .199 1 .594**
.714**
.594**
.748**
.595** .223
3‐NFL .554** .298 .236 .140 .182 .235 .055 .098 .540
**.558
**.558
**.596
**.601
**.584
**.536
** .391 .397 .227 .195 .208 .075 ‐.194 .683**
.600**
.484* .198 .230 .259 .594
** 1 .809**
.605**
.624**
.498* .151
4‐NPy .579** .260 .243 .057 .013 .158 ‐.047 .068 .601
**.657
**.625
**.706
**.646
**.559
**.612
**.484
*.572
** .347 .270 .418* .250 .212 .794
**.715
**.631
** ‐.053 .370 .137 .714**
.809** 1 .748
**.722
**.506
* .129
1‐NPy .755** .401 .447
* .167 .007 .144 ‐.148 ‐.085 .749**
.798**
.659**
.614**
.715**
.624**
.671**
.515*
.640** .348 .458
* .378 .413* .091 .685
**.633
**.469
* ‐.040 .414* .132 .594
**.605
**.748
** 1 .724**
.552** .168
2‐NPy .786**
.504*
.508* .235 .162 .059 ‐.188 ‐.136 .740
**.762
**.709
**.666
**.721
**.663
**.777
**.519
**.608
** .286 .567** .386 .413
* .009 .879**
.842**
.545** .001 .478
* .156 .748**
.624**
.722**
.724** 1 .472
* .250
7‐NBaA .564** .375 .423
* ‐.120 .381 .104 .011 ‐.051 .716**
.727**
.661**
.719**
.764**
.763**
.682**
.745**
.660**
.408*
.591**
.469* .218 .247 .533
**.467
*.408
* .200 .639** ‐.052 .595
**.498
*.506
*.552
**.472
* 1 .295
6‐NChr .488*
.525**
.455* ‐.078 .225 .428
* .336 .176 .366 .436* .320 .293 .343 .425
*.422
* .370 .172 .114 .332 .345 .378 .166 .324 .174 .130 .180 .353 .489* .223 .151 .129 .168 .250 .295 1

122
PAHs such as Cor, BPy and IPy, especially in the case of 9F and AQ. This may indicate the strong
traffic input of AQ and 9F, more predominantly from gasoline-fuelled vehicles, with a relatively
lower input of MAQ and BaAQ from traffic. This is in contrast to the study of Alam et al. (2013)
which suggested MAQ as a possible marker for traffic-related emissions.
BaAQ and MAQ are shown to be very strongly correlated, possibly indicating the presence of a
common source for these compounds. At EROS, BaAQ shows no significant correlation with other
PAH, OPAH and NPAH compounds, possibly suggesting the presence of a non-traffic source of
this compound influencing predominantly at EROS.
At both sites, 2NFlo, 6NChr and 1NFlu do not display significant correlation with most other
compounds, possibly indicating the presence of a non-traffic source for these compounds. 1NNap,
2NNap, 9NAnt, 1NPyr, 7NBaA are shown to be significantly inter-correlated at both sites and also
strongly correlated with traffic-related HMW PAHs, such as Cor and BPy, consistent with traffic
being the main source of these NPAHs at both sites. The strongest NPAH inter-correlations at
BROS and EROS are for 2NFlt and 2NPyr, possibly reflecting their common reactive input. This is
in agreement with Feilberg et al. (2001) who measured NPAH concentrations in the urban
atmosphere in Copenhagen, Denmark. 4NPyr also displays strong correlations with 2NFlt and
2NPyr, possibly also indicating reactive input of this compound.
Interestingly, 2NFlt and 2NPyr, do not display a correlation with their parent PAH. However, they
do display strong correlations with compounds associated with primary emission sources e.g.
1NPyr, BeP and IPy. Feilberg et al. (2001) also noted a significant correlation between 2NFlt and
primary PAHs BeP and BPy at a rural site in Denmark. The authors suggested that the level of
NPAHs formed via atmospheric reactions are also dependent on the PAH levels and that these
compounds act as a better marker than the actual parent PAHs as they are present almost entirely
in the particle-phase like the 2NFlt and 2NPyr while Flt and Pyr observed predominantly in the gas-
phase and are subject to temperature-dependent phase partitioning.

123
3.2.2. Correlations with inorganic air pollutants and meteorological parameters
The relationship between measured PAH, OPAHs and NPAH concentrations and the levels of
inorganic air pollutants such as TSP, NOx, O3 and SO2, as well as meteorological factors such as
temperature, wind speed , wind direction, pressure and intensity of solar radiation, may also
provide insight into the sources, behaviour and fate of these compounds.
Table 3.5a and 3.5b provide Pearson correlation coefficients for the measured PAH, OPAH and
NPAH compounds with these key parameters. It should be noted that the values for meteorological
variables are provided for Birmingham University sampling site as a whole so may only be of
limited usefulness for assessing differences in compound behaviour between sites. The
concentrations of NOx, O3 and SO2 were obtained from the Birmingham Tyburn monitoring site,
located ~6-7km away from BROS and EROS, therefore these relationships need to be viewed with
caution as these may not adequately represent the levels observed at the sampling sites but offer
the most representative values available.
3.2.2.1. Correlations of PAH, OPAH and NPAH with TSP
Most compounds at BROS correlate strongly with measured TSP concentration. This suggests that
most compounds are associated strongly with freshly emitted local sources from Bristol Road
traffic. The exceptions to this include LWM compounds Phe, Ant, Flth, Pyr, Ret and 2NFlo, possibly
indicating the influence of additional/alternative sources dominating for these compounds. At
EROS, the correlation with TSP appears to be weaker, although still statistically significant for most
compounds, consistent with the traffic source dominating at both sites and the greater distance of
EROS from the road traffic source.
Interestingly, for OPAH compounds, while significant correlations with TSP are seen at BROS,
indicating a close associating with primary emissions, no significant correlations are observed for
these compounds at EROS. In the case of 9F and AQ, this may suggest the influence of increased
partitioning into the gas-phase and/or secondary input from photooxidation reactions or local
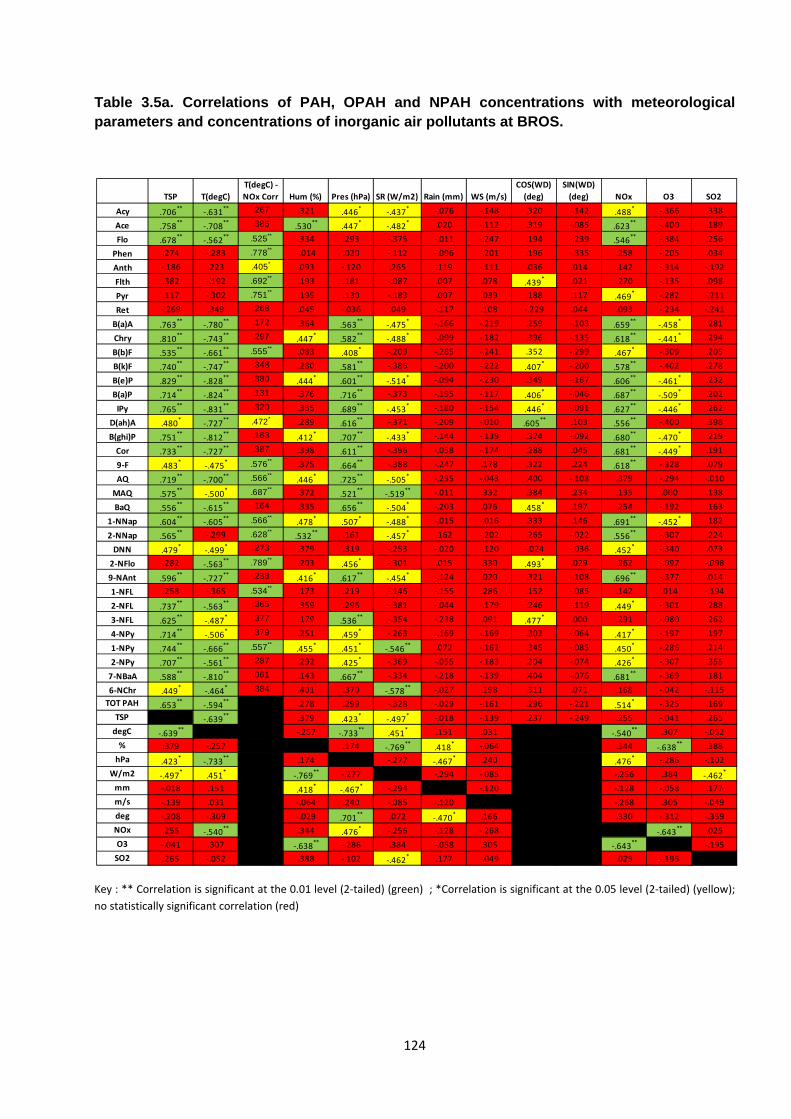
124
Table 3.5a. Correlations of PAH, OPAH and NPAH concentrations with meteorological parameters and concentrations of inorganic air pollutants at BROS.
Key : ** Correlation is significant at the 0.01 level (2‐tailed) (green) ; *Correlation is significant at the 0.05 level (2‐tailed) (yellow);
no statistically significant correlation (red)
TSP T(degC)
T(degC) ‐
NOx Corr Hum (%) Pres (hPa) SR (W/m2) Rain (mm) WS (m/s)
COS(WD)
(deg)
SIN(WD)
(deg) NOx O3 SO2
Acy .706**
‐.631** .267 .321 .446
*‐.437
* ‐.076 ‐.148 .320 ‐.142 .488* ‐.366 .338
Ace .758**
‐.708** .385 .530
**.447
*‐.482
* .020 ‐.112 .319 ‐.085 .623** ‐.400 .189
Flo .678**
‐.562** .525** .334 .293 ‐.375 ‐.011 ‐.247 .194 ‐.239 .546
** ‐.384 .256
Phen .274 ‐.283 .778** ‐.014 .020 ‐.112 ‐.096 ‐.201 .196 ‐.335 .258 ‐.205 .034
Anth ‐.186 .223 .405* .093 ‐.120 .265 .119 ‐.111 .036 .014 .142 ‐.314 ‐.192
Flth .382 ‐.192 .692** .193 .181 ‐.087 .007 .078 .439* .021 .270 ‐.135 .098
Pyr .117 ‐.302 .751** .195 .130 ‐.183 .007 .039 .188 .117 .469* ‐.282 ‐.211
Ret ‐.269 .349 .268 .045 ‐.036 .049 ‐.117 .108 ‐.229 .044 .093 ‐.234 ‐.241
B(a)A .763**
‐.780** .172 .364 .563
**‐.475
* ‐.166 ‐.219 .259 ‐.103 .659**
‐.458* .281
Chry .810**
‐.743** .297 .447
*.582
**‐.488
* ‐.099 ‐.182 .396 ‐.135 .618**
‐.441* .294
B(b)F .535**
‐.661** .555** .083 .408
* ‐.209 ‐.285 ‐.241 .352 ‐.299 .467* ‐.309 .205
B(k)F .740**
‐.747** .348 .280 .581
** ‐.386 ‐.200 ‐.222 .407* ‐.200 .578
** ‐.402 .278
B(e)P .829**
‐.828** .380 .444
*.601
**‐.514
* ‐.094 ‐.230 .349 ‐.167 .606**
‐.461* .232
B(a)P .714**
‐.824** .131 .376 .716
** ‐.373 ‐.195 ‐.117 .406* ‐.046 .687
**‐.509
* .202
IPy .765**
‐.831** .320 .355 .689
**‐.453
* ‐.180 ‐.154 .446* ‐.091 .627
**‐.446
* .262
D(ah)A .480*
‐.727** .472* .289 .616
** ‐.371 ‐.209 ‐.010 .605** .103 .556
** ‐.400 .398
B(ghi)P .751**
‐.812** .163 .412
*.707
**‐.433
* ‐.144 ‐.139 .374 ‐.092 .680**
‐.470* .219
Cor .733**
‐.727** .387 .398 .611
** ‐.396 ‐.058 ‐.174 .288 .045 .681**
‐.449* .191
9‐F .483*
‐.475* .576** .375 .664
** ‐.388 ‐.247 .178 .322 .224 .618** ‐.328 .079
AQ .719**
‐.700** .566**
.446*
.725**
‐.505* ‐.235 ‐.043 .400 ‐.108 .379 ‐.294 ‐.010
MAQ .575**
‐.500* .687** .372 .521
**‐.519
** ‐.011 .332 .384 .234 .135 .000 .138
BaQ .556**
‐.615** .164 .335 .656
**‐.504
* ‐.203 .076 .458* .197 .254 ‐.192 .163
1‐NNap .604**
‐.605** .566**
.478*
.507*
‐.488* ‐.015 ‐.016 .333 .146 .691
**‐.452
* .182
2‐NNap .565** ‐.299 .628**
.532** .161 ‐.457
* .162 ‐.202 .265 ‐.022 .556** ‐.307 .224
DNN .479*
‐.499* .273 .379 .319 ‐.253 ‐.020 ‐.120 ‐.024 ‐.036 .452
* ‐.340 .073
2‐NFlo .282 ‐.563** .789** .203 .456
* ‐.301 .015 .330 .493* .029 .262 ‐.097 ‐.098
9‐NAnt .596**
‐.727** .238 .416
*.617
**‐.454
* ‐.124 .020 .321 ‐.108 .696** ‐.377 .014
1‐NFL .258 ‐.365 .534** .173 .219 ‐.146 ‐.155 .286 .152 ‐.085 .142 .014 ‐.194
2‐NFL .737**
‐.563** .365 .359 .296 ‐.381 ‐.044 ‐.179 .246 ‐.119 .449
* ‐.301 .288
3‐NFL .625**
‐.487* .377 .179 .536
** ‐.354 ‐.238 .091 .477* .000 .291 ‐.080 .262
4‐NPy .714**
‐.506* .379 .251 .459
* ‐.263 ‐.169 ‐.169 .302 ‐.064 .417* ‐.197 .197
1‐NPy .744**
‐.666** .557**
.455*
.451*
‐.546** .072 ‐.162 .345 ‐.085 .450
* ‐.286 .214
2‐NPy .707**
‐.561** .287 .292 .425
* ‐.369 ‐.055 ‐.183 .304 ‐.074 .426* ‐.307 .355
7‐NBaA .588**
‐.810** .061 .143 .667
** ‐.334 ‐.218 ‐.139 .404 ‐.076 .681** ‐.369 .181
6‐NChr .449*
‐.464* .384 .401 .370 ‐.578
** ‐.027 .198 .311 .071 .168 ‐.042 ‐.115
TOT PAH .653**
‐.594** .278 .299 ‐.328 ‐.029 ‐.161 .296 ‐.221 .514
* ‐.325 .169
TSP 1 ‐.639** .379 .423
*‐.497
* ‐.018 ‐.139 .237 ‐.249 .255 ‐.041 .265
degC ‐.639** 1 ‐.257 ‐.733
**.451
* .151 .031 ‐.540** .307 ‐.052
% .379 ‐.257 1 .174 ‐.769**
.418* ‐.064 .344 ‐.638
** .388
hPa .423*
‐.733** .174 1 ‐.277 ‐.467
* .240 .476* ‐.286 ‐.102
W/m2 ‐.497*
.451*
‐.769** ‐.277 1 ‐.294 ‐.085 ‐.256 .384 ‐.462
*
mm ‐.018 .151 .418*
‐.467* ‐.294 1 ‐.120 ‐.128 ‐.058 .177
m/s ‐.139 .031 ‐.064 .240 ‐.085 ‐.120 1 ‐.268 .305 ‐.049
deg ‐.208 ‐.309 ‐.029 .701** .072 ‐.470
* .166 .330 ‐.312 ‐.359
NOx .255 ‐.540** .344 .476
* ‐.256 ‐.128 ‐.268 1 ‐.643** .025
O3 ‐.041 .307 ‐.638** ‐.286 .384 ‐.058 .305 ‐.643
** 1 ‐.195
SO2 .265 ‐.052 .388 ‐.102 ‐.462* .177 ‐.049 .025 ‐.195 1

125
Table 3.5b. Correlations of PAH, OPAH and NPAH concentrations with meteorological parameters and concentrations of inorganic air pollutants at EROS.
Key : ** Correlation is significant at the 0.01 level (2‐tailed) (green) ; *Correlation is significant at the 0.05 level (2‐tailed) (yellow);
no statistically significant correlation (red)
TSP T(degC)
T(degC)‐
NOx Corr Hum (%) Pres (hPa)
SR
(W/m2) Rain (mm) WS (m/s)
COS WD
(deg)
SIN WD
(deg) NOx O3 SO2
Acy .407*
‐.589**
.512*
.416*
.354 ‐.580**
‐.087 ‐.110 .464*
‐.212 .463*
‐.305 .334
Ace .724**
‐.657**
.338 .338 .416*
‐.416*
‐.089 .006 .281 ‐.120 .373 ‐.136 .115
Flo .526**
‐.520**
.684**
.429*
.283 ‐.555**
.078 .024 .122 ‐.046 .488*
‐.217 .150
Phen ‐.175 .095 .688**
‐.169 ‐.200 .120 ‐.102 .033 .161 ‐.070 ‐.011 ‐.102 ‐.023
Anth ‐.013 ‐.006 .752**
.247 .185 ‐.049 ‐.072 .156 .242 .097 .222 ‐.372 .007
Flth .062 ‐.296 .361 .072 .196 ‐.157 ‐.162 .163 .471*
.126 .173 ‐.021 ‐.128
Pyr ‐.150 .034 .783**
.000 .200 ‐.084 ‐.070 .272 .355 .304 .081 .018 ‐.276
Ret ‐.106 .021 .576**
.008 .188 ‐.043 ‐.131 .014 .099 .038 .118 ‐.207 ‐.452*
B(a)A .527**
‐.630**
.510*
.418*
.478*
‐.481*
‐.150 ‐.286 .329 ‐.255 .546**
‐.428*
.336
Chry .475*
‐.640**
.144 .427*
.548**
‐.529**
‐.181 ‐.227 .442*
‐.194 .548**
‐.411*
.319
B(b)F .632**
‐.770**
.158 .196 .582**
‐.352 ‐.350 ‐.267 .372 ‐.294 .463*
‐.341 .238
B(k)F .665**
‐.807**
.395 .183 .652**
‐.375 ‐.298 ‐.290 .313 ‐.194 .519**
‐.379 .187
B(e)P .641**
‐.799**
.106 .373 .540**
‐.484*
‐.145 ‐.317 .312 ‐.222 .618**
‐.448*
.311
B(a)P .657**
‐.817**
.140 .338 .656**
‐.405*
‐.240 ‐.195 .392 ‐.236 .551**
‐.404 .225
IPy .640**
‐.686**
.174 .371 .543**
‐.527**
‐.231 ‐.223 .386 ‐.189 .546**
‐.428*
.333
D(ah)A .320 ‐.496*
.298 .380 .490*
‐.581**
‐.174 ‐.128 .343 .003 .629**
‐.431*
.313
B(ghi)P .362 ‐.486*
‐.013 .332 .432*
‐.442*
‐.186 ‐.401 .137 ‐.232 .604**
‐.471*
.274
Cor .307 ‐.217 ‐.041 .176 .286 ‐.336 ‐.126 ‐.283 .088 ‐.312 .324 ‐.141 .098
9‐F .147 ‐.285 .139 .326 .367 ‐.344 ‐.222 ‐.023 .282 ‐.002 .478*
‐.331 .342
AQ .383 ‐.393 .479*
.275 .443*
‐.206 ‐.342 ‐.278 .390 ‐.228 .413*
‐.202 .201
MAQ .227 ‐.108 .596**
.233 .067 ‐.435*
‐.141 ‐.035 .396 ‐.148 ‐.078 .039 .364
BaQ .027 ‐.172 .719**
‐.065 .194 ‐.107 ‐.311 ‐.214 .108 .125 .090 ‐.069 ‐.005
1‐NNap .540**
‐.530**
.287 .338 .380 ‐.495*
‐.136 ‐.216 .337 ‐.080 .435*
‐.322 .389
2‐NNap .487*
‐.324 .430*
.315 .194 ‐.431*
‐.090 ‐.261 .245 ‐.140 .370 ‐.258 .472*
DNN .169 ‐.463*
.488*
.330 .495*
‐.182 ‐.216 ‐.249 .109 .060 .658**
‐.603**
.002
2‐NFlo .124 ‐.245 ‐.224 ‐.020 .278 ‐.244 ‐.314 .440*
.382 .039 .060 .021 .274
9‐NAnt .421*
‐.458*
.660**
.249 .297 ‐.352 ‐.173 ‐.308 .236 ‐.247 .678**
‐.179 .200
1‐NFL .041 ‐.177 .321 .295 ‐.022 ‐.318 ‐.078 .228 .285 .008 .020 ‐.055 .085
2‐NFL .454*
‐.455*
.603**
.258 .169 ‐.380 ‐.042 ‐.351 .136 ‐.005 .522**
‐.424*
.333
3‐NFL .453*
‐.559**
.233 .168 .355 ‐.266 .078 ‐.048 .337 ‐.031 .217 ‐.165 .234
4‐NPy .430*
‐.478*
.439*
.162 .333 ‐.302 ‐.061 ‐.333 .324 ‐.011 .289 ‐.211 .320
1‐NPy .228 ‐.518**
.287 .341 .199 ‐.486*
.150 ‐.323 .340 ‐.154 .332 ‐.244 .431*
2‐NPy .485*
‐.425*
.558**
.293 .254 ‐.279 ‐.106 ‐.254 .343 ‐.120 .396 ‐.362 .380
7‐NBaA .349 ‐.698**
.380 .189 .592**
‐.350 ‐.098 ‐.166 .431*
‐.056 .634**
‐.355 .206
6‐NChr .362 ‐.490*
.065 .454*
.522**
‐.485*
‐.270 .154 .576**
.069 .287 ‐.248 ‐.120
TSP 1 ‐.549**
.262 .439*
‐.331 ‐.112 ‐.150 .177 ‐.232 .155 ‐.084 .149
degC ‐.549**
1 ‐.257 ‐.733**
.451*
.151 .031 1 .072 ‐.540**
.307 ‐.052
% .262 ‐.257 1 .174 ‐.769**
.418*
‐.064 .072 1 .344 ‐.638**
.388
hPa .439*
‐.733**
.174 1 ‐.277 ‐.467*
.240 .476*
‐.286 ‐.102
W/m2 ‐.331 .451*
‐.769**
‐.277 1 ‐.294 ‐.085 ‐.256 .384 ‐.462*
mm ‐.112 .151 .418*
‐.467*
‐.294 1 ‐.120 ‐.128 ‐.058 .177
m/s ‐.150 .031 ‐.064 .240 ‐.085 ‐.120 1 ‐.268 .305 ‐.049
deg ‐.151 ‐.309 ‐.029 .701**
.072 ‐.470*
.166 .330 ‐.312 ‐.359
NOx .155 ‐.540**
.344 .476*
‐.256 ‐.128 ‐.268 1 ‐.643**
.025
O3 ‐.084 .307 ‐.638**
‐.286 .384 ‐.058 .305 ‐.643**
1 ‐.195
SO2 .149 ‐.052 .388 ‐.102 ‐.462*
.177 ‐.049 .025 ‐.195 1

126
volatilisation between the two sites. In the case of MAQ and BaAQ this may indicate an additional
source that influences EROS to a higher degree than BROS.
3.2.2.2. Correlations of PAH, OPAH and NPAH with NOx
Most compounds in this study display a significant positive correlation with NOx, This can be
interpreted in a number of ways:
Firstly, NOx is expected to result predominantly from local road traffic in this area (Lim et al., 1999)
therefore this relationship may reflect the intensity of vehicle exhaust input. For example, Feilberg
et al. (2001) indicted that at an urban location in Copenhagen, 1NPyr and 9NAnt correlated with
traffic gas NO while 2NFlt and 2NPyr did not, reflecting the importance of direct vehicle emissions
over atmospheric formation. However, in the present study 1NPty, 9NAnt, 2NFlt and 2NPyr were
shown to correlate with NOx at BROS and/or EROS. A number of compounds (e.g. Phe, Ant, Flt,
Pyr, Ret, AQ, MAQ, BaQ, 2NFlo, 1NFlt, 3NFlt, 6NChr) display weaker or no correlation with NOx,
possibly indicating different primary sources and/or processes governing their concentrations.
It has also been suggested that NPAH may be formed (in the particle-phase) from direct reaction of
PAH with NO2 (Inazu et al., 1997; Kwok et al., 1995; Ma et al., 2011; Miet et al., 2009c; Wang et
al., 2000) therefore it has been suggested a positive correlation could reflect secondary NPAH
input in this way (Feilberg et al. 2001). This was observed for a number of NPAHs at BROS. The
compounds for which a significant correlation remains at EROS include 9NAnt, 2NFlt and 7NBaA
which have been observed as NO2 heterogeneous reaction products (Inazu et al., 1997; Liu et al.,
2012; Ma et al., 2011; Zhang et al., 2011).
However, NOx also displays a significant (p<0.01) negative correlation with temperature. Since NOx
is expected to result primarily from local road traffic in this area, this relationship indicates that the
relationship observed between PAH, OPAH and NPAH with NOx may be more reflective of the
temperature-dependence of the atmospheric boundary layer (ABL) height rather than the
magnitude of primary or secondary input.
127
3.2.2.3. Correlations of PAH, OPAH and NPAH with O3
A number of compounds display a weak (yet statistically significant) negative correlation with O3
concentrations. This was observed more commonly for compounds found predominantly in the
particulate phase (e.g. BaA, Chr, IPy, BeP, BaP, DBA, BPy and Cor).
It has been shown that these compounds can undergo heterogeneous reactions with O3 on particle
surfaces (Kwamena et al., 2004; 2006; Perraudin et al., 2007). Relatively weak negative
correlations were between NPAHs with O3 were previously reported by Feilberg et al. (2001)
possibly indicating O3 reactions as a possible nighttime degradation pathway. However, this was
not indicated to be a significant process for NPAHs in this study with only a small number of
compounds displaying weak negative correlation with O3.
It is expected that heterogeneous reactivity is not the cause of the negative correlation observed in
the present study as this is more consistent with the strong negative correlation observed between
O3 and NOx which is likely to be due to reactions occurring between O3 and NO.
3.2.2.4. Temperature-dependence of PAH, OPAH and NPAH concentrations
Most compounds (with the exception of Phe, Ant, Flt, Pyr, Ret, 2NNap and 1NFlt) display a
significant negative correlation with temperature. This is more prevalent at BROS with weaker or
absent correlations present for some compounds at EROS. A similar observation was made for
PAH, OPAH and NPAH in southern China (Wei et al., 2012). This could indicate the primary
sources influencing the levels of these compounds are seasonal in nature, with higher emission
strength occurring in winter, for example due to domestic combustion of solid fuels for space
heating.
However, the negative correlation between temperature and NOx highlights the possible
importance of the ABL height on pollutant concentrations. To test this theory, measured PAH,
OPAH and NPAH concentrations were ‘corrected’ by dividing the observed concentrations by the
128
corresponding NOx concentration at Birmingham Tyburn (see Section 2) for each sampling period
to reflect the seasonal variation in ABL height, so variations caused only by source strength can be
assessed. It should be noted that CO has been previously used for PAH ‘corrections’ as it is
considered a more appropriate traffic-marker compound (Reisen and Arey, 2005). However, CO
measurements were not available as this species is no longer measured at the Birmingham Tyburn
site. The NOx-corrected concentrations were then correlated with temperature. This method has
been utilised at this site previously by Dimashki et al. (2001). The authors hypothesised that
following correlation behaviour could be interpreted in terms of the prevailing emissions sources as
follows :
i) a significant negative correlation would indicate seasonally modulated space heating as a
dominant source
ii) no significant correlation would indicate the dominance of road traffic as an emission source
iii) a significant positive correlation would indicate the influence of volatilisation from surfaces.
It is shown (Table 3.6) that the correlation of most NOx-corrected compounds with temperature is
not significant, consistent with traffic being the dominant emission source at both sites. It is
expected, therefore that highest concentrations of most compounds occur under relatively cold,
stable conditions when vertical transport is restricted, leading to relatively slow dispersion. This is
also consistent with a significant positive correlation observed for most compounds with
atmospheric pressure.
For a number of compounds, a significant positive correlation is observed between NOx-corrected
concentrations and temperature (Table 3.6). This positive correlation could be indicative of input
via volatilisation from road, pavement, vegetation or soil surfaces at these sites, which is likely to
be enhanced during warmer conditions.
129
This behaviour is observed mostly for LMW 3-4 ring species (e.g. Flo, Phe, Ant, Flt, Pyr, Ret, 9F,
AQ, 1NNap, 2NNap, 2NFlo) and relatively few HMW compounds (1NFlt, 1NPyr, MAQ, BaQ). This
is consistent with higher volatility of these lighter compounds, possibly facilitating a higher
tendency towards evaporation from surfaces or soil.
Dimashki et al. (2001) also found no correlation with temperature for most NOx corrected PAHs in
Birmingham, consistent with a non-seasonal traffic source dominating, but observed positive
correlations for LMW PAHs Phe, Flo and Flu, indicating the possible input of these compounds
from surface volatilisation. Similarly, Harrad and Laurie (2005) observed no correlation between
‘non-corrected’ PAH concentrations and temperature at these sites, which the authors attributed to
a seasonal pattern (higher emissions in winter) being buffered by volatilization during summer.
Interestingly, positive correlations of ‘corrected’ concentrations of 9NAnt, 2NFlt, 4NPyr and 2NPyr
are observed at EROS but not BROS. These compounds are formed, partly or entirely, by
photochemical reactions, which may be higher during the warmer summer conditions. However, no
correlation was noted for these compounds with solar radiation intensity so the nature of apparent
the temperature-dependence of these compounds is unclear.
3.2.2.5. Correlations of PAH, OPAH and NPAH with rainfall, wind speed and wind direction
No correlation was observed for PAH, OPAH or NPAH concentrations with rainfall. This is
consistent with previous studies at these sites (Laurie, 2003). Prevedouros et al. (2004b) also
indicated that the influence of scavenging by rainfall will have minor influence on atmospheric PAH
concentrations.
Furthermore, no correlation was noted between any measured compound and wind speed at either
site. This is in contrast to the findings of Harrad and Laurie (2005) where a significant negative
correlation was observed for most PAHs at both sites, the authors suggesting higher
concentrations were therefore observed under relatively still, calm conditions.

130
The measurement Sin(WD) is an indication of east-west wind direction. No significant correlation
was observed between compound concentrations and Sin(WD), suggesting the absence of a
significant emission source to the east or west of the sampling sites. This is broadly consistent with
the findings of Harrad and Laurie (2005)
Cos(WD) is an indication of the north-south wind direction. Weak yet significant negative
correlation between concentrations and Cos(WD) was observed for only for a small number of
compounds (BkF, BaP, DBA, BaAQ, 2NFlo, 3NFlu at BROS ; Acy, Flu, Chr, 7BaA, 6NChr at
EROS). Harrad and Lauie (2005) previously reported a significant negative correlation for most
LMW PAHs with cosWD at BROS but not at EROS. This suggested the levels of LMW PAHs were
higher during periods of low wind and air arriving from the south (Bristol Road) but were not
influenced to a large degree by wind direction at EROS. Most HMW PAH did not show a significant
correlation with cosWD.
3.3. Seasonal variation in PAH, OPAH and NPAH levels
3.3.1. PAH seasonality
The mean concentrations (particulate + vapour) of PAHs measured only in summer and winter
samples are compared in Figure 3.6a and 3.6b for BROS and EROS respectively. It should be
noted that these ‘seasonal’ concentrations are based on a relatively small number of samples
(n=7) taken during the summer and winter months respectively.
It assumed that these values are representative of concentrations for the full season, which may
not be the case so results need to be interpreted with caution. The mean temperature measured
on the ‘winter’ sampling days was ~6 oC while the mean temperature on ‘summer’ sampling days
was ~15 oC. Interestingly, the mean temperature measured at Birmingham Tyburn during all winter
days (Dec 2011 – Feb 2012) was 4.8 oC while the mean summer temperature (June 2012 – Aug
2012) was 14.9 oC.
131
Mean NOx concentrations measured at Tyburn were 55 μg/m3 and 38 μg/m3 during the winter and
summer sampling days respectively. The mean NOx concentration measured at Tyburn for the
whole seasons was 76 μg/m3 for winter months and 33 μg/m3 for summer months. This may
therefore suggest that the observed concentrations and conditions in this campaign may be
representative of the respective seasons.
Generally, higher concentrations are observed in winter at both sites for most compounds
compared with summer samples. However the nature and extent of the observed seasonal profile
is highly variable between species and between the two sites. The observed winter (W) to summer
(S) ratio of >1 could be caused by an increased concentration in winter and/or reduced
concentration in summer.
This seasonal trend has been observed for PAHs in previous air sampling studies (Cortes et al.,
2000; Cortes and Hites, 2000; Dimashki et al., 2001; Holoubek et al., 2007; Meijer et al., 2008;
Smith and Harrison, 1996; Sun et al., 2006).
The key factors that govern the observed seasonal profiles are i) differences in source strength
and/or relative contributions from different sources, and ii) changes in the meteorological
conditions influencing the rate of dispersion or deposition and the changes in the oxidative capacity
of the atmosphere controlling the rate of loss for PAH and/or input of OPAH and NPAH.
Acy is shown to display the highest W:S ratio of the LWM (3-ring) PAH compounds at both sites.
This is consistent with the relatively high reactivity towards OH radicals (Atkinson and Arey, 1994),
which is likely to cause significant depletion during summer months when photochemical activity is
enhanced. This ratio is more pronounced at BROS, possibly due to the closer proximity to the
traffic source and the relatively low mixing heights in winter but might also suggest an additional
local input influencing the levels of this compound primarily at EROS.
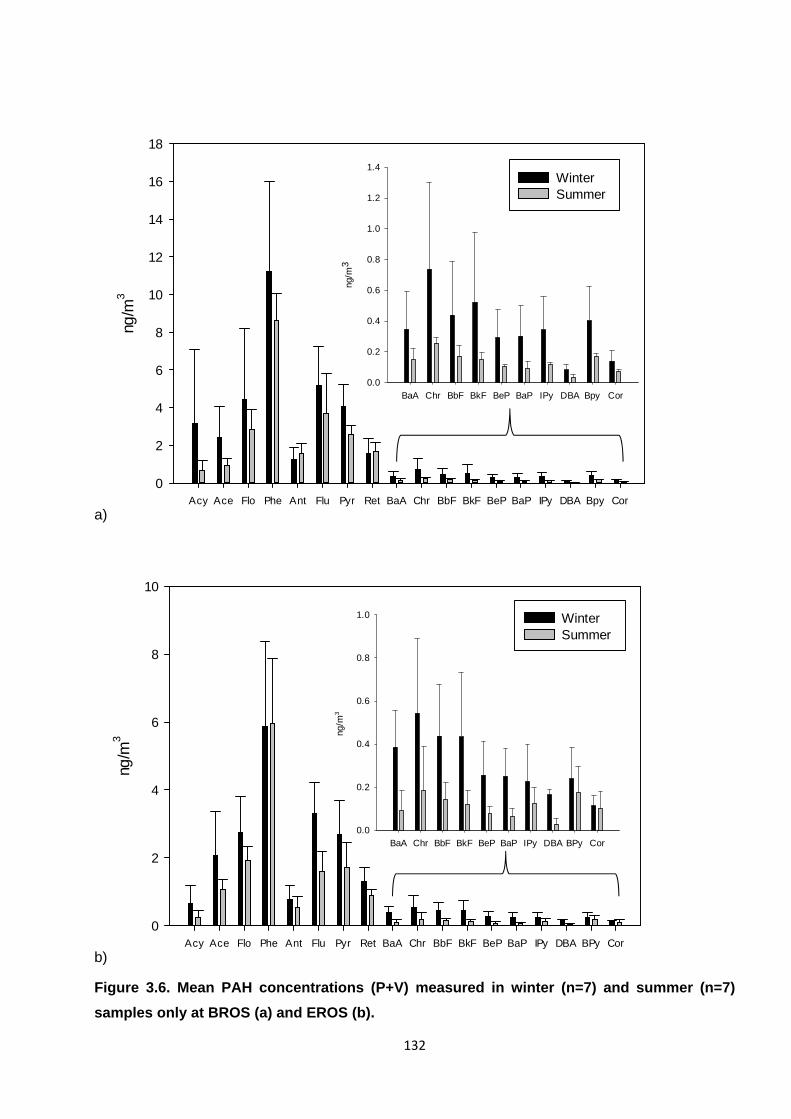
132
a)
b)
Figure 3.6. Mean PAH concentrations (P+V) measured in winter (n=7) and summer (n=7)
samples only at BROS (a) and EROS (b).
Acy Ace Flo Phe Ant Flu Pyr Ret BaA Chr BbF BkF BeP BaP IPy DBA Bpy Cor
ng/m
3
0
2
4
6
8
10
12
14
16
18
BaA Chr BbF BkF BeP BaP IPy DBA Bpy Cor
ng/m
3
0.0
0.2
0.4
0.6
0.8
1.0
1.2
1.4Winter Summer
Acy Ace Flo Phe Ant Flu Pyr Ret BaA Chr BbF BkF BeP BaP IPy DBA BPy Cor
ng/m
3
0
2
4
6
8
10
BaA Chr BbF BkF BeP BaP IPy DBA BPy Cor
ng/m
3
0.0
0.2
0.4
0.6
0.8
1.0 Winter Summer
133
A similar profile could be expected for Ant which is also highly reactive towards OH (Brubaker and
Hites, 1998). However, relatively low W:S ratios of 0.8 and 1.4 were observed at BROS and EROS
respectively. This may suggest that concentrations of Ant are being ‘buffered’ by a non-traffic
related source at these sites during summer.
Phe also displays relatively low seasonal variation with W:S ratios of 1.3 and <1 at BROS and
EROS respectively. Analysis of the PAH traffic profile (Section 3.1) indicated the presence of a
non-traffic source of Phe, primarily influencing EROS.
It was indicated from the observed traffic profile that concentrations of Ace and Ret are not
dominated by traffic inputs and may originate from other combustion sources. Ace displays
relatively high W:S ratios. This may result from higher emission rates in winter due seasonally
variable activities such as solid fuel combustion for space heating. However, Ret does not display
the same profile. This compound is associated with wood combustion but does not display a
pronounced seasonal profile. This may suggest that Ret levels observed at these sites are
influenced primarily by a non-seasonal wood combustion source.
HMW PAH compounds IPy, BPy and Cor are commonly associated with road traffic emissions
(Ravindra et al., 2008). W:S ratios of these compounds are relatively high at BROS, which is
consistent with traffic dominating the source profile of these compounds and a seasonal profile
resulting due to the colder, more stable conditions prevailing during winter, resulting in reduced
vertical transport and dispersion relative to summer months. Ratios at EROS are lower for these
compounds, presumably due to a dilution effect caused by greater distance from the local emission
source.
Other PAHs such as BaA, BbF, BkF, BeP, BaP and DBA display higher W:S ratios at EROS
possibly indicating the presence of an additional seasonally-dependent source of these
compounds that may influence EROS more than BROS. This is notably most pronounced for
DBA, suggesting this compound is not strongly emitted from road traffic and is predominantly
associated with a seasonally-mediated combustion source. This is consistent with the study by
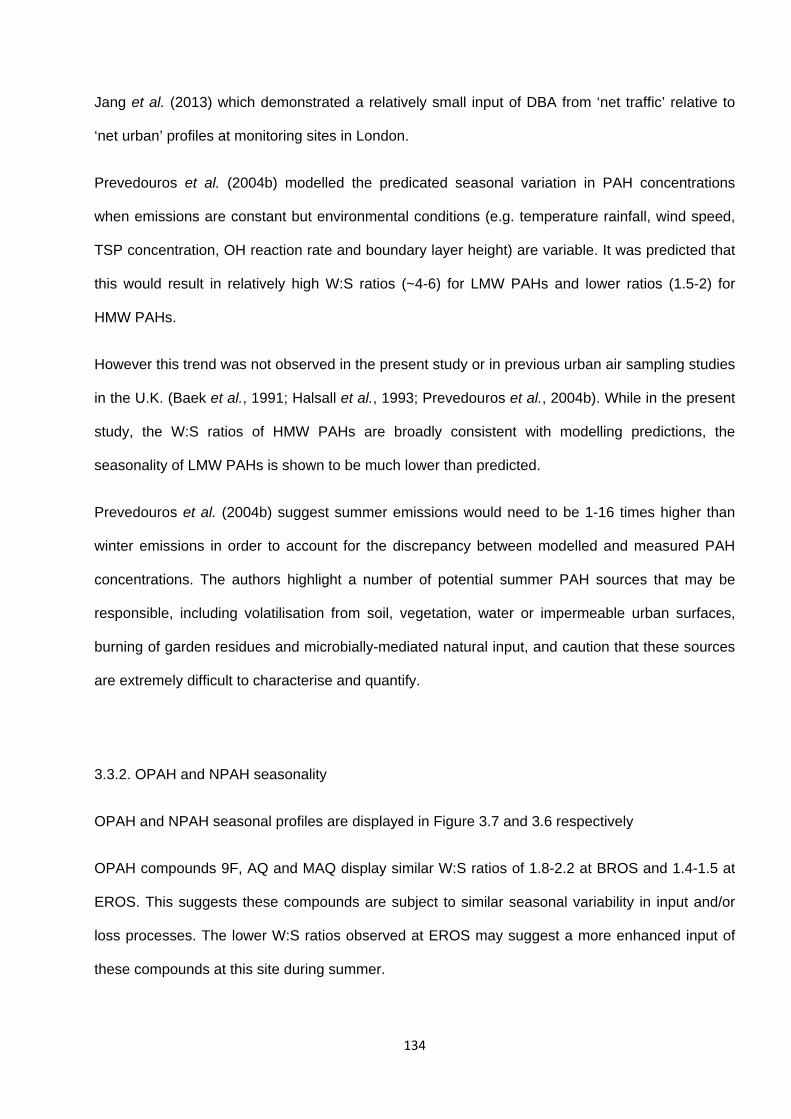
134
Jang et al. (2013) which demonstrated a relatively small input of DBA from ‘net traffic’ relative to
‘net urban’ profiles at monitoring sites in London.
Prevedouros et al. (2004b) modelled the predicated seasonal variation in PAH concentrations
when emissions are constant but environmental conditions (e.g. temperature rainfall, wind speed,
TSP concentration, OH reaction rate and boundary layer height) are variable. It was predicted that
this would result in relatively high W:S ratios (~4-6) for LMW PAHs and lower ratios (1.5-2) for
HMW PAHs.
However this trend was not observed in the present study or in previous urban air sampling studies
in the U.K. (Baek et al., 1991; Halsall et al., 1993; Prevedouros et al., 2004b). While in the present
study, the W:S ratios of HMW PAHs are broadly consistent with modelling predictions, the
seasonality of LMW PAHs is shown to be much lower than predicted.
Prevedouros et al. (2004b) suggest summer emissions would need to be 1-16 times higher than
winter emissions in order to account for the discrepancy between modelled and measured PAH
concentrations. The authors highlight a number of potential summer PAH sources that may be
responsible, including volatilisation from soil, vegetation, water or impermeable urban surfaces,
burning of garden residues and microbially-mediated natural input, and caution that these sources
are extremely difficult to characterise and quantify.
3.3.2. OPAH and NPAH seasonality
OPAH and NPAH seasonal profiles are displayed in Figure 3.7 and 3.6 respectively
OPAH compounds 9F, AQ and MAQ display similar W:S ratios of 1.8-2.2 at BROS and 1.4-1.5 at
EROS. This suggests these compounds are subject to similar seasonal variability in input and/or
loss processes. The lower W:S ratios observed at EROS may suggest a more enhanced input of
these compounds at this site during summer.
135
a) 9F AQ MAQ BaAQ
ng /
m3
0
1
2
3
4
5
Winter Summer
b) 9F AQ MAQ BaAQ
ng /
m3
0.0
0.5
1.0
1.5
2.0
2.5
Winter Summer
Figure 3.7. Mean OPAH concentrations (P+V) measured in winter (n=7) and summer
samples (n=7) only at BROS (a) and EROS (b).

136
a)
b)
Figure 3.8. Mean NPAH concentrations (P+V) measured in winter (n=7) and summer
samples (n=7) only at BROS (a) and EROS (b).
1NNap 2NNap 2NFlo 9NAnt 1NFlt 2NFlt 3NFlt 4NPy r 1NPy r 2NPy r 7NBaA 6NChr
pg
/m3
0
100
200
300
400
500
600
Winter Summer
1NNap 2NNap 2NFlo 9NAnt 1NFlt 2NFlt 3NFlt 4NPyr 1NPyr 2NPyr 7NBaA 6NChr
pg
/m3
0
50
100
150
200
Winter Summer

137
Walgraeve et al. (2010) reviewed a large number of OPAH sampling studies from different
locations, and reported that median concentrations are 3-4 times higher during winter than during
summer. The relatively lower W:S values observed in the present study may therefore reflect the
dominance of non-seasonal road traffic as a primary emission source and the possible additional
input of OPAHs due to non-traffic related sources during summer.
NPAHs display relatively high W:S ratios at BROS compared with most PAH and OPAH. This may
be attributed to photolysis being the primary loss process for these compounds, with rates of
degradation being relatively suppressed during the colder winter months and higher during
summer. It is noted that the 1NNap W:S ratio is ~2 times higher at BROS than that of 2NNap,
which may be attributed to the faster rate of photolysis observed for 1NNap relative to 2NNap
(Atkinson et al., 1989; Niu et al., 2005; Phousongphouang and Arey, 2003a).
The relatively high ratios observed for 7NBaA and 6NChr at BROS may indicate the more
dominant influence of a seasonally-dependent combustion source for these compounds. To date,
no data on non-traffic emissions of these compounds has been provided. The lower W:S ratios
observed for NPAHs at EROS may reflect the relatively more ‘aged’ air mass at this site and/or the
influence of secondary input from non-traffic sources such as surface volatilisation or atmospheric
reactions.
3.3.3. Factors influencing seasonal trends
3.3.3.1. Seasonal variation in source strength
Previously, relatively high W:S ratios of PAH, NPAH and OPAH observed in urban areas has been
associated with a stronger seasonal source strength, with higher concentrations in winter
associated, for example with higher emissions from space heating (Andreou and Rapsomanikis,
2009; Coleman et al., 1997; Eiguren-Fernandez et al., 2008a; Harrison et al., 1996; Smith and
Harrison, 1996). However, the dominant emission source at the University of Birmingham sites is
expected to be road traffic with a much lower contribution from domestic emission sources.
138
The seasonal variability of traffic-related PAH, NPAH and OPAH emissions is difficult to predict
and the lack of data on the seasonal variability of traffic flow at the sampling sites means there is
uncertainty regarding this trend. As discussed by Prevedouros et al. (2004b), the level of vehicle
usage may be higher during summer (for example due to a greater number of people taking
vacations and the longer average length of ‘daytime’). However, the contribution due to ‘cold start’
emissions is likely to be higher in winter.
Based on the lack of significant correlation between temperature and PAH/NOx for traffic marker
compounds such as Cor, BeP and BPy (see Section 3.2), it is assumed that traffic emissions do
not display significant seasonality and that variability in the emission source strength will not
influence the seasonal concentration variation at these sites. Reisen and Arey (2005) noted the
seasonal variation of 1NPyr (normalised to CO) was lower than for reaction products 2NFlt and
2NPyr, and suggested this indicated traffic sources were relatively non-seasonal .
A lack of seasonality in emission sources would partly account for the relatively low W:S variability
between seasons observed in this study in relation to sampling studies, for example close to
Birmingham city centre (Smith and Harrison, 1996).
3.3.3.2. Seasonality of atmospheric boundary layer height
The height of the ABL can influence the concentrations of air pollutants as this will dictate the
degree of atmospheric stability and rate of dispersion (Williams, 2001 ; Holloway and Wayne,
2010). The height of the ABL exhibits seasonal and diurnal patters with daytime summer heights of
~1000m and nighttime winter heights of ~100m (Williams, 2001). It has been indicated, based on
the significant (p<0.01) negative correlation between temperature and NOx concentration, that the
ABL height displays seasonality at these sites.
Higher levels of OPAH and NPAH in urban areas where higher emissions from space heating are
not likely to occur have been attributed to colder temperature resulting in lower ABL height, less
139
rapid photooxidation and associated accumulation of pollutants (Albinet et al., 2008a; Bamford and
Baker, 2003; Kakimoto et al., 2000; Kakimoto et al., 2001; Marino et al., 2000; Wei et al., 2012).
It is suggested, therefore that seasonality in temperature may be the dominant factor governing
observed seasonal PAH, OPAH and NPAH concentration variations at these sites. It should be
noted, however that the annual variation in temperature was relatively narrow. Mean ambient
temperature from the winter samples was 6°C compared with ~15°C in summer samples.
Albinet et al. (2008a) measured concentrations of OPAH and NPAH at a traffic site in France
during winter and summer, observing higher W:S ratios than were observed in the present study.
In summer, Albinet et al. (2008a) reported a concentration of BaP of 0.12 ng m-3 in very good
agreement with the summer mean concentration observed at BROS. This suggests the rate of
primary pollutant input is broadly similar in the two studies. The seasonal temperature trend
reported by Albinet et al. (2008a) varied from a mean winter temperature of -3°C to a mean
summer temperature of 17°C.
This much wider range of temperature may therefore account for the observed differences in
OPAH and NPAH seasonality between these two studies, with higher accumulation in the colder
winter caused by a lower ABL height and slower photodegradation, and more rapid loss in the
much warmer summer months. Indeed Albinet and co-workers report a winter BaP concentration
~9 times higher that was observed at BROS, therefore indicating the influence of a lower mixing
height during winter in the previous study.
3.3.3.3. Influence of volatilisation from surfaces
It has been previously been indicated that PAH concentrations measured in the U.K. atmosphere
can be influenced by the secondary input due to volatilisation from soil, vegetation and/or road
surfaces in urban areas (Dimashki et al., 2001; Harrad and Laurie, 2005; Lee and Jones, 1999) or
from the sea in coastal areas (Meijer et al., 2008).
140
Vegetation can represent an important compartment in the scavenging of atmospheric PAH
(Simonich and Hites, 1994). For example, it has been demonstrated that PAHs can accumulate in
leaf foliage (Keyte et al., 2009; Wild et al., 2006) particularly the waxy cuticle layer on the
vegetation surface (Wild et al., 2007). It has been suggested in multimedia modelling study that
semi-volatile organic compounds like PAHs can be subsequently released from this compartment
to the atmosphere (Diamond et al., 2001). It has also been suggested that volatilisation from soil to
air can also occur for LMW organic pesticides (Harner et al., 2001) and PAHs (Wei et al., 2014).
Lee and Jones (1999) noted a significant positive correlation between 3 and 4 ring compounds
Phe, Flt and Pyr concentration and temperature in a semi rural site in northern England, indicating
the possibility of temperature-driven evaporation from vegetation and/or soils, contributing to
observed ambient concentrations in summer. In contrast HMW 5 ring PAHs BbF and BkF were
negatively correlated with temperature.
In the present study, the trend between temperature and NOx-corrected concentrations was
investigated to account for the seasonal trend in ABL height (see Section 3.2). Significant (p<0.05)
positive correlations were noted at BROS for Flo, Phe, Ant, Flt, Pyr, BbF, DBA, 9F, AQ, MAQ,
1NNap, 2NNap, 2NFlo, 1NFlt and 1NPyr; and at EROS for Acy, Flo, Phe, Ant, Pyr, Ret, BaA, AQ,
MAQ, BaAQ, 2NNap, 9NAnt, 2NFlt, 4NPyr, 2NPyr. While this trend does not necessarily indicate
the influence of volatilisation from surfaces at these sites, nor the relative significance of this
source, it may suggest that a local temperature-driven secondary input may contribute to the
observed concentrations of PAH, OPAH and NPAH, particularly in summer for LMW compounds.
Dimashki et al. (2001) and Lim et al. (1999) indicated that volatilisation from surfaces was more
significant in the city centre than at the University site. It was hypothesised that the greater area of
impermeable surfaces and density of primary sources would mean road surfaces would represent
an area with a greater ‘reservoir’ of previously deposited PAH compounds than the background
site.
141
In the present study, however, it is unclear as to whether volatilisation is more significant at BROS
or EROS. For example, the traffic increment profiles (Section 3.1) indicate a more distinct input of
Phe from additional source exists at EROS, however the correlation between temperature and
Phe/NOx is stronger at BROS. Similarly, it was indicated that a stronger additional source of Ret is
present at BROS, however a significant trend between Ret/NOx and temperature is only indicated
at EROS.
3.3.4. Seasonal trend in PAH reactivity
It is expected that during summer, higher concentrations of atmospheric oxidants will result in
higher reactive input of OPAH and NPAH compounds. For example, Reisen and Arey (2005)
observed S:W ratios for NNaps, 2NFlt and 2NPyr were 2.3, 5.2 and 1.5 respectively at the receptor
suburban site Riverside, USA. The authors noted that NPAHs formed by OH reactions only (e.g.
2NPyr) displayed lower summer/winter ratios than those formed by both OH and NO3 reactions
(1NNap, 2NNap and 2NFlt) suggesting significant summer input from NO3 reactions.
In the present study, mean 2NFlt/2NPyr ratios were relatively low (<6) at both BROS and EROS in
all seasons, indicating minimal impact of NO3 reactivity relative to OH reactions. However,
2NFlt/1NPyr ratios were higher at EROS relative to BROS in all sampling seasons. Ratios were a
factor ~3.5 higher at EROS in summer, compared with an inter-site difference of factor ~2.3 in
winter. This highlights the potential importance of OH reactions between sites and suggests this is
more pronounced during the warmer summer months.
The greater prominence of atmospheric reactivity during summer may be expected to cause
NPAH/PAH and OPAH/PAH ratios to display similar seasonality. For example, Walgraeve et al.
(2010) assessed the ratio of OPAH/ ‘parent’ PAH in a number of ambient sampling studies in the
literature. It was shown that during winter, 50% of these ratios were between 0.006 and 0.16. In
summer ratios were reported to be about 20 times higher, with 50% of ratios between 0.54 and 3.6
(Keyte et al., 2013).
142
OPAH or NPAH ‘product’ / PAH rations (see Section 3.6) were shown to be highly variable and no
distinct seasonal trend in ratio values or in the significance of atmospheric reactivity to the
measured atmospheric concentrations of OPAH and NPAH could be observed.
Other seasonal factors may occur which will also influence the relative value of these ratios. This
includes differences phase partitioning, which can lead to protection of PAH, NPAH or OPAH from
photolytic or reactive losses as well as possible influence of temperature-dependent volatilisation
of compounds from surfaces, which may occur at differing levels of significance and occur at
different rates for different PAH, OPAH and NPAH compounds.
Similarly, Wei et al. (2012) showed that at sampling sites in southern China, NPAH/PAH and
OPAH/PAH ratios displayed considerable spatial, seasonal and diurnal variations, likely influenced
by a number of competing factors including changes in emission strength, reactivity rates and
degree of phase partitioning.
3.3.5. BROS/EROS ratio seasonality
Table 3.6. presents the mean ratios of BROS/EROS concentrations measured for all compounds
during each sampling season during Campaign 1.
HMW (5+ ring) PAHs exhibit relatively small seasonal variation in BROS/EROS ratios, attributed to
their relatively high stability, low volatility and strong association with PM expected in all sampling
seasons. LMW PAHs may be expected to display higher BROS/EROS ratios during summer due
to enhanced chemical reactivity between sites. However, this is not observed for most compounds.
For PAHs, the highest ratios in all seasons are observed for the most reactive PAHs, Acy and Ant.
However, opposing seasonal trends are observed for these compounds. Ant displays higher
BROS/EROS ratios in spring and summer compared to autumn and winter, consistent with higher
reactive losses between sites in the warmer months.
143
It is indicated above that the seasonal profile of Ant may be influenced by non-traffic sources
during summer. These results suggest this if this phenomenon occurs, it is primarily influencing at
BROS. Conversely, Acy displays higher BROS/EROS ratios in winter. This may indicate that levels
of Acy may be ‘buffered’ to a certain degree by evaporative input from surfaces, primarily
influencing EROS, as indicated by the significant (P<0.05) correlation between Acy/NOx and
temperature at this site.
Flt and Pyr display similar ratios in winter, indicating similar input and loss processes are affecting
both compounds. However, in summer Flt displays higher BROS/EROS ratio while Pyr appears to
show minimal seasonal variability. It has been indicated above that both Pyr and Flt may be
influenced by an additional source at both sites (as suggested by their observed association with
Ret; see Section 3.2). However, while both Flt/NOx and Pyr/NOx are shown to correlate
significantly with temperature at BROS, only Pyr displays this trend at EROS. This may partly
account for the discrepancy in the seasonal behaviour of the BROS/EROS ratios of these
compounds.
BROS/EROS ratios of Flo and Phe are highest in autumn and winter respectively and lower in
summer. As indicated in the present and previous (Dimashki et al., 2001) studies, these
compounds may be influenced by local input due to temperature-driven volatilisation from surfaces.
These results would suggest this phenomenon is more prevalent at EROS than at BROS.
Ret exhibits a higher BROS/EROS ratio in summer, suggesting the concentrations of Ret at these
sites is not controlled by seasonally-mediated domestic wood combustion for space heating but
rather a source that may be more prevalent at BROS in summer such as incineration of garden
wastes. Ace displays ratios of <1 in spring and summer and >1 in winter, possibly indicating the
influence of a seasonally-mediated combustion source that is more prevalent at BROS and/or a
local input at EROS in summer, which masks the influence of a traffic related pattern.
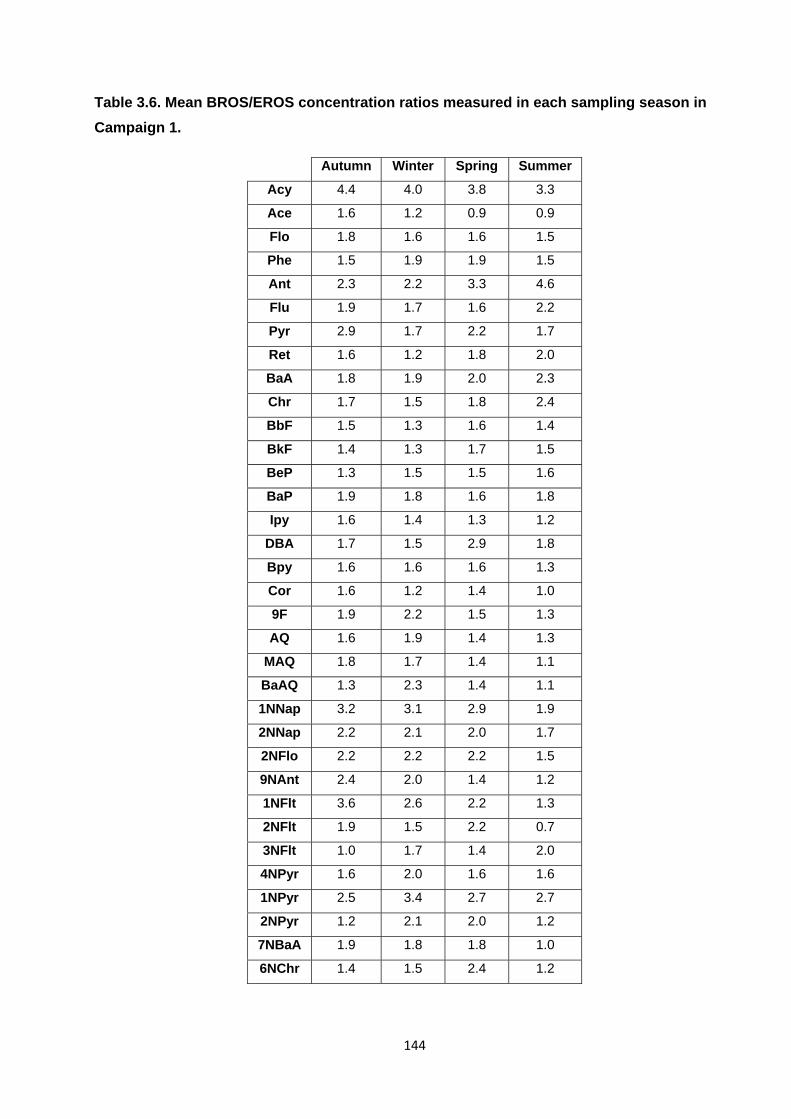
144
Table 3.6. Mean BROS/EROS concentration ratios measured in each sampling season in
Campaign 1.
Autumn Winter Spring Summer
Acy 4.4 4.0 3.8 3.3
Ace 1.6 1.2 0.9 0.9
Flo 1.8 1.6 1.6 1.5
Phe 1.5 1.9 1.9 1.5
Ant 2.3 2.2 3.3 4.6
Flu 1.9 1.7 1.6 2.2
Pyr 2.9 1.7 2.2 1.7
Ret 1.6 1.2 1.8 2.0
BaA 1.8 1.9 2.0 2.3
Chr 1.7 1.5 1.8 2.4
BbF 1.5 1.3 1.6 1.4
BkF 1.4 1.3 1.7 1.5
BeP 1.3 1.5 1.5 1.6
BaP 1.9 1.8 1.6 1.8
Ipy 1.6 1.4 1.3 1.2
DBA 1.7 1.5 2.9 1.8
Bpy 1.6 1.6 1.6 1.3
Cor 1.6 1.2 1.4 1.0
9F 1.9 2.2 1.5 1.3
AQ 1.6 1.9 1.4 1.3
MAQ 1.8 1.7 1.4 1.1
BaAQ 1.3 2.3 1.4 1.1
1NNap 3.2 3.1 2.9 1.9
2NNap 2.2 2.1 2.0 1.7
2NFlo 2.2 2.2 2.2 1.5
9NAnt 2.4 2.0 1.4 1.2
1NFlt 3.6 2.6 2.2 1.3
2NFlt 1.9 1.5 2.2 0.7
3NFlt 1.0 1.7 1.4 2.0
4NPyr 1.6 2.0 1.6 1.6
1NPyr 2.5 3.4 2.7 2.7
2NPyr 1.2 2.1 2.0 1.2
7NBaA 1.9 1.8 1.8 1.0
6NChr 1.4 1.5 2.4 1.2
145
OPAHs and NPAHs generally display lower inter-site ratios during summer compared with other
times of the year. For NPAHs, this observation is unexpected as relatively rapid photolytic
degradation of these compounds would be expected to produce relatively large BROS/EROS
ratios during summer, assuming a predominant traffic source from BROS.
The observation of relatively lower BROS/EROS ratios may therefore reflect a greater influence of
non-traffic related sources of these compounds during summer months e.g. input from garden
bonfires, or volatilisation/resuspension.
It is also suggested that NPAH and OPAH concentrations (for compounds such as 1NNap, 2NNap,
2NFlt, 2NPyr, AQ and 9F) at EROS may be enhanced during summer due to higher input from
atmospheric reactions between sites (see Section 3.6 and 4.3). For example a ratio of <1 is noted
for 2NFlt during summer, suggests the more enhanced reactivity in the atmosphere during the
warmer months.
3.4. Temporal trend of PAHs at BROS and EROS
3.4.1. Overview
PAH concentrations have previously been measured at the University of Birmingham sites in 1997
(Dimashki et al., 2001) and 1999-2001 (Harrad et al., 2003; Harrad and Laurie, 2005). A
comparison between the annual mean concentrations of PAH and OPAH compound 9F measured
in the present study and those in reported in the previous studies is shown in Figure 3.9. It should
be noted that this comparison is made based on a relatively small number of individual samples
taken at these sites in the present and previous studies, used as representative ‘annual mean’
concentrations. Differences in specific conditions (e.g. traffic flow, meteorological variables,
analytical methods) may mean the annual concentration values derived may not be directly
comparable. The interpretation of temporal pattern at these sites must therefore be made with
caution.
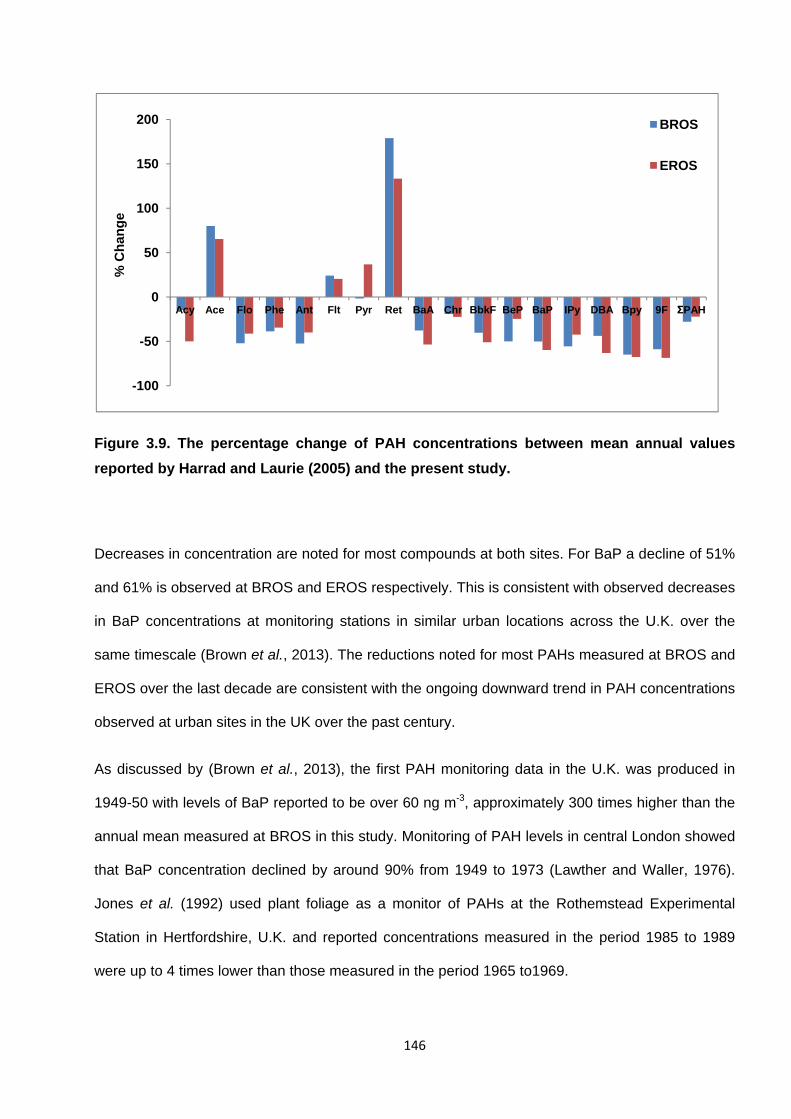
146
Figure 3.9. The percentage change of PAH concentrations between mean annual values
reported by Harrad and Laurie (2005) and the present study.
Decreases in concentration are noted for most compounds at both sites. For BaP a decline of 51%
and 61% is observed at BROS and EROS respectively. This is consistent with observed decreases
in BaP concentrations at monitoring stations in similar urban locations across the U.K. over the
same timescale (Brown et al., 2013). The reductions noted for most PAHs measured at BROS and
EROS over the last decade are consistent with the ongoing downward trend in PAH concentrations
observed at urban sites in the UK over the past century.
As discussed by (Brown et al., 2013), the first PAH monitoring data in the U.K. was produced in
1949-50 with levels of BaP reported to be over 60 ng m-3, approximately 300 times higher than the
annual mean measured at BROS in this study. Monitoring of PAH levels in central London showed
that BaP concentration declined by around 90% from 1949 to 1973 (Lawther and Waller, 1976).
Jones et al. (1992) used plant foliage as a monitor of PAHs at the Rothemstead Experimental
Station in Hertfordshire, U.K. and reported concentrations measured in the period 1985 to 1989
were up to 4 times lower than those measured in the period 1965 to1969.
-100
-50
0
50
100
150
200
Acy Ace Flo Phe Ant Flt Pyr Ret BaA Chr BbkF BeP BaP IPy DBA Bpy 9F ƩPAH
% C
han
ge
BROS
EROS
147
Smith and Harrison (1996) indicated that PAH concentrations measured at sites in Birmingham in
1992 were 2 to 10 times lower than levels observed in 1976-1978 by Butler and Crossley (1979).
Further decline of ambient PAH levels were noted during sampling studies in different urban
locations in the UK during the 1990s (Coleman et al., 1997; Meijer et al., 2008). Dimashki et al.
(2001) noted a 56% decrease in total PAH concentrations at the University of Birmingham campus
in the period 1992-1997. Harrad and Laurie (2005) reported a further decrease of 31% at the
University site between the 1997 and 1999-2001.
The observed decline in PAH concentrations reported in ambient air measurements has been
shown to correlate with reductions in estimated primary combustion emissions (Brown et al., 2013).
These historical emission reductions have therefore been attributed to the introduction of the Clean
Air Acts of 1956 and 1968 as well as the implantation of the Environmental Protection Act in 1990,
which enforced emission reduction measures (Brown et al., 2013).
Indeed, as discussed in Section 1.4.4, data from the NAEI indicates that the reductions in PAH
concentrations observed over the last 20 years can be attributed largely to the almost complete
reduction of PAH emissions from industrial metal processing and banning the burning of
agricultural waste (Murrells et al., 2010). Additionally, the decline in PAH concentrations in
Birmingham specifically have been attributed to the establishment of ‘smokeless zones’ in West
Midlands area as wells as reduction in use of coal movement towards natural gas heating (Smith
and Harrison, 1996). More recent decreases in PAH concentrations in the U.K. have been
associated with the introduction of catalytic converters in 1993 and the associated reduction in
emissions from on-road vehicles (Smith and Harrison, 1996 ; Dimashki et al., 2001).
It is suggested, therefore, that the observed changes in concentrations and relative contributions of
PAHs in the period 2000 to 2012 can be attributed to changes in local emission source profiles.
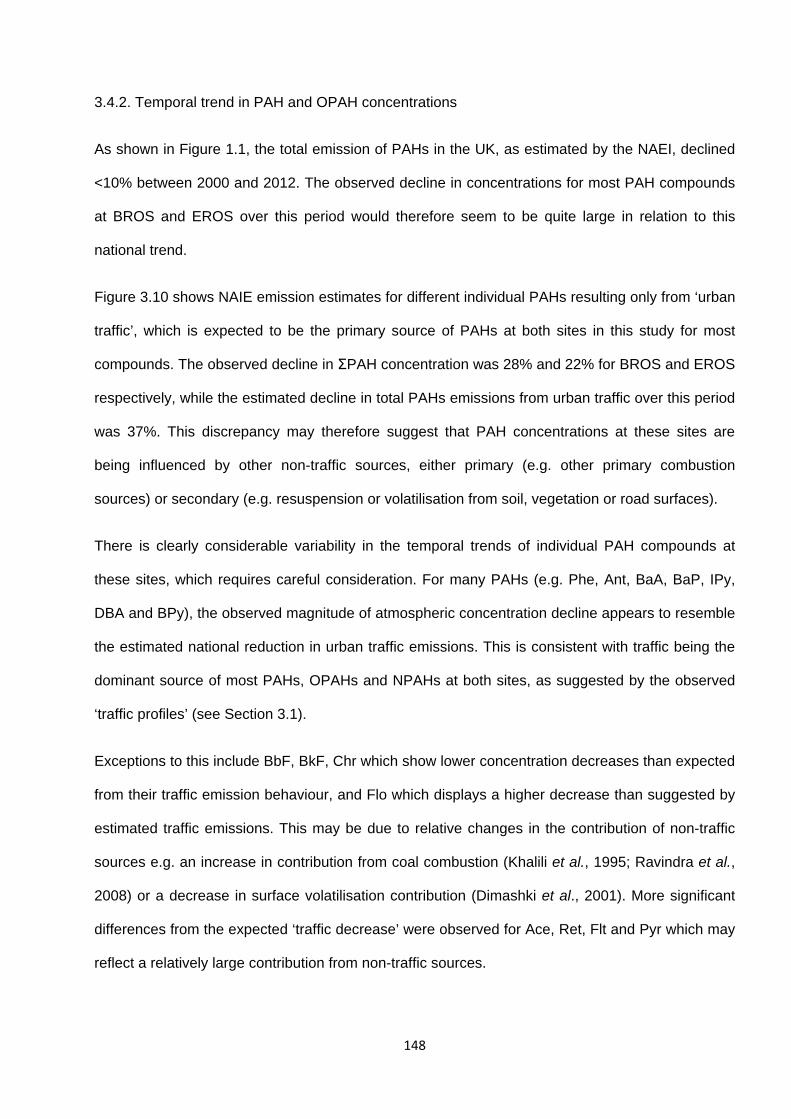
148
3.4.2. Temporal trend in PAH and OPAH concentrations
As shown in Figure 1.1, the total emission of PAHs in the UK, as estimated by the NAEI, declined
<10% between 2000 and 2012. The observed decline in concentrations for most PAH compounds
at BROS and EROS over this period would therefore seem to be quite large in relation to this
national trend.
Figure 3.10 shows NAIE emission estimates for different individual PAHs resulting only from ‘urban
traffic’, which is expected to be the primary source of PAHs at both sites in this study for most
compounds. The observed decline in ƩPAH concentration was 28% and 22% for BROS and EROS
respectively, while the estimated decline in total PAHs emissions from urban traffic over this period
was 37%. This discrepancy may therefore suggest that PAH concentrations at these sites are
being influenced by other non-traffic sources, either primary (e.g. other primary combustion
sources) or secondary (e.g. resuspension or volatilisation from soil, vegetation or road surfaces).
There is clearly considerable variability in the temporal trends of individual PAH compounds at
these sites, which requires careful consideration. For many PAHs (e.g. Phe, Ant, BaA, BaP, IPy,
DBA and BPy), the observed magnitude of atmospheric concentration decline appears to resemble
the estimated national reduction in urban traffic emissions. This is consistent with traffic being the
dominant source of most PAHs, OPAHs and NPAHs at both sites, as suggested by the observed
‘traffic profiles’ (see Section 3.1).
Exceptions to this include BbF, BkF, Chr which show lower concentration decreases than expected
from their traffic emission behaviour, and Flo which displays a higher decrease than suggested by
estimated traffic emissions. This may be due to relative changes in the contribution of non-traffic
sources e.g. an increase in contribution from coal combustion (Khalili et al., 1995; Ravindra et al.,
2008) or a decrease in surface volatilisation contribution (Dimashki et al., 2001). More significant
differences from the expected ‘traffic decrease’ were observed for Ace, Ret, Flt and Pyr which may
reflect a relatively large contribution from non-traffic sources.
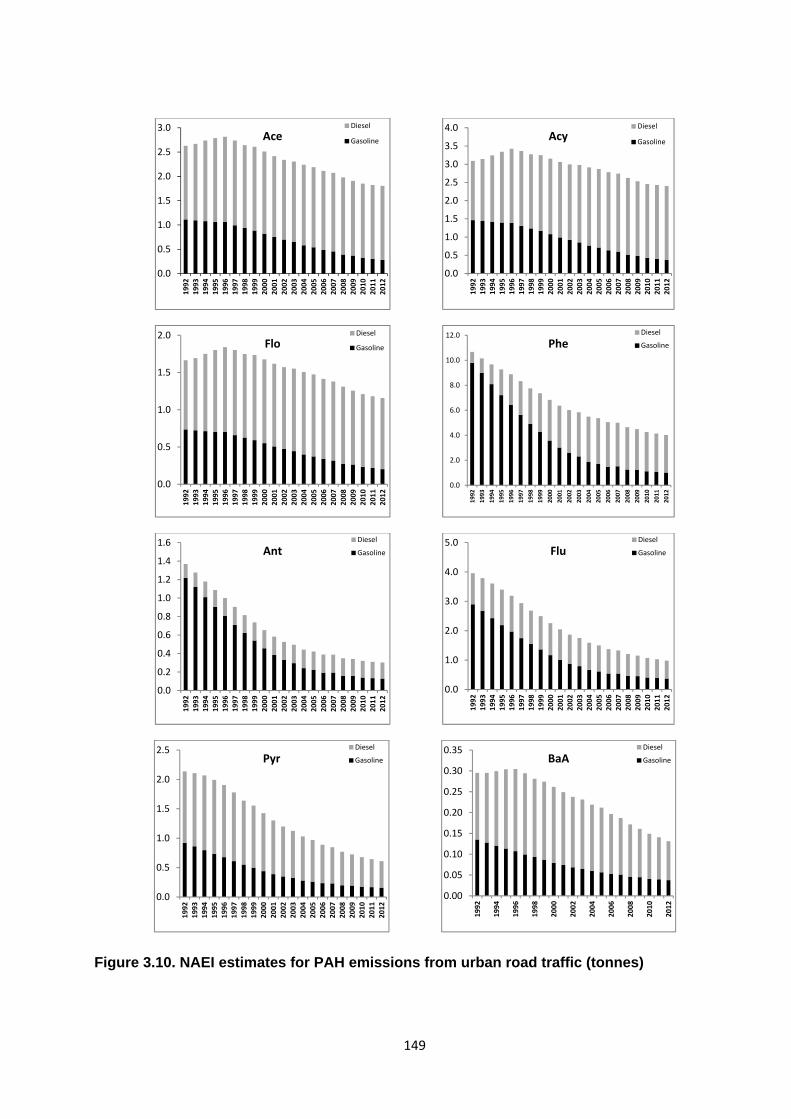
149
Figure 3.10. NAEI estimates for PAH emissions from urban road traffic (tonnes)
0.0
0.5
1.0
1.5
2.0
2.5
3.0
1992
1993
1994
1995
1996
1997
1998
1999
2000
2001
2002
2003
2004
2005
2006
2007
2008
2009
2010
2011
2012
AceDiesel
Gasoline
0.0
0.5
1.0
1.5
2.0
2.5
3.0
3.5
4.0
1992
1993
1994
1995
1996
1997
1998
1999
2000
2001
2002
2003
2004
2005
2006
2007
2008
2009
2010
2011
2012
AcyDiesel
Gasoline
0.0
0.5
1.0
1.5
2.0
1992
1993
1994
1995
1996
1997
1998
1999
2000
2001
2002
2003
2004
2005
2006
2007
2008
2009
2010
2011
2012
FloDiesel
Gasoline
0.0
2.0
4.0
6.0
8.0
10.0
12.0
1992
1993
1994
1995
1996
1997
1998
1999
2000
2001
2002
2003
2004
2005
2006
2007
2008
2009
2010
2011
2012
PheDiesel
Gasoline
0.0
0.2
0.4
0.6
0.8
1.0
1.2
1.4
1.6
1992
1993
1994
1995
1996
1997
1998
1999
2000
2001
2002
2003
2004
2005
2006
2007
2008
2009
2010
2011
2012
AntDiesel
Gasoline
0.0
1.0
2.0
3.0
4.0
5.0
1992
1993
1994
1995
1996
1997
1998
1999
2000
2001
2002
2003
2004
2005
2006
2007
2008
2009
2010
2011
2012
FluDiesel
Gasoline
0.0
0.5
1.0
1.5
2.0
2.5
1992
1993
1994
1995
1996
1997
1998
1999
2000
2001
2002
2003
2004
2005
2006
2007
2008
2009
2010
2011
2012
PyrDiesel
Gasoline
0.00
0.05
0.10
0.15
0.20
0.25
0.30
0.35
1992
1994
1996
1998
2000
2002
2004
2006
2008
2010
2012
BaADiesel
Gasoline

150
`
Figure 3.10. NAEI estimates for PAH emissions from urban road traffic (tonnes)
0.00
0.05
0.10
0.15
0.20
0.25
0.30
0.35
1992
1993
1994
1995
1996
1997
1998
1999
2000
2001
2002
2003
2004
2005
2006
2007
2008
2009
2010
2011
2012
ChrDiesel
Gasoline
0.00
0.05
0.10
0.15
0.20
0.25
0.30
1992
1993
1994
1995
1996
1997
1998
1999
2000
2001
2002
2003
2004
2005
2006
2007
2008
2009
2010
2011
2012
BbFDiesel
Gasoline
0.00
0.05
0.10
0.15
0.20
0.25
1992
1993
1994
1995
1996
1997
1998
1999
2000
2001
2002
2003
2004
2005
2006
2007
2008
2009
2010
2011
2012
BkFDiesel
Gasoline
0.00
0.02
0.04
0.06
0.08
0.10
0.12
0.14
0.16
1992
1993
1994
1995
1996
1997
1998
1999
2000
2001
2002
2003
2004
2005
2006
2007
2008
2009
2010
2011
2012
BaPDiesel
Gasoline
0.00
0.05
0.10
0.15
0.20
0.25
1992
1993
1994
1995
1996
1997
1998
1999
2000
2001
2002
2003
2004
2005
2006
2007
2008
2009
2010
2011
2012
IPyDiesel
Gasoline
0.00
0.10
0.20
0.30
0.40
0.50
0.60
1992
1993
1994
1995
1996
1997
1998
1999
2000
2001
2002
2003
2004
2005
2006
2007
2008
2009
2010
2011
2012
BPyDiesel
Gasoline
0.000
0.005
0.010
0.015
0.020
0.025
0.030
1992
1994
1996
1998
2000
2002
2004
2006
2008
2010
2012
DBADiesel
Gasoline

151
Ace and Ret both display substantial increases in annual concentration at both sites, in contrast to
most other PAHs. Harrad and Laurie (2005) also noted an increase in Ace concentration between
1997 and 1999-2001. As noted above, these compounds displayed a deviation away from the
expected ‘traffic profile’ correlation observed between road tunnel concentrations and [BROS –
EROS] increment, indicating the possible influence of non-traffic source(s).
Ret is commonly associated with wood combustion (McDonald et al., 2000; Ramdahl, 1983) and
shown to display elevated concentrations during ‘bonfire night’ celebrations (Harrad and Laurie,
2005 ; Mari et al., 2010). The increase in Ret concentrations of 179% and 133% at BROS and
EROS respectively would appear to be consistent with NAEI emissions data indicating a 123%
national increase in PAH emissions from domestic wood combustion over this period.
However, seasonal (Section 3.3) and diurnal (Section 5) profiles of Ret suggest domestic
combustion may not be the dominant source for this compound. PMF analysis (Section 4.3)
suggests Ret concentrations are dominated by a non-traffic source attributed to wood combustion
but it is suggested the specific source is more likely to be the periodic combustion of wood material
for example in garden bonfires rather than a seasonal domestic source.
A similar though smaller increase in concentration of Ace also indicates a strong influence from a
non-traffic source. Furthermore, Flt and Pyr also do not display expected decreases in
concentrations based on estimated traffic emission reductions, with levels either similar or higher
than those measured in 1999-2001.
Inter-correlations of species (Section 3.2) indicate Pyr and Flth are strongly associated at both
sites and both are correlated with Phe at BROS. These compounds are commonly associated with
diesel emissions so this may suggest the levels of these compounds at BROS may be influenced
by a common diesel source. However, Flt and Pyr are not correlated with other PAHs at EROS
with the exception of Ret. This suggests a common non-traffic source may influence Flt, Pyr and
Ret at EROS and to a lesser degree at BROS.
152
Indeed, PMF analysis (see Section 4.3) suggests Phe, Flt and Pyr concentrations are strongly
associated with the same source factor at Ret, suggesting the influence of wood combustion for
these compounds. This is consistent with the observation that Pyr and Flt display relatively high
levels in emissions from incineration (Ravindra et al., 2008).The temperature dependence of
Flt/NOx, Pyr/NOx and Ret/NOx indicates the possible additional influence of evaporative input of
Pyr and Flt at BROS and Pyr and Ret at EROS.
Ace was not strongly associated with Pyr, Flu or Ret at EROS but displays a weak (though
significant) correlation with Pyr and Flt at BROS. This could indicate that these compounds are
influenced to a degree by the common traffic source at BROS, but also influenced by separate
non-traffic sources at both sites. PMF analysis indicted a strong association of Ace with a factor
attributed mostly to volatilisation from road surfaces. However, this would not account for the
relatively high increase in concentrations since 1999-2001 or the observed seasonal pattern for
Ace (see Section 3.3). It is possible therefore that a domestic combustion source may also influce
Ace concentrations at these sites.
The observed decrease in concentrations of 9F at BROS and EROS, compared with
measurements in 1999-2000 is higher than those observed for semi-volatile PAH compounds. No
emission estimates are available for OPAH compounds in the NAEI database but 9F has been
observed in relatively high concentrations in gasoline and diesel exhaust emissions (Jakober et al.,
2007; Oda et al., 1998; Oda et al., 2001; Zielinska et al., 2004b). Inter-correlations of 9F with other
PAHs at these sites suggest a stronger with gasoline emissions than diesel. Therefore a relative
decline in concentration similar to other gasoline-related PAH compounds e.g. BPy and IPy would
appear sensible.
9F has also been shown to result for atmospheric reactions (Wang et al., 2007b). Therefore, it
might have been expected that while direct emissions decline, the levels of such compounds may
be ‘buffered’ to a degree by reactive input, as observed for 2NFlt by Kojima et al. (2010) and Wang
et al. (2011a) in urban areas where emission control measures were implemented. The relatively
153
substantial decline may indicate, therefore that reactivity (and volatilisation from surfaces) has not
influenced the temporal trend of this compound.
3.4.3. Temporal trend in NPAH concentrations
The relative lack of NPAH measurements carried out in the UK prior this study makes an
assessment of temporal variation difficult. However, NPAH concentrations were previously
measured in Birmingham city centre in 1995/6 in the period Nov to Feb (Dismashki et al., 2000).
Table 3.7 provides a comparison between the NPAH concentrations measured in the previous
study and those measured in the present study at BROS. The mean of winter samples is used and
BROS chosen for comparison due to its close proximity to relatively high traffic levels.
The levels of gas-phase NNap compounds in the present study are a factor ~4 and ~2 higher than
measured by Dimashki et al. (2000) in 1995/6 for 1NNap and 2NNap respectively. In contrast,
concentrations of compounds associated primarily with particulate matter (e.g. 1NPyr, 9NAnt and
2NFlt) are 2.5 to 5 times lower at BROS compared with concentrations in the previous study. The
sampling sites in the present study are ~3km south of the city centre so measurements may not be
directly comparable so assessment of relative levels needs to be made with caution.
Indeed, traffic counts adjacent to the city centre sampling site are estimated to be 3-4 times higher
than at BROS (DfT figures). Also, the contribution of traffic to the observed PAH levels have been
estimated to be higher at the city centre (80-82%) compared to the University campus site (61-
67%) (Lim et al., 1999). Therefore, the lower concentrations of particulate-phase NPAH observed
in this study may not be entirely associated with reduction in NPAH concentrations over time.
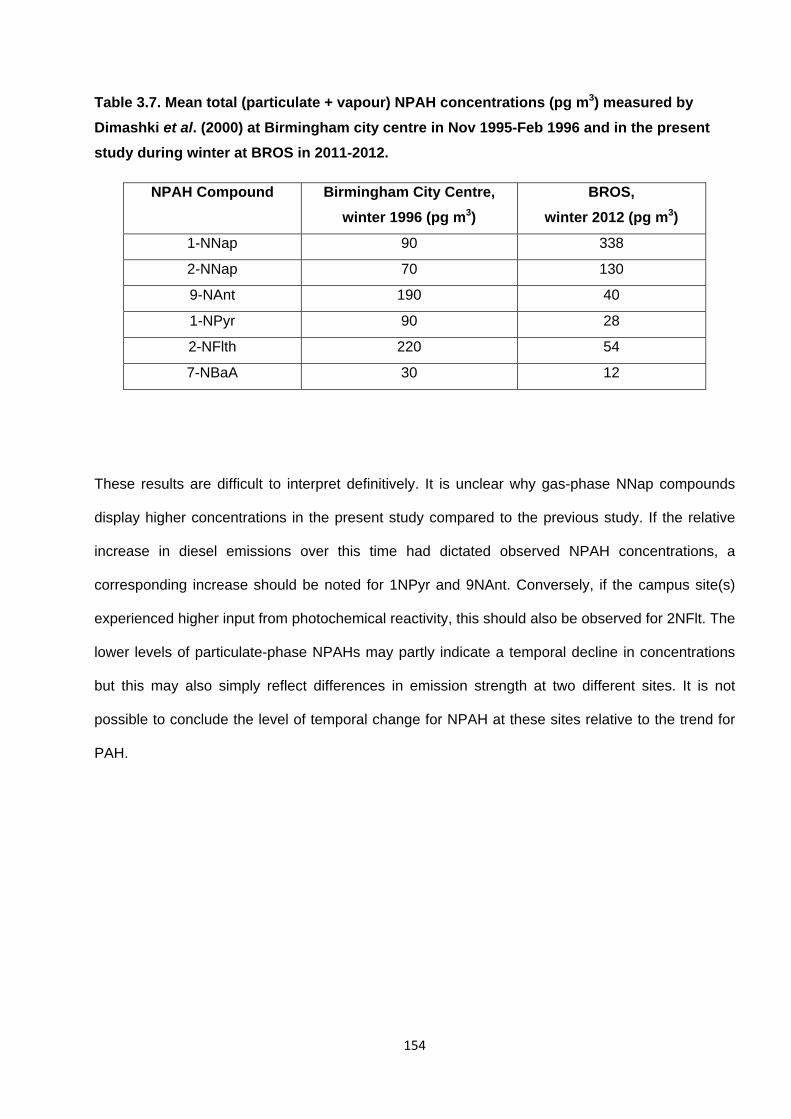
154
Table 3.7. Mean total (particulate + vapour) NPAH concentrations (pg m3) measured by
Dimashki et al. (2000) at Birmingham city centre in Nov 1995-Feb 1996 and in the present
study during winter at BROS in 2011-2012.
NPAH Compound Birmingham City Centre,
winter 1996 (pg m3)
BROS,
winter 2012 (pg m3)
1-NNap 90 338
2-NNap 70 130
9-NAnt 190 40
1-NPyr 90 28
2-NFlth 220 54
7-NBaA 30 12
These results are difficult to interpret definitively. It is unclear why gas-phase NNap compounds
display higher concentrations in the present study compared to the previous study. If the relative
increase in diesel emissions over this time had dictated observed NPAH concentrations, a
corresponding increase should be noted for 1NPyr and 9NAnt. Conversely, if the campus site(s)
experienced higher input from photochemical reactivity, this should also be observed for 2NFlt. The
lower levels of particulate-phase NPAHs may partly indicate a temporal decline in concentrations
but this may also simply reflect differences in emission strength at two different sites. It is not
possible to conclude the level of temporal change for NPAH at these sites relative to the trend for
PAH.

155
Chapter 4 : Gas-particle partitioning, chemical reactivity
and source apportionment of PAHs, OPAHs and
NPAHs, and the influence of sampling artefacts
4.1. Gas-particle partitioning of PAHs, OPAHs and NPAHs
4.1.1. Phase partitioning overview
The distinction between the gas-phase and particulate-phase fraction was taken be the proportion
present in the PUF material and filter respectively. The mean percentages of PAH, OPAH and
NPAH compounds in the gas- and particulate-phases in the samples from Campaign 1 are
presented in Figure 4.1. It is expected that sampling artefact has not influenced gas-particle
partitioning to a significant degree in this study (see Section 4.4).
4.1.1.1. Phase partitioning of PAHs
The PAH phase distribution observed in the present study is generally consistent with previous
sampling studies from the urban locations such as Tokyo, Japan (Yamasaki et al., 1982), London,
U.K. (Baek et al., 1991) and Chicago, USA (Simcik et al., 1998). LMW PAHs (MW<228) are shown
to be present predominantly in the gas-phase while HMW PAHs (MW>228) are mainly associated
with the particulate-phase. This partitioning behaviour is also similar to measurements previously
reported at the Birmingham University site in 1999-2001 (Laurie, 2003) and by Harrison and co
workers in 1992.
There is only a very modest difference in average gas-particle profiles for most compounds
between BROS and EROS locations, suggesting a limited degree of partitioning is occurring
between the ‘polluted’ site and the ‘background’ site. This is also consistent with previous work at
these sampling sites (Laurie, 2003).
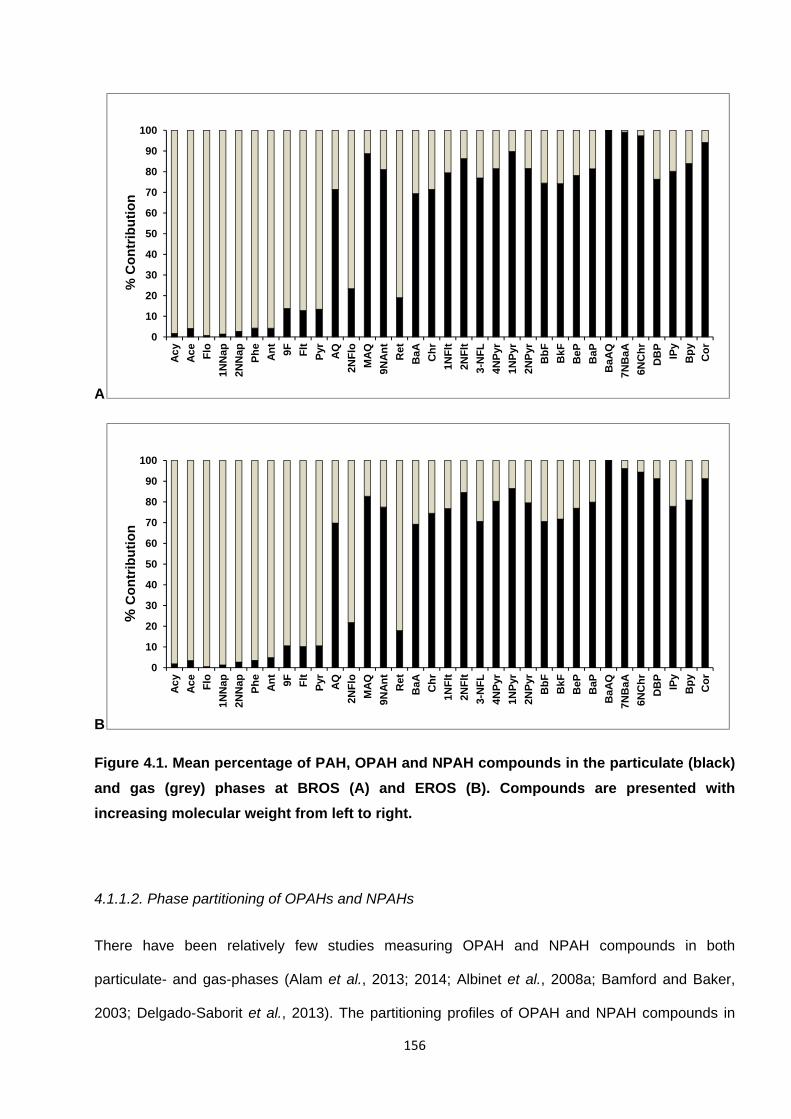
156
A
B
Figure 4.1. Mean percentage of PAH, OPAH and NPAH compounds in the particulate (black)
and gas (grey) phases at BROS (A) and EROS (B). Compounds are presented with
increasing molecular weight from left to right.
4.1.1.2. Phase partitioning of OPAHs and NPAHs
There have been relatively few studies measuring OPAH and NPAH compounds in both
particulate- and gas-phases (Alam et al., 2013; 2014; Albinet et al., 2008a; Bamford and Baker,
2003; Delgado-Saborit et al., 2013). The partitioning profiles of OPAH and NPAH compounds in
0
10
20
30
40
50
60
70
80
90
100
Ac
y
Ace Flo
1NN
ap
2NN
ap
Ph
e
An
t
9F Flt
Pyr AQ
2NF
lo
MA
Q
9NA
nt
Ret
Ba A Ch
r
1NF
lt
2NF
lt
3-N
FL
4NP
yr
1NP
yr
2NP
yr
Bb
F
BkF
BeP
BaP
BaA
Q
7NB
aA
6NC
hr
DB
P
IPy
Bp
y
Co
r
% C
on
trib
uti
on
0
10
20
30
40
50
60
70
80
90
100
Ac
y
Ace Flo
1NN
ap
2NN
ap
Ph
e
An
t
9F Flt
Pyr AQ
2NF
lo
MA
Q
9NA
nt
Ret
Ba A Ch
r
1NF
lt
2NF
lt
3-N
FL
4NP
yr
1NP
yr
2NP
yr
Bb
F
BkF
BeP
BaP
BaA
Q
7NB
aA
6NC
hr
DB
P
IPy
Bp
y
Co
r
% C
on
trib
uti
on
157
the present study are broadly similar with that observed by Albinet et al. (2008a), Bamford and
Baker (2003), Huang et al. (2014) and Delgado-Saborit et al. (2013). As with unsubstituted PAHs,
more volatile compounds (MW < 207) are predominantly present in the gas-phase while HMW
compounds (MW > 247) are mainly associated with the particle-phase.
Previously, Dimashki et al. (2000) measured NPAH concentrations in central Birmingham during
winter. NNap isomers were shown to exist almost entirely in the gas-phase while HMW compounds
2NFlt, 1NPyr and 7NBaA were shown to be almost entirely in the particulate phase. The more
semi-volatile 9NAnt was shown to exhibit a particle-phase contribution of ~77%. This NPAH phase
distribution is very similar to that observed in the winter samples of the present study.
The phase-partitioning behaviour of individual PAH, OPAH and NPAH compounds, particularly
those of intermediate size (234>MW>207) is highly dependent on the specific sampling location,
ambient conditions, and the sampling method used (Baek et al., 1991; Yamasaki et al., 1982 ;
Delgado-Saborit et al., 2013), and can display significant seasonal differences (see below).
It is clear from Figure 3.10 that while molecular weight is a good predictor of PAH gas-particle
partitioning, intermediate MW PAH, OPAH and NPAH compounds display very different partitioning
behaviour, suggesting other/additional factors play an important role. For example, the particle-
phase fraction of Ret, AQ, 2NFlo and 9NAnt are shown to display very different values despite
relatively small differences in MW between these compounds.
4.1.2. Physiochemical properties influencing partitioning
The percentage proportion of PAH, OPAH and NPAH compounds in atmospheric measurements
(%P) have previously been plotted with respect to their respective molecular weights by Albinet et
al. (2008a), who observed a distinct pattern for the distribution of these compound classes for
winter and summer sampling.
158
Delgado-Saborit et al. (2013) have also characterised PAH and OPAH phase partitioning based on
molecular weight (MW) as well as other physiochemical properties including vapour pressure, VP
(to represent compound volatility); octanol-water partitioning coefficient, Log Kow (to represent
compound polarity); and Henry’s Law Constant, H (to represent a compound’s tendency to partition
to the aqueous phase).
This approach was applied to the sampling data from Campaign 1 of the present study, in order to
compare observations with those of previous studies and extend the approach of Delgado-Saborit
et al. (2013) to include NPAH compounds Plots of percentage particulate-phase contribution
against MW, VP, logKow and H are shown in Figure 4.2, 4.3, 4.4 and 4.5 respectively, with different
plots shown for each individual compound class. These include distributions for the mean %P
value for all samples in the campaign as well as those for averages of winter and summer samples.
Details of the sources for physiochemical metrics used in these plots can be found in Table 4.1.
Experimental data were not available for all compounds and it should be noted than due to
relatively few OPAH compounds measured in the study, curves could not be adequately fitted for
certain parameters (e.g. log Kow and H) and plots for OPAH should interpreted with caution.
Delgado-Saborit et al. (2013) provide plots using a more expansive range of measured OPAH
compounds and a more detailed discussion of partitioning behaviour.
Delgado-Saborit et al. (2013) demonstrated that a sigmodial logistic curve using 4 parameters (Eq
4.1) provides a good fit for the plots of %P vs MW, %P vs VP and %P vs logKow and an
exponential curve fitted for %P vs H for PAHs and OPAHs in samples collected at these sites.
(4.1)
This approach was used in the present study to provide comparable results to those of the
Delgado-Saborit et al. (2013) study as to assess the suitability of this approach for NPAH
compounds.
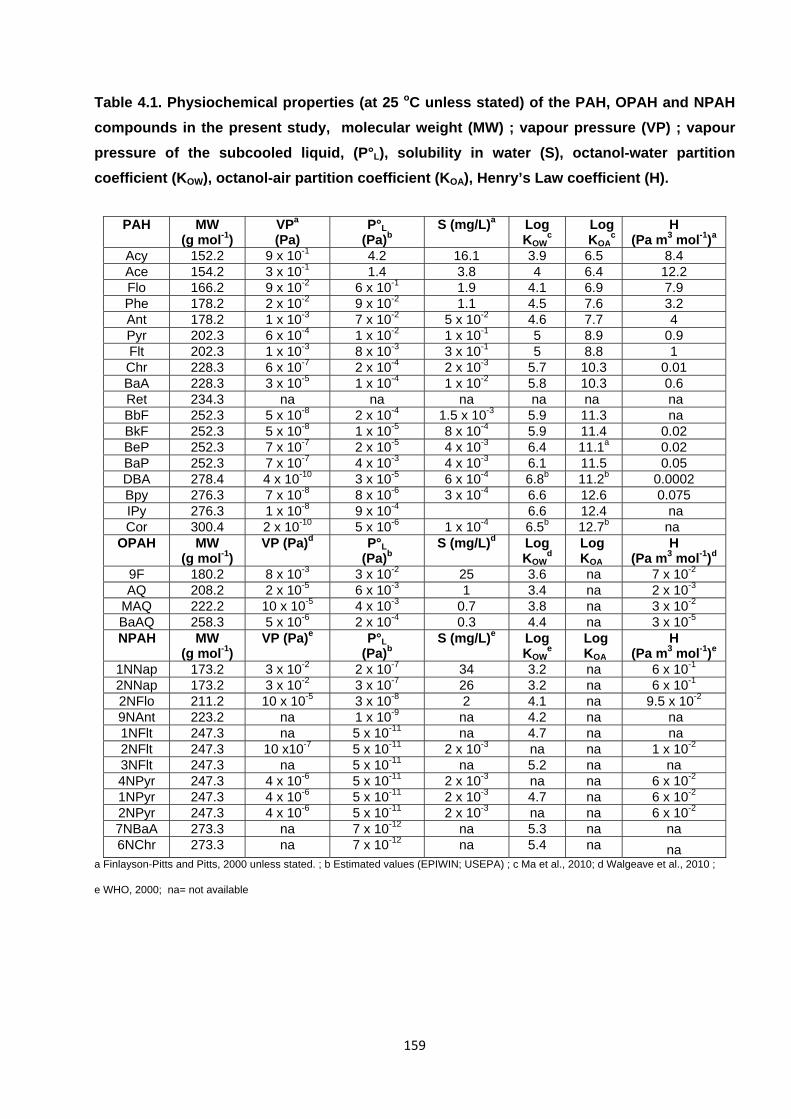
159
Table 4.1. Physiochemical properties (at 25 oC unless stated) of the PAH, OPAH and NPAH
compounds in the present study, molecular weight (MW) ; vapour pressure (VP) ; vapour
pressure of the subcooled liquid, (P°L), solubility in water (S), octanol-water partition
coefficient (KOW), octanol-air partition coefficient (KOA), Henry’s Law coefficient (H).
a Finlayson-Pitts and Pitts, 2000 unless stated. ; b Estimated values (EPIWIN; USEPA) ; c Ma et al., 2010; d Walgeave et al., 2010 ;
e WHO, 2000; na= not available
PAH MW (g mol-1)
VPa
(Pa) P°L
(Pa)b S (mg/L)a Log
KOWc
Log KOA
c H
(Pa m3 mol-1)a Acy 152.2 9 x 10⁻¹ 4.2 16.1 3.9 6.5 8.4 Ace 154.2 3 x 10⁻¹ 1.4 3.8 4 6.4 12.2 Flo 166.2 9 x 10⁻² 6 x 10⁻¹ 1.9 4.1 6.9 7.9 Phe 178.2 2 x 10⁻² 9 x 10⁻² 1.1 4.5 7.6 3.2 Ant 178.2 1 x 10⁻³ 7 x 10⁻² 5 x 10⁻² 4.6 7.7 4 Pyr 202.3 6 x 10⁻⁴ 1 x 10⁻² 1 x 10⁻¹ 5 8.9 0.9 Flt 202.3 1 x 10⁻³ 8 x 10⁻³ 3 x 10⁻¹ 5 8.8 1 Chr 228.3 6 x 10⁻⁷ 2 x 10⁻⁴ 2 x 10⁻³ 5.7 10.3 0.01 BaA 228.3 3 x 10⁻⁵ 1 x 10⁻⁴ 1 x 10⁻² 5.8 10.3 0.6 Ret 234.3 na na na na na na BbF 252.3 5 x 10⁻⁸ 2 x 10⁻⁴ 1.5 x 10⁻³ 5.9 11.3 na BkF 252.3 5 x 10⁻⁸ 1 x 10⁻⁵ 8 x 10⁻⁴ 5.9 11.4 0.02 BeP 252.3 7 x 10⁻⁷ 2 x 10⁻⁵ 4 x 10⁻³ 6.4 11.1a 0.02 BaP 252.3 7 x 10⁻⁷ 4 x 10⁻³ 4 x 10⁻³ 6.1 11.5 0.05 DBA 278.4 4 x 10⁻¹⁰ 3 x 10⁻⁵ 6 x 10⁻⁴ 6.8b 11.2b 0.0002 Bpy 276.3 7 x 10⁻⁸ 8 x 10⁻⁶ 3 x 10⁻⁴ 6.6 12.6 0.075 IPy 276.3 1 x 10⁻⁸ 9 x 10⁻⁴ 6.6 12.4 na Cor 300.4 2 x 10⁻¹⁰ 5 x 10⁻⁶ 1 x 10⁻⁴ 6.5b 12.7b na
OPAH MW (g mol-1)
VP (Pa)d P°L (Pa)b
S (mg/L)d Log KOW
d Log KOA
H (Pa m3 mol-1)d
9F 180.2 8 x 10⁻³ 3 x 10⁻² 25 3.6 na 7 x 10⁻² AQ 208.2 2 x 10⁻⁵ 6 x 10⁻³ 1 3.4 na 2 x 10⁻³
MAQ 222.2 10 x 10-5 4 x 10⁻³ 0.7 3.8 na 3 x 10⁻²
BaAQ 258.3 5 x 10⁻⁶ 2 x 10⁻⁴ 0.3 4.4 na 3 x 10⁻⁵
NPAH MW (g mol-1)
VP (Pa)e P°L (Pa)b
S (mg/L)e Log KOW
e Log KOA
H (Pa m3 mol-1)e
1NNap 173.2 3 x 10⁻² 2 x 10⁻⁷ 34 3.2 na 6 x 10⁻¹ 2NNap 173.2 3 x 10⁻² 3 x 10⁻⁷ 26 3.2 na 6 x 10⁻¹ 2NFlo 211.2 10 x 10-5 3 x 10⁻⁸ 2 4.1 na 9.5 x 10⁻² 9NAnt 223.2 na 1 x 10⁻⁹ na 4.2 na na 1NFlt 247.3 na 5 x 10-11 na 4.7 na na 2NFlt 247.3 10 x10-7 5 x 10-11 2 x 10⁻³ na na 1 x 10⁻² 3NFlt 247.3 na 5 x 10-11 na 5.2 na na 4NPyr 247.3 4 x 10⁻⁶ 5 x 10-11 2 x 10⁻³ na na 6 x 10⁻² 1NPyr 247.3 4 x 10⁻⁶ 5 x 10-11 2 x 10⁻³ 4.7 na 6 x 10⁻² 2NPyr 247.3 4 x 10⁻⁶ 5 x 10-11 2 x 10⁻³ na na 6 x 10⁻² 7NBaA 273.3 na 7 x 10-12 na 5.3 na na 6NChr 273.3 na 7 x 10-12 na 5.4 na na
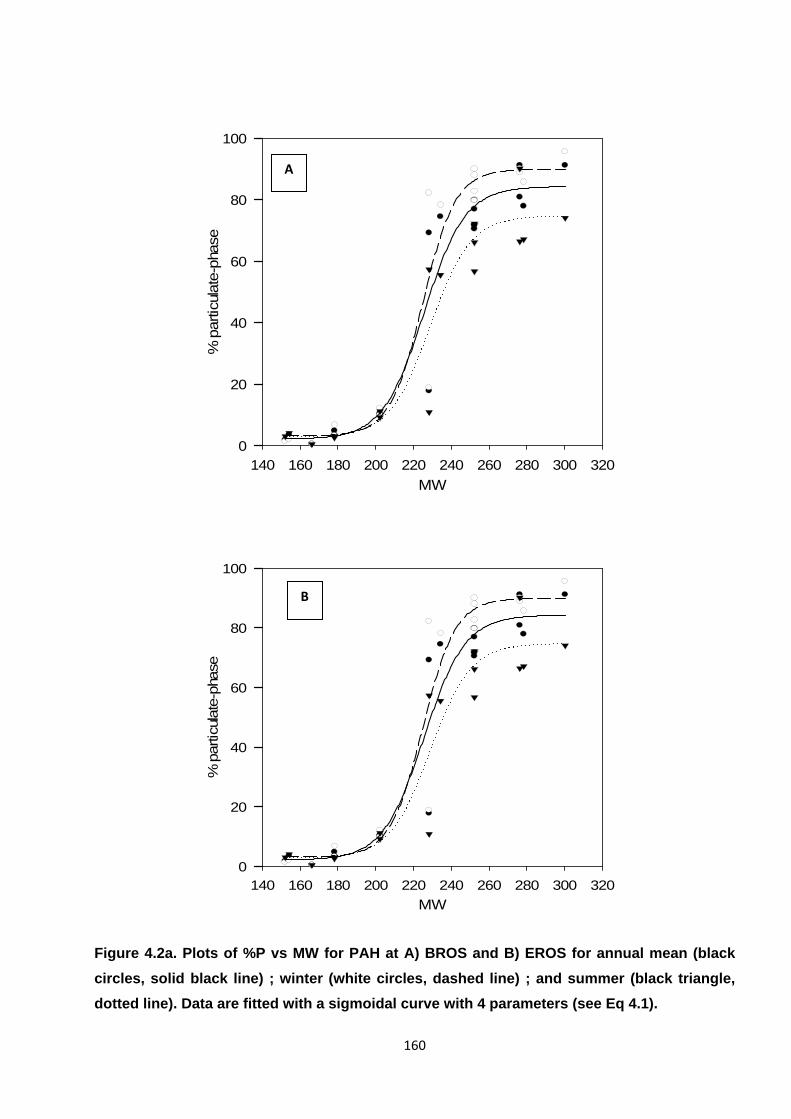
160
MW140 160 180 200 220 240 260 280 300 320
% p
artic
ulate
-pha
se
0
20
40
60
80
100
MW140 160 180 200 220 240 260 280 300 320
% p
artic
ulate
-pha
se
0
20
40
60
80
100
Figure 4.2a. Plots of %P vs MW for PAH at A) BROS and B) EROS for annual mean (black
circles, solid black line) ; winter (white circles, dashed line) ; and summer (black triangle,
dotted line). Data are fitted with a sigmoidal curve with 4 parameters (see Eq 4.1).
A
B
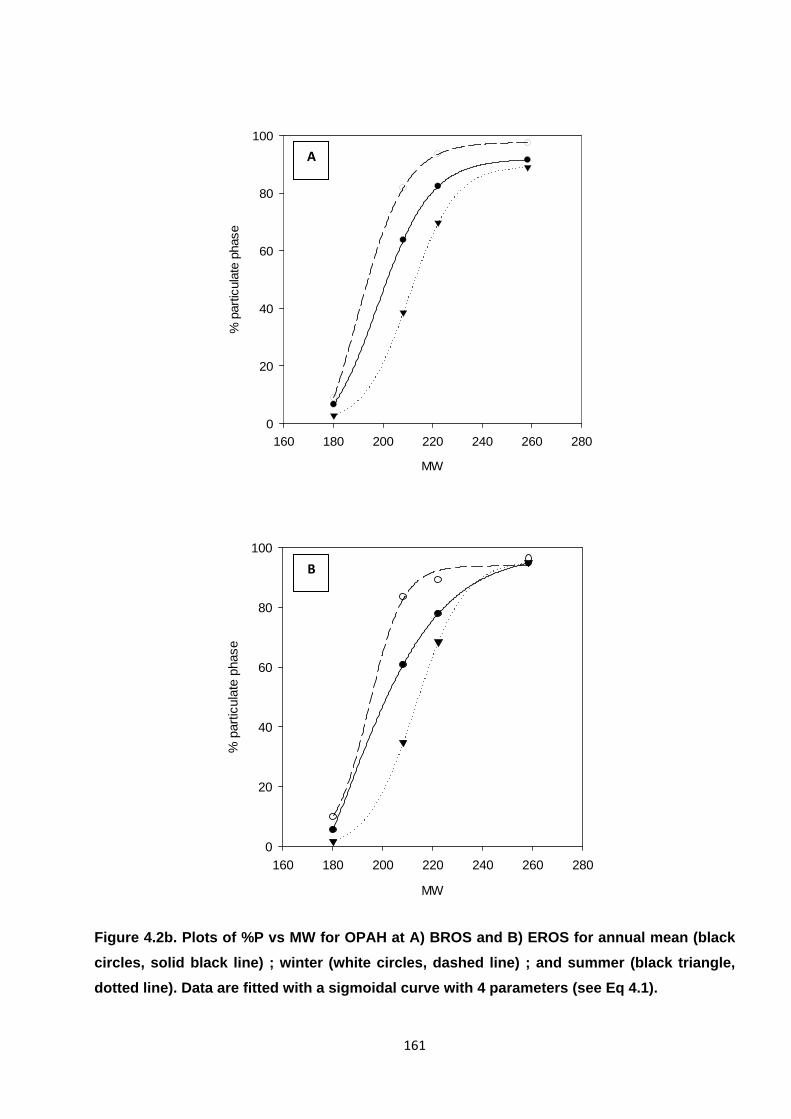
161
MW
160 180 200 220 240 260 280
% p
artic
ulat
e ph
ase
0
20
40
60
80
100
MW
160 180 200 220 240 260 280
% p
artic
ulat
e ph
ase
0
20
40
60
80
100
Figure 4.2b. Plots of %P vs MW for OPAH at A) BROS and B) EROS for annual mean (black
circles, solid black line) ; winter (white circles, dashed line) ; and summer (black triangle,
dotted line). Data are fitted with a sigmoidal curve with 4 parameters (see Eq 4.1).
A
B
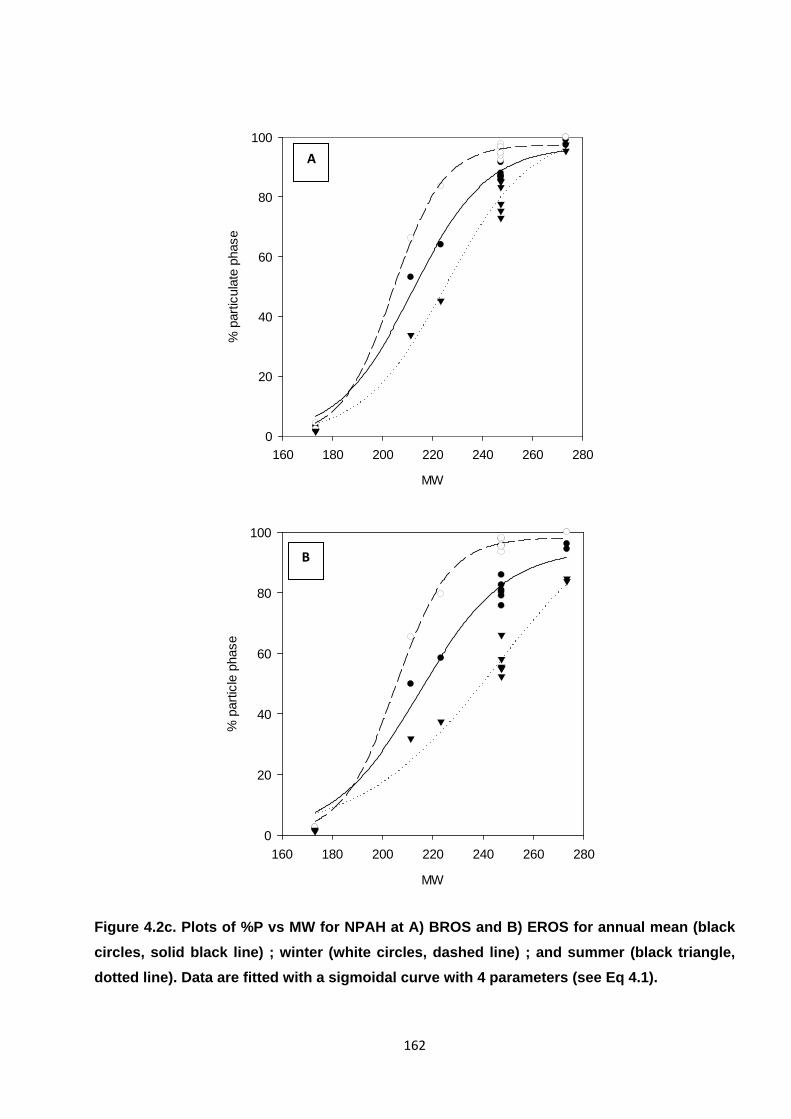
162
MW
160 180 200 220 240 260 280
% p
artic
ulat
e ph
ase
0
20
40
60
80
100
MW
160 180 200 220 240 260 280
% p
artic
le p
hase
0
20
40
60
80
100
Figure 4.2c. Plots of %P vs MW for NPAH at A) BROS and B) EROS for annual mean (black
circles, solid black line) ; winter (white circles, dashed line) ; and summer (black triangle,
dotted line). Data are fitted with a sigmoidal curve with 4 parameters (see Eq 4.1).
B
A

163
vapour pressure
1e-101e-9 1e-8 1e-7 1e-6 1e-5 1e-4 1e-3 1e-2 1e-1 1e+0
% p
artic
ulat
e ph
ase
0
20
40
60
80
100
vapour pressure
1e-111e-101e-9 1e-8 1e-7 1e-6 1e-5 1e-4 1e-3 1e-2 1e-11e+01e+1
% p
artic
ulat
e ph
ase
0
20
40
60
80
100
Figure 4.3a. Plots of %P vs VP for PAH at A) BROS and B) EROS for annual mean (black
circles, solid black line) ; winter (white circles, dashed line) ; and summer (black triangle,
dotted line). Data are fitted with a sigmoidal curve with 4 parameters (see Eq 4.1).
A
B

164
vapour pressure
e-9 e-8 e-7 e-6 e-5 e-4 e-3
% p
artic
ulat
e ph
ase
0
20
40
60
80
100
vapour pressure
e-9 e-8 e-7 e-6 e-5 e-4 e-3
% p
artic
ulat
e ph
ase
0
20
40
60
80
100
Figure 4.3b. Plots of %P vs VP for OPAH at (A) BROS and (B) EROS for annual mean (black
circles, solid black line) ; winter (white circles, dashed line) ; and summer (black triangle,
dotted line). Data are fitted with a sigmoidal curve with 4 parameters (see Eq 4.1).
A
B
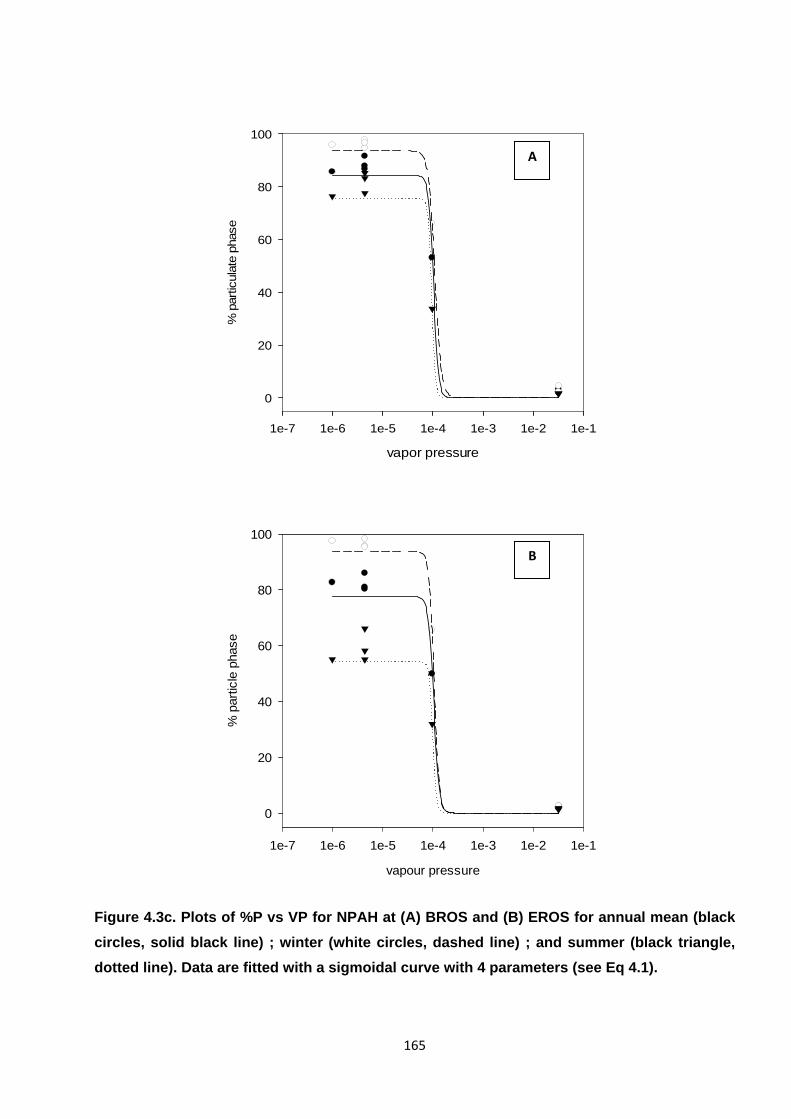
165
vapor pressure
1e-7 1e-6 1e-5 1e-4 1e-3 1e-2 1e-1
% p
artic
ulat
e ph
ase
0
20
40
60
80
100
vapour pressure
1e-7 1e-6 1e-5 1e-4 1e-3 1e-2 1e-1
% p
artic
le p
hase
0
20
40
60
80
100
Figure 4.3c. Plots of %P vs VP for NPAH at (A) BROS and (B) EROS for annual mean (black
circles, solid black line) ; winter (white circles, dashed line) ; and summer (black triangle,
dotted line). Data are fitted with a sigmoidal curve with 4 parameters (see Eq 4.1).
A
B
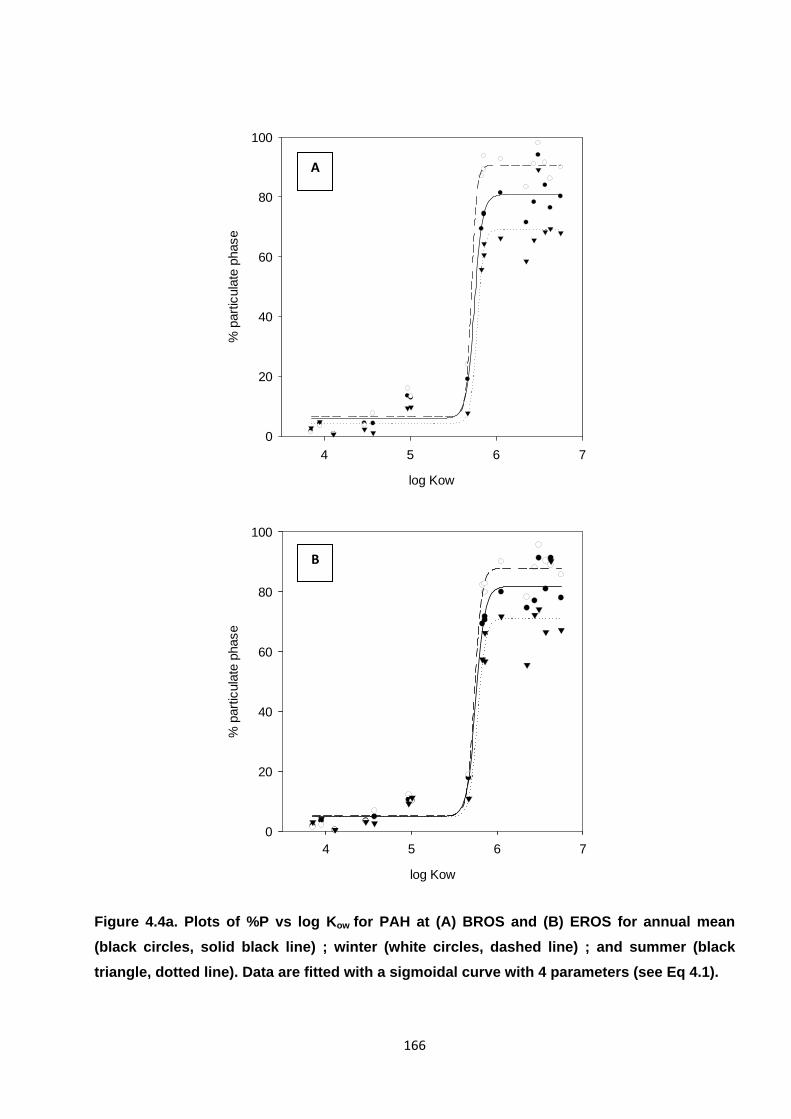
166
log Kow
4 5 6 7
% p
artic
ulat
e ph
ase
0
20
40
60
80
100
log Kow
4 5 6 7
% p
artic
ulat
e ph
ase
0
20
40
60
80
100
Figure 4.4a. Plots of %P vs log Kow for PAH at (A) BROS and (B) EROS for annual mean
(black circles, solid black line) ; winter (white circles, dashed line) ; and summer (black
triangle, dotted line). Data are fitted with a sigmoidal curve with 4 parameters (see Eq 4.1).
B
A
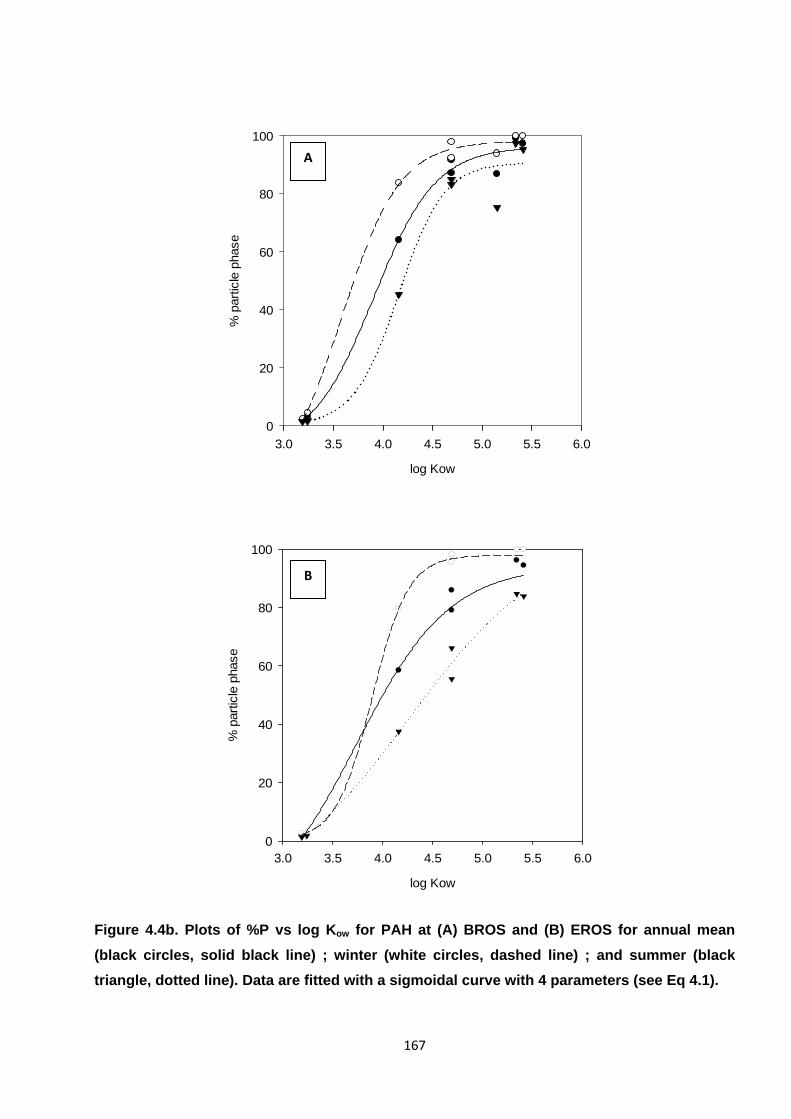
167
log Kow
3.0 3.5 4.0 4.5 5.0 5.5 6.0
% p
artic
le p
hase
0
20
40
60
80
100
log Kow
3.0 3.5 4.0 4.5 5.0 5.5 6.0
% p
artic
le p
hase
0
20
40
60
80
100
Figure 4.4b. Plots of %P vs log Kow for PAH at (A) BROS and (B) EROS for annual mean
(black circles, solid black line) ; winter (white circles, dashed line) ; and summer (black
triangle, dotted line). Data are fitted with a sigmoidal curve with 4 parameters (see Eq 4.1).
A
B

168
Henry's Law Constant
1e-5 1e-4 1e-3 1e-2 1e-1 1e+0 1e+1 1e+2
% p
artic
ulat
e ph
ase
0
20
40
60
80
100
Henry's Law Constant
1e-5 1e-4 1e-3 1e-2 1e-1 1e+0 1e+1 1e+2
% p
artic
ulat
e ph
ase
0
20
40
60
80
100
Figure 4.5a. Plots of %P vs H for PAH at A) BROS and B) EROS for annual mean (black
circles, solid black line) ; winter (white circles, dashed line) ; and summer (black triangle,
dotted line). Data are fitted with a sigmoidal curve with 4 parameters (see Eq 4.1).
A
B
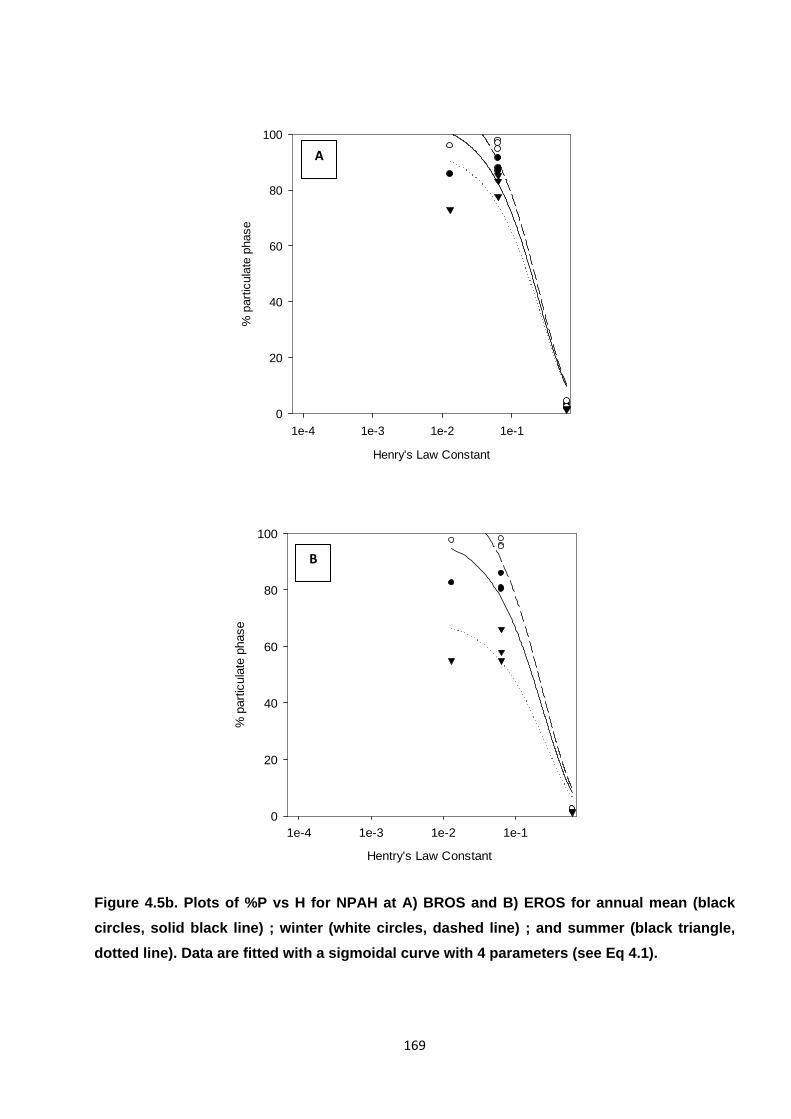
169
Henry's Law Constant
1e-4 1e-3 1e-2 1e-1
% p
artic
ulat
e ph
ase
0
20
40
60
80
100
Hentry's Law Constant
1e-4 1e-3 1e-2 1e-1
% p
artic
ulat
e ph
ase
0
20
40
60
80
100
Figure 4.5b. Plots of %P vs H for NPAH at A) BROS and B) EROS for annual mean (black
circles, solid black line) ; winter (white circles, dashed line) ; and summer (black triangle,
dotted line). Data are fitted with a sigmoidal curve with 4 parameters (see Eq 4.1).
A
B
170
It is shown in Figures 4.2. 4.3, 4.4 and 4.5 that the slopes of these plots are broadly similar
between BROS and EROS, suggesting very similar partitioning behaviour for these compound
classes at the two sites.
Plots of %P vs MW display similar curves to those observed by Albinet et al. (2008a). Interestingly,
Delgado-Saborit et al. (2013) observed a shallower slope for OPAH compared with PAH, in
contrast to the work present here and by Albinet et al. (2008a). It should be noted, however that
relatively fewer data were used in the plots in the present study compared with the Delgado-
Saborit et al. (2013) study.
The seasonality of partitioning for semi-volatile (240>MW>200) compounds is apparent from these
plots. As with the plots of %P vs MW produced by Albinet et al. (2008a), a notable shift in curve
position is observed for PAH, OPAH and NPAH. As reported by Albinet et al. (2008) a relatively
large seasonal shift in proportion of compounds present in the particulate phase is observed for
OPAH and NPAH compared with PAH. However it is noted that HMW PAH compounds display
relatively higher seasonal change compared with LMW species.
PAHs, OPAH and NPAHs display broadly similar %P vs VP curves, which is expected due to
similar relationships between MW and VP for these compound classes (see Table 3.9). Plots
of %P vs Log Kow for PAH are generally in agreement with that reported by Delgado-Saborit et al.
(2013) with a similar although slightly steeper curve than that observed for the %P vs MW plot. The
plot for NPAH compounds displays a similar pattern to this. The plots of %P vs H for PAH are fitted
by an exponential curve, in agreement with Delgado-Saborit et al. (2013) with NPAH compounds
displaying a similar pattern.
It is perhaps surprising that different physiochemical properties display similar curves defining the
partitioning behaviour of PAHs, OPAHs and NPAHs. The similar influence of these different
physiochemical variables for both PAH and OPAH compounds was observed previously (Delgado-
Saborit et al.,2013). It is shown that good correlations exist between these different properties for
both PAH and OPAH compounds, which may explain why similar curves are observed between
171
%P and these different properties Delgado-Saborit et al. (2013). Correlations are also noted for the
NPAHs included in the present study, however it should be noted that relatively few experimental
data are available for NPAH compounds.
OPAH and NPAH display lower log Kow and H values than unsubstituted PAH. This would indicate
these compounds will exhibit a higher affinity towards aqueous atmospheric droplets or water on or
within atmospheric particles. This is expected due to the higher polarity of these –NO2 or =O
containing compounds Delgado-Saborit et al. (2013). This behaviour may partly explain the
differences in partitioning behaviour for OPAH and NPAH compounds compared with PAHs of
similar MW.
More work is clearly required to investigate differences in phase-partitioning of PAHs and their
OPAH and NPAH derivatives. A further property that could be investigated as a predictor for
partitioning behaviour is the octanol-air partitioning coefficient (Koa) (Harner and Bidleman, 1998;
Huang et al., 2014). For example, investigating the partitioning behaviour of PAHs with respect to
Koa would allow researchers to asses the impotance of absorption into the organic fraction of
atmospheric PM on this process. However, limited experimental data are available on Koa values
for OPAH and NPAH compounds.
4.1.3. Seasonality in partitioning behaviour
Despite a considerable number of studies measuring both particle- and gas-phases of PAHs and
(to a lesser extent) OPAHs and NPAHs, relatively little discussion in the literature exists regarding
the seasonal variation in partitioning behaviour of these compounds (Yamaski et al., 1982 ; Baek et
al., 1991 ; Smith and Harrison, 1996 ; Albinet et al., 2008a). As demonstrated in Figure 3.10, the
PAH, OPAH and NPAH compounds measured in the present study display seasonally-dependent
behaviour, likely to be driven by temperature differences between warmer summer and colder
winter months .
Clearly, the proportion of compounds present in the particulate phase is reduced in summer
relative to winter, in agreement previous sampling studies in urban or trafficked sites for PAHs

172
(Baek et al.,1991 ; Yamasaki et al., 1982), NPAHs and OPAHs (Bamford and Baker, 2003; Albinet
et al., 2008a). However Smith and Harrison (1996) reported a higher proportion of 3-4 ring PAH in
the particulate-phase during summer in Birmingham in contrast to the present study. This would
suggest a temperature-driven partitioning of species is occurring, with low temperatures in winter
facilitating more pronounced association with particulate matter in winter and higher temperatures
resulting in more enhanced partitioning to the gas-phase in summer. However, it should be noted
that, similar to the observation of Albinet et al. (2008a), no correlation was found between the
percentage of compound in the particulate phase and ambient temperature in the present study.
The TSP concentration was also shown to be higher in winter samples compared with summer
samples in the present study. The mean TSP concentration in only winter and summer samples
were ~32 μg m-3 and ~17 μg m-3 respectively at BROS and ~24μg m-3 and ~13 μg m-3 respectively
at EROS. A higher concentration of TSP in winter relative to summer could therefore be an
important driver to higher particle-phase fraction of PAHs and derivatives in these samples.
The observed seahesonality of %P for intermediate MW compounds is much less pronounced than
has been reported in previous studies. For example, Albinet et al. (2008a) reported a much greater
winter/summer differential in the partitioning behaviour for intermediate molecular weight NPAH
compounds such a 2NFlo and 9Ant and OPAH compounds such as 9F and AQ in a trafficked site
in a French Alpine valley. A similar observation was reported by Bamford and Baker (2003) for Flt,
Pyr, 2NFlo and 9NAnt in Baltimore, USA.
As mentioned above, the difference in average seasonal temperature could partly explain this
discrepancy. For example, the mean ambient temperature measured for the winter and summer
samples in the present study were 6oC and 15oC respectively. In the study by Albinet et al. (2008)
the mean winter and summer temperatures were -3oC and 17oC respectively. The relatively cold
winter temperatures in the previous study could facilitate a higher association with the particulate
phase.
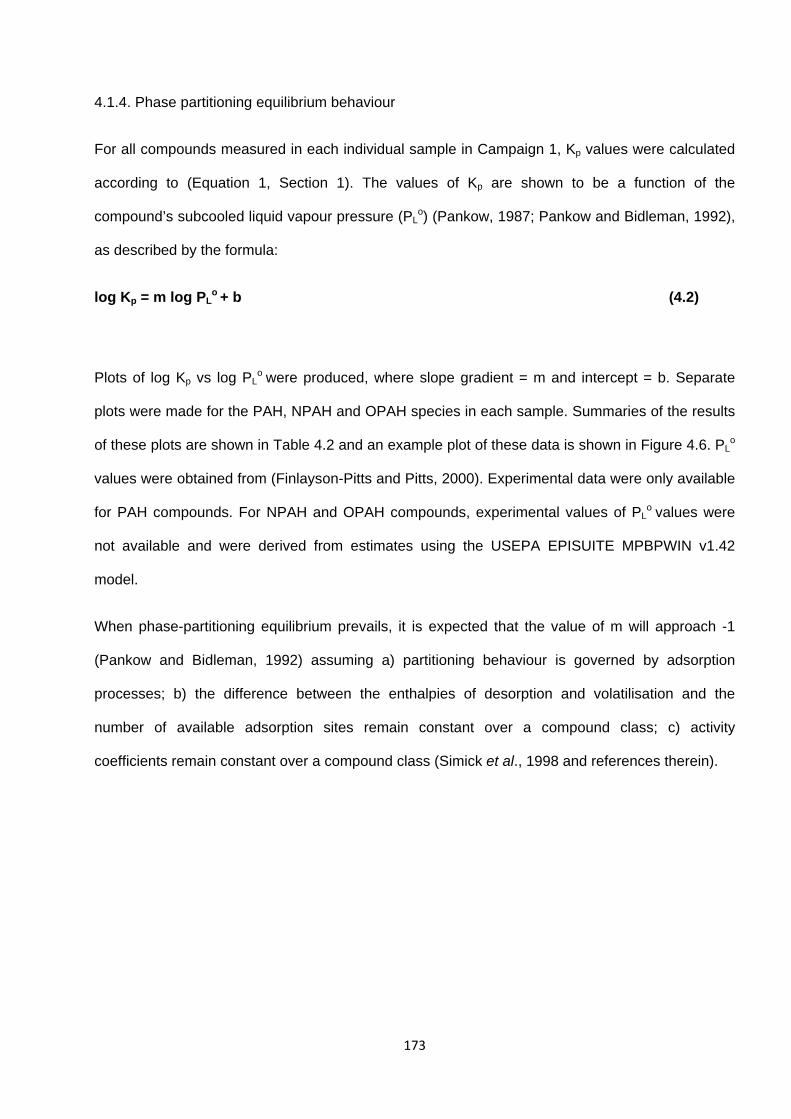
173
4.1.4. Phase partitioning equilibrium behaviour
For all compounds measured in each individual sample in Campaign 1, Kp values were calculated
according to (Equation 1, Section 1). The values of Kp are shown to be a function of the
compound’s subcooled liquid vapour pressure (PLo) (Pankow, 1987; Pankow and Bidleman, 1992),
as described by the formula:
log Kp = m log PLo + b (4.2)
Plots of log Kp vs log PLo were produced, where slope gradient = m and intercept = b. Separate
plots were made for the PAH, NPAH and OPAH species in each sample. Summaries of the results
of these plots are shown in Table 4.2 and an example plot of these data is shown in Figure 4.6. PLo
values were obtained from (Finlayson-Pitts and Pitts, 2000). Experimental data were only available
for PAH compounds. For NPAH and OPAH compounds, experimental values of PLo values were
not available and were derived from estimates using the USEPA EPISUITE MPBPWIN v1.42
model.
When phase-partitioning equilibrium prevails, it is expected that the value of m will approach -1
(Pankow and Bidleman, 1992) assuming a) partitioning behaviour is governed by adsorption
processes; b) the difference between the enthalpies of desorption and volatilisation and the
number of available adsorption sites remain constant over a compound class; c) activity
coefficients remain constant over a compound class (Simick et al., 1998 and references therein).
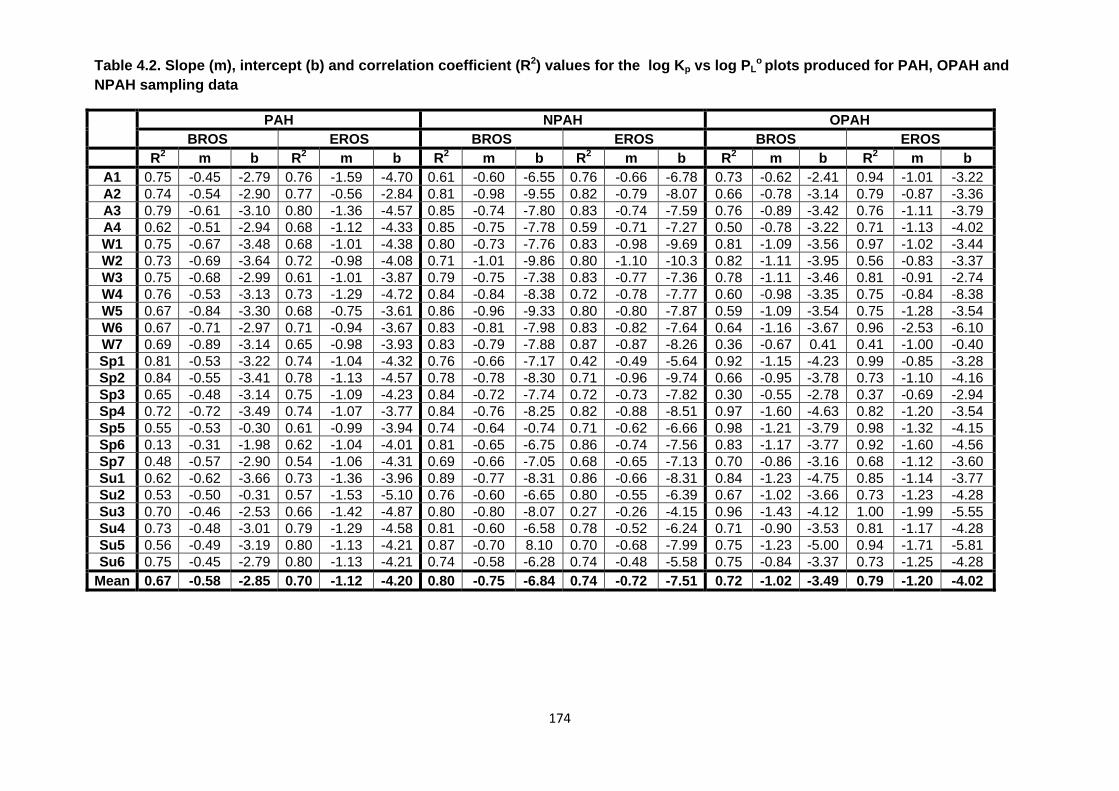
174
Table 4.2. Slope (m), intercept (b) and correlation coefficient (R2) values for the log Kp vs log PLo plots produced for PAH, OPAH and
NPAH sampling data
PAH NPAH OPAH BROS EROS BROS EROS BROS EROS
R2 m b R2 m b R2 m b R2 m b R2 m b R2 m b A1 0.75 -0.45 -2.79 0.76 -1.59 -4.70 0.61 -0.60 -6.55 0.76 -0.66 -6.78 0.73 -0.62 -2.41 0.94 -1.01 -3.22 A2 0.74 -0.54 -2.90 0.77 -0.56 -2.84 0.81 -0.98 -9.55 0.82 -0.79 -8.07 0.66 -0.78 -3.14 0.79 -0.87 -3.36 A3 0.79 -0.61 -3.10 0.80 -1.36 -4.57 0.85 -0.74 -7.80 0.83 -0.74 -7.59 0.76 -0.89 -3.42 0.76 -1.11 -3.79 A4 0.62 -0.51 -2.94 0.68 -1.12 -4.33 0.85 -0.75 -7.78 0.59 -0.71 -7.27 0.50 -0.78 -3.22 0.71 -1.13 -4.02 W1 0.75 -0.67 -3.48 0.68 -1.01 -4.38 0.80 -0.73 -7.76 0.83 -0.98 -9.69 0.81 -1.09 -3.56 0.97 -1.02 -3.44 W2 0.73 -0.69 -3.64 0.72 -0.98 -4.08 0.71 -1.01 -9.86 0.80 -1.10 -10.3 0.82 -1.11 -3.95 0.56 -0.83 -3.37 W3 0.75 -0.68 -2.99 0.61 -1.01 -3.87 0.79 -0.75 -7.38 0.83 -0.77 -7.36 0.78 -1.11 -3.46 0.81 -0.91 -2.74 W4 0.76 -0.53 -3.13 0.73 -1.29 -4.72 0.84 -0.84 -8.38 0.72 -0.78 -7.77 0.60 -0.98 -3.35 0.75 -0.84 -8.38 W5 0.67 -0.84 -3.30 0.68 -0.75 -3.61 0.86 -0.96 -9.33 0.80 -0.80 -7.87 0.59 -1.09 -3.54 0.75 -1.28 -3.54 W6 0.67 -0.71 -2.97 0.71 -0.94 -3.67 0.83 -0.81 -7.98 0.83 -0.82 -7.64 0.64 -1.16 -3.67 0.96 -2.53 -6.10 W7 0.69 -0.89 -3.14 0.65 -0.98 -3.93 0.83 -0.79 -7.88 0.87 -0.87 -8.26 0.36 -0.67 0.41 0.41 -1.00 -0.40 Sp1 0.81 -0.53 -3.22 0.74 -1.04 -4.32 0.76 -0.66 -7.17 0.42 -0.49 -5.64 0.92 -1.15 -4.23 0.99 -0.85 -3.28 Sp2 0.84 -0.55 -3.41 0.78 -1.13 -4.57 0.78 -0.78 -8.30 0.71 -0.96 -9.74 0.66 -0.95 -3.78 0.73 -1.10 -4.16 Sp3 0.65 -0.48 -3.14 0.75 -1.09 -4.23 0.84 -0.72 -7.74 0.72 -0.73 -7.82 0.30 -0.55 -2.78 0.37 -0.69 -2.94 Sp4 0.72 -0.72 -3.49 0.74 -1.07 -3.77 0.84 -0.76 -8.25 0.82 -0.88 -8.51 0.97 -1.60 -4.63 0.82 -1.20 -3.54 Sp5 0.55 -0.53 -0.30 0.61 -0.99 -3.94 0.74 -0.64 -0.74 0.71 -0.62 -6.66 0.98 -1.21 -3.79 0.98 -1.32 -4.15 Sp6 0.13 -0.31 -1.98 0.62 -1.04 -4.01 0.81 -0.65 -6.75 0.86 -0.74 -7.56 0.83 -1.17 -3.77 0.92 -1.60 -4.56 Sp7 0.48 -0.57 -2.90 0.54 -1.06 -4.31 0.69 -0.66 -7.05 0.68 -0.65 -7.13 0.70 -0.86 -3.16 0.68 -1.12 -3.60 Su1 0.62 -0.62 -3.66 0.73 -1.36 -3.96 0.89 -0.77 -8.31 0.86 -0.66 -8.31 0.84 -1.23 -4.75 0.85 -1.14 -3.77 Su2 0.53 -0.50 -0.31 0.57 -1.53 -5.10 0.76 -0.60 -6.65 0.80 -0.55 -6.39 0.67 -1.02 -3.66 0.73 -1.23 -4.28 Su3 0.70 -0.46 -2.53 0.66 -1.42 -4.87 0.80 -0.80 -8.07 0.27 -0.26 -4.15 0.96 -1.43 -4.12 1.00 -1.99 -5.55 Su4 0.73 -0.48 -3.01 0.79 -1.29 -4.58 0.81 -0.60 -6.58 0.78 -0.52 -6.24 0.71 -0.90 -3.53 0.81 -1.17 -4.28 Su5 0.56 -0.49 -3.19 0.80 -1.13 -4.21 0.87 -0.70 8.10 0.70 -0.68 -7.99 0.75 -1.23 -5.00 0.94 -1.71 -5.81 Su6 0.75 -0.45 -2.79 0.80 -1.13 -4.21 0.74 -0.58 -6.28 0.74 -0.48 -5.58 0.75 -0.84 -3.37 0.73 -1.25 -4.28
Mean 0.67 -0.58 -2.85 0.70 -1.12 -4.20 0.80 -0.75 -6.84 0.74 -0.72 -7.51 0.72 -1.02 -3.49 0.79 -1.20 -4.02

175
a
b
c
Figure 4.6. Plots of log Kp (m3 ng-1, x axis) vs log PL
o (Pa, y axis) for PAHs (a), NPAHs (b) and
OPAHs (c) in Campaign 1 sample W2 (10/2/12).
y = ‐0.693x ‐ 3.6369R² = 0.7279
y = ‐0.9774x ‐ 4.0758R² = 0.724 ‐7
‐6
‐5
‐4
‐3
‐2
‐1
0
1
2
3
‐6 ‐5 ‐4 ‐3 ‐2 ‐1 0 1 2 3
log K
p
log PLo
BROS EROS
y = ‐1.0093x ‐ 9.8635R² = 0.7146
y = ‐1.1006x ‐ 10.334R² = 0.8029 ‐4
‐3
‐2
‐1
0
1
2
3
‐12 ‐11 ‐10 ‐9 ‐8 ‐7 ‐6
log K
p
log PLo
BROS EROS
y = ‐1.1114x ‐ 3.9454R² = 0.8206
y = ‐0.8291x ‐ 3.3663R² = 0.5609 ‐3.0
‐2.5
‐2.0
‐1.5
‐1.0
‐0.5
0.0
0.5
‐4.0 ‐3.5 ‐3.0 ‐2.5 ‐2.0 ‐1.5 ‐1.0
log K
p
log PLo
BROS EROS
176
For PAHs , strong correlations are noted for most samples. In all samples the slope of these plots
were steeper for EROS samples than the corresponding sample at BROS with m values
approaching or exceeding -1, despite the relatively minor overall partitioning pattern observed
between the two sites indicated in Figure 4.6.
This can be attributed to the closer proximity of BROS to freshly emitted PAHs from road traffic and
suggests the PAHs measured at this site have not reached partitioning equilibrium. Samples at
EROS are expected to have had a longer exposure time and display partitioning values that are
much closer to equilibrium due to a temperature-driven partitioning from the particle-phase to the
gas-phase.
The difference in gradient of these plots is notably higher for summer samples relative to winter
samples, which may be due to higher ambient temperature during summer leading to a relatively
larger degree of PAH phase partitioning occurring between sites.
A similar observation was made by Cotham and Bidleman (1995) where PAH concentrations were
measured at the urban location Chicago and rural location Green Bay, USA. The authors reported
relatively shallow log Kp vs log PLo slopes at the Chicago location with steep slopes, approaching -
1, at Green Bay. It was suggested this could be attributed to PAHs moving further towards
equilibrium with increasing distance (and hence increasing aerosol ageing) from source region to
remote region.
In contrast, Simick et al. (1998) did not observe notable changes in slope values for PAHs between
the urban Chicago area and the adjacent coastal area The authors therefore suggested the
necessity of the slope approaching a value of -1 to describe equilibrium conditions does not always
hold true in all environments.
As noted in Keyte et al., 2013 interpreting variation in m and b values from these plots is complex
and can be influenced by myriad factors such as :
Changes in temperature or compound concentrations during sampling

177
Differences and variation in sorption kinetics between gas and solid surfaces, mediated by
a number of factors e.g. adsorption to OM, enthalpy of desorption and volatilization
Kinetic constraints (e.g. introduction of fresh particles) or presence of non-exchangeable
compounds on or within the particle matrix.
The occurrence of sampling artefacts (see Section 4.4).
Therefore results need to be interpreted with caution as many of these factors are extremely
difficult to fully characterize or quantify. The concentration of PAH, OPAH and NPAH are shown to
vary during the 24hr sampling period due to the diurnal traffic pattern (see Section 4) and
temperatures during sampling typically changed by up to 10oC during summer with lower (~4oC)
changes observed in winter. However, it is unclear how these factors influence partitioning
behaviour.
Slope and intercept values for OPAH and NPAH are shown to be more variable between different
samples, with more modest differences observed between the two sampling sites. There are a
number of possible explanations for the similar slopes of NPAH and OPAH plots : i) the OPAH and
NPAH derivatives are approaching equilibrium relatively rapidly upon emission ; ii) the OPAH and
NPAH derivatives are approaching equilibrium relatively slowly upon emission; iii) OPAH and
NPAH equilibrium behaviour is not well defined by the slope of the log Kp vs log PLo plot and/or the
data is not complete enough to produce appropriate plots; iv) the partitioning of OPAHs and
NPAHs is governed by different mechanisms and/or influencing factors (see above) .
This approach has not been applied to OPAH or NPAH compounds previously. Albinet et al.
(2008a) measured OPAH and NPAH concentrations in the particulate- and gas-phases in
trafficked, suburban and rural locations. Using the data reported from this previous study, log Kp vs
log PLo plots for NPAH compounds were derived for the traffic, suburban and rural sites. The slopes
from all three location types were approximately -1. This suggests the equilibrium conditions for
NPAHs are not greatly influenced by proximity to local sources, in agreement with observations in
the present study.
178
However, the relatively small number of OPAH and NPAH compounds used to produce the plots in
Figure 4.6 compared with PAHs, as well as the lack of experimentally derived PLo values for these
compounds, mean the plots should be viewed with caution and it is not possible to gain definitive
insight into the main factors driving the partitioning behaviour of these compounds from this
investigation.
4.2. Assessing the importance of PAH reactivity in the urban atmosphere
4.2.1. PAH degradation rates
Atmospheric reactivity, predominantly due to daytime reaction with OH or O3 can results in
atmospheric lifetimes for LWM PAHs of the order of hours (Atkinson and Arey, 1994; 2007; Keyte
et al., 2013). Therefore, the effect of reactive losses on the relative PAH concentrations between
BROS and EROS may be observed during 24hr sampling. The ratio between observed BROS and
EROS concentrations can therefore be interpreted in terms of differences in the relative chemical
reactivity of individual PAHs.
Alam et al. (2013) previously noted the good agreement between observed BROS/EROS
concentration ratios of LWM PAHs and their respective reaction rate coefficient with respect to OH
in the gas phase. The relationship between annual mean BROS/EROS ratio (particle- + vapour-
phases) and experimentally derived reaction rate coefficient with respect to OH is shown in Figure
4.7. Ace was not included because, as discussed in Section 3.1, this compound did not appear to
display the same traffic-related profile at these sites in contrast to the other LWM PAH compounds.
The order or observed BROS/EROS ratios, Acy > Ant > Pyr > Flth > Phe > Flo is broadly
reflected in the gas-phase reactivity rates towards OH. This is in agreement with the observations
of Alam et al. (2013) where samples were only taken during winter months. It is notable that the
BROS/EROS ratio for Ant is lower than might be expected based on its relatively high OH
reactivity, possibly indicating the presence of an additional source of Ant at EROS.
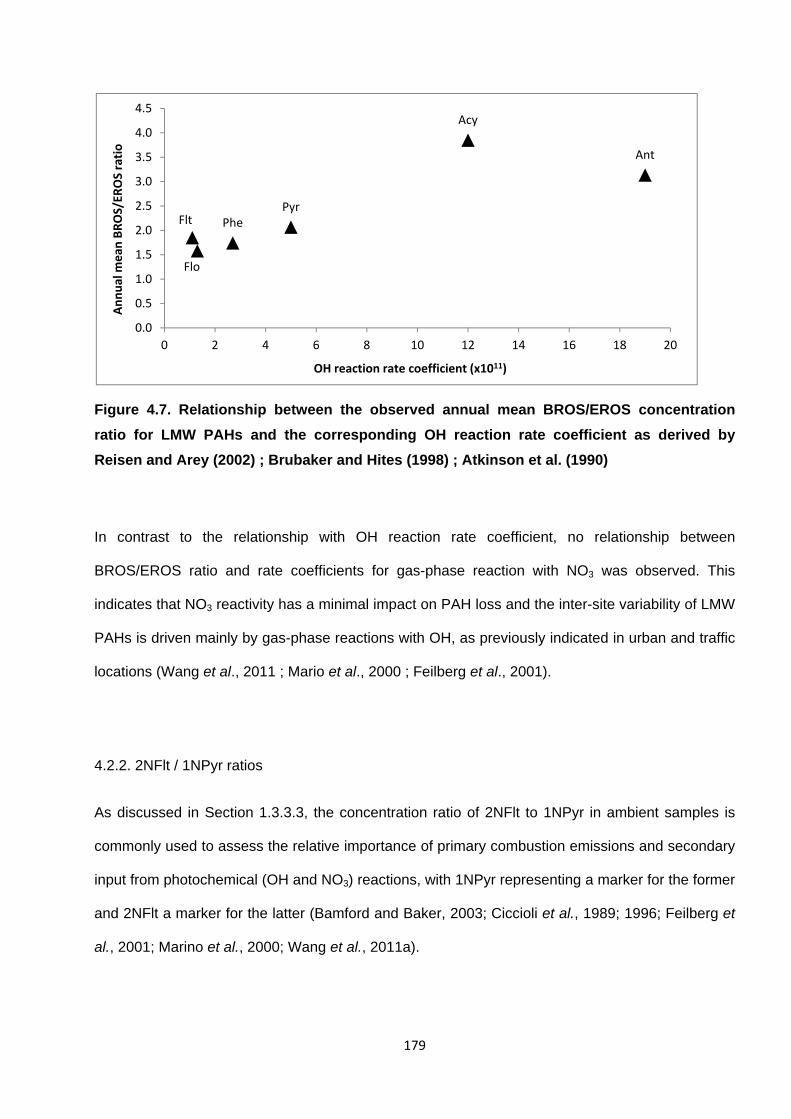
179
Figure 4.7. Relationship between the observed annual mean BROS/EROS concentration
ratio for LMW PAHs and the corresponding OH reaction rate coefficient as derived by
Reisen and Arey (2002) ; Brubaker and Hites (1998) ; Atkinson et al. (1990)
In contrast to the relationship with OH reaction rate coefficient, no relationship between
BROS/EROS ratio and rate coefficients for gas-phase reaction with NO3 was observed. This
indicates that NO3 reactivity has a minimal impact on PAH loss and the inter-site variability of LMW
PAHs is driven mainly by gas-phase reactions with OH, as previously indicated in urban and traffic
locations (Wang et al., 2011 ; Mario et al., 2000 ; Feilberg et al., 2001).
4.2.2. 2NFlt / 1NPyr ratios
As discussed in Section 1.3.3.3, the concentration ratio of 2NFlt to 1NPyr in ambient samples is
commonly used to assess the relative importance of primary combustion emissions and secondary
input from photochemical (OH and NO3) reactions, with 1NPyr representing a marker for the former
and 2NFlt a marker for the latter (Bamford and Baker, 2003; Ciccioli et al., 1989; 1996; Feilberg et
al., 2001; Marino et al., 2000; Wang et al., 2011a).
Acy
Flo
Phe
Ant
FltPyr
0.0
0.5
1.0
1.5
2.0
2.5
3.0
3.5
4.0
4.5
0 2 4 6 8 10 12 14 16 18 20
Annual m
ean
BROS/ER
OS ratio
OH reaction rate coefficient (x1011)

180
It is suggested that, assuming comparable emission rates and atmospheric concentrations of Flt
and Pyr and comparable dispersion and photolytic loss rates of 2NFlt and 1NPyr, a 2NFlt/1NPyr
ratio of >5 indicates the dominance of atmospheric reactions while a ratio of <5 indicates the
dominance of direct combustion emissions (Albinet et al., 2008a; Ciccioli et al., 1996).
These ratios were highly variable between sampling days at both the BROS and EROS locations,
ranging from 0.7 to ~13 over the full sampling period. The annual mean 2NF/1NP ratio at BROS
and EROS measured during Campaign 1 was 2.1 and 4.6 respectively. A comparison between
2NFlt/2NPyr ratios observed in this study and other sampling studies in different locations is
provided in Table 4.3.
2NFlt /1NPyr values of >5 is more commonly observed (Bamford and Baker, 2003; Ciccioli et al.,
1996; Reisen et al., 2003; Wang et al., 2011a), indicative of atmospheric formation dominating in
these environments. Lower (<5) ratios, are commonly observed in heavily trafficked areas
(Dimashki et al., 2000; Feilberg et al., 2001; Hien et al., 2007) and large urban centres (Bamford
and Baker, 2003; Murahashi and Hayakawa, 1997; Reisen and Arey, 2005).
Observations in the present study are therefore broadly consistent with previous observations in
trafficked and urban locations. The relatively low ratios, particularly at BROS are likely to have
resulted by virtue of the close proximity to a traffic source, which contributes a fresh source of
1NPyr throughout the year.
2NFlt /1NPyr ratios are generally higher at suburban sites relative to their proximate urban site
(Bamford and Baker, 2003; Feilberg et al., 2001; Marino et al., 2000). In this study, ratios are
consistently higher at EROS than at BROS. A paired t-test revealed the difference in ratios
between the two sites was statistically significant (p<0.01). This could be attributed to a longer
exposure time of the air mass to photochemical oxidants (OH and/or NO3) at EROS relative to
BROS (Ciccioli et al., 1996).
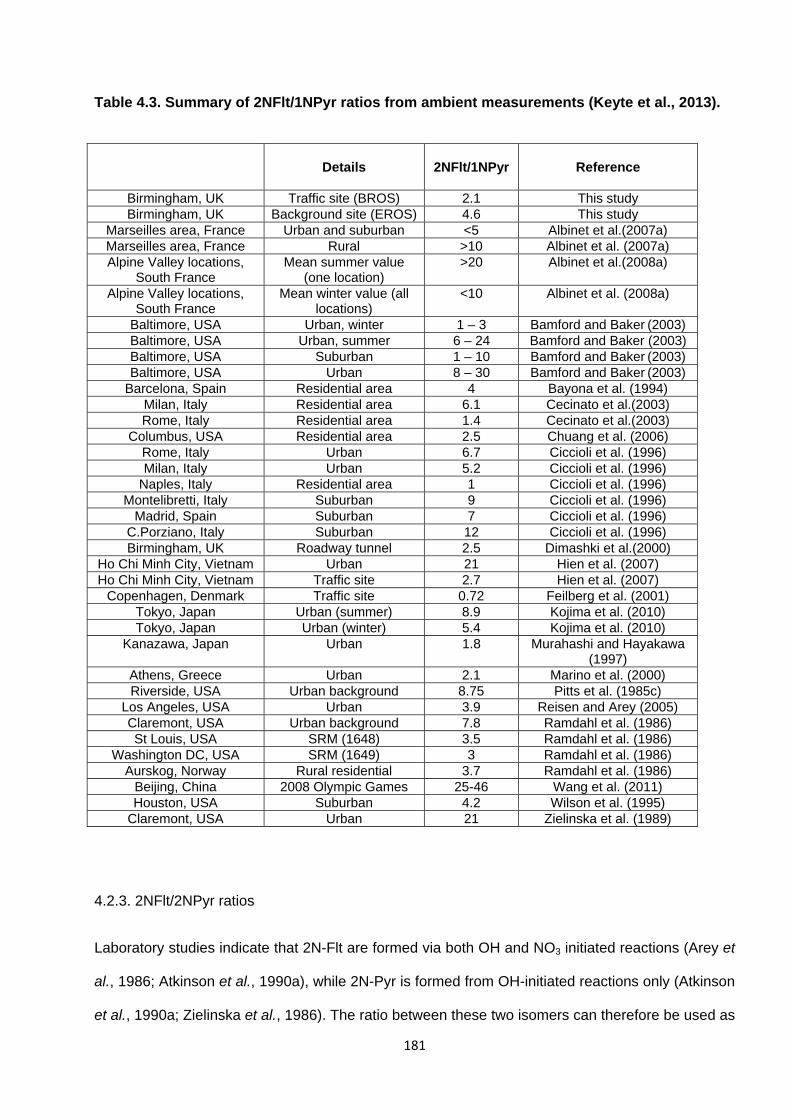
181
Table 4.3. Summary of 2NFlt/1NPyr ratios from ambient measurements (Keyte et al., 2013).
4.2.3. 2NFlt/2NPyr ratios
Laboratory studies indicate that 2N-Flt are formed via both OH and NO3 initiated reactions (Arey et
al., 1986; Atkinson et al., 1990a), while 2N-Pyr is formed from OH-initiated reactions only (Atkinson
et al., 1990a; Zielinska et al., 1986). The ratio between these two isomers can therefore be used as
Details 2NFlt/1NPyr
Reference
Birmingham, UK Traffic site (BROS) 2.1 This study Birmingham, UK Background site (EROS) 4.6 This study
Marseilles area, France Urban and suburban <5 Albinet et al.(2007a) Marseilles area, France Rural >10 Albinet et al. (2007a) Alpine Valley locations,
South France Mean summer value
(one location) >20 Albinet et al.(2008a)
Alpine Valley locations, South France
Mean winter value (all locations)
<10 Albinet et al. (2008a)
Baltimore, USA Urban, winter 1 – 3 Bamford and Baker (2003) Baltimore, USA Urban, summer 6 – 24 Bamford and Baker (2003) Baltimore, USA Suburban 1 – 10 Bamford and Baker (2003) Baltimore, USA Urban 8 – 30 Bamford and Baker (2003)
Barcelona, Spain Residential area 4 Bayona et al. (1994) Milan, Italy Residential area 6.1 Cecinato et al.(2003) Rome, Italy Residential area 1.4 Cecinato et al.(2003)
Columbus, USA Residential area 2.5 Chuang et al. (2006) Rome, Italy Urban 6.7 Ciccioli et al. (1996) Milan, Italy Urban 5.2 Ciccioli et al. (1996)
Naples, Italy Residential area 1 Ciccioli et al. (1996) Montelibretti, Italy Suburban 9 Ciccioli et al. (1996)
Madrid, Spain Suburban 7 Ciccioli et al. (1996) C.Porziano, Italy Suburban 12 Ciccioli et al. (1996) Birmingham, UK Roadway tunnel 2.5 Dimashki et al.(2000)
Ho Chi Minh City, Vietnam Urban 21 Hien et al. (2007) Ho Chi Minh City, Vietnam Traffic site 2.7 Hien et al. (2007)
Copenhagen, Denmark Traffic site 0.72 Feilberg et al. (2001) Tokyo, Japan Urban (summer) 8.9 Kojima et al. (2010) Tokyo, Japan Urban (winter) 5.4 Kojima et al. (2010)
Kanazawa, Japan Urban 1.8 Murahashi and Hayakawa (1997)
Athens, Greece Urban 2.1 Marino et al. (2000) Riverside, USA Urban background 8.75 Pitts et al. (1985c)
Los Angeles, USA Urban 3.9 Reisen and Arey (2005) Claremont, USA Urban background 7.8 Ramdahl et al. (1986) St Louis, USA SRM (1648) 3.5 Ramdahl et al. (1986)
Washington DC, USA SRM (1649) 3 Ramdahl et al. (1986) Aurskog, Norway Rural residential 3.7 Ramdahl et al. (1986)
Beijing, China 2008 Olympic Games 25-46 Wang et al. (2011) Houston, USA Suburban 4.2 Wilson et al. (1995)
Claremont, USA Urban 21 Zielinska et al. (1989)

182
an indicator for the relative importance of OH (daytime) and NO3 (night time) reaction pathways
(Bamford and Baker, 2003; Feilberg et al., 2001; Tsapakis and Stephanou, 2007). A ratio value of
between 5 and 10 indicates the dominance of OH reactions, while a value of above 100 suggests
the enhanced importance of NO3 reactions (Albinet et al., 2008a).
The mean 2NFlt/2NPyr ratio at BROS and EROS measured in samples during Campaign 1 was
2.1 and 3.3 respectively. These ratios were shown to be relatively low (<8) in all samples and
display low inter-site and inter-season variability. Higher mean ratio at EROS compared to BROS
may indicate the occurrence of NO3 reactivity between sites. However, a paired sample t-test
revealed no significant difference in ratios between sites.
A comparison between the 2NFlt/2NPyr ratios observed in this study and other sampling studies in
different locations is provided in Table 4.4. The relatively low (<10) 2NFlt /2NPyr ratios observed in
most urban and trafficked locations (Cecinato, 2003; Ciccioli et al., 1996; Marino et al., 2000; Wang
et al., 2011a), are in agreement with the ratios observed in the present study, and are indicative of
daytime OH-initiated reactions dominating over NO3-initiated reactions.
It is commonly considered that NO3 levels (and by extension PAH reactions with NO3) will be
minimal during the day due to the photolytic loss of NO3 in sunlight (Atkinson et al., 1990a; Graham
and Johnston, 1978; Magnotta and Johnston, 1980) :
NO3 + hv → NO + O2 (4.3a)
However, NO3 can also be removed from the atmosphere by reaction with nitrogen oxide (NO) :
NO3 + NO → 2 NO2 (4.3b)
NO is primarily associated with traffic emissions, therefore the close proxity of a traffic source to
the sampling locations in this study may lead to relatively low NO3 concentrations throuout the
year. Higher 2NFlt / 2NPyr ratios have been noted in rural areas compared to urban areas (Albinet
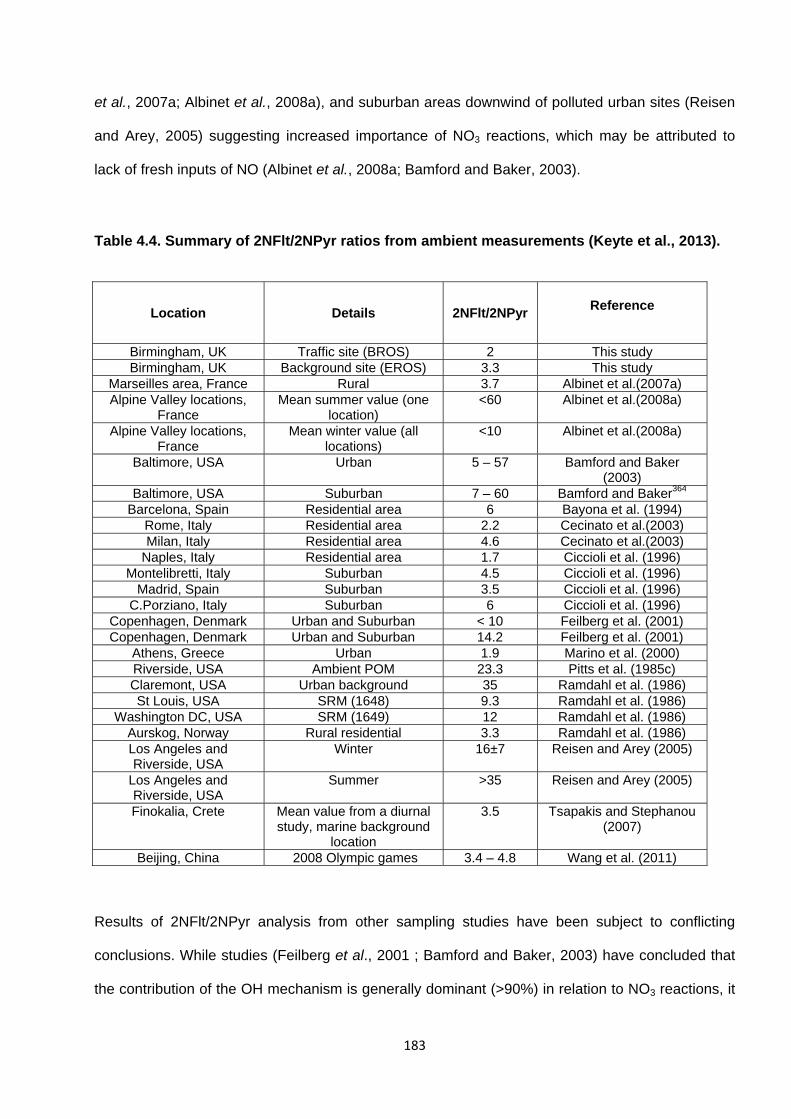
183
et al., 2007a; Albinet et al., 2008a), and suburban areas downwind of polluted urban sites (Reisen
and Arey, 2005) suggesting increased importance of NO3 reactions, which may be attributed to
lack of fresh inputs of NO (Albinet et al., 2008a; Bamford and Baker, 2003).
Table 4.4. Summary of 2NFlt/2NPyr ratios from ambient measurements (Keyte et al., 2013).
Location Details 2NFlt/2NPyr
Reference
Birmingham, UK Traffic site (BROS) 2 This study Birmingham, UK Background site (EROS) 3.3 This study
Marseilles area, France Rural 3.7 Albinet et al.(2007a) Alpine Valley locations,
France Mean summer value (one
location) <60 Albinet et al.(2008a)
Alpine Valley locations, France
Mean winter value (all locations)
<10 Albinet et al.(2008a)
Baltimore, USA Urban 5 – 57 Bamford and Baker (2003)
Baltimore, USA Suburban 7 – 60 Bamford and Baker364 Barcelona, Spain Residential area 6 Bayona et al. (1994)
Rome, Italy Residential area 2.2 Cecinato et al.(2003) Milan, Italy Residential area 4.6 Cecinato et al.(2003)
Naples, Italy Residential area 1.7 Ciccioli et al. (1996) Montelibretti, Italy Suburban 4.5 Ciccioli et al. (1996)
Madrid, Spain Suburban 3.5 Ciccioli et al. (1996) C.Porziano, Italy Suburban 6 Ciccioli et al. (1996)
Copenhagen, Denmark Urban and Suburban < 10 Feilberg et al. (2001) Copenhagen, Denmark Urban and Suburban 14.2 Feilberg et al. (2001)
Athens, Greece Urban 1.9 Marino et al. (2000) Riverside, USA Ambient POM 23.3 Pitts et al. (1985c) Claremont, USA Urban background 35 Ramdahl et al. (1986) St Louis, USA SRM (1648) 9.3 Ramdahl et al. (1986)
Washington DC, USA SRM (1649) 12 Ramdahl et al. (1986) Aurskog, Norway Rural residential 3.3 Ramdahl et al. (1986) Los Angeles and Riverside, USA
Winter 16±7 Reisen and Arey (2005)
Los Angeles and Riverside, USA
Summer >35 Reisen and Arey (2005)
Finokalia, Crete Mean value from a diurnal study, marine background
location
3.5 Tsapakis and Stephanou (2007)
Beijing, China 2008 Olympic games 3.4 – 4.8 Wang et al. (2011)
Results of 2NFlt/2NPyr analysis from other sampling studies have been subject to conflicting
conclusions. While studies (Feilberg et al., 2001 ; Bamford and Baker, 2003) have concluded that
the contribution of the OH mechanism is generally dominant (>90%) in relation to NO3 reactions, it

184
is suggested the NO3 mechanism may be important in some circumstances. However, while
Feilberg et al. (2001) indicate NO3 reactivity may be more important during wintertime when OH is
relatively low, Bamford and Baker (2003) and Reisen and Arey (2005) suggest the NO3
mechanism can become more significant in summer.
It should be noted that the 2NFlt /1NPyr and 2NFlt /2NPyr ratios reflect simply the relative levels of
these isomers in the atmosphere and while they can be used as a reasonable marker for OH
and/or NO3 initiated reactions in the atmosphere, these ratios can be influenced by other factors
such as the relative input and removal rates of particulate matter and meteorological factors such
as changes in mixing height or intensity of solar irradiation, which can influence the degree of their
dispersion and photolytic loss respectively (Keyte et al., 2013). The use of these ratios should
therefore be used with caution when assessing the relative importance of OH and/or NO3-induced
PAH reactivity.
4.2.4. Product to reactant ratios
The relative levels of ‘product’ compounds (i.e. OPAH and NPAH species) to ‘reactant’ compounds
(i.e. parent PAH compounds) observed in ambient samples can be used as an indicator for the
extent to which reactivity is influencing the OPAH or NPAH concentrations in ambient samples
(Alam et al., 2013; Nassar et al., 2011; Wei et al., 2012).
There are relatively few studies that have used this metric to assess the importance of PAH
reactivity on the observed concentrations of OPAH and NPAH. This method assumes that the rate
of primary input (i.e. from traffic or other combustion sources), atmospheric behaviour (i.e. phase
partitioning) and loss (i.e. reactive, photolytic or deposition) is similar for both parent and product,
with secondary input of OPAH or NPAH driving the variability in observed ratios. However, it
should be noted that results from the present investigation e.g. tunnel/ambient ratios (Section 6.3) ;
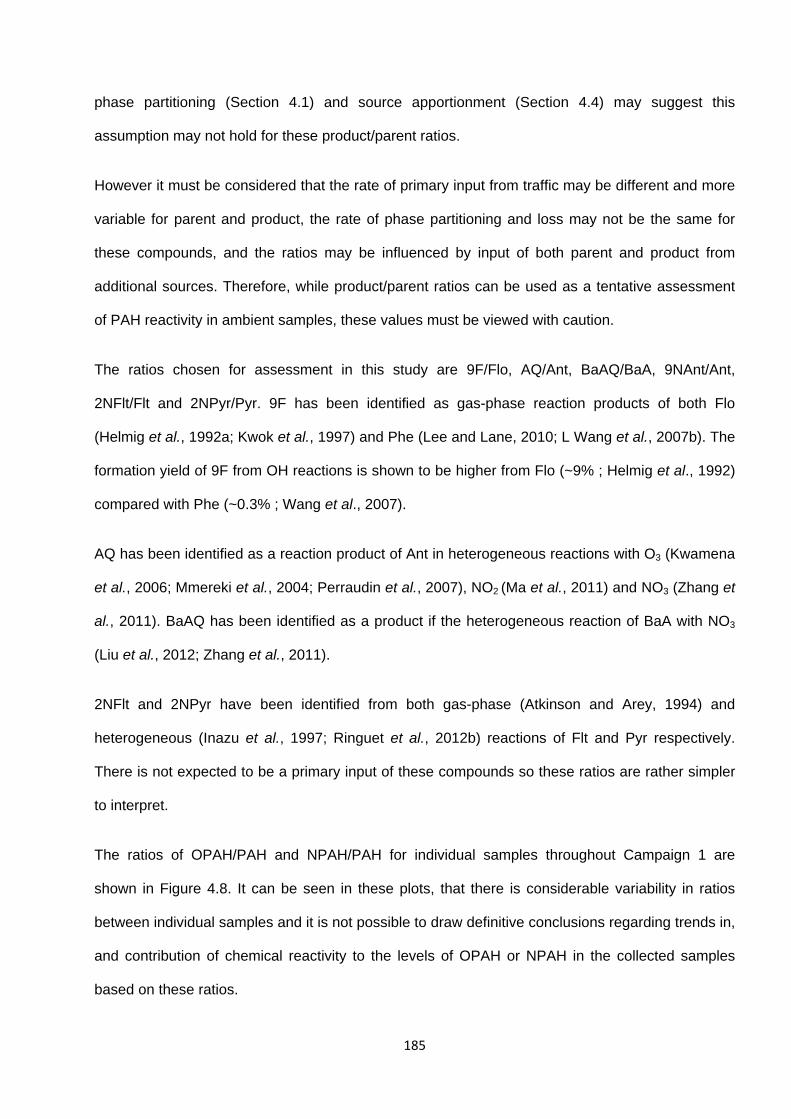
185
phase partitioning (Section 4.1) and source apportionment (Section 4.4) may suggest this
assumption may not hold for these product/parent ratios.
However it must be considered that the rate of primary input from traffic may be different and more
variable for parent and product, the rate of phase partitioning and loss may not be the same for
these compounds, and the ratios may be influenced by input of both parent and product from
additional sources. Therefore, while product/parent ratios can be used as a tentative assessment
of PAH reactivity in ambient samples, these values must be viewed with caution.
The ratios chosen for assessment in this study are 9F/Flo, AQ/Ant, BaAQ/BaA, 9NAnt/Ant,
2NFlt/Flt and 2NPyr/Pyr. 9F has been identified as gas-phase reaction products of both Flo
(Helmig et al., 1992a; Kwok et al., 1997) and Phe (Lee and Lane, 2010; L Wang et al., 2007b). The
formation yield of 9F from OH reactions is shown to be higher from Flo (~9% ; Helmig et al., 1992)
compared with Phe (~0.3% ; Wang et al., 2007).
AQ has been identified as a reaction product of Ant in heterogeneous reactions with O3 (Kwamena
et al., 2006; Mmereki et al., 2004; Perraudin et al., 2007), NO2 (Ma et al., 2011) and NO3 (Zhang et
al., 2011). BaAQ has been identified as a product if the heterogeneous reaction of BaA with NO3
(Liu et al., 2012; Zhang et al., 2011).
2NFlt and 2NPyr have been identified from both gas-phase (Atkinson and Arey, 1994) and
heterogeneous (Inazu et al., 1997; Ringuet et al., 2012b) reactions of Flt and Pyr respectively.
There is not expected to be a primary input of these compounds so these ratios are rather simpler
to interpret.
The ratios of OPAH/PAH and NPAH/PAH for individual samples throughout Campaign 1 are
shown in Figure 4.8. It can be seen in these plots, that there is considerable variability in ratios
between individual samples and it is not possible to draw definitive conclusions regarding trends in,
and contribution of chemical reactivity to the levels of OPAH or NPAH in the collected samples
based on these ratios.
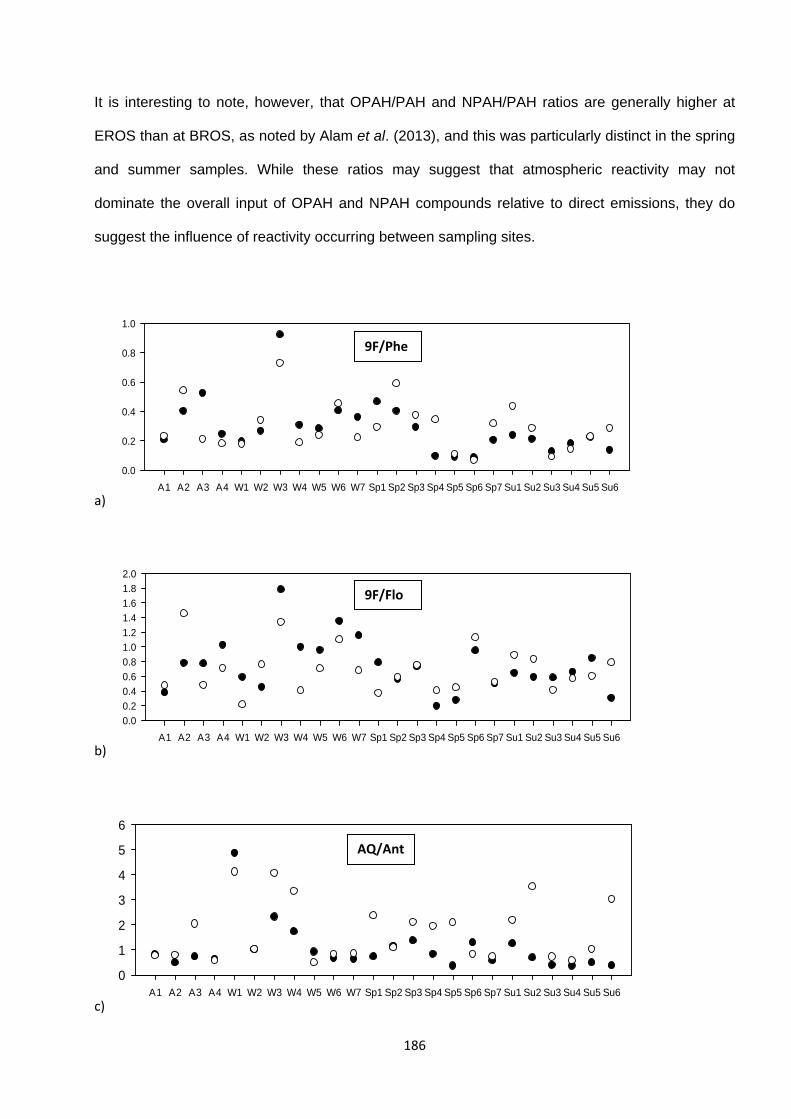
186
It is interesting to note, however, that OPAH/PAH and NPAH/PAH ratios are generally higher at
EROS than at BROS, as noted by Alam et al. (2013), and this was particularly distinct in the spring
and summer samples. While these ratios may suggest that atmospheric reactivity may not
dominate the overall input of OPAH and NPAH compounds relative to direct emissions, they do
suggest the influence of reactivity occurring between sampling sites.
a) A1 A2 A3 A4 W1 W2 W3 W4 W5 W6 W7 Sp1 Sp2 Sp3 Sp4 Sp5 Sp6 Sp7 Su1 Su2 Su3 Su4 Su5 Su6
0.0
0.2
0.4
0.6
0.8
1.0
b) A1 A2 A3 A4 W1 W2 W3 W4 W5 W6 W7 Sp1 Sp2 Sp3 Sp4 Sp5 Sp6 Sp7 Su1 Su2 Su3 Su4 Su5 Su6
0.0
0.2
0.4
0.6
0.8
1.0
1.2
1.4
1.6
1.8
2.0
c)A1 A2 A3 A4 W1 W2 W3 W4 W5 W6 W7 Sp1 Sp2 Sp3 Sp4 Sp5 Sp6 Sp7 Su1 Su2 Su3 Su4 Su5 Su6
0
1
2
3
4
5
6
9F/Phe
9F/Flo
AQ/Ant
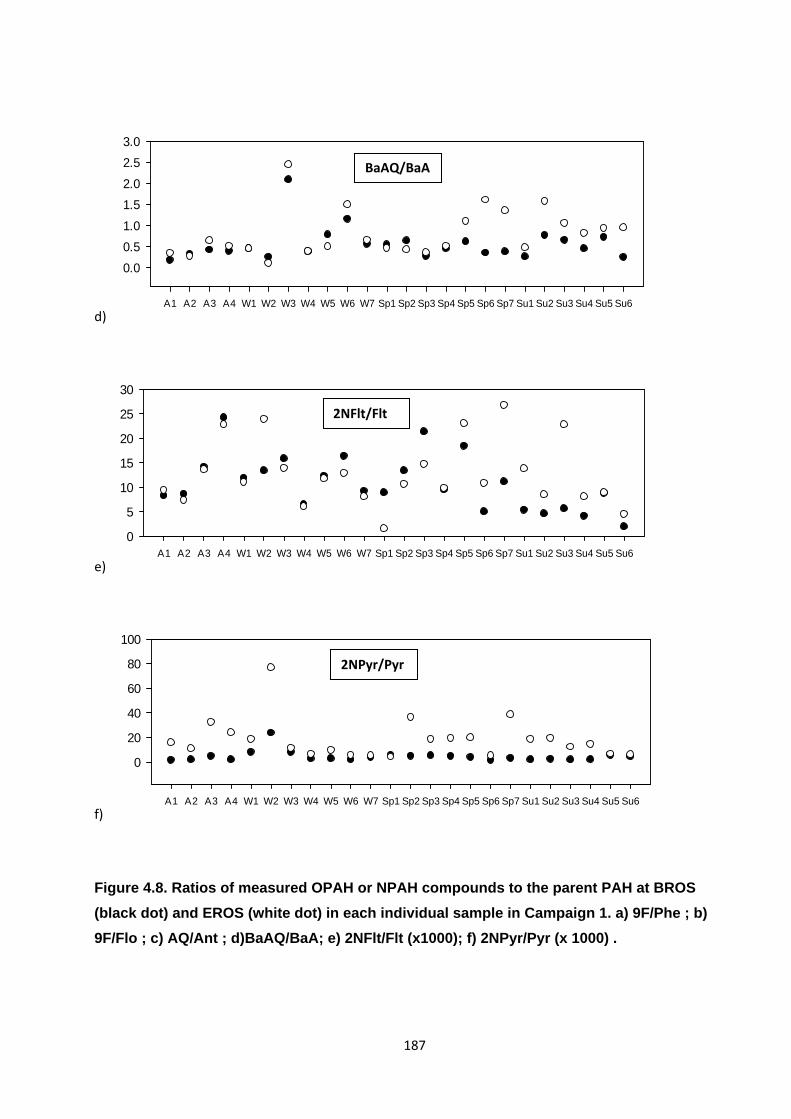
187
d) A1 A2 A3 A4 W1 W2 W3 W4 W5 W6 W7 Sp1 Sp2 Sp3 Sp4 Sp5 Sp6 Sp7 Su1 Su2 Su3 Su4 Su5 Su6
0.0
0.5
1.0
1.5
2.0
2.5
3.0
e)A1 A2 A3 A4 W1 W2 W3 W4 W5 W6 W7 Sp1 Sp2 Sp3 Sp4 Sp5 Sp6 Sp7 Su1 Su2 Su3 Su4 Su5 Su6
0
5
10
15
20
25
30
f) A1 A2 A3 A4 W1 W2 W3 W4 W5 W6 W7 Sp1 Sp2 Sp3 Sp4 Sp5 Sp6 Sp7 Su1 Su2 Su3 Su4 Su5 Su6
0
20
40
60
80
100
Figure 4.8. Ratios of measured OPAH or NPAH compounds to the parent PAH at BROS
(black dot) and EROS (white dot) in each individual sample in Campaign 1. a) 9F/Phe ; b)
9F/Flo ; c) AQ/Ant ; d)BaAQ/BaA; e) 2NFlt/Flt (x1000); f) 2NPyr/Pyr (x 1000) .
BaAQ/BaA
2NFlt/Flt
2NPyr/Pyr

188
Ratios of OPAH/PAH compounds have been measured by Alam et al. (2013) at the BROS and
EROS samples during the winter months. The authors noted higher ratios at EROS compared to
BROS. The results of this study are broadly in agreement with this observation, with a more
pronounced difference in ratios noted for spring and summer samples. This may indicate the
possible influence of inter-site chemical reactivity influencing the concentrations of OPAH and
NPAH, particularly during the warmer summer months
Alam et al. (2013) reported BaAQ/BaA ratios ranging from <0.05 to ~0.5 in a winter sampling
campaign. Most of the winter samples in the present study displayed similar ratios to the previous
study, with higher values (up to a factor 3) observed in spring and summer, particularly at EROS.
AQ/Ant ratio values are shown to be much higher (up to >10 times) and more variable in this study
than previously measured by Alam et al. (2013). This could indicate a greater role of reactive input
is influencing the samples in the present study, However, it should also be noted that the fraction of
AQ in the particulate phase in the previous study was ~50%, which is lower than the fraction notes
in the present study during autumn (65%), winter (82%) and spring (67%). This could indicate that
AQ in the present study was more protected towards reactive and/or photolytic losses than in the
previous study, which could also contribute towards higher observed ratios.
4.3. Source apportionment of PAH, OPAH, NPAH compounds using Positive Matrix
Factorization (PMF)
4.3.1 Introduction
Positive Matrix Factorization (PMF) is a multivariate factor analysis tool that can resolve the
identities and contributions of the components in a mixture of unknown composition (Reff et al.,
2007). The model assumes p source types (factors) contribute linearly to the observed
concentrations of defined species at a specific receptor site.

189
This method treats factor analysis as a true least squares problem i.e. a data set denoted by a
matrix, X where:
X = G F + E (4.4)
Where : G = factor contribution matrix
F = factor profile matrix
E = residual matrix
This equation can be written in an index notation (Reff et al., 2007) :
(4.5)
Where = concentration of species j in sample i
p = number of factors contributing to the samples
= concentration of species j in factor profile k
= relative contribution of source k to sample i
= the error of the model for species j measured in sample i
The objective of the PMF model is to derive suitable values for , and p that can best
reproduce . To do this the model produces a value of Q, an object function of the residual
matrix :

190
Q /
(4.6)
= error of the PMF model (residuals) for species j measured in sample i
= uncertainty of the jth species concentration in sample i
n = number of samples
m = number of species
The Q value must be minimised to derive the most appropriate factor contributions and profiles.
The values of and are adjusted until a minimum Q value for a defined p value is obtained.
PMF is considered to be a suitable method for modelling environmental data because it : a)
incorporates variable uncertainties commonly found in environmental samples; and b) constrains
the solution profiles (F) and concentrations (G) to be non-negative (Reff et al., 2007). This method
has been applied previously to source apportionment of atmospheric PAHs (Hanedar et al., 2014;
Jang et al., 2013; Okuda et al., 2010; Prevedouros et al., 2004a; Sofowote et al., 2011).
Previously, principal component analysis (PCA) has been a popular technique for carrying out
source apportionment for PAH (Harrison et al., 1996; Harrison et al., 2003; Mari et al., 2010;
Ravindra et al., 2008) and NPAH (Bamford and Baker, 2003).
However, PMF is preferable over PCA because it allows each sample and variable to be weighted
individually, unlike PCA where all are equally weighted (Park et al., 2012). Furthermore, PMF can
identify factor contributions directly without requiring further multiple regression analysis (Jang et
al., 2013). While PMF has been applied to PAHs, it has yet to be used for NPAH and OPAHs for
atmospheric source apportionment.
The initial data analysis of samples collected from the Queensway Road Tunnel and ambient sites
BROS and EROS suggest traffic is the dominant source to the Birmingham University sites but
191
other potential sources may also influence the observed concentrations (e.g. non-traffic
combustion sources, volatilisation or chemical reactivity). In the present study, PMF was applied
for source apportionment of selected PAH, OPAH and NPAH compounds to assess potential
source profiles.
4.3.2. Method
The model was run using EPA PMF 5.0. Model input data files were produced using ‘receptor’
concentration (C) and uncertainty (U) matrices, as previously described by Jang et al. (2013).
For measured concentration above the MDL, the input values c and u were calculated as follows :
Ci = Cm (4.7a)
Ui = 0.1Cm + MDL/3 (4.7b)
For measured concentrations below the MDL, the input values C and U were calculated :
Ci = MDL/2 (4.8a)
Ui = 0.2 Ci + MDL/3 (4.8b)
where :
Ci = input concentration
Cm = measured concentration
Ui = input uncertainty
MDL = method detection limit (calculated separately for filter and PUF components)
192
Total concentration (particulate + vapour) values from BROS, EROS and the Queensway Road
Tunnel samples obtained in campaigns 1, 2 and 3 were combined in the model input to ensure
there was sufficient number of samples to obtain adequate model performance. The total number
of 60 samples was included.
Due to the relatively low number of samples collected in this study, not all target compounds
measured in this investigation could be considered in the model. Base model data was assessed
prior to running the model to select the most appropriate compounds to include. Significant
correlations between compounds at each sampling site (see Section 3.2) allowed certain
compounds to be excluded from the model and assumed to display similar prevailing sources and
atmospheric behaviour patterns.
For example species IPy, BPy and Cor were shown to correlate strongly at both sites and are all
assumed to result predominantly from gasoline fuel combustion (Marr et al., 1999; Ravindra et al.,
2008; Staehelin et al., 1998). Similarly, 1NNap and 2NNap are assumed to display similar sources
and atmospheric behaviour.
Since both BROS and EROS samples were used in this analysis, both Acy and Ace were not
included as these have been shown to be the most reactive PAHs (Atkinson and Arey, 1994;
Brubaker and Hites, 1998; Reisen and Arey, 2002). Similarly, 2NFlt and 2NPyr were not included
in the analysis as the presence of these compounds is known to result entirely from atmospheric
reactions.
Some compounds and a small number of individual samples, where modelled data points were
shown to deviate significantly from observed data, were excluded from the analysis in order to
achieve optimal model performance. All included species displayed a correlation coefficient of >0.7
for the plot of observed vs. modelled concentrations. The final model runs included 9 PAHs, 1
OPAH and 3 NPAHs : Ace, Phe, Flt, Pyr, Ret, Chy, BbF, BaP, IPy, AQ, 1NNap, 9NAnt and 1NPyr.
The PMF model was run in ‘robust mode’, where model outliers are not allowed to overly influence
the fitting of the contributions and profiles. To achieve this, uncertainties for species or samples
193
with uncertainty-scaled residual values greater than an outlier distance of four, (eij / uij)2 >4, are
increased to downweight their influence on the PMF solution.
The distribution of intra-run residuals was analysed for each species, with all included species
displaying normally distributed residuals between values of -3 and +3, considered to be an
adequate range to provide reliable model results. The optimal number of factors required to obtain
an adequate model fit was investigated with a 4 factor found to be the best fit for modelled data.
The model also allows an additional percentage of uncertainty to be added. A varying degree of
additional uncertainty was tested, with a value of 3% found to result in optimal model performance.
4.3.3. Results
4.3.3.1. Overview
The distribution of species concentration between the 4 model factors and the percentage
contribution of each factor to the modelled PAH, OPAH and NPAH concentrations is shown in
Figure 4.9. This section discusses the model performance/uncertainty and the possible sources
attributed to each factor.
4.3.3.2. Model uncertainty and rotational freedom
Uncertainty in the PMF model was estimated using a bootstrap technique. This involved
performing 250 bootstrap model runs with a correlation set at 0.75. The estimated uncertainty, in
terms of the percentage contribution of each factor for the modelled species’, derived in this study
is shown in Figure 4.10. The bootstrapping output estimated the percentage of ‘factor swaps’ in
this study was <20% for all factors. The results of the PMF model can therefore be considered
sufficiently robust for source interpretation.
PMF analysis is complicated by the fact that there can theoretically exist multiple F and G values
that can produce the same minimum Q value (Reff et al., 2007). This is known as rotational
freedom. This phenomenon can be assessed and reduced by the parameter Fpeak, where new
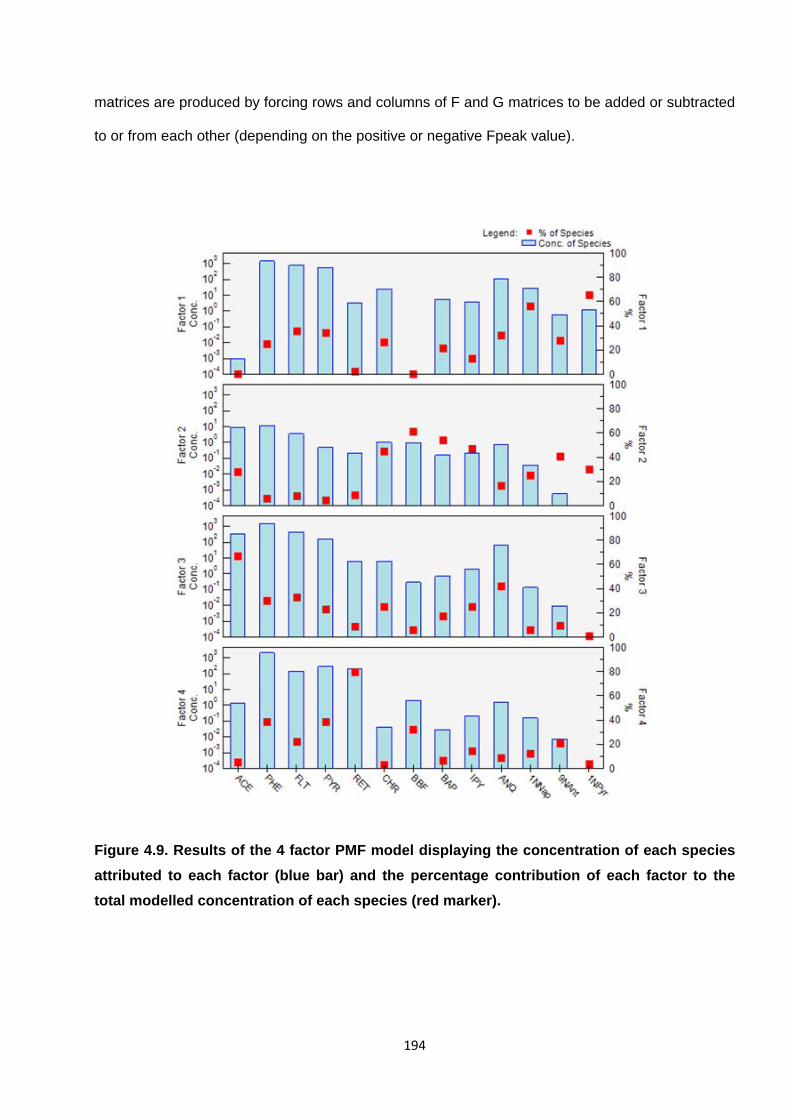
194
matrices are produced by forcing rows and columns of F and G matrices to be added or subtracted
to or from each other (depending on the positive or negative Fpeak value).
Figure 4.9. Results of the 4 factor PMF model displaying the concentration of each species
attributed to each factor (blue bar) and the percentage contribution of each factor to the
total modelled concentration of each species (red marker).

195
Figure 4.10. Results of the PMF bootstrapping analysis for each factor. Box plots display
the median percentage contribution (green line) and the upper and lower edges of the box
denote the 75th and 25th percentile values respectively. The percentage contribution
predicted in the original base run is denoted by a blue square.
Factor 1
Factor 2
Factor 3
Factor 4
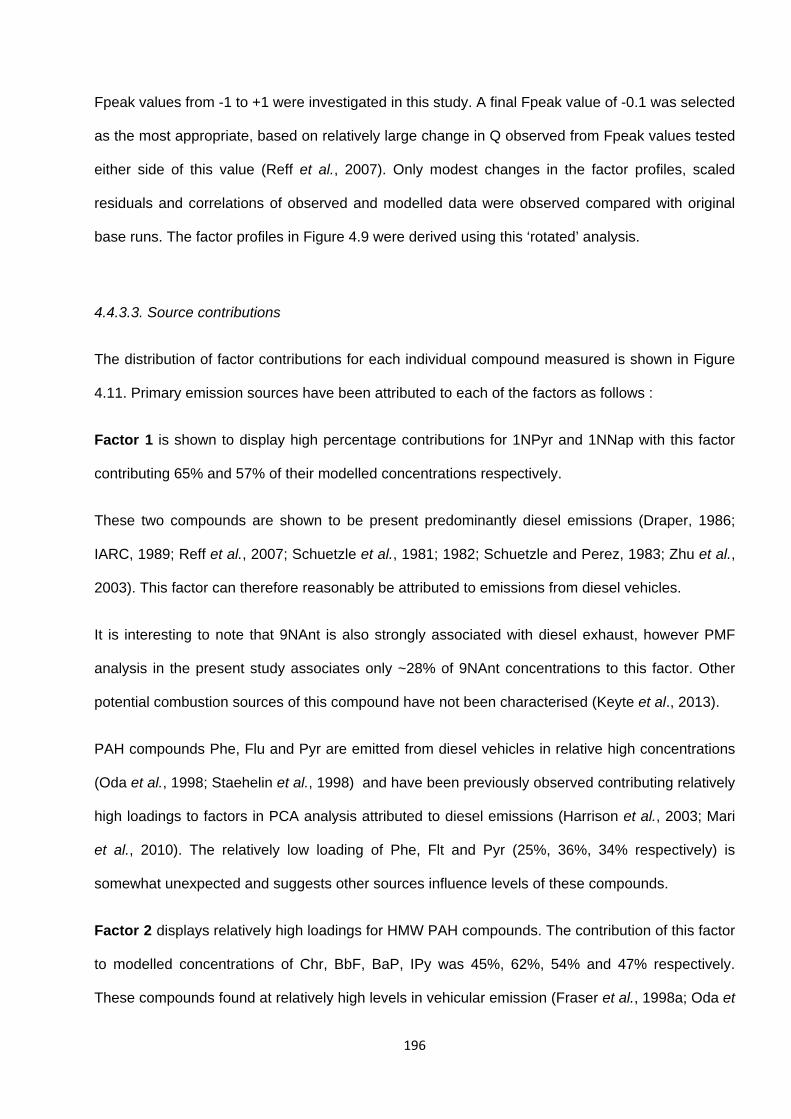
196
Fpeak values from -1 to +1 were investigated in this study. A final Fpeak value of -0.1 was selected
as the most appropriate, based on relatively large change in Q observed from Fpeak values tested
either side of this value (Reff et al., 2007). Only modest changes in the factor profiles, scaled
residuals and correlations of observed and modelled data were observed compared with original
base runs. The factor profiles in Figure 4.9 were derived using this ‘rotated’ analysis.
4.4.3.3. Source contributions
The distribution of factor contributions for each individual compound measured is shown in Figure
4.11. Primary emission sources have been attributed to each of the factors as follows :
Factor 1 is shown to display high percentage contributions for 1NPyr and 1NNap with this factor
contributing 65% and 57% of their modelled concentrations respectively.
These two compounds are shown to be present predominantly diesel emissions (Draper, 1986;
IARC, 1989; Reff et al., 2007; Schuetzle et al., 1981; 1982; Schuetzle and Perez, 1983; Zhu et al.,
2003). This factor can therefore reasonably be attributed to emissions from diesel vehicles.
It is interesting to note that 9NAnt is also strongly associated with diesel exhaust, however PMF
analysis in the present study associates only ~28% of 9NAnt concentrations to this factor. Other
potential combustion sources of this compound have not been characterised (Keyte et al., 2013).
PAH compounds Phe, Flu and Pyr are emitted from diesel vehicles in relative high concentrations
(Oda et al., 1998; Staehelin et al., 1998) and have been previously observed contributing relatively
high loadings to factors in PCA analysis attributed to diesel emissions (Harrison et al., 2003; Mari
et al., 2010). The relatively low loading of Phe, Flt and Pyr (25%, 36%, 34% respectively) is
somewhat unexpected and suggests other sources influence levels of these compounds.
Factor 2 displays relatively high loadings for HMW PAH compounds. The contribution of this factor
to modelled concentrations of Chr, BbF, BaP, IPy was 45%, 62%, 54% and 47% respectively.
These compounds found at relatively high levels in vehicular emission (Fraser et al., 1998a; Oda et
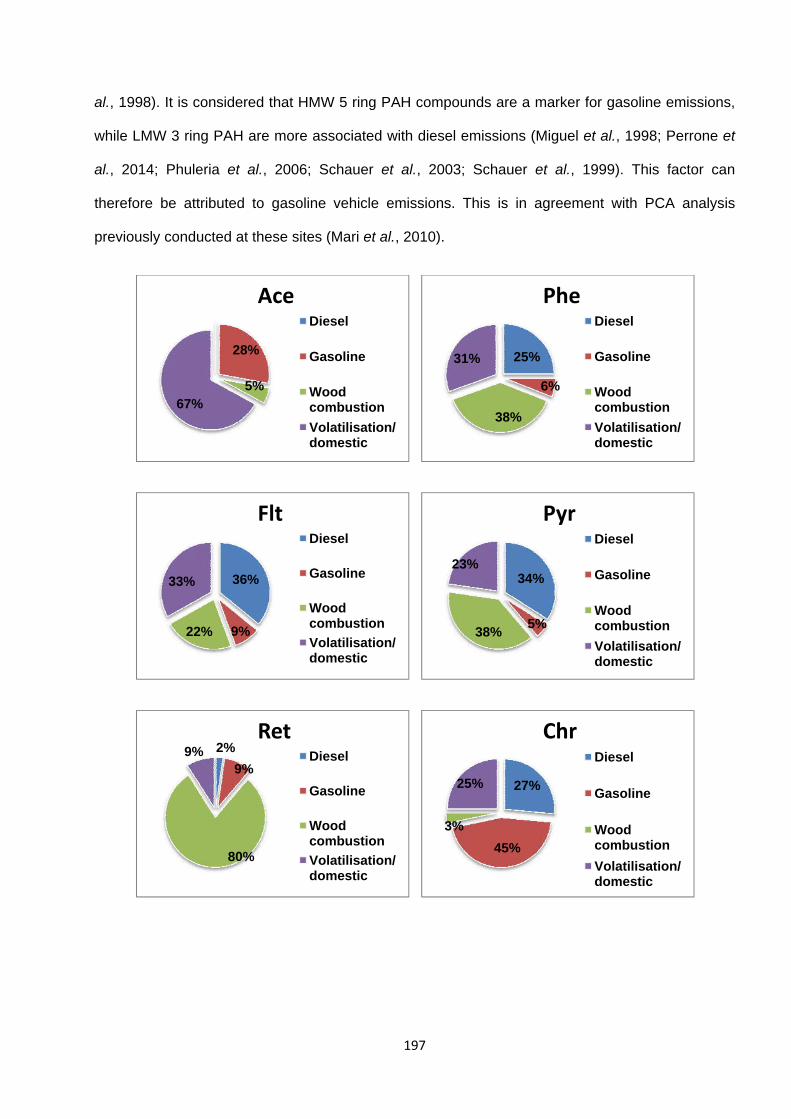
197
al., 1998). It is considered that HMW 5 ring PAH compounds are a marker for gasoline emissions,
while LMW 3 ring PAH are more associated with diesel emissions (Miguel et al., 1998; Perrone et
al., 2014; Phuleria et al., 2006; Schauer et al., 2003; Schauer et al., 1999). This factor can
therefore be attributed to gasoline vehicle emissions. This is in agreement with PCA analysis
previously conducted at these sites (Mari et al., 2010).
28%
5%67%
AceDiesel
Gasoline
Wood combustion
Volatilisation/domestic
25%
6%
38%
31%
PheDiesel
Gasoline
Wood combustion
Volatilisation/domestic
36%
9%22%
33%
FltDiesel
Gasoline
Wood combustion
Volatilisation/domestic
34%
5%38%
23%
PyrDiesel
Gasoline
Wood combustion
Volatilisation/domestic
2%
9%
80%
9%Ret
Diesel
Gasoline
Wood combustion
Volatilisation/domestic
27%
45%
3%
25%
ChrDiesel
Gasoline
Wood combustion
Volatilisation/domestic
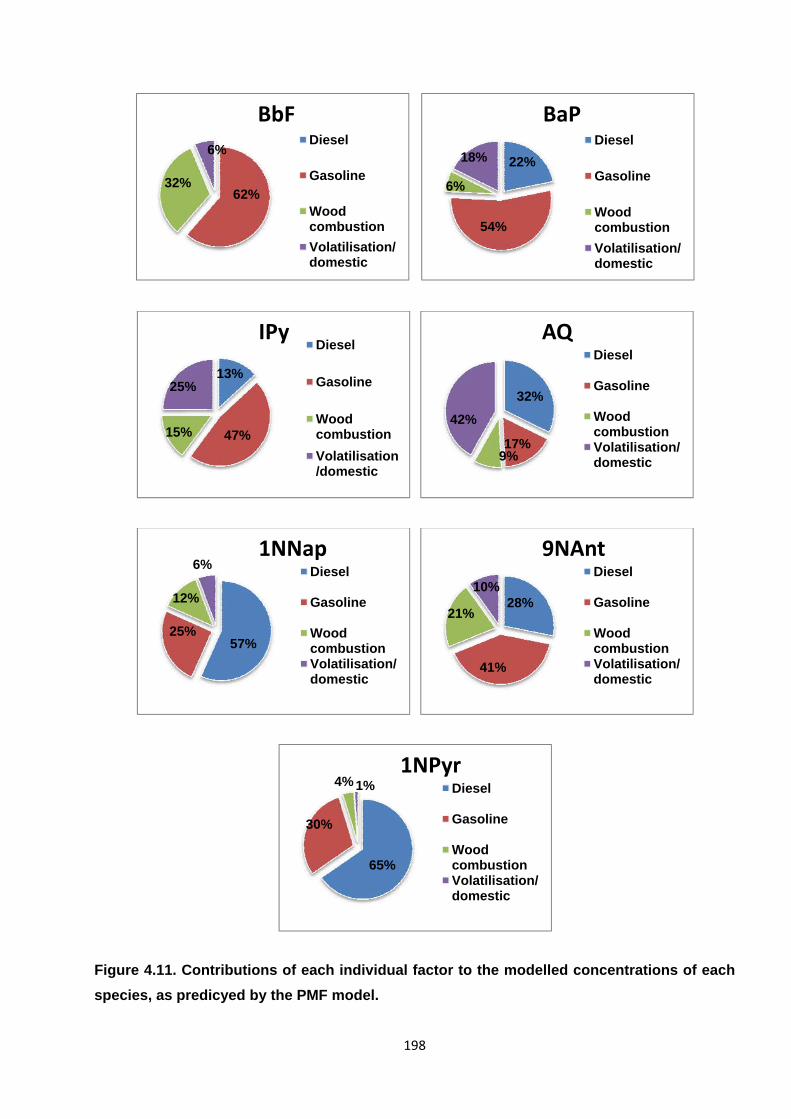
198
Figure 4.11. Contributions of each individual factor to the modelled concentrations of each
species, as predicyed by the PMF model.
62%32%
6%
BbFDiesel
Gasoline
Wood combustion
Volatilisation/domestic
22%
54%
6%
18%
BaPDiesel
Gasoline
Wood combustion
Volatilisation/domestic
13%
47%15%
25%
IPyDiesel
Gasoline
Wood combustion
Volatilisation/domestic
32%
17%9%
42%
AQDiesel
Gasoline
Wood combustionVolatilisation/domestic
57%25%
12%
6%1NNap
Diesel
Gasoline
Wood combustionVolatilisation/domestic
28%
41%
21%
10%
9NAntDiesel
Gasoline
Wood combustionVolatilisation/domestic
65%
30%
4% 1%1NPyr
Diesel
Gasoline
Wood combustionVolatilisation/domestic

199
AQ is emitted from both gasoline and diesel vehicles (Jakober et al., 2007; Oda et al., 2001; Rogge
et al., 1993a; Sidhu et al., 2005; Strandell et al., 1994; Zielinska et al., 2004b) . PMF results in the
present study indicate an equal contribution of gasoline and diesel emissions, with a total traffic
input contributing ~50% of AQ concentrations to the Birmingham University sites.
Factor 3 is characterised by a high loading of Ace (67%) with relatively smaller contributions for
other PAHs.
It has been suggested in previous sections and by Dimashki et al. (2001), that concentrations of
PAHs at these sites may be influenced by localised resuspension or volatilisation of components
from the ground surface. This may result from unburned components in vehicle exhausts being
deposited on the road surface (Rogge et al., 1993b), then undergoing temperature-driven
volatilisation to the atmosphere. PAHs can also be volatilised from soil or vegetation surfaces
(Diamond et al., 2001; Lee and Jones, 1999).
However, this does account for the relatively high loading of Ace in this factor. As discussed in
Section 3.4, a relatively large increase in Ace concentration has been indicated at these sites since
1999-2001. Furthermore, the seasonal profile (Section 3.3) suggests levels of Ace at the University
sites are much higher during the winter, suggesting the influence of a seasonally-mediated source.
Previously, a PCA factor containing high loading of Ace was attributed to “a specific fuel
combustion source” (Mari et al., 2010). This factor is therefore attributed to domestic wood
combustion.
This would seem consistent with the increase in NAIE estimated emissions of PAH from domestic
wood in the last 10 years, however it is unclear why this source produces elevated Ace
concentrations but this is not observed for other LMW PAHs that are also associated with domestic
wood combustion.
Factor 4 is characterised by a very high (80%) contribution to Ret concentration. Ret is typically
associated with wood combustion (Bari et al., 2010; Fine et al., 2002; McDonald et al., 2000;

200
Ramdahl, 1983). Mari et al. (2010) previously conducted PCA source apportionment to BROS and
EROS sampling data. The authors reported a PCA factor with a very high loading of Ret, which
displayed high contribution around November 5th ‘bonfire night’ celebrations.
Phe, Flt, Pyr also have relatively high (38%, 22%, 38% respectively) contribution from this factor.
While these compounds have been observed in traffic emissions (see Section 5.1), particularly
diesel (Zhu et al., 2003), these results suggest non-traffic sources such as wood combustion
significantly influence the levels of these compounds at BROS and EROS. This could provide an
explanation for the lack of substantial temporal decrease in Flt and Pyr concentrations observed at
these sites (Section 3.4).
The seasonal profile (Section 3.3) of Ret, Phe, Flt and Pyr, with relatively small differences
observed between summer and winter concentrations may suggest the dominant source of these
compounds is not seasonally mediated. These compounds have been shown to exhibit high levels
in emissions from incineration (Harrison et al., 1996; Ravindra et al., 2008). This factor may
therefore be associated with localised emissions from burning garden waste, which may be more
prominent in summer. Indeed Ret displays higher concentrations in summer relative to winter at
BROS, which may be explained by the close proximity of this site to local houses.
Jang et al. (2013) previously applied PMF source apportionment to airborne PAH concentration
data from various U.K. urban monitoring sites. The authors identified four source factors for these
data assigning the source contribution for urban sites ; unburned gasoline fuel (50.5%), diesel fuel
(21.4%,) coal combustion (15.0%) and wood combustion (13.1%).
Coal combustion was more strongly associated with locations of known industrial activity, with
48.5% of total PAH associated with this factor compared with 34.1% and 17.5% for unburned
petroleum and diesel respectively at industrial locations (Jang et al., 2013).
Clearly, different urban locations will exhibit different source profiles so comparison between the
analysis of these combined 14 urban sites and the present study are not directly applicable. It is
not expected that coal combustion has influenced the Birmingham University site to a significant

201
degree. Indeed PCA analysis of measured PAH concentrations by Mari et al. (2010) did not
attribute any of the identified source factors to an industrial emission source.
It has previously been estimated that traffic is the main contributor of PAHs to the urban
atmosphere in Birmingham (Harrison et al., 1996; Lim et al., 1999). However, the results of the
present study indicate PAH concentrations at these sites are also influenced by other sources.
This work has demonstrates that PMF source apportionment analysis can be applied to OPAHs
and NPAHs in air samples, suggesting the possible application of this tool for more extensive
studies with greater numbers of samples and species.
4.4. Sampling artefact study
As discussed in Section 2.1 atmospheric sampling of PAHs can be influenced by the occurrence of
sampling artefacts, which can alter both the measured concentrations of collected PAHs, OPAHs
and NPAHs and the observed gas-particle partitioning behaviour of these compounds. In order to
examine the potential influence of sampling artefacts under the sampling conditions and methods
used in the present study, and determine if the results obtained in the present investigation are
sufficiently robust, a quality control sampling experiment was conducted.
4.4.1. Methodology
4.4.1.1 Sampling
A sampling study was conducted for three sampling days in October 2013 at EROS. Two high
volume samplers were operated at the site simultaneously, one acting as a ‘sample test’ sampler
the other as a ‘sample blank’ sampler. The sampling materials were prepared, and the samplers
calibrated and operated as described in Section 2.1.
Briefly, both ‘sample test’ and ‘sample blank’ samplers used quartz fibre filters to collect particulate
matter (PM10) with two PUF plugs downstream to collect the gas-phase component. Both samplers
202
were run for ~12-24 hours prior to the artefact experiment to pre-load the filters with ambient
particulate matter.
Prior to the start of the experiment the ‘sample test’ filter was spiked with 250uL of PAH internal
standard, a solution of deuterated PAH mixture made up with hexane (1000 pg/uL). The
deuterated PAH compounds that were present in this mixture are shown in Table 4.5. These
compounds are synthetic and are not found naturally in the environment. However, they display
identical physiochemical properties as ‘natural’ PAH in collected samples.
There is assumed to be no natural addition of these deuterated compounds during sampling so
their presence can be used to monitor possible PAH losses, due to volatilisation, breakthrough
from the filter and/or chemical reactions. Monitoring the levels of the equivalent OPAH and NPAH
deuterated internal standards (which are also not naturally present in the atmosphere) will also
help to assess to what extent reactions of filter-bound PAH may have occurred during sampling
and hence influenced the measured levels of PAH, OPAH and NPAH compounds. The ‘sample
blank’ filter was not spiked and acted as a control sample. Both samplers were then run for a ~24
hours sampling period.
4.4.1.2. Analysis
Collected filter and PUF samples were prepared, extracted and analysed as described in Section
2.3. Briefly, samples were extracted in DCM using ultrasonication, blown to almost dryness by a
gentle stream of nitrogen gas and made up to ~1mL volume in hexane. Sample extracts were
cleaned up using an aminopropyl solid phase extraction column and finally made up to a final
volume of 250uL in nonane for GC-MS analysis. In addition to ‘sample test’ and ‘sample blank’
samples, ‘lab blank’ filters was analysed for comparison with collected samples. These were filters
spiked with the PAH IS mix but these were not exposed to sampling conditions, but immediately
extracted and analysed.
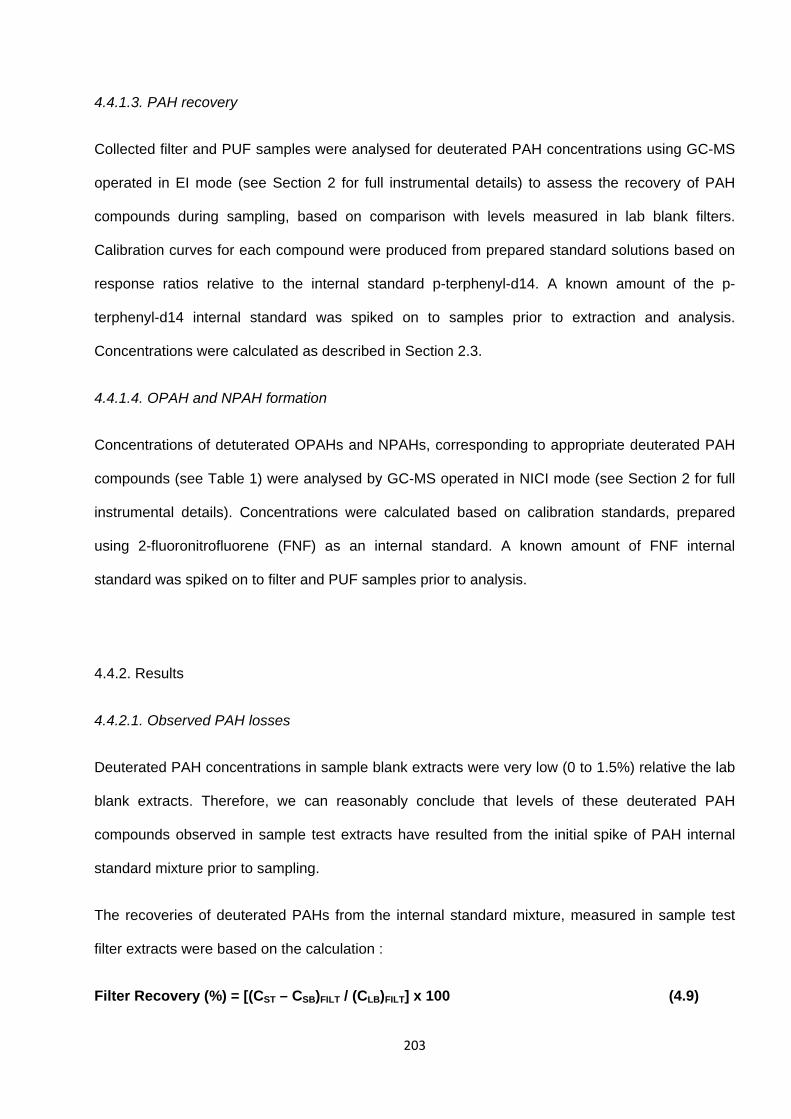
203
4.4.1.3. PAH recovery
Collected filter and PUF samples were analysed for deuterated PAH concentrations using GC-MS
operated in EI mode (see Section 2 for full instrumental details) to assess the recovery of PAH
compounds during sampling, based on comparison with levels measured in lab blank filters.
Calibration curves for each compound were produced from prepared standard solutions based on
response ratios relative to the internal standard p-terphenyl-d14. A known amount of the p-
terphenyl-d14 internal standard was spiked on to samples prior to extraction and analysis.
Concentrations were calculated as described in Section 2.3.
4.4.1.4. OPAH and NPAH formation
Concentrations of detuterated OPAHs and NPAHs, corresponding to appropriate deuterated PAH
compounds (see Table 1) were analysed by GC-MS operated in NICI mode (see Section 2 for full
instrumental details). Concentrations were calculated based on calibration standards, prepared
using 2-fluoronitrofluorene (FNF) as an internal standard. A known amount of FNF internal
standard was spiked on to filter and PUF samples prior to analysis.
4.4.2. Results
4.4.2.1. Observed PAH losses
Deuterated PAH concentrations in sample blank extracts were very low (0 to 1.5%) relative the lab
blank extracts. Therefore, we can reasonably conclude that levels of these deuterated PAH
compounds observed in sample test extracts have resulted from the initial spike of PAH internal
standard mixture prior to sampling.
The recoveries of deuterated PAHs from the internal standard mixture, measured in sample test
filter extracts were based on the calculation :
Filter Recovery (%) = [(CST – CSB)FILT / (CLB)FILT] x 100 (4.9)
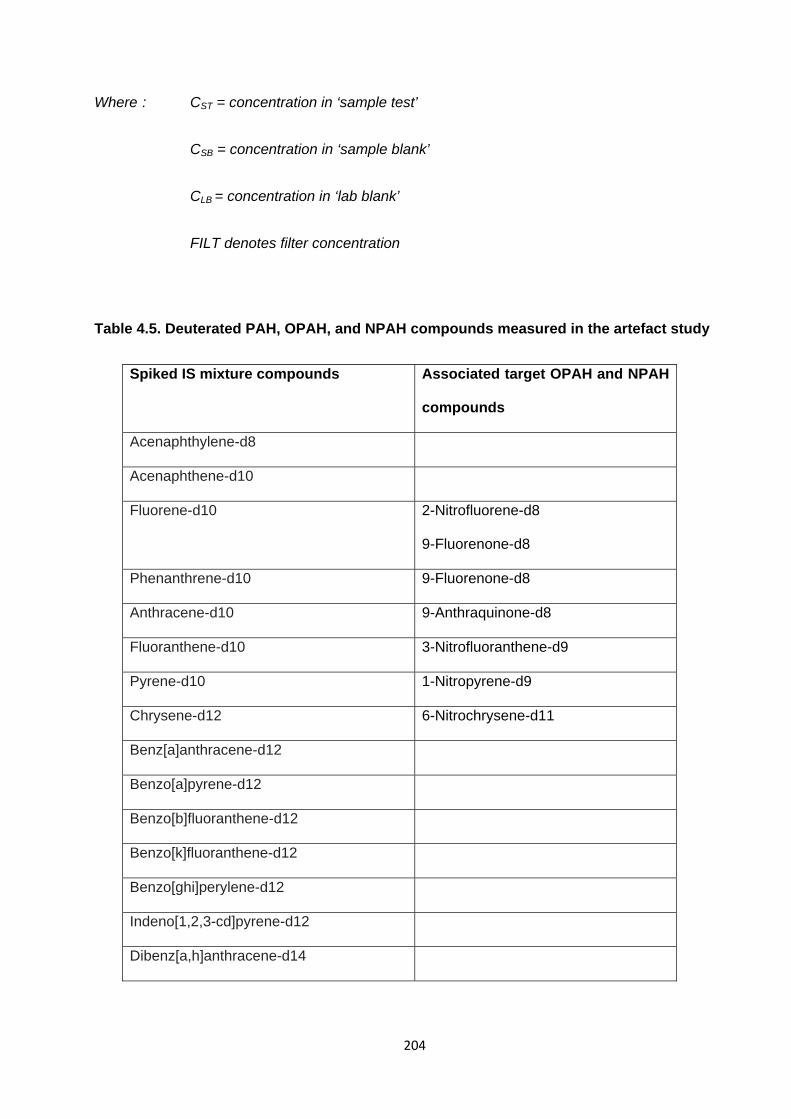
204
Where : CST = concentration in ‘sample test’
CSB = concentration in ‘sample blank’
CLB = concentration in ‘lab blank’
FILT denotes filter concentration
Table 4.5. Deuterated PAH, OPAH, and NPAH compounds measured in the artefact study
Spiked IS mixture compounds Associated target OPAH and NPAH
compounds
Acenaphthylene-d8
Acenaphthene-d10
Fluorene-d10 2-Nitrofluorene-d8
9-Fluorenone-d8
Phenanthrene-d10 9-Fluorenone-d8
Anthracene-d10 9-Anthraquinone-d8
Fluoranthene-d10 3-Nitrofluoranthene-d9
Pyrene-d10 1-Nitropyrene-d9
Chrysene-d12 6-Nitrochrysene-d11
Benz[a]anthracene-d12
Benzo[a]pyrene-d12
Benzo[b]fluoranthene-d12
Benzo[k]fluoranthene-d12
Benzo[ghi]perylene-d12
Indeno[1,2,3-cd]pyrene-d12
Dibenz[a,h]anthracene-d14

205
The mean filter recoveries for the PAH compounds calculated in this study are shown in Table 4.6.
For HMW (5+ ring) compounds, which are predominantly found in the particulate-phase in the
atmosphere (Smith and Harrison, 1996 ; Alam et al., 2013; Delgado-Saborit et al., 2013), the
recoveries were generally high (77 to 100%). This suggests the minimal losses from the filter
during sampling and the levels of these HMW compounds measured with these samplers are
reasonable agreement with ‘true’ levels present in the atmosphere. This is consistent with the
relatively high vapour pressures and subsequent low volatility of these compounds.
Recoveries of more volatile (3-4 ring) compounds were much lower (15-50%) suggesting these
compounds may be subject to losses from the filter during sampling and hence their levels may be
underestimated. This may have resulted due to volatilization, filter break-through or chemical
reaction during sampling. It is assumed that the use of a relatively non-volatile solvent (hexane) for
the IS spike prior to sampling meant that loss of PAH compounds prior to sampling was minimal.
However, it is possible some loss of more volatile compounds may have occurred prior to the
beginning of sampling .
Previously, Delgado-Saborit et al. (2013) collected PAH and OPAH at the BROS location using a
denuder system which collected the gas-phase component using XAD-4 upstream of a MOUDI
collecting the particulate-phase component on PTFE filters. This sampling system also used a PUF
plug downstream to monitor the amount of blow-off from the filter. The authors noted more volatile
3-ring PAHs displayed relatively high (18-63%) artefact levels compared with PAHs with 4+ rings
(0-10%).
The volatilisation artefact in the present study is relatively high for most compounds in relation to
this previous study, however the general trend of higher loss for LMW (3-4 ring) compounds
relative to HMW (5+ ring) compounds is consistent with the observation made by Delgado-Saborit
et al. (2013).
206
Kavouras et al. (1999) also utilised a denuded sampling system, observing particle-phase losses
for 3-4 ring PAH of 56-97% with much lower losses of 5+ ring PAH, which is also consistent with
losses during the present study.
It has been noted in studies utilising denuded sampling systems, that volatilisation from particles
can be enhanced in a denuded system as, by removing the gas-phase component upstream of the
particle component, the phase-partitioning equilibrium of the PAH compounds will be disrupted,
leading for a higher tendency for particle-bound fraction to partition to the gas-phase to move
towards equilibrium (Delgado-Saborit et al., 2014; Kavouras et al., 1999)
This study therefore demonstrates the loss of particle-phase component during sampling is a
phenomenon that influences both denuded and undenuded systems. The relatively high loss rates
of 3-4 ring PAH indicates that volatilisation/breakthrough from the filter and/or chemical reaction of
PAH with atmospheric oxidants are more significant processes influencing these PAHs than
adsorption of gas-phase components to the filter.
In order to assess whether loss of particle-associated semi-volatile PAH is predominantly due to
blow off/breakthrough or reactivity during sampling, the PAH levels present in the PUF material
downstream of the filter were also taken into account. The ‘total’ PAH recovery was calculated and
these recoveries are shown in Table 4.7 derived using the formula :
Total Recovery (%) = [(CST – CSB)FILT + (CST – CSB)PUF / (CLB)FILT] x 100 (4.10)
Where : CST = concentration in ‘sample test’
CSB = concentration in ‘sample blank’
CLB = concentration in ‘lab blank’
FILT – denotes filter concentration
PUF – denotes PUF concentration

207
Table 4.6. Mean filter recoveries of PAH compounds measured on sample test filters
Compound Mean SD
Acenaphylene-d8 51.6 23.9
Acenaphthene-d10 46.8 3.1
Fluorene-d10 21.8 10.4
Phenanthrene-d10 15.5 6.9
Anthracene-d10 23.4 10.6
Fluoranthene-d10 22.5 6.7
Pyrene-d10 27.9 2.4
Benzo(a)anthracene-d12 26.0 7.9
Chrysene-d12 31.7 10.2
Benzo(b)fluoranthene-d12 79.4 12.7
Benzo(k)fluoranthene-d12 77.1 5.1
Benzo(a)pyrene-d12 94.1 2.7
Indeno(1,2,3-cd)pyrene-d12 103.3 9.8
Dibenz(a,h)anthracene-d12 102.4 11.0
Benzo(ghi)perylene-d12 103.4 7.3
When the concentrations measured in PUFs is taken into account, total recoveries for most
compounds are generally high (>75%). These results suggest that in cases where filter recovery
was low, it is as a result of volatilisation/breakthrough from the filter to the PUF. If this behaviour
indeed occurred during sampling, this may influence the gas-particle partitioning behaviour of the
semi-volatile PAHs as the ‘real’ concentration of the compound in the particulate phase may have
been higher than reported.
This behaviour is likely to influence the semi-volatile PAHs, Pyr and Flt (and Ret which may be
assumed to display similar behaviour) primarily as the partitioning behaviour of these compounds
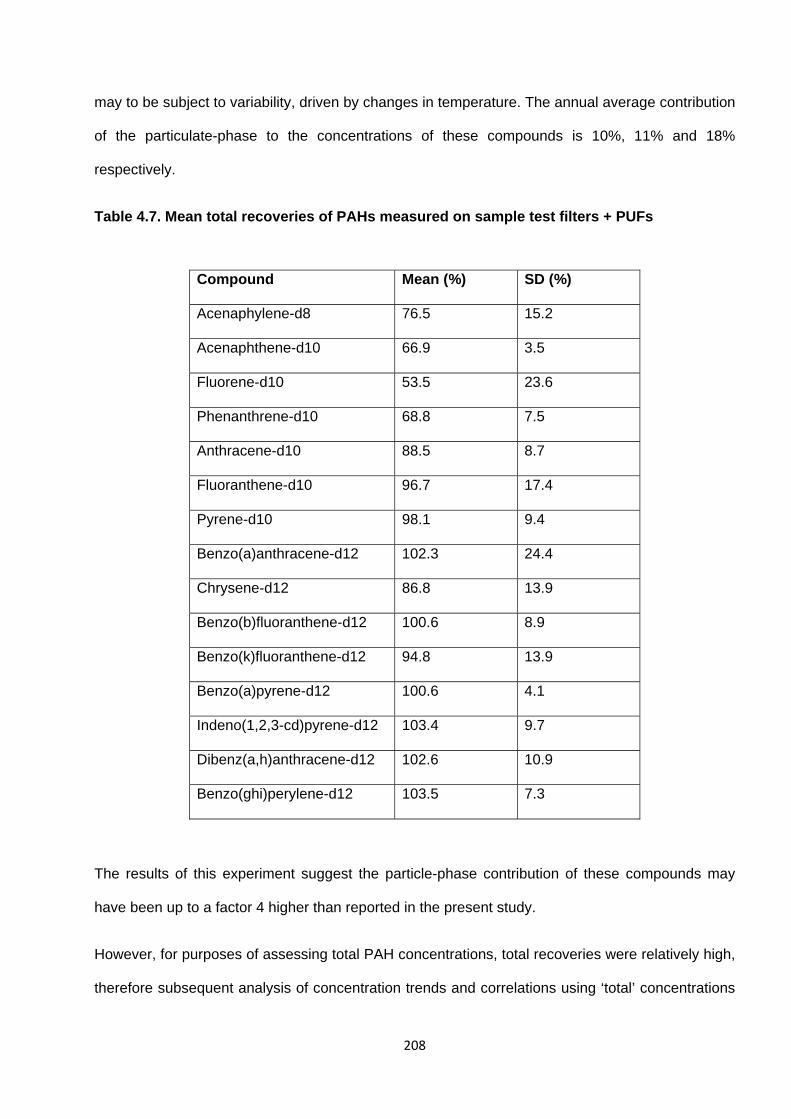
208
may to be subject to variability, driven by changes in temperature. The annual average contribution
of the particulate-phase to the concentrations of these compounds is 10%, 11% and 18%
respectively.
Table 4.7. Mean total recoveries of PAHs measured on sample test filters + PUFs
The results of this experiment suggest the particle-phase contribution of these compounds may
have been up to a factor 4 higher than reported in the present study.
However, for purposes of assessing total PAH concentrations, total recoveries were relatively high,
therefore subsequent analysis of concentration trends and correlations using ‘total’ concentrations
Compound Mean (%) SD (%)
Acenaphylene-d8 76.5 15.2
Acenaphthene-d10 66.9 3.5
Fluorene-d10 53.5 23.6
Phenanthrene-d10 68.8 7.5
Anthracene-d10 88.5 8.7
Fluoranthene-d10 96.7 17.4
Pyrene-d10 98.1 9.4
Benzo(a)anthracene-d12 102.3 24.4
Chrysene-d12 86.8 13.9
Benzo(b)fluoranthene-d12 100.6 8.9
Benzo(k)fluoranthene-d12 94.8 13.9
Benzo(a)pyrene-d12 100.6 4.1
Indeno(1,2,3-cd)pyrene-d12 103.4 9.7
Dibenz(a,h)anthracene-d12 102.6 10.9
Benzo(ghi)perylene-d12 103.5 7.3
209
will be valid. A number of LMW compounds (Ace, Acy, Flo, Phe) have lower (<77%) total filter
recoveries. This indicates these compounds are subject to losses from the filter and not recovered
by PUFs. This will result in overall loss and underestimation of total PAH concentration.
For 3-ring PAHs, which are typically found predominantly in the gas-phase, the influence of
observed loss rates from the filter is not likely to influence their partitioning or total concentrations
significantly. Considering the mean total (gas+particle) concentrations of PAHs measured in
campaign 1, the calculated loss of particle-phase 3-ring PAHs from filters during this artefact
experiment is likely to represent <1% decrease in total concentration.
While NPAH and OPAH losses were not directly monitored in this study, it is suggested that more
volatile compounds (MW<200) e.g. 1NNap, 2NNap and 9Flo may exhibit a similar level of loss as
more volatile PAHs
It is assumed that gas-phase loss from PUFs is minimal during sampling. PUFs have been widely
used in previous sampling studies collecting gas-phase 3-4 ring PAH, OPAH and NPAH (Yamasaki
et al., 1982 ; Keller and Bidleman, 1984; Harrison et al., 1996; Dimashki et al., 2000; 2001,
Bamford and Baker, 2003; Harrad and Laurie, 2005; Reisen and Arey, 2005; Albinet et al., 2008a,
Kim et al., 2012).
Keller and Bidleman (1984) demonstrated that PUF plugs of similar dimensions to those used in
this study, 3-ring PAH displayed <15% and 4-ring PAH <10% breakthrough during 24 hour
sampling studies. The use of 2 plugs in series therefore means we can be reasonably confident
that minimal loss of gas-phase species occurred during sampling in the present study.
Because the artefact sampling experiment was conducted for a specific period of the year in early
autumn, the meteorological conditions observed during this period were compared with those
during Campaign 1 to assess whether the results observed are likely to be representative for other
periods of Campaign 1, 2 and 3 (see Section 2) Meteorological data measured during the artefact
study are shown in Tables 4.8, along with mean values for each seasonal period of sampling
campaign 1.

210
Table 4.8. Mean values for meteorological measurements, temperature (TDRY), relative
humidity (RELH), Pressure (PRES) and solar radiation (SRAD) and total rainfall (RTOT) for
the sampling campaigns during autumn (A); winter (W); spring (Sp), summer (Su) and the
artefact study (ART).
TDRY (oC) RELH (%) PRES (hPa) SRAD (W/m2) RTOT (mm)
A 10.5 82.3 1012.2 156.1 3.5
W 6.0 82.7 1025.9 87.0 0.5
Sp 9.9 75.2 997.5 136.7 2.9
Su 16.5 76.3 996.7 183.1 2.9
ART 14.5 78.1 999.7 78.0 0.3
It can be seen that mean temperature during the artefact study was higher than that during the
autumn, winter and spring periods of Campaign 1, and slightly lower than measured during
summer. Other meteorological parameters (relative humidity, pressure) measured during the
artefact study and those measured in spring/summer were broadly comparable. However, solar
radiation levels during the artefact study were considerably lower. It is possible, therefore that
volatile losses of PAH compounds may have been more pronounced during the summer periods
when temperature and solar radiation levels were higher.
4.4.2.2. Conversion of PAH to OPAH or NPAH during sampling
Peaks on the gas chromatograph were identified corresponding at times consistent with the OPAH
and NPAH compounds. However these were noted in both ‘sample test’ and ‘sample blank’
extracts. This suggests that these peaks may not be attributable solely to the presence of
deuterated OPAH and NPAH compounds.
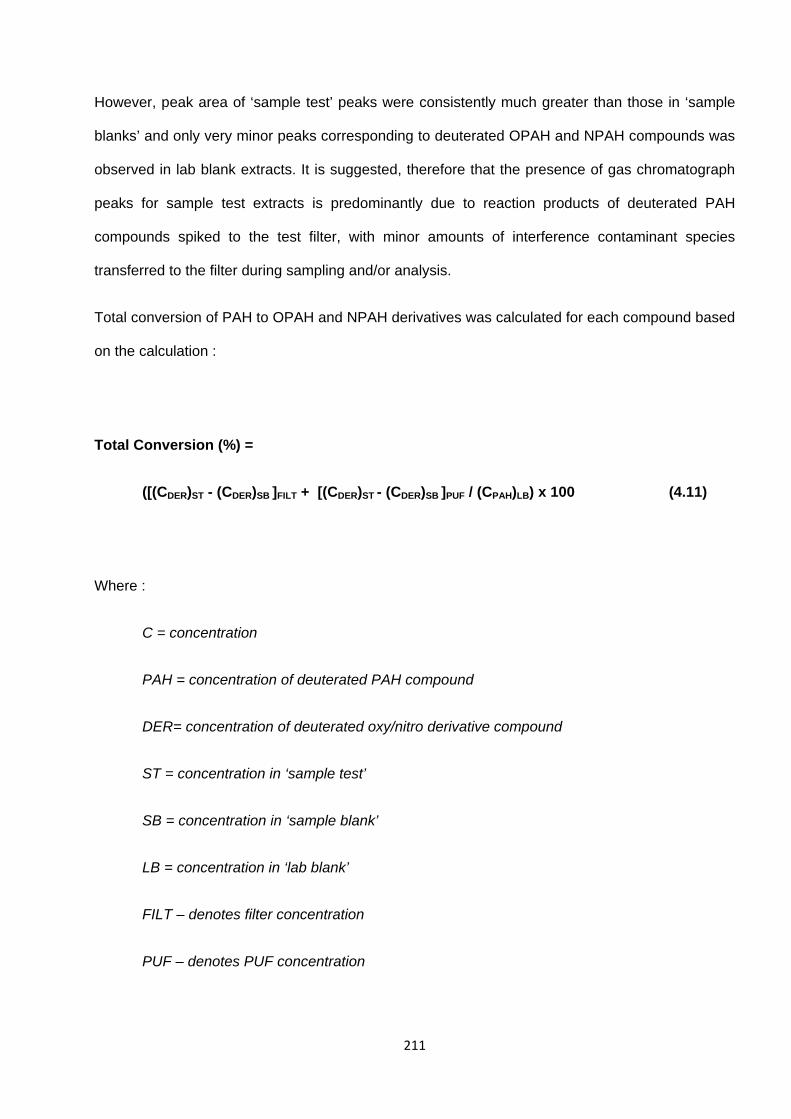
211
However, peak area of ‘sample test’ peaks were consistently much greater than those in ‘sample
blanks’ and only very minor peaks corresponding to deuterated OPAH and NPAH compounds was
observed in lab blank extracts. It is suggested, therefore that the presence of gas chromatograph
peaks for sample test extracts is predominantly due to reaction products of deuterated PAH
compounds spiked to the test filter, with minor amounts of interference contaminant species
transferred to the filter during sampling and/or analysis.
Total conversion of PAH to OPAH and NPAH derivatives was calculated for each compound based
on the calculation :
Total Conversion (%) =
([(CDER)ST - (CDER)SB ]FILT + [(CDER)ST - (CDER)SB ]PUF / (CPAH)LB) x 100 (4.11)
Where :
C = concentration
PAH = concentration of deuterated PAH compound
DER= concentration of deuterated oxy/nitro derivative compound
ST = concentration in ‘sample test’
SB = concentration in ‘sample blank’
LB = concentration in ‘lab blank’
FILT – denotes filter concentration
PUF – denotes PUF concentration

212
For all tested OPAH and NPAH compounds (Table 1) total conversion for the 24 hour sampling
period was <1%. The conversion to 9-Fluorenone-d8 ; Anthraquinone-d8 ; 2-Nitrofluorene-d8; 3-
Nitrofluoranthene-d9 ; 1-Nitropyrene-d9 ; 6-Nitrochrysene-d11 were 0.67%, 0.95%, 0.76%, 0.34%,
0.00%, 0.05% respectively.
This suggests that the measured levels of OPAH and NPAH compounds measured in this
investigation are not significantly influenced by artefact formation on the filter so the concentrations
measured during this investigation are broadly an accurate reflection of ‘true’ levels in the
atmosphere
It should be noted for most compounds the majority of observed detuterated OPAH or NPAH (with
the exception of 6NChr-d11) were detected in PUFs, suggesting formation had occurred on the
filter surface followed by volatilisation and/or break through to the PUF downstream.
Taking into account the mean particulate concentrations of PAH, OPAH and NPAH measured at
BROS and EROS in campaign 1, it is clear that a <1% conversion of PAH to their associated
derivatives will have a negligible influence of the overall concentrations of most PAH, OPAH and
NPAH measured during this study.
However, relatively low annual mean concentrations of 3NFlt and 6NChr suggest even minimal
artefact formation could influence these compounds. Indeed, considering the annual mean
particulate concentrations the conversion rates of 0.34% and 0.05% respectively of Flt and Chr
could lead to an overestimate of 3NFlt and 6NChr concentrations of >100%.
The extent of PAH reactivity towards oxidants during sampling will be highly dependent on the
oxidant concentration in the atmosphere. For example, Schauer et al. (2003) observed a
correlation between the denuded : undenuded PAH concentrations and the mixing ratio of O3.
In order to assess how the potential for oxidation reaction may vary during the sampling campaigns
in this project, and to compare the results of the present artefact study with previous studies, mean
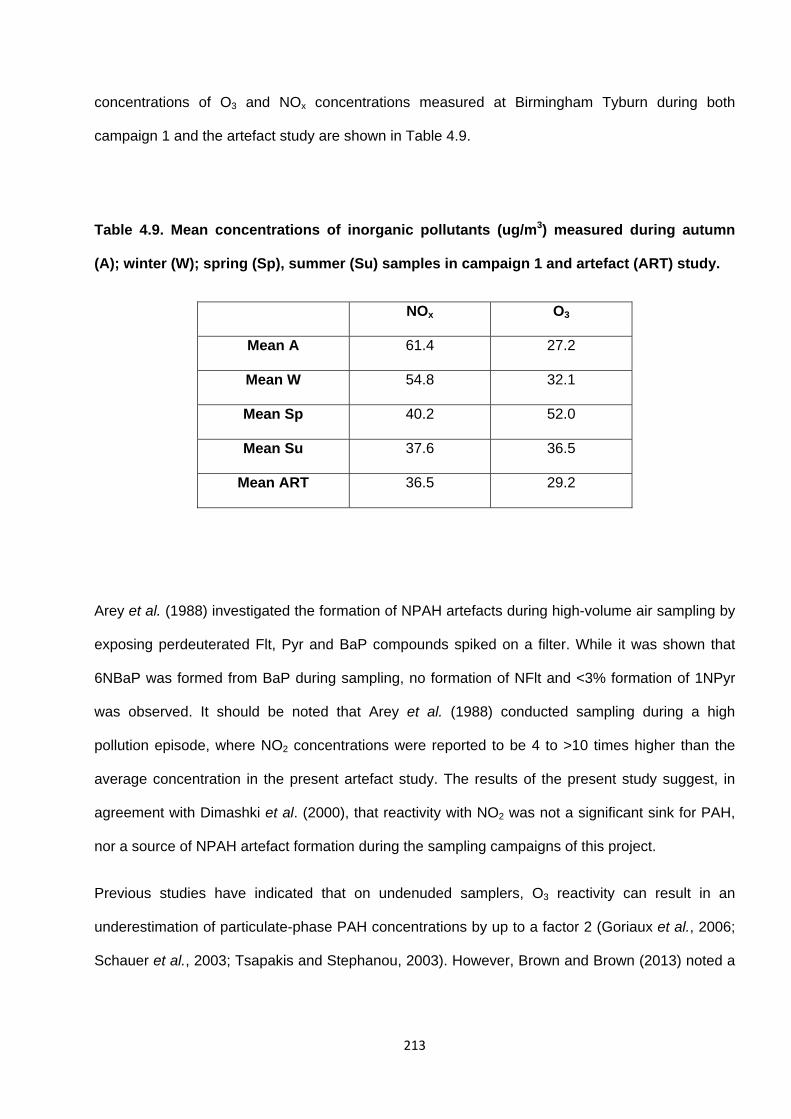
213
concentrations of O3 and NOx concentrations measured at Birmingham Tyburn during both
campaign 1 and the artefact study are shown in Table 4.9.
Table 4.9. Mean concentrations of inorganic pollutants (ug/m3) measured during autumn
(A); winter (W); spring (Sp), summer (Su) samples in campaign 1 and artefact (ART) study.
NOx O3
Mean A 61.4 27.2
Mean W 54.8 32.1
Mean Sp 40.2 52.0
Mean Su 37.6 36.5
Mean ART 36.5 29.2
Arey et al. (1988) investigated the formation of NPAH artefacts during high-volume air sampling by
exposing perdeuterated Flt, Pyr and BaP compounds spiked on a filter. While it was shown that
6NBaP was formed from BaP during sampling, no formation of NFlt and <3% formation of 1NPyr
was observed. It should be noted that Arey et al. (1988) conducted sampling during a high
pollution episode, where NO2 concentrations were reported to be 4 to >10 times higher than the
average concentration in the present artefact study. The results of the present study suggest, in
agreement with Dimashki et al. (2000), that reactivity with NO2 was not a significant sink for PAH,
nor a source of NPAH artefact formation during the sampling campaigns of this project.
Previous studies have indicated that on undenuded samplers, O3 reactivity can result in an
underestimation of particulate-phase PAH concentrations by up to a factor 2 (Goriaux et al., 2006;
Schauer et al., 2003; Tsapakis and Stephanou, 2003). However, Brown and Brown (2013) noted a

214
relatively small (~6%) underestimation in BaP concentrations due to reactive loss during 24 hr
sampling studies.
It is interesting to note that negligible loss of BaP is noted in this study, while previous studies have
noted this compound as one of the most reactive PAHs on the filter surface (Goriaux et al., 2006;
Liu et al., 2006; Tsapakis and Stephanou, 2003). This observation, in addition to the very low
conversion rates of PAHs to OPAH in this study suggest O3 reactivity on the filter surface was not
a significant process during this sampling experiment.
Furthermore, during the study of Tsapakis and Stephanou (2003) the O3 mixing ratio was >50ppb,
more than 3 times higher than was observed during the present study. Similarly, Liu et al. (2006)
noted 20% loss of BaP during sampling in an experiment where O3 mixing ratio was reported to be
70 μg/m3 , over a factor 2 higher than the present study. It is suggested, therefore that the
occurrence of artefact formation during sampling in these previous studies, and relative absence of
such an effect in the present study was as a result of much lower concentrations of reactant
species.
It can be seen in Table 4.9 that levels of NOx during the artefact study were similar to those
observed during spring and summer campaigns with higher levels observed during autumn and
winter. It is possible therefore, that while negligible levels of chemical conversion were indicted in
the artefact study, reactions of filter-bound PAH towards NOx may have been more enhanced
during winter.
The converse situation is true for O3 concentrations, for which levels during the artefact study are
similar to the autumn and winter concentrations but much lower than spring and summer
concentrations. It is possible therefore, that while negligible levels of chemical conversion were
indicted in the artefact study, reactions of filter-bound PAH towards O3 may have been more
enhanced during spring and summer.
215
4.4.3. Summary
The results of this quality control experiment suggest that sampling artefacts did not significantly
influence the total concentrations of target PAH or derivative compounds measured in the three
campaigns of this investigation.
Breakthrough and/or volatilisation of LMW 3-4 ring PAH was shown to occur, which resulted in
either loss of particulate component of these compounds to the atmosphere or to the downstream
PUF plug. However, because it is expected that vast majority of these 3-4 ring compounds will be
present in the atmosphere the gas-phase, the influence of this process on total concentration and
phase partitioning behaviour of these compounds is not expected to be significant.
It was shown that reactivity of PAH on the filter results in negligible levels of PAH loss and NPAH
or OPAH formation during sampling for most compounds. Based on these results, we can be
confident of the validity of assessments made using ‘total’ (vapour + particulate) concentrations as
total loss of PAH and derivatives is likely to be minimal.
216
Chapter 5. Diurnal profiles of PAH, OPAH and NPAH
5.1. BROS and EROS diurnal profiles
Diurnal profiles of PAHs, NPAHs and OPAHs compounds at BROS and EROS were derived from
sampling in Campaign 2. Details of the samples taken in Campaign 2 are provided in Table 2.1.
The profiles of ƩPAH concentrations at BROS and EROS, as well as the concentrations of O3 and
NOx are shown in Figure 5.1. It should be noted that the nighttime samples BD12 and ED12 taken
on 9/8/2012 displayed unusual behaviour. These samples were characterised by very high (>100
μg/m3) average nighttime NOx concentration at Tyburn and unexpectedly high concentrations of
HMW particle-phase PAHs. However the observed concentrations of LMW gas-phase compounds
and OPAH and NPAH compounds did not appear higher than expected. This could possibly
suggest the occurence of external pollution ‘episode’ influencing the Birmingham area during this
time or an error in extraction/analysis for these samples. These samples are excluded from the
calculation of mean diurnal patterns and any statistical analyses performed.
These profiles are based on mean values from each time period during the three sampling days of
this campaign during the summer months and therefore represent concentrations at these sites
and on these specific days. Given the spatial and temporal variation PAH, OPAH and NPAH
concentrations can exhibit, these diurnal profiles must be viewed with caution and may not be
representative of the wider area throughout other times of the year.
For ƩPAH at BROS, the highest concentrations are observed in the morning (0700 – 1100). This is
consistent with traffic being the principal source of compounds at these sites and emission strength
being strongest during the morning ‘rush hour’ period. Indeed, the profile for ƩPAH at BROS
appears to follow a distinct PAH ‘traffic’ pattern (Nielsen et al., 1999). The concentration peak in
the morning is followed by a sharp decline during daytime (1100 – 1600), possibly due to reduced
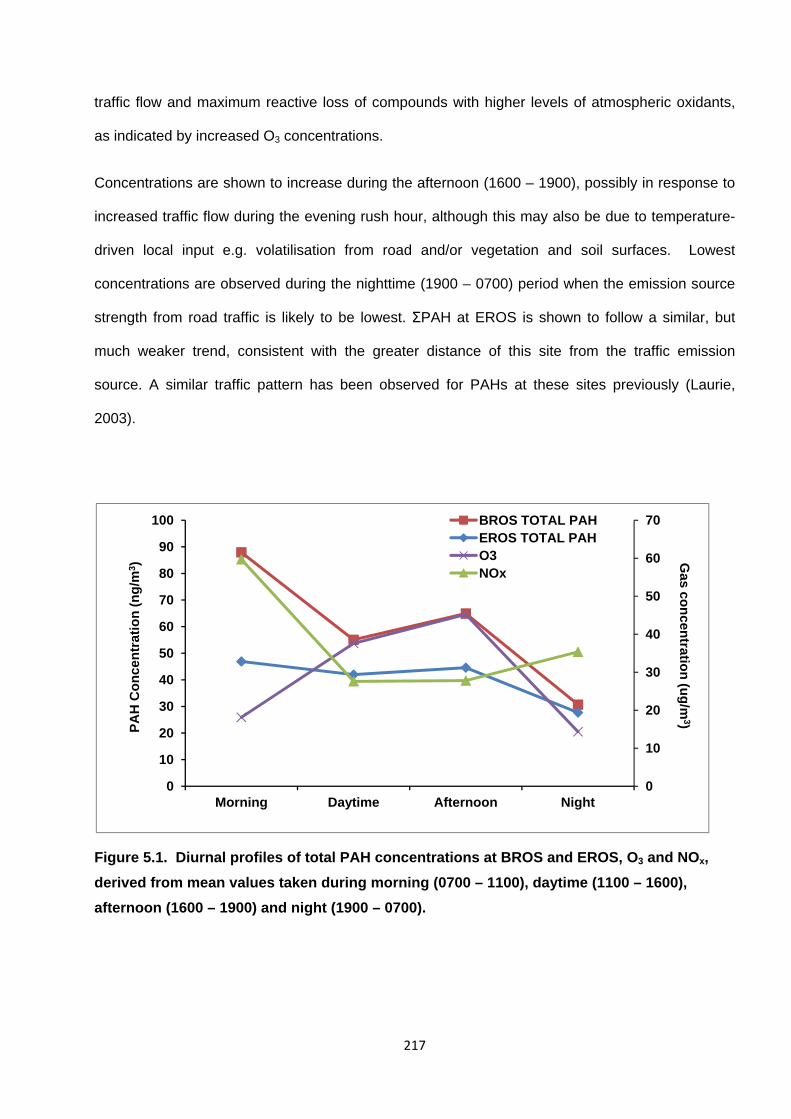
217
traffic flow and maximum reactive loss of compounds with higher levels of atmospheric oxidants,
as indicated by increased O3 concentrations.
Concentrations are shown to increase during the afternoon (1600 – 1900), possibly in response to
increased traffic flow during the evening rush hour, although this may also be due to temperature-
driven local input e.g. volatilisation from road and/or vegetation and soil surfaces. Lowest
concentrations are observed during the nighttime (1900 – 0700) period when the emission source
strength from road traffic is likely to be lowest. ƩPAH at EROS is shown to follow a similar, but
much weaker trend, consistent with the greater distance of this site from the traffic emission
source. A similar traffic pattern has been observed for PAHs at these sites previously (Laurie,
2003).
Figure 5.1. Diurnal profiles of total PAH concentrations at BROS and EROS, O3 and NOx,
derived from mean values taken during morning (0700 – 1100), daytime (1100 – 1600),
afternoon (1600 – 1900) and night (1900 – 0700).
0
10
20
30
40
50
60
70
0
10
20
30
40
50
60
70
80
90
100
Morning Daytime Afternoon Night
Gas co
ncen
tration
(ug
/m3)
PA
H C
on
cen
trat
ion
(n
g/m
3)
BROS TOTAL PAHEROS TOTAL PAHO3NOx
218
The PAH trend at BROS, and to a lesser extent at EROS is followed, at least partially by the trend
in NOx concentrations. The close association of PAHs and traffic-related gases such as NOx and
CO have previously been observed by Nielsen (1996). This indicates NOx levels are predominantly
governed by road traffic input. The observed increase in NOx concentration in nighttime samples is
therefore somewhat unexpected and may indicate the influence of non-traffic related combustion
sources at night and/or lower atmospheric losses of NOx resulting from reaction with OH.
Concentrations of NOx are shown to correlate significantly (p>0.05) with ambient temperature,
indicating the height of atmospheric mixing layer varies during the day, which will also influences
the observed diurnal patterns. For example, relatively high nighttime PAH concentrations have
previously been observed at night, attributed to thermal inversions in mixing height (Ringuet et al.,
2012a; Wu et al., 2010).
The diurnal profiles for individual PAH, OPAH and NPAH compounds at BROS and EROS are
presented in Figure 5.2. The relative distribution of PAH, OPAH and NPAH compounds, throughout
the diurnal cycle is shown to be broadly similar to that of seasonal samples collected in Campaign
1.
While the characteristic traffic-related pattern is observed for Phe at BROS, the daytime and
afternoon concentrations are higher at EROS than may be expected from traffic input. As
discussed in previous sections, this may be due to relatively high evaporative input from surfaces
causing a considerable variation from a traffic-mediated pattern, influencing more significantly at
EROS.
Ant displays highest concentrations during the afternoon at both sites. Ant displays high reactivity
towards OH (Atkinson and Arey, 1994; Brubaker and Hites, 1998) so might be expected to display
a relatively large decline in concentration during the daytime. Similarly, Acy, which is shown to be
the most reactive PAH towards OH (Reisen and Arey, 2002) does not display relatively steep
decline in daytime concentrations. Furthermore, while Flo follows a traffic-related pattern at both
sites, the trend is much weaker than observed for other compounds. The observed diurnal
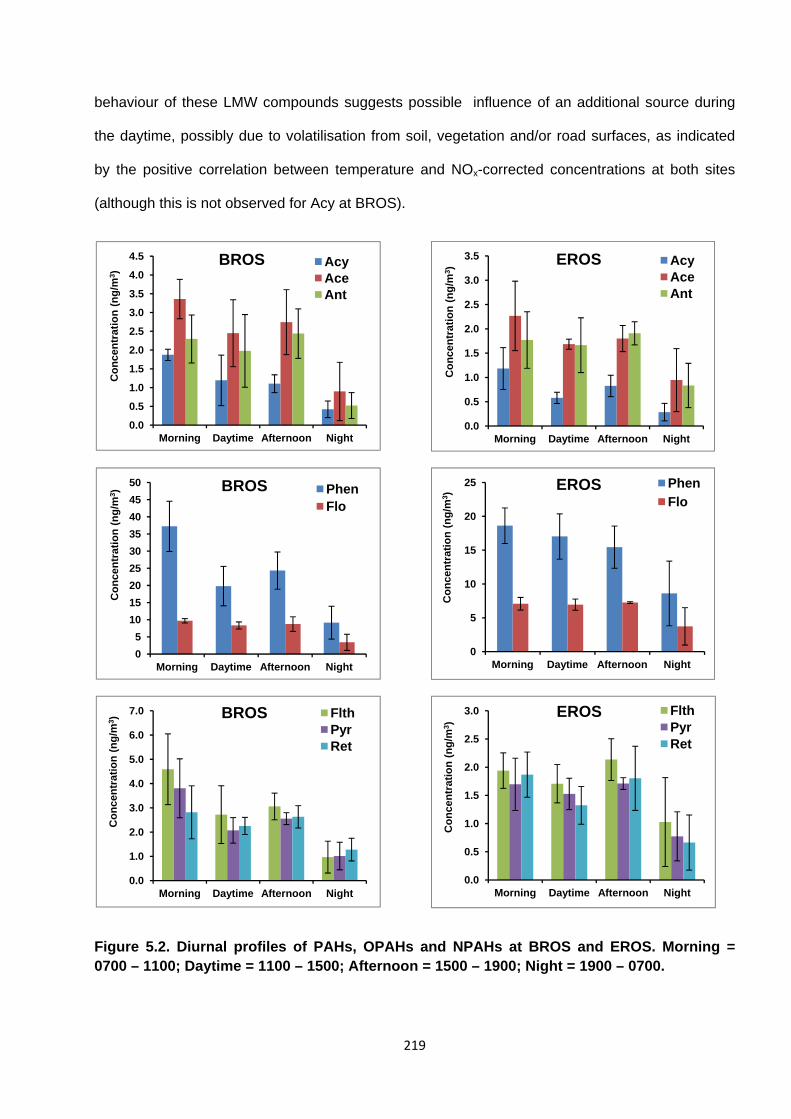
219
behaviour of these LMW compounds suggests possible influence of an additional source during
the daytime, possibly due to volatilisation from soil, vegetation and/or road surfaces, as indicated
by the positive correlation between temperature and NOx-corrected concentrations at both sites
(although this is not observed for Acy at BROS).
Figure 5.2. Diurnal profiles of PAHs, OPAHs and NPAHs at BROS and EROS. Morning = 0700 – 1100; Daytime = 1100 – 1500; Afternoon = 1500 – 1900; Night = 1900 – 0700.
0.0
0.5
1.0
1.5
2.0
2.5
3.0
3.5
4.0
4.5
Morning Daytime Afternoon Night
Co
nce
ntr
atio
n (
ng
/m3 )
BROS AcyAceAnt
0.0
0.5
1.0
1.5
2.0
2.5
3.0
3.5
Morning Daytime Afternoon NightC
on
cen
trat
ion
(n
g/m
3 ) EROS Acy
AceAnt
0
5
10
15
20
25
30
35
40
45
50
Morning Daytime Afternoon Night
Co
nce
ntr
atio
n (
ng
/m3 )
BROS PhenFlo
0
5
10
15
20
25
Morning Daytime Afternoon Night
Co
nce
ntr
atio
n (
ng
/m3 )
EROS Phen
Flo
0.0
1.0
2.0
3.0
4.0
5.0
6.0
7.0
Morning Daytime Afternoon Night
Co
nce
ntr
atio
n (
ng
/m3 )
BROS FlthPyrRet
0.0
0.5
1.0
1.5
2.0
2.5
3.0
Morning Daytime Afternoon Night
Co
nce
ntr
atio
n (
ng
/m3 )
EROS FlthPyrRet
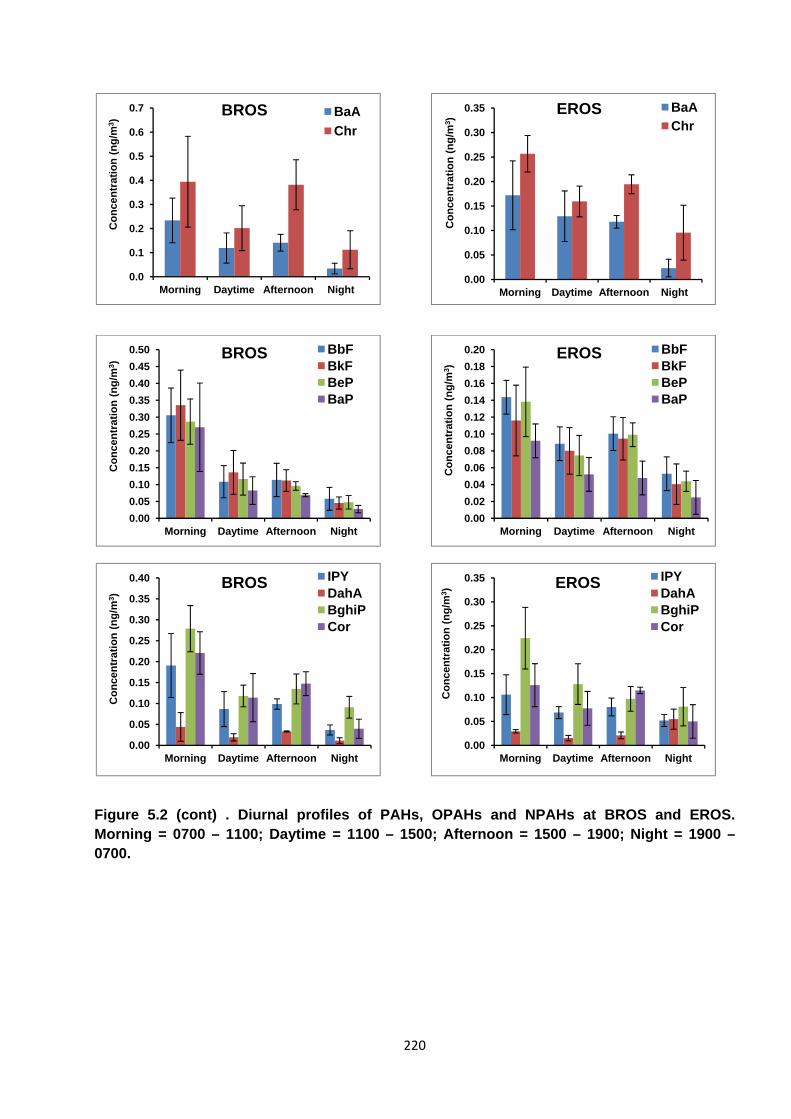
220
Figure 5.2 (cont) . Diurnal profiles of PAHs, OPAHs and NPAHs at BROS and EROS. Morning = 0700 – 1100; Daytime = 1100 – 1500; Afternoon = 1500 – 1900; Night = 1900 – 0700.
0.0
0.1
0.2
0.3
0.4
0.5
0.6
0.7
Morning Daytime Afternoon Night
Co
nce
ntr
atio
n (
ng
/m3 )
BROS BaA
Chr
0.00
0.05
0.10
0.15
0.20
0.25
0.30
0.35
Morning Daytime Afternoon Night
Co
nce
ntr
atio
n (
ng
/m3 )
EROS BaA
Chr
0.00
0.05
0.10
0.15
0.20
0.25
0.30
0.35
0.40
0.45
0.50
Morning Daytime Afternoon Night
Co
nce
ntr
atio
n (
ng
/m3 )
BROS BbFBkFBePBaP
0.00
0.02
0.04
0.06
0.08
0.10
0.12
0.14
0.16
0.18
0.20
Morning Daytime Afternoon Night
Co
nce
ntr
atio
n (
ng
/m3 )
EROS BbFBkFBePBaP
0.00
0.05
0.10
0.15
0.20
0.25
0.30
0.35
0.40
Morning Daytime Afternoon Night
Co
nce
ntr
atio
n (
ng
/m3 )
BROS IPYDahABghiPCor
0.00
0.05
0.10
0.15
0.20
0.25
0.30
0.35
Morning Daytime Afternoon Night
Co
nce
ntr
atio
n (
ng
/m3 )
EROS IPYDahABghiPCor
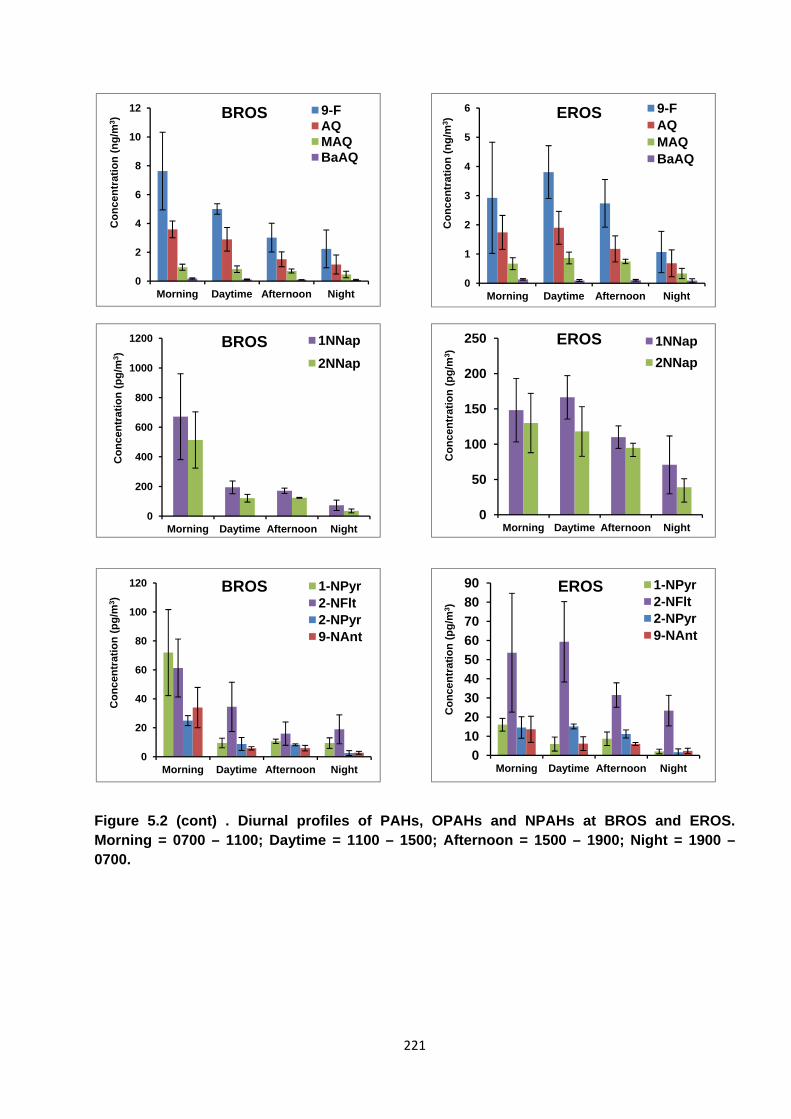
221
Figure 5.2 (cont) . Diurnal profiles of PAHs, OPAHs and NPAHs at BROS and EROS. Morning = 0700 – 1100; Daytime = 1100 – 1500; Afternoon = 1500 – 1900; Night = 1900 – 0700.
0
2
4
6
8
10
12
Morning Daytime Afternoon Night
Co
nce
ntr
atio
n (
ng
/m3 )
BROS 9-FAQMAQBaAQ
0
1
2
3
4
5
6
Morning Daytime Afternoon Night
Co
nce
ntr
atio
n (
ng
/m3 )
EROS 9-FAQMAQBaAQ
0
200
400
600
800
1000
1200
Morning Daytime Afternoon Night
Co
nce
ntr
atio
n (
pg
/m3 )
BROS 1NNap
2NNap
0
50
100
150
200
250
Morning Daytime Afternoon Night
Co
nce
ntr
atio
n (
pg
/m3 )
EROS 1NNap
2NNap
0
20
40
60
80
100
120
Morning Daytime Afternoon Night
Co
nce
ntr
atio
n (
pg
/m3 )
BROS 1-NPyr2-NFlt2-NPyr9-NAnt
0
10
20
30
40
50
60
70
80
90
Morning Daytime Afternoon Night
Co
nce
ntr
atio
n (
pg
/m3 )
EROS 1-NPyr2-NFlt2-NPyr9-NAnt
222
It is interesting to note that Ace displays a characteristic traffic pattern at both BROS and EROS,
despite seasonal (Section 3) and tunnel (Section 6) measurements suggesting a deviation away
from this behaviour. This may suggest measured concentrations in Campaign 1 are influenced by
a number of relatively isolated episodic emissions of Ace that mask the influence of traffic at these
sites.
Ret also displays a profile similar to a traffic-pattern, although relatively weakly, which is
unexpected because this compound has a relatively minor traffic input. It is suggested this profile is
primarily governed by variation in mixing layer height, with afternoon levels influenced by
evaporative input, particularly at EROS, as indicated by temperature-dependent behaviour of NOx-
corrected concentration (see Section 3.2).
At BROS, Flt and Pyr seem to follow a characteristic traffic pattern. However, at EROS, the
relatively shallow decline during the daytime, and rapid increase during the afternoon from these
compounds suggests the influence of an additional local daytime source, possibly volatilisation
from surfaces.
HMW PAHs (5+ ring) are shown to display the most pronounced morning rush hour peaks and
daytime declines of the PAHs measured. Since these compounds are not expected to display
significant reactive losses, this trend is expected to mostly indicate the impact of traffic flow
variation between morning and daytime.
However, afternoon concentrations are not shown to increase in correspondence with afternoon
rush hour, suggesting that afternoon traffic may have a minimal impact on the PAH profile and
afternoon increases observed for more volatile LMW compounds is due to contribution from
evaporative input. Fine et al. (2004) observed a diurnal profile for particle-bound BPy in Los
Angeles and Riverside, USA very similar to that of this study.
Reisen and Arey (2005) investigated diurnal variations of PAH and NPAH levels to assess
atmospheric reactivity by sampling over four time periods (morning, day, evening and night) in

223
California, USA. It was shown that, in summer, PAH concentrations clearly decrease during the
day and evening periods, in agreement with the observation in the present study.
While the diurnal pattern of PAH is likely to reflect relative source strength and photostability of
compounds (Dachs et al., 2002; Souza et al., 2014; Wu et al., 2010), the interpretation of OPAH
and NPAH diurnal patterns is more complex, due to the potential influence of secondary input from
atmospheric reactivity for some compounds. For example Souza et al. (2014) measured the diurnal
profile PAH, OPAH and NPAH in PM in Sao Paulo and indicated that direct emission from vehicles
influence concentrations of these compounds, but photochemical production contributes to levels
of NPAH and OPAH and photolysis of NPAH is also a significant loss process.
All for OPAH compounds measured concentrations display a morning peak in concentrations and a
decline throughout the day at BROS. However, it should be noted that this daytime decline is less
pronounced than for HMW PAHs and NPAH compounds. The relatively low concentrations during
the afternoon may be consistent with the relatively low impact of afternoon traffic at these sites but
may also indicate daytime concentrations are higher than expected due to additional input from
reactivity and/or volatilisation. The temperature dependence of NOx-corrected concentrations might
suggest the latter for 9F, AQ, MAQ (Section 3.2).
For 9F, AQ and MAQ, highest levels at EROS are observed during the daytime period, suggesting
a deviation away from a traffic-mediated profile. While NOx-corrected MAQ displays positive
correlation with temperature, this relationship is not observed for 9F and AQ. This might suggest
MAQ concentrations are influenced by volatilisation during the day at EROS while reactive input is
a more important factor contributing to 9F and AQ levels at EROS during the day.
1NNap and 2NNap levels display a morning rush hour peak at BROS with a relatively steep
decline in concentrations during the day. The decline is notably more pronounced for 1NNap than
2NNap, which is attributed the faster rate of photolysis for 1NNap.
At EROS, the profiles display an increase (1NNap) and relatively low decrease (2NNap) in
concentration between morning and daytime, which may indicate an additional source, possibly

224
from reactive or evaporative input, is influencing the concentrations of these compounds. A positive
correlation between temperature and NOx-corrected concentration is noted for 1NNap but not
2NNap at EROS.
1NPyr and 9NAnt are expected to be most prevalent in diesel exhaust emissions and are likely to
represent a traffic-related pattern for particle-phase NPAHs. These compounds display similar
patterns at BROS and EROS with a peak in the morning period followed by a steep decline during
daytime.
Kameda et al. (2004) investigated the diurnal pattern of 1NPyr concentration in Osaka, Japan and
observed higher concentrations during the morning and late evening, when traffic levels were
higher. The lack of a significant increase in concentrations during the afternoon may be due to a
minimal afternoon traffic impact at these sites, as observed with HMW PAHs. 1NFlt, 3NFlt, 6NChr
and 7NBaA display similar trend, indicating a similar traffic-related behaviour.
At BROS, reaction product compounds 2NFlt and 2NPyr display a similar traffic-related pattern to
other NPAH, indicating that levels of these reaction product compounds is dictated predominantly
by the primary input of precursor PAH compounds and reactive input is not significant that this site
relative to the strength of primary emissions. However, the daytime decline in concentration is
lower than observed for 1NPyr or 3NFlt, possibly indicating the impact or reactive or evaporative
input of these compounds at BROS.
At EROS, highest 2NFlt and 2NPyr concentrations are observed during the daytime period, when
OH radical concentration is expected to be highest, suggesting reactive input is an important
factor. The diurnal profile of 2NFlt and 2NPyr have been shown to closely follow the measured
concentration of OH, with highest concentrations observed during the daytime (1100-1500) period
(Tsapakis and Stephanou, 2007). Kameda et al. (2004) also observed a significant (p<0.05)
correlation between 2NFlt and estimated OH concentrations during a diurnal study.
A number of studies have noted lower levels of PAH, OPAH and NPAH during the day compared
with nighttime levels or a rapid decline during the daytime or afternoon, which is attributed to rapid
225
photodecomposition (Ciccioli et al., 1996; Hien et al., 2007; Ringuet et al., 2012a; Tsapakis and
Stephanou, 2007; Wu et al., 2010; Zielinska et al., 1989). The relatively steep decline in NPAH
concentrations during the day, in comparison with PAH and OPAH during the day, may indicate the
relatively rapid photolytic loss for these compounds.
4.2. NOx-corrected diurnal profiles
In an investigation of PAH and NPAH diurnal patterns in California, USA by Reisen and Arey
(2005) normalised observed concentrations to CO levels (used as a traffic marker) to compensate
for variation in ABL height during the diurnal cycle and the dilution of traffic-generated emissions
between urban and suburban sites. It was shown that normalising the PAH and NPAH levels
removed much of the traffic- or mixing height- mediated profile and allowed closer insight into the
processes driving the short term variations in concentrations. In this study NOx was used as a
traffic marker to normalise the PAH, OPAH and NPAH concentrations as data for CO were not
available. Normalised diurnal profiles for a number of selected PAH, OPAH and NPAH are
presented in Figure 5.3.
It is notable that highest normalised concentrations of the LWM (3-4 ring) PAHs (e.g. Phe, Flo,
Acy, Pyr and Flt) are highest during the daytime and/or afternoon periods at both sites, when
temperature is shown to be highest. This indicates the potential importance of temperature-driven
volatilisation from soil, vegetation or road surfaces on the concentrations of these compounds at
these sites. It is suggested, therefore, that while direct emissions of road traffic is likely to govern
the concentrations of these LMW PAHs, local input will also be an important factor, particularly in
warmer conditions.
For HMW compounds, the observed diurnal trend is either removed (e.g. IPy, BPy) or unchanged
(e.g. BaP, BeP) suggesting these compounds are not influenced significantly by reactive loss or
evaporative input. Interestingly, for OPAH compounds, highest normalised concentrations are
observed during the daytime period, when the intensity of solar radiation is highest. This indicates
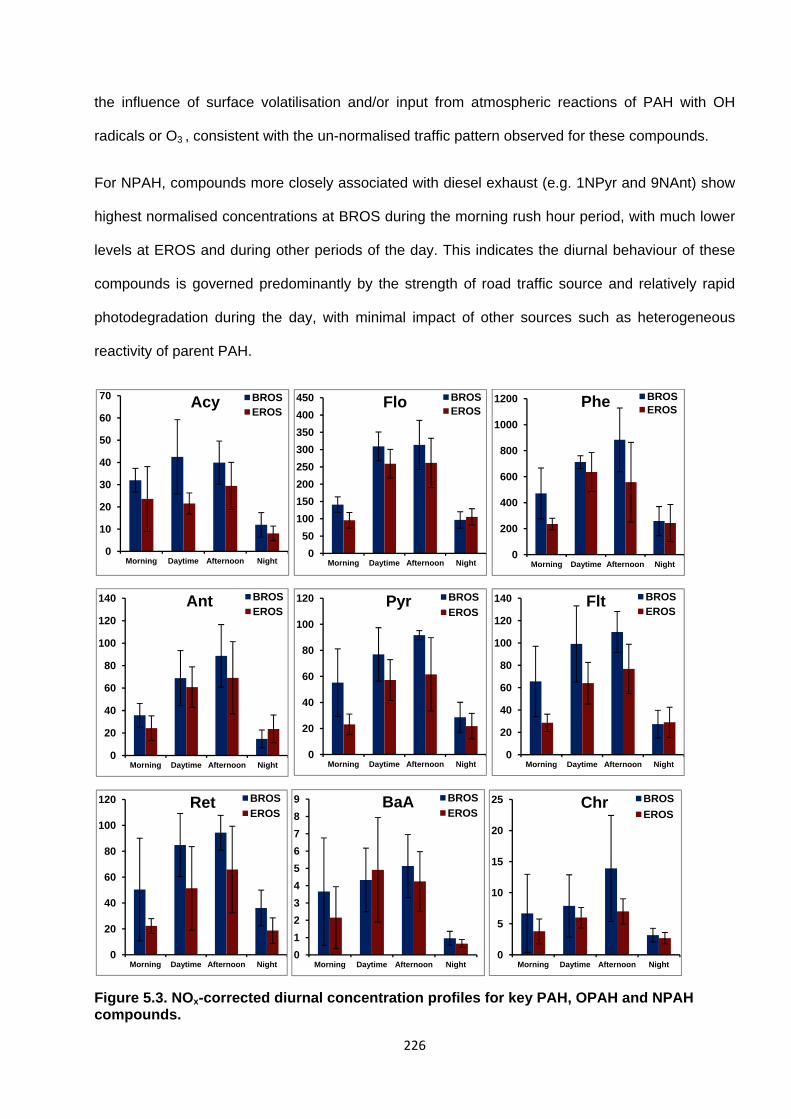
226
the influence of surface volatilisation and/or input from atmospheric reactions of PAH with OH
radicals or O3 , consistent with the un-normalised traffic pattern observed for these compounds.
For NPAH, compounds more closely associated with diesel exhaust (e.g. 1NPyr and 9NAnt) show
highest normalised concentrations at BROS during the morning rush hour period, with much lower
levels at EROS and during other periods of the day. This indicates the diurnal behaviour of these
compounds is governed predominantly by the strength of road traffic source and relatively rapid
photodegradation during the day, with minimal impact of other sources such as heterogeneous
reactivity of parent PAH.
Figure 5.3. NOx-corrected diurnal concentration profiles for key PAH, OPAH and NPAH compounds.
0
10
20
30
40
50
60
70
Morning Daytime Afternoon Night
Acy BROSEROS
0
50
100
150
200
250
300
350
400
450
Morning Daytime Afternoon Night
Flo BROSEROS
0
200
400
600
800
1000
1200
Morning Daytime Afternoon Night
Phe BROSEROS
0
20
40
60
80
100
120
140
Morning Daytime Afternoon Night
Ant BROSEROS
0
20
40
60
80
100
120
Morning Daytime Afternoon Night
Pyr BROS
EROS
0
20
40
60
80
100
120
140
Morning Daytime Afternoon Night
Flt BROSEROS
0
20
40
60
80
100
120
Morning Daytime Afternoon Night
Ret BROS
EROS
0
1
2
3
4
5
6
7
8
9
Morning Daytime Afternoon Night
BaA BROS
EROS
0
5
10
15
20
25
Morning Daytime Afternoon Night
Chr BROS
EROS

227
Figure 5.3 (cont). NOx-corrected diurnal concentration profiles for key PAH, OPAH and NPAH compounds.
0
2
4
6
8
10
12
Morning Daytime Afternoon Night
BbFBROS
EROS
0
2
4
6
8
10
12
Morning Daytime Afternoon Night
BaPBROSEROS
0
1
2
3
4
5
6
7
8
9
Morning Daytime Afternoon Night
BeP BROS
EROS
0.0
0.5
1.0
1.5
2.0
2.5
3.0
3.5
4.0
4.5
5.0
Morning Daytime Afternoon Night
IPY BROS
EROS
0
50
100
150
200
250
Morning Daytime Afternoon Night
9F BROS
EROS
0
20
40
60
80
100
120
140
160
180
Morning Daytime Afternoon Night
AQ BROS
EROS
0.0
0.2
0.4
0.6
0.8
1.0
1.2
1.4
Morning Daytime Afternoon Night
1NPyr BROSEROS
0.0
0.1
0.2
0.3
0.4
0.5
0.6
0.7
0.8
0.9
Morning Daytime Afternoon Night
9NAnt BROSEROS
0
5
10
15
20
25
Morning Daytime Afternoon Night
1NNap BROS
EROS
0
2
4
6
8
10
12
14
Morning Daytime Afternoon Night
2NNap BROSEROS
0.0
0.5
1.0
1.5
2.0
2.5
3.0
3.5
4.0
Morning Daytime Afternoon Night
2NFlth BROSEROS
0.0
0.1
0.2
0.3
0.4
0.5
0.6
0.7
0.8
Morning Daytime Afternoon Night
2NPyr BROSEROS

228
A broadly similar trend in the normalised profile of 1NPyr was observed by Reisen and Arey (2005)
in Los Angeles and Riverside, USA, suggesting urban and suburban areas display similar
behaviour for marker compounds of diesel traffic emissions.
NNap compounds display a similar normalised profile to those of 1NPyr and 9NAnt, with peak
concentrations during the morning rush hour and lower concentrations during the daytime and
afternoon. This would suggest the profiles of these compounds are more dominated by traffic-
generated input and photolytic loss, with a minor contribution from atmospheric reactions.
However, it should be noted that at EROS, while concentrations of 1NPyr and 9NAnt decrease
between morning and daytime, an increase in concentration is observed for NNap compounds over
this period. This may indicate an influence of OH reactivity between sites influencing the
concentrations of 1NNap and 2NNap at the background site.
Normalised concentrations of 2NFlt and 2NPyr are highest at EROS during the daytime period,
consistent with the profiles in Figure 5.2. This suggests that while reactive input from OH-initiated
input is not significant at the traffic site, the contribution of reactions between sites leads to
relatively high 2NFlt and 2NPyr concentrations at EROS. However, it should also be noted that
temperature-driven volatilization may also influence concentrations of these compounds at EROS.
The normalised concentrations of 2NFlt and 2NPyr are relatively low at both sites at night. This
suggests that the influence of NO3 reactions on the levels of these compounds at night may be
minimal.
It is interesting to note that Reisen and Arey (2005) observed peaks in NNap, 2NFlt and 2NPyr
normalised concentrations in Riverside during the night, indicating NO3 reactivity was occurring
between Los Angeles and this background site. This may be due to the much greater distance
between ‘polluted’ and ‘background’ sites in this previous (~90km) and present (~1km) study,
allowing increased time for reactions to occur and a much greater reduction in NO concentrations
in the atmosphere.
229
4.3. Assessing role of PAH degradation and reactive input of NPAH and OPAH
4.3.1. PAH degradation
It is considered that OH reactions will be the dominant loss process influencing LMW PAHs in the
atmosphere (Atkinson and Arey, 1994; 2007; Keyte et al., 2013).
Arey et al. (1989a) measured 12-hr daytime and night time concentrations of LMW PAHs during a
photochemical air pollution episode in the Los Angeles Basin. The nighttime/daytime concentration
ratios were shown to correlate with the laboratory-derived second order OH radical reaction rate
coefficients (see Appendix 1), for example with the largest ratios being observed for PAHs that
display the higherst rate coefficients for OH reactions, such as Acy and Ace. This indicates the
occurrence of OH-induced reactions occurring in the atmosphere at similar rates to those predicted
by laboratory-derived kinetics data. Furthermore, Dachs et al. (2002) estimated OH rate coefficient
values based on daytime and nighttime PAH profiles, which were in good agreement with literature
values.
Similarly, a linear correlation has been observed between the OH reaction rate coefficients for Nap,
methyl-Nap, ethyl-Nap and dimethyl-Nap compounds and both corresponding nighttime/daytime
concentration ratios measured in Riverside, USA (Phousongphouang and Arey, 2003b) and
morning/daytime concentration ratios measured in Los Angeles, USA (Reisen and Arey, 2005).
The slope of the latter trend was shown to be steeper in summer compared to winter, providing
further evidence for the dominant role of OH reaction chemistry on the observed degradation of
PAHs in the atmosphere.
While the annual mean BROS/EROS concentration ratios have been shown to agree well with OH
reactivity rates (Section 3.6), no correlation was observed between OH reaction rate coefficients
and nighttime/dayime or morning/daytime concentration ratios at either site for the diurnal samples.
This may partly be explained by the close proximity of these sites to a local traffic source which
dominates the observed PAH diurnal profiles. Additionally, as discussed above, the levels of LMW
PAHs may be influenced by local input from local temperature-driven volatilisation from surfaces at
230
both sites. This may affect the concentrations of compounds during the day to differing degrees
and potentially mask the influence of OH-initiated degradation.
It should also be noted that the previous studies were conducted in California, where the
meteorological conditions are likely to be more conducive to atmospheric reactivity. For example
the study by Arey et al. (1989) was conducted during a photochemical pollution ‘episode’ and other
O3 concentrations in previous studies ranged between 40-140 ppb (Phousongphouang and Arey,
2003b; Reisen and Arey, 2005) compared to a maximum level of 40 ppb in the present study. The
oxidising potential of the atmosphere in these previous studies is therefore likely to have been
much higher than in the present study.
4.3.2. 2NFlt/1NPyr and 2NFlt/2NPyr Ratios
The reaction source marker ratios of 2NFlt/1NPyr and 2NFlt/2NPyr were calculated for the samples
in Campaign 3 to assess the potential influence of OH and NO3 reactivity over the diurnal cycle.
The mean ratios for each time period are shown in Figure 5.4.
The 2NFlt/1NPyr ratio at BROS is shown to be low (<5) throughout the diurnal cycle, indicative of
vehicular traffic emissions dominating over secondary input at this site. However, at EROS, the
ratio was shown to be relatively high (>9) during the daytime (1100 – 1600) and night (1900 –
0700) periods, possibly indicating the greater influence of both OH and NO3 reactivity at the
background site. Similarly, noted 2NFlt/1NPyr values <5 at a traffic site and >5 at a suburban site
in both daytime and nighttime samples.
2NFlt/2NPyr ratios are low (<7) at both sites during morning, daytime and afternoon periods. This
is consistent with negligible influence of NO3 reactivity during daylight hours. This is also consistent
with the yield ratio from OH reactivity (assuming identical levels of Flu and Pyr in the air) of
2NFlt/2NPyr = 6 (Atkinson and Arey, 1994).

231
a
b
Figure 5.4. The diurnal profile of NPAH isomer ratios a) 2NFlt / 1NPyr and b) 2NFlt / 2NPyr
measured at BROS and EROS.
The ratio is higher (>12) at both sites during the night indicating NO3 reactivity can play a more
important role at night when the concentrations of this species will be higher due to absence of
sunlight and lower levels of NO. The higher ratio at EROS relative to BROS may indicate the
occurrence of NO3 reactivity between sites.
0
2
4
6
8
10
12
Morning Daytime Afternoon Night
2NFlth / 1NPyr BROSEROS
0
2
4
6
8
10
12
14
16
18
Morning Daytime Afternoon Night
2NFlth / 2NPyr BROSEROS

232
However, overall the role of NO3 is not significant at these sites, as indicated previously in urban
(Feilberg et al., 2001; Marino et al., 2000; Wang et al., 2011a), suburban (Ciccioli et al., 1996) and
background (Tsapakis and Stephanou, 2007) sites. However, much higher ratios have been noted
in other studies during summer months in urban and suburban sites (Albinet et al., 2008a; Bamford
and Baker, 2003; Reisen and Arey, 2005; Ringuet et al., 2012a).
5.3.3. Reactant/Parent Ratios
The ratios of OPAH or NPAH ‘product’ to PAH ‘parent’ for the diurnal samples were also assessed.
The ratios calculated during each time period at the two sites are presented in Figure 5.5.
OPAH/PAH ratios are generally higher at BROS relative to EROS during most time periods
indicating 9F and AQ are more strongly associated with primary vehicular emissions at the traffic
site than at the background site.
The decline in 9F/Flo ratio from morning rush hour peak throughout the daytime period at BROS is
likely to reflect the traffic-related profile of both compounds. The increases in 9F/Flo, 9F/Phe and
AQ/Ant during the daytime period at EROS may be a reflection of OH-generated input (and/or
reaction with O3 in the case of AQ) during the period of maximum solar radiation and high O3
concentrations.
However, AQ/NOx and 9F/NOx displayed a significant (p>0.01) correlation with temperature,
indicating the possible input from resuspension or volatilisation from surfaces at this site. However
it should be noted that Flo, Phe and Ant also displayed this trend. The distinction between reactive
and evaporative input at BROS is therefore unclear from these profiles.
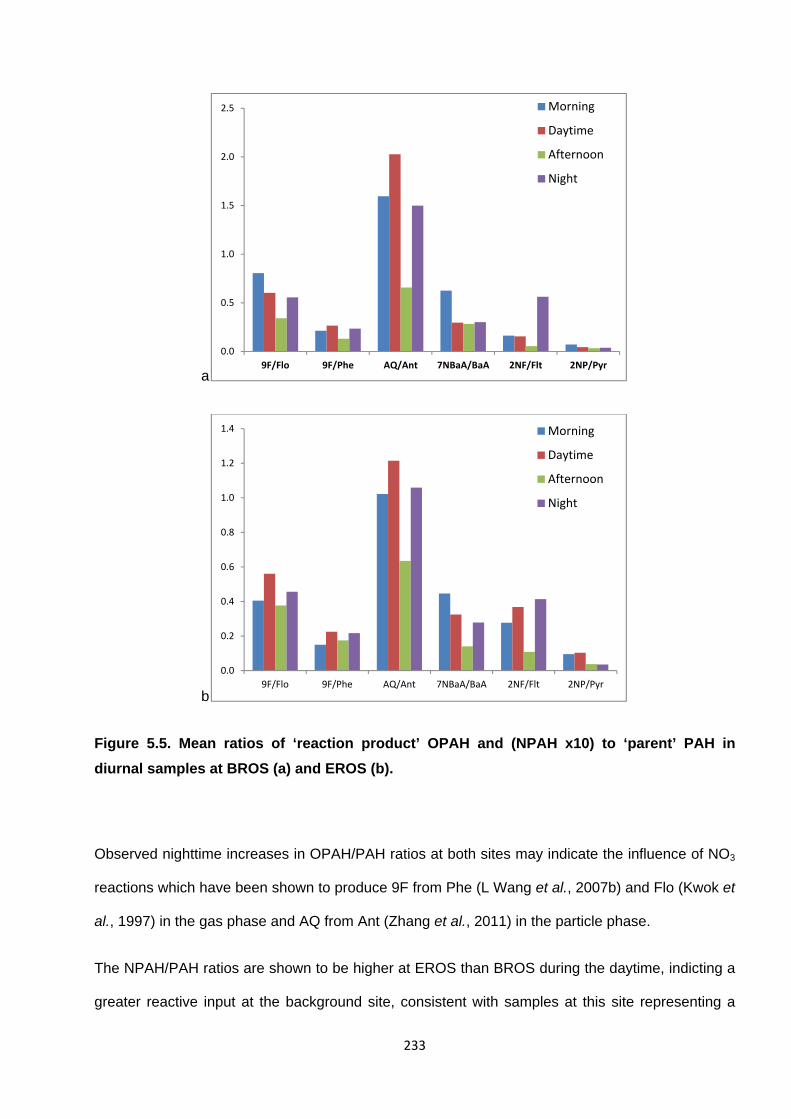
233
a
b
Figure 5.5. Mean ratios of ‘reaction product’ OPAH and (NPAH x10) to ‘parent’ PAH in
diurnal samples at BROS (a) and EROS (b).
Observed nighttime increases in OPAH/PAH ratios at both sites may indicate the influence of NO3
reactions which have been shown to produce 9F from Phe (L Wang et al., 2007b) and Flo (Kwok et
al., 1997) in the gas phase and AQ from Ant (Zhang et al., 2011) in the particle phase.
The NPAH/PAH ratios are shown to be higher at EROS than BROS during the daytime, indicting a
greater reactive input at the background site, consistent with samples at this site representing a
0.0
0.5
1.0
1.5
2.0
2.5
9F/Flo 9F/Phe AQ/Ant 7NBaA/BaA 2NF/Flt 2NP/Pyr
Morning
Daytime
Afternoon
Night
0.0
0.2
0.4
0.6
0.8
1.0
1.2
1.4
9F/Flo 9F/Phe AQ/Ant 7NBaA/BaA 2NF/Flt 2NP/Pyr
Morning
Daytime
Afternoon
Night

234
more ‘aged’ air mass. The lack of an increase in NPAH/PAH ratio between morning and daytime at
BROS indicates a less significant input from OH-initiated reactions at the traffic site.
At EROS, ratios were higher during daytime than morning, indicting the formation of 2NFlt and
2NPyr during the period when OH concentrations are likely to be highest. However, as with
OPAH/PAH, the ratios at EROS are likely to be influenced by volatilization of PAH and NPAH
compounds from surfaces making the distinction between reactive and evaporative input more
complex.
At both BROS and EROS 2NFlt/Flt ratios display a marked increase at night, indicating the
influence of NO3-initiated input of 2NFlt during this period. The lack of increase in 2NP/Pyr during
the night is consistent with the observation that 2NPyr does not result from NO3 reactions, in
contract to 2NFlt. Similar diurnal variability in these NPAH/PAH ratios was observed by (Wei et al.,
2012) at sampling sites in southern China where 2NFlt/Flt shown to be higher during the night than
during the day in summer and the converse trend was noted for 2NPyr/Pyr.
Interestingly, Wei et al. (2012) noted much higher 7NBaA/BaA ratios at night than during the day.
The authors indicated this may be due to a strong night-time emission source of 7NBaA rather than
due to atmospheric reactivity. In this study, this ratio strongly indicated the dominance of morning
emissions of 7NBaA, suggesting this compound is primarily emitted from road traffic, in contrast to
the seasonal (Section 3.3) and traffic (Section 3.1) patterns. The origin of this NPAH compound is
therefore rather unclear.
235
Chapter 6. Concentrations of PAHs, OPAHs and NPAHs
in the Queensway Road Tunnel
6.1. Tunnel concentrations of PAHs, OPAHs and NPAHs
Details of the samples taken in Campaign 3 are provided in Table 2.1. Mean concentrations of
PAHs, OPAHs and NPAHs measured in the Queensway Road Tunnel during Campaign 3
(calculated by subtracted corresponding EROS concentration from measured tunnel
concentration), and the proportion of each compound present in the particle-phase, are presented
in Table 6.1. A comparison with concentrations measured simultaneously at EROS is provided.
The relative proportions of PAHs, OPAHs and NPAHs present in the tunnel were broadly similar to
those measured at the ambient roadside location BROS (see Section 3). Since it is assumed that
road traffic is the only source influencing levels in the road tunnel, this indicates that traffic is the
dominant source of most of these compounds at BROS also.
6.1.1. PAH and OPAH concentrations
EROS-corrected tunnel concentrations of PAHs and OPAHs in the Queensway Road Tunnel, and
their distribution between the gas-phase and particle-phase are shown in Figure 6.1 and 6.2
respectively. LMW PAHs (MW<203) comprised ~93% of total PAH mass, with concentrations
ranging from 3.3 ng m-3 (Ace) to 81 ng m-3 (Phe). HMW (MW>228) PAHs were present at much
lower levels, with concentrations ranging from 0.1 ng m-3 (DBA) to 0.9 ng m-3 (BPy).
Concentrations of the OPAHs measured in the tunnel were lower than their corresponding semi-
volatile 3-4 ring PAHs. 9F was the dominant OPAH compound measured with lower levels of AQ
and MAQ. BaAQ was present at very low concentration, indicating a relatively low traffic input of
this compound. 9F was observed predominantly in the gas phase, while AQ, MAQ and BaAQ were
present mainly in the particulate-phase.
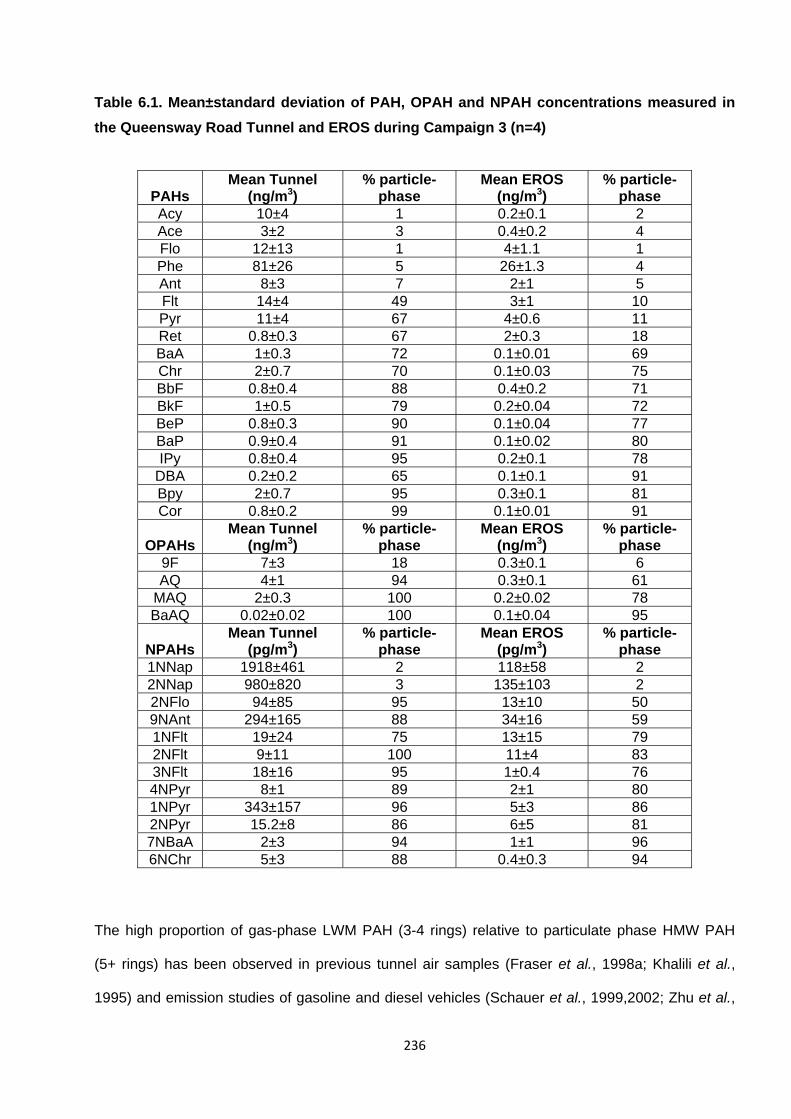
236
Table 6.1. Mean±standard deviation of PAH, OPAH and NPAH concentrations measured in
the Queensway Road Tunnel and EROS during Campaign 3 (n=4)
The high proportion of gas-phase LWM PAH (3-4 rings) relative to particulate phase HMW PAH
(5+ rings) has been observed in previous tunnel air samples (Fraser et al., 1998a; Khalili et al.,
1995) and emission studies of gasoline and diesel vehicles (Schauer et al., 1999,2002; Zhu et al.,
PAHs
Mean Tunnel (ng/m3)
% particle-phase
Mean EROS (ng/m3)
% particle-phase
Acy 10±4 1 0.2±0.1 2 Ace 3±2 3 0.4±0.2 4 Flo 12±13 1 4±1.1 1 Phe 81±26 5 26±1.3 4 Ant 8±3 7 2±1 5 Flt 14±4 49 3±1 10 Pyr 11±4 67 4±0.6 11 Ret 0.8±0.3 67 2±0.3 18 BaA 1±0.3 72 0.1±0.01 69 Chr 2±0.7 70 0.1±0.03 75 BbF 0.8±0.4 88 0.4±0.2 71 BkF 1±0.5 79 0.2±0.04 72 BeP 0.8±0.3 90 0.1±0.04 77 BaP 0.9±0.4 91 0.1±0.02 80 IPy 0.8±0.4 95 0.2±0.1 78
DBA 0.2±0.2 65 0.1±0.1 91 Bpy 2±0.7 95 0.3±0.1 81 Cor 0.8±0.2 99 0.1±0.01 91
OPAHs Mean Tunnel
(ng/m3) % particle-
phase Mean EROS
(ng/m3) % particle-
phase 9F 7±3 18 0.3±0.1 6 AQ 4±1 94 0.3±0.1 61
MAQ 2±0.3 100 0.2±0.02 78 BaAQ 0.02±0.02 100 0.1±0.04 95
NPAHs Mean Tunnel
(pg/m3) % particle-
phase Mean EROS
(pg/m3) % particle-
phase 1NNap 1918±461 2 118±58 2 2NNap 980±820 3 135±103 2 2NFlo 94±85 95 13±10 50 9NAnt 294±165 88 34±16 59 1NFlt 19±24 75 13±15 79 2NFlt 9±11 100 11±4 83 3NFlt 18±16 95 1±0.4 76 4NPyr 8±1 89 2±1 80 1NPyr 343±157 96 5±3 86 2NPyr 15.2±8 86 6±5 81 7NBaA 2±3 94 1±1 96 6NChr 5±3 88 0.4±0.3 94
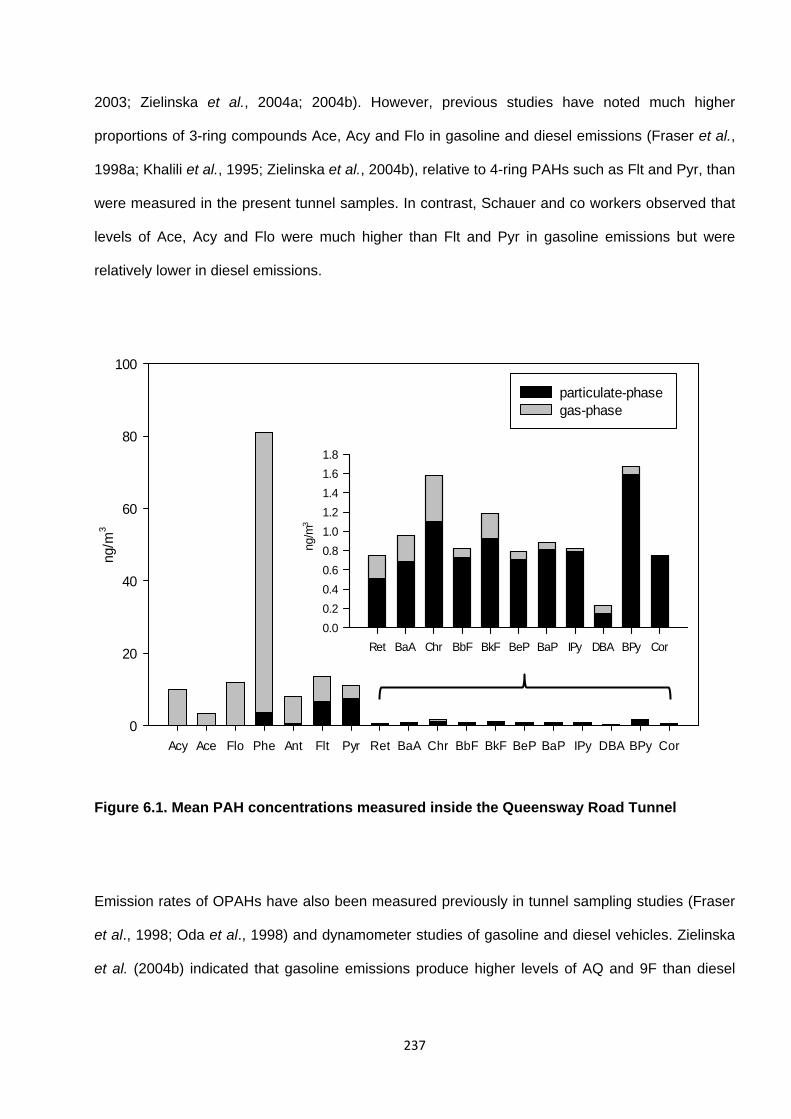
237
2003; Zielinska et al., 2004a; 2004b). However, previous studies have noted much higher
proportions of 3-ring compounds Ace, Acy and Flo in gasoline and diesel emissions (Fraser et al.,
1998a; Khalili et al., 1995; Zielinska et al., 2004b), relative to 4-ring PAHs such as Flt and Pyr, than
were measured in the present tunnel samples. In contrast, Schauer and co workers observed that
levels of Ace, Acy and Flo were much higher than Flt and Pyr in gasoline emissions but were
relatively lower in diesel emissions.
Figure 6.1. Mean PAH concentrations measured inside the Queensway Road Tunnel
Emission rates of OPAHs have also been measured previously in tunnel sampling studies (Fraser
et al., 1998; Oda et al., 1998) and dynamometer studies of gasoline and diesel vehicles. Zielinska
et al. (2004b) indicated that gasoline emissions produce higher levels of AQ and 9F than diesel
Acy Ace Flo Phe Ant Flt Pyr Ret BaA Chr BbF BkF BeP BaP IPy DBA BPy Cor
ng/m
3
0
20
40
60
80
100
particulate-phase gas-phase
Ret BaA Chr BbF BkF BeP BaP IPy DBA BPy Cor
ng/m
3
0.0
0.2
0.4
0.6
0.8
1.0
1.2
1.4
1.6
1.8
238
emissions. However, other emission studies have indicated that diesel emissions can produce
higher levels of 9F than catalyst-equipped gasoline emissions (Schauer et al., 1999, 2002).
Oda et al. (1998) measured particulate-phase emission factors for OPAHs from traffic in a road
tunnel. They indicated that particulate-phase emissions of AQ were a factor ~2 higher than 9F and
MAQ. This is consistent with the findings in the present study when only the particle phase sample
is considered. It has been shown that 9F is present mainly in the gas-phase in tunnel samples
(Fraser et al., 1998), diesel emissions (Schauer et al., 1999) and gasoline emissions (Schauer et
al., 2002), consistent with the Queensway Tunnel samples.
When gas-phase contribution is considered, the ratio of 9F to AQ in the present study was ~1.8.
Other studies indicate higher ratios (~5-50) have been observed in tunnel measurements (Fraser
et al., 1998) and gasoline emission studies (Rogge et al., 1993a; Schauer et al., 2002; Zielinska et
al., 2004b). However it should be noted that lower 9F:AQ ratios have been noted for diesel
emissions relative to gasoline emissions (Rogge et al., 1993a; Zielinska et al., 2004b). The
relatively low 9F:AQ ratio measured in this study could therefore indicate a relatively higher
contribution from diesel vehicles in the tunnel.
The parent PAH to OPAH ratio for Flo / 9F and Ant / AQ in the tunnel were ~1.7 and ~2
respectively. Lower ratios have been observed in gasoline and diesel emissions for both Flo / 9F
(Rogge et al., 1993a; Schauer et al., 1999,2002; Zielinska et al., 2004b) and Ant / AQ (Zielinska et
al., 2004b). However, much higher ratios have been noted in other tunnel studies where a mixture
of vehicles is present (Fraser et al., 1998a). It has been observed that PAH/OPAH ratios are higher
for diesel emissions than gasoline emissions (Schauer et al., 1999,2002; Zielinska et al., 2004b).
6.1.2. NPAH concentrations
Measured concentrations of NPAH compounds in the Queensway Road Tunnel, and their
distribution between the gas-phase and particle-phase are shown in Figure 6.3. 1 and 2NNap

239
isomers were the most abundant NPAHs compounds measured, predominantly present in the gas-
phase. The observed ratio of 1NNap/2NNap was ~1.8. This ratio is slightly higher than previously
observed in the same tunnel by Dimashki et al. (2000).
9F AQ MAQ BAQ
ng/m
3
0
2
4
6
8
particulate-phase gas-phase
Figure 6.2. Concentrations of OPAH compounds measured inside the Queensway Road
Tunnel in Campaign 3.
Direct vehicular emission data for NNap compounds, and relative production of 1- and 2- isomers
is lacking and is typically only available for particulate-phase emissions (Draper, 1986; Zhu et al.,
2003; Zielinska et al., 2004b). Electrophillic nitration of Nap, likely to occur during the combustion
process is expected to produce 1- and 2NNap at yields of 95% and 5% respectively (Ruehle,
1985). Therefore it would be expected for 1NNap to be present at much higher levels than 2NNap
in diesel emissions. It is indicated by some studies that the 1NNap isomer is dominant in diesel

240
emissions (Zielinska et al., 2004b) while others indicate emissions of 2NNap isomer can be higher
(Ratcliff et al., 2010).
1NPyr and 9NAnt are the dominant particle-phase NPAHs measured in the tunnel. These
compounds have been identified as the two principal NPAHs present in diesel emissions
(Campbell and Lee, 1984; Newton et al., 1982; Paputa-Peck et al., 1983; Ratcliff et al., 2010;
Schuetzle et al., 1981; Schuetzle et al., 1982; Zhu et al., 2003; Zielinska et al., 2004b).
1NNap 2NNap 2NFlo 9-NAnt 1NFlt 2NFlt 3NFlt 4NPyr 1NPyr 2NPyr 7NBaA 6NChr
pg
/m3
0
500
1000
1500
2000
2500
particulate phase gas phase
Figure 6.3. Concentrations of NPAH compounds measured inside the Queensway Road
Tunnel in Campaign 3.
241
Dynamometer studies indicate diesel vehicles produce 1NPyr at levels a factor ~2 to 6 higher than
9NAnt (Zhu et al., 2003; Zielinska et al., 2004b). However in the present study, the two compounds
are present at similar levels. This is consistent with samples previously collected in the same
tunnel by Dimashki et al. (2000). Furthermore, 9NAnt has been observed at higher concentration
than 1NPyr at high traffic locations in the ambient atmosphere (Albinet et al., 2008a; Valle-
Hernandez et al., 2010).
2NFlo was present in the tunnel at levels a factor ~3 lower than 1NPyr and 9NAnt. No previous
data on emission rates of 2-NFlo from vehicular traffic are available for comparison. Other NPAH
compounds 1NFlt, 3NFlt, 4NPyr, 7NBaA and 6NChr were identified in the tunnel at much lower
concentrations. These compounds are typically found in relatively low concentrations in diesel
emissions (Zhu et al., 2003; Zielinska et al., 2004b).
2NPyr and 2NFlt are found in relatively low levels in the tunnel. These compounds are generally
not observed in vehicular emissions and are the principal products of gas-phase (OH and/or NO3
initiated) reactions of Pyr and Flth respectively (Atkinson and Arey, 1994). The low concentration of
these compounds found in the tunnel is in agreement with previous measurements by Dimashki et
al. (2000) and is consistent with the absence of direct sunlight and low oxidant concentrations
resulting in negligible photochemical reactivity inside the tunnel. The relatively small amounts of
these compounds observed in the tunnel can probably be attributed to the migration of air from
outside of the tunnel.
However, the possible formation of gas-phase reaction products, 2NFlt and 2NPyr, as well as 1-
NNap and 2-NNap inside the tunnel has been proposed (Dimashki et al., 2000). This involves the
possible dark formation of OH radicals via the rapid conversion of NO to NO2 in diluted diesel
exhaust (Shi and Harrison, 1997). This is further discussed in Section 6.3.
242
6.1.3. Comparison with other Tunnel studies
Many previous on-road emission studies have sampled only particle-phase PAH (Chen et al.,
2013; Eiguren-Fernandez and Miguel, 2012; Marr et al., 1999; Miguel et al., 1998; Phuleria et al.,
2006). Furthermore, a large number of studies report results in terms of PAH emission factors i.e.
mass emitted per unit volume/weight of fuel consumed (Marr et al., 1999; Miguel et al., 1998) or
unit distance of vehicle travel (Fraser et al., 1998a; Kam et al., 2012; Staehelin et al., 1998).
Table 6.2 provides a comparison between PAH levels observed in the present study with three
previous investigations that measured total (particulate- + gas-phase) PAH concentrations in road
tunnel studies.
Pollutant concentrations in different locations can vary considerably due to differences in traffic
fleet composition (e.g. relative level of gasoline- and diesel-fuelled vehicles), level of traffic
congestion, fuel formulations, emission control measures (e.g. legislative requirements), tunnel
characteristics (e.g. dimensions, level of ventilation) and meteorological conditions (e.g. relative
humidity, temperature).
Benner et al. (1989) measured considerably higher levels of HMW (5+ ring) PAHs than in the
present study and the other studies. This is consistent with the relatively higher proportion of
gasoline-fuelled vehicles present in the vehicle fleet. Indeed, it was estimated that the vehicle fleet
in the Baltimore Harbour Tunnel comprised >80% gasoline-fuelled light duty vehicles. Semi-volatile
3-4 ring PAHs were also present in high relatively high concentrations in this previous study,
possibly due to the presence of a considerable proportion (>20%) of un-catalysed vehicles.
The levels of HMW PAHs are relatively low in the other studies. This suggests a lesser proportion
of gasoline-fuelled vehicles and/or similar emission control technologies being utilized in these
locations. However there is considerable variation in the relative levels of LMW (3-4 ring) species
between studies.
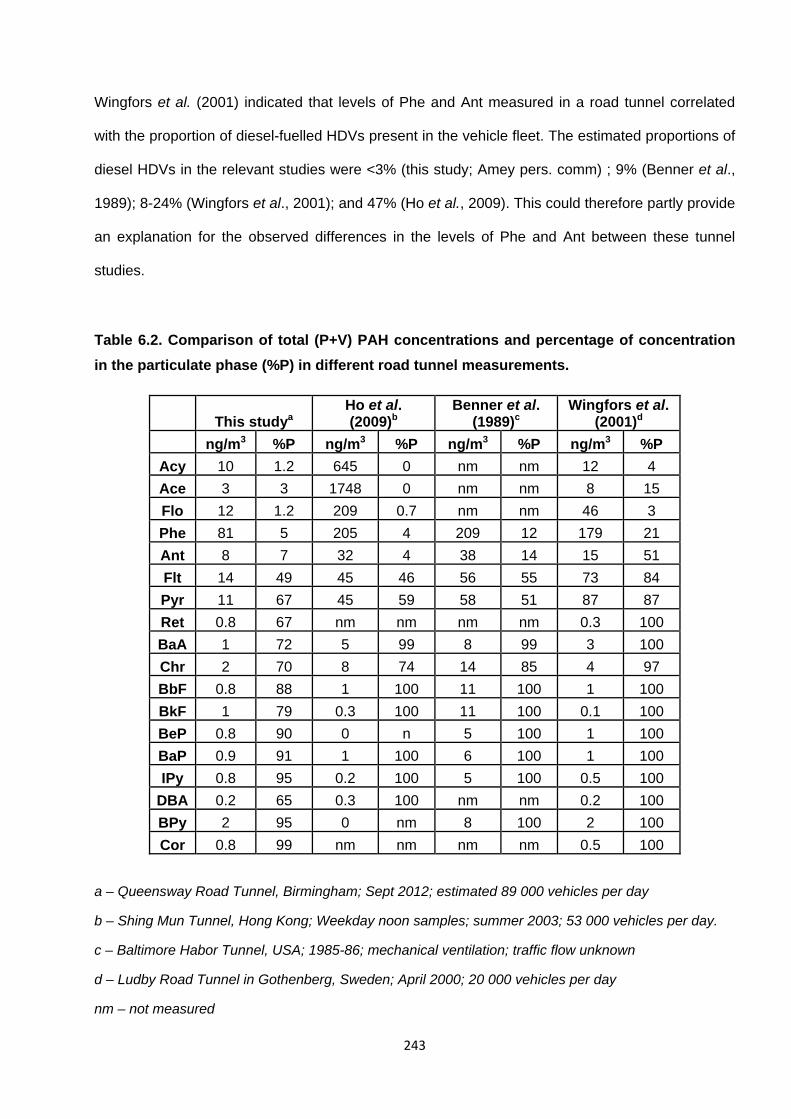
243
Wingfors et al. (2001) indicated that levels of Phe and Ant measured in a road tunnel correlated
with the proportion of diesel-fuelled HDVs present in the vehicle fleet. The estimated proportions of
diesel HDVs in the relevant studies were <3% (this study; Amey pers. comm) ; 9% (Benner et al.,
1989); 8-24% (Wingfors et al., 2001); and 47% (Ho et al., 2009). This could therefore partly provide
an explanation for the observed differences in the levels of Phe and Ant between these tunnel
studies.
Table 6.2. Comparison of total (P+V) PAH concentrations and percentage of concentration
in the particulate phase (%P) in different road tunnel measurements.
This studya Ho et al. (2009)b
Benner et al. (1989)c
Wingfors et al. (2001)d
ng/m3 %P ng/m3 %P ng/m3 %P ng/m3 %P
Acy 10 1.2 645 0 nm nm 12 4
Ace 3 3 1748 0 nm nm 8 15
Flo 12 1.2 209 0.7 nm nm 46 3
Phe 81 5 205 4 209 12 179 21
Ant 8 7 32 4 38 14 15 51
Flt 14 49 45 46 56 55 73 84
Pyr 11 67 45 59 58 51 87 87
Ret 0.8 67 nm nm nm nm 0.3 100
BaA 1 72 5 99 8 99 3 100
Chr 2 70 8 74 14 85 4 97
BbF 0.8 88 1 100 11 100 1 100
BkF 1 79 0.3 100 11 100 0.1 100
BeP 0.8 90 0 n 5 100 1 100
BaP 0.9 91 1 100 6 100 1 100
IPy 0.8 95 0.2 100 5 100 0.5 100
DBA 0.2 65 0.3 100 nm nm 0.2 100
BPy 2 95 0 nm 8 100 2 100
Cor 0.8 99 nm nm nm nm 0.5 100
a – Queensway Road Tunnel, Birmingham; Sept 2012; estimated 89 000 vehicles per day
b – Shing Mun Tunnel, Hong Kong; Weekday noon samples; summer 2003; 53 000 vehicles per day.
c – Baltimore Habor Tunnel, USA; 1985-86; mechanical ventilation; traffic flow unknown
d – Ludby Road Tunnel in Gothenberg, Sweden; April 2000; 20 000 vehicles per day
nm – not measured

244
No correlation with proportion of HDVs was found for other 3-4 ring species Ace, Acy, Flo, Flt and
Pyr, which have been observed in relatively high concentrations in diesel emissions (Ratcliff et al.,
2010; Rogge et al., 1993a; Schauer et al., 1999; Zhu et al., 2003; Zielinska et al., 2004b).
Differences in traffic numbers could potentially account for differences in observed concentrations
of these PAHs.
It should be noted that estimated traffic flow for Queensway tunnel, as provided by engineering
consultancy Amey, was ~4-5 and ~1.7 times higher than the tunnel studies by Wingfors et al.
(2001) and Ho et al. (2009) respectively. The observation of lower concentrations of 3-4 ring
species in this study compared with the other studies is therefore somewhat unexpected.
This could indicate the traffic flow in the Queensway Tunnel has been overestimated. Accurate
daily traffic data is not available for the tunnel itself and traffic counts were not performed during
sampling. Traffic counts, supplied by the Department of Transport are available for sites on the
same road approximately 200m away at either end of the tunnel , Daily traffic counts in 2012 at
these sites were ~75 000 and ~25 000 for roads to the south and north east of the tunnel
respectively. Only an unknown proportion of the traffic at these sites is expected to have passed
through the tunnel. It is assumed, based on the number of potential traffic routes/origins available,
that the lower of these traffic counts will be a better approximation of tunnel traffic flow, thus
strongly suggesting that the traffic count supplied by Amey is an overestimate.
Total PAH concentrations measured by Ho et al. (2009) were ~7 and ~20 times higher than the
Wingfors et al. (2001) study and the present study respectively. Specifically, levels of Ace and Acy
were considerably (60-600 times) higher. This was attributed to the high ratio of HDV diesel
vehicles to gasoline vehicles present in the Ho et al. (2009) study, Indeed, the diesel emission
factor was shown to be ~5 times higher than gasoline vehicles.
Wingfors et al. (2001) and Ho et al. (2009) derived emission factors for PAHs in road tunnels,
based on measured PAH concentrations, traffic numbers, tunnel dimensions and wind speed. It
can be seen in Figure 5.4 that a very good correlation (R2>0.9) is observed between measured

245
concentrations in this study and the emission factors calculated by Wingfors et al. (2001). This is
largely driven by high concentration and estimated emission factors for Phe. Correlation between
these two data sets was weaker when Phe was removed (R2~0.77).
It should be noted that, when the measured concentrations of Nap, 1MNap and 2MNap were
included in this plot, a substantial discrepancy was observed between measured tunnel
concentrations and the emission factors derived by Wingfors et al. (2001). This suggesed the
occurrence of significant evaporative loss of these 2-ring PAH compounds during sampling, as
previously suggested by Atkinson and Arey (pers. comm). Therefore, these compounds are not
considered in the results of this investigation, as detailed in Section 2.1.
Figure 6.4. Comparison of measured PAH concentrations inside the Queensway Tunnel in
the present study with tunnel emission factors derived by Wingfors et al. (2001)
Acy
AceFlo
Phe
Ant
Flt
Pyr
HMW PAHs
R² = 0.9176
0
10
20
30
40
50
60
70
80
90
0 20 40 60 80 100 120 140 160 180
Mea
sure
d T
un
nel
Co
nce
ntr
atio
n (
ng
/m3)
Literature Tunnel Emission Factor (μg/km)
246
The two tunnels were similar (vehicle speed limit of ~70 km hr -1, natural ventilation), and sampling
techniques were identical. The good agreement between measured concentrations and previous
emission factors indicates broadly similar traffic characteristics (vehicle types and fuel
compositions) and emission controls measures are influencing both tunnels.
However, it can be seen that concentrations of Flo, Flt and Pyr measured in the present study fall
below the expected level based on emission factors. This may be due to the higher proportion of
diesel HDVs present in the Swedish tunnel. No correlation was found between measured
concentrations in the Queensway Tunnel and the emission factors derived by Ho et al. (2009). This
suggests very different traffic fleet composition, emission control measures and/or fuel formulations
exist between the two location and this causes considerable differences in PAH emission profiles.
Measured concentrations of OPAHs and NPAHs in road tunnels are lacking in the literature.
NPAHs were measured previously in the Queensway Road Tunnel in 1996 by Dismashki et al.
(2000). Comparison between the two studies is discussed in detail below as this will provide an
assessment of temporal changes in traffic sources.
Gorse et al. (1983) measured 1NPyr concentrations in the Allegheny Mountain Tunnel in
Pennsylvania, USA in 1981. The maximum reported concentration was ~3 times lower than the
mean concentration measured in the present investigation. Benner (1988) measured mean
concentrations of ~0.3 ng/m3 for 1NPyr and 9NAnt in the Baltimore Harbour Tunnel in 1985, in
good agreement with the levels observed in the present study. Given that the Baltimore Harbour
Tunnel was artificially ventilated, while the Queensway Road Tunnel is not, the similar levels may
result from a higher overall traffic flow in the previous study, differences in the relative proportion of
diesel-fuelled vehicles and/or improved emission control technologies in the present study.
6.1.4. Gas-particle phase partitioning
Gas-phase compounds are shown to dominate the PAH burden in the tunnel environment,
comprising ~82% of the total PAH mass. This is broadly consistent with ambient measurements at
247
roadside locations and in other tunnel measurements (see Section 3 ; Harrad and Laurie, 2005;
Smith and Harrison, 1996; Benner et al., 1989 ; Ho et al., 2009; Fraser et al., 1998, Khalili et al.,
1995).
For example, Wingfors et al. (2001) indicated that ~81% of PAHs in a road tunnel were emitted in
the gas-phase. Zielinska et al. (2004b) also showed that the bulk of PAH emissions from gasoline
and diesel vehicles are in the gas-phase. Furthermore, Khalili et al. (1995) observed that 92% of
the measured PAH in a road tunnel in Chicago were 2-3 ring PAHs present in the gas-phase.
The relative level of PAH, OPAH and NPAH phase partitioning varies between tunnel and ambient
measurements (see Table 6.1). For most LMW 3-ring compounds and HMW 5+ ring compounds,
the proportion of compounds in the particle-phase in the tunnel is only slightly higher than that
observed at EROS. However, semi-volatile compounds (e.g. Pyr, Flt, Ret, 9F, AQ, MAQ, 2NFlo)
display markedly higher proportions in the particle-phase in the tunnel than in the ambient
atmosphere. The phase partitioning behaviour of PAH, OPAH and NPAH as a function of
compound MW is therefore markedly different for the tunnel and ambient samples (see Figure 6.5)
with greater proportions of each compound class present in the particulate phase.
Higher particulate-phase contributions may reflect more dominant role of direct emissions from
vehicles in the tunnel, which may be associated to a greater extent with fine particles (Albinet et al.,
2008b; Zielinska et al., 2004a). Zielinska et al. (2004a) investigated phase partitioning of PAHs
from diesel and gasoline vehicles. They found that Flt and Pyr were predominantly in the gas-
phase when vehicles were idle or at low engine loads but at higher vehicle load, a much larger
proportion of these compounds were present in the particulate phase, particularly for diesel
vehicles. This could indicate vehicles in the tunnel were operating under relatively higher load, thus
contributing to higher particulate concentrations of these compounds.
However, Ret has been shown to display an emission factor >250 times smaller than Flt and Pyr in
a road tunnel (Wingfors et al., 2001), and is typically a marker for wood combustion (Ramdahl,
1983). In this study Ret concentrations in the tunnel were lower than observed at EROS (see

248
Section 5.3). This indicates the dominant source of Ret is not road traffic and transportation of Ret
from the ambient atmosphere outside the tunnel may be responsible for observed concentrations.
MW
140 160 180 200 220 240 260 280 300 320
% p
artic
ulat
e-ph
ase
0
20
40
60
80
100
MW
160 180 200 220 240 260 280
% p
artic
ulat
e ph
ase
0
20
40
60
80
100
MW
160 180 200 220 240 260 280
% p
artic
le p
hase
0
20
40
60
80
100
Figure 6.5. Plots of % of component in the particulate phase vs. molecular weigh for a)
PAHs, b) OPAHs and c) NPAHs, measured in the tunnel (black dots, solid black line) and at
EROS (white dots, dotted line).
249
If this is the case, it would suggest the tunnel environment (enclosed location, low ventilation rate
and an assumed low, constant temperature) facilitates a more rapid partitioning of semi-volatile
species to the particulate-phase than the ambient atmosphere (Kam et al., 2012). Furthermore it is
noted that the concentration TSP in the tunnel was ~4-5 times higher than the annual mean at
EROS. Ambient measurements will represent a more ‘aged’ PAH profile with contributions from
other combustion sources and variations in meteorological conditions (e.g. temperature) which
may drive partitioning into the gas-phase.
Ho et al. (2009) and Benner et al. (1989) measured similar distribution of partitioning for 4-ring
PAH in tunnel sampling studies. Wingfors et al. (2001), utilizing the same sampling technique as
used in this study, found higher relative concentrations in the particle-phase for Flt and Pyr, with
~84% and ~89% measured in the particulate phase respectively, compared with 49% and 67% in
the present study. This may be attributed to higher levels of TSP, which were ~6 times higher in
the Swedish tunnel than in the present study.
As indicated in Section 4.1, PAH partitioning at EROS appears to be approaching equilibrium
behaviour. However, the situation was more unclear in the case of NPAH and OPAH compounds.
The difference in partitioning behaviour between tunnel and ambient environments could possibly
be attributed to compounds in the tunnel atmosphere representing a freshly emitted air mass
where compounds have not reached partitioning equilibrium. To test this theory, as in Section 4.1,
plots of log Kp vs log PLo were produced for both tunnel and EROS samples. While the slopes for
EROS plots were each approximately -1, the plots for tunnel samples produced more variable
slopes, ranging from -0.5 to -1.1. This variation in slope values and the relatively small number of
samples taken in this campaign mean is unclear how the difference in equilibrium conditions
influences the gas-particle partitioning of PAHs in the tunnel.
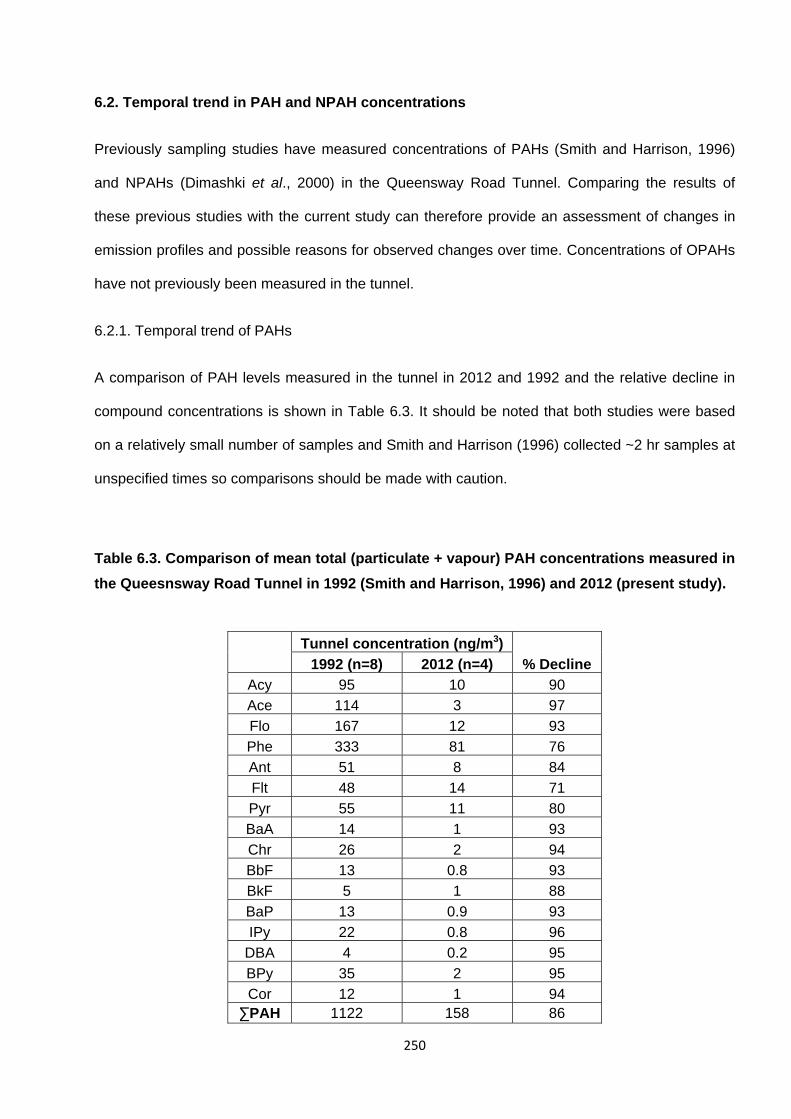
250
6.2. Temporal trend in PAH and NPAH concentrations
Previously sampling studies have measured concentrations of PAHs (Smith and Harrison, 1996)
and NPAHs (Dimashki et al., 2000) in the Queensway Road Tunnel. Comparing the results of
these previous studies with the current study can therefore provide an assessment of changes in
emission profiles and possible reasons for observed changes over time. Concentrations of OPAHs
have not previously been measured in the tunnel.
6.2.1. Temporal trend of PAHs
A comparison of PAH levels measured in the tunnel in 2012 and 1992 and the relative decline in
compound concentrations is shown in Table 6.3. It should be noted that both studies were based
on a relatively small number of samples and Smith and Harrison (1996) collected ~2 hr samples at
unspecified times so comparisons should be made with caution.
Table 6.3. Comparison of mean total (particulate + vapour) PAH concentrations measured in
the Queesnsway Road Tunnel in 1992 (Smith and Harrison, 1996) and 2012 (present study).
Tunnel concentration (ng/m3)
% Decline 1992 (n=8) 2012 (n=4)
Acy 95 10 90
Ace 114 3 97
Flo 167 12 93
Phe 333 81 76
Ant 51 8 84
Flt 48 14 71
Pyr 55 11 80
BaA 14 1 93
Chr 26 2 94
BbF 13 0.8 93
BkF 5 1 88
BaP 13 0.9 93
IPy 22 0.8 96
DBA 4 0.2 95
BPy 35 2 95
Cor 12 1 94 ∑PAH 1122 158 86
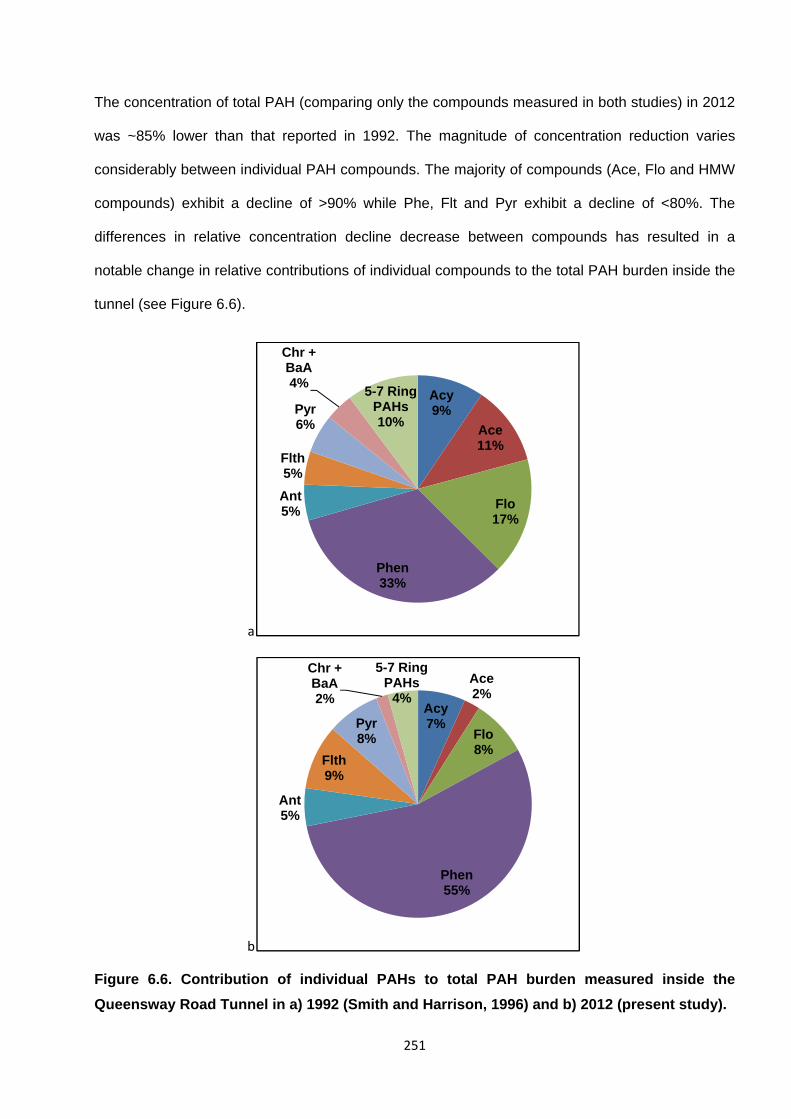
251
The concentration of total PAH (comparing only the compounds measured in both studies) in 2012
was ~85% lower than that reported in 1992. The magnitude of concentration reduction varies
considerably between individual PAH compounds. The majority of compounds (Ace, Flo and HMW
compounds) exhibit a decline of >90% while Phe, Flt and Pyr exhibit a decline of <80%. The
differences in relative concentration decline decrease between compounds has resulted in a
notable change in relative contributions of individual compounds to the total PAH burden inside the
tunnel (see Figure 6.6).
a
b
Figure 6.6. Contribution of individual PAHs to total PAH burden measured inside the
Queensway Road Tunnel in a) 1992 (Smith and Harrison, 1996) and b) 2012 (present study).
Acy9%
Ace11%
Flo17%
Phen33%
Ant5%
Flth5%
Pyr6%
Chr + BaA4%
5-7 Ring PAHs10%
Acy7%
Ace2%
Flo8%
Phen55%
Ant5%
Flth9%
Pyr8%
Chr + BaA2%
5-7 Ring PAHs
4%
252
The NAEI provides an estimate for emissions of individual PAH compounds from both gasoline-
and diesel-fuelled urban vehicular traffic (Figure 3.9, Section 3.4). Estimated total emission decline
from urban traffic over this time are shown to range from 23% and 70% for different PAHs with
HMW compounds displaying more pronounced decreases than LMW compounds. It is indicated
that the observed decline in PAH concentrations in the Queensway Road Tunnel between 1992
and 2012 is generally higher than predicted by the NAEI emission estimates.
However, emissions from gasoline vehicles only are shown to be relatively high (>65%) for most
compounds over this time period. The relative reduction in diesel-fuel emissions over this time is
shown to be generally lower and more variable between species. It should be noted that the
emission inventory estimates are subject to a degree of uncertainty and that a national estimate
may not be directly comparable with measurements in a specific traffic location.
Historical reduction in PAH levels have been reported previously in road tunnel studies (Benner et
al., 1989; Eiguren-Fernandez and Miguel, 2012). A number of factors have been shown to be
responsible for reduction of PAHs from road vehicles. These include changes to fuel formulations
(Westerholm and Egebäck, 1994) e.g. uses of biofuels (Ratcliff et al., 2010) or use of additives to
enhance the cetane or octane number (Williams et al., 1986; Zhu et al., 2003); innovations in
engine design e.g. use of three-way catalysts (Rogge et al., 1993a; Schauer et al., 2002;
Westerholm and Egebäck, 1994; Zielinska et al., 2004b) and improvement in exhaust emission
control measures e.g. particulate filters (Hu et al., 2013), with their implementation being principally
driven by increasingly strict government legislation (Perrone et al., 2014). Other factors e.g. state
of vehicle maintenance and ambient conditions (temperature) of the vehicle are also shown to
influence PAH emissions from road traffic (Zielinska et al., 2004b).
For example, Eiguren-Fernandez and Miguel (2012) calculated emission factors (EFs) for particle-
phase PAH in the Caldercott Tunnel in Berkeley, California, where emissions from gasoline-fuelled
LDVs and diesel-fuelled HDVs could be measured separately. EFs calculated were 9 and 17 times
lower in 2004 than had been measured in the same tunnel in 1997 (Marr et al., 1999) for HDV and

253
LDV vehicles respectively. This was attributed to reformulated gasoline fuel and removal of older,
higher-emitting vehicles from the fleet over this period (Phuleria et al., 2006).
The reduction of PAH levels on the Queensway Road Tunnel can be attributed, to a large degree,
to the introduction of mandatory catalytic converters to the UK in 1993. Catalytic converters have
been shown to reduce the emissions of PAHs in gasoline-fuelled vehicles by 92-99% and
reductions in OPAHs by ~79-97% (Rogge et al., 1993a; Schauer et al., 2002; Westerholm and
Egebäck, 1994; Zielinska et al., 2004b). For example, Benner et al. (1989) measured PAH
concentrations in the Baltimore Harbour Tunnel, USA, a factor 5-10 lower than a study conducted
10 years earlier (Fox and Stanley, 1976). This was attributed to the introduction of catalytic
converters which were first used in the USA in 1974.
Figure 6.6 indicates that three compounds display an increase in relative contribution to total PAH
burden in the tunnel; Pyr and Flth show relatively small increases while Phe which displays a larger
increase. Other PAHs have reduced contributions compared with 1992 levels. The combined
contribution of (Phe + Flt + Pyr) to ƩPAH burden has increased from ~44% in 1992 to ~72% in
2012.
The composition of the vehicle fleet has a major influence on the PAH emission profile. As
discussed in previous sections, a large number of tunnel sampling and chassis dynamometer
studies have identified the differences in PAH emission profiles for gasoline and diesel fuelled
vehicles (Westerholm and Egebäck, 1994; Zielinska et al., 2004b).
Gasoline-fuelled vehicles shown to emit higher levels of HMW compounds e.g. BaP, IPy, BPy, Cor
(Marr et al., 1999; Miguel and Pereira, 1989; Miguel et al., 1998; Perrone et al., 2014), while diesel
is generally shown to be a greater source of semi-volatile compounds such as Phe, Flt, and Pyr
(Chen et al., 2013; Harrison et al., 1996; Miguel et al., 1998; Perrone et al., 2014). The results
presented here may therefore be indicative of a more important role of diesel emissions to the total
PAH burden than was observed in 1992.
254
However, it has been indicated that different stages of EU legislation on new vehicle emission
limits (91/441/EEC) has resulted in progressively reduced PAH emissions from both gasoline and
diesel since 1993 (Perrone et al., 2014). This may explain why, despite the stronger association
with diesel exhaust, concentrations of LMW PAHs such as Phe have also decreased significantly,
albeit to a lesser degree than gasoline-related compounds.
6.2.2. The driving force behind emission changes
The number of vehicles on the road in Great Britain increased by over 10 million between 1992
and 2012, mostly due to passenger cars, taxis and vans (DfT, 2014).
This period has also seen a notable shift in the relative distribution of gasoline- and diesel-fuelled
vehicles in the traffic fleet (Figure 6.7). While there has been a modest (~500,000) decrease in the
number of gasoline-fuelled cars in Great Britain since 1994, the number of diesel-fuelled
passenger cars has increased by ~7.8 million. This trend has seen the relative proportion of diesel
cars in the traffic fleet increase from ~7% in 1994 to ~33% in 2012 (DfT, 2014).
This change has largely come about because diesel-fuelled vehicles have become more popular.
Diesel vehicles tend to display a superior fuel economy, therefore making them cheaper to run, as
well as producing lower emission CO2. Cars with lower CO2 emissions fall into cheaper Vehicle
Excise Duty (car tax) bands. This provides the consumer with a financial incentive to purchase
diesel cars. Furthermore, the legally binding EU CO2 emission targets give the car manufacturers
further incentive to bring lower emission vehicles, such as diesel cars into the market at
competitive prices.
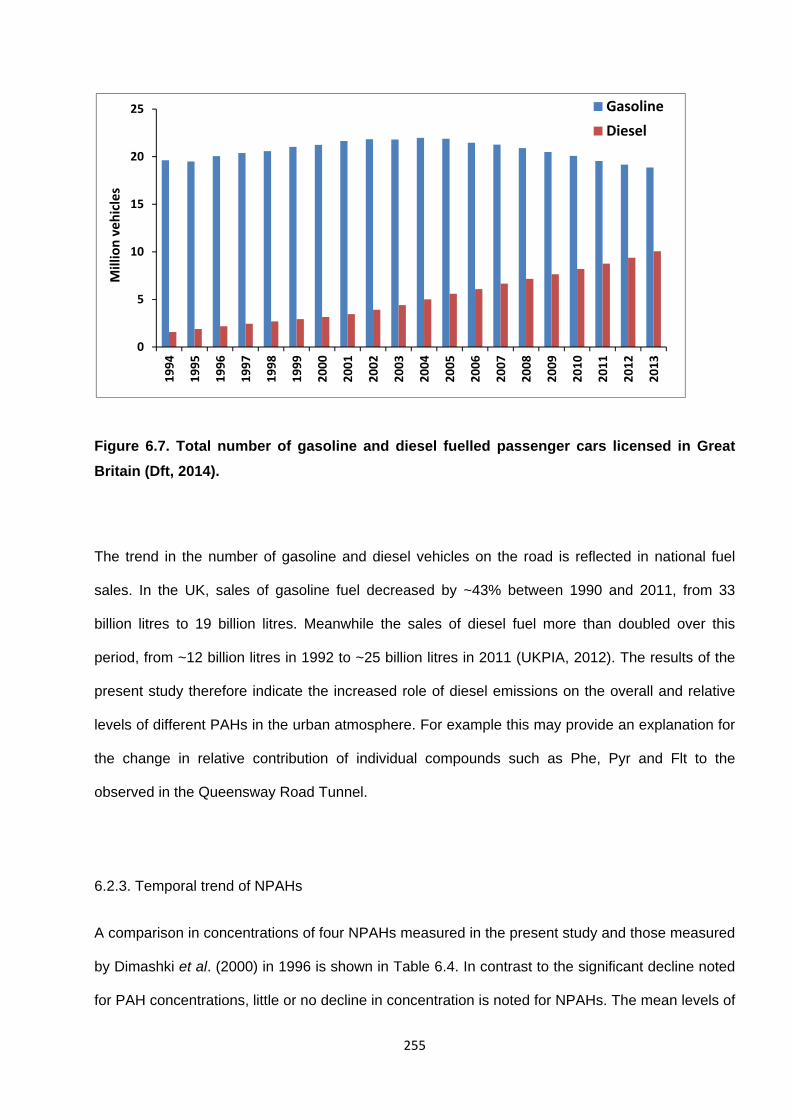
255
Figure 6.7. Total number of gasoline and diesel fuelled passenger cars licensed in Great
Britain (Dft, 2014).
The trend in the number of gasoline and diesel vehicles on the road is reflected in national fuel
sales. In the UK, sales of gasoline fuel decreased by ~43% between 1990 and 2011, from 33
billion litres to 19 billion litres. Meanwhile the sales of diesel fuel more than doubled over this
period, from ~12 billion litres in 1992 to ~25 billion litres in 2011 (UKPIA, 2012). The results of the
present study therefore indicate the increased role of diesel emissions on the overall and relative
levels of different PAHs in the urban atmosphere. For example this may provide an explanation for
the change in relative contribution of individual compounds such as Phe, Pyr and Flt to the
observed in the Queensway Road Tunnel.
6.2.3. Temporal trend of NPAHs
A comparison in concentrations of four NPAHs measured in the present study and those measured
by Dimashki et al. (2000) in 1996 is shown in Table 6.4. In contrast to the significant decline noted
for PAH concentrations, little or no decline in concentration is noted for NPAHs. The mean levels of
0
5
10
15
20
25
1994
1995
1996
1997
1998
1999
2000
2001
2002
2003
2004
2005
2006
2007
2008
2009
2010
2011
2012
2013
Million vehicles
Gasoline
Diesel

256
NNap isomers measured in the tunnel in 2012 fall within the range of concentrations measured in
1996. The concentrations of 9NAnt and 1NPyr display levels only slightly lower (within 1 standard
deviation) than the lower range of concentrations measured by Dimashki et al. (2000). The
previous measurements were made on only one sampling day, while the current study is the
average of four separate sampling days so comparison of results must be done with caution.
Nevertheless, this observation is striking.
Table 6.4. Comparison of total (particulate + vapour) NPAH concentrations measured in the
Queensway Tunnel in 1996 (Dimashki et al., 2000) and 2012 (present study).
Tunnel concentration (pg/m3)
2012 (This Study) 1996 (Dimashki et al., 2000)
1NNap 1918±461 560-2120
2NNap 980±820 620-1570
9NAnt 294±165 370-760
1NPyr 343±157 440-690
To our knowledge, this is the first study to investigate temporal variations in traffic profiles of
NPAHs. 1NNap, 2NNap, 9NAnt and 1NPyr are all present in diesel exhaust emissions in relatively
high levels (Campbell and Lee, 1984; Draper, 1986; Paputa-Peck et al., 1983; Zhu et al., 2003)
and are present in low/negligible emissions from gasoline vehicles (Zielinska et al., 2004b).
The difference between the temporal trends observed for NPAH compared with PAH may therefore
be associated with the greater contribution of diesel vehicles to NPAH compounds. The overall and
relative increase in diesel vehicles in the traffic fleet since 1996 may therefore account for a lack of
decrease in NPAH concentrations.
Evidence for the increased importance of NPAH over time in urban air has been indicated
previously. For example, Matsumoto et al. (1998) noted the concentration of BaP declined
257
significantly in the period 1975 to 1992 in the heavily trafficked region of Sapporo, Japan, while the
mutagenicity of collected particles remained unchanged. The authors suggested this could be
attributed to an increase in diesel traffic and the possible associated increase in NPAH
concentrations.
The lack of increase in observed NPAH levels in the tunnel over this time may suggest that while
the volume of diesel traffic has increased, the net emissions of NPAHs from diesel vehicles may
have declined. Indeed, improved engine design (e.g. use of catalytic devices or particulate traps)
and fuel formulation has been shown to reduce NPAH and OPAH concentrations as well as PAH
(Fiedler and Mücke, 1991; Marinov et al., 2009; Nielsen et al., 1999; Ratcliff et al., 2010;
Westerholm and Egebäck, 1994; Zhu et al., 2003).
Perrone et al. (2014) indicated that increasingly stringent EU legislation on exhaust emissions of
new vehicles (91/441/EEC) since 1993 has led to decreases in PAH emissions from both gasoline
and diesel vehicles. Therefore, it may be expected that a decrease in NPAH emissions may have
also resulted. However, as yet emission studies on NPAH have not been conducted to confirm this.
The results of the present study suggest the temporal variation in NPAH concentrations in the
Queensway Road Tunnel have been influenced by competing factors : i) an increase in the number
of diesel vehicles on U.K roads, and ii) a net reduction in emissions from individual diesel vehicles
in response to changes in fuel formulation and engine/exhaust system design.
Despite these observations being based on a small number of relatively small sampling
campaigns, it is indicated that the relative concentration of NPAH in vehicular emissions relative to
PAHs has increased considerably in the past 20 years. For example, the ratio of 1NPyr to BPy in
Queensway Tunnel samples in the present study (~0.16) is an order of magnitude higher than the
ratio using the concentrations of 1NPyr and BPy reported by Dimashki et al. (2000) and Smith and
Harrison (1996) for concentrations in 1996 and 1992 (0.016).
258
6.3. Comparison of tunnel vs. ambient concentrations
6.3.1. Overview
It is assumed that concentrations of PAHs, OPAHs and NPAHs measured in the tunnel will result
entirely from the emissions of gasoline and diesel traffic. Comparing levels of compounds
measured in the tunnel with those observed in the ambient atmosphere (tunnel/ambient ratios) will
allow the assessment of other influences (e.g. non-traffic sources, relative rates of loss processes)
potentially affecting their overall and relative concentrations in the urban atmosphere.
The ratios between mean concentrations measured in samples from the Queensway Road Tunnel
to those measured simultaneously at EROS are shown in Figure 6.8. It can be seen that these
ratios vary considerably for different individual compounds. This section discusses these
differences and the possible explanations for the observed variations. It should be noted that these
ratios represent the mean concentrations measured on only 4 individual sampling days, therefore
may not necessarily be representative of compound behaviour over longer time scales.
For most PAHs, OPAHs and NPAHs, concentrations are higher in the tunnel environment than
were measured at the ambient background location. Total PAH concentration was ~4.5 times
higher in the tunnel than the mean concentration at ambient EROS. This is generally consistent
with the lower rate of dispersion and lower chemical reactivity expected in the tunnel environment.
Similar observations have been noted in previous studies. Kim et al. (2012) noted that PAH
concentrations were ~6 and 10 times higher in the Bukak Tunnel in Seoul, South Korea, than were
measured at an ambient roadside location during spring and winter respectively. Similarly,
Wingfors et al. (2001) also noted total PAH concentrations in the Ludby Tunnel in Gothenburg,
Sweden were an order of magnitude higher than those measured in heavily trafficked urban areas.
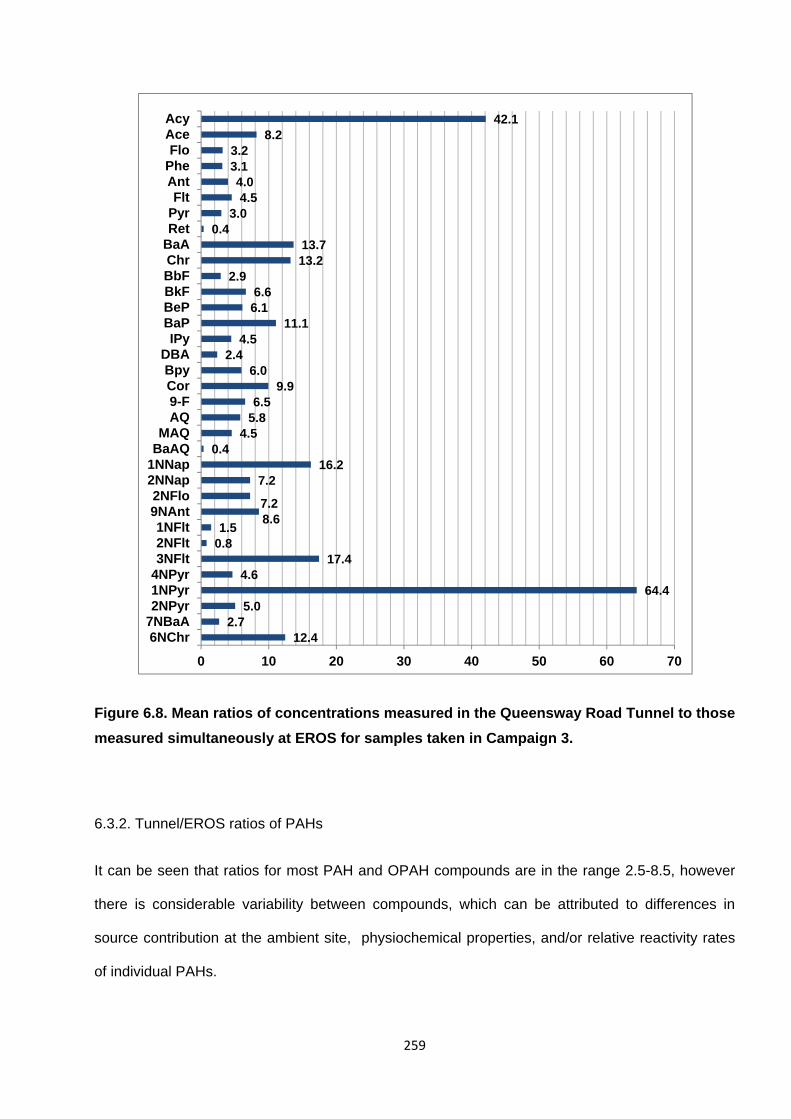
259
Figure 6.8. Mean ratios of concentrations measured in the Queensway Road Tunnel to those
measured simultaneously at EROS for samples taken in Campaign 3.
6.3.2. Tunnel/EROS ratios of PAHs
It can be seen that ratios for most PAH and OPAH compounds are in the range 2.5-8.5, however
there is considerable variability between compounds, which can be attributed to differences in
source contribution at the ambient site, physiochemical properties, and/or relative reactivity rates
of individual PAHs.
12.42.7
5.064.4
4.617.4
0.81.5
8.67.2
7.216.2
0.44.5
5.86.5
9.96.0
2.44.5
11.16.16.6
2.913.213.7
0.43.0
4.54.0
3.13.2
8.242.1
0 10 20 30 40 50 60 70
6NChr7NBaA2NPyr1NPyr4NPyr3NFlt2NFlt1NFlt
9NAnt2NFlo
2NNap1NNapBaAQMAQ
AQ9-FCorBpy
DBAIPy
BaPBePBkFBbFChrBaARetPyrFlt
AntPheFlo
AceAcy

260
Reaction with OH is expected to be the dominant loss process for gas-phase LMW PAHs in the
ambient atmosphere (Atkinson and Arey, 1994; Brubaker and Hites, 1998). However, as was
observed with the diurnal pattern of these compounds, no trend was observed between [tunnel] /
[ambient] concentration ratios and experimentally derived rate coefficients for gas-phase reaction
towards OH. This suggests the ambient concentrations at BROS and EROS are influenced by
other potential input and/or loss factors.
The only PAH compound to exhibit a tunnel/ambient ratio of <1 was Ret. This is consistent with
this compound resulting primarily from wood combustion rather than road traffic (Bari et al., 2010;
Fine et al., 2002; McDonald et al., 2000; Ramdahl, 1983). Indeed, PMF analysis (see Section 3.7)
suggested this Ret concentrations at the ambient sites result primarily from this source. Ret has
not been measured in traffic exhaust emissions, however Wingfors et al. (2001) did measure very
low levels of Ret in a road tunnel, suggesting a small contribution from vehicle emissions or
transfer of air from outside of the tunnel.
LMW (3-4 ring) compounds Flo, Phe, Ant, Flth, Pyr display relatively low (3 – 4.5) tunnel/ambient
ratios. Given that these compounds, are expected to be relatively abundant in traffic emissions this
observation is somewhat surprising. For example, Phe, Flt and Pyr are the dominant PAHs in
diesel exhaust (Ratcliff et al., 2010 ; Zhu et al. , 2003) and therefore may be expected to display
enhanced ratios.
However, PMF analysis indicated that <45% of Phe, Flt and Pyr measured at the ambient sites
result from traffic. The abundance of non-traffic sources at the ambient sites e.g. wood combustion
or revolatilisation of pollutants from road and or soil/vegetation surfaces, may therefore explain the
relatively low ratios of these compounds.
Interestingly, the tunnel/ambient ratio of Flt is higher than that of Pyr, despite higher OH reactivity
noted for Pyr relative to Flt (Atkinson et al., 1990a; Bari et al., 2010; Brubaker and Hites, 1998;
Fine et al., 2002; McDonald et al., 2000; Ramdahl, 1983).
261
It was noted in Section 3.2 that the positive correlation between NOx-corrected concentration and
temperature was observed for Pyr but not Flt, suggesting Pyr concentrations at EROS may be
‘buffered’ by volatilisation from soil or vegetation surfaces to a much greater degree than Flt
resulting in lower tunnel/ambient ratio. This may account for lower tunnel/ambient ratios for Pyr
relative to Flt.
The tunnel/ambient ratio of Acy was considerably higher than those of other PAHs. This is
consistent with relatively high gas-phase OH reactivity of this compound (Brubaker and Hites,
1998; Reisen and Arey, 2002). The lack of direct sunlight inside the tunnel is likely to result in
minimal reactivity, leading to enhanced ratios.
However, while Ant is shown to display similarly fast reactivity towards OH (Brubaker and Hites,
1998), the observed tunnel/ambient ratio is relatively lower than expected. This may suggest the
ambient concentration of these PAHs is influenced by non-traffic sources, either primary or non-
combustion related, as indicated by the seasonal (Section 3.3) and diurnal (Section 5) profiles of
this compound.
Ace displays relatively high tunnel/ambient ratios compared with other semi-volatile PAHs. This
observation indicates a dominant traffic input at the ambient sites in these samples. This is
consistent with the diurnal pattern observed for of Ace (Section 5). However the [BROS] – [EROS]
traffic profile (Section 3.1) and temporal trend (Section 3.4) suggests the Ace concentration at the
ambient sites is influenced significantly by a non-traffic seasonally-mediated source. PMF analysis
suggested Ace concentrations are dominated by a specific source attributed to volatilisation from
road surfaces, however it was noted that this does not account for the seasonal profile in Ace
concentrations, suggesting a possible additional contribution from a domestic combustion source.
Most HMW PAHs (MW>228) display relatively high tunnel/ambient ratios compared with most
LMW PAHs. BaA and Chy display particularly high ratios compared with other PAHs. Which may
reflect a relatively low contribution of non-traffic related source of these compounds at the ambient
262
sites, as indicated by PMF analysis for Chr (see Section 3.7), and/or the additional influence of
heterogeneous reactivity influencing these compounds.
The relative differences in tunnel/ambient ratios between these compounds may be attributed to
the relative stability of these compounds and/or the relative contribution of non-traffic sources to
their ambient concentrations. For example, BaP displays a relatively higher ratio compared with
other 5 ring PAH compound, despite PMF analysis attributing a significant proportion of BaP
concentration to ambient concentrations at these sites (Section 4.3). This may be attributed to
greater susceptibility of BaP to heterogeneous reactivity in the ambient atmosphere (Perraudin et
al., 2007).
DBA displays a relatively low tunnel/ambient ratio. This is consistent with a relatively low input from
road traffic, as indicated by Jang et al. (2013) who assessed a ‘traffic’ profile at London monitoring
sites, and may indicate an alternative seasonally-dependent combustion source influencing the
ambient sites. BbF also displays a relatively low tunnel/ambient ratio despite PMF analysis
suggesting a relatively high (~62%) contribution from traffic at the ambient sites. This observation
is therefore somewhat unexpected.
6.3.3. Tunnel/EROS ratios of OPAHs
The OPAHs 9F, AQ and MAQ display higher tunnel/ambient ratios than those of most semi-volatile
3-4 ring PAH compounds.
It has been indicated in Section 3, 4 and 5, that concentrations of 9F, AQ and MAQ may be
influenced by secondary input due to volatilisation from surfaces, wood combustion and/or
chemical reactivity between sites. Indeed, the PMF analysis performed for AQ indicates a
contribution from traffic of ~50% at these sites. However, the relatively high ratios suggest that
concentrations at the ambient sites are dominated by traffic emissions and that non-traffic sources
(both primary and secondary) do not control the concentrations of these compounds.
263
It has been demonstrated that particulate-phase OPAH are relatively stable towards photolysis but
are shown to decay when exposed to ozone with half lives on wood smoke particles of 80-200
mins (Kamens et al., 1989). However, it is noted that O3 concentrations used in this experiment
were >10 times higher than the atmospheric O3 concentration observed in this study. It is
suggested, therefore that OPAH concentrations are not influenced significantly by photolytic or
reactive losses between BROS and EROS.
The low (<1) ratios observed for BaAQ indicate that this compound is not emitted to a significant
degree by road vehicles and is present in much higher levels in the ambient atmosphere. This
suggests levels of this compound observed at BROS and EROS result primarily from a non-traffic
combustion source such as natural gas home appliances (Rogge et al., 1993c) or uncontrolled
domestic waste combustion (Sidhu et al., 2005). However, it should also be noted that a
statistically significant ‘traffic increment’ was observed for this compound.
6.3.4. Tunnel/EROS ratios of NPAHs
NPAHs generally display higher tunnel/ambient ratios than unsubstituted PAHs, although, as noted
with PAHs there is wide variability between individual compounds.
Relatively high ratios were observed for 1NNap, 2NNap, 2NFlo, 9NAnt, 3NFlt, 1NPyr and 6NChy.
These compounds are expected to be predominantly associated with diesel exhaust emissions
(Ball and Young, 1992; Campbell and Lee, 1984; IARC, 1983 ; Paputa-Peck et al., 1983;
Rappaport et al., 1982; Schuetzle et al., 1982; Schuetzle and Perez, 1983; Zhu et al., 2003;
Zielinska et al., 2004a; 2004b) with lower input from other combustion sources (WHO, 2000).
The principal atmospheric loss process for NPAHs is expected to be photolysis (Atkinson et al.,
1989; Fan et al., 1995; 1996a; 1996b; Phousongphouang and Arey, 2003a). This process is not
expected to occur significantly in the tunnel environment where direct sunlight is absent. The high
264
ratios may therefore reflect the relative lack of non-traffic input of these compounds in the ambient
atmosphere and the rapid photolytic and/or reactive losses in the ambient atmosphere.
Indeed, both PMF analysis of 1NPyr and 1NNap concentrations indicate the strong influence of
diesel emissions for these compounds at the ambient sites and the relatively low (3% and 18%
respectively) from non-traffic sources. The extremely high tunnel/ambient ratio observed for 1NPyr
in summer at EROS suggests this compound is the most susceptible to photolytic degradation.
Relatively few quantitative data are available for NPAH loss rates due to photolysis.
While Fan et al. (1996a) indicated the structure of particle-associated NPAH compounds does not
influence the rate of degradation, it has been suggested elsewhere that the isomeric structure of
the compound does influence the rate of photolytic decay (Pitts, 1983). For example, Holloway et
al. (1987) and Feilberg and Nielsen (2000) have indicated 1NPyr decays up to 10 times more
rapidly than other MW 247 NPAHs.
Previously, Dimashki et al. (2000) observed levels of 1NPyr and 9NAnt in the tunnel were ~6 and
~2 times higher in the Queensway Road Tunnel than in the ambient atmosphere of Birmingham
respectively. The ambient sampling in this previous study was conducted in central Birmingham
during winter.
The Tunnel/EROS ratio in the present study is shown to be a factor ~10 and ~4.5 higher than the
previous study for 1NPyr and 9NAnt respectively. This may partly be attributed to higher input of
pollutants in the city centre compared to the background University site and the fact that sampling
in the present study was conducted in the late summer/early autumn with associated higher
temperatures leading to potentially higher degradation rates in the ambient atmosphere.
The tunnel/ambient ratio of 1NNap is a factor ~2.2 higher than 2NNap. Experimental studies
indicate 1NNap will exhibit a rate of photolysis ~1.3 – 8 times higher than that of 2NNap (Atkinson
et al., 1989; Niu et al., 2005; Phousongphouang and Arey, 2003a). This would suggest the
observed difference in ratios for the two NNap isomers is due to differences in the rates of
photolytic degradation and the relatively long exposure time of air samples collected at EROS.

265
NNap isomers are also shown to originate from secondary reactions from OH and NO3 reactions.
The yield of 1NNap resulting from NO3 reactions with Nap has been shown to be higher (17%)
than for 2NNap (7%) (Atkinson et al., 1989). However, it is indicated from diurnal profiles (see
Section 4) that NO3 reactivity is of minor importance to these compounds at these sampling sites.
NNap photolysis is rate is likely to be much faster than the reaction rate of Nap with OH (Atkinson
and Arey, 1994) so it is suggested this process is not likely to have a substantial impact on
observed tunnel/ambient ratios.
The relatively low ratios observed for 1NFlt and 7NBaA indicate only a minor contribution from
traffic for these compounds at the ambient sites. There is almost a complete absence of previous
sampling (Bamford and Baker, 2003) and source emissions data available for 1NFlt. 7NBaA has
been measured in vehicular emissions (Karavalakis et al., 2009; Zhu et al., 2003). However, the
previous study in Birmingham did not detect this compound in the Queensway Road Tunnel but did
observe measureable levels in the city centre (Dimashki et al., 2000).
2NFlt and 2NPyr are expected to result from atmospheric reactions with minor input from road
traffic (Atkinson and Arey, 1994). A tunnel/ambient ratio of <1 was observed for 2NFlt, consistent
with low reactivity chemical in the tunnel. However, 2NPyr displays a ratio of ~5 which is
unexpected. While relatively higher concentrations inside the tunnel may have been caused by
transport of pollutants from outside the tunnel, this may not account for the relatively high ratio
observed for 2NPyr
It has been suggested that OH can be generated in-situ via the rapid conversion of NO to NO2 ,
that can take place in the absence of light in dilute vehicle emissions (Shi and Harrison, 1997).
The proposed sequence of reactions would be initiated by diene components found in gasoline
vehicle exhaust reacting with oxygen :
R + O2 → RO2 (R=conjugated diene component)
RO2 + NO2 → NO2 + RO

266
RO + O2 → R’CHO + HO2
HO2 + NO → NO2 + OH
It is possible, therefore, that OH reactivity may occur inside the tunnel despite the absence of direct
sunlight. However, more work is clearly required to establish if these reactions do indeed result in
NPAH formation.
It is not expected that gas-phase reactivity will not contribute significantly to the levels of 1NNap
and 2NNap present in the tunnel, even if significant in-situ OH formation occurred as formation
yields from OH-initiated reactions are relatively low (~1%) compared with NO3-initiated reactions
(7-24%) (Atkinson and Arey, 1994). The high NO levels expected in the tunnel would result in very
low NO3 concentrations.
267
Chapter 7. Summary and conclusions
7.1. Investigation summary
In this investigation the airborne concentrations of PAH, OPAH and NPAH compounds have been
measured at ambient sites in trafficked and urban background locations and inside a road traffic
tunnel. High volume air samplers were used to collect both particulate- and gas-phase air samples
in a number of different sampling campaigns, designed to investigate different aspects of PAH
behaviour and fate such as traffic source profiles, seasonality, phase partitioning, diurnal patterns
and chemical degradation and/or formation.
The difference in traffic source profiles, as well as spatial and temporal variations for individual
PAH, OPAH and NPAH compounds has allowed an assessment of the factors governing their
concentrations, behaviour and fate in the urban atmosphere. The following conclusions can be
drawn :
Concentrations of PAH, OPAH and NPAH compounds at the trafficked location BROS were
generally higher than at the urban background site EROS, due to the closer proximity to the traffic
source. Relative inter-site differences were variable between species and also displayed distinct
seasonality. This was attributed to differences in relative rates of atmospheric degradation and
relative input from non-traffic sources (such as wood combustion, volatilisation from surfaces and
photochemical reactions) for different compounds. The traffic increment (that is BROS – EROS)
concentrations of most compounds was reflected in the relative concentrations measured in the
Queensway Road Tunnel, suggesting traffic is the dominant source for most compounds at BROS.
Concentrations at EROS were correlated with BROS concentrations for most compounds
suggesting traffic is the dominant source at EROS also.
Concentrations of most PAH appear to have declined substantially at these sites over the past 10
years. This is broadly consistent with the estimated reduction of PAH emissions over this time,

268
particularly those associated with urban traffic. However, a number of compounds such as Ret,
Ace, Pyr and Flt did not display this trend, suggesting the increased importance of non-traffic
sources such as wood combustion at these sites.
Concentrations of PAH, OPAH and NPAH compounds were generally much higher in the
Queensway Road Tunnel than observed in the ambient atmosphere, due to the higher volume of
traffic and the reduced dilution and chemical reactivity inside the tunnel. However, considerable
variation was noted in tunnel/ambient behaviour between compounds, which was attributed to
differences in the relative level of input from non-traffic sources and the role of photochemical
degradation and/or input for PAHs, OPAHs and NPAHs in the ambient environment. The potential
occurrence of OH radical reaction with PAHs in vehicle exhaust was also suggested.
The concentrations of PAH compounds measured inside the Queensway Road Tunnel displayed a
substantial decline compared with measurements taken in 1992. This was linked mainly to the
introduction of catalytic converters as well as increasingly stringent vehicle emission legislation
since the previous studies. In contrast, concentrations of NPAHs in the tunnel were similar to those
measured in 1996. These results suggest that the increased numbers and relative proportion of
diesel passenger vehicles over this time has impacted on the overall and relative concentrations of
PAH and NPAH emissions from vehicles in the UK. These results suggest relative emissions of
NPAH from traffic relative to PAHs have increased substantially in the past 20 years.
The observed temporal, seasonal and diurnal patterns of PAH,OPAH and NPAH concentrations,
and their inter-site variation between BROS and EROS indicate the potential importance of non-
traffic sources affecting the concentrations of a number of compounds at these sites. PMF source
apportionment analysis was carried out for some key PAHs and a small number of NPAH and
OPAH compounds. The results suggest the potential importance of wood combustion at these
sites, consistent with the estimated growth in emissions from this source nationally over the past
10 years. The results also indicate a distinction between PAH source patterns from domestic
heating and non-domestic heating combustion activities.
269
Concentrations for most compounds were higher during the winter months compared to summer.
This was mainly associated with colder temperature and the resultant reduction in dispersion rate
in winter, as well as lower rate of photochemical degradation. However, seasonal differences were
relatively low, especially for LMW PAH compounds. This was attributed to the dominane of a non-
seasonal traffic source, relatively low seasonal variation in ambient temperature and possible
influence of additional input of compounds from chemical reactions and/or volatilisation from
surfaces during summer.
Diurnal patterns derived in this study appear to be dominated for most compounds by a
characteristic traffic profile with highest concentrations observed during morning rush hour.
However, when concentrations were normalised with traffic marker compound NOx, the influence
of a potential daytime source for LMW compounds was highlighted. It was suggested that
temperature-driven volatilisation from soil, vegetation or road surfaces may be the cause of this
pattern.
PAHs, OPAHs and NPAHs exhibited characteristic gas-particle partitioning behaviour. It was
shown that the proportion of these compounds in the particulate phase is well characterised by
different physiochemical properties such as MW, VP, Kow and H. Phase partitioning of PAHs at
background site EROS appeared to be approaching equilibrium conditions in contrast to trafficked
site BROS, consistent with established partitioning models. However the factors influencing
partitioning behaviour of OPAH and NPAH compounds were less clear.
The importance of chemical reactivity as a PAH degradation process was indicated by the
relatively large differences in concentration for highly reactive species such as Acy and Ant
between trafficked and background sites. The ratio between BROS and EROS concentrations of
LMW PAHs was shown to display distinct seasonally and association with measured OH reaction
rate coefficients, although this was possibly masked to a degree by input from non-traffic sources.
It was not possible to make a quantitative assessment on the relative contribution of secondary
NPAH or OPAH input due to PAH reactivity at these sites. This was due to the relatively short

270
distance between traffic and background sites. However, the occurrence of photochemical input of
NPAH (and OPAH) compounds between BROS and EROS samples was indicated by the inter-site
differences and diurnal and seasonality patterns of 2NFlt/1NPyr ratios and product/reactant
concentration ratios. It is indicated that OH radical input is dominant over NO3-related input at
these sites.
7.2. Recommendations for future work
The following aspects are identified as potential areas for future investigation :
i) This investigation presents the first instance of a regular year-long measurement campaign for
OPAH and NPAH concentrations in the U.K. It is suggested that there is a requirement for more
regular monitoring of NPAHs and OPAHs in the long-term at different locations and better
characterisation of their primary sources. This will help establish a longer-term profile for their
concentrations and a better understanding of how this is influenced by changes in primary
emissions in relation to secondary input from PAH reactivity.
ii) This investigation highlights the potential for PMF source apportionment to be applied to OPAH
and NPAH compounds. A larger scale long-term monitoring of these compounds would allow a
relatively large data set to be available for this analysis in future. This would allow a more
extensive suite of compounds to be considered and would enhance our understanding of the
sources of NPAH and OPAH in the U.K.
iii) It is clear that more work is required to fully understand the factors influencing the gas-particle
partitioning of PAH, OPAH and NPAH. An important pre-requisite for this will be to obtain reliable
experimental data for the key physiochemical properties of PAH, OPAH and NPAH compounds
that are shown to play an important role in this process. For example, data on specific parameters
271
such as vapour pressure, octanol-air partitioning coefficient (Koa) and Henry’s Law constant, are
lacking for many NPAH compounds.
iv) Investigations of PAH, NPAH and OPAH emissions from vehicles often focus solely on particle-
phase extracts. The present investigation highlights the need for a better understanding of gas-
phase emissions in vehicle exhaust to better understand the relative role of primary traffic
emissions vs. secondary atmospheric formation on the observed concentrations of LMW NPAH
and OPAH compounds.
v) Measurement of NPAH compounds in the present study indicate the possibility of reactions of
PAH with OH radicals occurring in road tunnels. Further investigation of potential PAH + OH
reactivity in vehicle exhaust emissions should be investigated to assess if this process can
influence the nature and extent of NPAH input in the urban atmosphere.
vi) This investigation also highlights how the concentrations of PAH, OPAH and NPAH compounds
have been influenced by changes to vehicle emission control technologies, fuel formation and
legislative measures. Future measures imposed to improve air quality e.g. introduction of low
emission zones, should be accompanied by concurrent monitoring studies to assess the impact on
PAH, OPAH and NPAH concentrations, with particular focus on potentially differing impacts on
compounds on primary and secondary origin. Effective emission control measures to reduce NPAH
emissions from vehicles should also be further investigated.
vii) The majority of reaction products from PAH photochemical degradation processes remain
unidentified. A more comprehensive elucidation of products from the reactions of many PAHs with
OH, NO3 and O3 in both gas-phase and heterogeneous phases is required. This will allow more
specific species to be targeted in air sampling studies to better investigate the role of PAH
reactivity in observed atmospheric levels of NPAH and OPAH compounds.

272
References
Alam, M. S., Delgado-Saborit, J. M., Stark, C., Harrison, R. M. (2013) Using atmospheric measurements of PAH and quinone compounds at roadside and urban background sites to assess sources and reactivity. Atmospheric Environment. 77, 24-35. Alam, M. S., Delgado-Saborit, J. M., Stark, C., Harrison, R. M. (2014) Investigating PAH relative reactivity using congener profiles, quinone measurements and back trajectories. Atmospheric Chemistry and Physics. 14, 2467-2477. Albinet, A., Leoz-Garziandia, E., Budzinski, H., ViIlenave, E. (2006) Simultaneous analysis of oxygenated and nitrated polycyclic aromatic hydrocarbons on standard reference material 1649a (urban dust) and on natural ambient air samples by gas chromatography-mass spectrometry with negative ion chemical ionisation. Journal of Chromatography A. 1121, 106-113. Albinet, A., Leoz-Garziandia, E., Budzinski, H., ViIlenave, E. (2007a) Polycyclic aromatic hydrocarbons (PAHs), nitrated PAHs and oxygenated PAHs in ambient air of the Marseilles area (South of France): Concentrations and sources. Sci Total Environ. 384, 280-292. Albinet, A., Leoz-Garziandia, E., Budzinski, H., Villenave, E. (2007b) Sampling precautions for the measurement of nitrated polycyclic aromatic hydrocarbons in ambient air. Atmospheric Environment. 41, 4988-4994. Albinet, A., Leoz-Garziandia, E., Budzinski, H., Villenave, E., Jaffrezo, J. L. (2008a) Nitrated and oxygenated derivatives of polycyclic aromatic hydrocarbons in the ambient air of two French alpine valleys - Part 1: Concentrations, sources and gas/particle partitioning. Atmospheric Environment. 42, 43-54. Albinet, A., Leoz-Garziandia, E., Budzinski, H., Villenave, E., Jaffrezo, J. L. (2008b) Nitrated and oxygenated derivatives of polycyclic aromatic hydrocarbons in the ambient air of two French alpine valleys - Part 2: Particle size distribution. Atmospheric Environment. 42, 55-64. Allen, J. O., Dookeran, N. M., Taghizadeh, K., Lafleur, A. L., Smith, K. A., Sarofim, A. F. (1997) Measurement of oxygenated polycyclic aromatic hydrocarbons associated with a size-segregated urban aerosol. Environ Sci Technol. 31, 2064-2070. Ananthula, R., Yamada, T., Taylor, P. H. (2006) Kinetics of OH radical reaction with anthracene and anthracene-d(10). Journal of Physical Chemistry A. 110, 3559-3566. Ananthula, R., Yamada, T., Taylor, P. H. (2007) Kinetics of OH radical reaction with phenanthrene: New absolute rate measurements and comparison with other PAHs. International Journal of Chemical Kinetics. 39, 629-637. Anderson, J. O., Thundiyil, J. G., Stolbach, A. (2012) Clearing the air: a review of the effects of particulate matter air pollution on human health. Journal of medical toxicology : official journal of the American College of Medical Toxicology. 8, 166-175. Andreou, G., Rapsomanikis, S. (2009) Polycyclic aromatic hydrocarbons and their oxygenated derivatives in the urban atmosphere of Athens. Journal of Hazardous Materials. 172, 363-373. AQEG. (2005) Particulate matter in the United Kingdom Defra, London Arce, R., Pino, E. F., Valle, C., Agreda, J. (2008) Photophysics and Photochemistry of 1-Nitropyrene. Journal of Physical Chemistry A. 112, 10294-10304.
273
Arey, J., Zielinska, B., Atkinson, R., Winer, A. M., Ramdahl, T., Pitts, J. N. (1986) The formation of nitro-PAH from the gas-phase reactions of fluoranthene and pyrene with the OH radical in the presence of NOx. Atmospheric Environment. 20, 2339-2345. Arey, J., Zielinska, B., Atkinson, R., Winer, A. M. (1987) Polycyclic Aromatic Hydrocarbon and Nitroarene Concentrations in Ambient Air During a Wintertime Nigh-NOx Episode in the Los Angeles Basin. Atmospheric Environment. 21, 1437-1444. Arey, J., Zielinska, B., Atkinson, R., Winer, A. M. (1988) Formation of nitroarenes during ambient high-volume sampling. Environ Sci Technol. 22, 457-462. Arey, J., Atkinson, R., Zielinska, B., McElroy, P. A. (1989a) Diurnal concentrations of volatile polycyclic aromatic-hydrocarbons and nitroarenes during a photochemical air-pollution episode in Glendora, California. Environ Sci Technol. 23, 321-327. Arey, J., Zielinska, B., Atkinson, R., Aschmann, S. M. (1989b) Nitroarene products from the gas-phase reactions of volatile polycyclic aromatic-hydrocarbons with the OH radical and N2O5. International Journal of Chemical Kinetics. 21, 775-799. Arey, J., Atkinson. R, Aschmann S.M., Schuetzle, D. (1990) Experimental investigation of the atmospheric chemistry of and a comparison of predicted nitroarene concentrations with ambient air data. Polycyclic Aromatic Compounds 1, 33-50. Atkinson, R., Aschmann, S. M., Pitts, J. N. (1984) Kinetics of the reactions of naphthalene and biphenyl with hydroxyl radicals and with ozone at 294 .+-. 1 K. Environ Sci Technol. 18, 110-113. Atkinson, R., Lloyd, A. C. (1984) Evaluation of kinetic and mechanistic data for modelling of photochemical smog. Journal of Physical and Chemical Reference Data. 13, 315-444. Atkinson, R., Aschmann, S. M. (1986) Kinetics of the reactions of naphthalene, 2-methylnaphthalene, and 2,3-dimethylnaphthalene with OH radicals and with O3 at 295 +/- 1 K. International Journal of Chemical Kinetics. 18, 569-573. Atkinson, R., Winer, A. M., Pitts, J. N. J. (1986) Estimation of night-time dinitrogen pentoxide concentrations from ambient nitrogen dioxide and nitrogen trioxide radical concentrations and the role of dinitrogen pentoxide in night-time chemistry. Atmospheric Environment. 20, 331-340. Atkinson, R., Arey, J., Zielinska, B., Aschmann, S. M. (1987a) Kinetics and products of the gas-phase reactions of OH radicals and N2O5 with naphthalene and biphenyl. Environ Sci Technol. 21, 1014-1022. Atkinson, R., Arey, J., Zielinska, B., Pitts, J. N., Winer, A. M. (1987b) Evidence for the transformation of polycyclic organic-matter in the atmosphere. Atmospheric Environment. 21, 2261-2262. Atkinson, R., Aschmann, S. M. (1987) Kinetics of the gas-phase reactions of alkylnaphthalenes with O3, N2O5 and OH radicals at 298+/-2-K. Atmospheric Environment. 21, 2323-2326. Atkinson, R., Aschmann, S. M. (1988) Kinetics of the reactions of acenaphthene and acenaphthylene and structurally-related aromatic-compounds with oh and NO3 radicals, N2O5 and O3 at 296+/-2 K. International Journal of Chemical Kinetics. 20, 513-539. Atkinson, R. (1989) Kinetics and mechanisms of the gas-phase reactions of the hydroxyl radical with organic compounds. J Phys Chem Ref. Data Monograph, 1-246.
274
Atkinson, R., Aschmann, S. M., Arey, J., Zielinska, B., Schuetzle, D. (1989) Gas-phase atmospheric chemistry of 1-nitronaphthalene and 2-nitronaphthalene and 1,4-naphthoquinone. Atmospheric Environment. 23, 2679-2690. Atkinson, R., Arey, J., Zielinska, B., Aschmann, S. M. (1990a) Kinetics and nitro-products of the gas-phase oh and NO3 radical-initiated reactions of naphthalene-d8, fluoranthene-d10, and pyrene. International Journal of Chemical Kinetics. 22, 999-1014. Atkinson, R., Tuazon, E. C., Arey, J. (1990b) Reactions of naphthalene in N2O5-NO-NO2-air mixtures. International Journal of Chemical Kinetics. 22, 1071-1082. Atkinson, R. (1991) Kinetics and mechanisms of the gas-phase reactions of the NO3 radical with organic-compounds. Journal of Physical and Chemical Reference Data. 20, 459-507. Atkinson, R. (1994) Gas-phase tropospheric chemistry of organic-compounds. Journal of Physical and Chemical Reference Data, Monograph No 2. Atkinson, R., Arey, J. (1994) Atmospheric chemistry of gas-phase polycyclic aromatic-hydrocarbons - formation of atmospheric mutagens. Environmental Health Perspectives. 102, 117-126. Atkinson, R., Tuazon, E. C., Bridier, I., Arey, J. (1994) Reactions of NO3-naphthalene adducts with O2 and NO2. International Journal of Chemical Kinetics. 26, 605-614. Atkinson, R., Arey, J. (2007) Mechanisms of the gas-phase reactions of aromatic hydrocarbons and PAHs with OH and NO3 radicals. Polycyclic Aromatic Compounds. 27, 15-40. Aulinger, A., Matthias, V., Quante, M. (2007) Introducing a partitioning mechanism for PAHs into the Community Multiscale Air Quality modeling system and its application to simulating the transport of benzo(a) pyrene over Europe. Journal of Applied Meteorology and Climatology. 46, 1718-1730. Baek, S. O., Goldstone, M. E., Kirk, P. W. W., Lester, J. N., Perry, R. (1991) Phase distribution and particle-size dependency of polycyclic aromatic-hydrocarbons in the urban atmosphere. Chemosphere. 22, 503-520. Ball, J. C., Young, W. C. (1992) Evidence for a new class of mutagens in diesel particulate extracts. Environ Sci Technol. 26, 2181-2186. Bamford, H. A., Baker, J. E. (2003) Nitro-polycyclic aromatic hydrocarbon concentrations and sources in urban and suburban atmospheres of the Mid-Atlantic region. Atmospheric Environment. 37, 2077-2091. Bamford, H. A., Bezabeh, D. Z., Schantz, M. M., Wise, S. A., Baker, J. E. (2003) Determination and comparison of nitrated-polycyclic aromatic hydrocarbons measured in air and diesel particulate reference materials. Chemosphere. 50, 575-587. Banceu, C. E., Mihele, C., Lane, D. A., Bunce, N. J. (2001) Reactions of methylated naphthalenes with hydroxyl radicals under simulated atmospheric conditions. Polycyclic Aromatic Compounds. 18, 415-425. Barbas, J. T., Sigman, M. E., Dabestani, R. (1996) Photochemical oxidation of phenanthrene sorbed on silica gel. Environ Sci Technol. 30, 1776-1780.
275
Bari, M. A., Baumbach, G., Kuch, B., Scheffknecht, G. (2010) Temporal variation and impact of wood smoke pollution on a residential area in southern Germany. Atmospheric Environment. 44, 3823-3832. Barrado, A. I., Garcia, S., Barrado, E., Maria Perez, R. (2012) PM2.5-bound PAHs and hydroxy-PAHs in atmospheric aerosol samples: Correlations with season and with physical and chemical factors. Atmospheric Environment. 49, 224-232. Bayona, J. M., Casellas, M., Fernandez, P., Solanas, A. M., Albaiges, J. (1994) Sources and seasonal variability of mutagenic-agents in the Barcelona city aerosol. Chemosphere. 29, 441-450. Becker, S., Halsall, C. J., Tych, W., Hung, H., Attewell, S., Blanchard, P., et al. (2006) Resolving the long-term trends of polycyclic aromatic hydrocarbons in the Canadian Arctic atmosphere. Environ Sci Technol. 40, 3217-3222. Bedjanian, Y., Nguyen, M. L., Le Bras, G. (2010) Kinetics of the reactions of soot surface-bound polycyclic aromatic hydrocarbons with the OH radicals. Atmospheric Environment. 44, 1754-1760. Behymer, T. D., Hites, R. A. (1985) Photolysis of polycyclic aromatic-hydrocarbons adsorbed on simulated atmospheric particulates. Environ Sci Technol. 19, 1004-1006. Behymer, T. D., Hites, R. A. (1988) Photolysis of polycyclic aromatic-hydrocarbons adsorbed on fly-ash. Environ Sci Technol. 22, 1311-1319. Benner, B. A. (1988) Mobile sources of polycyclic aromatic hydrocarbons (PAH) and nitro-PAH: a roadway tunnel study. PhD thesis, University of Maryland, USA. Benner, B. A., Gordon, G. E., Wise, S. A. (1989) Mobile sources of atmospheric polycyclic aromatic-hydrocarbons - a roadway tunnel study. Environ Sci Technol. 23, 1269-1278. Bertram, A. K., Ivanov, A. V., Hunter, M., Molina, L. T., Molina, M. J. (2001) The reaction probability of OH on organic surfaces of tropospheric interest. Journal of Physical Chemistry A. 105, 9415-9421. Bethel, H. L., Atkinson, R., Arey, J. (2001) Kinetics and products of the reactions of selected diols with the OH radical. International Journal of Chemical Kinetics. 33, 310-316. Bi, X., Simoneit, B. R. T., Sheng, G., Fu, J. (2008) Characterization of molecular markers in smoke from residential coal combustion in China. Fuel. 87, 112-119. Bi, X. H., Sheng, G. Y., Chen, Y. J., Tan, J. H., Fu, J. M. (2003) Distribution of N-alkanes and polycyclic aromatic hydrocarbons in the urban atmosphere of Guangzhou, China. Abstracts of Papers of the American Chemical Society. 225, U818-U818. Bi, X. H., Sheng, G. Y., Peng, P., Chen, Y. J., Fu, J. M. (2005) Size distribution of n-alkanes and polycyclic aromatic hydrocarbons (PAHs) in urban and rural atmospheres of Guangzhou, China. Atmospheric Environment. 39, 477-487. Bidleman, T. F. (1988) Atmospheric processes - wet and dry deposition of organic-compounds are controlled by their vapor particle partitioning. Environ Sci Technol. 22, 361-367. Biermann, H. W., Mac Leod, H., Atkinson, R., Winer, A. M., Pitts, J. N. (1985) Kinetics of the gas-phase reactions of the hydroxyl radical with naphthalene, phenanthrene, and anthracene. Environ Sci Technol. 19, 244-248.

276
Bolton, J. L., Trush, M. A., Penning, T. M., Dryhurst, G., Monks, T. J. (2000) Role of quinones in toxicology. Chemical Research in Toxicology. 13, 135-160. Bonfanti, L., Careri, M., Mangia, A., Manini, P., Maspero, M. (1996) Simultaneous identification of different classes of hydrocarbons and determination of nitro-polycyclic aromatic hydrocarbons by means of particle beam liquid chromatography mass spectrometry. Journal of Chromatography A. 728, 359-369. Brorstrom-Lunden, E., Lindskog, A. (1985) Degradation of polycyclic aromatic-hydrocarbons during simulated stack gas sampling. Environ Sci Technol. 19, 313-316. Brorstrom, E., Grennfelt, P., Lindskog, A. (1983) The effect of nitrogen-dioxide and ozone on the decomposition of particle-associated polycyclic aromatic-hydrocarbons during sampling from the atmosphere. Atmospheric Environment. 17, 601-605. Brown, A. S., Brown, R. J. C., Coleman, P. J., Conolly, C., Sweetman, A. J., Jones, K. C., et al. (2013) Twenty years of measurement of polycyclic aromatic hydrocarbons (PAHs) in UK ambient air by nationwide air quality networks. Environmental Science-Processes & Impacts. 15, 1199-1215. Brubaker, W. W., Hites, R. A. (1998) OH reaction kinetics of polycyclic aromatic hydrocarbons and polychlorinated dibenzo-p-dioxins and dibenzofurans. Journal of Physical Chemistry A. 102, 915-921. Bunce, N. J., Liu, L., Zhu, J., Lane, D. A. (1997) Reaction of naphthalene and its derivatives with hydroxyl radicals in the gas phase. Environ Sci Technol. 31, 2252-2259. Busby, W. F., Penman, B. W., Crespi, C. L. (1994a) human cell mutagenicity of mononitropyrenes and dinitropyrenes in metabolically competent MCL-5 CELLS. Mutation Research-Genetic Toxicology. 322, 233-242. Busby, W. F., Smith, H., Bishop, W. W., Thilly, W. G. (1994b) Mutagenicity of mononitropyrenes and dinitropyrenes in the salmonella-typhimurium-TM677 forward mutation assay. Mutation Research-Genetic Toxicology. 322, 221-232. Busby, W. F., Smith, H., Crespi, C. L., Penman, B. W. (1995) Mutagenicity of benzo a pyrene and dibenzopyrenes in the salmonella-typhimurium TM677 and the MCL-5 human cell forward mutation assays. Mutation Research-Genetic Toxicology. 342, 9-16. Butler, J. D., Crossley, P. (1979) Appraisal of relative airborne sub-urban concentrations of polycyclic aromatic-hydrocarbons monitored indoors and outdoors. Sci Total Environ. 11, 53-58. Butler, J. D., Crossley, P. (1981) Reactivity of polycyclic aromatic-hydrocarbons adsorbed on soot particles. Atmospheric Environment. 15, 91-94. Campbell, R. M., Lee, M. L. (1984) Capillary column gas-chromatographic determination of nitro polycyclic aromatic-compounds in particulate extracts. Analytical Chemistry. 56, 1026-1030. Cancio, J. A. L., Castellano, A. V., Martin, S. S., Rodriguez, J. F. S. (2004) Size distributions of PAHs in ambient air particles of two areas of Las Palmas de Gran Canaria. Water Air and Soil Pollution. 154, 127-138.
277
Castells, P., Santos, F. J., Gaiceran, M. T. (2003) Development of a sequential supercritical fluid extraction method for the analysis of nitrated and oxygenated derivatives of polycyclic aromatic hydrocarbons in urban aerosols. Journal of Chromatography A. 1010, 141-151. Cecinato, A. (2003) Nitrated polynuclear aromatic hydrocarbons in ambient air in Italy. A brief overview. Journal of Separation Science. 26, 402-408. Chapman, O. L., Heckert, D. C., Reasoner, J. W., Thackabe.S. (1966) Photochemical studies on 9-nitroanthracene. Journal of the American Chemical Society. 88, 5550-&. Chen, F., Hu, W., Zhong, Q. (2013) Emissions of particle-phase polycyclic aromatic hydrocarbons (PAHs) in the Fu Gui-shan Tunnel of Nanjing, China. Atmospheric Research. 124, 53-60. Chetwittayachan, T., Shimazaki, D., Yamamoto, K. (2002) A comparison of temporal variation of particle-bound polycyclic aromatic hydrocarbons (pPAHs) concentration in different urban environments: Tokyo, Japan, and Bangkok, Thailand. Atmospheric Environment. 36, 2027-2037. Cho, A. K., Di Stefano, E., You, Y., Rodriguez, C. E., Schmitz, D. A., Kumagai, Y., et al. (2004) Determination of four quinones in diesel exhaust particles, SRM 1649a, an atmospheric PM2.5. Aerosol Science and Technology. 38, 68-81. Choi, H., Harrison, R., Komulainen, H., J.M., D.-S. (2010) Polycyclic aromatic hydrocarbons. In: WHO guidelines for indoor air quality: selected pollutants, World Health Organization, Copenhagen Chrysikou, L. P., Gemenetzis, P. G., Samara, C. A. (2009) Wintertime size distribution of polycyclic aromatic hydrocarbons (PAHs), polychlorinated biphenyls (PCBs) and organochlorine pesticides (OCPs) in the urban environment: Street- vs rooftop-level measurements. Atmospheric Environment. 43, 290-300. Chuang, J. C., Mack, G. A., Kuhlman, M. R., Wilson, N. K. (1991) Polycyclic aromatic-hydrocarbons and their derivatives in indoor and outdoor air in an 8-home study. Atmospheric Environment Part B-Urban Atmosphere. 25, 369-380. Chung, M. Y., Lazaro, R. A., Lim, D., Jackson, J., Lyon, J., Rendulic, D., et al. (2006) Aerosol-borne quinones and reactive oxygen species generation by particulate matter extracts. Environ Sci Technol. 40, 4880-4886. Ciccioli, P., Cecinato, A., Brancaleoni, E., Draisci, R., Liberti, A. (1989) Evaluation of nitrated polycyclic aromatic-hydrocarbons in anthropogenic emission and air samples - a possible means of detecting reactions of carbonaceous particles in the atmosphere. Aerosol Science and Technology. 10, 296-310. Ciccioli, P., Cecinato, A., Brancaleoni, E., Frattoni, M., Zacchei, P., Miguel, A. H., et al. (1996) Formation and transport of 2-nitrofluoranthene and 2-nitropyrene of photochemical origin in the troposphere. Journal of Geophysical Research-Atmospheres. 101, 19567-19581. Cochran, R. E., Dongari, N., Jeong, H., Beranek, J., Haddadi, S., Shipp, J., et al. (2012) Determination of polycyclic aromatic hydrocarbons and their oxy-, nitro-, and hydroxy-oxidation products. Analytica Chimica Acta. 740, 93-103. Cole, J. A., Bittner, J. D., Longwell, J. P., Howard, J. B. (1984) Formation mechanisms of aromatic-compounds in aliphatic flames. Combustion and Flame. 56, 51-70. Coleman, P. J., Lee, R. G. M., Alcock, R. E., Jones, K. C. (1997) Observations on PAH, PCB, and PCDD/F trends in UK urban air, 1991-1995. Environ Sci Technol. 31, 2120-2124.
278
Collier, A. R., Rhead, M. M., Trier, C. J., Bell, M. A. (1995) Polycyclic aromatic compound profiles from a light-duty direct-injection diesel-engine. Fuel. 74, 362-367. COMEAP. (2010) The Mortality Effects of Long-Term Exposure to Particulate Air Pollution in the United Kingdom. A report by Health Protection Agency for the Committee on the Medical Effects of Air Pollutants. Cortes, D. R., Basu, I., Sweet, C. W., Hites, R. A. (2000) Temporal trends in and influence of wind on PAH concentrations measured near the Great Lakes. Environ Sci Technol. 34, 356-360. Cortes, D. R., Hites, R. A. (2000) Detection of statistically significant trends in atmospheric concentrations of semivolatile compounds. Environ Sci Technol. 34, 2826-2829. Cotham, W. E., Bidleman, T. F. (1995) Polycyclic Aromatic Hydrocarbons and Polychlorinated Biphenyls in Air at an Urban and a Rural Site Near Lake Michigan. Environ Sci Technol. 29, 2782-2789. Coutant, R. W., Brown, L., Chuang, J. C., Riggin, R. M., Lewis, R. G. (1988) Phase distribution and artifact formation in ambient air sampling for polynuclear aromatic-hydrocarbons. Atmospheric Environment. 22, 403-409. Dachs, J., Glenn, T. R., Gigliotti, C. L., Brunciak, P., Totten, L. A., Nelson, E. D., et al. (2002) Processes driving the short-term variability of polycyclic aromatic hydrocarbons in the Baltimore and northern Chesapeake Bay atmosphere, USA. Atmospheric Environment. 36, 2281-2295. Defra. (2007) The Air Quality Strategy for England, Scotland, Wales and Northern Ireland (Volume 2). Defra, London. Defra. (2010) Valuing the overall impacts of air pollution. Defra, London. Delgado-Saborit, J. M., Baker, S. J. (2006) Standard Operating Procedure For The Determination of PAHs by Gas Chromatography Mass Spectrometry University of Bimingham Delgado-Saborit, J. M., Stark, C., Harrison, R. M. (2011) Carcinogenic potential, levels and sources of polycyclic aromatic hydrocarbon mixtures in indoor and outdoor environments and their implications for air quality standards. Environment International. 37, 383-392. Delgado-Saborit, J. M., Alam, M. S., Godri Pollitt, K. J., Stark, C., Harrison, R. M. (2013) Analysis of atmospheric concentrations of quinones and polycyclic aromatic hydrocarbons in vapour and particulate phases. Atmospheric Environment. 77, 974-982. Delgado-Saborit, J. M., Stark, C., Harrison, R. M. (2014) Use of a Versatile High Efficiency Multiparallel Denuder for the Sampling of PAHs in Ambient Air: Gas and Particle Phase Concentrations, Particle Size Distribution and Artifact Formation. Environ Sci Technol. 48, 499-507. Delhomme, O., Millet, M., Herckes, P. (2008) Determination of oxygenated polycyclic aromatic hydrocarbons in atmospheric aerosol samples by liquid chromatography-tandem mass spectrometry. Talanta. 74, 703-710. Deutschwenzel, R. P., Brune, H., Grimmer, G., Dettbarn, G., Misfeld, J. (1983) Experimental studies in rat lungs on the carcinogenicity and dose-response relationships of 8 frequently occurring environmental polycyclic aromatic-hydrocarbons. Journal of the National Cancer Institute. 71, 539-544.
279
Department for Transport. (2014) DfT Vehicle Licensing Statistics : 2013, . UK Govermnent online resources Di Filippo, P., Riccardi, C., Pomata, D., Buiarelli, F. (2010) Concentrations of PAHs, and nitro- and methyl- derivatives associated with a size-segregated urban aerosol. Atmospheric Environment. 44, 2742-2749. Diamond, M. L., Priemer, D. A., Law, N. L. (2001) Developing a multimedia model of chemical dynamics in an urban area. Chemosphere. 44, 1655-1667. Dimashki, M., Harrad, S., Harrison, R. M. (2000) Measurements of nitro-PAH in the atmospheres of two cities. Atmospheric Environment. 34, 2459-2469. Dimashki, M., Lim, L. H., Harrison, R. M., Harrad, S. (2001) Temporal trends, temperature dependence, and relative reactivity of atmospheric polycyclic aromatic hydrocarbons. Environ Sci Technol. 35, 2264-2267. Ding, X., Wang, X.-M., Xie, Z.-Q., Xiang, C.-H., Mai, B.-X., Sun, L.-G., et al. (2007) Atmospheric polycyclic aromatic hydrocarbons observed over the North Pacific Ocean and the Arctic area: Spatial distribution and source identification. Atmospheric Environment. 41, 2061-2072. Draper, W. M. (1986) Quantitation of nitropolycyclic and dinitropolycyclic aromatic-hydrocarbons in diesel exhaust particulate matter. Chemosphere. 15, 437-447. Durant, J. L., Busby, W. F., Lafleur, A. L., Penman, B. W., Crespi, C. L. (1996) Human cell mutagenicity of oxygenated, nitrated and unsubstituted polycyclic aromatic hydrocarbons associated with urban aerosols. Mutation Research-Genetic Toxicology. 371, 123-157. Durant, J. L., Lafleur, A. L., Plummer, E. F., Taghizadeh, K., Busby, W. F., Thilly, W. G. (1998) Human lymphoblast mutagens in urban airborne particles. Environ Sci Technol. 32, 1894-1906. EEA. (2012) Air quality in Europe - 2012 report. EEA, Copenhagen Eiguren-Fernandez, A., Miguel, A. H., Jaques, P. A., Sioutas, C. (2003) Evaluation of a denuder-MOUDI-PUF sampling system to measure the size distribution of semi-volatile polycyclic aromatic hydrocarbons in the atmosphere. Aerosol Science and Technology. 37, 201-209. Eiguren-Fernandez, A., Miguel, A. H., Di Stefano, E., Schmitz, D. A., Cho, A. K., Thurairatnam, S., et al. (2008a) Atmospheric distribution of gas- and particle-phase quinones in Southern California. Aerosol Science and Technology. 42, 854-861. Eiguren-Fernandez, A., Miguel, A. H., Lu, R., Purvis, K., Grant, B., Mayo, P., et al. (2008b) Atmospheric formation of 9,10-phenanthraquinone in the Los Angeles air basin. Atmospheric Environment. 42, 2312-2319. Eiguren-Fernandez, A., Miguel, A. H. (2012) Size-Resolved Polycyclic Aromatic Hydrocarbon Emission Factors from On-Road Gasoline and Diesel Vehicles: Temperature Effect on the Nuclei-Mode. Environ Sci Technol. 46, 2607-2615. EMEP. (2011) Measurement data online, European Monitoring and Evaluation Programme. Measurement data online, European Monitoring and Evaluation Programme, Geneva, 43 http://wwwniluno/projects/ccc/emepdatahtml.

280
Enya, T., Suzuki, H., Watanabe, T., Hirayama, T., Hisamatsu, Y. (1997) 3-nitrobenzanthrone, a powerful bacterial mutagen and suspected human carcinogen found in diesel exhaust and airborne particulates. Environ Sci Technol. 31, 2772-2776. EPAQS. (1999) Expert Panel on Air Quality Standards. Polycyclic Aromatic Hydrocarbons. Report for the Department of the Environment, Transport and the Regions. Estéve, W., Budzinski, H., Villenave, E. (2003) Heterogeneous reactivity of OH radicals with phenanthrene. Polycyclic Aromatic Compounds. 23, 441-456. Estéve, W., Budzinski, H., Villenave, E. (2004) Relative rate constants for the heterogeneous reactions of OH, NO2 and NO radicals with polycyclic aromatic hydrocarbons adsorbed on carbonaceous particles. Part 1: PAHs adsorbed on 1-2 mu m calibrated graphite particles. Atmospheric Environment. 38, 6063-6072. Estéve, W., Budzinski, H., Villenave, E. (2006) Relative rate constants for the heterogeneous reactions of NO2 and OH radicals with polycyclic aromatic hydrocarbons adsorbed on carbonaceous particles. Part 2: PAHs adsorbed on diesel particulate exhaust SRM 1650a. Atmospheric Environment. 40, 201-211. Fan, Z. H., Chen, D. H., Birla, P., Kamens, R. M. (1995) Modeling of nitro-polycyclic aromatic hydrocarbon formation and decay in the atmosphere. Atmospheric Environment. 29, 1171-1181. Fan, Z. H., Kamens, R. M., Hu, J. X., Zhang, J. B., McDow, S. (1996a) Photostability of nitro polycyclic aromatic hydrocarbons on combustion soot particles in sunlight. Environ Sci Technol. 30, 1358-1364. Fan, Z. H., Kamens, R. M., Zhang, J. B., Hu, J. X. (1996b) Ozone-nitrogen dioxide-NPAH heterogeneous soot particle reactions and modeling NPAH in the atmosphere. Environ Sci Technol. 30, 2821-2827. Feilberg, A., Kamens, R. M., Strommen, M. R., Nielsen, T. (1999) Modeling the formation, decay, and partitioning of semivolatile nitro-polycyclic aromatic hydrocarbons (nitronaphthalenes) in the atmosphere. Atmospheric Environment. 33, 1231-1243. Feilberg, A., Nielsen, T. (2000) Effect of aerosol chemical composition on the photodegradation of nitro-polycyclic aromatic hydrocarbons. Environ Sci Technol. 34, 789-797. Feilberg, A., Poulsen, M. W. B., Nielsen, T., Skov, H. (2001) Occurrence and sources of particulate nitro-polycyclic aromatic hydrocarbons in ambient air in Denmark. Atmospheric Environment. 35, 353-366. Feilberg, A., Nielsen, T., Binderup, M. L., Skov, H., Poulsen, M. W. B. (2002) Observations of the effect of atmospheric processes on the genotoxic potency of airborne particulate matter. Atmospheric Environment. 36, 4617-4625. Fernandez, P., Grimalt, J. O., Vilanova, R. M. (2002) Atmospheric gas-particle partitioning of polycyclic aromatic hydrocarbons in high mountain regions of Europe. Environ Sci Technol. 36, 1162-1168. Fiedler, H., Mücke, W. (1991) Nitro Derivatives of Polycyclic Aromatic Hydrocarbons (NO2-PAH). In : (Ed Hutzinger, O) The Handbook of Environmental Chemistry, Volume 3 / 3G, Anthropogenic Compounds pp 97-137
281
Fine, P. M., Cass, G. R., Simoneit, B. R. T. (2002) Chemical characterization of fine particle emissions from the fireplace combustion of woods grown in the southern United States. Environ Sci Technol. 36, 1442-1451.
Fine, P. M., Chakrabarti, B., Krudysz, M., Schauer, J. J., Sioutas, C. (2004) Diurnal variations of individual organic compound constituents of ultrafine and accumulation mode particulate matter in the Los Angeles basin. Environ Sci Technol. 38, 1296-1304. Finlayson-Pitts, B. J., Pitts, J. N. (2000) Airborne Polycyclic Aromatic Hydrocarbons and Their Derivatives: Atmospheric Chemistry and Toxicological Implications. In : Chemistry of the Upper and Lower Atmosphere : Theory, Experiments, Application. Academic Press, San Diego, USA 436-546 pp Fitzpatrick, E. M., Ross, A. B., Bates, J., Andrews, G., Jones, J. M., Phylaktou, H., et al. (2007) Emission of oxygenated species from the combustion of pine wood and its relation to soot formation. Process Safety and Environmental Protection. 85, 430-440. Fraser, M. P., Cass, G. R., Simoneit, B. R. T. (1998a) Gas-phase and particle-phase organic compounds emitted from motor vehicle traffic in a Los Angeles roadway tunnel. Environ Sci Technol. 32, 2051-2060. Fraser, M. P., Cass, G. R., Simoneit, B. R. T., Rasmussen, R. A. (1998b) Air quality model evaluation data for organics. 5. C-6-C-22 nonpolar and semipolar aromatic compounds. Environ Sci Technol. 32, 1760-1770. Geyer, A., Ackermann, R., Dubois, R., Lohrmann, B., Muller, T., Platt, U. (2001) Long-term observation of nitrate radicals in the continental boundary layer near Berlin. Atmospheric Environment. 35, 3619-3631. Geyer, A., Alicke, B., Ackermann, R., Martinez, M., Harder, H., Brune, W., et al. (2003) Direct observations of daytime NO3: Implications for urban boundary layer chemistry. Journal of Geophysical Research-Atmospheres. 108. Gibson, T. L. (1982) Nitro-derivatives of polynuclear aromatic-hydrocarbons in airborne and source particulate matter. Atmospheric Environment. 16, 2037-2040. Goriaux, M., Jourdain, B., Temime, B., Besombes, J. L., Marchand, N., Albinet, A., et al. (2006) Field comparison of particulate PAH measurements using a low-flow denuder device and conventional sampling systems. Environ Sci Technol. 40, 6398-6404. Gorse, R. A., Riley, T. L., Ferris, F. C., Pero, A. M., Skewes, L. M. (1983) 1-Nitropyrene concentration and bacterial mutagenicity in on-road vehicle particulate-emissions. Environ Sci Technol. 17, 198-202. Goulay, F., Rebrion-Rowe, C., Le Garrec, J. L., Le Picard, S. D., Canosa, A., Rowe, B. R. (2005) The reaction of anthracene with OH radicals: An experimental study of the kinetics between 58 and 470 K. Journal of Chemical Physics. 122. Graham, R. A., Johnston, H. S. (1978) The photochemistry of NO3 and the kinetics of the N2O5-O3 system. Journal of Physical Chemistry 82, 254-268. Grosjean, D. (1983) The effect of nitrogen-dioxide and ozone on the decomposition of particle-associated polycyclic aromatic-hydrocarbons during sampling from the atmosphere. Atmospheric Environment. 17, 2112-2114.
282
Guo, H., Lee, S. C., Ho, K. F., Wang, X. M., Zou, S. C. (2003) Particle-associated polycyclic aromatic hydrocarbons in urban air of Hong Kong. Atmospheric Environment. 37, 5307-5317. Guo, Z., Kamens, R. M. (1991) An experimental technique for studying heterogeneous reactions of polyaromatic hydrocarbons on particle surfaces. Journal of Atmospheric Chemistry. 12, 137-151. Gupta, P., Harger, W. P., Arey, J. (1996) The contribution of nitro- and methylnitro-naphthalenes to the vapor-phase mutagenicity of ambient air samples. Atmospheric Environment. 30, 3157-3166. Gusev, A., Dutchak, S., Rozovskaya, O., Shatalov, V., Sokovyh, V., Vulykh, N., et al. (2011) Persistent Organic Pollutants in the Environment. EMEP Status Report 3/2011, Meteorological Synthesizing 38 Centre - East, Moscow, Russian Federation, 108 pp. Persistent Organic Pollutants in the Environment EMEP Status Report 3/2011, Meteorological Synthesizing 38 Centre - East, Moscow, Russian Federation, 108 pp. Halsall, C., Burnett, V., Davis, B., Jones, P., Pettit, C., Jones, K. C. (1993) PCBs and PAHs in U.K. urban air. Chemosphere. 26, 2185-2197. Halsall, C. J., Barrie, L. A., Fellin, P., Muir, D. C. G., Billeck, B. N., Lockhart, L., et al. (1997) Spatial and temporal variation of polycyclic aromatic hydrocarbons in the Arctic atmosphere. Environ Sci Technol. 31, 3593-3599. Halsall, C. J., Sweetman, A. J., Barrie, L. A., Jones, K. C. (2001) Modelling the behaviour of PAHs during atmospheric transport from the UK to the Arctic. Atmospheric Environment. 35, 255-267. Halse, A. K., Schlabach, M., Eckhardt, S., Sweetman, A., Jones, K. C., Breivik, K. (2011) Spatial variability of POPs in European background air. Atmospheric Chemistry and Physics. 11, 1549-1564. Hanedar, A., Alp, K., Kaynak, B., Avsar, E. (2014) Toxicity evaluation and source apportionment of Polycyclic Aromatic Hydrocarbons (PAHs) at three stations in Istanbul, Turkey. Sci Total Environ. 488, 439-448. Hannigan, M. P., Cass, G. R., Penman, B. W., Crespi, C. L., Lafleur, A. L., Busby, W. F., et al. (1997) Human cell mutagens in Los Angeles air. Environ Sci Technol. 31, 438-447. Hannigan, M. P., Cass, G. R., Penman, B. W., Crespi, C. L., Lafleur, A. L., Busby, W. F., et al. (1998) Bioassay directed chemical analysis of Los Angeles airborne particulate matter using a human cell mutagenicity assay. Environ Sci Technol. 32, 3502-3514. Harner, T., Bidleman, T. F. (1998) Octanol-air partition coefficient for describing particle/gas partitioning of aromatic compounds in urban air. Environ Sci Technol. 32, 1494-1502. Harner, T., Bidleman, T. F., Jantunen, L. M. M., Mackay, D. (2001) Soil-air exchange model of persistent pesticides in the United States cotton belt. Environmental Toxicology and Chemistry. 20, 1612-1621. Harrad, S., Hassoun, S., Romero, M. S. C., Harrison, R. M. (2003) Characterisation and source attribution of the semi-volatile organic content of atmospheric particles and associated vapour phase in Birmingham, UK. Atmospheric Environment. 37, 4985-4991. Harrad, S., Laurie, L. (2005) Concentrations, sources and temporal trends in atmospheric polycyclic aromatic hydrocarbons in a major conurbation. Journal of Environmental Monitoring. 7, 722-727.
283
Harrison, R. M., Smith, D. J. T., Luhana, L. (1996) Source apportionment of atmospheric polycyclic aromatic hydrocarbons collected from an urban location in Birmingham, UK. Environ Sci Technol. 30, 825-832. Harrison, R. M., Tilling, R., Romero, M. S. C., Harrad, S., Jarvis, K. (2003) A study of trace metals and polycyclic aromatic hydrocarbons in the roadside environment. Atmospheric Environment. 37, 2391-2402. Harrison, R. M., Smith, D. J. T., Kibble, A. J. (2004) What Is Responsible for the Carcinogenicity of PM2.5? Occupational and Environmental Medicine. 61, 799-805. Hart, K. M., Pankow, J. F. (1994) High-volume air sampler for particle and gas sampling .2. use of backup filters to correct for the adsorption of gas-phase polycyclic aromatic-hydrocarbons to the front filter. Environ Sci Technol. 28, 655-661. Hayakawa, K., Butoh, M., Miyazaki, M. (1992) Determination of dinitropyrenes and nitropyrenes in emission particulates from diesel and gasoline-engine vehicles by liquid-chromatography with chemiluminescence detection after precolumn reduction. Analytica Chimica Acta. 266, 251-256. Hayakawa, K., Butoh, M., Hirabayashi, Y., Miyazaki, M. (1994) Determination of 1,3-dinitropyrenes 1,6-dinitropyrenes 1,8-dinitropyrenes and 1-nitropyrene in-vehicle exhaust particulates. Japanese Journal of Toxicology and Environmental Health. 40, 20-25. Hayakawa, K., Tang, N., Akutsu, K., Murahashi, T., Kakimoto, H., Kizu, R., et al. (2002) Comparison of polycyclic aromatic hydrocarbons and nitropolycyclic aromatic hydrocarbons in airborne particulates collected in downtown and suburban Kanazawa, Japan. Atmospheric Environment. 36, 5535-5541. Hays, M. D., Fine, P. M., Geron, C. D., Kleeman, M. J., Gullett, B. K. (2005) Open burning of agricultural biomass: Physical and chemical properties of particle-phase emissions. Atmospheric Environment. 39, 6747-6764. Healy, R. M., Chen, Y., Kourtchev, I., Kalberer, M., O'Shea, D., Wenger, J. C. (2012) Rapid Formation of Secondary Organic Aerosol from the Photolysis of 1-Nitronaphthalene: Role of Naphthoxy Radical Self-reaction. Environ Sci Technol. 46, 11813-11820. Helmig, D., Arey, J., Atkinson, R., Harger, W. P., McElroy, P. A. (1992a) Products of the OH radical-initiated gas-phase reaction of fluorene in the presence of NOx. Atmospheric Environment Part a-General Topics. 26, 1735-1745. Helmig, D., Arey, J., Harger, W. P., Atkinson, R., Lopezcancio, J. (1992b) Formation of mutagenic nitrodibenzopyranones and their occurrence in ambient air. Environ Sci Technol. 26, 622-624. Helmig, D., Lopezcancio, J., Arey, J., Harger, W. P., Atkinson, R. (1992c) Quantification of Ambient Nitrodibenzopyranones - Further Evidence For Atmospheric Mutagen Formation. Environ Sci Technol. 26, 2207-2213. Helmig, D., Harger, W. P. (1994) OH radical-initiated gas-phase reaction-products of phenanthrene. Sci Total Environ. 148, 11-21. Hien, T. T., Thanh, L. T., Kameda, T., Takenaka, N., Bandow, H. (2007) Nitro-polycyclic aromatic hydrocarbons and polycyclic aromatic hydrocarbons in particulate matter in an urban area of a tropical region: Ho Chi Minh City, Vietnam. Atmospheric Environment. 41, 7715-7725.

284
Ho, K. F., Ho, S. S. H., Lee, S. C., Cheng, Y., Chow, J. C., Watson, J. G., et al. (2009) Emissions of gas- and particle-phase polycyclic aromatic hydrocarbons (PAHs) in the Shing Mun Tunnel, Hong Kong. Atmospheric Environment. 43, 6343-6351. Holloway, M. P., Biaglow, M. C., McCoy, E. C., Anders, M., Rosenkranz, H. S., Howard, P. C. (1987) Photochemical instability of 1-nitropyrene, 3-nitrofluoranthene, 1,8-dinitropyrene and their parent polycyclic aromatic-hydrocarbons. Mutation Research. 187, 199-207. Holloway, A.M. and Wayne, R.P. (2010) Atmospheric Chemistry, RSC Publishing. Royal Society of Chemistry, Cambridge, U.K.
Holoubek, I., Klanova, J., Jarkovsky, J., Kohoutek, J. (2007) Trends in background levels of persistent organic pollutants at Kosetice observatory, Czech Republic. Part I. Ambient air and wet deposition 1996-2005. Journal of Environmental Monitoring. 9, 557-563. Hu, S., Herner, J. D., Robertson, W., Kobayashi, R., Chang, M. C. O., Huang, S.-m., et al. (2013) Emissions of polycyclic aromatic hydrocarbons (PAHs) and nitro-PAHs from heavy-duty diesel vehicles with DPF and SCR. J Air Waste Manage Assoc. 63, 984-996. Huang, B., Liu, M., Bi, X., Chaemfa, C., Ren, Z., Wang, X., et al. (2014) Phase distribution, sources and risk assessment of PAHs, NPAHs and OPAHs in a rural site of Pearl River Delta region, China. Atmospheric Pollution Research. 5, 210-218. Hung, H., Blanchard, P., Halsall, C. J., Bidleman, T. F., Stern, G. A., Fellin, P., et al. (2005) Temporal and spatial variabilities of atmospheric polychlorinated biphenyls (PCBs), organochlorine (OC) pesticides and polycyclic aromatic hydrocarbons (PAHs) in the Canadian Arctic: Results from a decade of monitoring. Sci Total Environ. 342, 119-144. IARC. (1983) International Agency for Research on Cancer, Monographs on the Evaluation of Carcinogenic Risk of Chemicals to Humans, Volume 32 : Polynuclear Aromatic Hydrocarbons, Part 1 : Chemical, Environmental and Experimental Data. IARC, Lyon. IARC. (1989) International Agency for Research on Cancer, Monographs on the Evaluation of Carcinogenic Risk of Chemicals to Humans, Volume 46 : Diesel and Gasoline Engine Exhausts and Some Nitroarenes. IARC, Lyon. URL http://monographsiarcfr/ENG/Monographs/vol46/volume46pdf
IARC (2010) I International Agency for Research on Cancer, Monographs on the Evaluation of Carcinogenic Risk of Chemicals to Humans, Volume 92 : Some Non-heterocyclic Polycyclic Aromatic Hydrocarbons and Some Related Exposures. IARC, Lyon.
Iinuma, Y., Brueggemann, E., Gnauk, T., Mueller, K., Andreae, M. O., Helas, G., et al. (2007) Source characterization of biomass burning particles: The combustion of selected European conifers, African hardwood, savanna grass, and German and Indonesian peat. Journal of Geophysical Research-Atmospheres. 112. Inazu, K., Kobayashi, T., Hisamatsu, Y. (1997) Formation of 2-nitrofluoranthene in gas-solid heterogeneous photoreaction of fluoranthene supported on oxide particles in the presence of nitrogen dioxide. Chemosphere. 35, 607-622. Ioki, Y. (1977) Aryloxyl radicals by photorearrangement of nitro-compounds. Journal of the Chemical Society-Perkin Transactions 2, 1240-1242. Jaffrezo, J. L., Masclet, P., Clain, M. P., Wortham, H., Beyne, S., Cachier, H. (1993) Transfer-function of polycyclic aromatic-hydrocarbons from the atmosphere to the polar ice .1. determination
285
of atmospheric concentrations at dye-3, greenland. Atmospheric Environment Part a-General Topics. 27, 2781-2785. Jakober, C. A., Riddle, S. G., Robert, M. A., Destaillats, H., Charles, M. J., Green, P. G., et al. (2007) Quinone emissions from gasoline and diesel motor vehicles. Environ Sci Technol. 41, 4548-4554. Jang, E., Alam, M. S., Harrison, R. M. (2013) Source apportionment of polycyclic aromatic hydrocarbons in urban air using positive matrix factorization and spatial distribution analysis. Atmospheric Environment. 79, 271-285. Jariyasopit, N., Zimmermann, K., Schrlau, J., Arey, J., Atkinson, R., Massey Simonich, S. L. (2011) Heterogeneous reactions of O3, OH Radicals and N2O5 with Chinese particulate matter to simulate trans-Pacific atmospheric transport. 23rd International Symposium on Polycyclic Aromatic Compounds, Münster, Germany, 4-7 September 2011. Jariyasopit, N., Zimmermann, K., Schrlau, J., Arey, J., Atkinson, R., Yu, T.-W., et al. (2014) Heterogeneous Reactions of Particulate Matter-Bound PAHs and NPAHs with NO3/N2O5, OH Radicals, and O-3 under Simulated Long-Range Atmospheric Transport Conditions: Reactivity and Mutagenicity. Environ Sci Technol. 48, 10155-10164. Jones, K. C., Stratford, J. A., Waterhouse, K. S., Furlong, E. T., Giger, W., Hites, R. A., et al. (1989) Increases in the polynuclear aromatic hydrocarbon content of an agricultural soil over the last century. Environ Sci Technol. 23, 95-101. Jones, K. C., Sanders, G., Wild, S. R., Burnett, V., Johnston, A. E. (1992) Evidence for a decline of pcbs and pahs in rural vegetation and air in the United-Kingdom. Nature. 356, 137-140. Jonker, M. T. O., Hawthorne, S. B., Koelmans, A. A. (2005) Extremely slowly desorbing polycyclic aromatic hydrocarbons from soot and soot-like materials: Evidence by supercritical fluid extraction. Environ Sci Technol. 39, 7889-7895. Kahan, T. F., Kwamena, N. O. A., Donaldson, D. J. (2006) Heterogeneous ozonation kinetics of polycyclic aromatic hydrocarbons on organic films. Atmospheric Environment. 40, 3448-3459. Kakimoto, H., Kitamura, M., Matsumoto, Y., Sakai, S., Kanoh, F., Murahashi, T., et al. (2000) Comparison of atmospheric polycyclic aromatic hydrocarbons and nitropolycyclic aromatic hydrocarbons in Kanazawa, Sapporo and Tokyo. Journal of Health Science. 46, 5-15. Kakimoto, H., Yokoe, H., Matsumoto, Y., Sakai, S., Kanoh, F., Murahashi, T., et al. (2001) Considerations of atmospheric behaviors of polycyclic aromatic hydrocarbons, nitropolycyclic aromatic hydrocarbons and inorganic pollutants based on their interrelationships. Journal of Health Science. 47, 385-393. Kallio, M., Hyotylainen, T., Lehtonen, M., Jussila, M., Hartonen, K., Shimmo, M., et al. (2003) Comprehensive two-dimensional gas chromatography in the analysis of urban aerosols. Journal of Chromatography A. 1019, 251-260. Kam, W., Liacos, J. W., Schauer, J. J., Delfino, R. J., Sioutas, C. (2012) On-road emission factors of PM pollutants for light-duty vehicles (LDVs) based on urban street driving conditions. Atmospheric Environment. 61, 378-386. Kameda, T., Inazu, K., Bandow, H., Sanukida, S., Maeda, Y. (2004) Diurnal change of direct-acting mutagenicity of soluble organic fraction of airborne particles collected at Southern Osaka:
286
correlation between the mutagenicity, particles-associated nitroarenes, and gaseous emission. Atmospheric Environment. 38, 1903-1912. Kameda, T. (2011) Atmospheric Chemistry of Polycyclic Aromatic Hydrocarbons and Related Compounds. Journal of Health Science. 57, 504-511. Kamens, R. M., Guo, Z., Fulcher, J. N., Bell, D. A. (1988) Influence of humidity, sunlight, and temperature on the daytime decay of polyaromatic hydrocarbons on atmospheric soot particles. Environ Sci Technol. 22, 103-108. Kamens, R. M., Karam, H., Guo, J. H., Perry, J. M., Stockburger, L. (1989) The Behavior of Oxygenated Polycyclic Aromatic Hydrocarbons on Atmospheric Soot Particles. Environ Sci Technol. 23, 801-806. Karagulian, F., Rossi, M. J. (2007) Heterogeneous chemistry of the NO3 free radical and N2O5 on decane flame soot at ambient temperature: Reaction products and kinetics. Journal of Physical Chemistry A. 111, 1914-1926. Karavalakis, G., Stournas, S., Bakeas, E. (2009) Light vehicle regulated and unregulated emissions from different biodiesels. Sci Total Environ. 407, 3338-3346. Katz, M., Chan, C., Tosine, H., Sakuma, T. (1979) Relative Rates of Photochemical and Biological Oxidation in Vitro of Polycyclic Aromatic Hydrocarbons. in Polynuclear Aromatic Hydrocarbons (P W Jones and P Leber, Eds), Ann Arbor Science Publishers, Ann Arbor, MI, pp. 171-189. Kautzman, K. E., Surratt, J. D., Chan, M. N., Chan, A. W. H., Hersey, S. P., Chhabra, P. S., et al. (2010) Chemical Composition of Gas- and Aerosol-Phase Products from the Photooxidation of Naphthalene. Journal of Physical Chemistry A. 114, 913-934. Kavouras, I. G., Lawrence, J., Koutrakis, P., Stephanou, E. G., Oyola, P. (1999) Measurement of particulate aliphatic and polynuclear aromatic hydrocarbons in Santiago de Chile: source reconciliation and evaluation of sampling artifacts. Atmospheric Environment. 33, 4977-4986. Kawanaka, Y., Matsumoto, E., Sakamoto, K., Wang, N., Yun, S. J. (2004) Size distributions of mutagenic compounds and mutagenicity in atmospheric particulate matter collected with a low-pressure cascade impactor. Atmospheric Environment. 38, 2125-2132. Kawanaka, Y., Tsuchiya, Y., Yun, S.-J., Sakamoto, K. (2009) Size Distributions of Polycyclic Aromatic Hydrocarbons in the Atmosphere and Estimation of the Contribution of Ultrafine Particles to Their Lung Deposition. Environ Sci Technol. 43, 6851-6856. Keller, C. D., Bidleman, T. F. (1984) Collection of airborne polycyclic aromatic-hydrocarbons and other organics with a glass-fiber filter polyurethane foam system. Atmospheric Environment. 18, 837-845. Keyte, I. J., Wild, E., Dent, J., Jones, K. C. (2009) Investigating the Foliar Uptake and Within-Leaf Migration of Phenanthrene by Moss (Hypnum Cupressiforme) Using Two-Photon Excitation Microscopy with Autofluorescence. Environ Sci Technol. 43, 5755-5761. Keyte, I. J., Harrison, R. M., Lammel, G. (2013) Chemical reactivity and long-range transport potential of polycyclic aromatic hydrocarbons - a review. Chemical Society Reviews. 42, 9333-9391.
287
Khalili, N. R., Scheff, P. A., Holsen, T. M. (1995) PAH source fingerprints for coke ovens, diesel and gasoline-engines, highway tunnels, and wood combustion emissions. Atmospheric Environment. 29, 533-542. Kim, J. Y., Lee, J. Y., Kim, Y. P., Lee, S. B., Jin, H. C., Bae, G. N. (2012) Seasonal characteristics of the gaseous and particulate PAHs at a roadside station in Seoul, Korea. Atmospheric Research. 116, 142-150. Kishikawa, N., Nakao, M., Ohba, Y., Nakashima, K., Kuroda, N. (2006) Concentration and trend of 9,10-phenanthrenequinone in airborne particulates collected in Nagasaki city, Japan. Chemosphere. 64, 834-838. Kiss, G., Varga-Puchony, Z., Hlavaj, Z. . (1996) Distribution of polycyclic aromatic hydrocarbons on atmospheric aerosol particles of different size. In: Nucleation and Atmospheric Aerosols, Kulmala, M., Wagner, P.O. (eds.). Elsevier, Kidlington, pp 501–503. Distribution of polycyclic aromatic hydrocarbons on atmospheric aerosol particles of different size In: Nucleation and Atmospheric Aerosols, Kulmala, M, Wagner, PO (eds) Elsevier, Kidlington, pp 501–503. Klamt, A. (1993) Estimation of gas-phase hydroxyl radical rate constants of organic-compounds from molecular-orbital calculations. Chemosphere. 26, 1273-1289. Klanova, J., Cupr, P., Holoubek, I., Boruvkova, J., Pribylova, P., Kares, R., et al. (2009) Monitoring of persistent organic pollutants in Africa. Part 1: Passive air sampling across the continent in 2008. Journal of Environmental Monitoring. 11, 1952-1963. Klopffer, W., Frank, R., Kohl, E. G., Haag, F. (1986) Quantitative presentation of photochemical transformation processes in the troposphere. Chemiker-Zeitung. 110, 57-61. Kojima, Y., Inazu, K., Hisamatsu, Y., Okochi, H., Baba, T., Nagoya, T. (2010) Changes in Concentration Levels of Polycyclic Aromatic Compounds Associated with Airborne Particulate Matter in Downtown Tokyo after Introducing Government Diesel Vehicle Controls. Asian Journal of Atmospheric Environment. 4, 1-8. Korfmacher, W. A., Natusch, D. F. S., Taylor, D. R., Mamantov, G., Wehry, E. L. (1980) Oxidative transformations of polycyclic aromatic-hydrocarbons adsorbed on coal fly-ash. Science. 207, 763-765. Krol, M., Lelieveld, J. (2003) Can the variability in tropospheric OH be deduced from measurements of 1,1,1-trichloroethane (methyl chloroform)? Journal of Geophysical Research-Atmospheres. 108. Kumagai, Y. (2009) Polycyclic Aromatic Hydrocarbon Quinones as Redox and Electrophilic Chemicals Contaminated in the Atmosphere. Journal of Health Science. 55, 887-894. Kwamena, N. O. A., Thornton, J. A., Abbatt, J. P. D. (2004) Kinetics of surface-bound benzo a pyrene and ozone on solid organic and salt aerosols. Journal of Physical Chemistry A. 108, 11626-11634. Kwamena, N. O. A., Earp, M. E., Young, C. J., Abbatt, J. P. D. (2006) Kinetic and product yield study of the heterogeneous gas-surface reaction of anthracene and ozone. Journal of Physical Chemistry A. 110, 3638-3646. Kwok, E. S. C., Atkinson, R., Arey, J. (1994a) Kinetics and mechanisms of the gas-phase reactions of the NO3 radical with aromatic-compounds. International Journal of Chemical Kinetics. 26, 511-525.

288
Kwok, E. S. C., Harger, W. P., Arey, J., Atkinson, R. (1994b) Reactions of gas-phase phenanthrene under simulated atmospheric conditions. Environ Sci Technol. 28, 521-527. Kwok, E. S. C., Atkinson, R., Arey, J. (1995) Rate constants for the gas-phase reactions of the oh radical with dichlorobiphenyls, 1-chlorodibenzo-p-dioxin, 1,2-dimethoxybenzene, and diphenyl ether - estimation of OH radical reaction-rate constants for PCBs, PCDDs AND PCDFs. Environ Sci Technol. 29, 1591-1598. Kwok, E. S. C., Atkinson, R., Arey, J. (1997) Kinetics of the gas-phase reactions of indan, indene, fluorene, and 9,10-dihydroanthracene with OH radicals, NO3 radicals, and O-3. International Journal of Chemical Kinetics. 29, 299-309. Lammel, G., Klanova, J., Kohoutek, J., Prokes, R., Ries, L., Stohl, A. (2009) Observation and origin of organochlorine compounds and polycyclic aromatic hydrocarbons in the free troposphere over central Europe. Environmental Pollution. 157, 3264-3271. Lammel, G., Novák, J., Landlová, L., Dvorská, A., Klánová, J., Čupr, P., Kohoutek, J., Reimer, E., Škrdlíková, L. . (2010) Sources and distributions of polycyclic aromatic hydrocarbons and toxicity of polluted atmosphere aerosols. In: Urban Airborne Particulate Matter: Origins, Chemistry, Fate and Health Impacts, Zereini F, Wiseman CLS (eds) Springer, Berlin, pp 39-62. Lane, D. A., Katz, M. (1977) The Photomodification of Benzo a pyrene, Benzo b fluoranthene, and Benzo k fluoranthene under Simulated Atmospheric Conditions. in Fate of Pollutants in the Air and Water Environments, Part 2 (A Suffet, Ed), Wiley-Interscience, New York, pp. 133 -154. Laurie, E. H. (2003) Source apportionment of urban atmospheric polycyclic aromatic hydrocarbons PhD thesis, University of Birmingham, United Kingdom Lawther, P. J., Waller, R. E. (1976) Coal fires, industrial emissions and motor vehicles as sources of environmental carcinogens. IARC scientific publications, 27-40. Lee, H. K. (1995) Recent applications of gas and high-performance liquid-chromatographic techniques to the analysis of polycyclic aromatic-hydrocarbons in airborne-particulates. Journal of Chromatography A. 710, 79-92. Lee, J., Lane, D. A. (2010) Formation of oxidized products from the reaction of gaseous phenanthrene with the OH radical in a reaction chamber. Atmospheric Environment. 44, 2469-2477. Lee, J. Y., Lane, D. A. (2009) Unique products from the reaction of naphthalene with the hydroxyl radical. Atmospheric Environment. 43, 4886-4893. Lee, J. Y., Lane, D. A., Heo, J. B., Yi, S.-M., Kim, Y. P. (2012) Quantification and seasonal pattern of atmospheric reaction products of gas phase PAHs in PM2.5. Atmospheric Environment. 55, 17-25. Lee, R. G. M., Hung, H., Mackay, D., Jones, K. C. (1998) Measurement and modeling of the diurnal cycling of atmospheric PCBs and PAHs. Environ Sci Technol. 32, 2172-2179. Lee, R. G. M., Jones, K. C. (1999) The influence of meteorology and air masses on daily atmospheric PCB and PAH concentrations at a UK location. Environ Sci Technol. 33, 705-712.

289
Lee, W., Stevens, P. S., Hites, R. A. (2003) Rate constants for the gas-phase reactions of methylphenanthrenes with OH as a function of temperature. Journal of Physical Chemistry A. 107, 6603-6608. Lewis, A. C., Robinson, R. E., Bartle, K. D., Pilling, M. J. (1995) Online coupled lg-gc-itd/ms for the identification of alkylated, oxygenated, and nitrated polycyclic aromatic-compounds in urban air particulate extracts. Environ Sci Technol. 29, 1977-1981. Lewtas, J., Chuang, J., Nishioka, M., Petersen, B. (1990) Bioassay-directed fractionation of the organic extract of SRM-1649 urban air particulate matter. International Journal of Environmental Analytical Chemistry. 39, 245-256. Liberti, A., Ciccioli, P. (1986) High-resolution chromatographic techniques for the evaluation of atmospheric pollutants. Journal of High Resolution Chromatography & Chromatography Communications. 9, 492-501. Ligocki, M. P., Leuenberger, C., Pankow, J. F. (1985) Trace organic-compounds in rain .3. particle scavenging of neutral organic-compounds. Atmospheric Environment. 19, 1619-1626. Ligocki, M. P., Pankow, J. F. (1989) Measurements of the gas particle distributions of atmospheric organic-compounds. Environ Sci Technol. 23, 75-83. Lim, L. H., Harrison, R. M., Harrad, S. (1999) The contribution of traffic to atmospheric concentrations of polycyclic aromatic hydrocarbons. Environ Sci Technol. 33, 3538-3542. Lin, T. C., Chang, F. H., Hsieh, J. H., Chao, H. R., Chao, M. R. (2002) Characteristics of polycyclic aromatic hydrocarbons and total suspended particulate in indoor and outdoor atmosphere of a Taiwanese temple. Journal of Hazardous Materials. 95, 1-12. Lindskog, A., Brorstroem-Lunden, E., Sjoedin, A. (1985) Transformations of reactive PAH on particles by exposure to oxidised nitrogen compounds and ozone. Environment International. 11, 125-130. Lintelmann, J., Fischer, K., Matuschek, G. (2006) Determination of oxygenated polycyclic aromatic hydrocarbons in particulate matter using high-performance liquid chromatography-tandem mass spectrometry. Journal of Chromatography A. 1133, 241-247. Liu, C., Zhang, P., Yang, B., Wang, Y., Shu, J. (2012) Kinetic Studies of Heterogeneous Reactions of Polycyclic Aromatic Hydrocarbon Aerosols with NO3 Radicals. Environ Sci Technol. 46, 7575-7580. Liu, L. B., Liu, Y., Lin, J. M., Tang, N., Hayakawa, K., Maeda, T. (2007) Development of analytical methods for polycyclic aromatic hydrocarbons (PAHs) in airborne particulates: A review. Journal of Environmental Sciences-China. 19, 1-11. Liu, Y., Liu, L., Lin, J.-M., Tang, N., Hayakawa, K. (2006a) Distribution and characterization of polycyclic aromatic hydrocarbon compounds in airborne particulates of east asia. China Particuology. 4, 283-292. Liu, Y., Sklorz, M., Schnelle-Kreis, J., Orasche, J., Ferge, T., Kettrup, A., et al. (2006b) Oxidant denuder sampling for analysis of polycyclic aromatic hydrocarbons and their oxygenated derivates in ambient aerosol: Evaluation of sampling artefact. Chemosphere. 62, 1889-1898.
290
Lorenz, K., Zellner, R. (1983) Kinetics of the reactions of OH-radicals with benzene, benzene-d6 and naphthalene. Berichte Der Bunsen-Gesellschaft-Physical Chemistry Chemical Physics. 87, 629-636. Ma, J., Liu, Y., He, H. (2011) Heterogeneous reactions between NO(2) and anthracene adsorbed on SiO(2) and MgO. Atmospheric Environment. 45, 917-924. Magnotta, F., Johnston, H. S. (1980) Photo-dissociation quantum yields for the NO3 free-radical. Geophysical Research Letters. 7, 769-772. Mak, J., Gross, S., Bertram, A. K. (2007) Uptake of NO(3) on soot and pyrene surfaces. Geophysical Research Letters. 34. Mari, M., Harrison, R. M., Schuhmacher, M., Domingo, J. L., Pongpiachan, S. (2010) Inferences over the sources and processes affecting polycyclic aromatic hydrocarbons in the atmosphere derived from measured data. Sci Total Environ. 408, 2387-2393. Marino, F., Cecinato, A., Siskos, P. A. (2000) Nitro-PAH in ambient particulate matter in the atmosphere of Athens. Chemosphere. 40, 533-537. Marinov, D., Dueri, S., Puillat, I., Carafa, R., Jurado, E., Berrojalbiz, N., et al. (2009) Integrated modelling of Polycyclic Aromatic Hydrocarbons in the marine environment: Coupling of hydrodynamic, fate and transport, bioaccumulation and planktonic food-web models. Marine Pollution Bulletin. 58, 1554-1561. Marr, L. C., Kirchstetter, T. W., Harley, R. A., Miguel, A. H., Hering, S. V., Hammond, S. K. (1999) Characterization of polycyclic aromatic hydrocarbons in motor vehicle fuels and exhaust emissions. Environ Sci Technol. 33, 3091-3099. Mastral, A. M., Callen, M. S., Lopez, J. M., Murillo, R., Garcia, T., Navarro, M. V. (2003a) Critical review on atmospheric PAR Assessment of reported data in the Mediterranean basin. Fuel Processing Technology. 80, 183-193. Mastral, A. M., Lopez, J. M., Callen, M. S., Garcia, T., Murillo, R., Navarro, M. V. (2003b) Spatial and temporal PAH concentrations in Zaragoza, Spain. Sci Total Environ. 307, 111-124. Matsumoto, Y., Sakai, S., Kato, T., Nakajima, T., Satoh, H. (1998) Long-term trends of particulate mutagenic activity in the atmosphere of Sapporo. 1. Determination of mutagenic activity by the conventional tester strains TA98 and TA100 during an 18-year period (1974-1992). Environ Sci Technol. 32, 2665-2671. McDonald, J. D., Zielinska, B., Fujita, E. M., Sagebiel, J. C., Chow, J. C., Watson, J. G. (2000) Fine particle and gaseous emission rates from residential wood combustion. Environ Sci Technol. 34, 2080-2091. McDonald, J. D., Zielinska, B., Sagebiel, J. C., McDaniel, M. R. (2002) Characterization of fine particle material in ambient air and personal samples from an underground mine. Aerosol Science and Technology. 36, 1033-1044. Meijer, S. N., Sweetman, A. J., Halsall, C. J., Jones, K. C. (2008) Temporal trends of polycyclic aromatic hydrocarbons in the UK atmosphere: 1991-2005. Environ Sci Technol. 42, 3213-3218. Miet, K., Budzinski, H., Villenave, E. (2009a) Heterogeneous reactions of OH radicals with particulate-pyrene and 1-nitropyrene of atmospheric interest. Polycyclic Aromatic Compounds. 29, 267-281.
291
Miet, K., Le Menach, K., Flaud, P. M., Budzinski, H., Villenave, E. (2009b) Heterogeneous reactions of ozone with pyrene, 1-hydroxypyrene and 1-nitropyrene adsorbed on particles. Atmospheric Environment. 43, 3699-3707. Miet, K., Le Menach, K., Flaud, P. M., Budzinski, H., Villenave, E. (2009c) Heterogeneous reactivity of pyrene and 1-nitropyrene with NO2: Kinetics, product yields and mechanism. Atmospheric Environment. 43, 837-843. Miguel, A. H., Pereira, P. A. P. (1989) Benzo(k)fluoranthene, Benzo(ghi)perylene, and Indeno(1,2,3-cd)pyrene: New Tracers of Automotive Emissions in Receptor Modeling. Aerosol Science and Technology. 10, 292-295. Miguel, A. H., Kirchstetter, T. W., Harley, R. A., Hering, S. V. (1998) On-road emissions of particulate polycyclic aromatic hydrocarbons and black carbon from gasoline and diesel vehicles. Environ Sci Technol. 32, 450-455. Miguel, A. H., Eiguren-Fernandez, A., Jaques, P. A., Froines, J. R., Grant, B. L., Mayo, P. R., et al. (2004) Seasonal variation of the particle size distribution of polycyclic aromatic hydrocarbons and of major aerosol species in Claremont, California. Atmospheric Environment. 38, 3241-3251. Mmereki, B. T., Donaldson, D. J. (2003) Direct observation of the kinetics of an atmospherically important reaction at the air-aqueous interface. Journal of Physical Chemistry A. 107, 11038-11042. Mmereki, B. T., Donaldson, D. J., Gilman, J. B., Eliason, T. L., Vaida, V. (2004) Kinetics and products of the reaction of gas-phase ozone with anthracene adsorbed at the air-aqueous interface. Atmospheric Environment. 38, 6091-6103. Murahashi, T., Hayakawa, K. (1997) A sensitive method for the determination of 6-nitrochrysene, 2-nitro-fluoranthene and 1-, 2- and 4-nitropyrenes in airborne particulates using high-performance liquid chromatography with chemiluminescence detection. Analytica Chimica Acta. 343, 251-257. Murrells, T. P., Passant, N. R., Thistlethwaite, G., Wagner, A., Li, Y., Bush, T., et al. (2010) UK Emissions of Air Pollutants 1970 to 2008. AEAT/ENV/R/3036, Defra, London. Nassar, H. F., Tang, N., Kameda, T., Toriba, A., Khoder, M. I., Hayakawa, K. (2011) Atmospheric concentrations of polycyclic aromatic hydrocarbons and selected nitrated derivatives in Greater Cairo, Egypt. Atmospheric Environment. 45, 7352-7359. Neususs, C., Pelzing, M., Plewka, A., Herrmann, H. (2000) A new analytical approach for size-resolved speciation of organic compounds in atmospheric aerosol particles: Methods and first results. Journal of Geophysical Research-Atmospheres. 105, 4513-4527. Newton, D. L., Erickson, M. D., Tomer, K. B., Pellizzari, E. D., Gentry, P., Zweidinger, R. B. (1982) Identification of nitroaromatics in diesel exhaust particulate using gas-chromatography negative-ion chemical ionization mass-spectrometry and other techniques. Environ Sci Technol. 16, 206-213. Nguyen, M. L., Bedjanian, Y., Guilloteau, A. (2009) Kinetics of the reactions of soot surface-bound polycyclic aromatic hydrocarbons with NO2. Journal of Atmospheric Chemistry. 62, 139-150. Nicol, S., Dugay, J., Hennion, M. C. (2001) Determination of oxygenated polycyclic aromatic compounds in airborne particulate organic matter using gas chromatography tandem mass spectrometry. Chromatographia. 53, S464-S469.

292
Niederer, M. (1998) Determination of polycyclic aromatic hydrocarbons and substitutes (nitro-, oxy-PAHs) in urban soil and airborne particulate by GC-MS and NCI-MS/MS. Environmental Science and Pollution Research. 5, 209-216. Nielsen, T. (1984) Reactivity of polycyclic aromatic-hydrocarbons toward nitrating species. Environ Sci Technol. 18, 157-163. Nielsen, T., Seitz, B., Ramdahl, T. (1984) Occurrence of nitro-PAH in the atmosphere in a rural area. Atmospheric Environment. 18, 2159-2165. Nielsen, T. (1996) Traffic contribution of polycyclic aromatic hydrocarbons in the center of a large city. Atmospheric Environment. 30, 3481-3490. Nielsen, T., Feilberg, A., Binderup, M. L. (1999) The variation of street air levels of PAH and other mutagenic PAC in relation to regulations of traffic emissions and the impact of atmospheric processes. Environmental Science and Pollution Research. 6, 133-137. Nikolaou, K., Masclet, P., Mouvier, G. (1984) Sources and chemical-reactivity of polynuclear aromatic-hydrocarbons in the atmosphere - a critical-review. Sci Total Environ. 32, 103-132. Nishino, N., Atkinson, R., Arey, J. (2008) Formation of Nitro Products from the Gas-Phase OH Radical-Initiated Reactions of Toluene, Naphthalene, and Biphenyl: Effect of NO2 Concentration. Environ Sci Technol. 42, 9203-9209. Nishioka, M. G., Chuang, C. C., Petersen, B. A., Austin, A., Lewtas, J. (1985) Development and quantitative-evaluation of a compound class fractionation scheme for bioassay-directed characterization of ambient air particulate matter. Environment International. 11, 137-146. Niu, J. F., Yang, Z. F., Shen, Z. Y., Long, X. X. (2005) Estimation of photolysis lifetimes of the nitronaphthalenes and methylnitronaphthalenes. Bulletin of Environmental Contamination and Toxicology. 75, 813-819. Nizzetto, L., Lohmann, R., Gioia, R., Jahnke, A., Temme, C., Dachs, J., et al. (2008) PAHs in air and seawater along a North-South Atlantic transect: Trends, processes and possible sources. Environ Sci Technol. 42, 1580-1585. Oda, J., Maeda, I., Mori, T., Yasuhara, A., Saito, Y. (1998) The relative proportions of polycyclic aromatic hydrocarbons and oxygenated derivatives in accumulated organic particulates as affected by air pollution sources. Environmental Technology. 19, 961-976. Oda, J., Nomura, S., Yasuhara, A., Shibamoto, T. (2001) Mobile sources of atmospheric polycyclic aromatic hydrocarbons in a roadway tunnel. Atmospheric Environment. 35, 4819-4827. OECD. (2012) Environmental Outlook to 2050 : the consequences of inaction OECD Publishing, http://dxdoiorg/101787/9789264122246-en. Ohura, T., Amagai, T., Sugiyama, T., Fusaya, M., Matsushita, H. (2004) Characteristics of particle matter and associated polycyclic aromatic hydrocarbons in indoor and outdoor air in two cities in Shizuoka, Japan. Atmospheric Environment. 38, 2045-2054. Ohura, T., Kitazawa, A., Amagai, T., Makino, M. (2005) Occurrence, profiles, and photostabilities of chlorinated polycyclic aromatic hydrocarbons associated with particulates in urban air. Environ Sci Technol. 39, 85-91.

293
Okuda, T., Okamoto, K., Tanaka, S., Shen, Z., Han, Y., Huo, Z. (2010) Measurement and source identification of polycyclic aromatic hydrocarbons (PAHs) in the aerosol in Xi'an, China, by using automated column chromatography and applying positive matrix factorization (PMF). Sci Total Environ. 408, 1909-1914. Pankow, J. F. (1987) Review and comparative-analysis of the theories on partitioning between the gas and aerosol particulate phases in the atmosphere. Atmospheric Environment. 21, 2275-2283. Pankow, J. F., Bidleman, T. F. (1992) Interdependence of the slopes and intercepts from log log correlations of measured gas particle partitioning and vapor-pressure .1. Theory and analysis of available data. Atmospheric Environment Part a-General Topics. 26, 1071-1080. Paputa-Peck, M. C., Marano, R. S., Schuetzle, D., Riley, T. L., Hampton, C. V., Prater, T. J., et al. (1983) Determination of nitrated polynuclear aromatic-hydrocarbons in particulate extracts by capillary column gas-chromatography with nitrogen selective detection. Analytical Chemistry. 55, 1946-1954. Park, D., Oh, M., Yoon, Y., Park, E., Lee, K. (2012) Source identification of PM10 pollution in subway passenger cabins using positive matrix factorization. Atmospheric Environment. 49, 180-185. Park, E.-J., Kim, D.-S., Park, K. (2008) Monitoring of ambient particles and heavy metals in a residential area of Seoul, Korea. Environmental Monitoring and Assessment. 137, 441-449. Park, S. S., Kim, Y. J., Kang, C. H. (2002) Atmospheric polycyclic aromatic hydrocarbons in Seoul, Korea. Atmospheric Environment. 36, 2917-2924. Patton, G. W., Walla, M. D., Bidleman, T. F., Barrie, L. A. (1991) Polycyclic aromatic and organochlorine compounds in the atmosphere of Northern Ellesmere-Island, Canada. Journal of Geophysical Research-Atmospheres. 96, 10867-10877. Pedersen, D. U., Durant, J. L., Penman, B. W., Crespi, C. L., Hemond, H. F., Lafleur, A. L., et al. (2004) Human-cell mutagens in respirable airborne particles in the northeastern United States. 1. Mutagenicity of fractionated samples. Environ Sci Technol. 38, 682-689. Pedersen, D. U., Durant, J. L., Taghizadeh, K., Hemond, H. F., Lafleur, A. L., Cass, G. R. (2005) Human cell mutagens in respirable airborne particles from the Northeastern United States. 2. Quantification of mutagens and other organic compounds. Environ Sci Technol. 39, 9547-9560. Pedersen, P. S., Ingwersen, J., Nielsen, T., Larsen, E. (1980) Effects of fuel, lubricant, and engine operating parameters on the emission of polycyclic aromatic-hydrocarbons. Environ Sci Technol. 14, 71-79. Peltonen, K., Kuljukka, T. (1995) Air sampling and analysis of polycyclic aromatic-hydrocarbons. Journal of Chromatography A. 710, 93-108. Perraudin, E., Budzinski, H., Villenave, E. (2005) Kinetic study of the reactions of NO2 with polycyclic aromatic hydrocarbons adsorbed on silica particles. Atmospheric Environment. 39, 6557-6567. Perraudin, E., Budzinski, H., Villenave, E. (2007a) Identification and quantification of ozonation products of anthracene and phenanthrene adsorbed on silica particles. Atmospheric Environment. 41, 6005-6017.
294
Perraudin, E., Budzinski, H., Villenave, E. (2007b) Kinetic study of the reactions of ozone with polycyclic aromatic hydrocarbons adsorbed on atmospheric model particles. Journal of Atmospheric Chemistry. 56, 57-82. Perrone, M. G., Carbone, C., Faedo, D., Ferrero, L., Maggioni, A., Sangiorgi, G., et al. (2014) Exhaust emissions of polycyclic aromatic hydrocarbons, n-alkanes and phenols from vehicles coming within different European classes. Atmospheric Environment. 82, 391-400. Phousongphouang, P. T., Arey, J. (2002) Rate constants for the gas-phase reactions of a series of alkylnaphthalenes with the OH radical. Environ Sci Technol. 36, 1947-1952. Phousongphouang, P. T., Arey, J. (2003a) Rate constants for the photolysis of the nitronaphthalenes and methylnitronaphthalenes. Journal of Photochemistry and Photobiology a-Chemistry. 157, 301-309. Phousongphouang, P. T., Arey, J. (2003b) Rate constants for the gas-phase reactions of a series of alkylnaphthalenes with the nitrate radical. Environ Sci Technol. 37, 308-313. Phuleria, H. C., Geller, M. D., Fine, P. M., Sioutas, C. (2006) Size-resolved emissions of organic tracers from light-and heavy-duty vehicles measured in a California roadway tunnel. Environ Sci Technol. 40, 4109-4118. Pitts, J. N., Grosjean, D., Mischke, T. M., Simmon, V. F., Poole, D. (1977) Mutagenic activity of airborne particulate organic pollutants. Toxicology Letters. 1, 65-70. Pitts, J. N., Vancauwenberghe, K. A., Grosjean, D., Schmid, J. P., Fitz, D. R., Belser, W. L., et al. (1978) Atmospheric reactions of polycyclic aromatic-hydrocarbons - facile formation of mutagenic nitro-derivatives. Science. 202, 515-519. Pitts, J. N., Lokensgard, D. M., Ripley, P. S., Vancauwenberghe, K. A., Vanvaeck, L., Shaffer, S. D., et al. (1980) Atmospheric epoxidation of benzo alpha pyrene by ozone - formation of the metabolite benzo alpha pyrene-4,5-oxide. Science. 210, 1347-1349. Pitts, J. N., Lokensgard, D. M., Harger, W., Fisher, T. S., Mejia, V., Schuler, J. J., et al. 1982. Mutagens in diesel exhaust particulate identification and direct activities of 6-nitrobenzo a pyrene, 9-nitroanthracene, 1-nitropyrene and 5h-phenanthro 4,5-bcd pyran-5-one. Mutation Research, 103, 241-249. Pitts, J. N. (1983) Formation and fate of gaseous and particulate mutagens and carcinogens in real and simulated atmospheres. Environmental Health Perspectives. 47, 115-140. Pitts, J. N., Atkinson, R., Sweetman, J. A., Zielinska, B. (1985a) The gas-phase reaction of naphthalene with N2O5 to form nitronaphthalenes. Atmospheric Environment. 19, 701-705. Pitts, J. N., Sweetman, J. A., Zielinska, B., Atkinson, R., Winer, A. M., Harger, W. P. (1985b) Formation of nitroarenes from the reaction of polycyclic aromatic-hydrocarbons with dinitrogen pentaoxide. Environ Sci Technol. 19, 1115-1121. Pitts, J. N., Zielinska, B., Sweetman, J. A., Atkinson, R., Winer, A. M. (1985c) Reactions of adsorbed pyrene and perylene with gaseous N2O5 under simulated atmospheric conditions. Atmospheric Environment. 19, 911-915. Pitts, J. N., Paur, H. R., Zielinska, B., Arey, J., Winer, A. M., Ramdahl, T., et al. (1986) Factors influencing the reactivity of polycyclic aromatic-hydrocarbons adsorbed on filters and ambient POM with ozone. Chemosphere. 15, 675-685.
295
POST. (2014) Ambient Air Quality Parliamentary Office of Science and Technology, London Poster, D. L., Schantz, M. M., Sander, L. C., Wise, S. A. (2006) Analysis of polycyclic aromatic hydrocarbons (PAHs) in environmental samples: a critical review of gas chromatographic (GC) methods. Analytical and Bioanalytical Chemistry. 386, 859-881. Prevedouros, K., Brorstrom-Lunden, E., Halsall, C. J., Jones, K. C., Lee, R. G. M., Sweetman, A. J. (2004a) Seasonal and long-term trends in atmospheric PAH concentrations: Evidence and implications. Environmental Pollution. 128, 17-27. Prevedouros, K., Jones, K. C., Sweetman, A. J. (2004b) Modelling the atmospheric fate and seasonality of polycyclic aromatic hydrocarbons in the UK. Chemosphere. 56, 195-208. Primbs, T., Piekarz, A., Wilson, G., Schmedding, D., Higginbotham, C., Field, J., et al. (2008) Influence of Asian and Western United States urban areas and fires on the atmospheric transport of polycyclic aromatic hydrocarbons, polychlorinated biphenyls, and fluorotelomer alcohols in the Western United States. Environ Sci Technol. 42, 6385-6391. Prinn, R. G., Huang, J., Weiss, R. F., Cunnold, D. M., Fraser, P. J., Simmonds, P. G., et al. (2005) Evidence for variability of atmospheric hydroxyl radicals over the past quarter century. Geophysical Research Letters. 32. Qu, X., Zhang, Q., Wang, W. (2006a) Theoretical study on mechanism for NO3-initiated atmospheric oxidation of naphthalene. Chemical Physics Letters. 432, 40-49. Qu, X., Zhang, Q., Wang, W. (2006b) Mechanism for OH-initiated photooxidation of naphthalene in the presence of O-2 and NOx: A DFT study. Chemical Physics Letters. 429, 77-85. Ramdahl, T. (1983) Retene - a molecular marker of wood combustion in ambient air. Nature. 306, 580-583. Ramdahl, T., Bjorseth, A., Lokensgard, D. M., Pitts, J. N. (1984) Nitration of polycyclic aromatic-hydrocarbons adsorbed to different carriers in a fluidized-bed reactor. Chemosphere. 13, 527-534. Ramdahl, T., Zielinska, B., Arey, J., Atkinson, R., Winer, A. M., Pitts, J. N. (1986) Ubiquitous occurrence of 2-nitrofluoranthene and 2-nitropyrene in air. Nature. 321, 425-427. Rappaport, S. M., Wang, Y. Y., Wei, E. T., Sawyer, R., Watkins, B. E., Rapoport, H. (1980) Isolation and identification of a direct-acting mutagen in diesel-exhaust particulates. Environ Sci Technol. 14, 1505-1509. Rappaport, S. M., Jin, Z. L., Xu, X. B. (1982) High-performance liquid-chromatography with reductive electrochemical detection of mutagenic nitro-substituted polynuclear aromatic-hydrocarbons in diesel exhausts. Journal of Chromatography. 240, 145-154. Ratcliff, M. A., Dane, A. J., Williams, A., Ireland, J., Luecke, J., McCormick, R. L., et al. (2010) Diesel Particle Filter and Fuel Effects on Heavy-Duty Diesel Engine Emissions. Environ Sci Technol. 44, 8343-8349. Ravindra, K., Sokhi, R., Van Grieken, R. (2008) Atmospheric polycyclic aromatic hydrocarbons: Source attribution, emission factors and regulation. Atmospheric Environment. 42, 2895-2921. Reff, A., Eberly, S., Bhave, P. V. (2007) Receptor modeling of ambient particulate matter data using positive matrix factorization: Review of existing methods. J Air Waste Manage Assoc. 57, 146-154.
296
Reisen, F., Arey, J. (2002) Reactions of hydroxyl radicals and ozone with acenaphthene and acenaphthylene. Environ Sci Technol. 36, 4302-4311. Reisen, F., Wheeler, S., Arey, J. (2003) Methyl- and dimethyl-/ethyl-nitronaphthalenes measured in ambient air in Southern California. Atmospheric Environment. 37, 3653-3657. Reisen, F., Arey, J. (2005) Atmospheric reactions influence seasonal PAH and nitro-PAH concentrations in the Los Angeles basin. Environ Sci Technol. 39, 64-73. Rhead, M. M., Pemberton, R. D. (1996) Sources of naphthalene in diesel exhaust emissions. Energy & Fuels. 10, 837-843. Ringuet, J., Albinet, A., Leoz-Garziandia, E., Budzinski, H., Villenave, E. (2012a) Diurnal/nocturnal concentrations and sources of particulate-bound PAHs, OPAHs and NPAHs at traffic and suburban sites in the region of Paris (France). Sci Total Environ. 437, 297-305. Ringuet, J., Albinet, A., Leoz-Garziandia, E., Budzinski, H., Villenave, E. (2012b) Reactivity of polycyclic aromatic compounds (PAHs, NPAHs and OPAHs) adsorbed on natural aerosol particles exposed to atmospheric oxidants. Atmospheric Environment. 61, 15-22. Ringuet, J., Leoz-Garziandia, E., Budzinski, H., Villenave, E., Albinet, A. (2012c) Particle size distribution of nitrated and oxygenated polycyclic aromatic hydrocarbons (NPAHs and OPAHs) on traffic and suburban sites of a European megacity: Paris (France). Atmospheric Chemistry and Physics. 12, 8877-8887. Rogge, W. F., Hildemann, L. M., Mazurek, M. A., Cass, G. R., Simoneit, B. R. T. (1993a) Sources of fine organic aerosol .2. Noncatalyst and catalyst-equipped automobiles and heavy-duty diesel trucks. Environ Sci Technol. 27, 636-651. Rogge, W. F., Hildemann, L. M., Mazurek, M. A., Cass, G. R., Simoneit, B. R. T. (1993b) Sources of fine organic aerosol .3. road dust, tire debris, and organometallic brake lining dust - roads as sources and sinks. Environ Sci Technol. 27, 1892-1904. Rogge, W. F., Hildemann, L. M., Mazurek, M. A., Cass, G. R., Simoneit, B. R. T. (1993c) Sources of Fine Organic Aerosol. 5. Natural Gas Home Appliances. Environ Sci Technol. 27, 2736-2744. Rogge, W. F., Hildemann, L. M., Mazurek, M. A., Cass, G. R., Simoneit, B. R. T. (1998) Sources of fine organic aerosol. 9. Pine, oak and synthetic log combustion in residential fireplaces. Environ Sci Technol. 32, 13-22. Romero, R., Sienra, R., Richter, P. (2002) Efficient screening method for determination of polycyclic aromatic hydrocarbons (PAHs) in airborne particles. Application in real samples of Santiago-Chile metropolitan urban area. Atmospheric Environment. 36, 2375-2381. Rosenkranz, H. S., Mermelstein, R. (1983) Mutagenicity and genotoxicity of nitroarenes: All nitro-containing chemicals were not created equal. Mutation Research/Reviews in Genetic Toxicology. 114, 217-267. Ross, J. A., Nelson, G. B., Wilson, K. H., Rabinowitz, J. R., Galati, A., Stoner, G. D., et al. (1995) Adenomas induced by polycyclic aromatic-hydrocarbons in strain a/j mouse lung correlate with time-integrated dna adduct levels. Cancer Research. 55, 1039-1044.
297
Ruehle, P. H., Bosch, L.C., Duncan, W.P. (1985) Synthesis of nitrated polycyclic aromatic hydrocarbons. In: White, CM (Ed), Nitrated Polycyclic Aromatic Hydrocarbons Huethig, Heidelberg, pp 170-235. Salmeen, I., Durisin, A. M., Prater, T. J., Riley, T., Schuetzle, D. (1982) Contribution of 1-nitropyrene to direct-acting ames assay mutagenicities of diesel particulate extracts. Mutation Research. 104, 17-23. Salmeen, I. T., Pero, A. M., Zator, R., Schuetzle, D., Riley, T. L. (1984) Ames assay chromatograms and the identification of mutagens in diesel particle extracts. Environ Sci Technol. 18, 375-382. Sasaki, J., Arey, J., Eastmond, D. A., Parks, K. K., Grosovsky, A. J. (1997a) Genotoxicity induced in human lymphoblasts by atmospheric reaction products of naphthalene and phenanthrene. Mutation Research-Genetic Toxicology and Environmental Mutagenesis. 393, 23-35. Sasaki, J., Aschmann, S. M., Kwok, E. S. C., Atkinson, R., Arey, J. (1997b) Products of the gas-phase OH and NO3 radical-initiated reactions of naphthalene. Environ Sci Technol. 31, 3173-3179. Sato, S., Ohgaki, H., Takayama, S., Ochiai, M., Tahira, T., Ishizaka, Y., et al. (1986) Carcinogenicity of dinitropyrenes in rats and hamsters. Developments in toxicology and environmental science. 13, 271-277. Schauer, C., Niessner, R., Poschl, U. (2003) Polycyclic aromatic hydrocarbons in urban air particulate matter: Decadal and seasonal trends, chemical degradation, and sampling artifacts. Environ Sci Technol. 37, 2861-2868. Schauer, J. J., Kleeman, M. J., Cass, G. R., Simoneit, B. R. T. (1999) Measurement of emissions from air pollution sources. 2. C-1 through C-30 organic compounds from medium duty diesel trucks. Environ Sci Technol. 33, 1578-1587. Schauer, J. J., Kleeman, M. J., Cass, G. R., Simoneit, B. R. T. (2002) Measurement of emissions from air pollution sources. 5. C-1-C-32 organic compounds from gasoline-powered motor vehicles. Environ Sci Technol. 36, 1169-1180. Schnelle-Kreis, E., Sklorz, M., Peters, A., Cyrys, J., Zimmermann, R. (2005) Analysis of particle-associated semi-volatile aromatic and aliphatic hydrocarbons in urban particulate matter on a daily basis. Atmospheric Environment. 39, 7702-7714. Schnelle-Kreis, J., Gebefugi, I., Welzl, G., Jaensch, T., Kettrup, A. (2001) Occurrence of particle-associated polycyclic aromatic compounds in ambient air of the city of Munich. Atmospheric Environment. 35, S71-S81. Schnelle-Kreis, J., Sklorz, M., Orasche, J., Stoelzel, M., Peters, A., Zimmermann, R. (2007) Semi volatile organic compounds in ambient PM(2.5). Seasonal trends and daily resolved source contributions. Environ Sci Technol. 41, 3821-3828. Schnelle, J., Jansch, T., Wolf, K., Gebefugi, I., Kettrup, A. (1995) Particle-size dependent concentrations of polycyclic aromatic-hydrocarbons (PAH) in the outdoor air. Chemosphere. 31, 3119-3127. Schuetzle, D., Lee, F. S. C., Prater, T. J., Tejada, S. B. (1981) The identification of polynuclear aromatic hydrocarbon (PAH) derivatives in mutagenic fractions of diesel particulate extracts. International Journal of Environmental Analytical Chemistry. 9, 93-144.

298
Schuetzle, D., Riley, T. L., Prater, T. J., Harvey, T. M., Hunt, D. F. (1982) Analysis of nitrated polycyclic aromatic-hydrocarbons in diesel particulates. Analytical Chemistry. 54, 265-271. Schuetzle, D., Perez, J. M. (1983) Factors influencing the emissions of nitrated-polynuclear aromatic hydrocarbons(nitro-PAH) from diesel-engines. Journal of the Air Pollution Control Association. 33, 751-755. Seinfeld, J. H., Pandis, S. N. (1998) Atmospheric Chemistry and Physics. From Air Pollution to Climate Change. . John Wiley & Sons, Inc ISBN0-471-17815-2.
Sharma, H., Jain, V. K., Khan, Z. H. (2007) Characterization and source identification of polycyclic aromatic hydrocarbons (PAHs) in the urban environment of Delhi. Chemosphere. 66, 302-310. Shen, G., Wei, S., Zhang, Y., Wang, R., Wang, B., Li, W., et al. (2012) Emission of oxygenated polycyclic aromatic hydrocarbons from biomass pellet burning in a modern burner for cooking in China. Atmospheric Environment. 60, 234-237. Shi, J. P., Harrison, R. M. (1997) Rapid NO2 formation in diluted petrol-fuelled engine exhaust - A source of NO2 in winter smog episodes. Atmospheric Environment. 31, 3857-3866. Shimada, T. (2006) Xenobiotic-metabolizing enzymes involved in activation and detoxification of carcinogenic polycyclic aromatic hydrocarbons. Drug Metab Pharmacokinet. 21, 257-276. Shimmo, M., Adler, H., Hyotylainen, T., Hartonen, K., Kulmala, M., Riekkola, M. L. (2002) Analysis of particulate polycyclic aromatic hydrocarbons by on-line coupled supercritical fluid extraction-liquid chromatography-gas chromatography-mass spectrometry. Atmospheric Environment. 36, 2985-2995. Shimmo, M., Anttila, P., Hartonen, K., Hyotylainen, T., Paatero, J., Kulmala, M., et al. (2004a) Identification of organic compounds in atmospheric aerosol particles by on-line supercritical fluid extraction-liquid chromatography-gas chromatography-mass spectrometry. Journal of Chromatography A. 1022, 151-159. Shimmo, M., Jantti, J., Aalto, P., Hartonen, K., Hyotylainen, T., Kulmala, M., et al. (2004b) Characterisation of organic compounds in aerosol particles from a Finnish forest by on-line coupled supercritical fluid extraction-liquid chromatography-gas chromatography-mass spectrometry. Analytical and Bioanalytical Chemistry. 378, 1982-1990. Sidhu, S., Gullett, B., Striebich, R., Klosterman, J., Contreras, J., DeVito, M. (2005) Endocrine disrupting chemical emissions from combustion sources: diesel particulate emissions and domestic waste open burn emissions. Atmospheric Environment. 39, 801-811. Sienra, M. D. (2006) Oxygenated polycyclic aromatic hydrocarbons in urban air particulate matter. Atmospheric Environment. 40, 2374-2384. Sienra, M. D., Rosazza, N. G. (2006) Occurrence of nitro-polycyclic aromatic hydrocarbons in urban particulate matter PM10. Atmospheric Research. 81, 265-276. Silibello, C., Calori, G., Costa, M. P., Dirodi, M. G., Mircea, M., Radice, P., et al. (2012) Benzo a pyrene modelling over Italy: comparison with experimental data and source apportionment. Atmospheric Pollution Research. 3, 399-407. Simcik, M. F., Franz, T. P., Zhang, H. X., Eisenreich, S. J. (1998) Gas-particle partitioning of PCBs and PAHs in the Chicago urban and adjacent coastal atmosphere: States of equilibrium. Environ Sci Technol. 32, 251-257.

299
Simoneit, B. R. T., Rogge, W. F., Mazurek, M. A., Standley, L. J., Hildemann, L. M., Cass, G. R. (1993) Lignin pyrolysis products, lignans, and resin acids as specific tracers of plant classes in emissions from biomass combustion. Environ Sci Technol. 27, 2533-2541. Simoneit, B. R. T., Bi, X., Oros, D. R., Medeiros, P. M., Sheng, G., Fu, J. (2007) Phenols and Hydroxy-PAHs (Arylphenols) as tracers for coal smoke particulate matter: Source tests and ambient aerosol assessments. Environ Sci Technol. 41, 7294-7302. Simonich, S. L., Hites, R. A. (1994) Importance of vegetation in removing polycyclic aromatic-hydrocarbons from the atmosphere. Nature. 370, 49-51. Sjogren, M., Li, H., Rannug, U., Westerholm, R. (1996) Multivariate analysis of exhaust emissions from heavy-duty diesel fuels. Environ Sci Technol. 30, 38-49. Sklorz, M., Briede, J.-J., Schnelle-Kreis, J., Liu, Y., Cyrys, J., de Kok, T. M., et al. (2007) Concentration of oxygenated polycyclic aromatic hydrocarbons and oxygen free radical formation from urban particulate matter. Journal of Toxicology and Environmental Health-Part a-Current Issues. 70, 1866-1869. Skrdlikova, L., Landlova, L., Klanova, J., Lammel, G. (2011) Wet deposition and scavenging efficiency of gaseous and particulate phase polycyclic aromatic compounds at a central European suburban site. Atmospheric Environment. 45, 4305-4312. Smith, D. J. T., Harrison, R. M. (1996) Concentrations, trends and vehicle source profile of polynuclear aromatic hydrocarbons in the UK atmosphere. Atmospheric Environment. 30, 2513-2525. Sofowote, U. M., Hung, H., Rastogi, A. K., Westgate, J. N., Deluca, P. F., Su, Y., et al. (2011) Assessing the long-range transport of PAH to a sub-Arctic site using positive matrix factorization and potential source contribution function. Atmospheric Environment. 45, 967-976. Souza, K. F., Carvalho, L. R. F., Allen, A. G., Cardoso, A. A. (2014) Diurnal and nocturnal measurements of PAH, nitro-PAH, and oxy-PAH compounds in atmospheric particulate matter of a sugar cane burning region. Atmospheric Environment. 83, 193-201. Staehelin, J., Keller, C., Stahel, W., Schläpfer, K., Wunderli, S. (1998) Emission factors from road traffic from a tunnel study (Gubrist tunnel, Switzerland). Part III: Results of organic compounds, SO2 and speciation of organic exhaust emission. Atmospheric Environment. 32, 999-1009. Stark, G., Stauff, J., Miltenburger, H. G., Stummfischer, I. (1985) Photodecomposition of 1-nitropyrene and other direct-acting mutagens extracted from diesel-exhaust particulates. Mutation Research. 155, 27-33. Strandell, M., Zakrisson, S., Alsberg, T., Westerholm, R., Winquist, L., Rannug, U. (1994) Chemical-analysis and biological testing of a polar fraction of ambient air, diesel-engine, and gasoline-engine particulate extracts. Environmental Health Perspectives. 102, 85-92. Sun, P., Blanchard, P., Brice, K. A., Hites, R. A. (2006) Trends in polycyclic aromatic hydrocarbon concentrations in the Great Lakes atmosphere. Environ Sci Technol. 40, 6221-6227. Tancell, P. J., Rhead, M. M., Pemberton, R. D., Braven, J. (1995a) Survival of polycyclic aromatic-hydrocarbons during diesel combustion. Environ Sci Technol. 29, 2871-2876.
300
Tancell, P. J., Rhead, M. M., Trier, C. J., Bell, M. A., Fussey, D. E. (1995b) The sources of benzo a pyrene in diesel exhaust emissions. Sci Total Environ. 162, 179-186. Tang, N., Tabata, M., Mishukov, V. F., Sergineko, V., Toriba, A., Kizu, R., et al. (2002) Comparison of atmospheric nitropolycyclic aromatic hydrocarbons in Vladivostok, Kanazawa and Toyama. Journal of Health Science. 48, 30-36. Tang, N., Hattori, T., Taga, R., Igarashi, K., Yang, X. Y., Tamura, K., et al. (2005) Polycyclic aromatic hydrocarbons and nitropolycyclic aromatic hydrocarbons in urban air particulates and their relationship to emission sources in the Pan-Japan Sea countries. Atmospheric Environment. 39, 5817-5826. Tokiwa, H., Nakagawa, R., Morita, K., Ohnishi, Y. (1981) Mutagenicity of nitro-derivatives induced by exposure of aromatic-compounds to nitrogen-dioxide. Mutation Research. 85, 195-205. Tokiwa, H., Nakagawa, R., Horikawa, K., Ohkubo, A. (1987) The nature of the mutagenicity and carcinogenicity of nitrated, aromatic-compounds in the environment. Environmental Health Perspectives. 73, 191-199. Tsapakis, M., Lagoudaki, E., Stephanou, E. G., Kavouras, I. G., Koutrakis, P., Oyola, P., et al. (2002) The composition and sources of PM2.5 organic aerosol in two urban areas of Chile. Atmospheric Environment. 36, 3851-3863. Tsapakis, M., Stephanou, E. G. (2003) Collection of gas and particle semi-volatile organic compounds: use of an oxidant denuder to minimize polycyclic aromatic hydrocarbons degradation during high-volume air sampling. Atmospheric Environment. 37, 4935-4944. Tsapakis, M., Stephanou, E. G. (2005) Occurrence of gaseous and particulate polycyclic aromatic hydrocarbons in the urban atmosphere: study of sources and ambient temperature effect on the gas/particle concentration and distribution. Environmental Pollution. 133, 147-156. Tsapakis, M., Stephanou, E. G. (2007) Diurnal cycle of PAHs, nitro-PAHs, and oxy-PAHs in a high oxidation capacity marine background atmosphere. Environ Sci Technol. 41, 8011-8017. Tuominen, J., Salomaa, S., Pyysalo, H., Skytta, E., Tikkanen, L., Nurmela, T., et al. (1988) Polynuclear aromatic-compounds and genotoxicity in particulate and vapor-phases of ambient air - effect of traffic, season, and meteorological conditions. Environ Sci Technol. 22, 1228-1234. UKPIA. (2012) Statistical Review, 2012. Umbuzeiro, G. A., Franco, A., Martins, M. H., Kummrow, F., Carvalho, L., Schmeiser, H. H., et al. (2008) Mutagenicity and DNA adduct formation of PAH, nitro-PAH, and oxy-PAH fractions of atmospheric particulate matter from Sao Paulo, Brazil. Mutation Research-Genetic Toxicology and Environmental Mutagenesis. 652, 72-80. UNECE. (1998) United Nations Economic Commission for Europe, Convention on Long-range Transboundary Air Pollution, Protocol on Persistent Organic Pollutants, Arhus, Denmark. United Nations Economic Commission for Europe, Convention on Long-range Transboundary Air Pollution, Protocol on Persistent Organic Pollutants, Arhus, Denmark. Valavanidis, A., Fiotakis, K., Vlahogianni, T., Papadimitriou, V., Pantikaki, V. (2006) Determination of Selective Quinones and Quinoid Radicals in Airborne Particulate Matter and Vehicular Exhaust Paricles Environmental Chemistry. 3, 118-123.

301
Valle-Hernandez, B. L., Mugica-Alvarez, V., Salinas-Talavera, E., Amador-Munoz, O., Murillo-Tovar, M. A., Villalobos-Pietrini, R., et al. (2010) Temporal variation of nitro-polycyclic aromatic hydrocarbons in PM(10) and PM(2.5) collected in Northern Mexico City. Sci Total Environ. 408, 5429-5438. Van Drooge, B. L., Fernandez, P., Grimalt, J. O., Stuchlik, E., Torres Garcia, C. J., Cuevas, E. (2010) Atmospheric polycyclic aromatic hydrocarbons in remote European and Atlantic sites located above the boundary mixing layer. Environmental Science and Pollution Research. 17, 1207-1216. Van Vaeck, L., Van Cauwenberghe, K. (1984) Conversion of poly cyclic aromatic hydro carbons on diesel particulate matter upon exposure to parts-per-million levels of ozone. Atmospheric Environment. 18, 323-328. Venkataraman, C., Friedlander, S. K. (1994) Size distributions of polycyclic aromatic-hydrocarbons and elemental carbon .2. ambient measurements and effects of atmospheric processes. Environ Sci Technol. 28, 563-572. Vione, D., Maurino, V., Minero, C., Pelizzetti, E., Harrison, M. A. J., Olariu, R. I., et al. (2006) Photochemical reactions in the tropospheric aqueous phase and on particulate matter. Chemical Society Reviews. 35, 441-453. Walgraeve, C., Demeestere, K., Dewulf, J., Zimmermann, R., Van Langenhove, H. (2010) Oxygenated polycyclic aromatic hydrocarbons in atmospheric particulate matter: Molecular characterization and occurrence. Atmospheric Environment. 44, 1831-1846. Wallington, T. J., Atkinson, R., Winer, A. M., Pitts, J. N. (1987) A study of the reaction NO3 + NO2 + M- N2O5 + M(M = N2, O2). International Journal of Chemical Kinetics. 19, 243-249. Wang, G., Kawamura, K., Zhao, X., Li, Q., Dai, Z., Niu, H. (2007) Identification, abundance and seasonal variation of anthropogenic organic aerosols from a mega-city in China. Atmospheric Environment. 41, 407-416. Wang, H. M., Hasegawa, K., Kagaya, S. (1999) Nitration of pyrene adsorbed on silica particles by nitrogen dioxide under simulated atmospheric conditions. Chemosphere. 39, 1923-1936. Wang, H. M., Hasegawa, K., Kagaya, S. (2000) The nitration of pyrene adsorbed on silica particles by nitrogen dioxide. Chemosphere. 41, 1479-1484. Wang, L., Atkinson, R., Arey, J. (2007a) Dicarbonyl products of the OH radical-initiated reactions of naphthalene and the C-1- and C-2-alkylnaphthalenes. Environ Sci Technol. 41, 2803-2810. Wang, L., Atkinson, R., Arey, J. (2007b) Formation of 9,10-phenanthrenequinone by atmospheric gas-phase reactions of phenanthrene. Atmospheric Environment. 41, 2025-2035. Wang, L., Atkinson, R., Arey, J. (2010) Comparison of Alkylnitronaphthalenes Formed in NO3 and OH Radical-Initiated Chamber Reactions with those Observed in Ambient Air. Environ Sci Technol. 44, 2981-2987. Wang, W., Jariyasopit, N., Schrlau, J., Jia, Y., Tao, S., Yu, T.-W., et al. (2011a) Concentration and Photochemistry of PAHs, NPAHs, and OPAHs and Toxicity of PM(2.5) during the Beijing Olympic Games. Environ Sci Technol. 45, 6887-6895. Wang, W., Simonich, S., Giri, B., Chang, Y., Zhang, Y., Jia, Y., et al. (2011b) Atmospheric concentrations and air-soil gas exchange of polycyclic aromatic hydrocarbons (PAHs) in remote,
302
rural village and urban areas of Beijing-Tianjin region, North China. Sci Total Environ. 409, 2942-2950. Wei, S., Huang, B., Liu, M., Bi, X., Ren, Z., Sheng, G., et al. (2012) Characterization of PM2.5-bound nitrated and oxygenated PAHs in two industrial sites of South China. Atmospheric Research. 109, 76-83. Wei, S. J. C., Chang, R. L., Bhachech, N., Cui, X. X., Merkler, K. A., Wong, C. Q., et al. (1993) Dose-dependent differences in the profile of mutations induced by (+)-7r,8s-dihydroxy-9,10-epoxy-7,8,9,10-tetrahydrobenzo(a)pyrene in the coding region of the hypoxanthine (guanine) phosphoribosyltransferase gene in chinese-hamster V-79 cells. Cancer Research. 53, 3294-3301. Wei, Y. L., Bao, L. J., Wu, C. C., He, Z. C., Zeng, E. Y. (2014) Association of soil polycyclic aromatic hydrocarbon levels and anthropogenic impacts in a rapidly urbanizing region: Spatial distribution, soil-air exchange and ecological risk. Sci Total Environ. 473, 676-684. Westerholm, R., Egebäck, K. E. (1994) Exhaust emissions from light-duty and heavy-duty vehicles - chemical-composition, impact of exhaust after treatment, and fuel parameters. Environmental Health Perspectives. 102, 13-23. Westerholm, R., Li, H. (1994) A multivariate statistical-analysis of fuel-related polycyclic aromatic hydrocarbon emissions from heavy-duty diesel vehicles. Environ Sci Technol. 28, 965-972. WHO. (2000) Air Quality Guidelines for Europe, Second Edition. World Health Organization, Copenhagen WHO. (2003) Environmental health criteria for selected nitro- and nitro-oxy-polycyclic aromatic hydrocarbons. World Health Organization, Geneva Wild, E., Dent, J., Thomas, G. O., Jones, K. C. (2006) Visualizing the air-to-leaf transfer and within-leaf movement and distribution of phenanthrene: Further studies utilizing two-photon excitation microscopy. Environ Sci Technol. 40, 907-916. Wild, E., Dent, J., Thomas, G. O., Jones, K. C. (2007) Use of two-photon excitation microscopy and autofluorescence for visualizing the fate and behavior of semivolatile organic chemicals within living vegetation. Environmental Toxicology and Chemistry. 26, 2486-2493. Wild, S. R., Jones, K. C. (1995) Polynuclear aromatic-hydrocarbons in the united-kingdom environment - a preliminary source inventory and budget. Environmental Pollution. 88, 91-108.
Williams, M. L. (2001) Atmospheric dispersal of pollutants and the modelling of air pollution. In: Harrison, RM (Ed),Pollution: Causes, Effects and Control The Royal Society of Chemistry, Cambridge, UK, pp 246-267.
Williams, P. T., Bartle, K. D., Andrews, G. E. (1986) The relation between polycyclic aromatic compounds in diesel fuels and exhaust particulates. Fuel. 65, 1150-1158. Williams, P. T., Abbass, M. K., Andrews, G. E., Bartle, K. D. (1989) Diesel particulate emissions: The role of unburned fuel. Combustion and Flame. 75, 1-24. Wilson, N. K., McCurdy, T. R., Chuang, J. C. (1995) Concentrations and phase distributions of nitrated and oxygenated polycyclic aromatic-hydrocarbons in ambient air. Atmospheric Environment. 29, 2575-2584.
303
Wingfors, H., Sjodin, A., Haglund, P., Brorstrom-Lunden, E. (2001) Characterisation and determination of profiles of polycyclic aromatic hydrocarbons in a traffic tunnel in Gothenburg, Sweden. Atmospheric Environment. 35, 6361-6369. Wu, S. P., Wang, X. H., Yan, J. M., Zhang, M. M., Hong, H. S. (2010) Diurnal Variations of Particle-bound PAHs at a Traffic Site in Xiamen, China. Aerosol and Air Quality Research. 10, 497-506. Xiao, H., Kang, S., Zhang, Q., Han, W., Loewen, M., Wong, F., et al. (2010) Transport of semivolatile organic compounds to the Tibetan Plateau: Monthly resolved air concentrations at Nam Co. Journal of Geophysical Research-Atmospheres. 115. Xue, W. L., Warshawsky, D. (2005) Metabolic activation of polycyclic and heterocyclic aromatic hydrocarbons and DNA damage: A review. Toxicology and Applied Pharmacology. 206, 73-93. Yaffe, D., Cohen, Y., Arey, J., Grosovsky, A. J. (2001) Multimedia analysis of PAHs and nitro-PAH daughter products in the Los Angeles basin. Risk Analysis. 21, 275-294. Yamasaki, H., Kuwata, K., Miyamoto, H. (1982) Effects of ambient-temperature on aspects of airborne polycyclic aromatic-hydrocarbons. Environ Sci Technol. 16, 189-194. Yang, P., Gong, B. F., Xiong, Y. (1999) tudy of Soxhlet extraction of polycyclic aromatic hydrocarbons on airborne particulate. Environmental Monitoring in China. 15, 16-20. Yassaa, N., Meklati, B. Y., Cecinato, A., Marino, F. (2001) Organic aerosols in urban and waste landfill of Algiers metropolitan area: Occurrence and sources. Environ Sci Technol. 35, 306-311. Yokley, R. A., Garrison, A. A., Wehry, E. L., Mamantov, G. (1986) Photochemical transformation of pyrene and benzo a pyrene vapor-deposited on 8 coal stack ashes. Environ Sci Technol. 20, 86-90. Zhang, Y., Tao, S. (2009) Global atmospheric emission inventory of polycyclic aromatic hydrocarbons (PAHs) for 2004. Atmospheric Environment. 43, 812-819. Zhang, Y., Yang, B., Gan, J., Liu, C., Shu, X., Shu, J. (2011) Nitration of particle-associated PAHs and their derivatives (nitro-, oxy-, and hydroxy-PAHs) with NO(3) radicals. Atmospheric Environment. 45, 2515-2521. Zhu, J. P., Cao, X. L., Pigeon, R., Mitchell, K. (2003) Comparison of vehicle exhaust emissions from modified diesel fuels. J Air Waste Manage Assoc. 53, 67-76. Zielinska, B., Arey, J., Atkinson, R., Ramdahl, T., Winer, A. M., Pitts, J. N. (1986) Reaction of dinitrogen pentoxide with fluoranthene. Journal of the American Chemical Society. 108, 4126-4132. Zielinska, B., Arey, J., Atkinson, R., Winer, A. M. (1989) The nitroarenes of molecular weight-247 in ambient particulate samples collected in southern-California. Atmospheric Environment. 23, 223-229. Zielinska, B., Sagebiel, J., Arnott, W. P., Rogers, C. F., Kelly, K. E., Wagner, D. A., et al. (2004a) Phase and size distribution of polycyclic aromatic hydrocarbons in diesel and gasoline vehicle emissions. Environ Sci Technol. 38, 2557-2567. Zielinska, B., Sagebiel, J., McDonald, J. D., Whitney, K., Lawson, D. R. (2004b) Emission rates and comparative chemical composition from selected in-use diesel and gasoline-fueled vehicles. J Air Waste Manage Assoc. 54, 1138-1150.

304
Zimmermann, K., Jariyasopit, N., Massey Simonich, S. L., Tao, S., Atkinson, R., Arey, J. (2013) Formation of Nitro-PAHs from the Heterogeneous Reaction of Ambient Particle-Bound PAHs with N2O5/NO3/NO2. Environ Sci Technol. 47, 8434-8442.
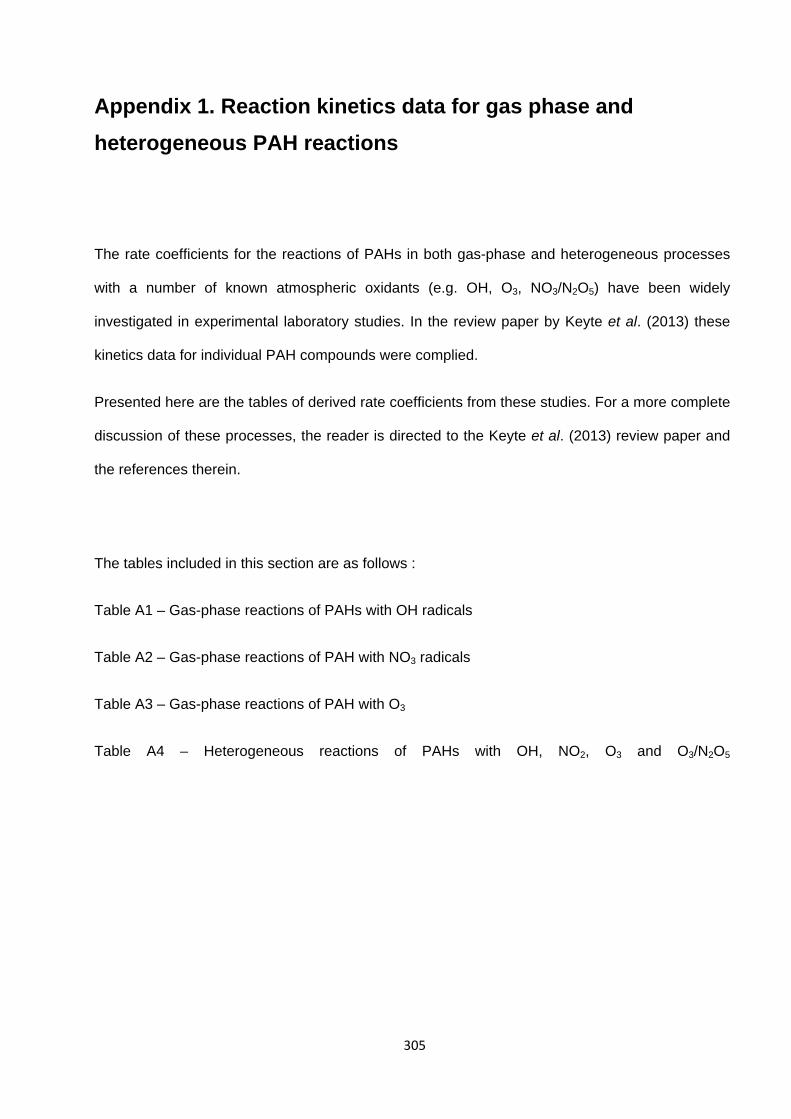
305
Appendix 1. Reaction kinetics data for gas phase and
heterogeneous PAH reactions
The rate coefficients for the reactions of PAHs in both gas-phase and heterogeneous processes
with a number of known atmospheric oxidants (e.g. OH, O3, NO3/N2O5) have been widely
investigated in experimental laboratory studies. In the review paper by Keyte et al. (2013) these
kinetics data for individual PAH compounds were complied.
Presented here are the tables of derived rate coefficients from these studies. For a more complete
discussion of these processes, the reader is directed to the Keyte et al. (2013) review paper and
the references therein.
The tables included in this section are as follows :
Table A1 – Gas-phase reactions of PAHs with OH radicals
Table A2 – Gas-phase reactions of PAH with NO3 radicals
Table A3 – Gas-phase reactions of PAH with O3
Table A4 – Heterogeneous reactions of PAHs with OH, NO2, O3 and O3/N2O5
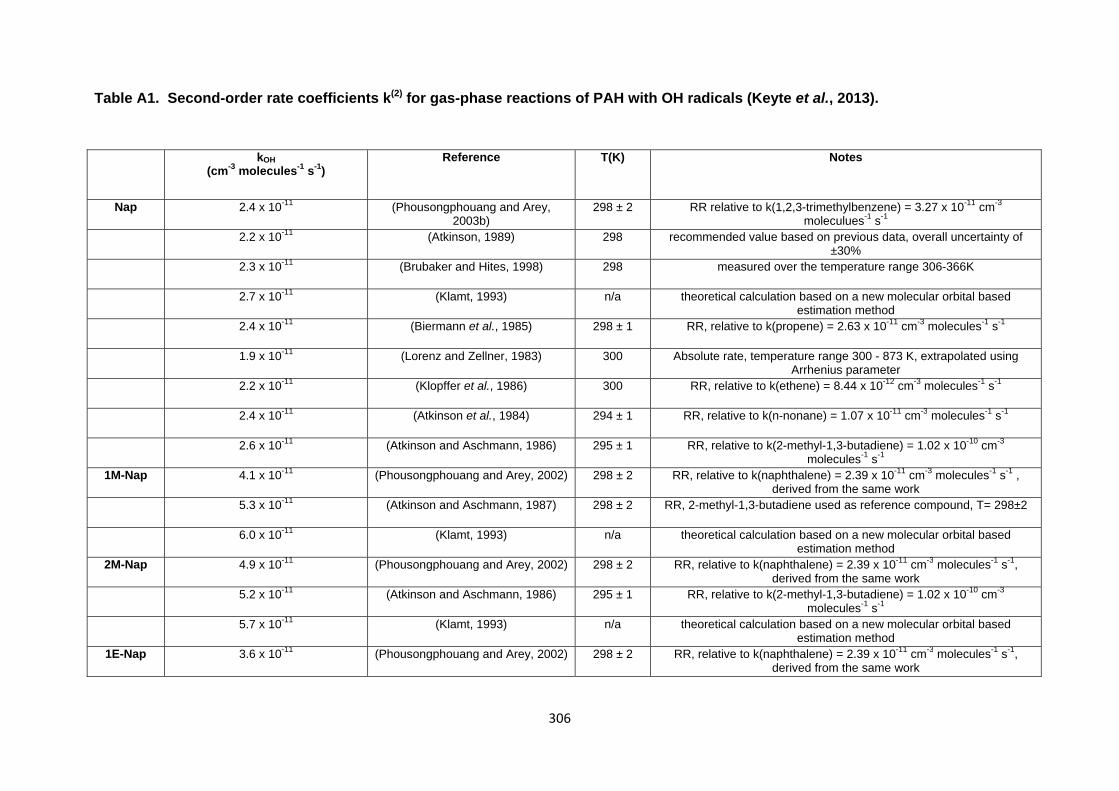
306
Table A1. Second-order rate coefficients k(2) for gas-phase reactions of PAH with OH radicals (Keyte et al., 2013).
kOH (cm-3 molecules-1 s-1)
Reference T(K) Notes
Nap 2.4 x 10⁻¹¹ (Phousongphouang and Arey, 2003b)
298 ± 2 RR relative to k(1,2,3-trimethylbenzene) = 3.27 x 10⁻¹¹ cm-3 moleculues-1 s-1
2.2 x 10⁻¹¹ (Atkinson, 1989) 298 recommended value based on previous data, overall uncertainty of ±30%
2.3 x 10⁻¹¹ (Brubaker and Hites, 1998) 298 measured over the temperature range 306-366K
2.7 x 10⁻¹¹ (Klamt, 1993) n/a theoretical calculation based on a new molecular orbital based estimation method
2.4 x 10⁻¹¹ (Biermann et al., 1985) 298 ± 1 RR, relative to k(propene) = 2.63 x 10⁻¹¹ cm-3 molecules-1 s-1
1.9 x 10⁻¹¹ (Lorenz and Zellner, 1983) 300 Absolute rate, temperature range 300 - 873 K, extrapolated using Arrhenius parameter
2.2 x 10⁻¹¹ (Klopffer et al., 1986) 300 RR, relative to k(ethene) = 8.44 x 10⁻¹² cm-3 molecules-1 s-1
2.4 x 10⁻¹¹ (Atkinson et al., 1984) 294 ± 1 RR, relative to k(n-nonane) = 1.07 x 10⁻¹¹ cm-3 molecules-1 s-1
2.6 x 10⁻¹¹ (Atkinson and Aschmann, 1986) 295 ± 1 RR, relative to k(2-methyl-1,3-butadiene) = 1.02 x 10⁻¹⁰ cm-3 molecules-1 s-1
1M-Nap 4.1 x 10⁻¹¹ (Phousongphouang and Arey, 2002) 298 ± 2 RR, relative to k(naphthalene) = 2.39 x 10⁻¹¹ cm-3 molecules-1 s-1 , derived from the same work
5.3 x 10⁻¹¹ (Atkinson and Aschmann, 1987) 298 ± 2 RR, 2-methyl-1,3-butadiene used as reference compound, T= 298±2
6.0 x 10⁻¹¹ (Klamt, 1993) n/a theoretical calculation based on a new molecular orbital based estimation method
2M-Nap 4.9 x 10⁻¹¹ (Phousongphouang and Arey, 2002) 298 ± 2 RR, relative to k(naphthalene) = 2.39 x 10⁻¹¹ cm-3 molecules-1 s-1, derived from the same work
5.2 x 10⁻¹¹ (Atkinson and Aschmann, 1986) 295 ± 1 RR, relative to k(2-methyl-1,3-butadiene) = 1.02 x 10⁻¹⁰ cm-3 molecules-1 s-1
5.7 x 10⁻¹¹ (Klamt, 1993) n/a theoretical calculation based on a new molecular orbital based estimation method
1E-Nap 3.6 x 10⁻¹¹ (Phousongphouang and Arey, 2002) 298 ± 2 RR, relative to k(naphthalene) = 2.39 x 10⁻¹¹ cm-3 molecules-1 s-1, derived from the same work

307
2E-Nap 4.0 x 10⁻¹¹ (Phousongphouang and Arey, 2002) 298 ± 2 RR, relative to k(naphthalene) = 2.39 x 10⁻¹¹ cm-3 molecules-1 s-1 , derived from the same work
1,2DM-Nap 6.0 x 10⁻¹¹ (Phousongphouang and Arey, 2002) 298 ± 2 RR, relative to k(naphthalene) = 2.39 x 10⁻¹¹ cm-3 molecules-1 s-1, derived from the same work
1,3DM-Nap 2.2 x 10⁻¹¹ (Banceu et al., 2001) 295 RR [relative to k(naphthalene) = 2.39 x 10⁻¹¹ cm-3 molecules-1 s-1
7.5 x 10⁻¹¹ (Phousongphouang and Arey, 2002) 298 ± 2 RR, relative to k(naphthalene) = 2.39 x 10⁻¹¹ cm-3 molecules-1 s-1, derived from the same work
1,4DM-Nap 5.8 x 10⁻¹² (Klamt, 1993) n/a theoretical calculation based on a new molecular orbital based estimation method
5.8 x 10⁻¹¹ (Phousongphouang and Arey, 2002) 298 ± 2 RR, relative to k(naphthalene) = 2.39 x 10⁻¹¹ cm-3 molecules-1 s-1, derived from the same work
1,5DM-Nap 6.0 x 10⁻¹¹ (Phousongphouang and Arey, 2002) 298 ± 2 RR, relative to k(naphthalene) = 2.39 x 10⁻¹¹ cm-3 molecules-1 s-1, derived from the same work
1,6DM-Nap 6.3 x 10⁻¹¹ (Phousongphouang and Arey, 2002) 298 ± 2 RR, relative to k(naphthalene) = 2.39 x 10⁻¹¹ cm-3 molecules-1 s-1, derived from the same work
1,7DM-Nap 6.8 x 10⁻¹¹ (Phousongphouang and Arey, 2002) 298 ± 2 RR, relative to k(naphthalene) = 2.39 x 10⁻¹¹ cm-3 molecules-1 s-1, derived from the same work
1,8DM-Nap 6.3 x 10⁻¹¹ (Phousongphouang and Arey, 2002) 298 ± 2 RR, relative to k(naphthalene) = 2.39 x 10⁻¹¹ cm-3 molecules-1 s-1, derived from the same work
2,3DM-Nap 6.2 x 10⁻¹¹ (Phousongphouang and Arey, 2002) 298 ± 2 RR, relative to k(naphthalene) = 2.39 x 10⁻¹¹ cm-3 molecules-1 s-1, derived from the same work
1.0 x 10⁻¹⁰ (Klamt, 1993) n/a theoretical calculation based on a new molecular orbital based estimation method
7.7 x 10⁻¹¹ (Atkinson and Aschmann, 1986) 295 ± 1 RR, relative to k(2-methyl-1,3-butadiene) = 1.02 x 10⁻¹⁰ cm-3 molecules-1 s-1
2,6DM-Nap 6.7 x 10⁻¹¹ (Phousongphouang and Arey, 2002) 298 ± 2 RR, relative to k(naphthalene) = 2.39 x 10⁻¹¹ cm-3 molecules-1 s-1, derived from the same work
2,7DM-Nap 6.9 x 10⁻¹¹ (Phousongphouang and Arey, 2002) 298 ± 2 RR, relative to k(naphthalene) = 2.39 x 10⁻¹¹ cm-3 molecules-1 s-1 , derived from the same work
Ace 8.0 x 10⁻¹¹ (Reisen and Arey, 2002) 296 RR [relative to k(trans-2-butene) = 6.48 x 10⁻¹¹ cm-3 molecules-1 s-1
5.8 x 10⁻¹¹ (Brubaker and Hites, 1998) 298 measured over the temperature range 325-365K
1.0 x 10⁻¹⁰ (Atkinson and Aschmann, 1987) 296 ± 1 RR [relative to k(2,3-dimethyl-2-butene) = 1.11 x 10⁻¹⁰ cm-3 molecules-1 s-1
5.8 x 10⁻¹¹ (Klopffer et al., 1986) 300 RR [relative to k(ethene) = 10-12 cm-3 molecules-1 s-1
6.4 x 10⁻¹¹ (Banceu et al., 2001) 295 RR [relative to k(naphthalene) = 2.2 x 10⁻¹¹ cm-3 molecules-1 s-1
8.0 x 10⁻¹¹ (Klamt, 1993) n/a theoretical calculation based on a new molecular orbital based estimation method

308
Acy 1.2 x 10⁻¹⁰ (Reisen and Arey, 2002) 296 RR [relative to k(trans-2-butene) = 6.48 x 10⁻¹¹ cm-3 molecules-1 s-1
1.3 x 10⁻¹⁰ (Banceu et al., 2001) 295 RR [relative to k(naphthalene) = 2.2 x 10⁻¹¹ cm-3 molecules1 s-1
1.1 x 10⁻¹⁰ (Atkinson and Aschmann, 1987) 296 ± 1 RR [relative to k(2,3-dimethyl-2-butene) = 1.11 x 10⁻¹⁰ cm-3 molecules-1 s-1
Fln 1.6 x 10⁻¹¹ (Kwok et al., 1994b) 297 placed on an absolute basis by using k2(cyclohexane = 7.47 x 10⁻¹¹ cm-3 molecules-1 s-1
1.3 x 10⁻¹¹ (Brubaker and Hites, 1998) 298 measured over the temperature range 326-366K
9.9 x 10⁻¹² (Klamt, 1993) n/a theoretical calculation based on a new molecular orbital based estimation method
1.3 x 10⁻¹¹ (Klopffer et al., 1986) 300 RR [relative to k(ethene) = 7.47 x 10⁻¹² cm-3 molecules-1 s-1
Phe 3.4 x 10⁻¹¹ (Biermann et al., 1985) 298 ± 1 RR [relative to k(propene) = 4.85 x 10⁻¹² e504/T cm-3 molecules-1 s-1
3.1 x 10⁻¹¹ (Atkinson, 1989) 298 recommended value based on previous data, overall uncertainty of ±30%
2.6 x 10⁻¹¹ (Klamt, 1993) n/a theoretical calculation based on a new molecular orbital based estimation method
1.6 x 10⁻¹¹ (Lorenz and Zellner, 1983) 338 Absolute rate study, measured over a temperature range 338 - 748 K
1.3 x 10⁻¹¹ (Kwok et al., 1994b) 296 RR [relative to k(propene) = 2.66 x x 10-11 cm-3 molecules-1 s-1
2.7 x 10⁻¹¹ (Brubaker and Hites, 1998) 298 measured over the temperature range 346-386K, extrapolated using Arrhenius parameters
3.2 x 10⁻¹¹ (Lee et al., 2003) 298 measured over the temperature range 298-386K, extrapolated using Arrhenius parameters
4.98 ± 2.96 x 10⁻⁶ T-1.97 ± 0.10 (Ananthula et al., 2006) 373-1000 two-parameter expression to best fit experimental data
1M-Phe 2.9 x 10⁻¹¹ (Lee et al., 2003) 298 measured over the temperature range 363-403K, extrapolated using Arrhenius parameters
2M-Phe 6.5 x 10⁻¹¹ (Lee et al., 2003) 298 measured over the temperature range 338-398K, extrapolated using Arrhenius parameters
3M-Phe 6.6 x 10⁻¹¹ (Lee et al., 2003) 298 measured over the temperature range 353-388K, extrapolated using Arrhenius parameters
9M-Phe 7.6 x 10⁻¹¹ (Lee et al., 2003) 298 measured over the temperature range 333-373K, extrapolated using Arrhenius parameters
Ant 1.1 x 10⁻¹⁰ (Biermann et al., 1985) 325 ± 1 RR [relative to k(propene) = 2.29 x x 10-11 cm-3 molecules-1 s-1
1.9 x 10⁻¹⁰ (Brubaker and Hites, 1998) 298 measured over the temperature range 346-365K

309
1.3 x 10⁻¹¹ (Kwok et al., 1994b) 296 based on a derived k(anthracene)/k(phenanthrene) value of 1.0 ± 0.5
2.0 x 10⁻¹⁰ (Klamt, 1993) n/a theoretical calculation based on a new molecular orbital based estimation method
1.3 x 10⁻¹⁰ (Atkinson, 1989) ; (Biermann et al., 1985)
298 recommended value based on previous data, overall uncertainty of ±30%
1.12 x 10⁻¹⁰ (T/298)-0.46 (Goulay et al., 2005) 58-470 two-parameter expression to best fit experimental data
8.17 x 10⁻¹⁴ T-8.3 e (-3171.71 / T) (Ananthula et al., 2006) 373-923 modified Arrhenius equation to best fit experimental data
2.18 x 10⁻¹¹ e(-1734.11 / T) (Ananthula et al., 2006) 999-1200 modified Arrhenius equation to best fit experimental data
Flt 1.1 x 10⁻¹¹ (Brubaker and Hites, 1998) 298 measured over the temperature range 346-366K
Pyr 5.0 x 10⁻¹¹ (Atkinson et al., 1987a) 296±2 RR Relative to k(naphthalene) = 3.6 x 10⁻²⁸ cm-3 molecules-1 s-1
1N-Nap 5.4 x 10⁻¹¹ (Atkinson, 1989) 298 recommended value
2N-Nap 5.6 x 10⁻¹¹ (Atkinson, 1989) 298 recommended value

310
Table A2. Second-order rate coefficients k(2) for gas-phase reactions of PAH with NO3 radicals (Keyte et al., 2013).
kNO3 (cm-3 molecules-1 s-1)
(x [NO2] )
kNO3
(cm-3 molecules-1 s-1)
[NO2] = 6.91 x 10¹¹
molecule cm-3 a
Reference T (K) Note
Nap 8.5 x 10⁻²⁸ 1.1 x 10⁻¹⁶ (Pitts et al., 1985c) 298±2 RR Relative to K5(NO3 + NO2 – N2O5) = 3.41 x 10⁻¹¹ cm-3 molecules-1 s-1
4.8 x 10⁻²⁸ 6.2 x 10⁻¹⁷ (Atkinson et al., 1987b) 298±2 RR Relative to K5(NO3 + NO2 – N2O5) = 3.41 x 10⁻¹¹ cm-3 molecules-1 s-1
3.3 x 10⁻²⁸ 4.3 x 10⁻¹⁷ (Atkinson and Aschmann, 1988) 296±2 RR Relative to k(propene) = 9.45 x 10⁻¹⁵ cm-3 molecules-1 s-1
3.7 x 10⁻²⁸ 4.7 x 10⁻¹⁷ (Atkinson et al., 1990a) ~297 RR Relative to k(thioprene) = 9.93 x 10⁻¹⁴ cm-3 molecules-1 s-1, Measured over temp range 272-
297K 4.2 x 10⁻²⁸ 5.5 x 10⁻¹⁷ (Atkinson et al., 1990a) ~297 RR Relative to K5(NO3 + NO2 – N2O5) = 1.26 x 10⁻²⁷
e11275/T cm-3 molecules-1 s-1, Measured over temp range 272-297K
3.6 x 10⁻²⁸ 4.6 x 10⁻¹⁷ (Atkinson, 1991) 298 Recommended value
1M-Nap 8.4 x 10⁻²⁸ 1.1 x 10⁻¹⁶ (Atkinson and Aschmann, 1987) 298±2 RR Relative to k(naphthalene) = 3.6 x 10⁻²⁸ cm-3 molecules-1 s-1
7.0 x 10⁻²⁸ 9.0 x 10⁻¹⁷ (Atkinson and Aschmann, 1988) 296±2 RR Relative to k(trans-2-butene) = 3.89 x 10⁻¹³cm-3 molecules-1 s-1
7.7 x 10⁻²⁸ 9.9 x 10⁻¹⁷ (Atkinson, 1991) 298 Recommended value
7.2 x 10⁻²⁸ 9.2 x 10⁻¹⁷ (Phousongphouang and Arey, 2003b)
298±2 RR Relative to k(naphthalene) = 3.65 x 10⁻²⁸ cm-3 molecules-1 s-1, derived from the same work
2M-Nap 1.1 x 10⁻²⁷ 1.4 x 10⁻¹⁶ (Atkinson and Aschmann, 1987) 298±2 RR Relative to k(naphthalene) = 3.6 x 10⁻²⁸ cm-3 molecules-1 s-1
1.1 x 10⁻²⁷ 1.4 x 10⁻¹⁶ (Atkinson and Aschmann, 1988) 296±2 RR Relative to k(propene) = 9.45 x 10⁻¹⁵ cm-3 molecules-1 s-1
1.1 x 10⁻²⁷ 1.4 x 10⁻¹⁶ (Atkinson, 1991) 298 Recommended value
1.0 x 10⁻²⁷ 1.3 x 10⁻¹⁶ (Phousongphouang and Arey, 2003b)
298±2 RR Relative to k(naphthalene) = 3.65 x 10⁻²⁸ cm-3 molecules-1 s-1 , derived from the same work
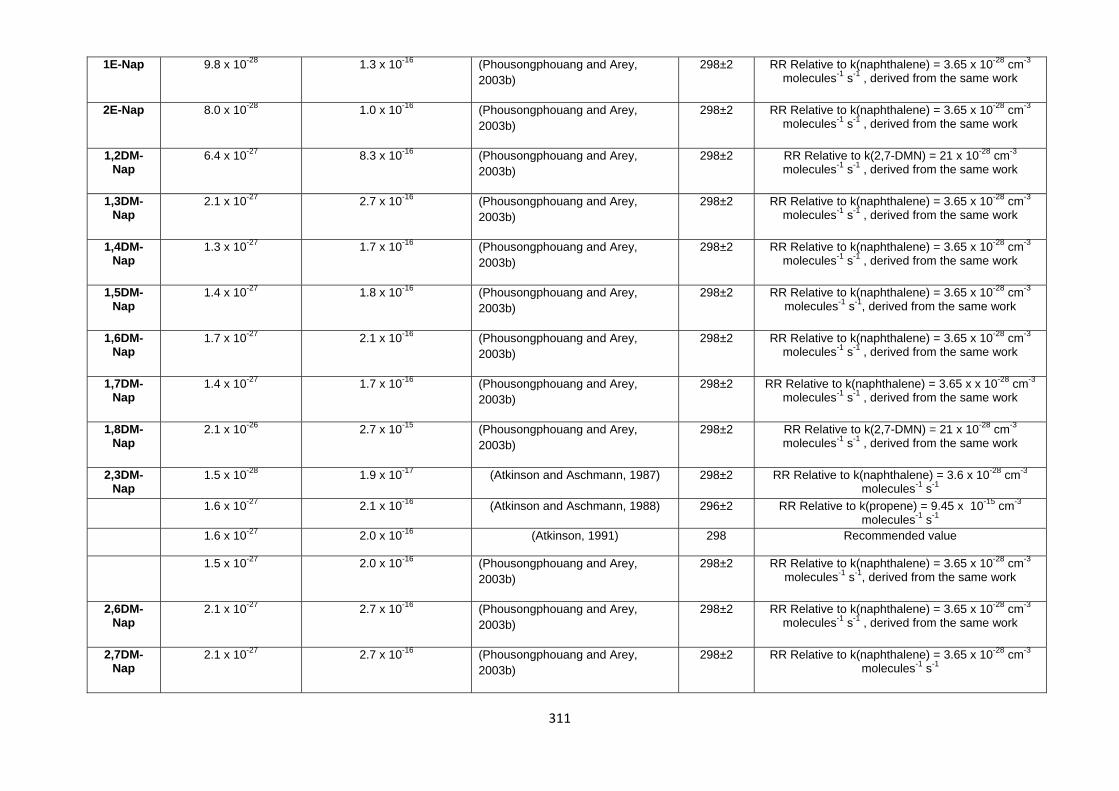
311
1E-Nap 9.8 x 10⁻²⁸ 1.3 x 10⁻¹⁶ (Phousongphouang and Arey, 2003b)
298±2 RR Relative to k(naphthalene) = 3.65 x 10⁻²⁸ cm-3 molecules-1 s-1 , derived from the same work
2E-Nap 8.0 x 10⁻²⁸ 1.0 x 10⁻¹⁶ (Phousongphouang and Arey, 2003b)
298±2 RR Relative to k(naphthalene) = 3.65 x 10⁻²⁸ cm-3 molecules-1 s-1 , derived from the same work
1,2DM-Nap
6.4 x 10⁻²⁷ 8.3 x 10⁻¹⁶ (Phousongphouang and Arey, 2003b)
298±2 RR Relative to k(2,7-DMN) = 21 x 10-28 cm-3 molecules-1 s-1 , derived from the same work
1,3DM-Nap
2.1 x 10⁻²⁷ 2.7 x 10⁻¹⁶ (Phousongphouang and Arey, 2003b)
298±2 RR Relative to k(naphthalene) = 3.65 x 10⁻²⁸ cm-3 molecules-1 s-1 , derived from the same work
1,4DM-Nap
1.3 x 10⁻²⁷ 1.7 x 10⁻¹⁶ (Phousongphouang and Arey, 2003b)
298±2 RR Relative to k(naphthalene) = 3.65 x 10⁻²⁸ cm-3 molecules-1 s-1 , derived from the same work
1,5DM-Nap
1.4 x 10⁻²⁷ 1.8 x 10⁻¹⁶ (Phousongphouang and Arey, 2003b)
298±2 RR Relative to k(naphthalene) = 3.65 x 10⁻²⁸ cm-3 molecules-1 s-1, derived from the same work
1,6DM-Nap
1.7 x 10⁻²⁷ 2.1 x 10⁻¹⁶ (Phousongphouang and Arey, 2003b)
298±2 RR Relative to k(naphthalene) = 3.65 x 10⁻²⁸ cm-3 molecules-1 s-1 , derived from the same work
1,7DM-Nap
1.4 x 10⁻²⁷ 1.7 x 10⁻¹⁶ (Phousongphouang and Arey, 2003b)
298±2 RR Relative to k(naphthalene) = 3.65 x x 10-28 cm-3 molecules-1 s-1 , derived from the same work
1,8DM-Nap
2.1 x 10⁻²⁶ 2.7 x 10⁻¹⁵ (Phousongphouang and Arey, 2003b)
298±2 RR Relative to k(2,7-DMN) = 21 x 10-28 cm-3 molecules-1 s-1 , derived from the same work
2,3DM-Nap
1.5 x 10⁻²⁸ 1.9 x 10⁻¹⁷ (Atkinson and Aschmann, 1987) 298±2 RR Relative to k(naphthalene) = 3.6 x 10⁻²⁸ cm-3 molecules-1 s-1
1.6 x 10⁻²⁷ 2.1 x 10⁻¹⁶ (Atkinson and Aschmann, 1988) 296±2 RR Relative to k(propene) = 9.45 x 10⁻¹⁵ cm-3 molecules-1 s-1
1.6 x 10⁻²⁷ 2.0 x 10⁻¹⁶ (Atkinson, 1991) 298 Recommended value
1.5 x 10⁻²⁷ 2.0 x 10⁻¹⁶ (Phousongphouang and Arey, 2003b)
298±2 RR Relative to k(naphthalene) = 3.65 x 10⁻²⁸ cm-3 molecules-1 s-1, derived from the same work
2,6DM-Nap
2.1 x 10⁻²⁷ 2.7 x 10⁻¹⁶ (Phousongphouang and Arey, 2003b)
298±2 RR Relative to k(naphthalene) = 3.65 x 10⁻²⁸ cm-3 molecules-1 s-1 , derived from the same work
2,7DM-Nap
2.1 x 10⁻²⁷ 2.7 x 10⁻¹⁶ (Phousongphouang and Arey, 2003b)
298±2 RR Relative to k(naphthalene) = 3.65 x 10⁻²⁸ cm-3 molecules-1 s-1

312
a [NO2] = 6.91 x 10¹¹ molecule cm-3; annual average, Harwell, U.K. (2011)
b [NO2] = <1.2 x 10¹⁵ molecule cm-3
c [NO2] = (7.2-24) x 1013 molecule cm-3
d [NO2] = (4.8-24) x 1013 molecule cm-3
Ace 4.6 x 10⁻¹³ b (Atkinson and Aschmann, 1988) 296±2 RR Relative to k(trans-2-butene) = 3.89 x 10⁻¹³ cm-3 molecules-1 s-1
1.7 x 10⁻²⁷ 2.1 x 10⁻¹⁶ (Atkinson and Aschmann, 1988) 296±2 RR Relative to k(trans-2-butene) = 3.89 x 10⁻¹³ cm-3 molecules-1 s-1
Acy 5.5 x 10⁻¹² b (Atkinson and Aschmann, 1988) 296±2 RR Relative to k(trans-2-butene) = 3.89 x 10⁻¹³ cm-3 molecules-1 s-1
Fln 3.5 x 10⁻¹⁴ c (Kwok et al., 1997) 297±2 RR Relative to k(1-butene) = 1.19 x 10⁻¹⁴ cm-3 molecules-1 s-1
Phe 1.2 x 10⁻¹³ d (Kwok et al., 1994a) 296±2 RR Relative to k(1-butene) = 1.19 x 10⁻¹⁴ cm-3 molecules-1 s-1
Flt 5.1 x 10⁻²⁸ 6.6 x 10⁻¹⁷ (Atkinson et al., 1990a) 296±2 RR Relative to k(naphthalene) = 3.6 x 10⁻²⁸ cm-3 molecules-1 s-1
Pyr 1.6 x 10⁻²⁷ 2.1 x 10⁻¹⁶ (Atkinson et al., 1990a) 296±2 RR Relative to k(naphthalene) = 3.6 x 10⁻²⁸ cm-3 molecules-1 s-1
1N-Nap 3.0 x 10⁻²⁸ 3.9 x 10⁻¹⁷ (Atkinson, 1991) 298 Recommended value
2N-Nap 2.7 x 10⁻²⁸ 3.5 x 10⁻¹⁷ (Atkinson, 1991) 298 Recommended value
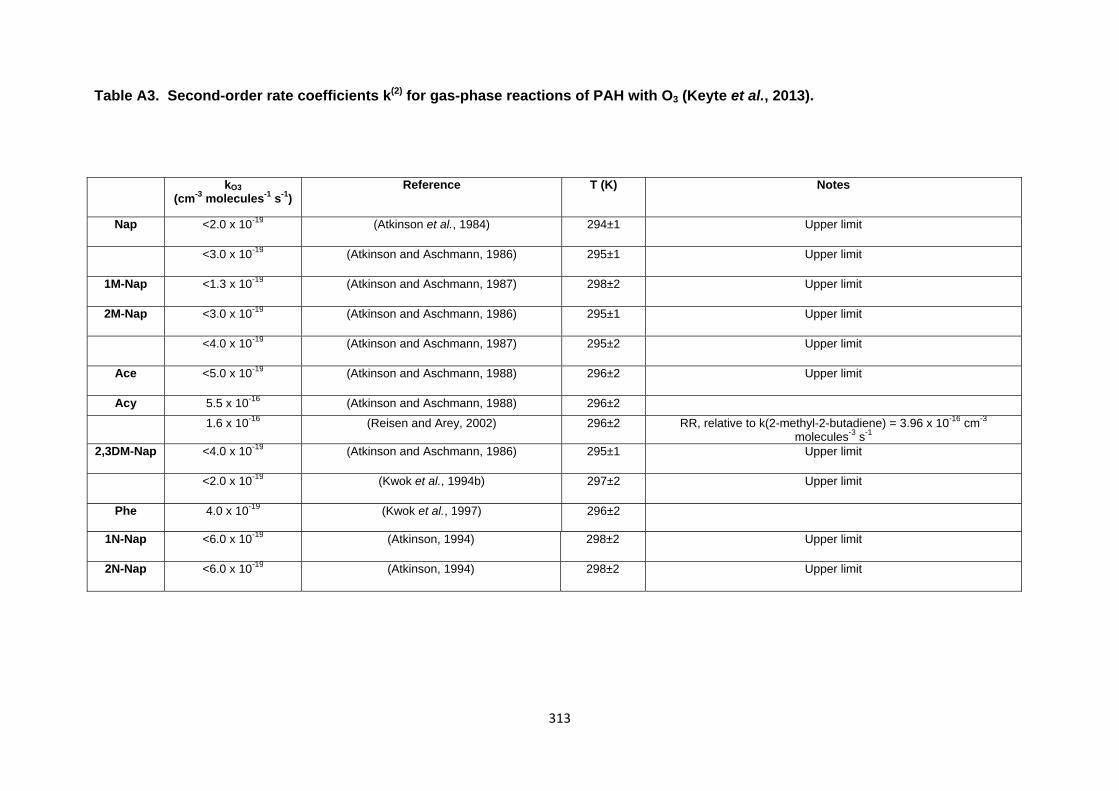
313
Table A3. Second-order rate coefficients k(2) for gas-phase reactions of PAH with O3 (Keyte et al., 2013).
kO3 (cm-3 molecules-1 s-1)
Reference T (K) Notes
Nap <2.0 x 10⁻¹⁹ (Atkinson et al., 1984) 294±1 Upper limit
<3.0 x 10⁻¹⁹ (Atkinson and Aschmann, 1986) 295±1 Upper limit
1M-Nap <1.3 x 10⁻¹⁹ (Atkinson and Aschmann, 1987) 298±2 Upper limit
2M-Nap <3.0 x 10⁻¹⁹ (Atkinson and Aschmann, 1986) 295±1 Upper limit
<4.0 x 10⁻¹⁹ (Atkinson and Aschmann, 1987) 295±2 Upper limit
Ace <5.0 x 10⁻¹⁹ (Atkinson and Aschmann, 1988) 296±2 Upper limit
Acy 5.5 x 10⁻¹⁶ (Atkinson and Aschmann, 1988) 296±2
1.6 x 10⁻¹⁶ (Reisen and Arey, 2002) 296±2 RR, relative to k(2-methyl-2-butadiene) = 3.96 x 10⁻¹⁶ cm-3 molecules-3 s-1
2,3DM-Nap <4.0 x 10⁻¹⁹ (Atkinson and Aschmann, 1986) 295±1 Upper limit
<2.0 x 10⁻¹⁹ (Kwok et al., 1994b)
297±2 Upper limit
Phe 4.0 x 10⁻¹⁹ (Kwok et al., 1997)
296±2
1N-Nap <6.0 x 10⁻¹⁹ (Atkinson, 1994) 298±2 Upper limit
2N-Nap <6.0 x 10⁻¹⁹ (Atkinson, 1994) 298±2 Upper limit

314
Table A4. Second-order rate coefficients k(2) for heterogeneous reactions of PAH with OH, NO2, O3 and NO3/N2O5 (Keyte et al., 2013).
PAH OH Reactions NO2 Reactions O3 Reactions NO3 reactions
kOH (cm3 molec-1 s-1)
Reference Notes kNO2 (cm3 molec-1 s-1)
Reference Notes kO3 (cm3 molec-1 s-1)
Reference Notes kNO3 (cm3 molec-1 s-1)
Reference Notes
Nap 0.9 x 10⁻¹⁸ / (1/cO3 + 10-
15)
(Kahan et al., 2006)
Octanol
Phe 5.0 x 10⁻¹² (Estéve et al., 2004)
Graphite particles
2.8 x 10⁻¹⁹ (Perraudin et al., 2005)
Silica particles
2.4 x 10⁻¹⁷ (Perraudin et al., 2007)
Graphite particles
3.2 x 10⁻¹³ (Estéve et al., 2006)
Diesel exhaust particles
SRM 1650a
3.4 x 10⁻¹⁸ (Nguyen et al., 2009)
Kerosene flame soot
2.3 x 10⁻¹⁷ (Perraudin et al., 2007)
Silica particles
3.5 x 10⁻¹⁷ (Estéve et al., 2004)
Graphite particles
2.3 x 10⁻¹⁹ / (1/cO3 + 4.6
x 10-16)
(Kahan et al., 2006)
Octanol
1.1 x 10⁻¹⁷ (Estéve et al., 2006)
Diesel exhaust particles
SRM 1650a
1.0 x 10⁻¹⁸ / (1/cO3 + 1.4
x 10-16)
(Kahan et al., 2006)
Ice
2.3 x 10⁻²¹ (Butler and Crossley,
1981)
Ethylene flame soot
Ant 4.4 x 10⁻¹² (Estéve et al., 2006)
Graphite particles
1.0 x 10⁻¹⁶ (Perraudin et al., 2005)
Silica particles
9.8 x 10⁻¹⁷ (Perraudin et al., 2007)
Graphite particles
3.4 x 10⁻¹⁸ (Nguyen et al., 2009)
Kerosene flame soot
1.4 x 10⁻¹⁶ (Perraudin et al., 2007)
Silica particles
6.9 x 10⁻¹⁷ (Estéve et al., 2004)
Graphite particles
5.1 x 10⁻¹⁸ / (1/cO3 +
1.96 x 10-
15)
(Kwamena et al., 2006)
Octanol

315
1.0 x 10⁻¹⁶
(Ma et al., 2011)
Silica particles
1.3 x 10⁻¹⁶/ (1/cO3 + 2.2
x 10-15)
(Kwamena et al., 2007)
Azelaic acid (wet)
5.3 x 10⁻¹⁷
(Ma et al., 2011)
MgO particles
1.0 x 10⁻¹⁵ / (1/cO3 + 10-
13)
(Kwamena et al., 2007)
Phenylsiloxane oil
1.2 x 10⁻¹⁸ / (1/cO3 + 1.2
x 10-18)
(Mmereki et al., 2004)
Water
Flt 1.4 x 10⁻¹⁴ (Bedjanian et al., 2010)
Kerosene flame soot
3.2 x 10⁻²¹ (Perraudin et al., 2005)
Silica particles
1.9 x 10⁻¹⁷ (Perraudin et al., 2007)
Graphite particles
3.2 x 10⁻¹² (Estéve et al., 2004)
Graphite particles
1.0 x 10⁻¹⁹ (Nguyen et al., 2009)
Kerosene flame soot
1.5 x 10⁻¹⁷ (Perraudin et al., 2007)
Silica particles
3.8 x 10⁻¹³ (Estéve et al., 2006)
Diesel exhaust particles
SRM 1650a
2.9 x 10⁻¹⁷ (Estéve et al., 2004)
Graphite particles
1.0 x 10⁻¹⁷ (Estéve et al., 2006)
Diesel exhaust particles
SRM 1650a
2.5 x 10⁻²¹ (Butler and Crossley,
1981)
Ethylene flame soot
Pyr 1.6 x 10⁻¹⁴ (Bedjanian et al., 2010)
Kerosene flame soot
2.0 x 10⁻¹⁷ (Perraudin et al., 2005)
Silica particles
2.5 x 10⁻¹⁷ (Perraudin et al., 2007)
Graphite particles
6.4 x 10⁻¹² (Liu et al., 2012)
Azelaic acid
particles 3.2 x 10⁻¹² (Estéve et
al., 2004) Graphite particles
1.0 x 10⁻¹⁹ (Nguyen et al., 2009)
Kerosene flame soot
5.9 x 10⁻¹⁷ (Perraudin et al., 2007)
Silica particles
4.1 x 10⁻¹³ (Estéve et al., 2006)
Diesel exhaust particles
SRM 1650a
5.1 x 10⁻¹⁷ (Estéve et al., 2004)
Graphite particles
9.3 x 10⁻¹⁷ (Miet et al., 2009b)
Silica particles

316
2.4 x 10⁻¹³ (Miet et al., 2009a)
Silica particles
1.5 x 10⁻¹⁷ (Estéve et al., 2006)
Diesel exhaust particles
SRM 1650a
2.2 x 10⁻¹⁹ / (1/cO3 + 3.1
x 10-16)
(Kahan et al., 2006)
Octanol
4.8 x 10⁻²¹ (Butler and Crossley,
1981)
Ethylene flame soot
3.2 x 10⁻¹⁶ Miet et al.277 Silica particles
Chr 9.2 x 10⁻¹⁵ (Bedjanian et al., 2010)
Kerosene flame soot
6. 0 x 10-19 (Perraudin et al., 2005)
Silica particles
1.5 x 10⁻¹⁷ (Perraudin et al., 2007)
Graphite particles
4.0 x 10⁻¹² (Liu et al., 2012)
Azelaic acid
particles 5.0 x 10⁻¹² (Estéve et
al., 2004) Graphite particles
1. 0 x 10-19 (Nguyen et al., 2009)
Kerosene flame soot
3.1 x 10⁻¹⁷ (Perraudin et al., 2007)
Silica particles
4.4 x 10⁻¹³ (Estéve et al., 2006)
Diesel exhaust particles
SRM 1650a
3.9 x 10⁻¹⁷ (Estéve et al., 2004)
Graphite particles
1.0 x 10⁻¹⁷ (Estéve et al., 2006)
Diesel exhaust particles
SRM 1650a
2.6 x 10⁻²¹ (Butler and Crossley,
1981)
Ethylene flame soot
BaA 9.2 x 10⁻¹⁵ (Bedjanian et al., 2010)
Kerosene flame soot
6.7 x 10⁻¹⁸ (Perraudin et al., 2005)
Silica particles
2.8 x 10⁻¹⁷ (Perraudin et al., 2007)
Graphite particles
4.3 x 10⁻¹² (Liu et al., 2012)
Azelaic acid
particles 5.6 x 10⁻¹³ (Estéve et
al., 2004) Graphite particles
1.0 x 10⁻¹⁹ (Nguyen et al., 2009)
Kerosene flame soot
8.7 x 10⁻¹⁷ (Perraudin et al., 2007)
Silica particles
3.2 x 10⁻¹³ (Estéve et al., 2006)
Diesel exhaust particles
SRM 1650a
3.3 x 10⁻¹⁷ (Estéve et al., 2004)
Graphite particles
1.3 x 10⁻¹⁷ (Estéve et al., 2006)
Diesel exhaust particles
SRM 1650a
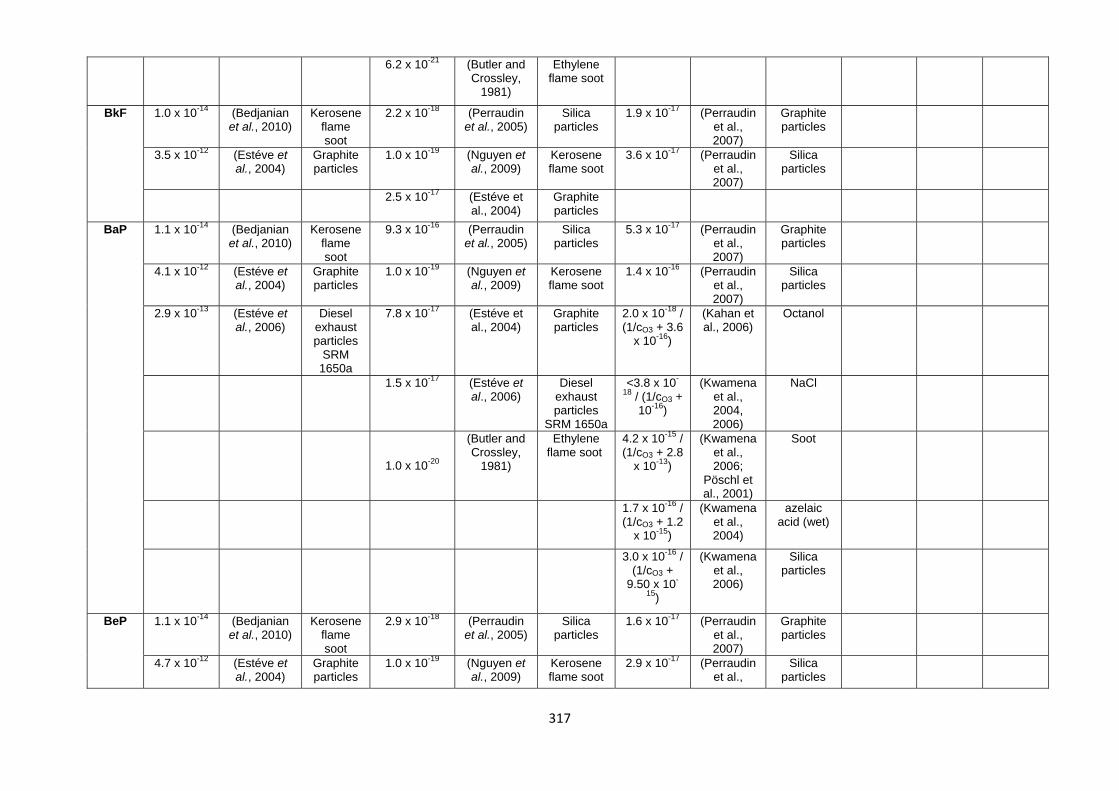
317
6.2 x 10⁻²¹ (Butler and Crossley,
1981)
Ethylene flame soot
BkF 1.0 x 10⁻¹⁴ (Bedjanian et al., 2010)
Kerosene flame soot
2.2 x 10⁻¹⁸ (Perraudin et al., 2005)
Silica particles
1.9 x 10⁻¹⁷ (Perraudin et al., 2007)
Graphite particles
3.5 x 10⁻¹² (Estéve et al., 2004)
Graphite particles
1.0 x 10⁻¹⁹ (Nguyen et al., 2009)
Kerosene flame soot
3.6 x 10⁻¹⁷ (Perraudin et al., 2007)
Silica particles
2.5 x 10⁻¹⁷ (Estéve et al., 2004)
Graphite particles
BaP 1.1 x 10⁻¹⁴ (Bedjanian et al., 2010)
Kerosene flame soot
9.3 x 10⁻¹⁶ (Perraudin et al., 2005)
Silica particles
5.3 x 10⁻¹⁷ (Perraudin et al., 2007)
Graphite particles
4.1 x 10⁻¹² (Estéve et al., 2004)
Graphite particles
1.0 x 10⁻¹⁹ (Nguyen et al., 2009)
Kerosene flame soot
1.4 x 10⁻¹⁶ (Perraudin et al., 2007)
Silica particles
2.9 x 10⁻¹³ (Estéve et al., 2006)
Diesel exhaust particles
SRM 1650a
7.8 x 10⁻¹⁷ (Estéve et al., 2004)
Graphite particles
2.0 x 10⁻¹⁸ / (1/cO3 + 3.6
x 10-16)
(Kahan et al., 2006)
Octanol
1.5 x 10⁻¹⁷ (Estéve et al., 2006)
Diesel exhaust particles
SRM 1650a
<3.8 x 10-
18 / (1/cO3 + 10-16)
(Kwamena et al., 2004, 2006)
NaCl
1.0 x 10⁻²⁰
(Butler and Crossley,
1981)
Ethylene flame soot
4.2 x 10⁻¹⁵ / (1/cO3 + 2.8
x 10-13)
(Kwamena et al., 2006;
Pöschl et al., 2001)
Soot
1.7 x 10⁻¹⁶ / (1/cO3 + 1.2
x 10-15)
(Kwamena et al., 2004)
azelaic acid (wet)
3.0 x 10⁻¹⁶ / (1/cO3 +
9.50 x 10-
15)
(Kwamena et al., 2006)
Silica particles
BeP 1.1 x 10⁻¹⁴ (Bedjanian et al., 2010)
Kerosene flame soot
2.9 x 10⁻¹⁸ (Perraudin et al., 2005)
Silica particles
1.6 x 10⁻¹⁷ (Perraudin et al., 2007)
Graphite particles
4.7 x 10⁻¹² (Estéve et al., 2004)
Graphite particles
1.0 x 10⁻¹⁹ (Nguyen et al., 2009)
Kerosene flame soot
2.9 x 10⁻¹⁷ (Perraudin et al.,
Silica particles

318
2007)
4.7 x 10⁻¹³ (Estéve et al., 2006)
Diesel exhaust particles
SRM 1650a
3.5 x 10⁻¹⁷ (Estéve et al., 2004)
Graphite particles
7.5 x 10⁻¹⁸ (Estéve et al. 2006)
Diesel exhaust particles
SRM 1650a
2.8 x 10⁻²¹ (Butler and Crossley,
1981)
Ethylene flame soot
Per 5.0 x 10⁻¹² (Estéve et al., 2004)
Graphite particles
1.1 x10⁻¹⁶ (Estéve et al., 2004)
Graphite particles
IPy 3.5 x 10⁻¹³ (Estéve et al., 2006)
Diesel exhaust particles
SRM 1650a
6.2 x 10⁻¹⁸ (Perraudin et al., 2005)
Silica particles
1.9 x 10⁻¹⁷ (Perraudin et al., 2007)
Graphite particles
1.0 x 10⁻¹⁹ (Nguyen et al., 2009)
Kerosene flame soot
3.8 x 10⁻¹⁷ (Perraudin et al., 2007)
Silica particles
7.5 x 10⁻¹⁸ Estéve et al., 2006
Diesel exhaust particles
SRM 1650a
BgP 5.9 x 10⁻¹² (Estéve et al., 2004)
Graphite particles
4.7 x 10⁻¹⁷ (Perraudin et al., 2005)
Silica particles
1.0 x 10⁻¹⁹ (Nguyen et al., 2009)
Kerosene flame soot
3.8 x 10⁻¹⁷ Estéve et al., 2004
Graphite particles
7.9 x 10⁻²¹ (Butler and Crossley,
1981)
Ethylene flame soot
BgF 8.4 x 10⁻¹⁵ (Bedjanian et al., 2010)
Kerosene flame soot
1.0 x 10⁻¹⁹ (Nguyen et al., 2009)
Kerosene flame soot
AcP 1.0 x 10⁻¹⁴ (Bedjanian Kerosene flame
1.0 x 10⁻¹⁹ (Nguyen et Kerosene flame soot

319
et al., 2010) soot al., 2009)
DBahA 1.6 x 10⁻¹⁴ (Bedjanian et al., 2010)
Kerosene flame soot
1.0 x 10⁻¹⁹ (Nguyen et al., 2009)
Kerosene flame soot
DBaeP 1.0 x 10⁻¹⁴ (Bedjanian et al., 2010)
Kerosene flame soot
1.0 x 10⁻¹⁹ (Nguyen et al., 2009)
Kerosene flame soot
BbF 1.2 x10⁻¹⁴ (Bedjanian et al., 2010)
Kerosene flame soot
1.0 x 10⁻¹⁹ (Nguyen et al., 2009)
Kerosene flame soot
Cor 1.1 x 10⁻¹⁴ (Bedjanian et al., 2010)
Kerosene flame soot
1.3 x 10⁻¹⁸ (Perraudin et al., 2005)
Silica particles
1.0 x 10⁻¹⁹ (Nguyen et al., 2009)
Kerosene flame soot
2.3 x 10⁻²¹ (Butler and Crossley,
1981)
Ethylene flame soot
DBalP 1.8 x 10⁻¹⁶ (Perraudin et al., 2005)
Silica particles
1.3 x 10⁻¹⁶ (Perraudin et al., 2007)
Graphite particles
1.3 x 10⁻¹⁶ (Perraudin et al., 2007)
Silica particles
1-NP 1.0 x 10⁻¹³ (Miet et al., 2009a)
Silica particles
6.2 x 10⁻¹⁸ (Miet et al., 2009c)
Silica particles
2.2 x 10⁻¹⁷ (Miet et al., 2009b)
Silica particles
1.3 x 10⁻¹² (Liu et al., 2012)
Azelaic acid
particles

320
Appendix 2 : Sampler Calibration and total air flow calculation
Sampler flow rates were calibrated according to manufacturer guidelines (Tisch TE-5000
Operations Manual). Sampler calibrations were carried out each time a sampler motor was
changed. A Fixed Orifice Calibrator (Tisch Environmental Inc.) was used, utilizing 5 plates of
differing resistance to simulate a variation in airflow across the sampler. Flow chart recorder and
manometer measurements were taken for each of the five resistances. Actual air flow rates for
these readings were calculated according to the formula (Tisch TE-5000 Operations Manual) :
Qa = 1/m[Sqrt((H2O)(Ta/Pa))-b] (B1)
where:
Qa = actual flow rate as indicated by the calibrator orifice (m3/min)
H20 = orifice manometer reading (inches)
Ta = ambient temperature (K)
Pa = ambient barometric pressure (mm Hg)
m = slope of orifice calibration relationship – obtained from data sheet provided by manufacturer
b = intercept of orifice calibration relationship – obtained from data sheet provided by manufacturer
Flow recorder readings were corrected to the prevailing meteorological conditions during
calibrations using the equation (Tisch TE-5000 Operations Manual) :
IC = I[Sqrt(Ta/Pa)] (B2)
where:
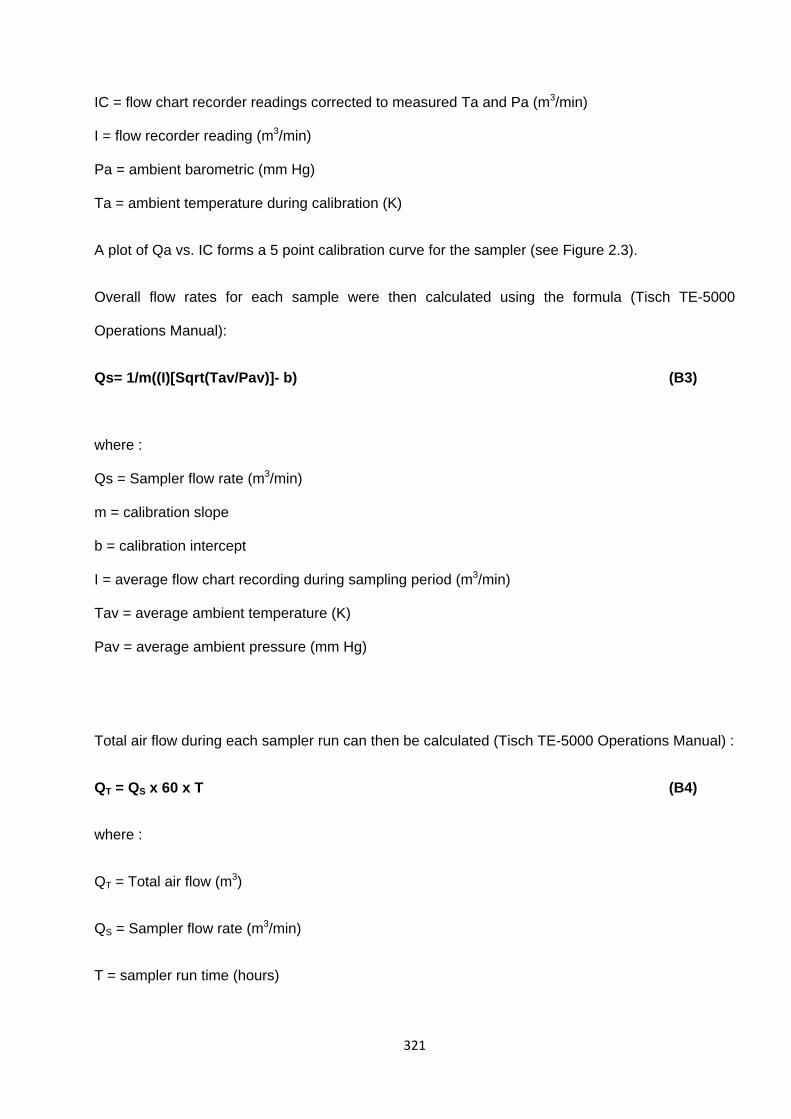
321
IC = flow chart recorder readings corrected to measured Ta and Pa (m3/min)
I = flow recorder reading (m3/min)
Pa = ambient barometric (mm Hg)
Ta = ambient temperature during calibration (K)
A plot of Qa vs. IC forms a 5 point calibration curve for the sampler (see Figure 2.3).
Overall flow rates for each sample were then calculated using the formula (Tisch TE-5000
Operations Manual):
Qs= 1/m((I)[Sqrt(Tav/Pav)]- b) (B3)
where :
Qs = Sampler flow rate (m3/min)
m = calibration slope
b = calibration intercept
I = average flow chart recording during sampling period (m3/min)
Tav = average ambient temperature (K)
Pav = average ambient pressure (mm Hg)
Total air flow during each sampler run can then be calculated (Tisch TE-5000 Operations Manual) :
QT = QS x 60 x T (B4)
where :
QT = Total air flow (m3)
QS = Sampler flow rate (m3/min)
T = sampler run time (hours)

322
Figure B1. Example calibration curve for high volume samplers
R² = 0.9995
0
5
10
15
20
25
30
35
0.6 0.7 0.8 0.9 1.0 1.1 1.2 1.3 1.4
IC (CFM
)
Qa (CMM)
BROS Calibration - 13/7/11

323
Appendix 3 : PAH, OPAH and NPAH gas chromatograph peaks
Separate GC-MS techniques were used for the analysis of PAH compounds and the analysis of
OPAH and NPAH compounds
The gas-chromatograph peaks for all measured PAH compounds and detuerated standards,
measured in both sample extracts and internal standards in this study are shown in Figure C1.
The gas-chromatograph peaks for all measured OPAH and NPAH compounds and detuerated
standards, measured in samples and internal standards in this study are shown in Figure C2.

324
Figure C1a. GC-MS peaks for the recovery standard compound PT-d14 (M+ = 244) in the
standard (upper) and sample extract (lower).
PT‐d14
PT‐
Time (mins)
Response
Time (mins)
Response
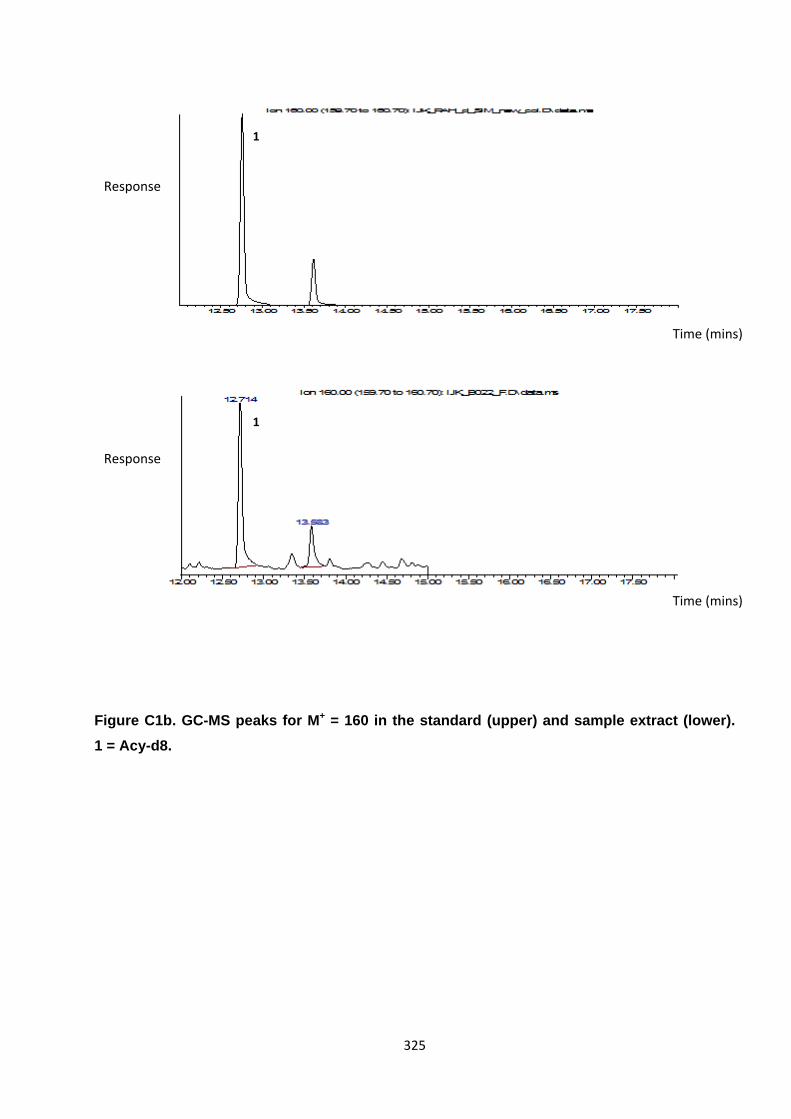
325
Figure C1b. GC-MS peaks for M+ = 160 in the standard (upper) and sample extract (lower).
1 = Acy-d8.
1
1
Time (mins)
Time (mins)
Response
Response

326
Figure C1c. GC-MS peaks for M+ = 162 in the standard (upper) and sample extract (lower). 2
= Ace-d8.
2
2
Time (mins)
Time (mins)
Response
Response

327
Figure C1d. GC-MS peaks for M+ = 176 in the standard (upper) and sample extract (lower).
3 = Flo-d10.
3
3
Time (mins)
Time (mins)
Response
Response
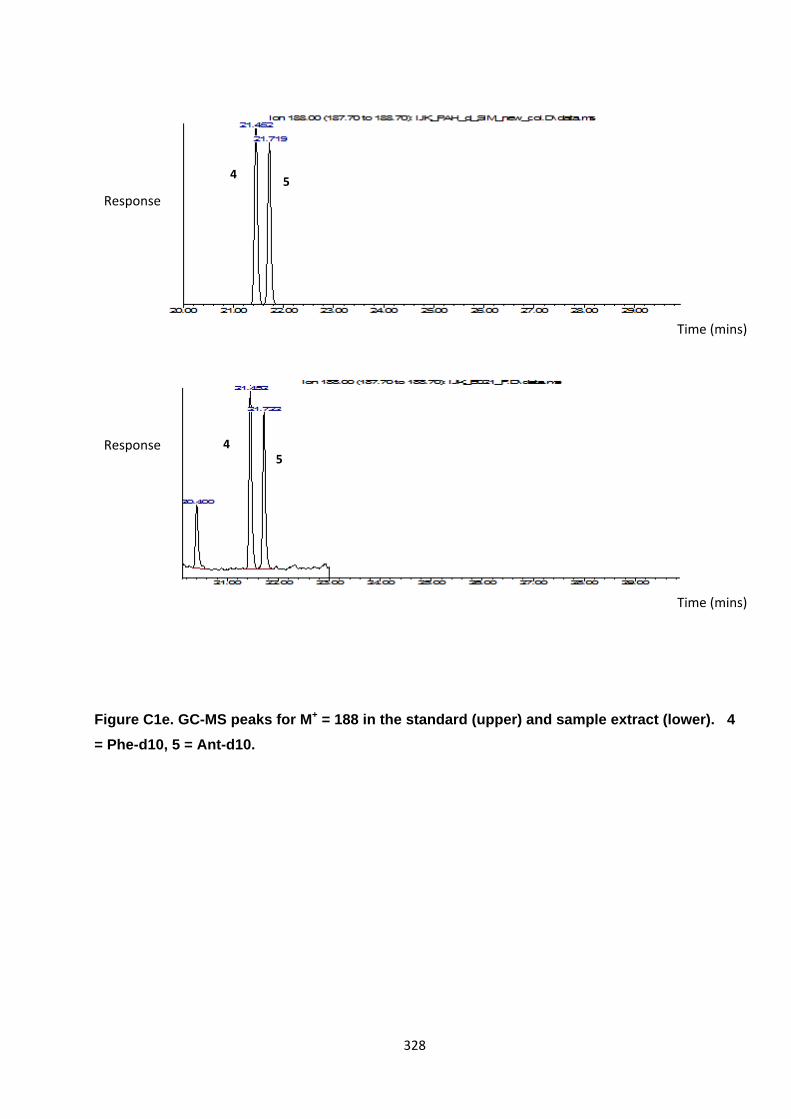
328
Figure C1e. GC-MS peaks for M+ = 188 in the standard (upper) and sample extract (lower). 4
= Phe-d10, 5 = Ant-d10.
4 5
45
Time (mins)
Time (mins)
Response
Response
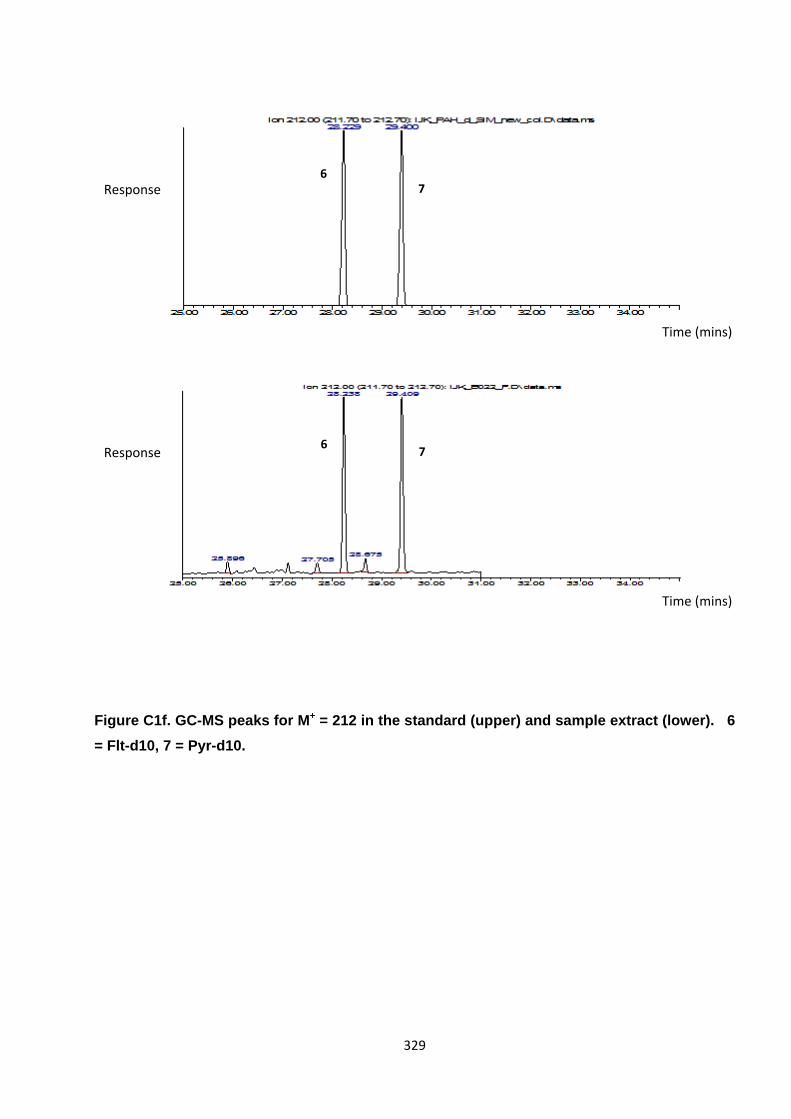
329
Figure C1f. GC-MS peaks for M+ = 212 in the standard (upper) and sample extract (lower). 6
= Flt-d10, 7 = Pyr-d10.
67
67
Time (mins)
Time (mins)
Response
Response
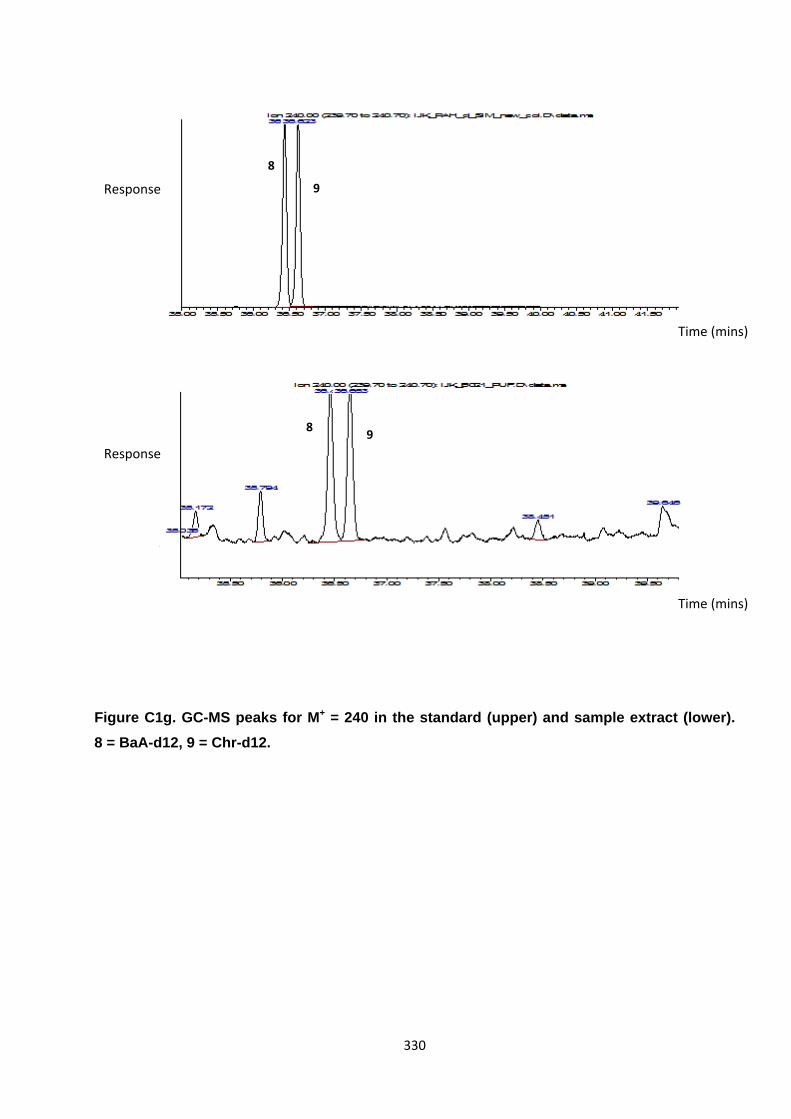
330
Figure C1g. GC-MS peaks for M+ = 240 in the standard (upper) and sample extract (lower).
8 = BaA-d12, 9 = Chr-d12.
8 9
8
9
Time (mins)
Time (mins)
Response
Response
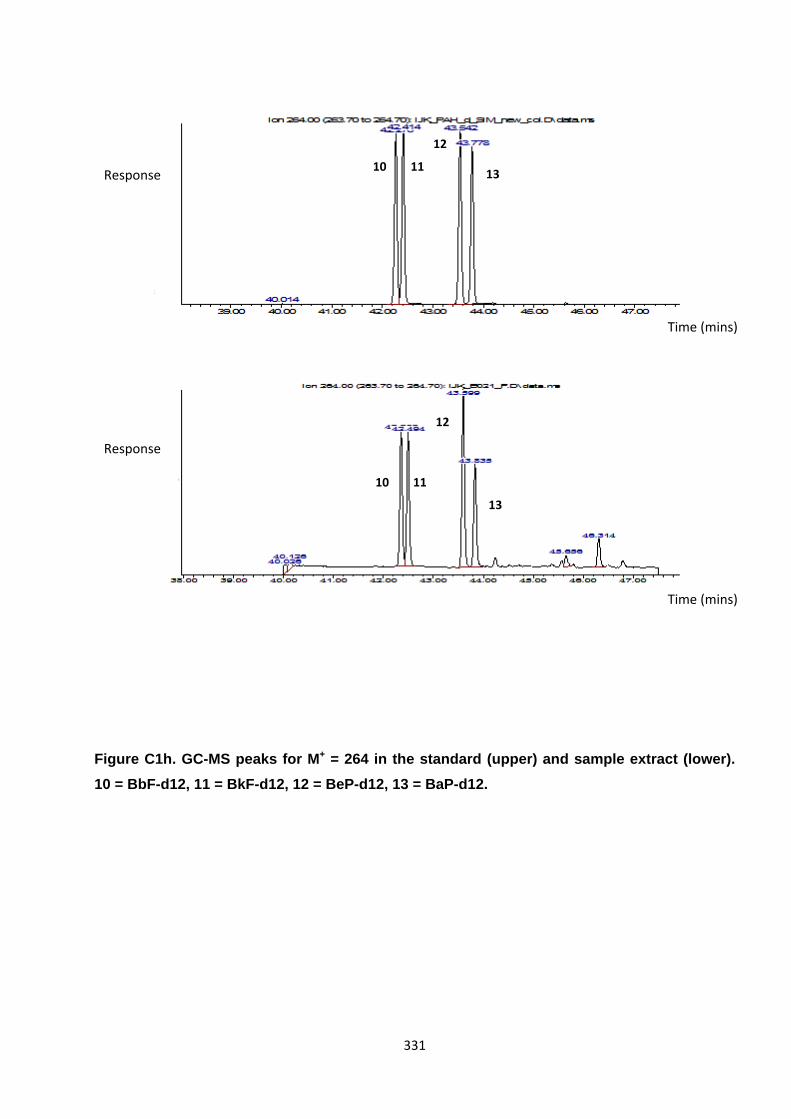
331
Figure C1h. GC-MS peaks for M+ = 264 in the standard (upper) and sample extract (lower).
10 = BbF-d12, 11 = BkF-d12, 12 = BeP-d12, 13 = BaP-d12.
10 11
12
13
10 11
12
13
Time (mins)
Time (mins)
Response
Response
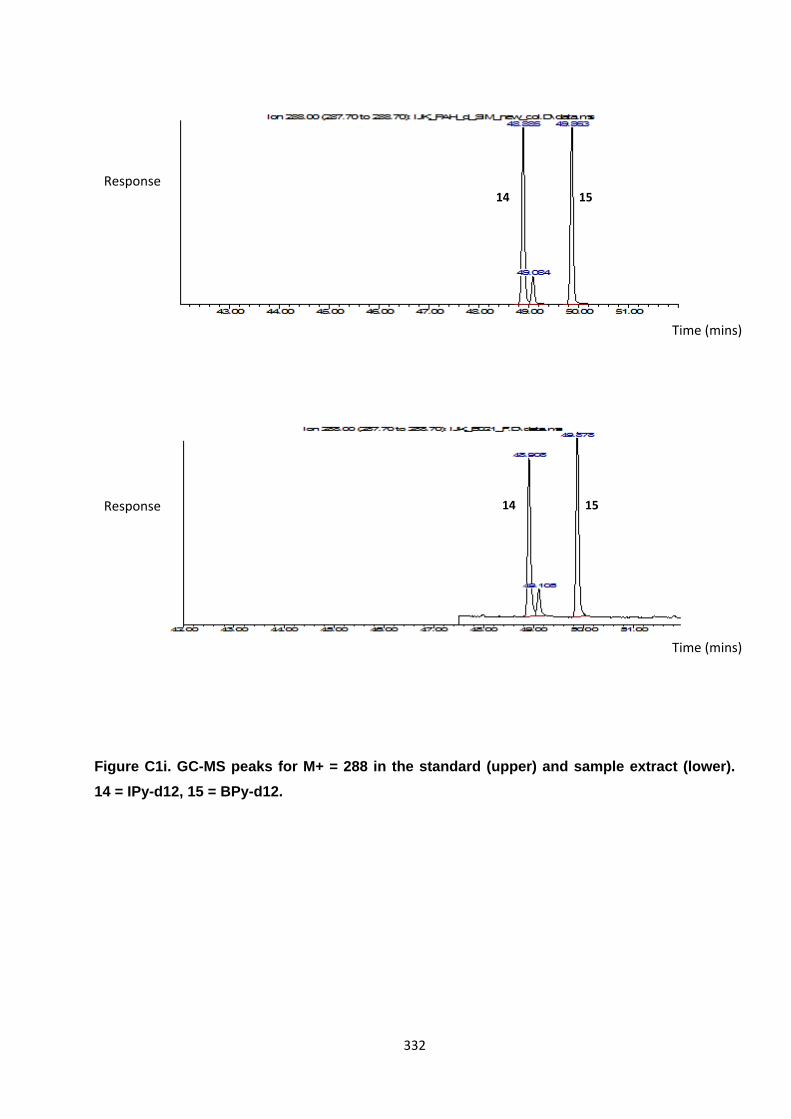
332
Figure C1i. GC-MS peaks for M+ = 288 in the standard (upper) and sample extract (lower).
14 = IPy-d12, 15 = BPy-d12.
14 15
14 15
Time (mins)
Time (mins)
Response
Response
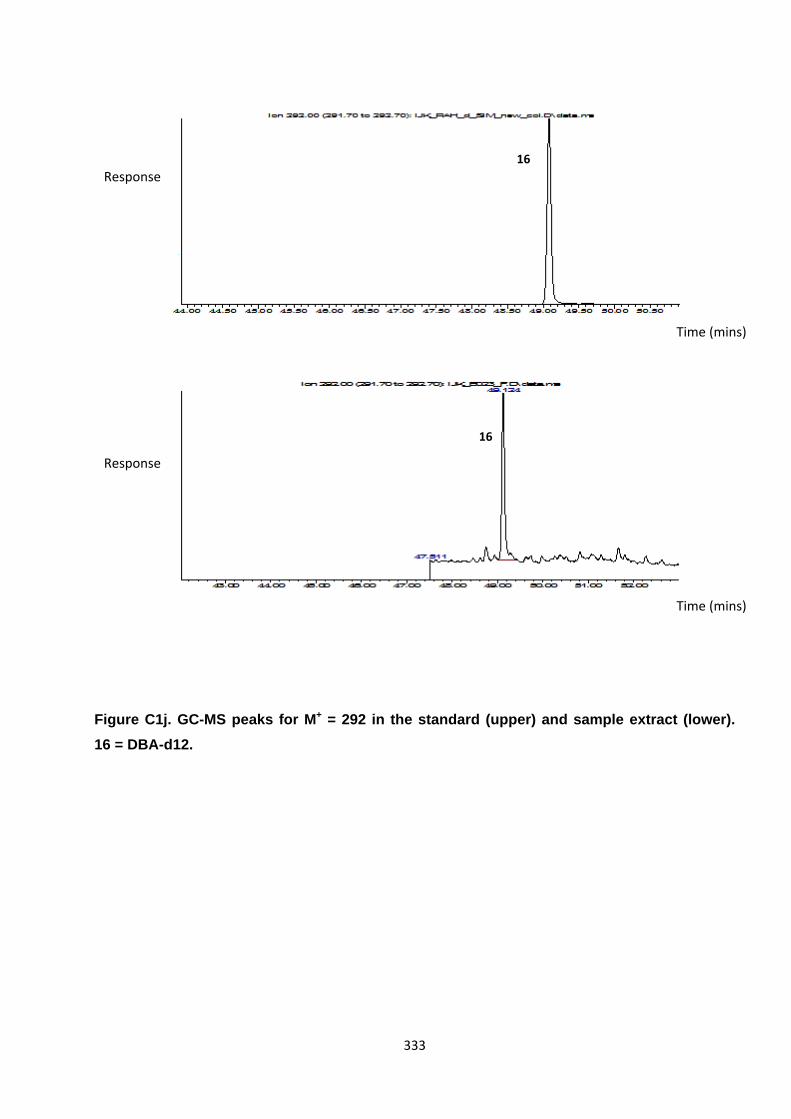
333
Figure C1j. GC-MS peaks for M+ = 292 in the standard (upper) and sample extract (lower).
16 = DBA-d12.
16
16
Time (mins)
Time (mins)
Response
Response

334
Figure C1k. GC-MS peaks for M+ = 312 in the standard (upper) and sample extract (lower).
17 = Cor-d12.
17
17
Time (mins)
Time (mins)
Response
Response
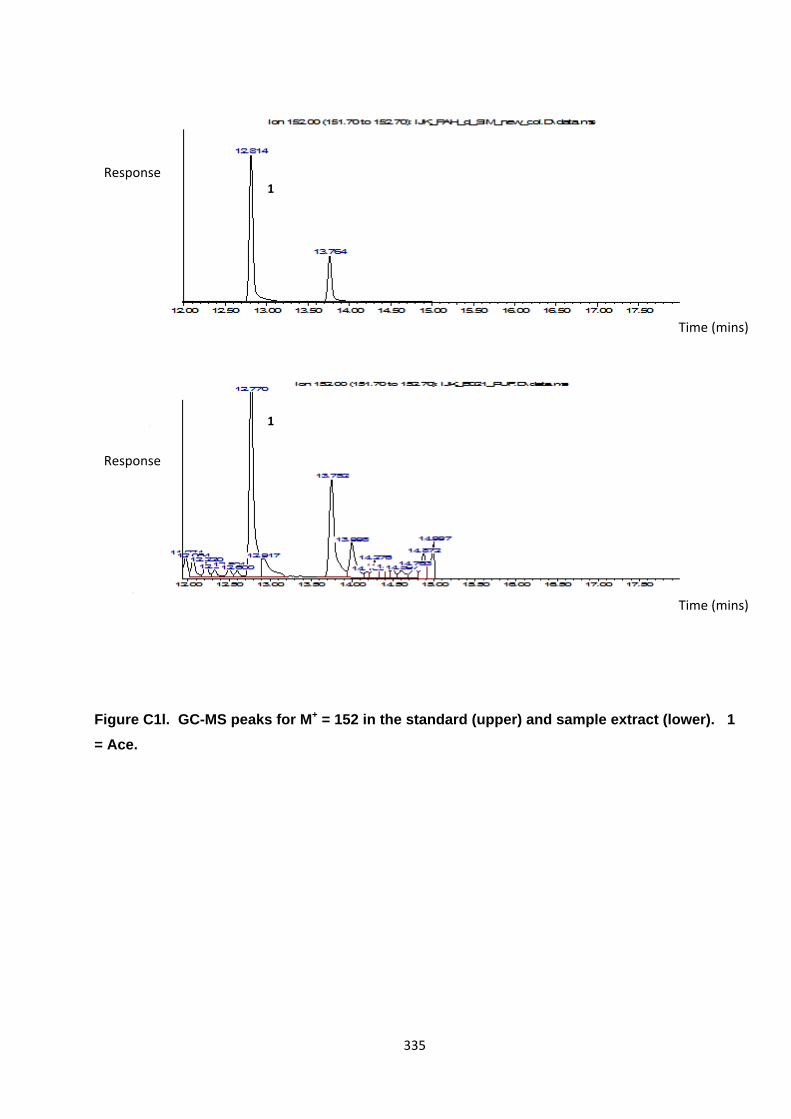
335
Figure C1l. GC-MS peaks for M+ = 152 in the standard (upper) and sample extract (lower). 1
= Ace.
1
1
Time (mins)
Time (mins)
Response
Response

336
Figure C1m. GC-MS peaks for M+ = 153 in the standard (upper) and sample extract (lower).
2 = Acy.
2
2
Time (mins)
Time (mins)
Response
Response
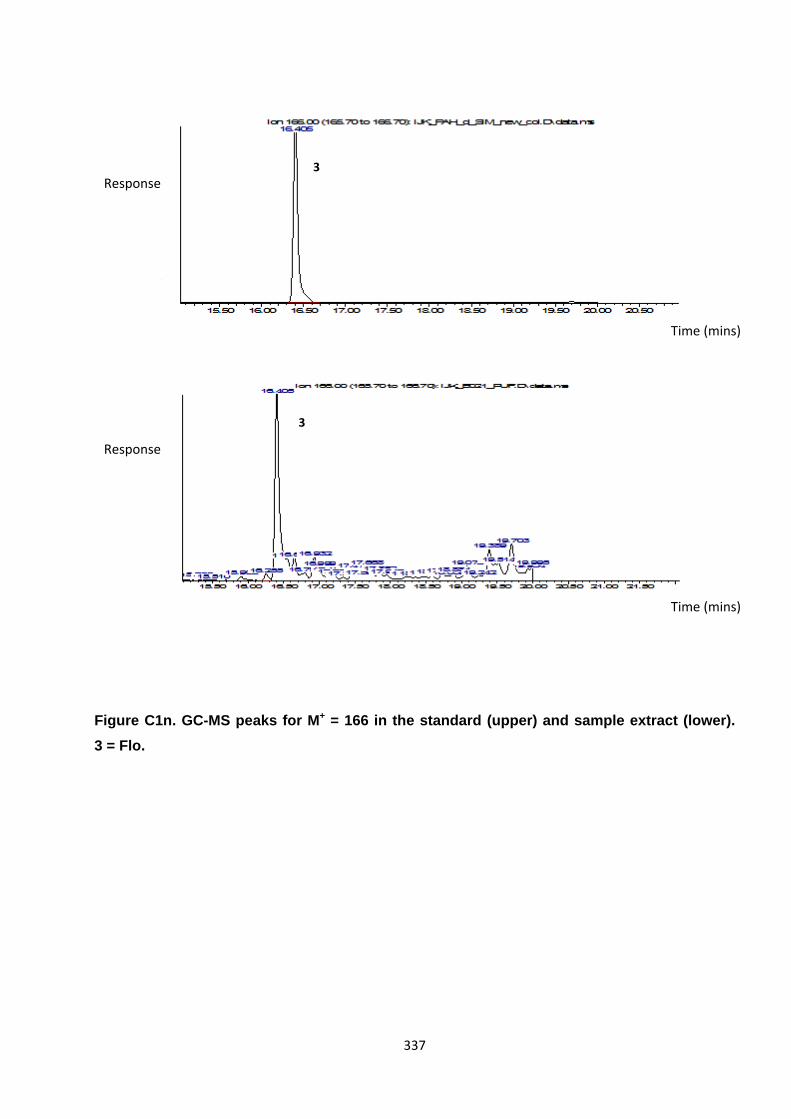
337
Figure C1n. GC-MS peaks for M+ = 166 in the standard (upper) and sample extract (lower).
3 = Flo.
3
3
Time (mins)
Time (mins)
Response
Response
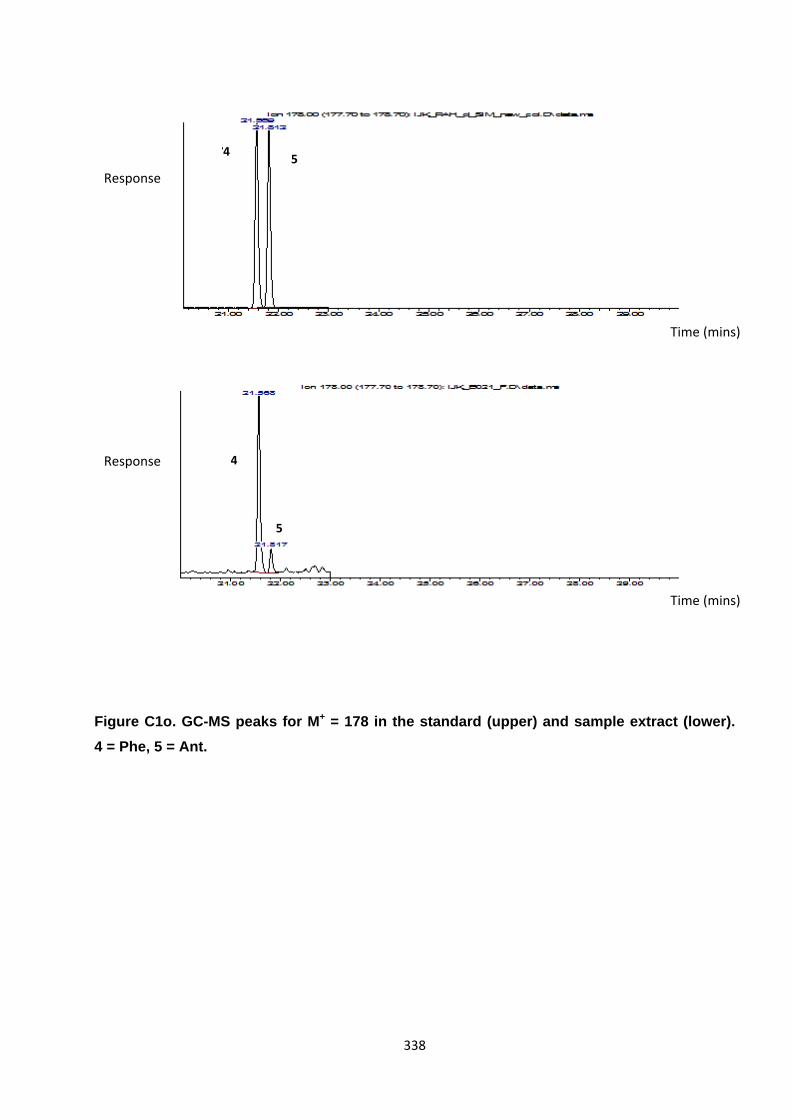
338
Figure C1o. GC-MS peaks for M+ = 178 in the standard (upper) and sample extract (lower).
4 = Phe, 5 = Ant.
4
5
4 5
Time (mins)
Time (mins)
Response
Response
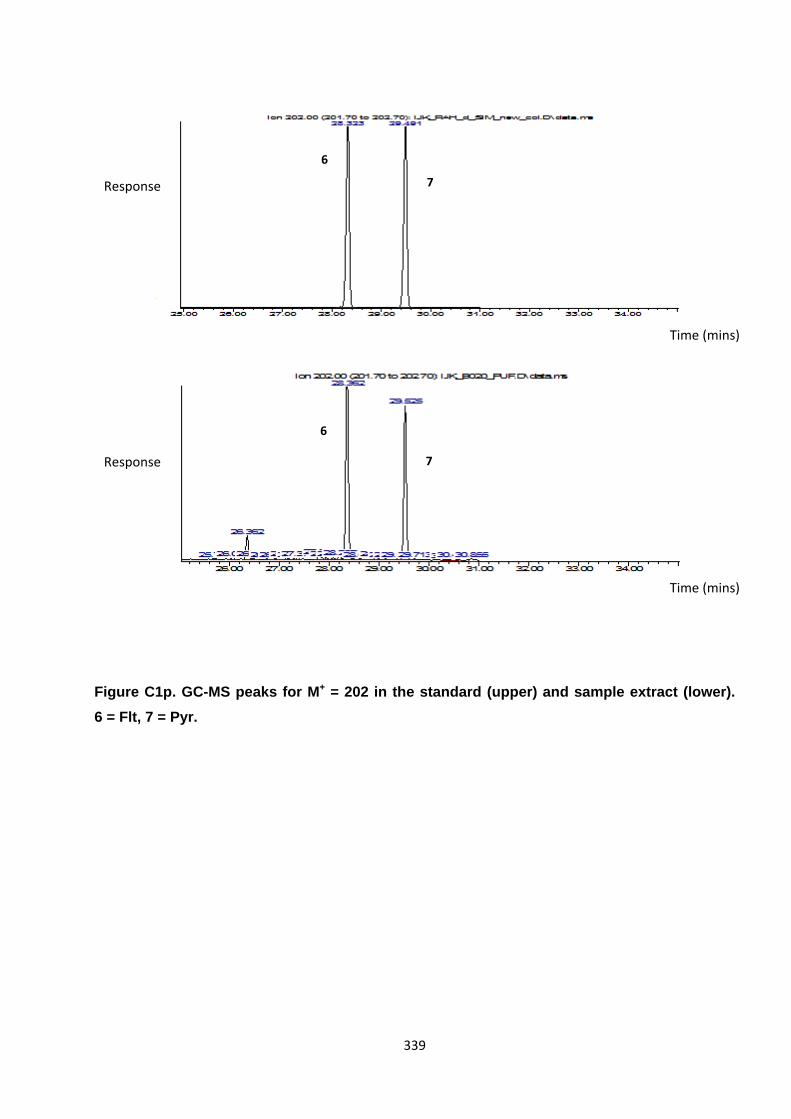
339
Figure C1p. GC-MS peaks for M+ = 202 in the standard (upper) and sample extract (lower).
6 = Flt, 7 = Pyr.
6
7
6
7
Time (mins)
Time (mins)
Response
Response
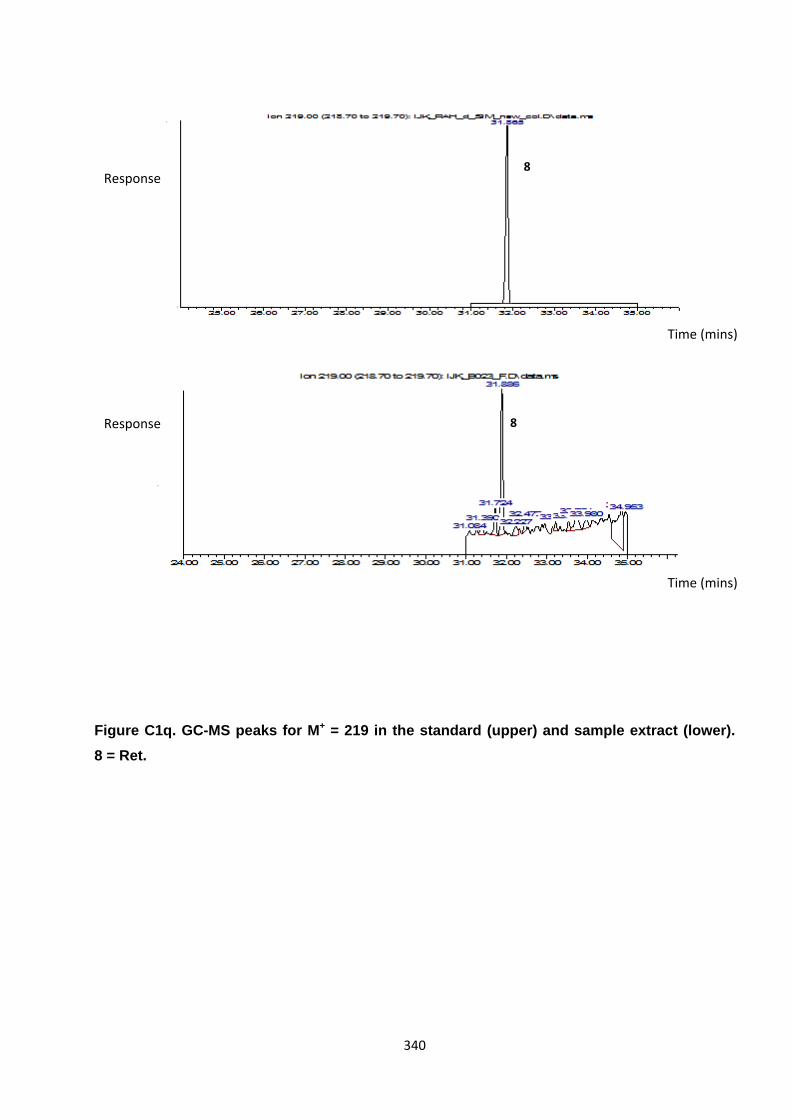
340
Figure C1q. GC-MS peaks for M+ = 219 in the standard (upper) and sample extract (lower).
8 = Ret.
8
8
Time (mins)
Time (mins)
Response
Response
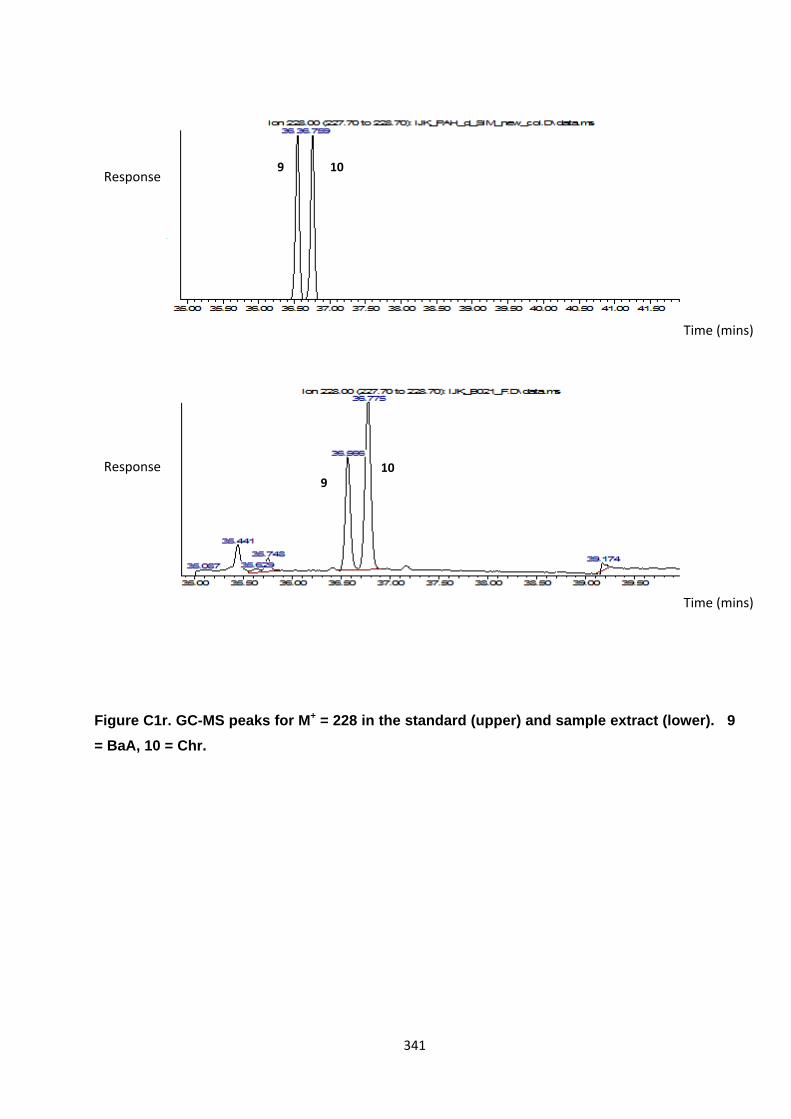
341
Figure C1r. GC-MS peaks for M+ = 228 in the standard (upper) and sample extract (lower). 9
= BaA, 10 = Chr.
910
9 10
Time (mins)
Time (mins)
Response
Response
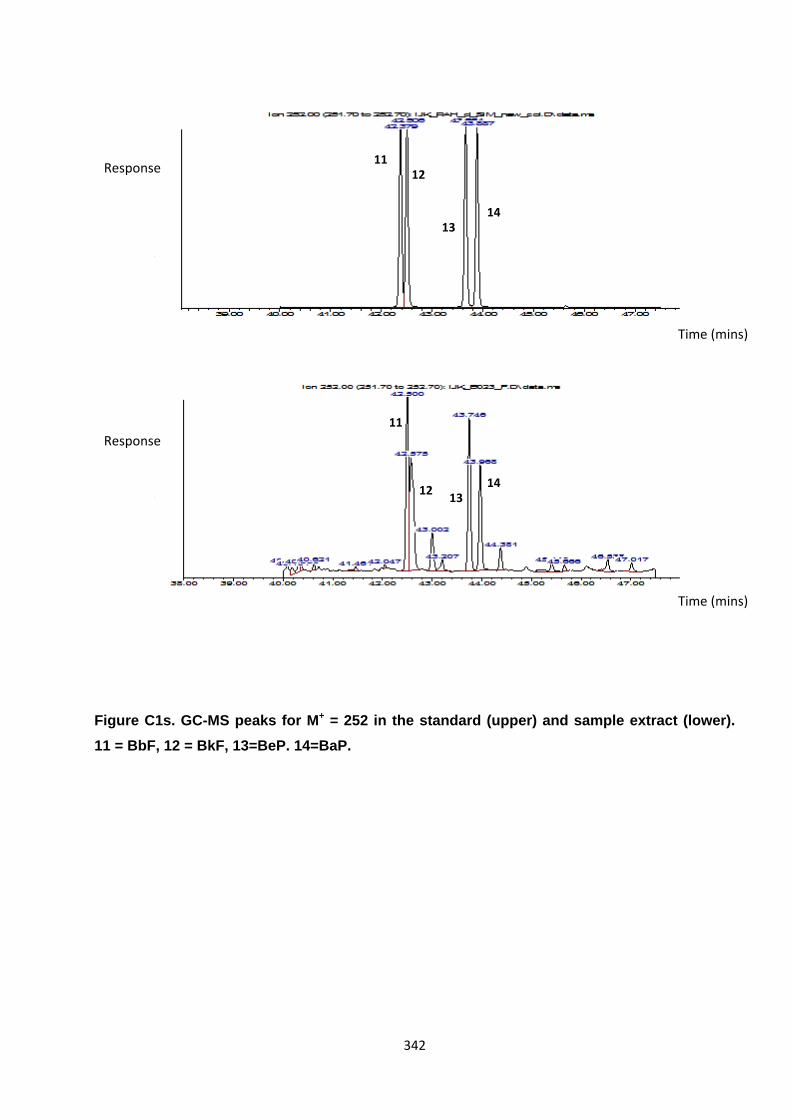
342
Figure C1s. GC-MS peaks for M+ = 252 in the standard (upper) and sample extract (lower).
11 = BbF, 12 = BkF, 13=BeP. 14=BaP.
11
1213
14
1112
1314
Time (mins)
Time (mins)
Response
Response
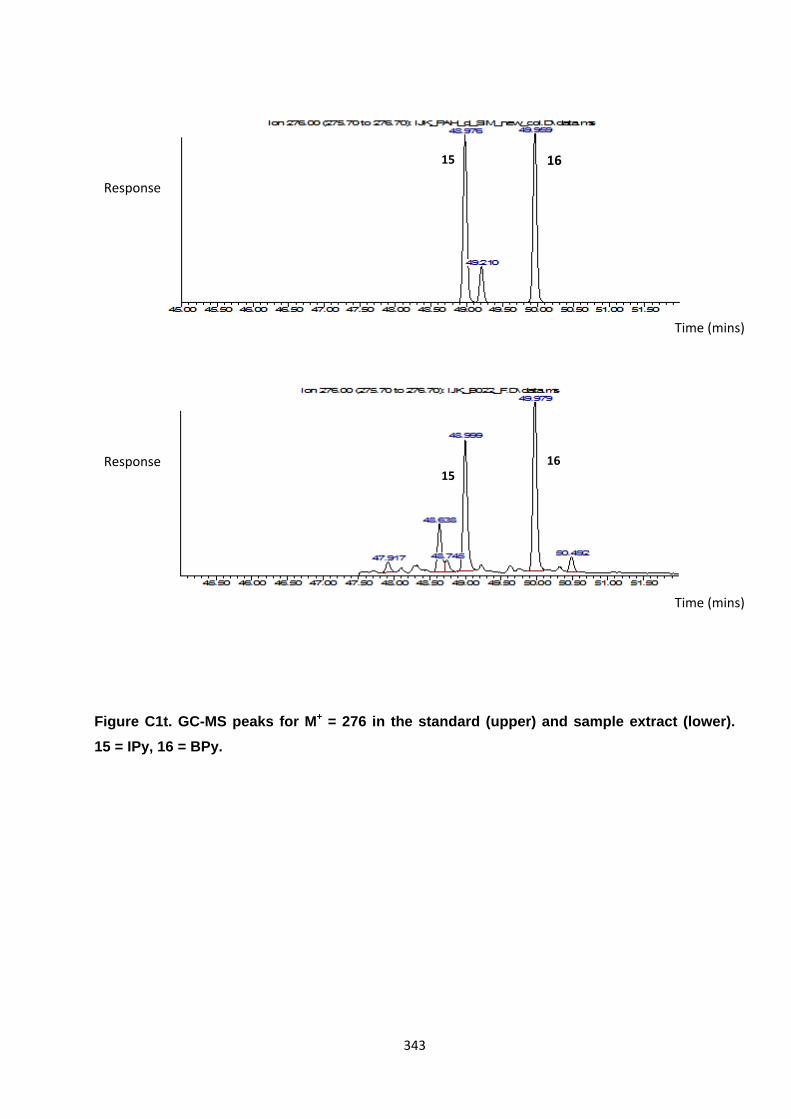
343
Figure C1t. GC-MS peaks for M+ = 276 in the standard (upper) and sample extract (lower).
15 = IPy, 16 = BPy.
1516
15 16
Time (mins)
Time (mins)
Response
Response

344
Figure C1u. GC-MS peaks for M+ = 278 in the standard (upper) and sample extract (lower).
17 = DBA.
17
17
Time (mins)
Time (mins)
Response
Response
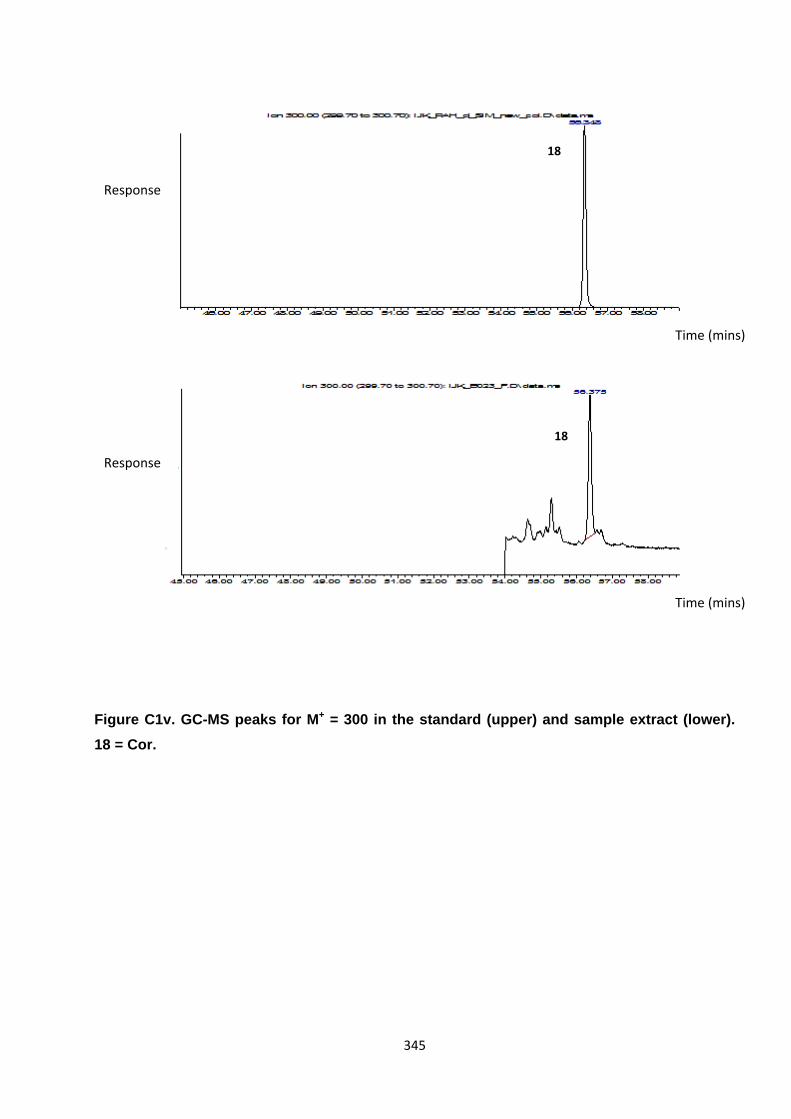
345
Figure C1v. GC-MS peaks for M+ = 300 in the standard (upper) and sample extract (lower).
18 = Cor.
18
18
Time (mins)
Time (mins)
Response
Response

346
Figure C2a. GC-MS peaks for recovery standard FNN (M- = 229) observed in the standard
(upper) and sample extract (lower).
FNF
FNF
Time (mins)
Time (mins)
Response
Response
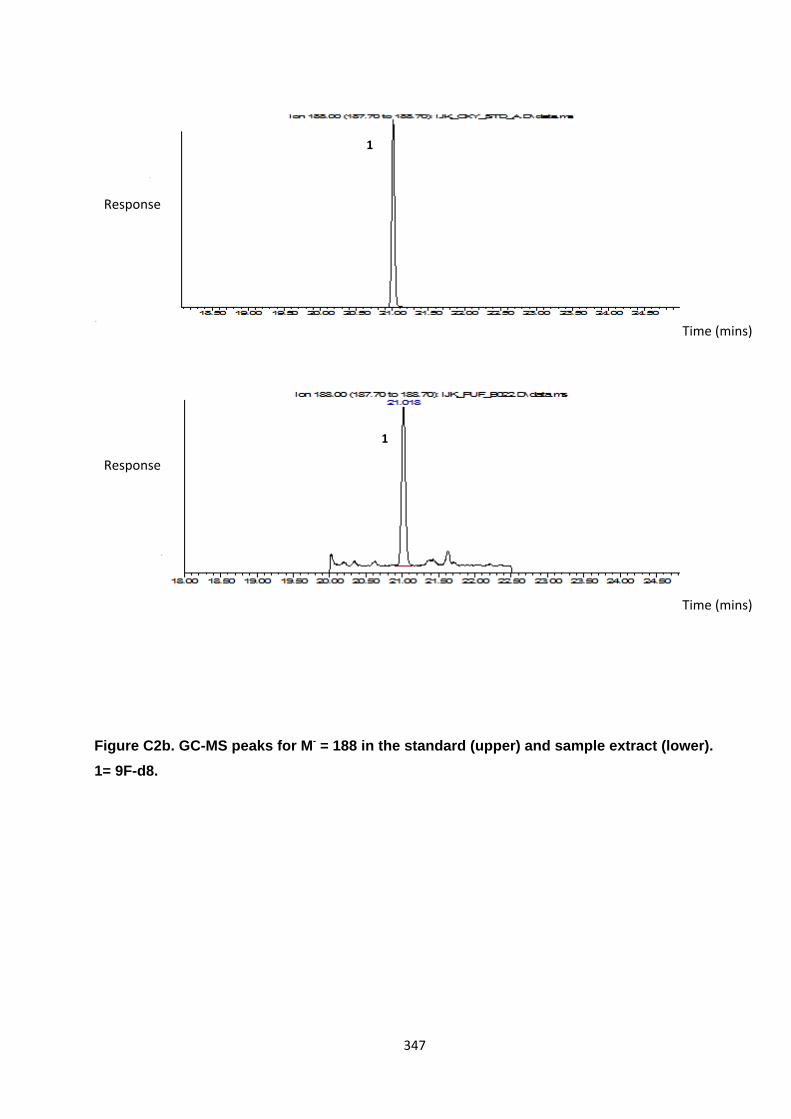
347
Figure C2b. GC-MS peaks for M- = 188 in the standard (upper) and sample extract (lower).
1= 9F-d8.
1
1
Time (mins)
Time (mins)
Response
Response
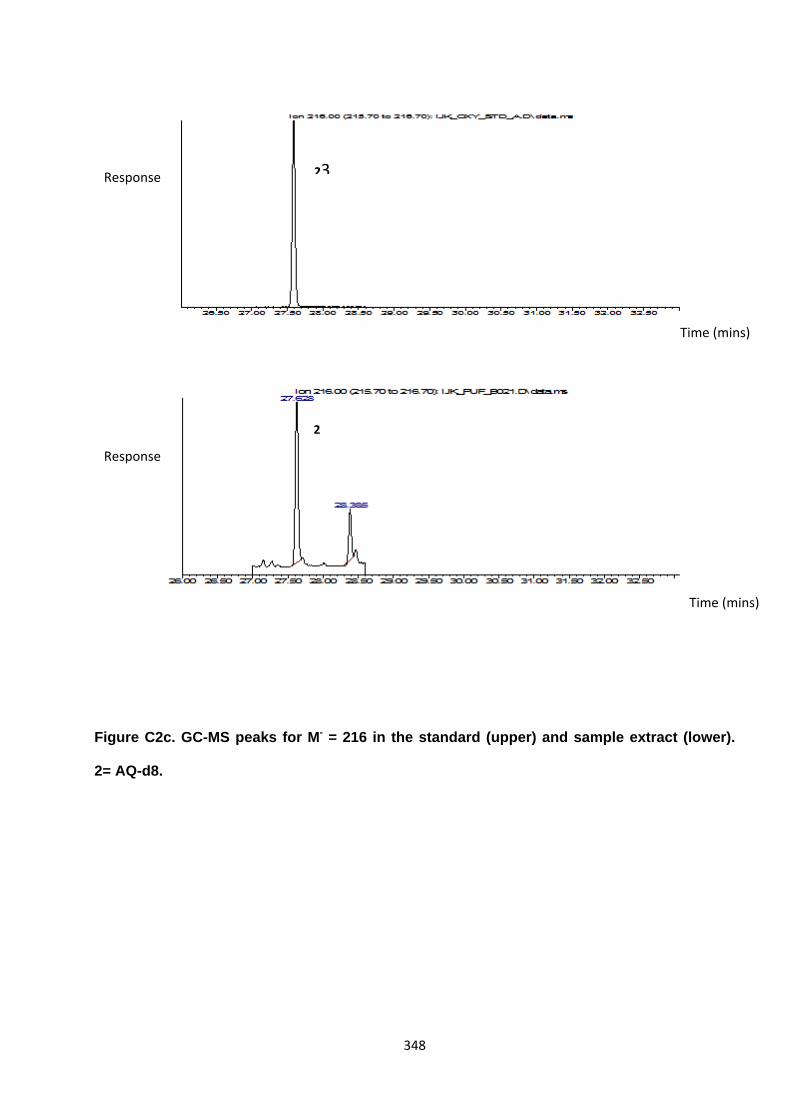
348
Figure C2c. GC-MS peaks for M- = 216 in the standard (upper) and sample extract (lower).
2= AQ-d8.
2
23
Time (mins)
Time (mins)
Response
Response
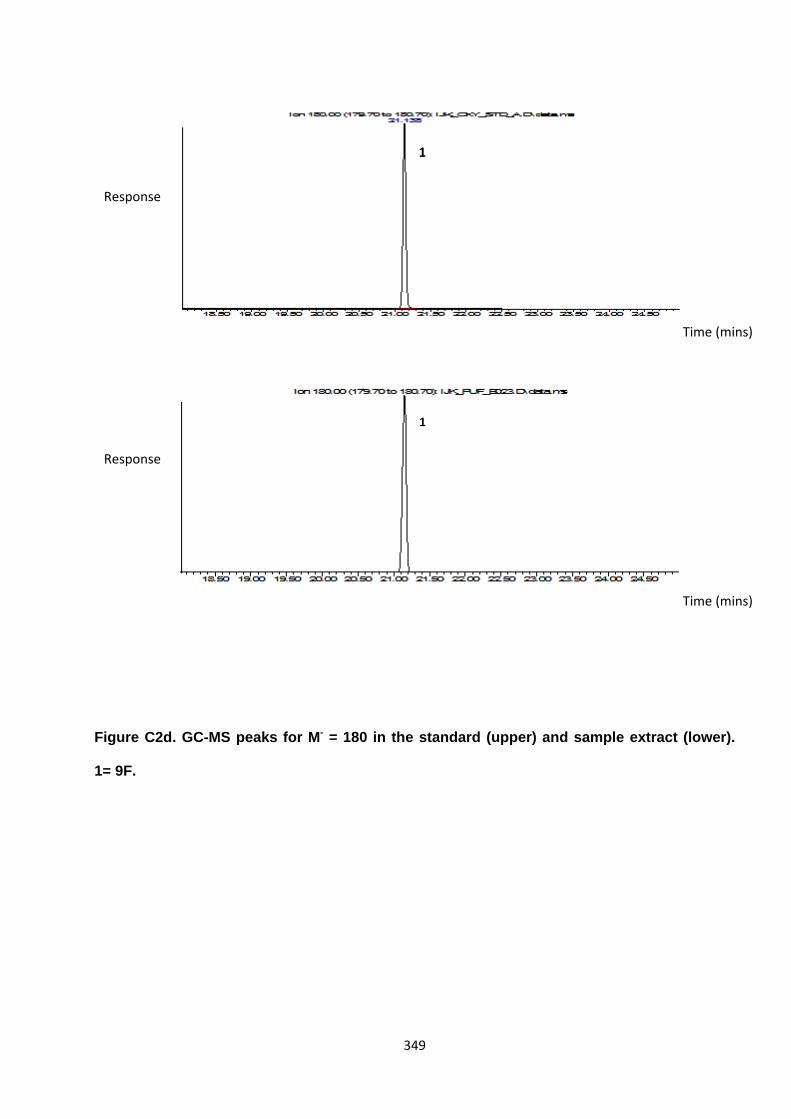
349
Figure C2d. GC-MS peaks for M- = 180 in the standard (upper) and sample extract (lower).
1= 9F.
1
1
Time (mins)
Time (mins)
Response
Response
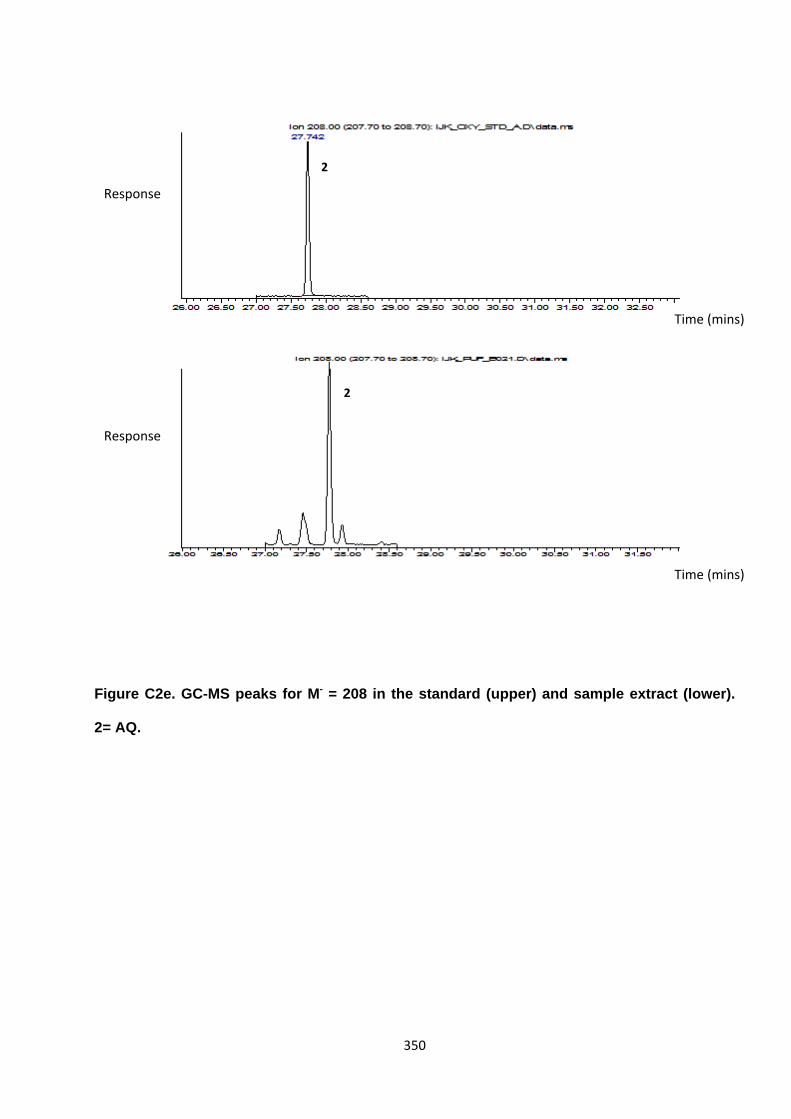
350
Figure C2e. GC-MS peaks for M- = 208 in the standard (upper) and sample extract (lower).
2= AQ.
2
2
Time (mins)
Time (mins)
Response
Response
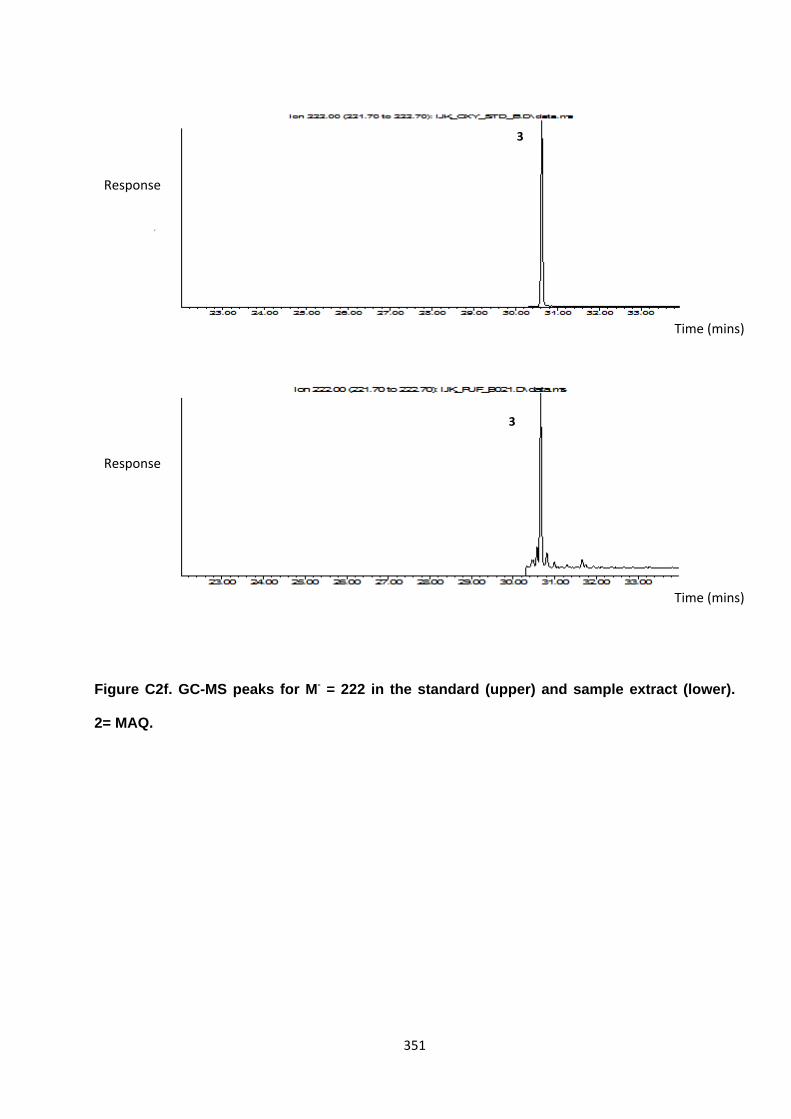
351
Figure C2f. GC-MS peaks for M- = 222 in the standard (upper) and sample extract (lower).
2= MAQ.
3
3
Time (mins)
Time (mins)
Response
Response

352
Figure C2g. GC-MS peaks for M- = 258 in the standard (upper) and sample extract (lower).
4= BaAQ.
4
4
Time (mins)
Time (mins)
Response
Response
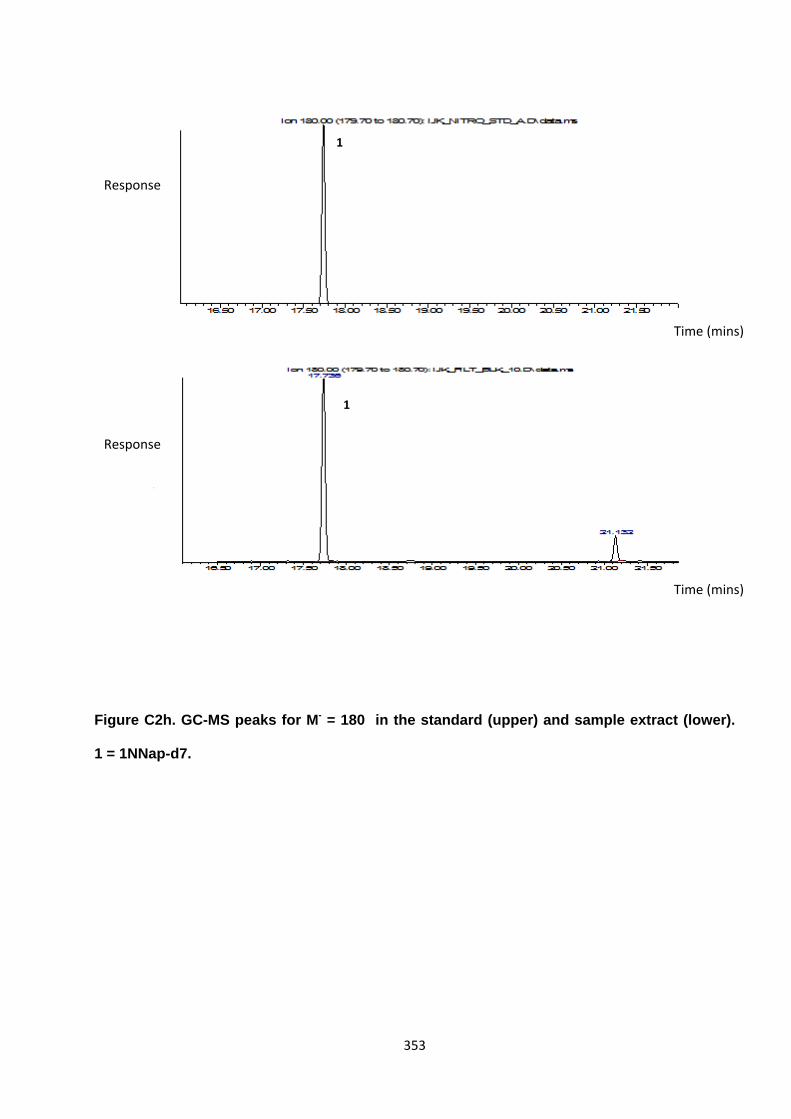
353
Figure C2h. GC-MS peaks for M- = 180 in the standard (upper) and sample extract (lower).
1 = 1NNap-d7.
1
1
Time (mins)
Time (mins)
Response
Response

354
Figure C2i. GC-MS peaks for M- = 220 in the standard (upper) and sample extract (lower).
2= 2NFlo-d8.
2
2
Time (mins)
Time (mins)
Response
Response

355
Figure C2j. GC-MS peaks for M- = 256 in the standard (upper) and sample extract (lower). 3
= 3NFlt-d6, 4 = 1NPyr-d9.
3 4
3 4
Time (mins)
Time (mins)
Response
Response

356
Figure C2k. GC-MS peaks for M- = 284 in the standard (upper) and sample extract (lower). 5
= 6NChr-d11.
Time (mins)
Time (mins)
Response
Response
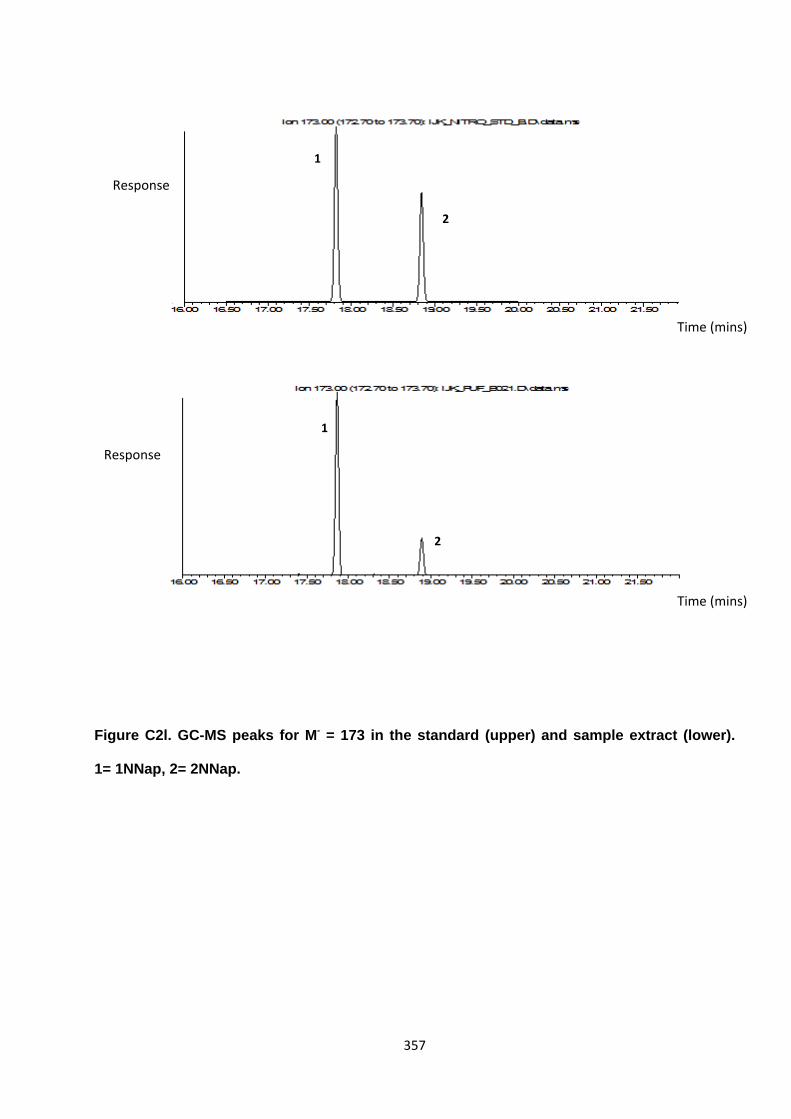
357
Figure C2l. GC-MS peaks for M- = 173 in the standard (upper) and sample extract (lower).
1= 1NNap, 2= 2NNap.
1
2
1
2
Time (mins)
Time (mins)
Response
Response
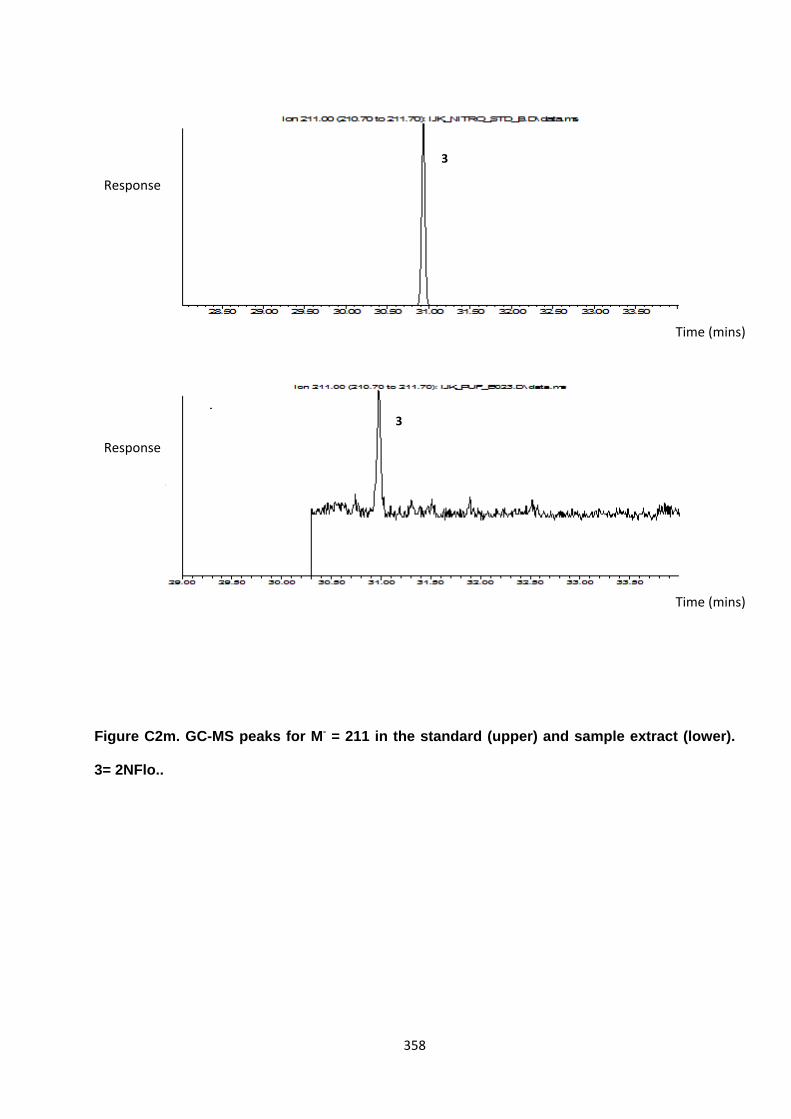
358
Figure C2m. GC-MS peaks for M- = 211 in the standard (upper) and sample extract (lower).
3= 2NFlo..
3
3
Time (mins)
Time (mins)
Response
Response
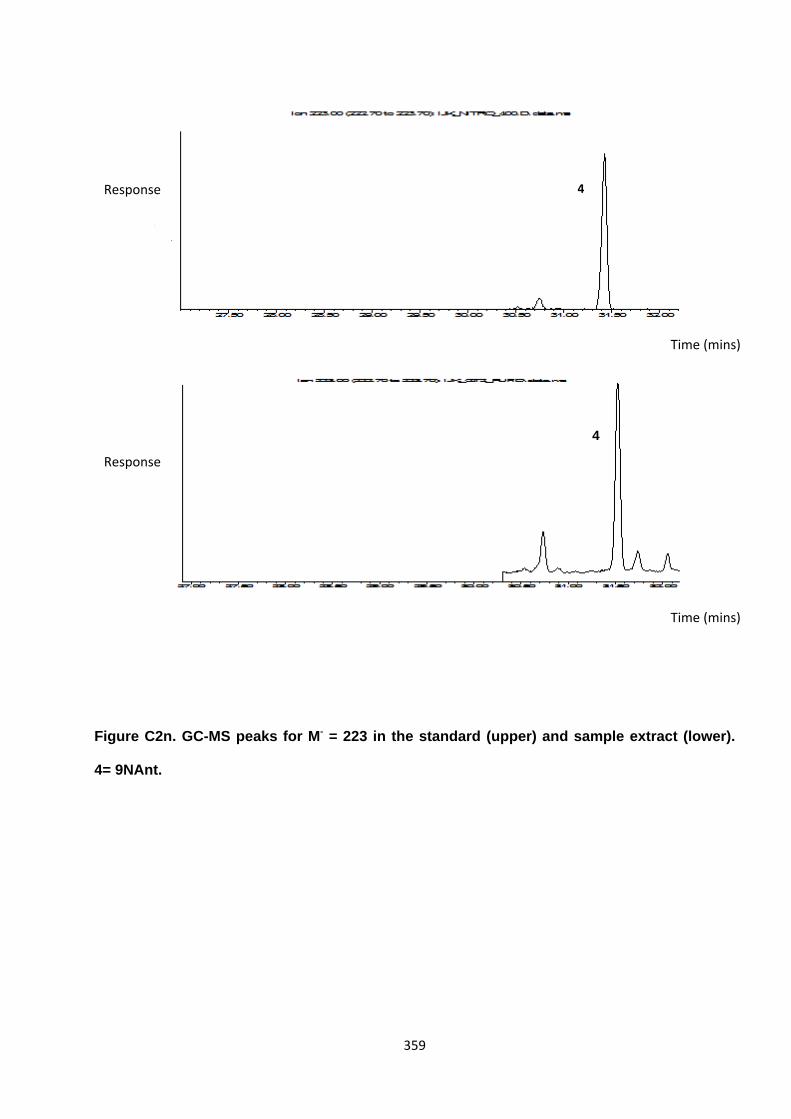
359
Figure C2n. GC-MS peaks for M- = 223 in the standard (upper) and sample extract (lower).
4= 9NAnt.
4
4
Time (mins)
Time (mins)
Response
Response
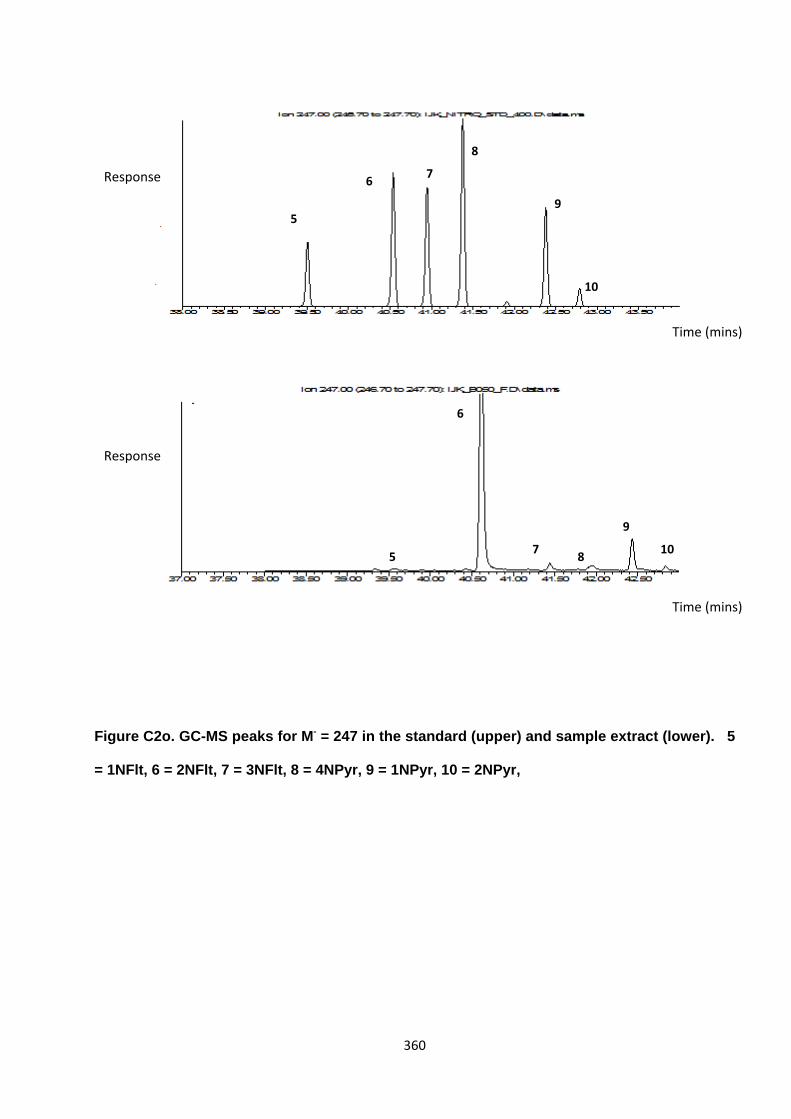
360
Figure C2o. GC-MS peaks for M- = 247 in the standard (upper) and sample extract (lower). 5
= 1NFlt, 6 = 2NFlt, 7 = 3NFlt, 8 = 4NPyr, 9 = 1NPyr, 10 = 2NPyr,
5
6
78
9
10
5
67
8
9
10
Time (mins)
Time (mins)
Response
Response

361
Figure C2p. GC-MS peaks for M- = 273 in the standard (upper) and sample extract (lower).
11 = 7NBaA, 12 = 6NChr.
Time (mins)
Time (mins)
Response
Response