Embed Size (px)
Citation preview

The Colorado Talent Pipeline Report
Pre-release version
In accordance with C.R.S. 24-46.3-103, this Talent Pipeline Report was
prepared by the Colorado Workforce Development Council (CWDC) in
partnership with the Department of Higher Education, the Department of
Education, the Department of Labor and Employment (including the
Division of Labor Standards and Statistics), and the Office of Economic
Development and International Trade, with support from the Office of State
Planning and Budgeting, the State Demography Office at the Department of
Local Affairs, the Department of Human Services, and the Department of
Regulatory Affairs, along with other partners.
For legislative questions or requests related to this report, please contact: Patrick Teegarden, Director of Policy and Legislation Office of Government, Policy and Public Relations, Colorado Dept. of Labor & Employment P 303.318.8019 | C 303-908-0866 | [email protected] All other inquires may be directed to: Stephanie Veck, Director, Colorado Workforce Development Council P 303.318.8235 | C 719.588.2373 | [email protected] or Lauren E. Victor, Ph.D., Talent Development Research and Policy Analyst Colorado Workforce Development Council and Colorado Department of Higher Education P 303.974.2488 | [email protected]

1
TalentFOUND is the brand of the statewide talent development network. It is a joint effort of partners working to ensure that students, job seekers, workers, and businesses can find the tools, programs, and resources they need to design their own unique path to success.
The Colorado talent development network is broad and diverse, including all systems, partners, programs, and initiatives working to build a strong talent pipeline for Colorado. Our students, job seekers, workers, and businesses need help navigating this sprawling, decentralized network -- TalentFOUND will be their guide.
Key components of TalentFOUND to be created for spring 2017 full launch:
Electronic gateway that filters database of assets via logic tree to help students, job seekers, workers, and businesses access the tools and resources of the talent development network already in existence that best help each one find their own unique path to success
Public service announcement videos and digital ads to help raise general public’s awareness
Affiliate communications toolkit containing content to share among their networks
Repository of real life success stories to help strengthen the telling of the Colorado story
TalentFOUND is NOT designed to replicate the many sites and information points already available. It is intended to help visitors connect more efficiently with those resources that best fit their individual needs. Additionally, TalentFOUND is not looking to prescribe anything about the way organizations
provide services, nor is it to replace existing marketing, branding, or communications efforts.
Outcomes: Students, job seekers, and workers will have the information they need to explore a variety of education and training and career opportunities and more easily access the resources already available to help set and achieve their career goals. Businesses will use the Colorado talent development network as a reason for staying in, coming to, and expanding in Colorado. Affiliates will be able to communicate their role in the network and the benefits to students, job seekers, workers, and businesses. Elected officials and community leaders will see the value of the network and the resulting talent pipeline. State agencies and the administration will have access to common talking points and real success stories, ensuring a more consistent and stronger telling of the Colorado story.
At this time, we continue gathering feedback from partners, mapping assets for the gateway, creating the components for the spring 2017 launch, and recruiting charter affiliates. The September 2016 release of this report marks the soft launch of TalentFOUND as the overarching brand of the talent development network. A temporary landing page is live at talentfound.org where any organization that is part of the network can learn more and sign up to become a charter affiliate of TalentFOUND.
As the Talent Pipeline Report tells the story of the talent development network through data and is a collaboration of network partners, we are excited for it to be the first use of the TalentFOUND brand.

2
EXECUTIVE SUMMARY
Having the right mix of talent is critical to supporting the growth of Colorado businesses, continuing to attract new business to the state and ensuring that Coloradans have good job opportunities. This report explores issues impacting talent in the state, from the evolving labor market to changing demographics to postsecondary education outcomes. Like in previous reports, we explore jobs that are high demand, high growth jobs that pay a living wage. This year we look at two earnings tiers: one that includes jobs meeting a living wage for a family of three (one working adult), another that includes jobs meeting a living wage for an individual. Job openings in the higher earnings tier are largely concentrated in healthcare practitioners and technical, business and finance, IT, and engineering occupations. Job openings in the lower earnings tier are largely concentrated in construction, office and administrative support, healthcare support, and education occupations. For job openings in the higher earnings tier, nearly all typically require formal education or training beyond high school for entry into the field, while the lower earnings tier offers far more opportunity for workers without education or training beyond high school. In an effort to better understand in-demand, employer-sought skills, we look to trends in today’s online job postings. While technical skills certainly vary depending on the occupation type and/or industry, among the most commonly posted professional competencies are oral and written communication, problem solving and integrity. Studies show that work-based learning may have an advantage in developing certain skills, such as trustworthiness and teamwork, while school-based learning may have a comparative advantage in developing analytical thinking and the joy of learning. Colorado is engaged in a range of programs and initiatives supporting talent development. Activity focusing on experiential work-based learning opportunities is guided by the Governor-appointed Business Experiential Learning (BEL) Commission, and occurring through initiatives such as CareerWise Colorado’s youth apprenticeships. A statewide two-generation work group is engaged in expanding the implementation of two-generation strategies across more agencies and organizations. The Colorado Department of Labor and Employment offers numerous career services for veterans, serving over 18,000 veterans during the 2015 program year. Sector strategies continue to expand, with 21 active or emerging sector partnerships across the state focusing on industries such as healthcare, manufacturing and agriculture, and over 450 involved businesses. Colorado has also been actively working on further developing career pathways; for example, legislation (HB 15-1274) has guided the development of IT career pathways, as well as those for healthcare and construction. Recommendations include:
Promote apprenticeships by creating a strong foundation of youth apprenticeships that integrate secondary education, postsecondary education and work.
Support the cross-agency 2-Gen approach, and focus on “two-generation approaches” that work with both parents/caretakers and children to improve education and work outcomes.
Support streamlined regulations of credentialing to result in a more rapid response to filling high demand occupations.

3
TABLE OF CONTENTS Executive Summary .......................................................................................................................................................................... 2
Introduction ...................................................................................................................................................................................... 4
Top Talent Issues Explained .............................................................................................................................................................. 4
The Future of Jobs ........................................................................................................................................................................ 4
The Gig Economy .......................................................................................................................................................................... 5
The Future of Talent ..................................................................................................................................................................... 6
What about the “Colorado Paradox”? .......................................................................................................................................... 9
The Impact of Postsecondary Education .................................................................................................................................... 11
Top Jobs in Colorado ....................................................................................................................................................................... 16
What is a Top Job?...................................................................................................................................................................... 16
Top Jobs by Occupation Group ................................................................................................................................................... 16
Top Jobs by Education Level ....................................................................................................................................................... 18
Nurturing Talent for Top Jobs ..................................................................................................................................................... 20
HB 16-1289 Career Development Success Pilot Program ....................................................................................................... 20
HB 15-1170 Postsecondary and Workforce Readiness ........................................................................................................... 21
In-Demand Skills ......................................................................................................................................................................... 21
Putting Policy into Practice in the Colorado Talent Development System ..................................................................................... 23
Sector Strategies: A Key to Industry-Led Talent Solutions in Colorado ...................................................................................... 23
Sector Partnerships in Colorado ............................................................................................................................................. 24
Statewide Industry Associations are Critical Collaborators in Developing Talent .................................................................. 27
Building Industry-Driven Career Pathways Systems in Colorado ............................................................................................ 27
Two-Generation Strategies......................................................................................................................................................... 28
Veteran Strategies ...................................................................................................................................................................... 29
Services for Veterans with Significant Barriers to Employment ............................................................................................. 29
Hilton Honors (HHonors) Military Rewards Program ............................................................................................................. 30
HB 16-1197 Military Veteran Occupational Credentials Implementation .............................................................................. 30
Strategies for Coloradans with Disabilities ................................................................................................................................. 30
Implementing Systemic Change in Experiential Learning Opportunities.................................................................................... 31
Collaboration across the Talent Development Network ............................................................................................................ 32
Recommendations .......................................................................................................................................................................... 33
References ...................................................................................................................................................................................... 35
Appendix A: Top Jobs List by Occupation Cluster Appendix B: Top Jobs List by Typical Education for Entry Appendix C: Top Jobs Spreadsheet Appendix D: Changes in Top Jobs from Last Year to This Year Appendix E: HB 15-1170: PWR Coordinator Update Appendix F: Top Jobs: Top Skills and Employers from Online Job Postings Appendix G: HB 16-1289: Career Development Success Pilot Program Appendix H: Add’l Information Regarding Specific Collaborators in the Talent Development Network Appendix I: Overview of Information Technology (IT) in Colorado

4
It’s difficult to adapt fast enough to shifting job qualifications, as many jobs
are requiring higher levels of technology literacy and a more flexible skills
accumulation mindset.
INTRODUCTION
Having the right mix of talent is critical to supporting the growth of Colorado businesses, continuing to attract new business to the state, and ensuring that Coloradans have good job opportunities. In this year’s Talent Pipeline Report, we explore:
Top talent issues of today;
Top jobs and skills; and
Talent development strategies.
TOP TALENT ISSUES EXPLAINED
THE FUTURE OF JOBS
The labor market is evolving faster than ever through the influence of technological
innovations. How is this impacting talent?
Job qualifications are shifting. While some jobs are becoming automated, many
require increasingly higher levels of technology literacy to operate more advanced
systems and procedures. More than ever, workers must have a “liquid skills mindset”—
a “flexible, ongoing approach to skills accumulation” in response to volatility in the
labor market (Infosys, p. 23). As a result of technological advancements, the “ability
to work with data and make data-based decisions will become an increasingly vital
skill across many job families” (World Economic Forum, 2016, p. 21). Astutely, college
students tend to believe that both interpersonal skills and agility with workforce-
related technology help improve job prospects, with business and economics and STEM
majors putting more emphasis on the importance of having a degree in what they
perceive as a “marketable field,” over arts and humanities and social sciences majors
(McGraw Hill, 2016).
Society can’t adapt fast enough. Nearly half of young workers in the United States
find that their formal education did not prepare them for their work life (Infosys,
2016), suggesting an opportunity to fill a gap between education and employment
through work-based learning opportunities. Yet, while the majority of young workers
have to learn new skills for their job, more than half are optimistic about their future
job prospects (Infosys, 2016). Demographics also impact talent demands—for example,
the role and importance of women as talent and consumers has been increasing, and

5
About 0.5% of all
workers rely on an
online gig platform
(such as Uber) for
primary income.
the longevity of aging populations will also impact both talent needs and the nature of
consumers (WEF, 2016).
Globalization of the economy. Young people believe they are dealing with a more
competitive job market as a result of increased globalization (Infosys, 2016). As a
state, we compete nationally and internationally for talent, especially as new
technologies innovate work environments (e.g. working remotely, teleconferencing).
For some types of jobs this means that increasingly, “work is what people do and not
where they do it,” forcing organizations to become more agile if they wish to stay
competitive (WEF, 2016, p. 30).
THE GIG ECONOMY
With the emergence of online platforms, such as Uber and Taskrabbit, that directly connect a
consumer with a provider of services or products, the concept of a seemingly more ubiquitous
“gig economy” has evolved. How significant is this segment of the workforce? Does a “gig
worker” truly benefit from such arrangements?
Nationally, only about 0.5 percent of all workers rely
primarily on an online gig economy platform (such as
Uber) for their income. For the most part, alternative
work arrangements—such as contract, on-call or
temporary work—do not involve work coordinated
through such online platforms, although this online gig
workforce is, in fact, rapidly growing (Katz and Krueger,
2016).
Most workers who earn income through an online gig economy platform already have
other jobs as their main income source. A JP Morgan Chase Institute study (2015)
found that 82 percent of gig economy platform users (e.g. Uber drivers, TaskRabbit
Taskers) relied on these earnings for less than 25 percent of their total income.
Workers with their main job as an alternative work arrangement increased from 10.1
to 15.8 percent of all workers over the past decade, with the largest increase being
seen in contracted workers (Katz and Krueger, 2016). See Figure 1 below.
Through a combination of business cycles and workers’ changing ideals, there are
cycles in entrepreneurial activity. There is typically growth in sole
proprietorships/entrepreneurship during a recession as people creatively pursue an
income, which eventually declines as more workers return to traditional employment.

6
Older workers have
seen the greatest
increases in
alternative work
arrangements.
By 2050, our workforce
will near a 50/50
balance between our
majority white and
minority populations.
Figure 1: Breakdown of the Gig Economy in the United States
*Percentages may not total due to rounding. Source: Data based on Katz and Krueger’s 2016 analysis
The largest increase in the share of workers employed
in alternative work arrangements as their main job is among
workers over the age of 55. The percentages of women and
Hispanic workers employed in an alternative work arrangement
have also increased substantially (Katz and Krueger, 2016).
Jobs in the gig economy may lack health insurance,
retirement plans, guarantee of a specific income and other
benefits; also, a gig economy worker is typically considered an independent contractor
and not an employee, thus not covered by various labor laws. However, many people
value on-demand work opportunities for the flexibility and the opportunity presented
through low operating costs, or for the option to work part-time as a retiree or
student.
THE FUTURE OF TALENT
In various regions of the state, there is a relatively strong economy with low unemployment
rates and growing job opportunities, and educated newcomers continue to move to the state.
It is important to understand how changing demographics have the power to impact
characteristics of our future workforce.
The racial and ethnic composition of our state’s
population is experiencing dramatic shifts—by 2050
our workforce will near a 50 percent balance
between our majority and minority populations.
Why does this matter? We have significant
disparities in education levels between the majority white non-Hispanic adult
population and Hispanic, black and Native American populations—so much so that if we
do not see continued improvement in educational attainment levels, we will see
6.4% 6.9% 8.4%
1.6% 1.7% 2.6%
1.0% 0.9%
1.6% 0.5%
0.6%
3.1%
1995 (9.5%) 2005 (10.1%) 2015 (15.8%)
Independent contractors On-call workers
Temporary help agency workers Workers provided by contract firms

7
While we’ve had a
younger population than
the nation in recent years,
the aging of the Baby
Boomers will change
Colorado’s age
distribution rapidly. We
are increasingly looking
more like the nation.
declines in the education levels of our adult population. This is not just an
“education” issue, but a “workforce” issue.
Figure 2: Changing Workforce Demographics in Colorado
Source: Based on Colorado State Demographer’s population projections
The total labor force participation rate will continue to decline as aging baby boomers
exit the labor force.
Figure 3: The Change in Age Distribution in Colorado
Source: Colorado State Demographer
26%
All Minorities
38%
48%
74%
White, non-Hispanic
62%
52%
18%
Hispanic
27%
36%
8%
Other Minorities (Black, Asian,
Native American)
10% 12%
2010 2020 2030 2040 2050

8
The Colorado labor
force will continue
to grow, but at a
much slower rate
than historical
growth.
The labor force in Colorado will continue to increase in size, but at a slower rate than
historical growth. By 2040, the labor force will be larger in number, older and include
a larger share of females. It will also be smaller relative to the total population it
supports.
Figure 4: The Growth Rate for the Colorado Labor Force
Source: Colorado State Demographer
Certain occupation clusters have high numbers of workers nearing retirement,
including:
o Office and administrative support occupations (100,000 workers, or 25 percent
of workers in this occupation cluster)
o Sales and related occupations (65,000 workers, or 22 percent of workers in this
occupation cluster)
o Business and finance occupations (43,000 workers, or 24 percent of workers in
this occupation cluster)
o Education, training and library occupations (42,000 workers, or 27 percent of
workers in occupation cluster)
Source: EMSI 2016.3
0
1
2
3
4
5
Ave
rage
An
nu
al G
row
th R
ate
(%
)
Labor Force Population
Figure 5: Occupation clusters with the largest number of workers who are 55+

9
More than 70 percent
of Colorado adults
with education beyond
high school were not
born in Colorado.
Overall, 70 percent of
Colorado adults were
not born in Colorado.
We need to stay attractive to both businesses and our workforce, through maintaining features such as access to a high quality of life,
vibrant communities and natural amenities. The above serve as examples of factors that rank high per the Office of Economic
Development and International Trade (OEDIT) business and talent surveys.
WHAT ABOUT THE “COLORADO PARADOX”?
For many years, policy leaders and others misleadingly used the term “Colorado
Paradox” as a way to describe the fact that Colorado ranked high in percentage of
adults with postsecondary credentials, but low in the education attainment of its own
students.
Colorado attracts a highly educated population and consistently ranks as one of the
top states to do so. It is also true that the majority of educated workers in Colorado
were not born in Colorado; however, the majority of all adults (70 percent) were not
born in Colorado.
Source: U.S. Census Bureau; 2015 American Community Survey, 1-year estimates
The education levels of Colorado-born adults are actually higher than education levels
typically seen across all states for native-born adults who remain in their state of
birth. Adults with higher levels of education tend to have more geographic mobility
(explaining in part why people who move across state lines tend to be well-educated),
so we have done relatively well in continuing to be an attractive place to live for our
educated Colorado-born population. Ultimately, we need to have an infrastructure
that keeps Colorado attractive to any skilled workforce no matter where they are
born, ensuring quality and alignment between education and work opportunities, and
a high quality of life.
Does not have postsecondary
education 31%
Born outside of Colorado
73%
Colorado native 27%
Has postsecondary
education 69%
Figure 6: Education Levels by Place of Birth

10
Colorado’s To Do List: 1. Grow our own talent 2. Attract the best talent
3. Retain talent
Figure 7: Percentage of Adults with Some College Experience and Above for Colorado Natives, Other States’ Natives and Overall United States
Source: U.S. Census Bureau; 2015 American Community Survey, 1-year estimates
What is the issue at play in terms of
educating talent in Colorado? Much of the
challenge is in our changing demographics. As we
have discussed in previous reports, Colorado—like
most states—has an educational pipeline with
numerous leaks, from on-time high school
graduation through college enrollment and graduation. Unfortunately, like the rest of
the nation, the leaks are far more pronounced for Hispanic, black and Native American
and low-income youth. With such a large and growing young Hispanic population, the
impact of these inequities will continue to increase and be manifested in disparate
education levels of our future adult population, unless we make changes in student
success rates today. In our current adult populations, the gap already exists—54
percent of non-Hispanic white adults have a college degree, while 21 percent of
Hispanic adults have a college degree (U.S. Census Bureau, 2015).
64%
57%
60%
Colorado native living inColorado
United States - born inand living in state of birth
United States overall

11
For more data updates on
education and employment
throughout the year, visit
our data dashboard.
Figure 8: The K-12 - College Talent Pipeline in Colorado
While only 56 percent of high school graduates immediately enroll at a community
college or university, a higher share of the adult population has at least some college
experience. This differential is due to multiple factors, including the impact of
Coloradans who matriculate into college as adults (about 40 percent of undergraduate
students are over the age of 25) or obtain credentials through private occupational
schools.
What about other pathways to success? Colorado does not have complete information
about how our students are progressing through educational and training options
outside the path of attending a college or university. There are many other
postsecondary training options, including the military or work-based training and
industry certification programs, which develop an individual’s skills and lead to
employment. We know that there are many in-demand jobs that rely on
apprenticeships and work-based learning to develop their talent (see the complete top
jobs list in the Appendix, for example), and many more in-demand jobs that could
etch out similar articulated training pathways.
For many of these opportunities, information for
students and counselors is not readily and
systematically available. A comprehensive state
resource providing such information could help
streamline and strengthen these pathways.
THE IMPACT OF POSTSECONDARY EDUCATION
As of July 2016, Colorado continues to see one of the lowest unemployment and
underemployment rates in the nation, at 3.4 percent and 7.3 percent, respectively.
The underemployment rate (that is, people who are involuntary part-time workers or

12
Colorado’s unemployment (3.4%) and underemployment (7.3%) rates are some of the
lowest in the country.
whose skills are not being fully utilized in their current position) is the lowest it has
been since 2007, prior to the Great Recession.
Table 1: Comparison of Unemployment Rates
Unemployment
Rate (U-3) Underemployment
Rate (U-6)
Colorado 3.4% 7.3%
Arizona 5.7% 11.3%
Utah 3.8% 7.8%
Washington 5.7% 10.7%
United States 5.0% 9.9%
Source: Bureau of Labor Statistics, 2016. 3rd quarter of 2015 through 2nd quarter of 2016 averages.
Unemployment varies depending on
education level. Among individuals with
higher education levels, there tends to be a
low unemployment rate and a higher rate of
participation in the labor force, as well as a
higher earnings potential. Among workers
with less than a high school diploma the rate is similarly low in this Colorado dataset,
but this is likely due to this segment being marginally engaged in the workforce, with
low participation rates and lower skill levels. Their engagement is less stable, with
many workers entering the workforce in low paying, low skill positions seasonally,
whether it is their preference or not. This is also a much smaller segment of the state
population, so shifts in behavior show up more dramatically in the data.
Table 2: Colorado and National Employment Statistics by Education Levels
Educational Attainment
Labor Force Participation
Rate - CO
Labor Force Participation
Rate - US
Unemployment Rate (U-3) - CO
Unemployment Rate (U-3) - US
Median Earnings -
CO
Median Earnings -
US
Less than a high school diploma
52.1% 45.4% 2.5% 8.0% $25,304 $21,320
High school graduate or equiv., no college
59.5% 57.2% 4.2% 5.4% $31,280 $29,004
Some college or associate degree
65.2% 66.6% 2.9% 4.5% $35,392 $34,377
Bachelor's degree
71.7% 74.4% 2.2% 2.6%
$50,196 $50,930
Graduate or professional degree
$63,270 $67,286
Source: For labor force participation and unemployment rates - Current Population Survey, 2016. For median earnings - U.S. Census Bureau; 2015 American Community Survey, 1-year estimates
Underemployment rates are still typically lowest for workers with the most education
(Economic Policy Institute analysis of Bureau of Labor Statistics CPS monthly
microdata). While not a new phenomenon, it is also not unusual for recent college

13
graduates to have elevated levels of underemployment in comparison to the greater
college educated population, as it may take some time for them to transition into a
career (Abel & Deitz, 2016; Abel, Deitz & Su, 2014).
Figure 9: Underemployment Rate of Workers by Education Level in the United States, 1994-2015
Source: Economic Policy Institute
Digging deeper, median earnings outcomes vary depending on college credential and
major. Postsecondary credentials with high market value can be found at all levels,
but what individuals study influences their initial earnings potential. While higher
earnings are not the only benefit of postsecondary education, with students assuming
a larger share of educational costs in recent years, this piece of the decision-making
process is probably of greater interest to students and families than ever before.
High school
Some college
Less than high school
Bachelor's degree or higher 0%
5%
10%
15%
20%
25%
30%
35%
19
94
19
95
19
96
19
97
19
98
19
99
20
00
20
01
20
02
20
03
20
04
20
05
20
06
20
07
20
08
20
09
20
10
20
11
20
12
20
13
20
14
20
15
Un
de
rem
plo
yme
nt
rate
Note: Shaded areas denote recessions. Definition: Underemployment is measured to correspond to the Bureau of Labor Statistics' U-6 measure as "total unemployed, plus all persons marginally attached to the labor force, plus total employed part time for economic reasons, as a percent of the civilian labor force plus all persons marginally attached to the labor force." Underemployment is seasonally adjusted. Source: EPI analysis of Bureau of Labor Statistics basic CPS monthly microdata
What is Postsecondary Education?
Educational options following successful graduation from high school
(or high school equivalency) include, but are not limited to:
certificate program, degree program, military training or
apprenticeship program.

14
20k
•$23k Early Childhood Education Cert.
•$26k Nursing Aide Certificate
30k
•$35k Automotive Tech. Certificate
•$37k Liberal Arts AA
•$39k English BA
40k
•$43k Biology BS
•$47k Welding AAS
50k
•$56k Business Administration BS
•$59k Registered Nursing AAS
60k
•$64k Construction Management BS
•$69 Mechanical Engineering BS
70k
•$74k Fire Science AAS
•$78k Computer Science BS
Figure 10: What You Study Matters: Median Earnings 5 Years Following Graduation
Source: Colorado Department of Higher Education
More than just preparation for earnings potential, furthering one’s education provides
benefits in other life skills and fulfillment. Recent studies have explored the
relationship between certain positive experiences during college and subsequent
success in the work environment. Students have the opportunity to interact with
educators who make them excited about learning and serve as mentors, and gain the
skills to garner positive social and emotional well-being throughout their lives.
Research shows that if graduates received emotional support, mentorship and
participated in experiential learning opportunities while in college, their odds of being
engaged at work are significantly higher (Gallup-Purdue, 2015).
$82,467
$62,429
$46,930
$49,694
$40,513
$36,920
$44,070
$39,391

15
Figure 11: Important Factors Influencing College Graduates’ Later Engagement at Work and Well-Being
Source: Gallup-Purdue, 2015
As already noted, apprenticeships are valuable postsecondary training opportunities, offering a pathway to a profession integrating experiential, on-the-job training with classroom instruction rather than relying solely on an academic education and/or examination. Colorado has initiatives underway and is increasing apprenticeship opportunities, though misperceptions still exist—for example, that they are never paid or that they preclude one from pursuing a college degree. From an economic standpoint, countries that have abundant apprenticeship training opportunities also have lower youth unemployment rates (Bilem, Petanovitsch & Schmid, 2015).
Apprenticeship systems benefit both apprentice and employer. They allow employers to train a skilled labor supply and to vet candidates as they are being trained toward full employment, increasing productivity and reducing recruiting costs. The benefits for workers are also notable, as the U.S. Department of Labor (2013) reports that the average annual wage for apprenticeship completers was $50,000 in 2011. In Great Britain, apprenticeship completers earn an average weekly wage 10 percent higher than that of peers and are more likely to be employed (Centre for Economics and Business Research, 2013).
64%
66%
23%
23%
Gallup-Purdue Index National Average
Colorado college graduates
“I had at least one professor at (College/University name) who made me excited about learning.”
Strongly Agree Agree
22%
25%
20%
23%
Gallup-Purdue Index National Average
Colorado college graduates
“While attending (College/University name), I had a mentor who encouraged me to pursue my goals and dreams.”
Strongly Agree Agree
30%
27%
18%
23%
Gallup-Purdue Index National Average
Colorado college graduates
“While attending (College/University name), I had an internship or job that allowed me to apply what I was learning in the classroom.”
Strongly Agree Agree

16
TOP JOBS IN COLORADO
WHAT IS A TOP JOB?
This report uses labor market data from Colorado’s Office of Labor Market Information at the
Colorado Department of Labor and Employment to identify jobs that meet three criteria:
projected high annual openings, above average growth rates and offer a living wage. The
jobs in this report are categorized into two earnings tiers, as we know there are many
essential jobs that may not typically pay a higher wage, but are in high demand and/or could
lead to a higher paying in-demand job.
The first tier includes jobs that have median earnings at or above a living wage for
a family with two adults (one working) and one child ($22.90/hour).
The second tier adds in jobs that meet a lower living wage benchmark for an
individual (median earnings of $11.33/hour).
This report recognizes that there are jobs that do not exist today that will be in high demand
in the future. Overall, these top jobs represent about 36 percent of all annual job openings in
Colorado.
TOP JOBS BY OCCUPATION GROUP
Please see this report’s Appendix for a complete list of occupations.
Table 3: Tier 1 Occupation Examples
Engineering Business & Finance
Civil Engineers Mechanical Engineers Computer Hardware Engineers Electrical Engineers
Accountants and Auditors Market Research Analysts/Marketing Specialists Cost Estimators Training and Development Specialists
Healthcare Practitioners & Technical Information Technology (IT)
Registered Nurses Pharmacists Physician Assistants Dental Hygienists
Software Developers Computer User Support Specialists Computer Systems Analysts Network/Computer Systems Administrators
Table 4: Tier 2 Occupation Examples
Skilled Trades Office & Administrative Support
Electricians Construction Equipment Operators Plumbers, Pipefitters, Steamfitters Carpenters
Customer Service Representatives Receptionists/Information Clerks Medical Secretaries Billing and Posting Clerks/Machine Operators
Healthcare Support Education, Social Services
Nursing Assistants (CNA) Home Health Aides Medical Assistants Licensed Practical Nurses
Teacher Assistants Preschool Teachers Education, Guidance and Vocational Counselors Mental Health Counselors

17
Much like recent years, the higher paying tier 1 annual job openings are largely concentrated in healthcare practitioners and technical, business and finance, IT and engineering occupations. Tier 2 job openings are largely concentrated in construction, office and administrative support, healthcare support and education occupations. Of the 79 occupations on this list, 65 carried over from the previous year (for more information on the specific occupations that did not carry over from last year due to changes in projected growth rates and/or annual openings, please reference this report’s Appendix).
Figure 12: Tier 1 Top Jobs – Share of Projected Job Openings by Occupation Cluster
Figure 13: Tier 2 Top Jobs - Share of Projected Job Openings by Occupation Cluster
509 (2%)
581 (3%)
667 (3%)
902 (4%)
925 (4%)
1,085 (5%)
1,465 (7%)
1,789 (8%)
3,925 (18%)
4,565 (20%)
5,931 (27%)
Other
Life, Physical & Social Science
Education, Training & Library
Installation, Maintenance & Repair
Legal
Construction Trades
Management
Architecture & Engineering
Computer & Mathematical
Business & Financial Operations
Healthcare Practitioners & Technical
Share of annual job openings for jobs that show high growth (>2.4%
annually), high openings (>40 annually) and pay a living wage for a family of 3 with 1 working adult
($22.90/hr).
559 (2%)
662 (3%)
911 (4%)
984 (4%)
1,308 (6%)
1,444 (6%)
1,526 (7%)
1,905 (8%)
3,660 (16%)
4,408 (20%)
5,202 (23%)
Management
Production
Other
Food Preparation & Serving
Personal Care and Service
Healthcare Practitioners & Technical
Community & Social Services
Education, Training & Library
Healthcare Support
Office & Administrative Support
Construction Trades
Share of annual job openings for jobs that
show high growth (>2.4% annually), high openings (>40 annually) and pay above a living wage for
an individual ($11.33/hr) and below $22.90/hr.

18
STEM in Top Jobs (Brookings STEM Definition)
75% of tier 1 job openings are considered STEM
12% of tier 2 job openings are considered STEM
44% of all top job openings are considered STEM
Compare that to…of all Colorado job openings, about 23% are STEM.
Where are Most of the STEM Top Jobs?
Healthcare Practitioners & Technical Information Technology (IT)
Finance Construction Trades
Engineering
Figure 14: All Top Jobs - Share of Projected Job Openings by Occupation Cluster
TOP JOBS BY EDUCATION LEVEL
In-demand jobs that show high growth and pay above a living wage to support a family of
three overwhelmingly require formal education or training beyond high school for entry into
the field. When measured by job openings, 97 percent of jobs on the tier 1 list typically
demand some level of formal postsecondary education/training, ranging from formal
employer-sponsored training and coursework (that usually lead to industry certification) to
graduate-level degrees. Seventeen percent of these job openings are for middle skill jobs—a
job that typically requires additional formal education or training after a high school diploma,
but less than a bachelor’s degree—in fields like IT, healthcare and the skilled trades. This
analysis relies on the Bureau of Labor Statistics’ definition of typical entry education
requirements for each occupation; certainly workers within an occupation embody a range of
education and training levels, and occupational requirements can also shift due to changes in
complexity, perception or licensure regulation, for example.
47 76 175
488 (1%) 643 (1%) 662 (1%)
925 (2%) 984 (2%)
1,116 (2%) 1,308 (3%)
1,702 (4%) 1,846 (4%)
2,024 (5%) 2,572 (6%)
3,785 (8%) 3,925 (9%)
4,408 (10%) 4,565 (10%)
6,287 (14%) 7,375 (16%)
Farming, Fishing & ForestryProtective Service
Transportation & Material MovingDesign, Media & Communication
Life, Physical & Social ScienceProduction
LegalFood Preparation & Serving
Installation, Maintenance & RepairPersonal Care & Service
Community & Social ServicesArchitecture & Engineering
ManagementEducation, Training & Library
Healthcare SupportComputer & Mathematical
Office & Administrative SupportBusiness & Financial Operations
Construction TradesHealthcare Practitioners & Technical
Share of annual job openings for jobs that show
high growth (>2.4% annually), high openings (>40 annually) and pay
above a living wage for an individual ($11.33/hr).
19
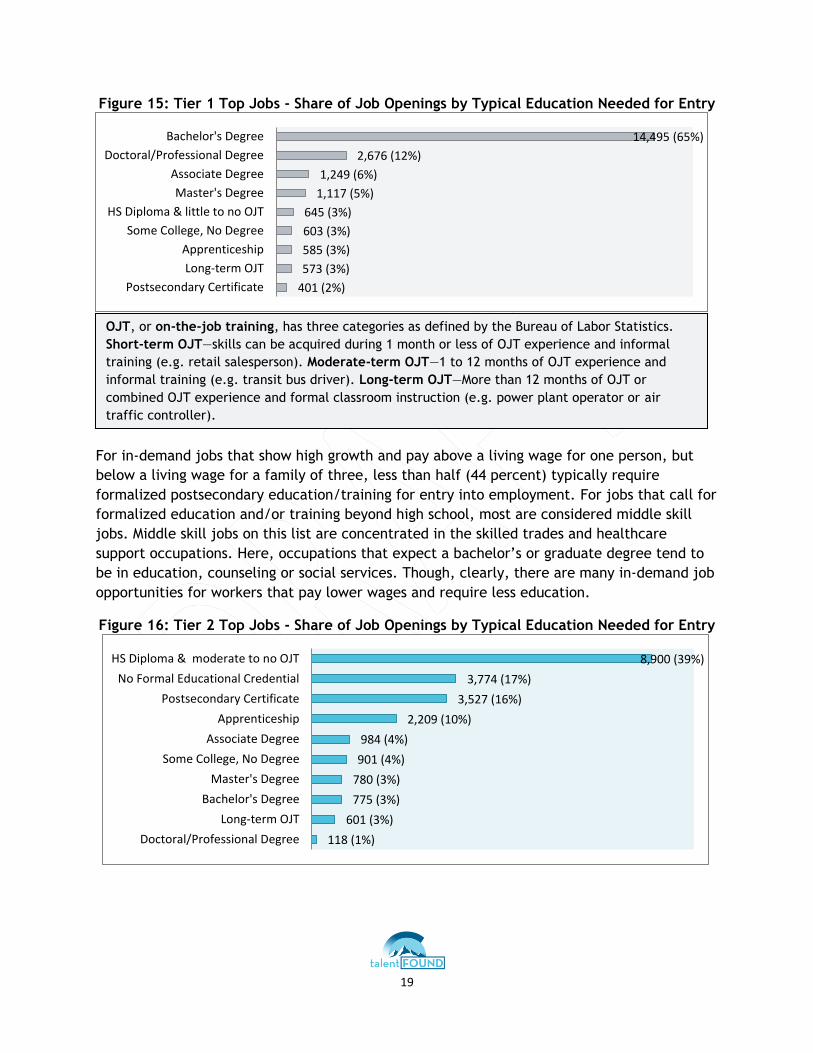
Figure 15: Tier 1 Top Jobs - Share of Job Openings by Typical Education Needed for Entry
For in-demand jobs that show high growth and pay above a living wage for one person, but
below a living wage for a family of three, less than half (44 percent) typically require
formalized postsecondary education/training for entry into employment. For jobs that call for
formalized education and/or training beyond high school, most are considered middle skill
jobs. Middle skill jobs on this list are concentrated in the skilled trades and healthcare
support occupations. Here, occupations that expect a bachelor’s or graduate degree tend to
be in education, counseling or social services. Though, clearly, there are many in-demand job
opportunities for workers that pay lower wages and require less education.
Figure 16: Tier 2 Top Jobs - Share of Job Openings by Typical Education Needed for Entry
401 (2%)
573 (3%)
585 (3%)
603 (3%)
645 (3%)
1,117 (5%)
1,249 (6%)
2,676 (12%)
14,495 (65%)
Postsecondary Certificate
Long-term OJT
Apprenticeship
Some College, No Degree
HS Diploma & little to no OJT
Master's Degree
Associate Degree
Doctoral/Professional Degree
Bachelor's Degree
118 (1%)
601 (3%)
775 (3%)
780 (3%)
901 (4%)
984 (4%)
2,209 (10%)
3,527 (16%)
3,774 (17%)
8,900 (39%)
Doctoral/Professional Degree
Long-term OJT
Bachelor's Degree
Master's Degree
Some College, No Degree
Associate Degree
Apprenticeship
Postsecondary Certificate
No Formal Educational Credential
HS Diploma & moderate to no OJT
OJT, or on-the-job training, has three categories as defined by the Bureau of Labor Statistics.
Short-term OJT—skills can be acquired during 1 month or less of OJT experience and informal
training (e.g. retail salesperson). Moderate-term OJT—1 to 12 months of OJT experience and
informal training (e.g. transit bus driver). Long-term OJT—More than 12 months of OJT or
combined OJT experience and formal classroom instruction (e.g. power plant operator or air
traffic controller).

20
Skillful, an online job seeker platform, is
currently developing an online tool that employers
can use to help identify where there may be gender bias in a job
posting that dissuades a wider range of qualified
applicants from applying.
Figure 17: Top Jobs - Share of Job Openings by Typical Education Needed for Entry
Some industries may be missing out on talent
opportunities for jobs where certain demographic
groups tend to be underrepresented. With nearly half of
our workforce being female and a growing minority
population, we have multiple talent sources to further
nurture and tap into. Ultimately, all people should have
the opportunity to get on a good career path, but some
fields may benefit by implementing intentional
recruitment strategies to fulfill talent needs.
Additional supply (postsecondary credential
completions)-demand (projected job openings) analysis
is planned. There is also opportunity to further examine top jobs, the jobs that lead to top
jobs and the competencies needed to succeed in these occupations.
NURTURING TALENT FOR TOP JOBS
Legislation has been enacted in recent years to better link education with workforce demand.
HB 16-1289 Career Development Success Pilot Program
The 2016 legislation (HB 16-1289) will help increase the number of high school graduates
prepared for high demand fields or pathways toward such fields. The new law provides for
school districts to receive incentives based on the number of students who complete
qualifying career and technical education programs such as industry credential programs or
pre-apprenticeships that are aligned with high demand, high growth occupations. A list of
1,174 (3%)
1,504 (3%)
1,897 (4%)
2,233 (5%)
2,794 (6%)
2,794 (6%)
3,774 (8%)
3,928 (9%)
9,545 (21%)
15,270 (34%)
Long-term OJT
Some College, No Degree
Master's Degree
Associate Degree
Doctoral/Professional Degree
Apprenticeship
No Formal Educational Credential
Postsecondary Certificate
HS Diploma and moderate to no OJT
Bachelor's Degree
70 percent of job openings across both tiers of top jobs typically require
some level of formalized postsecondary education or training.
21
approved programs was informed by the high growth, high demand occupations that this
report analyzes, and can be found on the Colorado Workforce Development Council’s website.
Please see this report’s Appendix for additional information regarding program requirements.
HB 15-1170 Postsecondary and Workforce Readiness
A 2015 bill (HB 15-1170) created a statewide postsecondary and workforce readiness (PWR)
position, filled in December 2015, is shared between the Colorado Workforce Development
Council and the Colorado Department of Education. The PWR coordinator works to support
and leverage sector partnerships, career pathways and work-based learning as key strategies
to improve postsecondary attainment by Coloradans and ensure education programs are
aligned with the needs of the labor market. The Departments of Education and Higher
Education have collaborated to update the definition of postsecondary and workforce
readiness. The PWR coordinator is tasked with supporting the implementation of the updated
definition and accompanying PWR framework. A summary of initial accomplishments of the
PWR coordinator are provided in the appendix.
IN-DEMAND SKILLS
Policymakers, educators, students and parents are seeking to better understand in-demand,
employer-sought skills. A concrete answer is challenging to deliver, as occupations require a
wide array of technical skills, and even the same occupation across different industries can
require certain areas of specialization that broad assessments do not adequately depict. And
that does not consider how quickly skills and occupations can change in our fast paced world.
This section uses current data resources to present trends in skills that Colorado employers
value today.
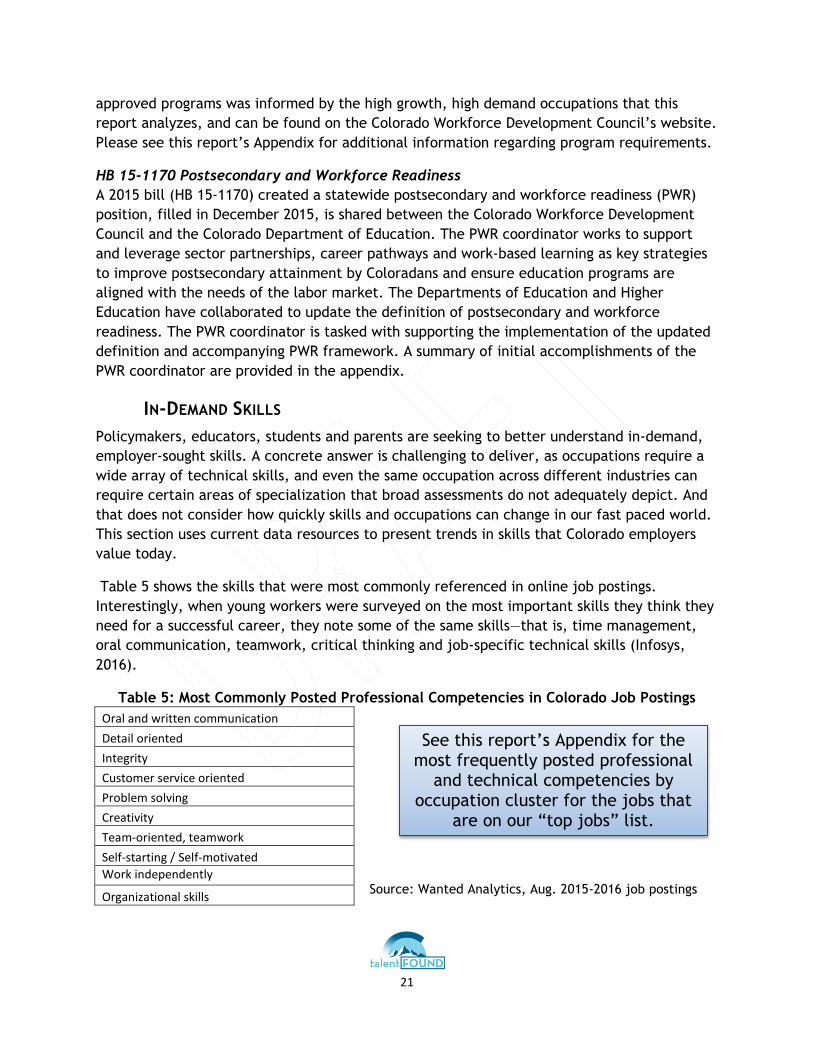
Table 5 shows the skills that were most commonly referenced in online job postings.
Interestingly, when young workers were surveyed on the most important skills they think they
need for a successful career, they note some of the same skills—that is, time management,
oral communication, teamwork, critical thinking and job-specific technical skills (Infosys,
2016).
Table 5: Most Commonly Posted Professional Competencies in Colorado Job Postings
Oral and written communication
Detail oriented
Integrity
Customer service oriented
Problem solving
Creativity
Team-oriented, teamwork
Self-starting / Self-motivated
Work independently
Organizational skills
See this report’s Appendix for the most frequently posted professional
and technical competencies by occupation cluster for the jobs that
are on our “top jobs” list.
Source: Wanted Analytics, Aug. 2015-2016 job postings

22
It is incredibly important for a student or jobseeker to learn how to articulate their skills through examples of past experiences or
activities. Being able to self-advocate is critical to acing a job
interview.
Globally, cognitive abilities such as cognitive flexibility, creativity, logical
reasoning, problem sensitivity, mathematical reasoning and visualization
are becoming increasingly important across all industries, and require time
and quality programming to develop (WEF, 2016). Colorado in particular
has high levels of jobs demanding non-routine cognitive jobs (OSPB, 2014).
Postsecondary and Workforce Readiness is: “Colorado high school graduates demonstrate the knowledge and skills
(competencies) needed to succeed in postsecondary settings and to advance in career pathways as lifelong learners and contributing citizens.”
Research has found that certain professional competencies may be more effectively acquired
through work-based learning opportunities. Work-based learning shows a comparative
advantage in developing skills such as trustworthiness, teamwork and reliability. School-based
learning shows a comparative advantage in developing analytical thinking and the joy of
learning (Bolli and Renold, 2015). Experiential academic courses also have the potential to
increase collaborative skills, self-confidence and creativity, although participants must also
have a level of openness to new experiences and reflection in order to experience benefits
(Victor, 2013).
Ensuring students are prepared and have the
in-demand skills to enter the workforce is an
essential strategy to meeting needs of
employers in Colorado. At the secondary level,
the goal is for all students to understand and
articulate their individual skillset, how they
relate to potential careers and jobs, and
graduate from high school with these in-
demand skills. Colorado industry representatives are clear that students who graduate from
high school and seek to work in Colorado need in-demand skills that meet business, industry
and higher education standards. Aligned high school graduation expectations are intended to
be a roadmap to help students and their families plan for success after high school by
demonstrating their knowledge, skills and abilities to enter the workforce, military or higher
education without significant training or remediation.
Obviously, graduating from high school with the competencies needed for future success is
critical for all students. A discussion among statewide participants from business and
industry, education, non-profit organizations and government sectors developed a description
of Postsecondary and Workforce Readiness (PWR) in Colorado that was approved by both the
State Board of Education and the Commission on Higher Education. The work group also
identified core skills that are necessary to successfully enter the workforce or educational

23
opportunities beyond high school. The group’s findings align well with skills that most
frequently appear in real-time job postings—each of the top ten skills listed in job postings
can be found in the table below.
Table 6: Essential Skills Needed for Workforce or Educational Opportunities beyond High School Defined by 2015 Workgroup
Entrepreneurial Personal Civic/Interpersonal Professional
Critical thinking and problem solving
Initiative and self-direction
Core academic foundation
Time management
Creativity and innovation Personal responsibility and self-management
Collaboration and teamwork
Career literacy
Inquiry and analysis Adaptability and flexibility
Communication Grit and resilience
Risk taking Personal awareness Global and cultural awareness
Work ethic; dependable and reliable
Learn independently Ethics and integrity Self-advocacy
Perseverance
PUTTING POLICY INTO PRACTICE IN THE COLORADO TALENT
DEVELOPMENT SYSTEM
It is important to continue establishing efficient and effective means of developing skilled
talent so that employers can find the quality workforce they need to be competitive. While
this report focuses on solutions for Colorado, this issue extends globally, as evidenced by the
World Economic Forum’s recent (2016) emphasis on the need for cross-industry and public-
private collaboration to address talent issues. Creating systemic change requires public-
private partnership to establish functional feedback loops between industry and education,
and using resources wisely to get the desired results. This section provides an overview of
various programs and initiatives supporting talent development currently underway in
Colorado.
SECTOR STRATEGIES: A KEY TO INDUSTRY-LED TALENT SOLUTIONS IN
COLORADO
Colorado is a national innovator in sector strategies—with the launch of our next generation
approach to sector partnerships in 2013, Colorado helped to elevate the value of this strategy
nationally. In 2014, the federal Workforce Innovation and Opportunity Act (WIOA) identified
sector strategies and industry-led career pathways as key strategies that states and local
areas must implement for workforce development. Since then, Colorado has been recognized
and used as a model for other states, by national experts and the Employment and Training
Administration. A recent example is an action guide published by the ETA in June of 2016.

24
Sector Partnerships in Colorado
A sector partnership is an industry-specific regional partnership that is led by business, in
collaboration with economic development, education and workforce development, and
formed to address specific priorities and needs as identified by business.
Sector partnerships are benefiting Coloradans and Colorado businesses. The annual Key
Performance Indicator survey measures the impact of partnerships across the state on job
seekers and students as a result of better aligned community partners from workforce,
education and economic development, as well as the impact of the partnership on businesses.
This section highlights the successes of partnerships across Colorado and their goals for the
future, with additional information to be released in the coming months.
Colorado has 21 Active and Emerging Sector Partnerships that engage over 450 businesses.
These partnerships, representing five major industries, include the following:
11 health & wellness sector partnerships (2*)
7 advanced manufacturing sector partnerships (1*)
1 tourism & outdoor recreation sector partnership*
1 value-added agriculture sector partnership*
1 tree care (arborist) sector partnership*
1 statewide sector strategy in Information Technology (IT)
*Denotes the six sector partnerships that launched in the last 12 months, resulting in at least one sector partnership in every region of the state.
What are the benefits from Sector Partnerships?
Colorado sector partnerships enable community partners from workforce, education and
economic development to better meet the talent development needs of businesses.
Ultimately, the systems and programs involved in Colorado sector partnerships will benefit
students and jobseekers. Over the past year, Colorado sector partnerships reported the
following outcomes1:
1 Key Performance Indicator survey completed in August, 2016. Based on responses from 21 active or emerging
sector partnerships.

25
86% Implemented joint or shared projects across community support partners/ organizations
86% Experienced joint or shared decision-making across community support partners (education, workforce development, economic development, etc.)
81% Increased collaboration across community support and partner organizations on talent development
81% Increased participation by businesses in target industry and region
81% Shared data across community support partners/organizations
76% Increased participation in their partnership from community support partners in education (including k-12 and postsecondary), training, and workforce development
71% Increased student and/or jobseeker awareness of education and training programs
67% Enhanced existing or developed new training and/or education program(s)
62% Increased program alignment across secondary, postsecondary, and/or workforce programming
The examples below illustrate how sector partnerships address employer needs in critical occupations.
The Southern Colorado Healthcare Sector Partnership is addressing employers’ high demand for
nurses. Healthcare employers have increased financial and in-kind investments in two regional
nursing programs (CSU-Pueblo and Pueblo Community College) resulting in more students entering
and completing nursing programs.
The Upper Arkansas Health and Wellness Sector Partnership is working with the two largest
hospitals in their region to establish training programs within the hospitals for CNAs and MAs, in
order to meet the high demand for staff trained with the right skills.
The Southeast Colorado Manufacturing Partnership is raising awareness about manufacturing
careers with youth, in order to create the talent pipeline needed for the future of manufacturing.
They send over 800 6th, 7th and 8th graders on tours of manufacturing facilities every year.
Several manufacturing partnerships have stated specific goals around growing the number of
businesses involved in the partnership and developing additional leaders.
Manufacturers from CAMA South write monthly articles for the local business journal to increase
awareness about the industry and partnership.

26
Looking forward
We expect these successful partnerships to continue their work over the next year. Some of
the activity that we will follow over the next year includes:
The Southern Colorado Manufacturing Group (Pueblo) has a goal of increasing
enrollment/participation in the middle and high school manufacturing programs in
Pueblo City Schools and District 70 by a minimum of 25 percent.
Through support of the Colorado Opportunity Scholarship Initiative (COSI), the Region
5 Sector Health and Wellness Partnership is focused on filling 89 unfilled nurse,
nurse aides and medical assistant positions in their four county region. They hope to
raise $91,000 by December 2016 and train 40 people in two years.
The Southern Colorado Healthcare Partnership will develop baseline measures to
The NoCO Manufacturing Partnership’s Talent Committee is focused on developing the region’s
manufacturing workforce through aligning workforce, training and education resources with the
needs of the region’s manufacturing industry. The Talent Committee’s business leaders have
partnered with ten high schools and one middle school across four different school districts, and
two Workforce Investment Boards to:
Inform the development of a regional career pathway map and career pathway action plan,
informing curricular changes and articulation agreements.
Create and host a joint Career and Technical Education (CTE) advisory board for local
community college CTE programs and school districts, in alignment with the Workforce
Investment Boards.
Engage 847 students in hands on learning experiences in 49 different local manufacturing
facilities over a year and a half.
What businesses are saying about sector partnerships… “This is a collaborative group that gets things done in our city and the space of the sector team provides a neutral environment that allows for both community health and business partnerships.” “I truly believe that I can get expert advice on a wide range of business issues from mentors that care about my success.” “Networking is an added benefit! With networking comes an increase in ideas and others know what your struggles are currently. Sometimes this leads to a (new business) partnership.”
For businesses that received benefit from participating in a sector partnership… 42% formed new or enhanced joint ventures 36% implemented new recruitment practices 35% found support in finding employees with the skills and experiences their business needs

27
track the impact they are having on increasing the number of nursing graduates,
increasing the number of nursing and allied health graduates that will live and work in
Southern Colorado, and increasing the retention of nursing staff in facilities across
Southern Colorado.
Statewide Industry Associations are Critical Collaborators in Developing Talent
Across Colorado, industry associations are key leaders in developing the Colorado workforce
to meet the needs of industry. Highlights of association activities include:
The Associated General Contractors of Colorado (AGC) has utilized the Innovative Industries
Internship Grant to expand the number of internships within the construction industry. These
internships are helping to promote a quality training program for a state industry that is
anticipated to need 30,000 new employees in the next seven years.
The Colorado Technology Association's (CTA) Talent Council leads a Talent Agenda to
support workforce needs of the technology industry. Programs in the CTA agenda address a
spectrum of populations in the workforce, from youth to young adults to those changing
careers. This past year CTA’s emphasis was on internships. CTA also partnered with
Markle/LinkedIn to define and publish competencies for ten IT occupation clusters.
Underpinning CTA’s work is their strong commitment to advancing STEM—especially computer
science—inn the Colorado K-12 education system.
Frequent, early career exploration prepares students for success. This realization spurred the
Colorado Advanced Manufacturing Alliance (CAMA) and Gates Corporation to develop
Empowering Creators, an event in which teams of 8th graders compete for a space agency
contract by designing and building the most capable Mars rover prototype.
The Colorado Bioscience Institute provides education, workforce and career development for
life science professionals, companies, students and educators in Colorado. The Institute
operates across the programmatic and educational pipeline, from K-12 to higher education to
workforce training. Through research experiences for teachers, mentorship programs,
internships, career fairs and leadership training, they encourage businesses relying on a
strong talent pipeline to not simply be passive consumers, but instead become active
participants in education and workforce initiatives tied to real world solutions. Internships
allow students to gain an understanding of what it means to be a life science professional in a
working environment and the Innovative Industries Internship Program fits in with the
Institute's goal of serving the life science workforce pipeline.
Building Industry-Driven Career Pathways Systems in Colorado
In Colorado, industry-driven career pathway systems ensure that education, training, and
workforce systems stay deeply attuned and responsive to the needs of the labor market,
preparing students and workers with the skills and credentials they need for jobs and careers.
Colorado has been developing career pathways, both in direct response to legislation (HB 15-

28
A resource from Ascend at the Aspen Institute was released on September 26th entitled
"State Human Services Model: Colorado as a Case Study for
Policymakers"
1274—designating the creation of statewide industry-driven career pathways), and through
industry-led efforts and partnerships such as Skillful.
McGraw Hill’s recent study (2016) of college students finds that only 25 percent of students
are in majors with established career paths at their university. At the same time, most
college students are motivated by increased job opportunities (Eagan et al., 2016). More
structured and deliberate pathways will enable students to connect their education choices
with future careers.
In 2016, the CWDC coordinated the development of the first statewide career pathways maps
required by 2015 legislation. Information Technology (IT) was chosen as the first pathway due
to IT occupations being in high demand and typically paying good wages. Globally, strong
employment growth in IT positions across all industries—not just in the IT sector—is expected,
reinforcing the wide range of data and technological literacy demanded by today’s jobs (WEF,
2016).
Through the use of labor market data, employer engagement through regional Tech Talent
forums and cross-agency collaboration, a map of five main IT pathways is now sequenced and
posted online, while an interactive online version that further integrates data points such as
earnings and related training/educational programs currently in development. See this
report’s Appendix for additional information on the sequencing process and for additional IT
occupation and education data. Career pathways mapping efforts for in-demand healthcare
and construction/skilled trades occupations have begun.
TWO-GENERATION STRATEGIES
In April 2016, a Colorado Statewide Two-Generation Action Plan Work Group began working with Ascend at the Aspen Institute to develop a strategy for implementing the “two-generation approach” across sectors. The partners are seeking to embed this strategy, which takes into account the needs of parents/caregivers and children, in more public and private service programs. The Workgroup is currently developing two resources. One document, the "Colorado Guide to 2Gen," will be shared throughout the state. It details the importance of the two-generation approach in Colorado and why two-generation matters to each of these sector groups, along with other information. A second resource will be a comprehensive Two-Generation Action Plan for Colorado. The Workgroup began by identifying existing two-generation activities across agencies, in counties and at non-profit organizations; the Group is now focused on common program and system outcomes that will be the foundation for a broader Two-Generation Action Plan. Recently, Colorado applied to be a participant in the National Governors Association (NGA)/Center for Law and Social Policy (CLASP) Two-Generation State Policy Network,

29
Parents and Children Thriving Together (PACTT). Participation in this network will help drive the two-generation work forward.
VETERAN STRATEGIES
The Colorado Department of Labor and Employment (CDLE) is the federal grant recipient for
programs that fund career services for job seekers. Veterans and their family members
receive a full array of employment services through the 61 state and county operated
Workforce Centers and satellite offices.
In the Workforce Centers during Program Year 2015:
18,161 veterans received services
58 percent of veterans entered employment following services
82 percent of those veterans were still working nine months later
Services for Veterans with Significant Barriers to Employment
The Jobs for Veterans State Grant provides funding for 29 Veteran Employment Specialists and
nine Veteran Employment Representatives. CDLE strategically assigns the staff to locally
operated workforce centers as part of their integrated employment and training operations
and inside community partner offices throughout the state where veterans are likely to seek
services.
Veteran Employment Specialists provide intensive employment services to veterans with
significant barriers to employment. They provide specialized services such as individualized
job search assistance and targeted career management. Veteran Employment Representatives
provide services that increase the capacity for the workforce system to serve veterans,
increase veteran employment, and ensure veterans receive priority of service for all
employment and training services in the workforce system. They work directly with businesses
to assist them with veteran recruiting and hiring, through personal visits to the business,
employer panels, customized workshops, job fairs, and hiring events specifically for veterans
on behalf of the business.
These highly trained subject matter experts also provide assistance to other agencies and
organizations that provide employment services or have employment programs for veterans.
In the absence of funding for supportive services or training, Veteran Employment Specialists
are experts at identifying and leveraging the resources of partner programs, local community
service organizations and philanthropic businesses. They are also veterans themselves,
personally understanding the challenges that veterans face.
Through the Colorado Veteran Employment Program during Program Year 2015:
1,665 veterans with significant barriers to employment received services
64 percent of veterans with barriers to employment entered employment following services
81 percent of those veterans were still working 9 months later

30
Hilton Honors (HHonors) Military Rewards Program
In Partnership with the National Association of State Workforce Agencies and CDLE, Hilton
donates 100,000 Hilton Honors points to eligible veterans and transitioning service members
to support their transition to civilian employment. The points support hotel stays related to
job search activities.
During Program Year 2015:
34 veterans were served, saving $5,059 in hotel costs
24 veterans used the program for interviews
10 veterans used the program for training
14 veterans were hired at an average salary of $51,026 per year
HB 16-1197 Military Veteran Occupational Credentials Implementation
The Division of Professions and Occupations (DPO) at the Department of Regulatory Agencies is moving forward with implementing 2016 legislation (HB 16-1197) that directs DPO to evaluate and provide appropriate credit towards licensing and certification for military experience. Under the new law, DPO will be better able to evaluate and award credit for military experience toward a license, thus helping active military personnel, veterans and their families transition into civilian life by providing opportunities for post-military employment sought by military professionals. Activities to be conducted include evaluation of which military training meets state requirements, identification of reciprocity mechanisms with other states, determination of relevant occupational exams, documentation of pathways available to a veteran to obtain authorization to practice an occupation, and consultation with postsecondary educational institutions to cover educational gaps or refresher courses for lapsed credentials.
STRATEGIES FOR COLORADANS WITH DISABILITIES
While many Coloradans with disabilities are contributing their talents to the Colorado workforce, there is significant potential to increase labor force participation and career advancement within this group. Our state is preparing to achieve this by structuring and aligning our programs to maximize opportunity for students and job seekers with disabilities. Because the Colorado Division of Vocational Rehabilitation is now part of the Colorado Department of Labor and Employment and is also a core partner per the WIOA, Coloradans with disabilities will benefit from the breadth and depth of subject matter expertise from more partner programs. The additional resources and opportunities each partner offers increases the likelihood that people with disabilities will be empowered to craft a way to work. Increased workforce participation is a preliminary step in gaining the skills to compete for higher wages. The term “disability” refers to a wide array of human experience. As we highlight strategies for increasing the ability of all Coloradans to contribute their talents to the talent pool, it is important to remember that people in every group already specified here may also experience disabilities. For example, as we continue expand career pathways to align education, training and work-based learning, our approach must consider the level of

31
individualization required to include Coloradans with disabilities in benefiting from services designed for a broader population. Our policy and statutory barriers or perceived barriers to work-based learning must factor in the needs and experiences of students with additional challenges and focus on their abilities and opportunities. Although some individuals with disabilities have competitive credentials and relevant work experience, others lack appropriate skills and/or credentials in educational settings that are needed to acquire additional skills and credentials that would allow them to enter and participate more fully in the workforce. Alternative ways of demonstrating skill, such as through work-based training and other approaches to experiential learning, may support people with disabilities to increase labor force participation, earnings, and opportunities for professional growth.
IMPLEMENTING SYSTEMIC CHANGE IN EXPERIENTIAL LEARNING OPPORTUNITIES
As referenced earlier, a disconnect often exists between formal education and job
expectations. Experiential learning opportunities (including internships, apprenticeships and
other work-based learning initiatives) have the power to close this and are an important
component of career pathway systems. But successful experiential learning requires
collaboration between education and the business sector to make such meaningful
experiential education opportunities possible on a large scale.
Colorado has begun implementing several strategies in this area, through initiatives such as
the Governor-appointed Business Experiential Learning (BEL) Commission, expansion of adult
apprenticeships, the Innovative Industries paid internship program, HIRE Colorado, and many
local and regional efforts such as Denver’s Opportunity Youth Initiative and Mesa School
District 51’s Project Based Learning program. Most recently, in fall 2016, Colorado announced
CareerWise Colorado, a youth apprenticeship system focused on developing flexible, multi-
skilled apprenticeships that open multiple career pathways for students, instead of a single
occupation in a single industry. This initiative is also expected to encourage more out-of-state
businesses to locate in Colorado to take advantage of skillsets and training opportunities for
local talent. Additional information highlighting a number of statewide initiatives
(CareerWise, Colorado STEM and Skillfull) can be found in the Appendix.
Colorado already has a network of apprenticeships, which presents an opportunity to continue expansion in high demand fields. It does not appear that an all-inclusive centralized state apprenticeship database resource exists, aside from the sources used for the figures presented below (therefore, other apprenticeships may exist that are not captured here).
Table 7: Apprenticeship Data
U.S. Dept. of Labor Registered Apprentices
Active Apprentices in Colorado Regulated by DORA
Colorado National
Electrical 10,621
Total Active Apprentices 5,222 448,000
Plumbing 7,893
Youth Apprentices (16-24 year olds) 26% 20%
*There may be duplication across active apprentices in DORA’s database and the U.S. DOL’s active Registered Apprentices
Female Apprentices 5% 6%
Hispanic Apprentices 25% 20%
Source: U.S. Dept. of Labor RAPIDS data and the Colorado Department of Regulatory Agencies

32
COLLABORATION ACROSS THE TALENT DEVELOPMENT NETWORK
Clearly, talent development in Colorado relies on key collaborators from across the public and
private sector. This report highlights a number of critical initiatives and partners that are part
of a complex system, and it can at times be difficult to understand how all of the components
fit together. While a simplification of this network, the visual below depicts where a number
of players fit together in the Colorado talent development ecosystem. Collectively, we move
the work forward to meet our overarching goal of statewide economic vitality.
Figure 18: The Colorado Talent Development Ecosystem Extends beyond Government
33
RECOMMENDATIONS
The Governor's Workforce and Education Cabinet workgroup is a subgroup of cabinet members and their key staff collaborating on workforce and education issues. This group, along with leadership from the Department of Education, jointly offers the following recommendations to address challenges, gaps and opportunities as identified in this report. Many of the recommendations reference work already in implementation or planning phases. Accomplishing this work through integrated and meaningful solutions will take time and intentionality; anyone interested in helping to move these recommendations forward is encouraged to contact [email protected] to learn more.
Priority: Close Attainment Gaps
Continue to support policies and services for populations with unique needs (including underserved minorities, veterans, long-term unemployed, ex-offenders, persons with disabilities) to ensure access to career pathways and meaningful employment.
Continue to support and expand concurrent enrollment as a means of increasing access to postsecondary education and shortening the time to degree.
Continue efforts to increase career awareness and intensive career exploration opportunities.
Continue to expand utilization of competency-based learning. Continue to support the work of the Colorado talent development network in
promoting work-based opportunities, including expansion of apprenticeships into non-traditional occupations such as banking, finance, IT and healthcare.
Promote apprenticeships as a good postsecondary pathway for Coloradans, by creating a strong foundation of youth apprenticeships that integrate secondary education, postsecondary education and work.
Seek innovative approaches to re-engaging adults who lack work-ready credentials to help them gain needed skills to more fully participate in the workforce. Support the work of Skillful and other similar adult-focused initiatives in this area.
Continue to utilize the Colorado STEM Roadmap to build a STEM-ready pipeline, by connecting learners with STEM experiences to further develop and increase STEM literacy.
Priority: Align Resources and Provide Access to Information
Embrace and engage with TalentFOUND—the Colorado talent development network communication strategy—to help businesses, students, job seekers and workers design their own unique path to success.
Continue efforts to redefine employer expectations and worker qualifications by skills and competencies rather than only by degrees and credentials.
Create a comprehensive state resource on non-traditional education pathways to improve student, parent, educator and job seeker understanding of various educational pathways to success.
Support initiatives that ease education/training transition points (leaks in the pipeline), including concurrent enrollment, career pathways, CareerWise Colorado and apprenticeships.
Improve data and information around the multiple education and training pathways one may pursue to inform better decision-making. Many transition points along the

34
education and workforce spectrum lack continuity of data that will allow for a more complete understanding of the current and future state of the Colorado talent pipeline.
Support the cross-agency 2-Gen approach, and focus on “two-generation approaches” that work with both parents/caretakers and children to improve education and work outcomes.
Priority: Increase Job Placement, Retention and Wage Growth
Create contextual work-based “earn and learn” opportunities, such as traditional and non-traditional apprenticeships, built on existing sector strategies. This includes the creation of a work-based learning unit to expand opportunities statewide.
Implement effective, coordinated strategies to assist businesses in recruiting, retaining and developing talent.
Support streamlined regulations of credentialing to result in a more rapid response to filling high demand occupations.
Pursue practices that encourage access to and participation of a broader talent pool in high demand fields (e.g. underrepresented workers such as women or minorities in certain fields).
Further examine top jobs, the jobs that lead to top jobs and the competencies needed to succeed in these occupations. Map the intersections of education and training pathways into these fields.
Priority: Continued Collaboration and Integrated Efforts
Through three publications of this report the agencies have demonstrated the value of collaborative work.
Continue to utilize the Colorado Workforce Development Council as the coordinator and convener of the talent development network.
Support the Governor’s Business Experiential Learning Commission to provide awareness, alignment and focus for work-based learning.
Continue to partner with Skillful, an initiative of the Markle Foundation, as a resource for competency based hiring and training, and with LinkedIn to create a work-based learning market-place on the Skillful platform.

35
REFERENCES
Abel, J. R. and Deitz, R. (2016). Underemployment in the early careers of college graduates following the Great Recession. National Bureau of Economic Research working paper no. 22654. Retrieved from: http://www.nber.org/papers/w22654 Abel, J. R., Deitz, R., and Su, Y. Are recent college graduates finding good jobs? Federal Reserve Bank of New York. Retrieved from: https://www.newyorkfed.org/medialibrary/media/research/current_issues/ci20-1.pdf Bilem, W., Petanovtisch, A and Schmid, K. (2015). Success factors for the Dual VET System. Ibw-Forschungsbericht, no. 177. Bollie, T. and Renold U. (2015). Comparative advantages of school and workplace environment in competence acquisition: Empirical evidence from a survey among professional tertiary education and training students in Switzerland. KOF Swiss Economic Institute. Centre for Economics and Business Research (2013). Productivity matters: The impact of apprenticeships on the UK economy. Retrieved from http://webarchive.nationalarchives.gov.uk/20141006151154/http://www.apprenticeships.org.uk/about-us/~/media/Documents/Productivity-Matters-Report-FINAL-March-2013.ashx Colorado Office of State Planning and Budgeting. (September 2014). The Colorado economic outlook.
Economic Policy Institute (2016). Retrieved from
http://www.stateofworkingamerica.org/charts/underemployment-education/
Eagan, K., Stolzenberg, E. B., Bates, A. K., Aragon, M. C., Suchard, M. R., & Rios-Aguilar, C. (2015). The American freshman: National norms fall 2015. Los Angeles: Higher Education Research Institute, UCLA. Retrieved from http://www.heri.ucla.edu/monographs/TheAmericanFreshman2015.pdf
Infosys. (2016). Amplifying human potential: Education and skills for the fourth industrial revolution. Retrieved
from http://www.experienceinfosys.com/humanpotential
JPMorgan Chase Institute (2016). Paychecks, paydays, and the online platform economy. Retrieved from
https://www.jpmorganchase.com/corporate/institute/document/jpmc-institute-volatility-2-report.pdf
Katz, L. F. and Krueger, A. B. (2016). The rise and nature of alternative work arrangements in the United States,
1995-2015. Retrieved from http://krueger.princeton.edu/sites/default/files/akrueger/files/katz_krueger_cws_-
_march_29_20165.pdf
McGraw-Hill. (2016). McGraw-Hill Education 2016 Workforce Readiness Survey. Retrieved from
http://www.multivu.com/players/English/7782351-mcgraw-hill-education-survey/
U.S. Census Bureau. (2015). American Community Survey 1-year estimates.
U.S. Dept. of Labor. (2013). FY 2013: Congressional budget justification Employment and Training Administration.
Retrieved from https://www.dol.gov/dol/budget/2013/PDF/CBJ-2013-v1-12.pdf
Victor, L. E. (2013). Making a lifelong impact on students through a place-based experiential approach to
academics. Curriculum & Teaching Dialogue, 15(2), 83-96.
World Economic Forum. (2016). The future of jobs: Employment, skills and workforce strategy for the forth
industrial revolution. Retrieved from http://www3.weforum.org/docs/WEF_Future_of_Jobs.pdf