Embed Size (px)
Citation preview

THE COLLEGE ALCOHOL SURVEY:The national longitudinal survey on
alcohol, tobacco, other drug and violence issues at institutions of higher education
1979 - 2012
David S. Anderson, Ph.D.George Mason University
and Angelo F. Gadaleto, Ph.D.West Chester University

THE COLLEGE ALCOHOL SURVEY1979 - 2012
Sample of 4-year colleges and universities
No external funding
Conducted every 3 years since 1979; 12 survey administrations
Respondents are chief student affairs officers
Response rate from 50% – 71%
Results available at www.caph.gmu.edu

POLICIES

4
1979 1982 1985 1988 1991 1994 1997 2000 2003 2006 2009 20120
102030405060708090
100
Alcohol is Allowed on CampusPe
rcen
tage
s of
Affi
rmati
ve R
espo
nses

5
1979 1982 1985 1988 1991 1994 1997 2000 2003 2006 2009 20120
102030405060708090
100
Alternative Beverage Required When Alcohol Is Served
Perc
enta
ges
ofA
ffirm
ative
Res
pons
es

6
1979 1982 1985 1988 1991 1994 1997 2000 2003 2006 2009 20120
102030405060708090
100
Food is Required When Alcohol is Served
Perc
enta
ges
ofA
ffirm
ative
Res
pons
es

7
1994 1997 2000 2003 2006 2009 20120
102030405060708090
100
Alcohol Sales On Campus
Location to Purchase Drink Server Training Required
Perc
enta
ges
ofAffi
rmati
ve R
espo
nses

8
1979 1982 1985 1988 1991 1994 1997 2000 2003 2006 2009 20120
102030405060708090
100
Event May Advertise Alcohol Availability Pe
rcen
tage
s of
Affi
rmati
ve R
espo
nses

9
1991 1994 1997 2000 2003 2006 2009 20120
10
20
30
40
50
60
70
80
90
100 Campus Policy for Drug Testing
Student-Athletes Staff Students Faculty
Perc
enta
ges
ofAffi
rmati
ve R
espo
nses

10
1982 1985 1988 1991 1994 1997 2000 2003 2006 2009 20120
10
20
30
40
50
60
70
80
90
100
Campus Media Allowing Alcohol Advertising
Campus Radio Student Newspaper Bulletin BoardsFliers in Dining Areas
Perc
enta
ges
ofAffi
rmati
ve R
espo
nses

11
1982 1985 1988 1991 1994 1997 2000 2003 2006 2009 20120
102030405060708090
100
Campus Policies on School Newspaper Advertising
Newspaper Advertising Permitted Brand Preference Ads ProhibitedPrice Special Ads Prohibited Happy Hours Prohibited
Perc
enta
ges
ofAffi
rmati
ve R
espo
nses

12
1988 1991 1994 1997 2000 2003 2006 2009 20120
10
20
30
40
50
60
70
80
90
100
Campus Policy on Sponsorship of Campus Events by the Alcoholic Beverage Industry
Policy Present Prohibits AdvertisingProhibits Promotions Prohibits Official SponsorshipProhibits Signs at Major Facilities
Perc
enta
ges
ofAffi
rmati
ve R
espo
nses

13
1994 1997 2000 2003 2006 2009 20120
10
20
30
40
50
60
70
80
90
100
Alcohol Prohibited Restricted AreasEfforts to prevent underage drinking Others
Institutional policies to limit alcohol consumption at tailgating events
Perc
enta
ges
ofAffi
rmati
ve R
espo
nses

14
Amnesty Policy 2012
Amnesty policy to promote reporting dangerous behavior0
10
20
30
40
50
60
70
80
90
100
Perc
enta
ges
ofAffi
rmati
ve R
espo
nses

DATA COLLECTION

16
Campus Survey Done On Alcohol Use
2012200920062003200019971994199119881985198219790
10
20
30
40
50
60
70
80
90
100
Student drinking behavior Student knowledge of drinkingStudent attitudes about drinking Student perceptions of alcohol
Perc
ent A
ffirm
ative
Res
pons
es

17
Campus Survey Done on Drug Use
2012200920062003200019971994199119880
10
20
30
40
50
60
70
80
90
100
Student perception of drugs Drug usage behavior of studentsStudent attitudes about drugs
Perc
ent A
ffirm
ative
Res
pons
es

18
Campus Survey Done on Tobacco Use
201220092006200320000
10
20
30
40
50
60
70
80
90
100
Tobacco use by student Student knowledge of studentsStudent perceptions of tobacco Student attitudes about tobacco
Perc
ent A
ffirm
ative
Res
pons
es

19
Survey Conducted on Student Health and Safety Topics
Abuse of prescription drugs
Knowledge of prescrip-tion drug abuse
Attitudes/beliefs about initiating interventions
with others
Violence on campus
Awareness of violence prevention on campus
0 10 20 30 40 50 60 70 80 90 100
80
61
60
73
13
Percent Affirmative Responses

20
Campus Survey Done on Faculty Engagement
20122009200620030
10
20
30
40
50
60
70
80
90
100
Faculty infusion of drug, alcohol, or tobacco in coursesFaculty knowledge of drug, alcohol, or tobacco policies and services
Perc
ent A
ffirm
ative
Res
pons
es

21
Alcohol Violations: Use of BAC and Judicial Charges for Off-Campus Behavior
2012200920060
102030405060708090
100
Judicial Charges for alcohol related behavior off campusHave methods to measure BAC in policy enforcementBAC records of students with alcohol violations
Perc
ent A
ffirm
ative
Res
pons
es

22
Reporting of Alcohol Related Violations
2006 2009 20120
102030405060708090
100
Campus recieves reports on alcohol related ER visits
Student security workers report violations
Perc
ent A
ffirm
ative
Res
pons
es

231988 1991 1994 1997 2000 2003 2006 2009 20120
10
20
30
40
50
60
70
80
90
100
Campus Data Collection on Use of False IDs to Purchase Alcohol
Perc
ent A
ffirm
ative
Res
pons
es

242006 2009 20120
10
20
30
40
50
60
70
80
90
100
Percent of Alcohol Related Infractions Involving Repeat Offenders
Perc
ent A
ffirm
ative
Res
pons
es

25
1988 1991 1994 1997 2000 2003 2006 2009 20120
10
20
30
40
50
60
70
80
90
100
Conducted Assessment of Drug and Alcohol Policies Related to Legal LiabilityPe
rcen
tage
s of
A
ffirm
ative
Res
pons
es

26
1994 1997 2000 2003 2006 2009 20120
10
20
30
40
50
60
70
80
90
100
Formal Assessment of Effectiveness of Drug and Alcohol Program
Perc
enta
ges
of
Affi
rmati
ve R
espo
nses

27
Strategies to Measure Effectiveness of Campus Efforts: 2012
Student Use/Abuse Survey
Quantitative Assessment (s-tandardized instrumentation)
Compare findings with external research
Qualitative assessment (focus groups, interviews)
Quantitative assessment (local instrumentation)
Comparing efforts using ex-ternal criteria
Campus Environmental Scan
Use of control groups
External evaluator
0 10 20 30 40 50 60 70 80 90 100
85
70
65
49
47
44
40
23
23
Percent Affirmative Responses


SCOPE OF PROBLEMS

30
Campus Property Damage
Campus Policy Violation
Residence Hall Damage
Violent Behavior
0 20 40 60 80 100
46
56
55
55
Alcohol's Involvement With Campus Behaviors: 2012
Mean Percentages

31
Health Center Contacts
Risk of Suicide
Emotional Difficulty
Physical Injury
Unsafe Sexual Practices
Acquaintance Rape
0 20 40 60 80 100
20
26
32
36
57
68
Alcohol's Involvement With Personal Behaviors: 2012
Mean Percentages

32
Student Attrition
Lack of Academic Success
Diminished Performance on Test or Project
Missed Classes
0 20 40 60 80 100
24
28
28
32
Alcohol's Involvement With Academic Issues: 2012
Mean Percentages

33
1985 1988 1991 1994 1997 2000 2003 2006 2009 20120
10
20
30
40
50
60
70
80
90
100Alcohol’s Involvement With Campus Behaviors
Physical Injury Violent BehaviorResidence Hall Damage Campus Property DamageViolation of Campus Policy
Mea
n Pe
rcen
tage
s

34
1985 1988 1991 1994 1997 2000 2003 2006 2009 20120
10
20
30
40
50
60
70
80
90
100
Alcohol's Involvement With Personal Behaviors
Health Center Contacts Marijuana Use Emotional DifficultyUnsafe Sexual Practices Acquaintance Rape
Mea
n Pe
rcen
tage
s

35
1985 1988 1991 1994 1997 2000 2003 2006 2009 20120
10
20
30
40
50
60
70
80
90
100Alcohol's Involvement With Academic Problems
Lack of Academic SuccessStudent AttritionDiminished PerformanceMissed Classes
Perc
ent A
ffirm
ative
Res
pons
es


PREVENTION

38
1979 1982 1985 1988 1991 1994 1997 2000 2003 2006 2009 20120
10
20
30
40
50
60
70
80
90
100
Focus Period of Time on Alcohol Education and Prevention
Perc
enta
ge o
f Affi
rmati
ve R
espo
nses

39
1988 1991 1994 1997 2000 2003 2006 2009 20120
10
20
30
40
50
60
70
80
90
100
Focus Period Of Time For Drug Education/Prevention
Perc
enta
ge o
f Affi
rmati
ve R
espo
nses

40
Campus Efforts: Awareness & Information
1991 1994 1997 2000 2003 2006 2009 20121
1.5
2
2.5
3
3.5
4
Campaigns Social Norms ArticlesHandouts Poster Campaigns
None
A Lot
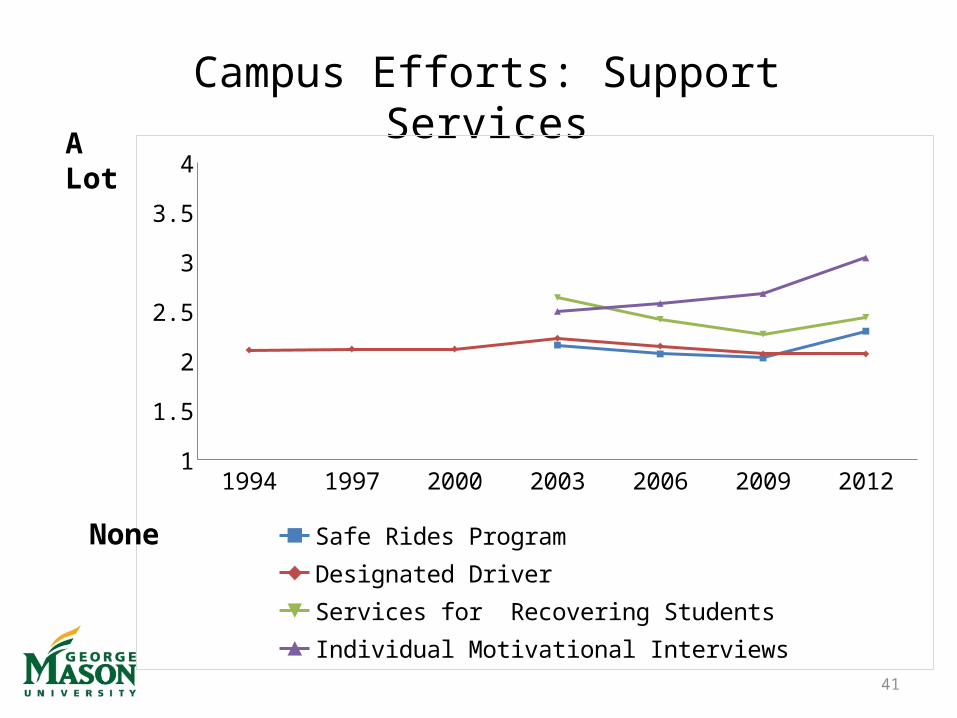
41
Campus Efforts: Support Services
1994 1997 2000 2003 2006 2009 20121
1.5
2
2.5
3
3.5
4
Safe Rides Program Designated DriverServices for Recovering Students Individual Motivational Interviews
None
A Lot

42
20122009200620032000199719941
1.5
2
2.5
3
3.5
4
Special Attention to Needs of Groups or Subpopulations
Freshmen Students Athletes Fraternity/Sorority Women
None
A Lot

43
20122009200620032000199719941
1.5
2
2.5
3
3.5
4 Special Attention to Needs of Groups or Subpopulations
People of Color Gays/Lesbians/ Bisexuals Commuters DisabilityNone
A Lot

44
201220091
1.5
2
2.5
3
3.5
4
Special Attention to Needs of Groups or Subpopulations
Students turning 21 Graduate Students International StudentsVeterans
None
A Lot

Included in Campus Efforts: 2012
Internet Education
WorkshopsAssmt/Feedback (In-
tervention)Discussion Groups
Speakers
Others
Peer Theatre
Other Social Media
Blogs
1 1.5 2 2.5 3 3.5 4
3.24
2.82
2.51
2.4
2.28
2.11
2.01
2
1.64
1.53
1.44
1.27
1 = Not at All 4 = Very Much
45Extent of Inclusion

46
Campus Programs Dealing With Alcohol and Substance Abuse
1982 1985 1988 1991 1994 1997 2000 2003 2006 2009 20120
10
20
30
40
50
60
70
80
90
100
Orientation program for students Orientation program for parentsStudent programming/ Peer group

47
Program Involves Bus or Van
Students Pay for Service
Safe Rides Program Available
0 10 20 30 40 50 60 70 80 90
79
19
50
Availability of Safe Rides Program
Percent Affirmative Responses

48
Days of the Week that Safe Rides is Available
Sunday
Monday
Tuesday
Wednesday
Thursday
Friday
Saturday
0 10 20 30 40 50 60 70 80 90 100
Percent Affirmative Responses

PERSONNEL, PLANNING AND RESOURCES

50
1997
2000
2003
2006
2009
2012
0 10,000 20,000 30,000 40,000 50,000 60,000
$13,435
$12,344
$20,233
$21,807
$24,494
$29,878
$13,168
$12,493
$14,985
$16,512
$16,818
$24,269
Alcohol/Substance Abuse (Excluding Personnel)
Other Wellness Funding
Dollars
Annual Funding For Alcohol/Substance AbuseIn 2012 = 55.18% of Wellness Funding
Wellness Funding = $ 54,147

Funding for Drug/Alcohol/Wellness Programs (per capita)
Overall Small Intermediate Large0
1
2
3
4
5
6
$4.10 $4.48$4.92
$3.04
Per c
apita
fund
ing

52
1979 1982 1985 1988 1991 1994 1997 2000 2003 2006 2009 20120
10
20
30
40
50
60
70
80
90
100
Designated Alcohol/Substance Abuse Edu-cator or Specialist
Perc
enta
ge o
f Affi
rmati
ve R
espo
nses

53
Level of Effort for Professionals Addressing Alcohol and Substance Abuse Education
Baseline 1994 2009 20120
0.2
0.4
0.6
0.8
1
1.2
1.4
1.6
Graduate Student Full time Specialist
Full
time
equi
vale
nts

54
Specialist Time Allocations: RolesAssessment12%
Counseling25%
Education8%
Administrative7%
Task Force18%
Research11%
Training7%
Others11%

55
Specialist Time Allocations: Topics
Alcohol41%
Drugs12%
Tobacco9%
Wellness23%
Violence16%

56
Specialist Time Allocation Within the Drugs Area
Marijuana49%
Synthetic Drugs9%
Cocaine5%
Heroin4%
Prescription Drugs19%
Over the Counter
Medicines7%
Other Substances8%

Campus utilizes peers
Educational workshops
Health awareness
Alcohol-free events
Policy review/ task member
Guest lectures in academic classes
Initial intervention/ referral to counseling
Other
0 10 20 30 40 50 60 70 80 90
63
85
80
68
48
41
22
11
Peer Utilization in Alcohol and Substance Abuse

58
1988 1991 1994 1997 2000 2003 2006 2009 20120
10
20
30
40
50
60
70
80
90
100
31
46
6672
6165
5955
63
Use of Peer Groups Whose Primary Purpose is Drug or Alcohol Abuse
Perc
enta
ges
ofA
ffirm
ative
Res
pons
es

59
Campus Police
Greek Affairs
Athletics
Student Organizations
Student Government
Faculty
Local Police
Community Residents
Local Government
Local Businesses
1 1.5 2 2.5 3 3.5 4
3.67
3.48
3.34
3.27
2.74
2.55
2.51
2.04
1.99
1.95
Collaboration Between Coordinator and Group: 2012
None A Lot

60
If so, plan includes a timeline and has des-ignated roles and responsibilities
If so, plan has measurable outcomes
Campus has formalized plan
0 20 40 60 80100
55
57
52
Strategic plan for addressing alcohol and substance abuse issues
Percent Affirmative Responses

61
1982 1985 1988 1991 1994 1997 2000 2003 2006 2009 20120
10
20
30
40
50
60
70
80
90
100
Campus, Community, and State Efforts
State Efforts Community Partnership Campus
Perc
enta
ge o
f Affi
rmati
ve R
espo
nses

62
1.00 1.50 2.00 2.50 3.00 3.50 4.00 4.50 5.00
Alcohol-free activitiesAcademic successCommunity serviceSexual activityDiversity SensitivityAlcohol abuse preventionCareer planningStress managementSTD/HIV preventionEffective relationshipsCo-dependencyViolence reductionTobacco cessationDepressionNutritionEffective communicationCivilityConflict managementValues clarificationSelf esteemAssertiveness training
1 = Not at All 5 = Very Much
Incorporation of themes into campus programming

63
1991 1994 1997 2000 2003 2006 2009 20121
1.5
2
2.5
3
3.5
4
4.5
5
Alcohol-free activities Nutrition Civility Values clarification
Not At All
Very Much
Extent to which the following themes are incorporated into campus programming

65
1994 1997 2000 2003 2006 2009 20121
1.5
2
2.5
3
3.5
4
4.5
5
Violence reduction Career planning Academic successCommunity service
Not At All
Very Much
Extent to which the following themes are incorporated into campus programming

66
1991 1994 1997 2000 2003 2006 2009 20121
1.5
2
2.5
3
3.5
4
4.5
5
Effective communication Effective relationships Sexual activitySTD/HIV prevention
Not At All
Very Much
Extent to which the following themes are incorporated into campus programming

67
1994 1997 2000 2003 2006 2009 20121
1.5
2
2.5
3
3.5
4
4.5
5
Co-dependency Tobacco cessation Alcohol abuse prevention
Not At All
Very Much
Extent to which the following themes are incorporated into campus programming

Intervention/ referral for mental health problems
Intervention/ referral for alcohol/drug problems
Identify students w/ alcohol/drug problems
Policy awareness of alcohol/drug issues
Guest lectures
1 1.5 2 2.5 3 3.5 4
Assistance for Faculty on Alcohol and Substance Abuse Issues: 2009 vs. 2012
20092012
None A lot

Curricular content on wellness issues
Curricular content on alcohol/drug issues
Audio/Video on alcohol/wellness issues
Teaching plan on wellness issues
Teaching plan on alcohol/drug issues
1 1.5 2 2.5 3 3.5 4
2.21
2.13
1.81
1.75
1.76
2.04
1.92
1.86
1.41
1.42
Assistance for Faculty on Alcohol and Substance Abuse Issues: 2009 vs. 2012
None A lot

TREATMENT

72
2003 2006 2009 20121
2
3
4
Counseling Center Health CenterAlcohol/Substance Abuse Coordinator Residence Hall StaffCampus Ministry Off- campus Treatment Agency
Extent to Which a Student with a Drinking Problem Can Receive Counseling Assistance
None
A lot

73
1979 1982 1985 1988 1991 1994 1997 2000 2003 2006 2009 20120
10
20
30
40
50
60
70
80
90
100Group Counseling Experience For Problem
Drinkers
Perc
enta
ge o
f Affi
rmati
ve R
espo
nses

74
1979 1982 1985 1988 1991 1994 1997 2000 2003 2006 2009 20120
10
20
30
40
50
60
70
80
90
100
Support Group For Those Negatively Affected By An Alcoholic
Perc
enta
ge o
f Affi
rmati
ve R
espo
nses

75
1982 1985 1988 1991 1994 1997 2000 2003 2006 2009 20120
10
20
30
40
50
60
70
80
90
100
Campus has Employee Assistance Program for Those with Drinking Problems
Perc
enta
ge o
f Affi
rmati
ve R
espo
nses

76
1979 1982 1985 1988 1991 1994 1997 2000 2003 2006 2009 20120
10
20
30
40
50
60
70
80
90
100
Paraprofessional Staff Receives Training to Deal with Students with Drinking Problems
Perc
enta
ge o
f Affi
rmati
ve R
espo
nses

RELATED ISSUES
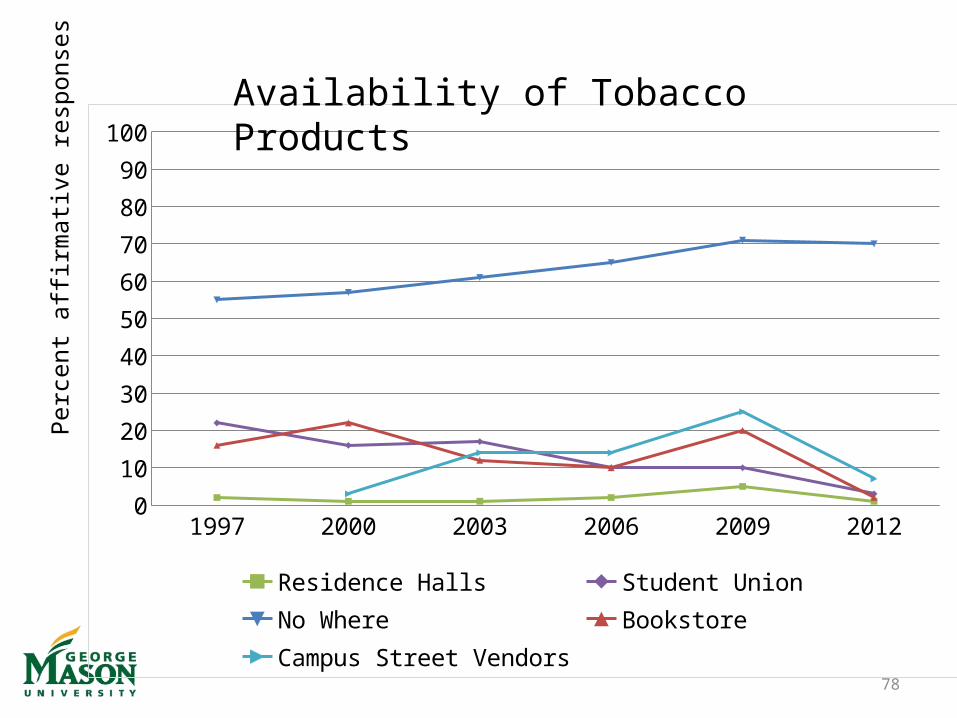
78
1997 2000 2003 2006 2009 20120
10
20
30
40
50
60
70
80
90
100
Residence Halls Student Union No WhereBookstore Campus Street Vendors
Availability of Tobacco ProductsPe
rcen
t affi
rmati
ve re
spon
ses

79
Smoke-free Environment
1997 2000 2003 2006 2009 20120
10
20
30
40
50
60
70
80
90
100
All Residence Halls All Public Areas Academic Buildings
Perc
ent a
ffirm
ative
resp
onse
s


ADMINISTRATIVE ASSESSMENTS

82
Preferred Minimum Age
1997 2000 2003 2006 2009 20120
10
20
30
40
50
60
70
80
90
100
18 19 20 21 or higher
Perc
ent a
ffirm
ative
resp
onse

83
Administrative Assessment: Alcohol Problems
Minimal cam-pus alcohol
abuse problems
Most abuse occur off-cam-
pus
1 1.5 2 2.5 3 3.5 4 4.5 5
2.39
3.75
Strongly Disagree Strongly Agree

84
Administrative Assessment: Alcohol Problems
2000 2003 2006 2009 20121
2
3
4
5
Minimal campus alcohol abuse problems Most abuse occur off-campus
Strongly Disagree
Strongly Agree

85
Administrative Assessment: Overall Approach
Adequate funding for prevention programs
Comprehensive approach
Efforts has been in-stitutionalized
Committed to effec-tive prevention
1 1.5 2 2.5 3 3.5 4 4.5 5
2.35
3.3
3.25
3.99
Strongly Disagree Strongly Agree

86
Administrative Assessment: Overall Approach
2000 2003 2006 2009 20121
2
3
4
5
Adequate Funding for prevention programs Comprehensive approach
Efforts has been institutionalized Campus is committed to prevention strategies
Strongly Disagree
Strongly Agree

87
Administrative Assessment: Planning
Concensus on direc-tion of prevention ef-
forts
Principles of preven-tion efforts formalized
Alcohol abuse goals clearly defined
Campus utilizes effec-tive strategies
1 1.5 2 2.5 3 3.5 4 4.5 5
2.89
3.31
3.22
3.61
Strongly Disagree Strongly Agree

88
Administrative Assessment: Planning
2000 2003 2006 2009 20121
2
3
4
5
Concensus on direction of prevention efforts Principles of prevention efforts formalized
Alcohol abuse goals clearly defined Campus utilizes effective strategies
Strongly Disagree
Strongly Agree

89
1.00 1.50 2.00 2.50 3.00 3.50 4.00 4.50 5.00
Harm ReductionResponsible Decision-MakingEstablishing Healthy NormsHealthy Life ChoicesProblem ReductionAlcohol-Free ActivitiesResponsible DrinkingLifelong SkillsValues DevelopmentSocial Norms MarketingAbstinence
1 = Not at All 5 = Very Much
Prevention Approaches Guiding Campus Efforts

90
200020032006200920121
2
3
4
5
Responsible Decision-Making Harm ReductionEstablishing Healthy Norms Healthy Life ChoicesProblem Reduction Responsible Drinking
Prevention Approaches Guiding Campus Efforts 1
Not at all
Very much

91
Prevention Approaches Guiding Campus Efforts 2
2000 2003 2006 2009 20121
2
3
4
5
Abstinence Social Norms Marketing Values DevelopmentLifelong Skills Alcohol-Free Activities
Not at all
Very much

92
Perceived Effectiveness for AOD Efforts
Alcohol Free Social Events
Individual Motivational interviews
Alcohol Education and Prevention
Local Police Enforcement
State and Federal Law
Treatment and Referral Resources
Campus Staff Enforcement
First-Year targeted
Campus Policies and Procedures
Sanctions for Alcohol Infractions
Campus Police Enforcement
1 2 3 4 5
1 = Not at All 5 = Very Much

93
Perceived Effectiveness for AOD Efforts
Faculty Training
Infusion of Prevention Education
Collaboration: Student Services & Faculty
Campus Task Force
Social Norms Marketing
Joint Campus/Community Efforts
Use of Peer Educators
Staff Training
Accessibility of on-campus Treatment
Greeks Targeted
Technological Approaches
In-depth assessment of Repeat Offeders
Athletes Targeted
1 2 3 4 5
1 = Not at All 5 = Very Much

94
Perceived Effectiveness for AOD Efforts 2
2006 2009 20121
2
3
4
5
Campus Policies and Procedures State and Federal LawSanctions for Alchol Infractions Campus Staff EnforcementCampus Police Enforcement Local Police Enforcement
Not effective
Very effective

95
Perceived Effectiveness for AOD Efforts 3
2006 2009 20121
2
3
4
5
Individual Motivational interviewsAccessibility of on-campus TreatmentIn-depth assessment of Repeat OffedersTreatment and Referral Resources
Not effective
Very effective

96
Perceived Effectiveness for AOD Efforts 4
2006 2009 20121
2
3
4
5
Campus Task force Joint campus/Community Efforts
Collaboration Between Student Services and Faculty Faculty Training
Staff Training
Not effective
Very effective

97
Perceived Effectiveness for AOD Efforts 5
2006 2009 20121
2
3
4
5
Greeks Targeted First-Year targeted Athletes Targeted
Not effective
Very effective

98
Perceived Adequacy for AOD Efforts 1
2006 2009 20121
2
3
4
Alcohol Education and Prevention Alcohol Free Social EventsTechnological Approaches Social Norms MarketingUse of Peer Educators Infusion of prevention education
Not adequate
Very Adequate

99
Perceived Adequacy for AOD Efforts 2
2006 2009 20121
2
3
4
Campus Policies and Procedures State and Federal LawSanctions for Alchol Infractions Campus Staff EnforcementCampus Police Enforcement Local Police Enforcement
Not adequate
Very Adequate

100
Perceived Adequacy for AOD Efforts 3
2006 2009 20121
2
3
4
Individual Motivational interviewsAccessibility of on-campus TreatmentIn-depth assessment of Repeat Offeders
Not adequate
Very Adequate

101
Perceived Adequacy for AOD Efforts 4
2006 2009 20121
2
3
4
Campus Task forceJoint campus/Community EffortsCollaboration Between Student Services and FacultyFaculty TrainingStaff Training
Not adequate
Very Adequate

102
Perceived Adequacy for AOD Efforts 5
2006 2009 20121
2
3
4
Greeks Targeted First-Year targeted Athletes TargetedNot adequate
Very Adequate

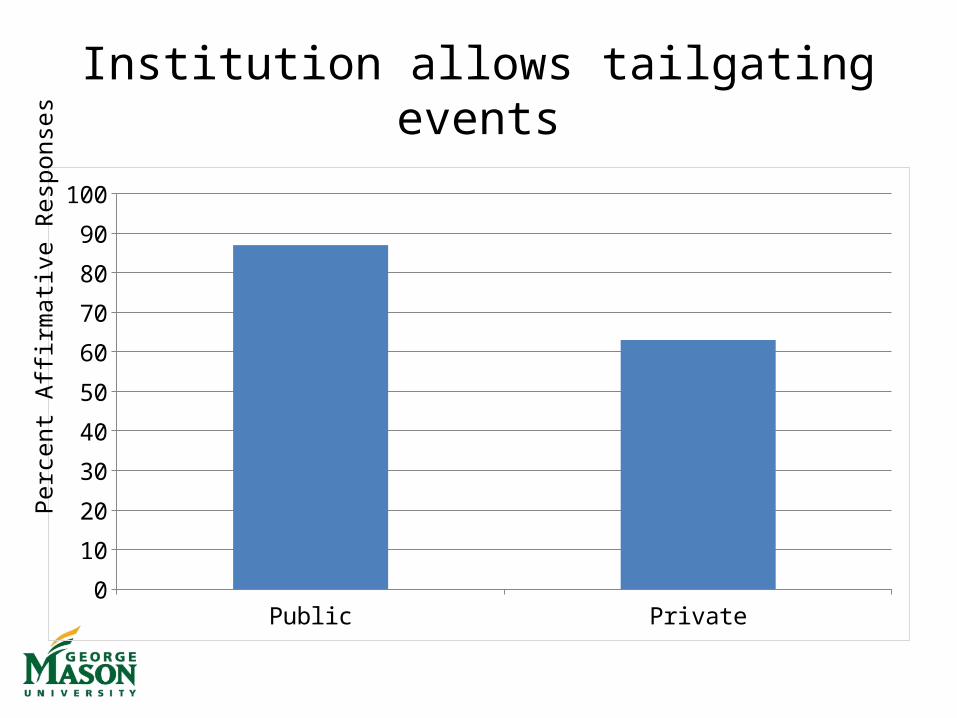
PUBLIC/PRIVATE COMPARISONS
114 Public Institutions (65.1%)61 Private Institutions (34.9%)
Public Private0
10
20
30
40
50
60
70
80
90
100
Perc
ent A
ffirm
ative
Res
pons
es
Institution allows tailgating events

School has an amnesty policy
Public Private0
10
20
30
40
50
60
70
80
90
100
Perc
ent A
ffirm
ative
Res
pons
es

Institutional Assessment
Alcohol survey Assessment of Effectiveness0
10
20
30
40
50
60
70
80
90
100 95
60
95
39
Public Private
Perc
ent A
ffirm
ative
Res
pons
es

Crime and property damage
Violation of policies Residence Hall damage Other property damage0
10
20
30
40
50
60
70
80
90
100
53 5446
6157
47
Public Private
Perc
ent A
ffirm
ative
Res
pons
es

Behavioral consequences of alcohol
Violent behavior Physical injury Emotional difficulties Risk of suicide0
10
20
30
40
50
60
70
80
90
100
51
37 3429
61
3429
20
Public Private
Perc
ent A
ffirm
ative
Res
pons
es *

Academic consequences of alcohol
Miss
ed class
Diminish
ed perform
ance
Lack
of Aca
demic Su
ccess
Attrition
0
20
40
60
80
100
35 29 29 2628 25 26 20
Public Private
Perc
ent A
ffirm
ative
Res
pons
es

Health consequences of alcohol
Unsafe sexual practices Health center contacts Acquaintance rape0
10
20
30
40
50
60
70
80
90
100
56
22
5660
16
60
Public Private
Perc
ent A
ffirm
ative
Res
pons
es
*

Association of alcohol with other drugs
Drug use Marijuana Designer drugs0
10
20
30
40
50
60
70
80
90
100
27 302522
3023
Public Private
Perc
ent A
ffirm
ative
Res
pons
es

Total Funding for Drug/Alcohol programs
Overall Public Private0
10000
20000
30000
40000
50000
60000
70000
$29,878 $34,406$25,027
$24,269
$27,701
$14,197Other wellnessAlcohol/Substance Abuse
Tota
l Fun
ding

Funding for Drug/Alcohol programs (per capita)
Overall Public Private0
1
2
3
4
5
6
$2.43$1.95
$3.42
$1.67$1.57
$1.94
Other wellnessAlcohol/Substance Abuse
Per c
apita
fund
ing

Campus staffing for alcohol related issues
Designate
d coord
inator
Task-fo
rce
Violence preve
ntion education
Group co
unselin
g
Support
group
0
20
40
60
80
100 95
75 73
4834
92
61 5642
25
Public Private
Perc
ent A
ffirm
ative
Res
pons
es

INSTITUTION SIZE COMPARISONS
Small- Below 7500 | 32%Intermediate – 7500-18000 | 33.1%
Large- Above 18000 | 34.9%

Small Intermediate Large0
10
20
30
40
50
60
70
80
90
100
Perc
ent A
ffirm
ative
Res
pons
es
Institution allows tailgating events

School has an Amnesty Policy
Small Intermediate Large0
10
20
30
40
50
60
70
80
90
100
Perc
ent A
ffirm
ative
Res
pons
es

Institutional Assessment
Alcohol survery Assessment of Effectiveness0
10
20
30
40
50
60
70
80
90
100 96
39
98
58
90
60
Small Intermediate Large
Perc
ent A
ffirm
ative
Res
pons
es

Crime and property damage
Violation of policies Residence Hall damage Other property damage0
10
20
30
40
50
60
70
80
90
100
60 57
43
55 5245
5358
51
Small Intermediate Large
Perc
ent A
ffirm
ative
Res
pons
es

Behavioral consequences of alcohol
Violent behavior Physical injury Emotional difficulties Risk of suicide0
10
20
30
40
50
60
70
80
90
100
61
35 3326
53
3834
30
50
3628
20
Small Intermediate Large
Perc
ent A
ffirm
ative
Res
pons
es

Academic consequences of alcohol
Miss
ed class
Diminish
ed perform
ance
Lack
of Aca
demic Su
ccess
Attrition
0
20
40
60
80
100
34 30 31 2533 29 29 2431 25 24 20
Small Intermediate Large
Perc
ent A
ffirm
ative
Res
pons
es

Health consequences of alcohol
Unsafe sexual practices Health center contacts Acquaintance rape0
10
20
30
40
50
60
70
80
90
100
63
16
74
56
24
65
54
19
64
Small Intermediate Large
Perc
ent A
ffirm
ative
Res
pons
es

Association of alcohol with other drugs
Drug use Marijuana Designer drugs0
10
20
30
40
50
60
70
80
90
100
2028
232331
21
32 30 28
Small Intermediate Large
Perc
ent A
ffirm
ative
Res
pons
es

Total Funding for Drug/Alcohol programs
Overall Small Intermediate Large0
10000
20000
30000
40000
50000
60000
70000
80000
90000
$54,147
$14,797
$66,017$77,582
Total Funding
Tota
l Fun
ding

Funding for Drug/Alcohol/Wellness Programs (per capita)
Overall Small Intermediate Large0
1
2
3
4
5
6
$4.10 $4.48$4.92
$3.04
Per c
apita
fund
ing

Campus staffing for alcohol related issues
020406080
100 8772
5232
19
97
61 6749 44
9778 82
57
30
Small Intermediate Large
Perc
ent A
ffirm
ative
Res
pons
es

ALCOHOL ALLOWED VS.
ALCOHOL NOT ALLOWED
135 Institutions allow alcohol (77.1%)40 Institutions don’t allow alcohol (22.9%)

Institution allows tailgating events
Alcohol not allowed Alcohol Allowed0
10
20
30
40
50
60
70
80
90
100
Perc
ent A
ffirm
ative
Res
pons
es

School has an Amnesty Policy
Alcohol not allowed Alcohol allowed0
10
20
30
40
50
60
70
80
90
100
Perc
ent A
ffirm
ative
Res
pons
es

Institutional Assessment
Alcohol survery Assessment of Effectiveness0
10
20
30
40
50
60
70
80
90
100 95
60
95
51
Alcohol not allowed Alcohol allowed
Perc
ent A
ffirm
ative
Res
pons
es

Crime and property damage
Violation of policies
Residence Hall damage
Other property damage
Acquaintance rape0
102030405060708090
100
50 5043
6358 57
47
69
Alcohol not allowed Alcohol allowed
Perc
ent A
ffirm
ative
Res
pons
es

Behavioral consequences of alcohol
Violent behavior Physical injury Emotional difficulties Risk of suicide0
10
20
30
40
50
60
70
80
90
100
52
34 36 33
55
3731
24
Alcohol not allowed Alcohol allowed
Perc
ent A
ffirm
ative
Res
pons
es

Academic consequences of alcohol
Miss
ed class
Diminish
ed perform
ance
Lack
of Aca
demic Su
ccess
Attrition
0
20
40
60
80
100
38 32 34 2731 26 26 23
Alcohol not allowed Alcohol allowed
Perc
ent A
ffirm
ative
Res
pons
es

Health consequences of alcohol
Unsafe sexual practices Health center contacts0
10
20
30
40
50
60
70
80
90
100
62
25
56
18
Alcohol not allowed Alcohol allowed
Perc
ent A
ffirm
ative
Res
pons
es

Association of alcohol with other drugs
Drug use Marijuana Designer drugs0
10
20
30
40
50
60
70
80
90
100
2733
262529
24
Alcohol not allowed Alcohol allowed
Perc
ent A
ffirm
ative
Res
pons
es

Total Funding for Drug/Alcohol Programs
Overall Alcohol not allowed Alcohol allowed0
10000
20000
30000
40000
50000
60000
70000
$54,147
$35,265
$60,774
Tota
l Fun
ding

Funding for Drug/Alcohol Programs (per capita)
Overall Alcohol not allowed Alcohol allowed0
0.5
1
1.5
2
2.5
3
3.5
4
4.5
5
$4.10
$2.54
$4.64
Per c
apita
fund
ing

Campus staffing for alcohol related issues
Designated coordinator
Task-force Violence prevention education
Group counseling
Support group0
10
20
30
40
50
60
70
80
90
100
Alcohol not allowed Alcohol allowed
Perc
ent A
ffirm
ative
Res
pons
es