Embed Size (px)
Citation preview

THE CITY OF MISSISSAUGA
FINANCIALREPORT2007
THE CITY OF MISSISSAUGA
FINANCIALREPORT2007
for the fiscal year ended December 31, 2007

Hazel McCallion Mayor
Carmen Corbasson ward 1 Councillor
Patricia Mullin ward 2 Councillor
Maja L.A. Prentice ward 3 Councillor
Frank Dale ward 4 Councillor
Eve Adams ward 5 Councillor
Carolyn Parrish ward 6 Councillor
Nando Iannicca ward 7 Councillor
Katie Mahoney ward 8 Councillor
Patricia Saito ward 9 Councillor
Sue McFadden ward 10 Councillor
George Carlson ward 11 Councillor
MAyor hAzEL McCALLIoN ANd MEMbErS of CoUNCIL
9
1011
6
5
34
7
12
8Burnhamthorpe Rd.
Mav
is R
d.
Lakeshore Rd.
Q.E.W.
Q.E.W.
Hwy. 403
Hwy. 407
LESTER B.PEARSON�NTERNAT�ONALA�RPORT
Caw
thra
R
d.
Mis
siss
auga
Rd.
Queensway
Dundas St.
Win
ston
Chu
rchi
ll B
lvd.
Sou
thdo
wn
Rd.
Erin
Mills
P
kwy.
Derry Rd.
Eglinton Ave.
Hwy.401
Hw
y. 42
7
Britannia Rd. W.
Britannia Rd. E.
Hw
y. 41
0H
wy.
403
Dix
ie R
d.
Hur
onta
rio S
t.
Nin
th L
ine
Derry Rd.
Hw
y. 4
07
ETR
Hw
y. 4
03
Finc
h A
ve.
Cre
dit R
iver
Eto� icoke Creek
City ofTorontoTown of
Oakville
Town ofMilton
Town of Halton Hills City ofBrampton
Lake Ontario
City of Mississauga CounCillors
ward 1 Carmen Corbasson ward 2 Patricia Mullin ward 3 Maja L.A. Prentice ward 4 Frank Dale ward 5 Eve Adams ward 6 Carolyn Parrish ward 7 Nando Iannicca ward 8 Katie Mahoney ward 9 Patricia Saito ward 10 Sue McFadden ward 11 George Carlson

FINANCIAL REPORT 2007 1
INTRODUCTORY SECTION
for the fiscal year ended December 31, 2007 Mississauga, Ontario, Canada
Produced by the Finance Division, Corporate Services Department of the City of Mississauga
in co-operation with all civic departments, offices and agencies.
THE CITY OF MISSISSAUGA FINANCIAL REPORT 2007

INTRODUCTORY SECTION
Table OF CONTENTsIntroductory SectIon:Our Values 3
GFOa award: Canadian award for Financial Reporting 4
Mayor’s Message 5
about Mississauga Quick Facts 6
Message from the City Manager 7
Message from the Commissioner of Corporate Services and Treasurer 8
Corporate Organizational Structure 10
Financial Highlights in 2007 11
Financial Management Processes 14
FInancIal Statement SectIon:Financial year in review 15
2007 Consolidated Financial Performance 16
Consolidated Statement of Financial Position 16
Consolidated Statement of Financial activities 16
Operating Fund Overview 17
Capital Fund Overview 18
Reserves and Reserve Funds Overview 20
Financial Graphs 21
Introduction to the Financial Statements 24
City of Mississauga Financial Statements and Related Schedules 26
Trust Fund Financial Statements 41
StatIStIcal SectIon:Five-Year Financial Review 44
10 largest Corporate Property Taxpayers 47
contact Information: reaching out to all our community 48
2007 Successes report Insert
2 CITY OF MISSISSAUGA

INTRODUCTORY SECTION
OuR Values
truSt We commit to upholding public trust and
to promoting a climate of trust between employees, management, Council and
residents. We strive to be open and responsive in managing the City.
QualIty We deliver services and programs which
enhance the quality of life of residents and employees.
eXcellence We serve as a model of excellent public
administration and deliver the right services in a superior way, at a reasonable cost.
FINANCIAL REPORT 2007 3

INTRODUCTORY SECTION
4 CITY OF MISSISSAUGA
GFOa awardCAnAdIAn AwArd FOr FInAnCIAl rEpOrTInG
For the 10th consecutive year, the Government Finance Officers association of the united States and Canada presented the City of Mississauga with the Canadian award for Financial Reporting for its 2006 annual Financial Report in recognition of the City’s ability to present financial information in a clear, concise and informative manner. This award program encourages innovative financial reporting and maintains a high quality standard that is recognized amongst peers. The City of Mississauga is continuing this standard of high quality reporting for the submission and evaluation for the 2007 award program.

FINANCIAL REPORT 2007 5
INTRODUCTORY SECTION
MaYOR’S MessaGeThe City of Mississauga is realizing our vision for making our city a prosperous, livable and exciting urban centre.
Through “Our Future Mississauga – be Part of the Conversation” – the largest public consultation process in our history – we received valuable input from citizens. Over 80,000 residents and stakeholders shared their creative thoughts and ideas through our website, community events, speakers’ series and visioning symposium which will help us establish our priorities and direction for the future of our city.
Today, more than 40,000 people live, and 20,000 employees work, in the City Centre and surrounding area. Our City Centre has undergone a remarkable transformation. New commercial and residential construction projects have reshaped our city skyline. When fully developed, “downtown Mississauga” will be home to more than 100,000 people and will be a work destination for more than 60,000 employees.
Investment in higher-order transit such as bus Rapid Transit (bRT) and light Rail Transit (lRT) is a priority to provide links to our City Centre from urban centres throughout the Greater Toronto area (GTa). as we continue to invest in public spaces, parks, transportation and transit to meet the community and service needs of people who live and work in our city, we are also continuing to practice sound financial management and prudent stewardship of our resources.
Through extensive public engagement we are working with residents and stakeholders to build a great, new Strategic Plan for our future. Together we will build an even better Mississauga!
Hazel mccallion, C.M. Mayor City of Mississauga
Hazel McCallion, C.M. Mayor
City of Mississauga

INTRODUCTORY SECTION
6 CITY OF MISSISSAUGA
location
• LocatedwithintheGreaterTorontoArea
• AdjoiningCityofTorontoonthewestside and on the north shores of lake Ontario
• Area:111squaremiles(288km2); 71,040 acres (28,750 ha)
Population
• 709,250;Canada’s6thlargestcity
• ProjectedPopulationin2041:788,100
employment
• EmployeesinMississauga:416,300
• EmployeesinGTA:3.1million
transportation
airport • TorontoPearsonInternationalAirportislocated in Mississauga - Canada’s busiest airport, among the top 30 in the world
Highways • TheonlycityintheGTAservicedby7majorhighways
• Excellenthighwayconnections,lessthan2hours from the u.S.a. border
railways • Servedby2nationalrailways, Canadian National (CN) and Canadian Pacific (CP)
• Intercityandlongdistancerailpassengerservice is provided by VIa Rail Canada and aMTRaK
Public transit • ThirdlargestmunicipaltransitsysteminOntario servicing approximately 30 million riders annually
• 96routesthroughouttheCityconnectwiththeToronto Transit Commission, brampton Transit, Oakville Transit and all GO Transit stations
• GOTransitoperates3trainlinesandseveralGOBus routes through Mississauga providing frequent service throughout the day with connections to Toronto and surrounding areas
Higher education
In Mississauga
• TheUniversityofTorontoMississauga
Within Commuting Distance
• 10majoruniversitiesand11technicalcolleges
Businesses
•Morethan56,100intotal(June2007)
• Topemployersinclude:AccentureInc.,AtomicEnergy of Canada limited/aeCl, air Canada, bell Canada, bell Mobility, CFM Vermont Castings Majestic Products, Cara Operations, Citi, Federal express Canada ltd., G4S Security Services (Canada) ltd., GlaxoSmithKline Inc., Greater Toronto airports authority, Hewlett-Packard (Canada) ltd., Honeywell, loblaw Companies east, Maple leaf Consumer Foods, RbC Financial Group, RbC Insurance Services Inc., Servisair/GlobeGround, Symcor, TD bank Financial Group, Wal-Mart Canada Inc., and Winners Merchants Inc.
•Majorheadoffices:40ofCanada’stop500 companiesand59Fortune500corporations
tax rates (2007)
• Industrial:2.941159%
• Commercial:2.595117%
• Residential:1.002521%
•Multi-Residential:1.577668%
abOuT MISSISSauGa Quick Facts
FINANCIAL REPORT 2007 7
INTRODUCTORY SECTION
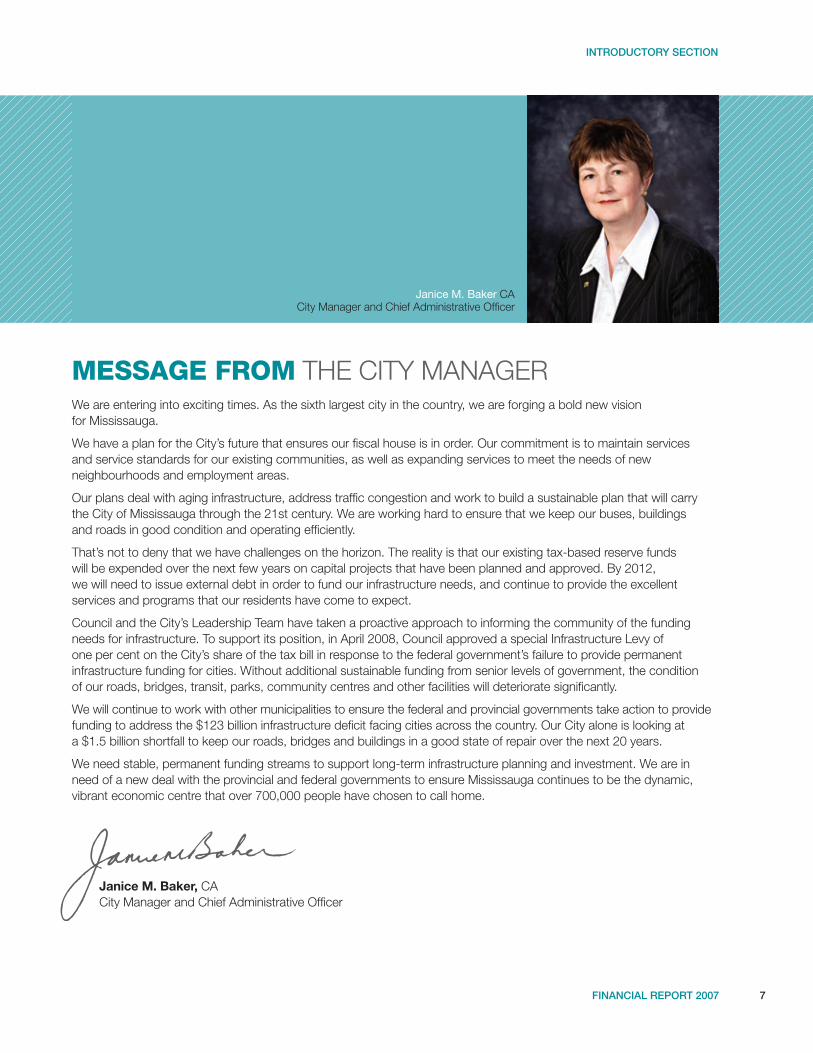
MessaGe FroM THe CITY MaNaGeRWe are entering into exciting times. as the sixth largest city in the country, we are forging a bold new vision for Mississauga.
We have a plan for the City’s future that ensures our fiscal house is in order. Our commitment is to maintain services and service standards for our existing communities, as well as expanding services to meet the needs of new neighbourhoods and employment areas.
Our plans deal with aging infrastructure, address traffic congestion and work to build a sustainable plan that will carry the City of Mississauga through the 21st century. We are working hard to ensure that we keep our buses, buildings and roads in good condition and operating efficiently.
That’s not to deny that we have challenges on the horizon. The reality is that our existing tax-based reserve funds will be expended over the next few years on capital projects that have been planned and approved. by 2012, we will need to issue external debt in order to fund our infrastructure needs, and continue to provide the excellent services and programs that our residents have come to expect.
Council and the City’s leadership Team have taken a proactive approach to informing the community of the funding needs for infrastructure. To support its position, in april 2008, Council approved a special Infrastructure levy of one per cent on the City’s share of the tax bill in response to the federal government’s failure to provide permanent infrastructure funding for cities. Without additional sustainable funding from senior levels of government, the condition of our roads, bridges, transit, parks, community centres and other facilities will deteriorate significantly.
We will continue to work with other municipalities to ensure the federal and provincial governments take action to provide funding to address the $123 billion infrastructure deficit facing cities across the country. Our City alone is looking at a $1.5 billion shortfall to keep our roads, bridges and buildings in a good state of repair over the next 20 years.
We need stable, permanent funding streams to support long-term infrastructure planning and investment. We are in need of a new deal with the provincial and federal governments to ensure Mississauga continues to be the dynamic, vibrant economic centre that over 700,000 people have chosen to call home.
Janice m. Baker, Ca City Manager and Chief administrative Officer
Janice M. Baker Ca City Manager and Chief administrative Officer

INTRODUCTORY SECTION
8 CITY OF MISSISSAUGA
MessaGe FroM THe COMMISSIONeR OF CORPORaTe SeRVICeS aND TReaSuReRThe City of Mississauga’s well-known reputation for prudent and stringent financial management continues to be reflected in the City’s 2007 annual Financial Report and accompanying financial statements.
The City of Mississauga is proud to present its Financial Report for the year ended December 31, 2007. This report has been prepared in accordance with the Municipal act and based on the reporting standards set by the Public Sector accounting board of the Canadian Institute of Chartered accountants.
Council and staff carefully reviewed every service for efficiency and value for our taxpayers before approving a property tax increase of 4.7 per cent for 2007. This increase was recommended after an in-depth review of all service areas and capital needs in an effort to find cost savings and minimize tax increases without compromising services or service levels today or in the future. Mississauga has maintained its debt-free status and continues to hold its “aaa” credit rating which affords us some flexibility in addressing our financial challenges.
Times are changing and resources are tight for all municipalities. Municipalities are struggling to maintain services and deal with increasing transportation problems due to increased traffic congestion and/or deteriorating infrastructure while at the same time limiting tax increases. Fortunately, due to strong financial management and planning, Mississauga has been better able to respond to, mitigate, and deal with these issues.
Most Ontario municipalities are finding it increasingly difficult to balance their budgets and the City of Mississauga is no different. as revenue growth slows and the city evolves, we cannot continue to rely on property tax as the only permanent source of funding for local public services and capital infrastructure.
Mississauga is currently dealing with aging infrastructure, increasing labour and commodity cost pressures, and declining development growth. The City is facing some very difficult decisions for the future given that property taxes are our only source of tax revenue. Strategies to deal with these pressures are limited to increases in property taxes, user fees, modifying our service standards, lowering costs, or some combination of these measures.
Senior levels of government have taken preliminary steps to help municipalities with our funding shortfalls but more support is needed. There are still large and costly gaps in overall infrastructure funding. Not only is additional predictable funding needed from senior levels of government but greater flexibility needs to be offered in the use of these funds.
One of the City’s key strategic strategies is “building a City for the 21st Century.” Within this strategy, there are a number of objectives and initiatives to steer this direction.
Brenda r. Breault CMa, Mba Commissioner of Corporate Services and Treasurer

FINANCIAL REPORT 2007 9
INTRODUCTORY SECTION
The City of Mississauga will need to reassess its service levels in order to respond to the changing population. The demographics for the city are shifting from a rapidly growing and young population to a more stable population of older adults. It is projected that by 2021, persons aged 55 and older will form one third of Mississauga’s total projected population. The challenge will be to make service changes for senior residents while continuing to provide services to the city’s younger population in a way that encourages an active, healthy lifestyle for all age groups.
Transportation and traffic congestion management is also a high strategic priority for the City. a sustainable city for the 21st century requires a balanced approach to mobility where transportation choices enhance the quality of life in our communities.
The City is currently working with Metrolinx, as well as other GTa municipalities, to develop a regional transportation plan;conductinganOfficialPlanReview;movingforwardwithmajorinvestmentsintransittoimproveservicelevels; continuingtoaddressgapsintheroadnetworkthroughtheroadscapitalprogram;andconductingaright-of-way review to assist with the development of a multi-modal transportation plan, including a cycling strategy.
as our city grows and matures, we will focus on ensuring that our city is well positioned for the future. We must continue to invest in infrastructure, services and programs for our new and growing communities while maintaining the infrastructure, programs and services we currently have. Increasing costs and other operational pressures makes this challenge increasingly difficult.
However, we are committed to exploring options and identifying solutions to the challenges that lie ahead. all of the objectives, priorities and pressures will be assessed in concert with the City’s strategic planning, business planning, and budget processes. Fiscal responsibility is, and will continue to be, one of Mississauga’s many strengths. The 2007 financial results demonstrate Mississauga’s commitment to prudent financial planning. With an “aaa” credit rating, no debt, combined with adequate reserve balances and a new strategic and business planning process that aligns service and funding decisions, the City of Mississauga is positioning itself for future service and infrastructure requirements.
brenda R. breault, CMa, Mba Commissioner of Corporate Services and Treasurer March 7, 2008

INTRODUCTORY SECTION
10 CITY OF MISSISSAUGA
CORPORaTe orGanizational STRuCTuRe
Paul a. mitcham P. eng., Mba Commissioner Community Services
Brenda r. Breault CMa, Mba Commissioner Corporate Services and Treasurer
edward r. Sajecki P. eng., M.C.I.P. Commissioner Planning and building
martin Powell P. eng. Commissioner Transportation and Works
Janice m. Baker Ca City Manager and Chief administrative Officer
• EconomicDevelopment
• InternalAudit
• StrategicInitiatives
• OfficeofArtsandCulture
• CustomerService
• OrganizationalWellness & business Services
• CorporateFinance
• Communications
• OfficeoftheCityClerk
• Facilities&Property Management
• LegalServices
• CorporateHuman Resources
• InformationTechnology
• Revenue&Materiel Management
• BusinessServices
• Transportation& Infrastructure Planning
• Engineering&Works
• MississaugaTransit
• Enforcement
• BusRapidTransit(BRT) Project Office
• Planning,Development & business Services
• Recreation&Parks
• Fire&Emergency Services
• LibraryServices
• StrategicPlanning & business Services
• Development&Design
• PolicyPlanning
• BuildingServices

FINANCIAL REPORT 2007 11
INTRODUCTORY SECTION
FINaNCIal HiGHliGHts IN 2007Balanced BudGet and ProPerty taXeS:City Council, in conjunction with staff, worked very hard to minimize the impact of cost pressures on taxpayers and maintain current service levels. However, it is becoming increasingly difficult to balance the City’s budget with property taxes being the main source of funding.
by introducing a variety of operational efficiencies and new revenue sources, as well as undertaking a detailed review of cost pressures, the City was able to limit its property tax rate increase to 4.7 per cent in 2007. This included a 1.3 per cent tax increase to provide funding for the capital program.
PuBlIc Sector accountInG Board tanGIBle caPItal aSSet rePortInG:The Public Sector accounting board (PSab) has adopted new guidelines which will require all Canadian municipalities tobeginreportingTangibleCapitalAssetsintheirfinancialstatementsstartingonJanuary1,2009.Thisrequiresthe City of Mississauga to inventory and value all of our physical assets such as roads, buildings, parks, land and major equipment, as well as determine depreciation rates and other accounting policies. a city-wide project team has been established to design and implement the new accounting rules.
cIty BuSIneSS PlannInG:Mississauga has designed a new City business Planning process that will integrate our strategic, budget and work planning processes. The City business Planning process will help align work efforts and budgets to our strategic priorities by clearly defining and measuring resource requirements, service levels, outputs and outcomes. It will also benefit decision-making by clarifying priorities and ensuring corporate alignment. business planning set the parametres and building blocks for a two-year budget process. a business plan will enable us to measure and report on our progress in achieving our objectives. The new business planning and budgeting processes will be a two-year cyclefromJanuary1,2008andwillencompassboth2009and2010.
envIronmental InItIatIveS:an environmental advisory Committee (eaC) has been established to review environmental initiatives and priorities for the City. Some 2007 environmental achievements are as follows:
• Air:GreenedourCityfleetbypurchasinghybridandfuel-efficientreplacementvehicles;begantousebio-dieselfuel intransitbuses;andsignedaMemorandumofUnderstandingwithCleanAirPartnershiptoparticipateinairquality modelling in the GTa.
• Energy: Completed a city-wide energy Feasibility Study to evaluate opportunities for energy and water conservation. Total cost of all recommended measures adds up to $5.6 million with estimated annual energy and water cost savings ofover$800,000.CityCouncilapprovedtherecommendationsandasix-yearimplementationplanstartingin2007; installed a solar photovoltaic power generation system at the Hershey Centre. The photovoltaic panels will generate 25 to 30 kilowatts of electricity, which is equivalent to the power required to light a typical fire station for one year. Thisprojectwillreducecarbondioxideemissionsby25,800kilogramsperyearforapproximately25years;City Council approved green power purchase for the Civic Centre as a one-year pilot project. This initiative will reduce greenhousegasemissionsby4,400tonnesortheequivalentofremoving975carsfromMississaugaroads;and developed innovative electricity procurement processes which provided a saving of $1.25 million in electricity cost compared to the regulated price offered to municipalities.
• Land: Parks and Forestry staff facilitated 50 community cleanup events and 750 regular group cleanups under theLitter-Notcampaign;launchedglassandplasticrecyclingonapilotbasisat52majoruseparks;co-ordinated 73communityplantingeventsduringtheyearinvolving3,412volunteerswhoplanted11,950treesandshrubs; and developed a new encroachment Management Plan concentrating on reclaiming and protecting natural areas.
• PlanningandPolicy:Completedanaturalareassurveyupdateforwards5,6and11;initiatedthedevelopment ofaGreenDevelopmentStrategy;CouncilapprovedaComprehensiveZoningBy-lawwithnewGreenbeltZoning approach,aswellascomplementaryOfficialPlanAmendments(OPA25);implementedOfficialPlanPoliciesin developmentapplicationsandenvironmentalassessments;approvedsixdevelopmentsthatareLEED(Leaderin energy and environmental Design) and implemented green development techniques such as green roofs, bioswales,

INTRODUCTORY SECTION
12 CITY OF MISSISSAUGA
permeablepavement,energyandwaterefficientmeasures;basedontheCity’senvironmentalobjectives,provided directionforConservationAuthoritynaturalheritage,waterresources,andpolicydevelopmentinitiatives;andsigned a Memorandum of understanding with Toronto Region Conservation for GTa eco-Industrial Park City data collection.
•Water: Initiated an update of the Mississauga Storm Water Quality Strategy.
our Future mISSISSauGa: The goal of Mississauga’s largest public engagement campaign “Our Future Mississauga - be Part of the Conversation” is to inspire, inform and interact with residents, businesses, students and stakeholders about the future of Mississauga. The campaign will broadly gather creative thoughts and unique ideas through an innovative website, community events, great idea “puzzle pieces” and a community visioning symposium, and will incorporate them into a common vision in the form of a new Strategic Plan to take Mississauga into the next 40 years.
SPace PlannInG & accommodatIon InItIatIveS:a number of space planning and accommodation initiatives began in 2007 to accommodate City operations and administration due to growth and the introduction of new and expanded service areas.
• The“ConsolidatedCallCentreProject”wascompletedinlate2007withtherelocationofemployeestothe 950BurnhamthorpeRoadWestbuilding.
• The“PublicCounterConsolidationProject”wasinitiatedwhich,whenimplementedin2008/09,willresultinimproved front-line service delivery as public counters are relocated to accessible areas within the Civic Centre (i.e. first three floors). In 2007, the Call Centre handled over 170,000 telephone calls and just over 4,000 public e-mails while maintaining publishedservicelevelsfortelephonecustomerservice;80percentofallcallswillbeansweredin30secondsorless; acallabandonedrateof3percentorless;andacallblockagerateof0percent.TheCallCentrestartedusingthe newCustomerRelationshipManagement(CRM)systeminJune2007totrackandassesscitizeninquiries.Over81,400 calls were tracked with 1,404 of these resulting in customer service requests resolved by various sections in the City.
• The“TransitRelocationandRenovationProject”iscurrentlyunderwaywithemployeerelocationsscheduledin early 2008. Mississauga’s Transit Ridership Growth Strategy will significantly increase the size of the City’s bus fleet. In order to accommodate this growth for the next four to five years, a major expansion of the main bus storage and maintenance facility on Central Parkway is required to provide sufficient capacity to efficiently operate and maintain the fleet. a second satellite facility will also be required for growth beyond five years.
BuS raPId tranSIt (Brt):The bus Rapid Transit (bRT) project is a partnership between Mississauga, GO Transit, Ontario and Canada, to create a new busway running east-west across Mississauga along Highway 403, eastgate Parkway and eglinton avenue corridors. When complete in 2012, it will serve thousands of transit riders each day, making it easier to travel to, from, and through Mississauga and the GTa.
2007 was a landmark year for the bRT project. The City received the federal funding commitment and opened the City’s bRT Project Office. a consultant team was hired to lead the preliminary design phase and the federal environmental assessment process which are currently underway.
acceSSIBIlIty InItIatIveS:The City’s accessibility Plan has been in place since 2003. Some of the City’s accessibility objectives include an enhanced communication campaign, refining and improving accessibility design guidelines, integrating accessibility intotheCity’sStrategicandDepartmentalPlans;andimprovingaccessibilityofMississaugaTransit.
Some accomplishments in 2007 include accessibility improvements to the Hershey Sports Complex, Churchill Meadows Library,StreetsvilleKinsmenSeniorCitizensCentre,andCouncilChambers;assistivelisteningsystemsforCivicFitnessAerobicsStudio,GreatHall,PublicAffairsAuditoriumandNoelRyanAuditorium;increasednumberofdesignatedparkingspacesfordisabledpersons;andmoretransitaccessiblebuses.Attheendof2007,MississaugaTransithadapproximately281accessiblebusesoutofatotalof379buses(74percent)ofthefleet.Mississaugaisalsocommittedto replace the remainder with accessible buses by 2012.

FINANCIAL REPORT 2007 13
INTRODUCTORY SECTION
cuStomer ServIce StrateGy:OnMarch29,2006,CouncilapprovedtheCustomerServiceStrategyasaframeworkforimprovingthewayweserveour customers. The strategy encompasses customer service through three channels: call centres, counters and the internet. The Call Centre Consolidation Project and the review of counter services are the first major initiatives that are being undertaken as part of the strategy.
Phase I of the Call Centre Consolidation Project was completed as planned with all general inquiry calls, Office of the City Clerk, animal Services, Revenue and snow calls being handled in the new call centre. In November, the Call Centre also extendeditshoursofoperationfrom7a.m.to7p.m.andmovedintoitsnewspaceat950BurnhamthorpeRoadWest.The Customer Service Division also implemented a City of Mississauga Knowledge base (Kb) and Customer Relationship Management (CRM) system to provide up-to-date information and services to customers through the Call Centre.
In 2007, the City reviewed public access to services at counters resulting in a comprehensive plan to realign services from 17 locations in City Hall to three key service-oriented counters, as well as a new counter at the Mavis Road location for many of the Transportation and Works (T&W) counter services. Working with the accessibility advisory Committee, City staff has started to develop plans to implement new accessible Customer Service Standards to improve and ensure that the delivery of counter customer service is fully accessible.
ecIty:The City of Mississauga’s award-winning website provides City information and a growing number of online services for businesses and city residents on a 24 hour/7 day-a-week basis.
talent manaGement:In 2007, the City’s leadership Team approved a Corporate Talent Management Strategy. This strategy is focused on building a talent ready city for the 21st century positioning the City to remain an employer of choice. It is made up of initiatives designed to ensure City leadership continuity, define the City’s leadership needs for the future and proactively manage current and future key talent issues and gaps.
ecity Portal: • 17,144userswillvisitwww.mississauga.ca • 94%Canada+6%International • 63%returningcustomers+37%new • 95.6%Windows+3.6%Mac • 51.5%arrivedviasearch(usuallyGoogle) +35.8%direct+12.7%followedalink • 317,000pageswillbeviewed • 8,800willviewtheeCityhomepage • 5,500willviewtheTransithomepage
Planning and Building Services online • Planning&BuildingeServicessuccessfully used 415,110 times in 2007 • BuildingPermitStatus–75,571(18.6%) • DevelopmentApplicationStatus–31,036(7.6%) • DigitalMapping–38,414(11.3%) • Property/TaxQuery–221,113(58.4%) • Other–48,976(4.2%)
click n’ ride – transit trip Planner • 148,000usersessionseverymonth(5,000/day) • 5.6millionpageviewseverymonth • 164,000tripplanseverymonth(5,290/day) • 183,000routestopscheduleseverymonth(5,903/day)
library catalogue online • 650,000usecounteverymonth(20,967/day) • 270,000+searchesoflibrarycatalogue madeonlineeverymonth(8,709/day) • 120,000+accountloginsonlineeverymonth(3,870/day) • 85,000+renewalsonlineeverymonth(2,741/day) • 65,000+holdsplacedonlineeverymonth(2,096/day) • 500+accountupdatesonlineeverymonth(16+/day)
connect2rec – recreation and Parks • 183,547registrationsprocessedin2007 • IVR-9,553(4%) • Connect2Rec-82,545(45%) • StaffProcessed(mail-in/walk-in)-91,449(49%) • IVRandInternet(ie.self-service)channelstookin over $6.7 million for recreation registrations.
Parking tickets online • Processed42,418ticketstotalling$1,336,348in2007 • Currentpace:42,000+onlinetransactions (out of 118,000 across all channels) and over $1.3MineCommerceperyear(40%adoptionrate)
Provincial offence tickets online • Processed11,392ticketstotalling$982,272in2007 • Currentpace:12,000+onlinetransactions (out of 60,000 across all channels) and over $1.1MineCommerceperyear(20%adoptionrate)

INTRODUCTORY SECTION
14 CITY OF MISSISSAUGA
FINaNCIal MaNaGeMeNT ProcessescIty BuSIneSS PlannInG and e3 ProGram:To address significant budget, economic and political pressures in recent years, the City of Mississauga is introducing a new, corporate-wide, business planning process which builds on the lessons learned through the City Services Review project. The end result will be better integration of Mississauga’s strategic priorities and programs, service levels and budgets.
The City also implemented a new program called e3 - efficiency, economy, and effectiveness. under this new initiative, the City will review in a systematic and regular way, all major City services and programs on a four to six-year cycle.
FInancIal Statement PreParatIon:City of Mississauga management is responsible for all information contained in the annual Financial Report. These financial statements and accompanying notes have been prepared using reasonable limits of materiality and within the framework of the accounting principles and disclosure requirements of the Canadian Institute of Chartered accountants guidelines included in the Public Sector accounting and auditing Standards Manual.
Internal control manaGement:Management maintains appropriate systems of internal and administrative controls designed to provide reasonable assurance that transactions are executed in accordance with proper authorization, that assets are properly accounted for and safeguarded, and that financial information produced is relevant and reliable.
eXternal audIt:The role of the external auditor, KPMG llP, is to present an independent opinion on the fair presentation of the City’s financial position and operating results as contained in the Financial Report, confirming that the statements are free from material misstatements. It is the responsibility of the auditor to advise management and the audit Committee of any control or operational issues that may be identified during their audit procedures.
audIt commIttee:The audit Committee is comprised of three members of Council, who are appointed annually by Council with the Mayor also being an ex-officio member. The audit Committee provides a focal point for communications between Council, the external auditor, the internal auditor and management, and facilitates an impartial, objective and independent review of management practices through the internal and external audit functions.
uSer Pay PHIloSoPHy:With the City’s only major funding source being property taxation, Mississauga continues to implement its “user Pay” philosophy where appropriate to do so to fund service costs. Development is slowing down and as a result development charge revenues are declining while tax base growth is slowing. The City will continually need to review user fees to balance service and tax pressures.

FINANCIAL REPORT 2007 15
YEAr 2007FINaNCIal YeaR
inREviEW •2007ConsolidatedFinancialPerformance
•OperatingFundOverview
•CapitalFundOverview
•ReservesandReserveFundsOverview
•FinancialGraphs
•IntroductiontotheFinancialStatements
•CityFinancialStatementsandNotes
•TrustFundFinancialStatementandNotes

FINANCIAL STATEMENTS SECTION
16 CITY OF MISSISSAUGA
FINaNCIal YeaR in reView2007 conSolIdated FInancIal PerFormanceThe major funds utilized by the City of Mississauga are the Operating Fund, the Capital Fund, and the Reserves and Reserve Funds. The year-end balances for these funds have been consolidated to provide the overall financial position and the financial resources of the City.
Theconsolidated2007year-endbalanceforthesethreefundsis$698.5million,comparedto$692.6millionin2006, anincreaseof$5.9million.Anoverviewofeachofthefundsisprovidedbelow.
TheCityisa90percentshareholderinEnersourceCorporation.TheCity’sshareofnetassetshasincreasedfrom$188.6millionin2006to$191.8millionin2007,representinga$3.2millionincrease.ThisincreaseisattributedtotheCity’sshareofEnersourcenetincomeof$12.5millionlessa$9.3milliondividendpaymentreceivedbytheCityfromenersource in 2007.
conSolIdated Statement oF FInancIal PoSItIon (Balance SHeet)In 2007, the City’s Net Financial Resources balance (i.e. financial assets minus liabilities) closed at $743.6 million as comparedto$753.4millionin2006,adecreaseof$9.8million.ThepositiveNetFinancialResourcespositionindicatesthat there are net financial assets on hand, which can provide resources to finance future obligations. although there was a slight decrease in 2007, the City’s Net Financial Resources position remains financially healthy and strong for the future.
• ThedecreaseinNetFinancialResourcesisattributedtoanumberoffinancialareas.
- TotalFinancialAssetsof$1,331.3millionincreasedby$39.6millionfrom2006mainlyduetoanincreaseincash and investments ($60.8 million), partially offset by a decrease in receivables ($24.4 million).
- TotalLiabilitiesof$587.7millionincreasedby$49.4millionfrom2006primarilybecausedeferredrevenue-obligatory reserve funds (i.e. conditional grants received by senior levels of government) increased by $44.1 million and employeebenefitsandotherliabilitiesincreasedby$17.9million,offsetbyadecreaseinpayablesof$12.1million.
• Combinedcashandinvestmentstotal$1.0billionattheendof2007,anincreaseof$60.8millionfrom2006. The majority of this increase relates to the cash inflow of federal and provincial funds (i.e. gas taxes, public transit funds, bus rapid transit grant) and development charges during the year. However, a significant portion of these funds remain unspent (i.e. held in Reserve Funds or capital projects) and have been set up as deferred revenue (approx. $350 million). These funds will be applied/earned as revenue when applicable transit, road, and other infrastructure related expenditures occur in the future. The balance of the cash and investments represents working capital (for day-to-day operations) and funds set aside within Reserves and Reserve Funds for future requirements.
conSolIdated Statement oF FInancIal actIvItIeS (Income Statement)Totalrevenuesfor2007were$591.6million,anincreaseof$21.2millionor3.7percentover2006.
• Propertytaxrevenuesfor2007wereup$10.1millionfrom2006to$259.2million.Assessmentgrowthof1.6percent and a 4.7 per cent property tax rate increase accounted for the growth.
• Paymentsinlieuoftaxes(i.e.taxationfromothergovernments)for2007were$22.1million,anincreaseof$0.2million over 2006.
• Userchargesfor2007were$143.7million,anincreaseof$7.9millionover2006.Theincreasewasduetotransit fare increases, increased transit ridership (1.1 million or 3.8 per cent), and other departmental fees and service charge rate increases (i.e. recreation programs, rentals, Transportation and Works permit fees, library fees, etc.). Provincial offences fine gross revenues decreased by $141 thousand or 2 per cent in 2007.
• Governmentgrantsfor2007were$11.0million,adecreaseof$8.8millionover2006.In2006,theCityreceived aone-timegrantof$9.3millionforbusreplacementsfromtheOntarioGovernment.
• Developmentcontributionsfor2007were$62.9million,anincreaseof$1.7millionover2006.Increasedexpenditures on development-related projects resulted in additional funds being utilized in 2007.

FINANCIAL REPORT 2007 17
FINANCIAL STATEMENTS SECTION
• Investmentincomefor2007was$58.1million,anincreaseof$6.4millionor12.4percentfromtheprioryear. Higher short-term rates and higher average daily investment balances accounted for the increase.
• Penaltiesandinterestearningsfor2007fromoverduetaxaccountswere$7.6million,anincreaseof$1.8million over 2006.
• Otherrevenuesfor2007were$14.4million,anincreaseof$4.8millionover2006.Moremiscellaneousone-time revenueswerereceivedin2007versus2006.Inaddition,theEnersourceCorporationdividendat$9.3millionwas also $1.3 million higher than 2006.
• TheCity’sshareofEnersourceCorporationnetincomefor2007was$12.6million,adecreaseof$2.9millionor 18.7 per cent from 2006.
OPERAtingFundOvERviEW:The Operating Fund provides for the normal operating revenues and expenditures associated with the day-to-day provision of services. The main categories of revenue include: taxation, investment income, development-related income, transit fares, recreation fees, payments in lieu of taxes (PIlTs) / supplementary taxes, and fines and tax penalties.
EventhoughtheOperatingFundhadanetloss(i.e.revenuesminusexpenses)of$9.2milliononoperationsbeforetransfers, this loss is mainly attributable to increased actuarial liability estimates for WSIb, insurance and other post-employmentliabilities(approx.$17.9millionhigherin2007).Thechangeintheseactuarialliabilitiesfromoneyeartothenext must flow through the Consolidated Schedule of Current Fund Operations as a net increase or decrease to labour expenses. These non-cash expenses are consolidated at year-end, within the financial statements, and these expenses are considered outside of the control and scope of normal day-to-day operations.
after transfers and post net revenue adjustments, the Operating Fund (i.e. the City’s operating revenues and expenditures) generated a surplus of $2.6 million. This surplus will be used to help offset some of the 2008 budget pressures.
revenues: In 2007, Operating Fund revenues totalled $457.3 million as compared to $436.5 million in 2006, an increase of $20.8 million. explanations for the revenue variances can be found in the Consolidated Statement of Financial activities overview section above.
expenditures: expenditures are broken down into major categories: labour and benefits, materials and supplies, contracted services, rents and financial expenses, and transfer payments. Total operating expenditures for 2007 were $466.5 million compared to$412.6in2006,anincreaseof$53.9million.
Salary, wage and benefits for 2007 were $342 million, an increase of $40.1 million from the prior year. Growth in the City’s labour force (new and expanded services), performance increases, labour contract settlements/adjustments, increased benefit costs and increased OMeRS costs contributed to this increase. also recognition for increased WSIb, propertyandliabilityinsuranceandotherpost-employmentliabilitiesresultedinanadditional$17.9millioninlabour-related expenses as compared to $0.4 million in 2006.
Materials and supplies for 2007 were $42.4 million, an increase of $5.1 million or 13 per cent over 2006. Winter salt requirements increased by $3.2 million over 2006 due to increased snowfall. utility costs (electricity, gas, water) increased by $1.3 million over 2006.
Contracted services for 2007 were $36.7 million, an increase of $8.0 million or 27 per cent over 2006. Winter maintenance contract services increased by approximately $4 million due to increased snowfall in 2007. Road and asphalt repair contracts accounted for approximately $2 million of the increase. Contract increases in all other service areas accounted for the balance.
Rentandfinancialexpensesfor2007were$43.6million,anincreaseof$0.9millionor2percentover2006.Generalincreases in staff development, communication, occupancy, and finance-related costs accounted for the increase.

FINANCIAL STATEMENTS SECTION
18 CITY OF MISSISSAUGA
CAPitALFundOvERviEW:The Capital Fund provides for expenditures on assets and infrastructure that benefit the City for a significant time period. Capital Fund expenditures provide for improvement, acquisition and construction of land, buildings, roads, bridges and machinery used in the provision of municipal services.
Mississauga’s capital program is funded from two primary sources. Taxes are used to fund major maintenance or enhancements/changes to existing infrastructure. Development charges are used to fund growth-related assets.
Mississauga has a policy of “pay-as-you-go” which means that the City builds capital infrastructure without the use of debt financing. However, by 2012, debt financing will be needed to assist in funding future asset rehabilitation and replacements.
The capital budget is established in a different format from the operating budget. The capital budget is based on an approved project basis (i.e. commitment) rather than an annualized cash flow basis.
Fund Balance: The Capital Fund balance (i.e. unexpended capital financing) has increased from $107.8 million in 2006 to $137.2 million in2007,representinga$29.4millionincrease.Thisincreasereflectsthefundingsetasidein2007fornewcapitalprojects and the timing of spending on previously approved capital projects. all projects have been pre-approved with project funding set aside in the Capital Fund. Due to the size and scope of capital projects, the timing and rate of capital expenditures can vary over many years. as a result, Capital Fund balances may fluctuate from year-to-year.
In2007,theCityreceived$2.6millioningovernmentgrantsforcapitalinfrastructure,adecreaseof$14.9millionfrom2006.In2006,theCityreceived$16.9millionfromtheOntarioGovernmentforthebusreplacementprogramwhich wasdirectlyappliedagainstthecapitalprogram.The$16.9millionincludedaone-timegrantpaymentof$9.3millionfromtheprovince.However,in2007,theCityreceivedonly$5.9millionforbusreplacementsandthesefundswereapplied against the Reserve Fund for future capital obligations.
In2007,$91.8million($80.9millionin2006)wastransferredfromReserveFundstothecapitalprogramtohelpmeetthe capital demands associated with a growing and maturing city.
expenditures: Forfiscalyear2007,totalcapitalexpenditureswere$134.9,anincreaseof$6.3millionovertheprioryear.Thisincreasereflects the timing of capital payments and stages of development for certain capital projects. It also reflects a larger capital program which results in more spending on an annual basis.
Projects: Some of the major capital project successes for 2007 include:
• AnewaccessibleCityCentreShuttlewasimplementedinDecember2007.Itoperatesdailyandissponsoredin part by Square One Shopping Centre. The cost to travel around the City Centre area is only $1 or pay full fare for transfer privileges.
• Creatingavirtualserverenvironmentwhichresultedinareductioninthenumberofphysicalserversinthecomputer roomfrom150to90.Consolidationofdiskstorageinonestoragedeviceoptimizedbothspacerequirementsandcosts.
• Consolidationofphone-calltakingfor14existingbusinessareaswithextendedhoursofoperationtobetterservice the residents.
• AnewSportsComplexnexttotheHersheyCentreopenedtothepublicinthefallandincludesanindoorsportsfield, gymnasium, gymnastics facility and two outdoor sports fields with artificial turf.
• ChurchillMeadowsBranchLibraryandActivityCentreopenedtothepublicinMarch2007.
• Citypurchaseofperformancestagingallowedforenhancedprogrammingof“MyMississauga”eventsatthe Civic Centre.

FINANCIAL REPORT 2007 19
FINANCIAL STATEMENTS SECTION
• FireandEmergencyServiceshastakendeliveryofaSpecialOperatingVehicle(SOV)whichwilltransportspecialized trench and technical rescue equipment.
• FireandEmergencyServiceshastakendeliveryoffourpumper/rescuechassis.
• QuenippenonMeadowsSprayPadopenedforpublicuseandincludeslandscapeimprovements,seatingareas, pathway connections and lawn areas.
• TheredevelopedLakefrontPromenadeplaygroundopenedtothepublicandfeaturesthe“Evos”playsystemwhich offers new physical and mental play challenges.
• KariyaParkreconstructionoffrontentrancestonestepsandpathwaypavingcompletedandnewcustommadestone bencheswereinstalledwhichcomplementtheJapanesegardenstyle.
•WoodgreenParkandMarvinHeightsParksredevelopmentwascompletedandopenedtothepublicandfeatures a community garden, beautiful front park entrances and gathering places.
• PortCreditLogCabinrelocationtoBradleyMuseumsitewascompleted.
• ThetrailnetworkgrewwiththecompletionoftheMaltonGreenwayTrailfromEtudeDrivetoGorewayDrive as well as bicycle lanes on South Millway from burnhamthorpe Road to erin Mills Parkway.
• ThepreliminarytraildesignwascompletedforQueenswayTrailfromWinstonChurchillBlvd.toErinMillsParkway and from Glengarry Road to Dixie Road, etobicoke Creek Trail for Rathburn Road and Waterfront Trail through Rhododendron Gardens.
• Federalandprovincialfundingwasusedtobegina$76millionexpansionofMississaugaTransit’soperational headquarters on Central Parkway West and complete a $2.3 million expansion of its satellite complex in Malton to increase total capacity to 470 buses.
• FifteenmorebuseswereaddedtotheCity’stransitfleet,plusanadditional70,000hoursofannualservice.
• TheCity’sTransitfleetwasupgradedwith12smallercomfortableElDoradobusesthatwereplacedintoservice on community and shuttle routes.
• $83millioninfederalfundingwascommittedtotheBRTProject,ahigh-efficiencytransitcorridorthatwillrun east-west across Mississauga and provide express bus service to thousands of passengers per day.
• 75Citystreetswereimprovedthroughthe2007RoadwayResurfacingProgram.
• TheCity’sGreenFleetprogramincludes25hybrid-electricandfuel-efficientvehiclestohelpreducegreenhouse gas emissions and air contaminants.
• AnewsectionofThomasStreet,between10thLineWestandWinstonChurchillBoulevard,wasconstructed and paved to improve area traffic when the roadway opens in 2008.
• ASouthdownRoadPedestrianBridgeattheClarksonGOStationwasbuilttopromotepedestriansafety.
• ConstructionstartedonthenewConfederationParkwayBridgeoverHwy403.

FINANCIAL STATEMENTS SECTION
20 CITY OF MISSISSAUGA
REsERvEsAndREsERvEFundsOvERviEW:Reserves and Reserve Funds are established by Council. These funds are drawn upon to finance specific purpose expenditures as designated by Council, to minimize tax rate fluctuations due to unanticipated expenditure and revenue shortfalls, and to fund multiple-year projects and programs (i.e. insurance and employee benefits).
Reserves and Reserve Funds (i.e. funds set aside to help offset future obligations, pressures and costs) were drawn down from $582.2 million in 2006 to $558.6 million in 2007, representing a decrease of $23.6 million. although Reserves and Reserve Funds remain high and very strong, capital pressures required draws from these funds to finance our growing infrastructure requirements.
Despite the decline in total Reserve and Reserve Fund balances in 2007, the City of Mississauga continues to maintain adequate Reserves and Reserve Funds. The Reserve and Reserve Funds will help the City meet the projected expenditure needs in the upcoming years. However, draws on Reserve and Reserve Funds in future years to support our capital infrastructure and maintenance needs will deplete these balances unless additional funding comes through from other senior levels of government to help sustain and invest in new and replacement infrastructure.
reserves: Reserves, which are discretionary in nature, are generally used to offset major fluctuations in operating costs/revenues or to fund future contingent liabilities. Total Reserves increased to $54.5 million, an increase of $0.6 million over 2006. This increase is the result of various transfers from operations to help fund future operational pressures.
reserve Funds: Reserve Funds, on the other hand, are non-discretionary, segregated and restricted to meet a specific purpose for the municipality. Total Reserve Funds decreased to $504.1 million, a decline of $24.2 million from 2006. This decrease is the result of increased transfer payments from the Reserve Funds to the capital program and a decreased transfer of fundingfromtheOperatingFundtotheReserveFunds.In2007,$91.8millionwastransferredfromtheReserveFund tothecapitalprogram,anincreaseof$10.9millionintransferpaymentsfrom2006.
In2007,$19.0millionwastransferredintotheReserveFundfromtheOperatingFund,adecreaseof$14.0million. The pre-year-end close surplus (before final transfers) at the end of 2007 was significantly less than 2006, resulting in a lower transfer.

FINANCIAL REPORT 2007 21
FINANCIAL STATEMENTS SECTION
FInAnCIAl GrApHSCONSOlIDaTeD STaTeMeNT OF Financial Position
Protection services $6.6 (5%)
Environment services $7.5 (6%)
Planning & developmentservices 13.4 (2%)
Environmental services9.3 (1%)Health/social & familyservices 0.6 (0%)
CONSOLIDATED EXPENDITURES BY SERVICE(in $millions)
Total Consolidated Expenditures by Service $601.4 (100%)
Recreation andcultural services
141.5 (24%)
Transportation services226.3 (38%)
General governmentservices 115.3 (19%)
Protection services95.0 (16%)
$1,331.3
$1,125.2$1,291.7
$1,139.1 $1,168.2
FINANCIAL ASSETS SUMMARY(in $millions)
2007 2006 2005 2004 2003
2007 2006 2005 2004 2003
2007 2006 2005 2004 2003
2007 2006 2005 2004 2003
FINANCIAL LIABILITIES SUMMARY(in $millions)
INVESTMENT INENERSOURCE CORPORATION
(in $millions)
FUND BALANCES(in $millions)
$587.7$538.3
$414.9 $407.7$361.8
$191.8 $188.6 $181.1 $177.0 $180.7
$698.5 $692.6 $670.2 $707.0 $702.7
Rents and financial expenses$55.8 (9%)
Salaries, wages and benefits$344.5 (57%)
Contracted services$133.8 (22%)
Materials and supplies$65.6 (11%)
Transfer payments$1.7 (1%)
CONSOLIDATED EXPENDITURES BY TYPE(in $millions)
CONSOLIDATED REVENUES BY TYPE(in $millions)
CAPITAL FUND EXPENDITURES BY SERVICE(in $millions)
Equity in income of Enersource Corporation$12.6 (2%)
Property taxation$259.2 (44%)
User charges$143.7 (24%)
Development contributions applied $62.9 (11%)
Investment income $58.1 (10%)
Payments in lieu of taxes $22.1 (4%)
Government grants $11.0 (2%)
Penalties and interest on taxes $7.6 (1%)
Other income $14.4 (2%)
Transportation services$67.9 (50%)
Recreation and cultural,social/family services$43.1 (32%)
General government services $9.8 (7%)
Total Consolidated Expenditures by Type $601.4 (100%)
Total Consolidated Revenues by Type $591.6 (100%)
Total Capital Fund Expenditures by Service $134.9 (100%)
Sick leave benefits $10.0 (2%)
WSIB $16.2 (3%)
Group benefits $3.1 (1%)
Self Insurance claims $23.2 (4%)
Capital revolving fund$176.6 (35%)
Capital construction$129.8 (26%)
Vehicle and equipment replacement $54.1 (11%)
Lot levies $46.8 (9%)
Contributions from developers for specific works $44.3 (9%)
RESERVE FUNDS(in $millions)
Total Reserve Funds $504.1 (100%)
Transit revenue stabilization $1.1 (2%)Arts $0.8 (1%)Other $0.8 (1%)Development revenue $4.8 (9%)
Assessmentappeals
$9.0 (17%)Winter maintenance$7.3 (13%)
Utilities$6.8 (13%)
Laboursettlement$6.0 (11%)
Vacation pay$5.8 (11%)
Contingencies $3.9 (7%)
Planning $4.0 (8%)Elections $1.9 (3%)Legal settlements $2.3 (4%)
Total Reserves $54.5 (100%)
RESERVES(in $millions)

FINANCIAL STATEMENTS SECTION
22 CITY OF MISSISSAUGA
Protection services $6.6 (5%)
Environment services $7.5 (6%)
Planning & developmentservices 13.4 (2%)
Environmental services9.3 (1%)Health/social & familyservices 0.6 (0%)
CONSOLIDATED EXPENDITURES BY SERVICE(in $millions)
Total Consolidated Expenditures by Service $601.4 (100%)
Recreation andcultural services
141.5 (24%)
Transportation services226.3 (38%)
General governmentservices 115.3 (19%)
Protection services95.0 (16%)
$1,331.3
$1,125.2$1,291.7
$1,139.1 $1,168.2
FINANCIAL ASSETS SUMMARY(in $millions)
2007 2006 2005 2004 2003
2007 2006 2005 2004 2003
2007 2006 2005 2004 2003
2007 2006 2005 2004 2003
FINANCIAL LIABILITIES SUMMARY(in $millions)
INVESTMENT INENERSOURCE CORPORATION
(in $millions)
FUND BALANCES(in $millions)
$587.7$538.3
$414.9 $407.7$361.8
$191.8 $188.6 $181.1 $177.0 $180.7
$698.5 $692.6 $670.2 $707.0 $702.7
Rents and financial expenses$55.8 (9%)
Salaries, wages and benefits$344.5 (57%)
Contracted services$133.8 (22%)
Materials and supplies$65.6 (11%)
Transfer payments$1.7 (1%)
CONSOLIDATED EXPENDITURES BY TYPE(in $millions)
CONSOLIDATED REVENUES BY TYPE(in $millions)
CAPITAL FUND EXPENDITURES BY SERVICE(in $millions)
Equity in income of Enersource Corporation$12.6 (2%)
Property taxation$259.2 (44%)
User charges$143.7 (24%)
Development contributions applied $62.9 (11%)
Investment income $58.1 (10%)
Payments in lieu of taxes $22.1 (4%)
Government grants $11.0 (2%)
Penalties and interest on taxes $7.6 (1%)
Other income $14.4 (2%)
Transportation services$67.9 (50%)
Recreation and cultural,social/family services$43.1 (32%)
General government services $9.8 (7%)
Total Consolidated Expenditures by Type $601.4 (100%)
Total Consolidated Revenues by Type $591.6 (100%)
Total Capital Fund Expenditures by Service $134.9 (100%)
Sick leave benefits $10.0 (2%)
WSIB $16.2 (3%)
Group benefits $3.1 (1%)
Self Insurance claims $23.2 (4%)
Capital revolving fund$176.6 (35%)
Capital construction$129.8 (26%)
Vehicle and equipment replacement $54.1 (11%)
Lot levies $46.8 (9%)
Contributions from developers for specific works $44.3 (9%)
RESERVE FUNDS(in $millions)
Total Reserve Funds $504.1 (100%)
Transit revenue stabilization $1.1 (2%)Arts $0.8 (1%)Other $0.8 (1%)Development revenue $4.8 (9%)
Assessmentappeals
$9.0 (17%)Winter maintenance$7.3 (13%)
Utilities$6.8 (13%)
Laboursettlement$6.0 (11%)
Vacation pay$5.8 (11%)
Contingencies $3.9 (7%)
Planning $4.0 (8%)Elections $1.9 (3%)Legal settlements $2.3 (4%)
Total Reserves $54.5 (100%)
RESERVES(in $millions)
FInAnCIAl GrApHSCONSOlIDaTeD STaTeMeNT OF Financial actiVities

FINANCIAL REPORT 2007 23
FINANCIAL STATEMENTS SECTION
FInAnCIAl GrApHSCaPITal FuND, ReSeRVeS aND reserVe Funds
Protection services $6.6 (5%)
Environment services $7.5 (6%)
Planning & developmentservices 13.4 (2%)
Environmental services9.3 (1%)Health/social & familyservices 0.6 (0%)
CONSOLIDATED EXPENDITURES BY SERVICE(in $millions)
Total Consolidated Expenditures by Service $601.4 (100%)
Recreation andcultural services
141.5 (24%)
Transportation services226.3 (38%)
General governmentservices 115.3 (19%)
Protection services95.0 (16%)
$1,331.3
$1,125.2$1,291.7
$1,139.1 $1,168.2
FINANCIAL ASSETS SUMMARY(in $millions)
2007 2006 2005 2004 2003
2007 2006 2005 2004 2003
2007 2006 2005 2004 2003
2007 2006 2005 2004 2003
FINANCIAL LIABILITIES SUMMARY(in $millions)
INVESTMENT INENERSOURCE CORPORATION
(in $millions)
FUND BALANCES(in $millions)
$587.7$538.3
$414.9 $407.7$361.8
$191.8 $188.6 $181.1 $177.0 $180.7
$698.5 $692.6 $670.2 $707.0 $702.7
Rents and financial expenses$55.8 (9%)
Salaries, wages and benefits$344.5 (57%)
Contracted services$133.8 (22%)
Materials and supplies$65.6 (11%)
Transfer payments$1.7 (1%)
CONSOLIDATED EXPENDITURES BY TYPE(in $millions)
CONSOLIDATED REVENUES BY TYPE(in $millions)
CAPITAL FUND EXPENDITURES BY SERVICE(in $millions)
Equity in income of Enersource Corporation$12.6 (2%)
Property taxation$259.2 (44%)
User charges$143.7 (24%)
Development contributions applied $62.9 (11%)
Investment income $58.1 (10%)
Payments in lieu of taxes $22.1 (4%)
Government grants $11.0 (2%)
Penalties and interest on taxes $7.6 (1%)
Other income $14.4 (2%)
Transportation services$67.9 (50%)
Recreation and cultural,social/family services$43.1 (32%)
General government services $9.8 (7%)
Total Consolidated Expenditures by Type $601.4 (100%)
Total Consolidated Revenues by Type $591.6 (100%)
Total Capital Fund Expenditures by Service $134.9 (100%)
Sick leave benefits $10.0 (2%)
WSIB $16.2 (3%)
Group benefits $3.1 (1%)
Self Insurance claims $23.2 (4%)
Capital revolving fund$176.6 (35%)
Capital construction$129.8 (26%)
Vehicle and equipment replacement $54.1 (11%)
Lot levies $46.8 (9%)
Contributions from developers for specific works $44.3 (9%)
RESERVE FUNDS(in $millions)
Total Reserve Funds $504.1 (100%)
Transit revenue stabilization $1.1 (2%)Arts $0.8 (1%)Other $0.8 (1%)Development revenue $4.8 (9%)
Assessmentappeals
$9.0 (17%)Winter maintenance$7.3 (13%)
Utilities$6.8 (13%)
Laboursettlement$6.0 (11%)
Vacation pay$5.8 (11%)
Contingencies $3.9 (7%)
Planning $4.0 (8%)Elections $1.9 (3%)Legal settlements $2.3 (4%)
Total Reserves $54.5 (100%)
RESERVES(in $millions)
Protection services $6.6 (5%)
Environment services $7.5 (6%)
Planning & developmentservices 13.4 (2%)
Environmental services9.3 (1%)Health/social & familyservices 0.6 (0%)
CONSOLIDATED EXPENDITURES BY SERVICE(in $millions)
Total Consolidated Expenditures by Service $601.4 (100%)
Recreation andcultural services
141.5 (24%)
Transportation services226.3 (38%)
General governmentservices 115.3 (19%)
Protection services95.0 (16%)
$1,331.3
$1,125.2$1,291.7
$1,139.1 $1,168.2
FINANCIAL ASSETS SUMMARY(in $millions)
2007 2006 2005 2004 2003
2007 2006 2005 2004 2003
2007 2006 2005 2004 2003
2007 2006 2005 2004 2003
FINANCIAL LIABILITIES SUMMARY(in $millions)
INVESTMENT INENERSOURCE CORPORATION
(in $millions)
FUND BALANCES(in $millions)
$587.7$538.3
$414.9 $407.7$361.8
$191.8 $188.6 $181.1 $177.0 $180.7
$698.5 $692.6 $670.2 $707.0 $702.7
Rents and financial expenses$55.8 (9%)
Salaries, wages and benefits$344.5 (57%)
Contracted services$133.8 (22%)
Materials and supplies$65.6 (11%)
Transfer payments$1.7 (1%)
CONSOLIDATED EXPENDITURES BY TYPE(in $millions)
CONSOLIDATED REVENUES BY TYPE(in $millions)
CAPITAL FUND EXPENDITURES BY SERVICE(in $millions)
Equity in income of Enersource Corporation$12.6 (2%)
Property taxation$259.2 (44%)
User charges$143.7 (24%)
Development contributions applied $62.9 (11%)
Investment income $58.1 (10%)
Payments in lieu of taxes $22.1 (4%)
Government grants $11.0 (2%)
Penalties and interest on taxes $7.6 (1%)
Other income $14.4 (2%)
Transportation services$67.9 (50%)
Recreation and cultural,social/family services$43.1 (32%)
General government services $9.8 (7%)
Total Consolidated Expenditures by Type $601.4 (100%)
Total Consolidated Revenues by Type $591.6 (100%)
Total Capital Fund Expenditures by Service $134.9 (100%)
Sick leave benefits $10.0 (2%)
WSIB $16.2 (3%)
Group benefits $3.1 (1%)
Self Insurance claims $23.2 (4%)
Capital revolving fund$176.6 (35%)
Capital construction$129.8 (26%)
Vehicle and equipment replacement $54.1 (11%)
Lot levies $46.8 (9%)
Contributions from developers for specific works $44.3 (9%)
RESERVE FUNDS(in $millions)
Total Reserve Funds $504.1 (100%)
Transit revenue stabilization $1.1 (2%)Arts $0.8 (1%)Other $0.8 (1%)Development revenue $4.8 (9%)
Assessmentappeals
$9.0 (17%)Winter maintenance$7.3 (13%)
Utilities$6.8 (13%)
Laboursettlement$6.0 (11%)
Vacation pay$5.8 (11%)
Contingencies $3.9 (7%)
Planning $4.0 (8%)Elections $1.9 (3%)Legal settlements $2.3 (4%)
Total Reserves $54.5 (100%)
RESERVES(in $millions)Protection services $6.6 (5%)
Environment services $7.5 (6%)
Planning & developmentservices 13.4 (2%)
Environmental services9.3 (1%)Health/social & familyservices 0.6 (0%)
CONSOLIDATED EXPENDITURES BY SERVICE(in $millions)
Total Consolidated Expenditures by Service $601.4 (100%)
Recreation andcultural services
141.5 (24%)
Transportation services226.3 (38%)
General governmentservices 115.3 (19%)
Protection services95.0 (16%)
$1,331.3
$1,125.2$1,291.7
$1,139.1 $1,168.2
FINANCIAL ASSETS SUMMARY(in $millions)
2007 2006 2005 2004 2003
2007 2006 2005 2004 2003
2007 2006 2005 2004 2003
2007 2006 2005 2004 2003
FINANCIAL LIABILITIES SUMMARY(in $millions)
INVESTMENT INENERSOURCE CORPORATION
(in $millions)
FUND BALANCES(in $millions)
$587.7$538.3
$414.9 $407.7$361.8
$191.8 $188.6 $181.1 $177.0 $180.7
$698.5 $692.6 $670.2 $707.0 $702.7
Rents and financial expenses$55.8 (9%)
Salaries, wages and benefits$344.5 (57%)
Contracted services$133.8 (22%)
Materials and supplies$65.6 (11%)
Transfer payments$1.7 (1%)
CONSOLIDATED EXPENDITURES BY TYPE(in $millions)
CONSOLIDATED REVENUES BY TYPE(in $millions)
CAPITAL FUND EXPENDITURES BY SERVICE(in $millions)
Equity in income of Enersource Corporation$12.6 (2%)
Property taxation$259.2 (44%)
User charges$143.7 (24%)
Development contributions applied $62.9 (11%)
Investment income $58.1 (10%)
Payments in lieu of taxes $22.1 (4%)
Government grants $11.0 (2%)
Penalties and interest on taxes $7.6 (1%)
Other income $14.4 (2%)
Transportation services$67.9 (50%)
Recreation and cultural,social/family services$43.1 (32%)
General government services $9.8 (7%)
Total Consolidated Expenditures by Type $601.4 (100%)
Total Consolidated Revenues by Type $591.6 (100%)
Total Capital Fund Expenditures by Service $134.9 (100%)
Sick leave benefits $10.0 (2%)
WSIB $16.2 (3%)
Group benefits $3.1 (1%)
Self Insurance claims $23.2 (4%)
Capital revolving fund$176.6 (35%)
Capital construction$129.8 (26%)
Vehicle and equipment replacement $54.1 (11%)
Lot levies $46.8 (9%)
Contributions from developers for specific works $44.3 (9%)
RESERVE FUNDS(in $millions)
Total Reserve Funds $504.1 (100%)
Transit revenue stabilization $1.1 (2%)Arts $0.8 (1%)Other $0.8 (1%)Development revenue $4.8 (9%)
Assessmentappeals
$9.0 (17%)Winter maintenance$7.3 (13%)
Utilities$6.8 (13%)
Laboursettlement$6.0 (11%)
Vacation pay$5.8 (11%)
Contingencies $3.9 (7%)
Planning $4.0 (8%)Elections $1.9 (3%)Legal settlements $2.3 (4%)
Total Reserves $54.5 (100%)
RESERVES(in $millions)
FINANCIAL STATEMENTS SECTION
24 CITY OF MISSISSAUGA
introduction to THe FINaNCIal STaTeMeNTSThe accompanying Consolidated Financial Statements and all other financial information included within this financial report are the responsibility of the management of the City of Mississauga. The City’s Financial Statements contained in this report have been prepared in accordance with the accounting principles and disclosure requirements of the Canadian Institute of Chartered accountants guidelines contained in the Public Sector accounting and auditing Standards Manual.
The Commissioner of Corporate Services and Treasurer is responsible for submitting annually to the audit Committee and Council audited financial statements. These financial statements include the consolidated results of the City of Mississauga for the fiscal year ending December 31, 2007.
Finance staff are responsible for the co-ordination and completion of the annual financial statements in a timely, accurate and efficient manner, as well as providing support and related financial information to external auditors during the year-end audit.
The Consolidated Financial Statements of the City of Mississauga provide important information about the overall financial condition of the City. The purpose of the Consolidated Financial Statements is to present the effects of transactions of the City taking into consideration the accounting for all City Funds and associated City business enterprises.
The audited Consolidated Financial Statements for City operations and the audited Trust Fund Financial Statements include:
cIty FInancIal StatementS:• Auditor’sReport • ConsolidatedStatementofFinancialPosition • ConsolidatedStatementofFinancialActivities • ConsolidatedStatementofChangesinFinancialPosition • NotestotheConsolidatedFinancialStatements • ConsolidatedScheduleofCurrentFundOperations • ConsolidatedScheduleofCapitalFundOperations • ConsolidatedScheduleofReservesandReserveFunds
truSt Fund FInancIal StatementS:• Auditor’sReport • StatementofFinancialActivitiesandChangesinFundBalance • StatementofFinancialPosition • NotestotheFinancialStatements
FINANCIAL REPORT 2007 25
FINANCIAL STATEMENTS SECTION
auDITORS’ rePort
TO THE MEMBErS OF COUnCIl, InHABITAnTS And rATEpAYErS OF THE COrpOrATIOn OF THE CITY OF MISSISSAUGA
We have examined the Consolidated Statement of Financial Position of The Corporation of the City of Mississauga as at December 31, 2007 and Statements of Financial activities and Changes in Financial Position for the year then ended. These financial statements are the responsibility of the Corporation’s management. Our responsibility is to express an opinion on these financial statements based on our audit.
We conducted our audit in accordance with Canadian generally accepted auditing standards. Those standards require that we plan and perform an audit to obtain reasonable assurance whether the financial statements are free of material misstatement. an audit includes examining, on a test basis, evidence supporting the amounts and disclosures in the financial statements. an audit also includes assessing the accounting principles used and significant estimates made by management, as well as evaluating the overall financial statement presentation.
In our opinion, these Consolidated Financial Statements present fairly, in all material respects, the financial position of the City as at December 31, 2007 and the results of its operations and the changes in its financial position for the year then ended in accordance with Canadian generally accepted accounting principles.
Our audit was conducted for the purpose of forming an opinion on the basic financial statements taken as a whole. The current year’s supplementary information included in the schedules is presented for additional analysis and is not a required part of the basic financial statements. Such supplementary information has been subjected to the auditing procedures applied in the audit of the basic financial statements and, in our opinion, is fairly stated, in all material respects, in relation to the basic financial statements taken as a whole.
KPMG llP Chartered accountants
Toronto, Ontario March 7, 2008

FINANCIAL STATEMENTS SECTION
26 CITY OF MISSISSAUGA
COnSOlIdATEd STATEMEnT OF FInAnCIAl pOSITIOn
as at December 31, 2007 2007 2006(All dollar amounts are in $000) $ $
AssetsFinancial AssetsCash and short-term investments $464,210 $488,051Taxes receivable (Note 3) 51,639 59,672accounts receivable 32,899 49,279Investments (Note 4) 590,618 505,971loans receivable 108 107Investment in enersource Corporation (Note 5) 191,848 188,578
Total Financial assets $1,331,322 $1,291,658
Liabilitiesaccounts payable and accrued liabilities 92,883 104,935Deferred revenue - general 5,149 5,668Deferred revenue – obligatory reserve funds (Note 6) 350,031 305,945employee benefits and other liabilities (Note 7) 139,657 121,730
Total liabilities $587,720 $538,278
Net Financial Resources $743,602 $753,380
Other Non-Financial AssetsInventory and prepaids 7,061 6,025
Total Net Assets $750,663 $759,405
Municipal PositionAmounts to be recovered (Note 7)
From reserves and reserve funds on hand (94,797) (87,949)From future revenues (44,860) (33,781)
Total ($139,657) ($121,730)
Fund Balances (Note 8)
Current Fund (See Schedule) 2,623 2,545Capital Fund (See Schedule) 137,221 107,785Reserves (See Schedule) 54,488 53,898Reserve Fund (See Schedule) 504,140 528,329enersource Corporation net equity (Note 5) 191,848 188,578
Total Fund balances $890,320 $881,135
Contingencies (Note9) - -
Total Municipal Position $750,663 $759,405
The accompanying notes are an integral part of these consolidated financial statements

FINANCIAL REPORT 2007 27
FINANCIAL STATEMENTS SECTION
COnSOlIdATEd STATEMEnT OF FInAnCIAl ACTIvITIES
for the year ended December 31, 2007 Budget Actual Actual(All dollar amounts are in $000) 2007 2007 2006
unaudited Note 1(m)
$ $ $
RevenuesProperty taxation 260,417 259,239 249,087Taxation from other governments 22,509 22,086 21,922user charges 144,191 143,699 135,750Government grants 10,640 11,038 19,824Development contributions applied 49,629 62,913 61,226Investment income 40,620 58,142 51,694Penalties and interest on taxes 5,690 7,563 5,841Other 15,145 14,355 9,551equity in income of enersource Corporation (Note 5) - 12,573 15,504
Total Revenues $548,841 $591,608 $570,399
ExpendituresGeneral government services 128,206 115,332 91,485Protection services 94,496 94,992 87,654Transportation services 223,587 226,341 212,329environmental services 11,600 9,301 9,318Health services 74 70 30Social and family services 428 453 419Recreation and cultural services 135,279 141,533 128,440Planning and development services 13,944 13,364 11,552
Total expenditures $607,614 $601,386 $541,227
Increase/(Decrease) in Net Financial Resources ($58,773) ($9,778) $29,172
Increase in amounts to be recovered 17,927 380Increase in non-financial assets 1,036 771
Increase in Fund Balances $9,185 $30,323
The accompanying notes are an integral part of these consolidated financial statements

FINANCIAL STATEMENTS SECTION
28 CITY OF MISSISSAUGA
COnSOlIdATEd STATEMEnT OF CHAnGES In FInAnCIAl pOSITIOn
for the year ended December 31, 2007 2007 2006(All dollar amounts are in $000) $ $
OperationsIncrease/(decrease) in Net Financial Resources (9,778) 29,172equity in income of enersource Corporation which does not involve cash (12,573) (15,504)
($22,351) $13,668
Changes in Non-Cash Working Capital:Increase in taxes receivable 8,033 (8,636)Increase in accounts receivable 16,380 (22,256)Decrease in loans receivable (1) 314Decrease in accounts payable and accrued liabilities (12,052) 34,436Decrease in deferred revenue – general (519) (38)Increase in deferred revenue – obligatory reserve funds 44,086 88,623Increase in employee benefits and other liabilities 17,927 380
Total Changes in Non-Cash Working Capital $73,854 $92,823
Net change in cash from operations $51,503 $106,491
InvestingIncrease in investments (84,647) (47,635)Dividends received from enersource Corporation 9,303 8,010
Net change in cash from investing ($75,344) ($39,625)
Net change in cash and short-term investments ($23,841) $66,866
Opening cash and short-term investments 488,051 421,185
Closing cash and short-term investments $464,210 $488,051
The accompanying notes are an integral part of these consolidated financial statements.

FINANCIAL REPORT 2007 29
FINANCIAL STATEMENTS SECTION
nOTES TO THE COnSOlIdATEd FInAnCIAl STATEMEnTS
for the year ended December 31, 2007 (All dollar amounts are in $000)
The City of Mississauga is a municipality in the Province of Ontario, Canada. It conducts its operations guided by the provisions of provincial statutes such as the Municipal act 2001, Planning act, building Code act, Provincial Offences act and other related legislation.
1. SIGnIFIcant accountInG PolIcIeSThe consolidated financial statements of The Corporation of the City of Mississauga (the “City”) are prepared by management in accordance with generally accepted accounting principles for local governments as recommended by the Public Sector accounting board (PSab) of the Canadian Institute of Chartered accountants (CICa). Significant aspects of the accounting policies adopted by the City are as follows:
a) rePortInG entItyThe consolidated financial statements reflect the assets, liabilities, revenues, expenditures and fund balances of the reporting entity. The reporting entity is comprised of all organizations, committees and local boards accountable for the administration of their financial affairs and resources to the City and which are owned or controlled by the City. These financial statements include:
• CityofMississaugaPublicLibraryBoard • ClarksonBusinessImprovementArea • PortCreditBusinessImprovementArea • StreetsvilleBusinessImprovementArea
Inter-departmental and inter-organizational transactions and balances between these organizations are eliminated.
enersource Corporation is accounted for on a modified equity basis, consistent with the generally accepted accounting treatment for government business enterprises. under the modified equity basis, the business enterprise’s accounting principles are not adjusted to conform with those of the City, and inter-organizational transactions and balances are not eliminated.
B) Fund accountInGFunds within the consolidated financial statements consist of current, capital and reserve funds. Transfers between funds are recorded as adjustments to the appropriate municipal fund balance.
Trust funds and their related operations administered by the City are not included in these financial statements but are reported separately on the Trust Funds Financial Statements.
c) BaSIS oF accountInGSources of financing and expenditures are reported on the accrual basis of accounting.
Theaccrualbasisofaccountingrecognizesrevenuesastheybecomemeasurable;expendituresarethecostofgoodsand services acquired in the period whether or not payment has been made or invoices received.
d) caPItal aSSetSexpenditures on capital assets are reported as expenditures on the statement of financial activities in the period incurred.
e) reServeS and reServe FundSCertain amounts, as approved by City Council, are set aside in reserves and reserve funds for future operating and capital purposes. Transfers to and/or from reserves and reserve funds are an adjustment to the respective fund when approved.
F) Government tranSFerSGovernment transfers are recognized in the financial statements in the period in which the events giving rise to the transfer occur, providing the transfers are authorized, any eligibility criteria have been met, and reasonable estimates of the amounts can be made.

FINANCIAL STATEMENTS SECTION
30 CITY OF MISSISSAUGA
G) deFerred revenue - GeneralThe City defers recognition of user charges and fees which have been collected but for which the related services have yet to be performed. These amounts will be recognized as revenues in the fiscal year the services are performed.
H) deFerred revenue – oBlIGatory reServe FundSThe City receives funding from various agreements under the authority of provincial legislation, federal legislation and City by-laws. These funds include: development charge contributions, payments in lieu of parkland, public transit funds, and gasoline tax. by their very nature, these funds are restricted in their use, and until applied to qualifying capital projects are recorded as deferred revenue.
I) taXatIon and related revenueSProperty tax billings are prepared by the City based on assessment rolls issued by the Municipal Property assessment Corporation (MPaC) based upon Current Value assessment (CVa). Tax rates are established annually by City Council, incorporating amounts to be raised for local services and the requisition made by the Region of Peel in respect of regional services. The City is required to collect education taxes on behalf of the Province of Ontario. a mandatory property tax mitigation process exists in Ontario whereby Commercial, Industrial and Multi-Residential property tax increases are capped at the greater of 10 per cent of the previous year’s actual taxes and 5 per cent of the previous year’s actual CVa taxes. The cap is funded through a clawback of reassessment related tax decreases in these property classes. a normal part of the assessment process is the issue of supplementary assessment rolls which provide updated information with respect to changes in property assessment. Once a supplementary assessment roll is received, the City determines the taxes applicable and renders supplementary tax billings. Taxation revenues are recorded at the time tax billings are issued. assessments and the related property taxes are subject to appeal. Tax adjustments as a result of appeals are recorded when the result of the appeal process is known.
The City is entitled to collect interest and penalties on overdue taxes. These revenues are recorded in the period the interest and penalties are levied.
J) InveStmentSInvestments are reported at the lesser of cost or market value. any premium or discount at purchase of an investment is amortized over the life of the investment.
k) InveStment IncomeInvestment income earned on surplus current funds, capital funds, reserves and reserve funds (other than obligatory reserve funds) are reported as revenue in the period earned. Investment income earned on obligatory reserve funds is added to the fund balance and forms part of respective deferred revenue balances.
l) PenSIonS and emPloyee BeneFItSThe City accounts for its participation in the Ontario Municipal employee Retirement System (OMeRS), a multi-employer public sector pension fund, as a defined benefit plan. Vacation entitlements are accrued for as entitlements are earned. Sick leave benefits are accrued where they are vested and subject to pay out when an employee leaves the City’s employment. Other post-employment benefits and compensated absences are accrued in accordance with the projected benefit method prorated on service and management’s best estimate of salary escalation and retirement ages of employees. actuarial valuations, where necessary for accounting purposes, are performed triennially. The discount rate used to determine the accrued benefit obligation was determined by reference to market interest rates at the measurement date on high-quality debt instruments with cash flows that match the timing and amount of expected benefit payments. unamortized actuarial gains or losses are amortized on a straight line basis over the expected average remaining service life of the related employee groups. unamortized actuarial gains/losses for event-triggered liabilities, such as those determined as claims related to Workplace Safety and Insurance board (WSIb) are amortized over the average expected period during which the benefits will be paid.
Costs related to prior period employee services arising out of plan amendments are recognized in the period in which the plan is amended.
Where applicable, the City has set aside Reserve Funds intended to fund these obligations, either in full or in part. These Reserve Funds were created under municipal by-law and do not meet the definition of a plan asset under CICa PS 3250 Retirement benefits. Therefore, for the purposes of these financial statements, the plans are considered unfunded.

FINANCIAL REPORT 2007 31
FINANCIAL STATEMENTS SECTION
m) BudGet FIGureSMississauga City Council reviews and approves its capital and operating budgets each year. both budgets are reflected in the Consolidated Statement of Financial activities.
The operating budget is based on projected operating expenditures to be incurred during the current year.
The capital budget is established in a different format from the operating budget. The capital budget is based on an annualized capital cash flow.
The Reserves and Reserve Fund budget is not formally prepared and approved by Council. To comply with financial reporting requirements for consolidation purposes, a budget is based on an annualized reserve cash flow.
n) uSe oF eStImateSThe preparation of financial statements in conformity with generally accepted accounting principles requires management to make estimates and assumptions that affect the reported amounts of assets and liabilities and disclosure of contingent assets and liabilities at the date of the financial statements, and the reported amounts of revenues and expenditures during the period. actual results could differ from these estimates.
2. oPeratIonS oF tHe reGIon oF Peel and ScHool BoardSDuring 2007, the City has made property tax transfers to the Region of Peel and school boards. The amounts collected and remitted are summarized below:
School Boards Region$ $
Property taxes 481,326 431,037Taxation from other governments 126 7,904
Amounts transferred $481,452 $438,941
3. taXeS receIvaBleTaxesreceivableof$51,639(2006$59,672)reportedontheConsolidatedStatementofFinancialPositionincludes$4,105 (2006 $26,463) of supplementary taxes recorded in 2007 but not collectable until 2008.
4. InveStmentSThe investments have a market value of $622,684 (2006 $538,721) at the end of the year.

FINANCIAL STATEMENTS SECTION
32 CITY OF MISSISSAUGA
5. InveStment In enerSource corPoratIonTheCityhasa90percentinterestinEnersourceCorporation.Thefollowingtableprovidescondensedfinancial information in respect of enersource Corporation for its 2007 fiscal year together with comparative figures for year 2006.
2007 2006Financial Position: $ $
Current assets 183,419 178,624Capital assets 413,980 399,465assets held for sale - -Deferred charges and other assets 30,693 35,700
Total assets $628,092 $613,789
Current liabilities 100,944 91,546long-term liabilities 313,508 312,518
Total liabilities $414,452 $404,064
Non-controlling interest 475 194
Shareholders’ Equity $213,165 $209,531
City share of net assets (90 per cent ownership) $191,848 $188,578
Results of operations:Revenues 700,076 683,482expenses 676,882 660,234
Income before the undernoted $23,194 $23,248
amounts in lieu of income taxes 10,188 9,938Income from discontinued operations 964 3,916
Net income $13,970 $17,226
City share of net income (90 per cent ownership) $12,573 $15,504
Duringtheyear,theCityofMississaugareceivedadividendof$9,303(2006$8,010)issuedbyEnersource Corporation.TheCityhasanoptionitmayexercisebetweenJuly1,2008andDecember31,2008tosellits interest to the minority shareholder.
The City’s investment in enersource Corporation is reflected in the following table for its 2007 fiscal year together with comparative figures for 2006.
2007 2006Investment in Enersource Corporation: $ $
Opening balance, beginning of year 188,578 181,084City’s share of net income 12,573 15,504City’s share of dividend issued (9,303) (8,010)
Closing balance, end of year $191,848 $188,578

FINANCIAL REPORT 2007 33
FINANCIAL STATEMENTS SECTION
6. deFerred revenue – oBlIGatory reServe FundSa requirement of the public sector accounting principles of the CICa is that obligatory reserve funds be reported as deferred revenue. This requirement is in place as provincial legislation restricts how these funds may be used. The balances in the obligatory reserve funds of the City are summarized below:
2007 2006$ $
Development charges 162,496 157,516Parkland 48,946 38,800
Sub-total $211,442 $196,316
Provincial public transit funds 71,506 68,187Federal public transit funds 20,967 6,012
Sub-total $92,473 $74,199
Provincial gasoline tax 18,608 11,346Federal gasoline tax 27,508 24,084
Sub-total $46,116 $35,430
Total Obligatory Reserve Funds $350,031 $305,945
7. emPloyee BeneFItS and otHer lIaBIlItIeSThe City provides certain employee benefits and other liabilities which will require funding in future periods. Please refer to the summary below:
2007 2006$ $
Future payments required to WSIb 12,971 8,973accumulated Sick leave benefit Plan entitlements 9,450 9,713early retirement benefits 27,208 25,316Post employment benefits 4,864 -Vacation pay 16,120 14,785Developer contribution credits 41,187 40,860Other liabilities 27,857 22,083
Total Employee Benefits and Other Liabilities $139,657 $121,730
less: Recoverable from Reserves and Reserve Funds on hand 94,797 87,949
Amount to be funded from future revenues $44,860 $33,781
(i) WSIb: The City has elected to be a Schedule 2 employer under the provisions of the Workplace Safety and Insurance board act, and as such remits payments to the WSIb only as required to fund disability payments. a full actuarial study ofthisobligationwascompletedinJanuary2008,inaccordancewiththefinancialreportingguidelinesestablishedbythe Public Sector accounting board of the CICa (section PS 3255).
(ii) accumulated sick leave benefits accrue to certain employees of the City and are paid out either on approved retirement, or upon termination or death. The accrued benefit obligation and the net periodic benefit cost were determined by an actuarialvaluationcompletedinJanuary2008,inaccordancewiththefinancialreportingguidelinesestablishedbythePublic Sector accounting board of the CICa (section PS 3250).

FINANCIAL STATEMENTS SECTION
34 CITY OF MISSISSAUGA
(iii) early retirement benefits are representative of the City’s share of the cost to provide certain employees with extended benefits upon early retirement. The accrued benefit obligation and the net periodic benefit cost were determined by an actuarialvaluationcompletedinJanuary2008,inaccordancewiththefinancialreportingguidelinesestablishedbythePublic Sector accounting board of the CICa (section PS 3250).
(iv) Post employment benefits are paid on behalf on any employee on long-term disability. The accrued benefit obligation andthenetperiodiccostweredeterminedbyanactuarialvaluationcompletedinJanuary2008,inaccordancewiththe financial reporting guidelines established by the Public Sector accounting board of the CICa (section PS3250). Information about liabilities for defined benefit plans is as follows:
2007 2006
WSIB Sick Leave Early Retirement Post Employment Total Total
Accrued benefit obligation, beginning of year
$ $ $ $ $ $
$8,973 $9,713 $25,316 - $44,002 $41,798
Increase due to plan amendment 2,750 - - 4,714 7,464 -Service cost 1,743 759 1,549 634 4,685 2,891Interest cost 719 581 1,505 232 3,037 2,514amortization of actuarial (gain)/loss 184 1 (114) - 71 71benefit payments (1,398) (1,604) (1,048) (716) (4,766) (3,272)
Accrued benefit obligation, end of year $12,971 $9,450 $27,208 $4,864 $54,493 $44,002
unamortized actuarial (gain)/loss 449 3,345 3,301 - 7,095 226
actuarial valuation, end of year $13,420 $12,795 $30,509 $4,864 $61,588 $44,228
expected average remaining service life 8 yrs 14 yrs 11 yrs n/a n/a n/a
The actuarial valuations of the plans were based upon a number of assumptions about future events, which reflect management’s best estimates. The following represents the more significant assumptions made:
WSIB Sick Leave Post Employment Early Retirementexpected inflation rate 2.50% 2.50% 2.50% 2.50%expected level of salary increases n/a 3.50% 3.50% 3.50%Interest discount rate 6.00% 6.00% 4.65% 5.00%
(v) Developer charge credits are liabilities and obligations that arise through the Development Charges act. The year 2007 developer charge credit liability is $41,187 (2006 $40,860).
8. munIcIPal Fund BalanceS at tHe end oF tHe yearThe City’s fund balances are comprised of the following:
2007 2006$ $
For general reduction of taxation:City 2,557 2,168library board (15) 301
Sub-total $2,542 $2,469
For specific reduction of taxation:business Improvement areas 81 76
Total $2,623 $2,545
Other Fund Balances:Capital Fund 137,221 107,785Reserves 54,488 53,898Reserve Funds 504,140 528,329enersource Corporation net equity 191,848 188,578
Total $890,320 $881,135

FINANCIAL REPORT 2007 35
FINANCIAL STATEMENTS SECTION
9. contInGencIeSas at December 31, 2007, the City has been named as defendant or co-defendant in a number of outstanding legal actions. No provision has been made for any claims that are expected to be covered by insurance or where the consequences are undeterminable. Where the claims are not expected to be covered by insurance and where management has assessed the likelihood of exposure as being more likely than not and is able to reasonably assess the exposure, an amount is provided for in these financial statements.
10. eXPendItureS By oBJectThe following is a summary of the expenditures reported on the Consolidated Statement of Financial activities by object:
Budget Actual Actual2007 2007 2006
unaudited
$ $ $
Salaries, wages and fringe benefits 349,386 344,480 304,052Materials and supplies 76,913 65,558 72,263Contracted services 121,836 133,830 108,375Rents and financial expenses 56,917 55,761 54,427Transfer payments 2,562 1,757 2,110
Total Expenditures $607,614 $601,386 $541,227
11. PenSIon aGreementSThe City makes contributions to the Ontario Municipal employees Retirement System (OMeRS), which is a multi-employer plan, on behalf of all permanent, full-time members of its staff. The plan is a defined benefit plan which specifies the amount of the retirement benefit to be received by the employees based on the length of service and rates of pay. In 2007,Citycontributionstotalled$18,011(2006$17,019)andemployeecontributionstotalled$18,012(2006$17,021).
12. truSt FundSTrust funds administered by the City amounting to $555 (2006 $414) are presented in a separate financial statement of trust fund balances and operations. as such balances are held in trust by the City for the benefit of others, they are not presented as part of the City’s financial position or financial activities.
13. ProvIncIal oFFenceS admInIStratIonThe Ministry of the attorney General requires all municipal partners administering Provincial Offences administration to disclose in the year-end audited financial statements a note on the gross and net provincial offence revenues earned. The following table provides condensed financial information required by the terms in the Memorandum of understanding for its 2007 fiscal year with comparative figures for the year 2006:
2007 2006Revenues $ $Gross revenues 6,807 6,948less refunds 83 74
Net revenues $6,724 $6,874
ExpendituresProvincial charges 523 484City operating expenses 3,044 3,205
Total expenditures $3,567 $3,689
Net Revenue 3,157 3,185
Repayment to Capital Revolving Fund 478 599
Net Contribution $2,679 $2,586

FINANCIAL STATEMENTS SECTION
36 CITY OF MISSISSAUGA
14. tanGIBle caPItal aSSetSTangible capital assets are non-financial (i.e. real) assets that are generally not available to the City for use in discharging its existing liabilities and are held for use in the provision of services. These assets are significant economic resources that are not intended for sale in the ordinary course of business and have an estimated useful life that extends beyond the current year. examples include roads, sidewalks, sewers, buildings, libraries, parks, land, etc.
tranSItIonal ProvISIonSEffectiveJanuary1,2007,theCityofMississaugaadoptedPublicSectorGuideline7(PSG-7)ofthePublicSectoraccounting Handbook of the Canadian Institute of Chartered accountants with respect to the disclosure of tangible capital assets of local governments. PSG-7 provides transitional guidance on presenting information related to tangible capital assets by way of a note to the financial statements until Section 3150 – Tangible Capital assets comes into effectonJanuary1,2009.Theseprovisionsrequirelocalgovernmentstoreportandcapitalizetangiblecapitalassets at historical cost and amortize these assets over their estimated useful life.
During 2007, the City of Mississauga has worked towards compliance with the new legislation. as at December 31, 2007, the municipality has obtained a complete listing of all land, building, vehicle and furniture inventories with valuation of these assets in progress. Work has also begun on establishing policies relating to Tangible Capital asset reporting, including asset classifications, useful life and depreciation methods. The asset categories, estimated useful lives and future significant accounting policies are as follows:
aSSet claSSIFIcatIon Useful Life (Years)
land Infiniteland Improvements 15buildings 20 - 40Vehicles 10 - 20equipment 3 - 40Roads, bridges and Sidewalks 15 - 100Storm Drainage 25 - 100
amortIzatIonTangible capital assets are recorded at historic cost which includes all amounts that are directly attributable to acquisition, construction, development or betterment of the asset. Where historic cost is not available, the City has developed estimation techniques to determine cost. The cost, less residual value, of the tangible capital assets is amortized on a straight-line basis over the above noted useful lives. The only exception, per the above, is for land, which is considered to have an infinite life. assets under construction are not amortized until the asset is available for productive use. Gains and/or losses on the disposal of an asset will be recorded on the Statement of Operations as “Gain/loss on Disposal of assets”.
contrIButIonS oF tanGIBle caPItal aSSetSTangible capital assets received as contributions are recorded at their fair market value at the date of receipt and are also recorded as revenue.
leaSed aSSetSleases are classified as either operating or capital leases. lease agreements which substantially transfer all the risks and rewards of ownership to the City are accounted for as a capital lease. all other leases are considered operating leases and the related payments are charged to operating expenses as incurred.
WORksOFARtAndHistORiCALtREAsuREsThe City of Mississauga owns both works of art and historical treasures at various Mississauga-owned facilities such as benares/bradley Museums and the Mississauga art Gallery. These assets are deemed worthy of preservation because of the social rather than financial benefits they provide to the community. The historic cost of the art and treasures is neitherdeterminablenorrelevantinitssignificance;hence,avaluationisneitherassignedtotheseassetsnordisclosedin the consolidated financial statements
15. comParatIve FIGureSCertain 2006 comparative figures have been reclassified to conform with the financial statement presentation adopted in the current year.

FINANCIAL REPORT 2007 37
FINANCIAL STATEMENTS SECTION
COnSOlIdATEd SCHEdUlE OF CUrrEnT FUnd OpErATIOnS
for the year ended December 31, 2007 (All dollar amounts are in $000)
2007 2007 2006Budget Actual Actualunaudited
$ $ $
RevenuesProperty taxation 260,417 259,239 249,087Taxation from other governments 22,509 22,086 21,922user charges 144,191 143,699 135,750Government grants 2,083 2,481 2,351Investment income 11,203 14,806 14,066Penalties and interest on taxes 5,690 7,563 5,841Other 7,465 7,432 7,437
Total Revenues $453,558 $457,306 $436,454
ExpendituresGeneral government services 123,253 105,516 81,195Protection services 89,472 88,423 85,106Transportation services 158,306 158,393 139,239environmental services 1,419 1,823 2,347Health services 74 70 30Social and family services 370 401 357Recreation and cultural services 91,269 98,489 92,787Planning and development services 13,944 13,364 11,552
Total Expenditures $478,107 $466,479 $412,613
Net Revenue/(Expense) ($24,549) ($9,173) $23,841
Financing and Transfers
Dividends received from enersource 8,000 9,303 8,010
Transfers to reserves and reserve funds (4,914) (19,015) (33,036)
Net Financing and Transfers ($3,086) ($9,712) ($25,026)
Increase in amounts to be recovered 17,927 17,927 380
Increase in inventory/prepaids 1,036 1,036 771
Change in Current Fund Balance ($2,500) $78 ($34)
Opening Current Fund balance 2,500 2,545 2,579
Closing Current Fund Balance - $2,623 $2,545

FINANCIAL STATEMENTS SECTION
38 CITY OF MISSISSAUGA
COnSOlIdATEd SCHEdUlE OF CApITAl FUnd OpErATIOnS
for the year ended December 31, 2007 (All dollar amounts are in $000)
2007 2007 2006Budget Actual Actualunaudited
$ $ $
RevenuesDevelopment contributions applied 49,629 62,913 61,226Other 7,680 6,985 4,970Government grants 2,625 2,625 17,473
Total Revenues $59,934 $72,523 $83,669
ExpendituresGeneral government services 4,953 9,816 10,290Protection services 5,024 6,569 2,548Transportation services 65,281 67,948 73,090environmental services 10,181 7,478 6,971Social and family services 58 52 62Recreation and cultural services 44,010 43,044 35,653
Total Expenditures $129,507 $134,907 $128,614
Net Expenditures ($69,573) ($62,384) ($44,945)
Financing and Transfers
Transfers from reserve funds 108,815 91,820 80,904
Change in Capital Fund Balance $39,242 $29,436 $35,959
Opening Capital Fund balance 107,785 107,785 71,826
Closing Capital Fund Balance $147,027 $137,221 $107,785

FINANCIAL REPORT 2007 39
FINANCIAL STATEMENTS SECTION
COnSOlIdATEd SCHEdUlE OF rESErvES And rESErvE FUndS
for the year ended December 31, 2007 (All dollar amounts are in $000)
2007 2007 2006Budget Actual Actualunaudited
Net Revenues $ $ $
Government grants 5,932 5,932 -Investment income 29,417 43,336 37,628Other revenue/(expense) - (62) (2,856)
Total Net Revenues $35,349 $49,206 $34,772
Net Transfers from/(to) other fundsTransfers from Current Fund 4,914 19,015 33,036Transfers to Capital Fund (108,815) (91,820) (80,904)
Total Net Transfers ($103,901) ($72,805) ($47,868)
Change in Reserves and Reserve Fund Balances ($68,552) ($23,599) ($13,096)
Opening balance 582,227 582,227 595,323
Ending Balance $513,675 $558,628 $582,227
Analyzed as follows:
Reserves set aside for specific purposes:Development revenue 4,781 5,130assessment appeals 8,968 9,337Vacation pay 5,820 5,820Contingencies 3,869 4,139labour settlements 5,956 5,956Planning process update 4,048 3,072Transit revenue stabilization 1,078 1,079legal settlements 2,304 2,784Winter maintenance 7,313 7,313elections 1,914 1,464Commitments 327 502early retirement benefits 500 500arts 807 -Other 25 25utilities 6,778 6,777
Total Reserves $54,488 $53,898
Reserve Funds set aside for specific purposes by Council:lot levies 46,816 46,334Contributions from developers for specific works 44,348 41,658Vehicle and equipment replacement 54,123 46,516Capital construction 129,776 180,356Capital revolving fund 176,599 164,714Self insurance 23,194 21,449Group benefits 3,111 2,932WSIb 16,166 14,240Sick-leave benefits 10,007 10,130
Total Reserve Funds $504,140 $528,329
Total Reserves and Reserve Funds $558,628 $582,227

FINANCIAL STATEMENTS SECTION
40 CITY OF MISSISSAUGA
auDITORS’ rePort
TO THE MEMBErS OF COUnCIl, InHABITAnTS And rATEpAYErSOF THE COrpOrATIOn OF THE CITY OF MISSISSAUGA
We have audited the statement of financial position of the Trust Funds of The Corporation of the City of Mississauga as at December 31, 2007 and the statement of financial activities and changes in fund balances for the year then ended. These financial statements are the responsibility of the Corporation’s management. Our responsibility is to express an opinion on these financial statements based on our audit.
We conducted our audit in accordance with Canadian generally accepted auditing standards. Those standards require that we plan and perform an audit to obtain reasonable assurance whether the financial statements are free of material misstatement. an audit includes examining, on a test basis, evidence supporting the amounts and disclosures in the financial statements. an audit also includes assessing the accounting principles used and significant estimates made by management, as well as evaluating the overall financial statement presentation.
In our opinion, these financial statements present fairly, in all material respects, the financial position of the trust funds of the City as at December 31, 2007 and the continuity of trust funds for the year then ended in accordance with Canadian generally accepted accounting principles.
KPMG llP Chartered accountants
Toronto, Ontario March 7, 2008
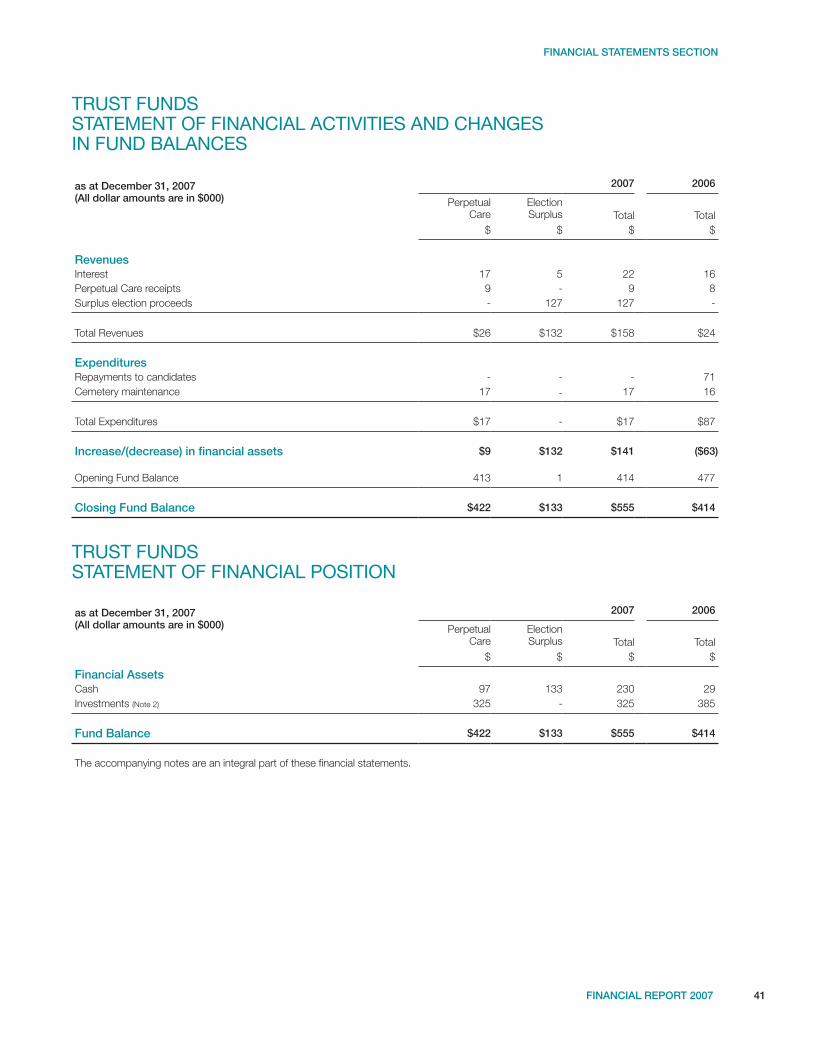
FINANCIAL REPORT 2007 41
FINANCIAL STATEMENTS SECTION
TrUST FUndS STATEMEnT OF FInAnCIAl ACTIvITIES And CHAnGES In FUnd BAlAnCES
as at December 31, 2007 (All dollar amounts are in $000)
2007 2006
Perpetual Care
election Surplus Total Total
$ $ $ $
RevenuesInterest 17 5 22 16Perpetual Care receipts 9 - 9 8Surplus election proceeds - 127 127 -
Total Revenues $26 $132 $158 $24
ExpendituresRepayments to candidates - - - 71Cemetery maintenance 17 - 17 16
Total expenditures $17 - $17 $87
Increase/(decrease) in financial assets $9 $132 $141 ($63)
Opening Fund balance 413 1 414 477
Closing Fund Balance $422 $133 $555 $414
TrUST FUndSSTATEMEnT OF FInAnCIAl pOSITIOn
as at December 31, 2007 (All dollar amounts are in $000)
2007 2006
Perpetual Care
election Surplus Total Total
$ $ $ $
Financial AssetsCash 97 133 230 29Investments (Note 2) 325 - 325 385
Fund Balance $422 $133 $555 $414
The accompanying notes are an integral part of these financial statements.

FINANCIAL STATEMENTS SECTION
42 CITY OF MISSISSAUGA
TrUST FUndS nOTES TO THE FInAnCIAl STATEMEnTS
for the year ended December 31, 2007 (All dollar amounts are in $000)
1. SIGnIFIcant accountInG PolIcIeSBasis of accounting
Perpetual Care receipts are reported on the cash basis of accounting and interest income is reported on the accrual basis of accounting.
expenditures are reported on the cash basis of accounting with the exception of administrative expenses which are reported on the accrual basis of accounting, which recognizes expenditures as they are incurred and measurable as a result of the receipt of goods or services and the creation of a legal obligation to pay.
2. InveStmentSThe total investments by the Trust Fund of $325 (2006 $385) reported on the Statement of Financial Position at cost, have a market value of $325 (2006 $383) at the end of the year.
3. PerPetual care FundThe Perpetual Care Fund administered by the City is funded by the sale of cemetery plots. These funds are invested and earnings derived therefrom are used to perform perpetual care maintenance to the municipality’s cemeteries. The operations and investments of the Fund are undertaken by the City in accordance with the regulations of the Cemeteries act.
4. electIon SurPluS FundTheElectionSurplusFund,asperS.79(8)ofthe1996MunicipalElectionsAct,statesthatifinthenextregularelectionor in an earlier by-election, the candidate is nominated for an office on the same council, the Clerk shall pay the amount heldintrusttothecandidate,withinterest.In2007,$127(2006$0)wasaddedtothefund.AsperS.79(9),ifsubsection(8) does not apply, the amount becomes the property of the municipality.

FINANCIAL REPORT 2007 43
STATISTICAL SECTION
FINANCIAL REPORT 2007 43
YEAr 2007STaTISTICS
•FiveYearFinancialReview
•10LargestCorporatePropertyTaxpayers

STATISTICAL SECTION
44 CITY OF MISSISSAUGA
FIvE-YEAr FInAnCIAl rEvIEw
(all dollar amounts are in $000 except per capita figures.) unaudited
Fiscal Year 2007 2006 2005 2004 2003
Municipality StatisticsPopulation 709,250 704,000 697,000 689,000 679,000area in acres 70,500 70,500 70,500 70,500 70,500Households 224,700 220,000 218,000 214,000 209,000
Employees:full time 3,872 3,763 3,452 3,380 3,294per 1000 people 5.5 5.3 5.0 4.9 4.9part time 2,783 3,168 3,180 2,971 2,767Construction activity $1,199,184 $1,052,760 $1,104,789 $1,385,657 $1,506,898
Tax Assessment InformationAssessment Valuation Year 2005 2005 2003 2003 2001
Taxable Assessment upon which the year’s rates of taxation were set:Residential, farm, multi-residential $61,568,791 $60,579,487 $53,557,080 $52,048,099 $44,264,794Commercial, industrial and other 20,099,979 19,759,296 17,246,701 16,977,633 15,804,946
Total Taxable Assessment $81,668,770 $80,338,783 $70,803,781 $69,025,732 $60,069,740
Commercial, industrial, and business as a percentage of taxable assessment
24.6% 24.6% 24.4% 24.6% 26.3%
Tax Rate Information: (per $ of assessed value)
Residential and farmfor City purposes 0.276312% 0.263908% 0.277827% 0.262596% 0.287885%for Region purposes 0.462209% 0.444471% 0.479680% 0.466669% 0.510987%for School purposes 0.264000% 0.264000% 0.296000% 0.296000% 0.335000%
Total Tax Rate - Residential and farm 1.002521% 0.972379% 1.053507% 1.025265% 1.133872%
Commercialfor City purposes 0.389549% 0.372062% 0.391327% 0.369875% 0.373416%for Region purposes 0.651630% 0.626623% 0.675644% 0.657318% 0.662801%for School purposes 1.553938% 1.553938% 1.737545% 1.737545% 1.825042%
Total Tax Rate - Commercial 2.595117% 2.552623% 2.804516% 2.764738% 2.861259%
Industrialfor City purposes 0.434021% 0.414537% 0.432778% 0.409053% 0.423191%for Region purposes 0.726020% 0.698159% 0.747210% 0.726943% 0.751151%for School purposes 1.781118% 1.781118% 1.984482% 1.984482% 2.151155%
Total Tax Rate - Industrial 2.941159% 2.893814% 3.164470% 3.120478% 3.325497%

FINANCIAL REPORT 2007 45
STATISTICAL SECTION
FIvE-YEAr FInAnCIAl rEvIEw
(all dollar amounts are in $000 except per capita figures.) unaudited
Fiscal Year 2007 2006 2005 2004 2003
Property Tax Information:Tax Levies:City portion $259,238 $249,087 $229,195 $211,760 $202,125Region portion 431,037 417,213 392,090 372,992 356,201
School board portion 481,326 492,348 471,702 455,888 461,660
Total Tax Levies $1,171,601 $1,158,648 $1,092,987 $1,040,640 $1,019,986
Taxes collected:City collection $255,320 $218,248 $189,955 $209,110 $172,034Taxes transferred to the Region 431,037 417,213 392,090 372,992 356,201
Taxes transferred to the School boards 481,326 492,348 471,702 455,888 461,660
Total Taxes collected $1,167,683 $1,127,809 $1,053,747 $1,037,990 $989,895
Tax arrears:Taxes receivable $51,639 $59,672 $51,036 $60,191 $91,059Taxes receivable per capita $73 $84 $73 $87 $134Percentage of current levy 4.4% 5.1% 4.7% 5.8% 8.9%
Consolidated Revenues: Property taxation $259,239 $249,087 $229,195 $211,760 $202,125Taxation from other governments 22,086 21,922 23,068 24,097 25,370user charges 143,699 135,750 128,569 124,002 115,641Government grants 11,038 19,824 6,795 10,561 2,280Development contributions applied 62,913 61,226 31,979 24,345 33,744Investment income 58,142 51,694 43,875 42,229 43,212Penalties and interest on taxes 7,563 5,841 3,701 8,169 8,392Other 14,355 9,551 15,856 13,087 22,044
equity in income of enersource Corporation 12,573 15,504 12,078 10,486 6,864
Total Revenues $591,608 $570,399 $495,116 $468,736 $459,672Revenue per capita $837 $810 $710 $680 $677
Consolidated expenditures by function:Current FundGeneral government services $105,516 $81,195 $89,078 $91,288 $91,543Protection services 88,423 85,106 76,857 72,864 66,116Transportation services 158,393 139,239 136,622 126,803 114,269environmental services 1,823 2,347 1,998 2,233 1,927Health services 70 30 38 53 39Social and family services 401 357 349 310 256Recreation and cultural services 98,489 92,787 79,196 73,504 68,073
Planning and development services 13,364 11,552 10, 603 10,895 10,213
Total Current Fund Expenditures $466,479 $412,613 $394,741 $377,950 $352,436
Capital FundGeneral government services 9,816 10,290 6,824 16,539 7,947Protection services 6,569 2,548 14,198 1,232 2,912Transportation services 67,948 73,090 82,045 36,576 59,417environmental services 7,478 6,971 2,934 1,725 6,256Social and family services 52 62 1 13 14
Recreation and cultural services 43,044 35,653 30,719 37,560 54,148
Total Capital Fund Expenditures $134,907 $128,614 $136,721 $93,645 $130,694
Total Consolidated Expenditures $601,386 $541,227 $531,462 $471,595 $483,130

STATISTICAL SECTION
46 CITY OF MISSISSAUGA
FIvE-YEAr FInAnCIAl rEvIEw
(all dollar amounts are in $000 except per capita figures.) unaudited
Fiscal Year 2007 2006 2005 2004 2003
Capital Fund Information:Capital FinancingDevelopment contributions applied $62,913 $61,226 $31,979 $24,345 $33,744Government grants 2,625 17,473 4,460 6,300 0Other 6,985 4,970 4,705 4,551 3,112
Total Capital Financing $72,523 $83,669 $41,144 $35,196 $36,856
Capital Fund Expenditures 134,907 128,614 136,721 93,645 130,694
Net Capital Financing/(Expenditures) ($62,384) ($44,945) ($95,577) ($58,449) ($93,838)
Transfers from Reserve Funds 91,820 80,904 72,649 85,528 87,027Previous Year unexpended Capital Financing 107,785 71,826 94,754 67,675 74,486
Current Year Unexpended Capital Financing $137,221 $107,785 $71,826 $94,754 $67,675
Expenditures By Object:Consolidated Current FundSalary, wages and fringe benefits $342,023 $301,853 $281,543 $265,999 $248,049Net long-term debt charges (interest) - - - - -Net long-term debt charges (principal) - - - - 9Materials and supplies 42,438 37,276 36,491 33,163 32,498Contracted services 36,670 28,691 32,318 30,415 28,492Rents and financial expenses 43,591 42,683 41,232 45,281 40,472Transfer payments 1,757 2,110 3,157 3,092 2,916
Total Current Fund Expenditures $466,479 $412,613 $394,741 $377,950 $352,436
Capital FundSalary, wages and fringe benefits $2,457 $2,199 $2,381 $2,188 $1,967Materials and supplies 23,120 34,987 33,356 8,512 28,924Contracted services 97,160 79,684 85,174 60,488 82,337Rents and financial expenses 12,170 11,744 15,810 22,457 17,466Transfer payments - - - - -
Total Capital Fund Expenditures $134,907 $128,614 $136,721 $93,645 $130,694
Total Consolidated Expenditures $601,386 $541,227 $531,462 $471,595 $483,130
Municipal Debt Information:Long-Term LiabilitiesGeneral municipal activities - - - - -Per capita - - - - -
Charges for Long-Term LiabilitiesGeneral municipal activities - - - - -Per capita - - - - -Debt Repayment Limit $101,615 $97,089 $88,911 $81,808 $83,713(as determined by the Province of Ontario)
Fund Balances:Operating Fund $2,623 $2,545 $2,579 $2,621 $3,185Reserves 54,488 53,898 47,933 46,470 48,987Reserve Funds 504,140 528,329 547,390 562,749 582,495Capital Fund 137,221 107,785 71,826 94,754 67,675Trust Funds 555 414 477 443 368Investment in enersource Corporation 191,848 188,578 181,084 177,016 180,698

FINANCIAL REPORT 2007 47
STATISTICAL SECTION
10 larGest CORPORaTe PROPeRTY TaxPaYeRSOwner Assessment Value $
1 OMeRS Realty Management $505,867,000
2 The erin Mills Town Centre $178,113,000
3 3536785 Canada Inc. $160,650,000
4 Mississauga Complex $118,239,000
5 Nuance Group (Canada) Inc. $94,085,000
6 Metrus Central Properties $79,703,000
7 Ivanhoe Cambridge I Inc. $78,875,000
8 Orlando Corporation $72,401,000
9 GlaxoSmithKline Inc. $70,382,000
10 First Capital (Meadowvale) $68,507,000
Top Ten - Assessment Total $1,426,822,000
% of Total Industrial and Commercial Assessment 7.1%
% of Total Taxable Assessment 1.7%
Total Residential assessment $61,568,791,015
Total Industrial and Commercial assessment $20,099,979,079
Total Taxable Assessment $81,668,770,094

STATISTICAL SECTION
contact InFormatIonReaCHING OuT TO all OuR COMMuNITY
city of mississauga 300 city centre drive mississauga, on l5B 3c1
Website: www.mississauga.ca PublicInquiriestelephone:905-896-5000 Fax(Finance):905-896-5133 TTY:905-896-5151 e-mail: [email protected]
cIty oF mISSISSauGa memBerS oF councIlmayor Hazel mccallion 905-896-5555 [email protected]
carmen corbasson Ward 1 905-896-5100 [email protected]
Patricia mullin Ward 2 905-896-5200 [email protected]
maja l.a. Prentice Ward 3 905-896-5300 [email protected]
Frank dale Ward 4 905-896-5400 [email protected]
eve adams Ward 5 905-896-5500 [email protected]
carolyn Parrish Ward 6 905-896-5600 [email protected]
nando Iannicca Ward 7 905-896-5700 [email protected]
katie mahoney Ward 8 905-896-5800 [email protected]
Patricia Saito Ward9 905-896-5900 [email protected]
Sue mcFadden Ward 10 905-896-5010 [email protected]
George carlson Ward 11 905-896-5011 [email protected]
48 CITY OF MISSISSAUGA

Jamesbay
Thunderbay
duluth
SudburySaultSte. Marie
Québecfredericton
Charlottetown
Saint Johnhalifax
St. Paul
ottawa
Montréal Augusta
Montpelier Portland
MadisonMilwaukee
Lansing
detroit
windsor
Toronto
hamiltonrochester
buffalo
Concord
boston
Albany
hartford
Providence
New york
Trenton
Philadelphia
harrisburgPittsburgh
Cleveland
dover
Chicagodavenport
des Moines
SpringfieldIndianapolis
Cincinnati
Columbus Annapoliswashington
richmondCharleston
frankfurtLouisville
raleigh
Jefferson City
Springfield
NashvilleKnoxville
Charlotte
Memphis
Little rock Atlanta
Columbia
birmingham Augusta
ShreveportJackson
Montgomery
Columbus
JacksonvilleTallahasseeMobile
New orleans orlando
Tampa
Miami
baton rouge
MINNESoTA
oNTArIo
QUEbEC
MAINE
VErMoNT
NEw yorK
MIChIGAN
NEwhAMPShIrE
MASSAChUSETTSwISCoNSIN
IowA
ILLINoISINdIANA
ohIo
PENNSyLVANIA
NEw JErSEy
CoNNECTICUT
rhodE ISLANd
NoVASCoTIA
dELAwArE
MAryLANd
VIrGINIA
wESTVIrGINIA
NorThCAroLINA
SoUThCAroLINA
GEorGIA
ALAbAMA
TENNESSEE
KENTUCKy
MISSISSIPPI
ArKANSAS
MISSoUrI
LoUISIANA
fLorIdA
NEwbrUNSwICK
PrINCE EdwArdISLANd
Gulf ofSt. Lawrence
Lake Superior
Lakehuron
LakeMichigan
LakeErie
Lakeontario
GULf of MEXICo
ATLANTIC oCEAN
Mississauga
´CANAdA
NEwfoUNdLANd
Lake Ontario
km
Halton
Peel TorontoDurham
BurlingtonOakville
TorontoAjax
PickeringWhitby
Oshawa
Clarington
Scugog
Brock
Durham
Georgina
EastGwillimbury
Newmarket
AuroraWhitchurch-Stouffville
Richmond Hill
Markham
Vaughan
King
YorkPeel
Caledon
BramptonHaltonHills
Halton
Milton
Uxbridge0 10 20 30 40
Mississauga
GTA MUNICIPALITIES
CiTy of MississAuGA wIThIN CENTrAL/EASTErN NorTh AMErICA

THE CITY OF MISSISSAUGA
FINANCIALREPORT2007
THE CITY OF MISSISSAUGA
FINANCIALREPORT2007
for the fiscal year ending December 31, 2007