Embed Size (px)
Citation preview

MPR Reference No.: 6264-601
The Chicago Program
Evaluation Project:
A Picture of Early
Childhood Programs,
Teachers, and Preschool-
Age Children in Chicago
Final External Report
December 2008
Christine Ross
Emily Moiduddin
Cassandra Meagher
Barbara Carlson
Produced for:
The Erikson Institute
The Chicago Department of Children
and Youth Services
The Chicago Public Schools
Submitted to:
The Erikson Institute
420 North Wabash Avenue
Chicago, IL 60611-5627
Project Officer:
Eboni Howard
Submitted by:
Mathematica Policy Research, Inc.
P.O. Box 2393
Princeton, NJ 08543-2393
Telephone: (609) 799-3535
Facsimile: (609) 799-0005
Project Director:
Christine Ross

ACKNOWLEDGEMENTS
We thank the teachers in the Chicago Head Start and Preschool for All programs who
generously welcomed us into their classrooms to assess children and the observe the educational
setting, and who responded to our questions and completed behavior ratings on each child in the
study in both fall and spring of the 2006-2007 school year. We thank the children who engaged
in the assessments and enthusiastically chose stickers as rewards for their efforts, and the parents
who graciously agreed to allow their children to participate.
We appreciate the leadership of the Chicago Public Schools, the Chicago Department of
Children and Youth Services, and the McCormick Foundation, who jointly funded this important
study. We also thank the staff of CPS and CYS, who answered numerous questions about the
policy and program details, provided class lists for sampling, and worked with supervisors and
teachers to encourage participation in the study. CPS fielded a parent survey to obtain the
demographic data needed for Preschool for All children, entered the data and then reviewed and
corrected it.
We are grateful to the staff at Mathematica Policy Research who helped in numerous ways
in the data analysis and reporting, including Sarah Avellar, Patricia DelGrosso, Laura Guy,
Bonnie Hart, Miriam Loewenberg, Maricar Mabutas, Kathleen Paganelli, Caterina Pisciotti, and
Elizabeth Seif. We are also grateful for the comments and insights of Sally Atkins-Burnett, John
Deke, Cindy George, John Hall, John Love, Frank Potter, Peter Schochet, Louisa Tarullo, and
Jerry West, which strengthened the analysis and reporting. We thank Jennifer Baskwell, who
spent many hours making the tables and figures look legible and attractive, and who produced
the entire report.
Finally, we thank Eboni Howard and Sam Meisels of the Erikson Institute, Karen Carradine,
Barbara Bowman, and Paula Cottone of the Chicago Public Schools, Tony Raden, Jim Chesire,
Katie Dealy, Vanessa Rich, and Mary Ellen Caron of the Department of Children and Youth
Services, and their many colleagues for their careful review of drafts of the report, their
enthusiastic support for this project, and their vision for what preschool programs can contribute
to the lives of the children of Chicago.


v
CONTENTS
Section Page
Introduction ...............................................................................................................................1
Key Research Questions ...........................................................................................................3
Design of the C-PEP Study.......................................................................................................4
Research Question #1: What are the characteristics and development of children
entering early childhood education programs in the fall? ........................................................9
Research Question #2: What are the characteristics of teachers and the quality
of classrooms in Chicago’s early childhood education programs? ........................................22
Research Question #3: What developmental progress do children make during
the preschool year? .................................................................................................................33
Summary and Discussion of the Findings ..............................................................................43
Conclusion ..............................................................................................................................50
References ...............................................................................................................................53


THE CHICAGO PROGRAM EVALUATION PROJECT: A PICTURE
OF EARLY CHILDHOOD PROGRAMS, TEACHERS, AND
PRESCHOOL-AGE CHILDREN IN CHICAGO
Early childhood education programs can play a critical role in preparing educationally at-
risk children for school and reducing achievement gaps that develop as early as the elementary
grades (Campbell et al. 2002; Zigler and Styfco 1996). Early childhood education programs seek
to enrich the learning environments of children at an early age, recognizing that development is
cumulative and starts early (Bowman, Donovan, and Burns 2001; Cunha, Heckman, Lochner,
and Masterov 2006; Shonkoff and Phillips 2000). More recently, the federal No Child Left
Behind legislation establishes an imperative for schools to ensure that increasing proportions of
children reach state-defined proficiency standards starting in third grade. This imperative has
increased the focus on early childhood education programs to provide an early start at reducing
the gaps in children’s achievement, and has increased public support for preschool programs
nationally.
Growing support for publicly funded preschool educational opportunities has led to rapid
expansion of early childhood education for economically disadvantaged 3- and 4-year-olds over
the past two decades. The federal Head Start program doubled its enrollment during the 1990s to
900,000 children; since 2001, enrollment has remained flat (Administration for Children and
Families [ACF] 2007). State pre-kindergarten programs also expanded during the 1990s, but
unlike Head Start, they continued growing through 2006. In 1991, a total of 28 states served
290,000 children in state pre-kindergarten programs; by 2006, there were 10 additional states
offering pre-kindergarten programs and over 1 million children were enrolled (Barnett et al.
2007).
The quality of early childhood education programs has also been a focus of public and
policy attention. The 1990s brought new efforts by the Head Start program to improve the
educational content of the programs, by placing a greater focus on enhancing children’s language
development and early literacy skills, using periodic assessments to inform individualized
teaching, and requiring 50 percent of teachers to have an associate’s degree by 2003. More
recently, the 2007 reauthorization of the Head Start program requires all teachers to have at least
an associate’s degree by 2011, and 50 percent of teachers to have at least a bachelor’s degree by
2013. Reauthorization also requires the development of new early learning standards and
program assessments that expand the focus to include instructional quality. As state pre-
kindergarten programs have become established and grown over the past decade, they have been
accompanied by standards for class sizes and child-adult ratios, teacher education levels and
professional development, and early learning standards that extend and support the state’s
curriculum standards for kindergarten through 12th
grade.
Illinois is considered to be one of the leading states in making investments in early
childhood education services. In terms of quality standards for pre-kindergarten, as well as in
terms of the number of preschool-age children served, it is ranked near the top of the states
(Barnett et al. 2007). The Illinois state pre-kindergarten program began in 1985 as the
Prekindergarten Program for At-Risk Children, offering early childhood services. Since 1998,

funding for the program has been included in the Illinois Early Childhood Block Grant and
administered by the state Department of Education.
Head Start has been offered by the City of Chicago since the program’s inception as a pilot
summer program in 1965. Today, Chicago is one of the largest ―super‖ grantees in the U.S.,
overseeing the delivery of Head Start services by 57 community-based organizations to over
16,000 children across the city. One of the largest of these organizations is the Chicago Public
Schools.
Thus, the Chicago early childhood education system includes diverse center-based and
school-based programs, many serving low-income or educationally at-risk children. The
programs operate under both public school and private, community-based auspices and receive
funding from several sources, including the Illinois State Board of Education Early Childhood
Block Grant, Head Start, the Illinois Child Care Assistance Program, and the Department of
Child and Family Services. Accordingly, the programs vary in eligibility rules and program
priorities, hours and days of operation, and families served. The early childhood education
programs enroll mainly 3- and 4-year-old children and operate for full-day or half-day double
sessions. Funding sources and sponsoring agencies set different requirements for teacher
education and provide different systems for support of professional development. The
characteristics of children served vary depending on neighborhood characteristics, eligibility
rules, and program priorities. Head Start, until the 2007 federal reauthorization, served children
in families with incomes at or below the federal poverty line (although 10 percent of enrollment
could be children with special needs from families at any income level). With reauthorization,
the income limit was modified so that up to 35 percent of children in a Head Start program may
come from families with income up to 130 percent of the federal poverty line. Parents who
receive child care subsidies and whose children are in full-day programs are required to be
employed, in school, or in job training. The Illinois Preschool for All program does not set an
income eligibility requirement, although during the phase-in period from the at-risk to the
universal program, providers had to give priority to at-risk children and lower-income families
(incomes below $60,000 per year). As a result, the families served by each program differ in the
percentage of parents employed, the percentage with incomes below poverty, and other
characteristics.
Chicago’s early childhood education programs are operating in a state in which investment
in early education is growing. The Preschool for All Children Act, passed in July 2006,
expanded the existing Pre-Kindergarten for Children At-Risk of Academic Failure program to
offer universal preschool and re-named the program Preschool for All. By 2011, when the
program is expected to be fully implemented and funded, all 3- and 4-year-olds in the state are
expected to have access to pre-kindergarten in a range of settings, including state-funded
preschools, community-based child care centers, and Head Start.
In the context of this funding expansion, and in the face of a continuing need to serve more
eligible children in some locations, information about the early childhood education system in
Chicago, including the experiences of children in its classrooms and children’s developmental
progress, can help to inform initiatives that will use the available programs and resources to best
meet the needs of low-income preschool children. Although nearly a decade of research offers a
nationally representative picture of Head Start children and program quality (ACF 2003, 2006),
research is just beginning to provide a picture of who is served by state preschool programs and

the quality of those environments (Barnett et al. 2007; Clifford, et al., 2005; Early et al. 2005;
Henry et al. 2006; Phillips, Gormley, and Lowenstein 2007; Pianta et al. 2005). A large body of
literature has examined children’s experiences in the Head Start program nationally, and in
eleven of the largest state preschool programs, yet few studies have examined the multiple
program environments of a large city like Chicago and described children’s early childhood
education experiences in these programs. Basic descriptive information is a critical first step
before the most salient policy questions can be identified and answered.
The Chicago Public Schools (CPS) and the Chicago Department of Children and Youth
Services (CYS) have partnered with the McCormick Foundation and the Erikson Institute to
support the Chicago Program Evaluation Project (C-PEP). The project was initiated to inform
program improvement efforts and funding directions for Chicago’s early childhood education
programs, and to provide a baseline for future research. This study documents children’s
experiences in early childhood education classrooms, assesses their development, and provides
information on children’s readiness to succeed in kindergarten.
This report describes children representing the roughly 30,000 4-year-old children who
attended Chicago’s early childhood education programs in the 2006-2007 school year. They are
from diverse family backgrounds in terms of ethnicity, parental education and employment, but
nearly all have demographic risk factors associated with adverse outcomes. The report describes
the teachers and classrooms, providing a detailed picture of the education and experience of
teachers, the curriculum and educational activities, and the quality of the classroom environment
in terms of instructional and emotional support. Finally, we describe the developmental progress
children make over a period of 5 to 6 months during the preschool year, and examine how that
progress relates to variations in children’s background characteristics and characteristics of the
preschool classroom environment.
The analysis is descriptive, not causal. Differences in children’s developmental progress
during the preschool year may vary by particular program, classroom, or family characteristics,
but may reflect many other influences not measured in this study. The descriptive information in
this report can, however, provide a rich picture of the children, families, and programs that make
up the early childhood education landscape in Chicago, and can suggest avenues for further
research.
KEY RESEARCH QUESTIONS
C-PEP was designed to address research questions in three main areas:
1. What are the characteristics and developmental levels of children attending
Chicago’s early childhood education programs in the fall of 2006?
2. What are the characteristics of teachers and classrooms in Chicago’s early childhood
education programs?
3. What developmental progress do children make during the preschool year? How are
family background characteristics and classroom environments related to children’s
developmental progress during the preschool year?
To provide a broader context for interpreting information about Chicago’s children and
classrooms, we compare them to Head Start children and programs nationally and to other state
pre-kindergarten children and programs based on previous studies (ACF 2003, 2006; Early et al.
2005). It is important to keep in mind that, relative to children in the national studies, Chicago’s
early childhood education programs have particularly high proportions of children who are
English Language Learners and whose parents have lower education levels. Thus, the special
needs of English Language Learners will need more attention in Chicago’s early childhood
education programs. Moreover, since parent education is associated with the home language
environment and with children’s cognitive development, children in Chicago’s early childhood
education programs may be at greater educational risk than their peers nationally.
DESIGN OF THE C-PEP STUDY
The Study Examined Three Types of Early Childhood Education Programs
The study includes three types of programs that constitute a large proportion of the early
childhood education slots in Chicago: Full-Day programs in community-based child care centers
that operate with federal Head Start dollars and state child care subsidy funds; Half-Day Head
Start, which operates with federal Head Start funding; and school-based Preschool for All, which
is funded by the state of Illinois Early Childhood Block Grant.1 The programs are described in
greater detail in Box 1.
The Study Focused on 4-Year-Olds
Within the three program types, C-PEP focuses on 4-year-old children for three reasons.
First, the early childhood education programs in the study give 4-year-olds priority over younger
children, so they constitute the largest subgroup served by these programs. Second, many
educationally at-risk 3-year-olds cannot reach a minimum score on the cognitive assessments
used in the study, making inferences about this group less certain. Finally, 4-year-olds provide a
picture of the development of preschool children in the year immediately prior to kindergarten.
1 CPS full-day Head Start programs and community-based Preschool for All programs could not be included in
the study, because this would have required a much larger project.

The Study Included a Representative Sample of Classes and Children from Each Program
We selected classes at random within each program from a full list of classes that had
eligible 4-year-old children. The probability of selecting any class was proportional to the
number of 4-year-olds in that class. Prior to conducting our random selection, we sorted classes
by community area to ensure that the sample of children represented Chicago’s diversity.
Ultimately, we selected 37 classes from each program. Some selected classes were not eligible
for the study and others declined to participate, leaving a sample of 33 Full-Day, 31 Half-Day
Head Start, and 31 Preschool for All classes across a broad array of neighborhoods in the city
(Figure 1). After selecting classes for the study, we randomly chose 12 to 14 children ages 4 and
older from each selected class and invited them to participate in the study.2 Of the 943 children
2 Children who are 5 years old by September 1 can enter kindergarten; thus, children who are not yet 5 by
September 1 and a small number of children whose parents preferred to keep them in preschool for an additional
year could be in our sample.


sampled to participate in the study, parents of 711 gave consent for them to participate. The final
sample of children was spread across the three programs, with 33 percent from Preschool for All,
31 percent from Full-Day programs, and 36 percent from Half-Day Head Start. The study
sample is thus evenly balanced across programs, in order to provide a clearer description of each.
However, the number of children enrolled in Preschool for All programs is, in fact, much larger
than the number of children in Full Day or Half-Day Head Start programs.
Measures of Preschool Children’s Development Focused on Vocabulary, Early Literacy,
Early Mathematics, and Social-Emotional Development
Many aspects of children’s cognitive development are important during the preschool years.
We have focused on three areas of cognitive development that predict success in school: English-
and Spanish-language vocabulary development, early literacy, and early mathematics (ACF
2003; Denton and West 2003; Peisner-Feinberg, et al. 1999). Vocabulary development measures
children’s knowledge of a variety of words and concepts, such as categories, actions, and objects
from different environments and time periods. English-language development is important for
the many English Language Learners who will be entering English-speaking kindergartens the
following year. For early literacy achievement, we focused on children’s knowledge of letters,
letter sounds, and words. For mathematics achievement, we focused on whether children could
identify and understand certain fundamental mathematics concepts (number and operations;
geometry, patterns, and measurement), given their importance for children’s later development
(Clements and Sarama 2000).
Children’s social-emotional development is critical for well-being and to support learning in
a school environment. For the C-PEP study, we selected three major areas of social-emotional
development that both associate with learning and have suitable measures available:
(1) attention/persistence, (2) social behavior, and (3) behavior problems. Attention/persistence
refers to a child’s ability to do things such as settle into an activity or concentrate. Social
behavior refers to cooperation and interaction (for example, empathy towards other children,
leadership). Behavior problems include both internalizing behaviors (social withdrawal) and
externalizing behaviors (attention problems and self-centered or overactive behavior).
The Study Used Child Assessments, Teacher Interviews, and Direct Observations of the
Classrooms
In fall and spring, we administered direct assessments of children’s cognitive and social-
emotional development and asked teachers to report about children’s social-emotional
development. During the fall interviews, teachers reported their education, experience,
professional development, classroom instructional practices, curriculum used, and types of child
assessments used during the year. Finally, we conducted observations of the classrooms in
February 2007 to assess classroom quality across several dimensions, including materials for
learning, emotional support, classroom management, and the quality of instruction.
The fall child assessments were conducted between mid-October and the end of November.
This allowed children the opportunity to adjust to the preschool classroom environment before

being assessed, as well as accommodating the sampling process and the time required to obtain
parental consent. Spring assessments were conducted between early April and mid-May. The
average (and median) interval between the fall and spring assessments for all children was 5.4
months, with 80 percent of the children assessed within a period of 4.8 to 5.9 months. Full-Day
programs are open for nearly the full calendar year (50 weeks). For Half-Day Head Start and
Preschool for All programs, the 2006–07 school year began just after Labor Day and ended in
mid-June; a total of 9.5 months, including holidays and school vacations. Thus, our measure of
children’s growth between the fall and spring assessment points – a span of 5 to 6 months – does
not include the entire preschool year, and thus likely underestimates the actual growth children
experienced during the entire preschool year.

RESEARCH QUESTION 1
WHAT ARE THE CHARACTERISTICS AND DEVELOPMENT OF CHILDREN ENTERING
EARLY CHILDHOOD EDUCATION PROGRAMS IN THE FALL?
1a. What are the demographic and family background characteristics of 4-
year-old children in CPS/CYS early childhood classrooms in the fall?
FIGURE 2
MOST CHILDREN IN C-PEP EARLY CHILDHOOD PROGRAMS
ARE LATINO OR AFRICAN AMERICAN
50% 48%
2%
0%
Latino White African American Other
50%
8%
33%
10%
Half-Day Head Start Preschool for All
Source: MPR tabulations from C-PEP administrative data. See Table II.3.
38%
0%
59%
3%
Full-Day Programs
Children in the early childhood education programs are predominantly Latino or African
American.
Figure 2 shows that children’s racial/ethnic backgrounds vary by program. Full-Day
programs serve a majority of African American children (59 percent). In Half-Day Head Start,
about half of the children are African American and half are Latino. Preschool for All programs
serve a larger proportion of Latino children (50 percent) than other groups.3
3 This study may have a higher proportion of Latino families than would be expected had all of Chicago’s early
childhood programs been included. In particular, the study’s inclusion of more half-day than full-day programs and
the focus on 4-year-old children may have increased the proportion of Latino children in the study.

Approximately half of the children in the early childhood programs included in the C-PEP
study speak Spanish or another language (other than English) in the home.
The proportion of children from homes in which English is not the primary language varies
by program, reflecting the proportions of Latino children in each program (see Figure 3). Half-
Day Head Start and Preschool for All have particularly large populations of children who do not
speak English at home. For many of these children, learning English will be a major task of
preschool.
Parent education, employment, and income levels are lowest in Half-Day Head Start
programs; parent education and income levels are highest in Preschool for All programs.
Family income and parental employment vary across programs, reflecting the different
eligibility criteria and service priorities of the programs described earlier in Box 1. In Full-Day
programs, nearly 60 percent of children live with single parents,4 and the vast majority of parents
reported that they are employed. Two-thirds of the parents of children in Full-Day programs
have a high school diploma or GED, and half of these high school graduates have taken some
courses at the college level. Average annual family income is $12,100. Among the families of
children in Half-Day Head Start, 47 percent of the parents have not completed high school, one-
third are not working, and average annual family income is $10,500. Children in Preschool for
4 Substantial non-reporting of marital status among Full-Day and Half-Day Head Start parents (35 percent)
means that the proportion of single parents could be higher.
FIGURE 3
APPROXIMATELY HALF OF CHILDREN IN C-PEP EARLY CHILDHOOD
PROGRAMS SPEAK SPANISH OR ANOTHER LANGUAGE AT HOME
Percentage of Children
67.3
29.7
3.0
54.7
42.9
2.4
43.847.4
8.8
0
20
40
60
80
English Spanish Other
Source: MPR tabulations from C-PEP administrative data. See Table II.3.
Full-Day
Programs
Half-Day
Head Start
Preschool
for All

All programs, on the other hand, come from families with higher incomes. Parents of children
in these programs tend to be married (56 percent), to have higher education levels (72 percent
have completed high school), and to have higher family income than the other two groups
($25,600 annually). Although there is substantial missing data on employment, the vast majority
of parents indicated that they are employed. Figure 4 shows parent education levels and Figure 5
shows parent employment levels across the three programs.
FIGURE 4
A MAJORITY OF PARENTS OF CHILDREN IN FULL-DAY AND
PRESCHOOL FOR ALL PROGRAMS HAVE A HIGH SCHOOL DIPLOMA OR
ATTENDED COLLEGE
Percentage of Families
Source: MPR tabulations from C-PEP administrative data. See Table II.5.
Full-Day
Programs
Half-Day
Head Start
Preschool
for All12.3 50.8 21.5 15.5
47.0 17.5 13.0 22.6
30.9 32.6 27.0 9.5
0% 20% 40% 60% 80% 100%
Less than High School High School Diploma or GED
Some College or More Not Reported
FIGURE 5
A MAJORITY OF PARENTS OF CHILDREN IN FULL-DAY AND
PRESCHOOL FOR ALL PROGRAMS ARE EMPLOYED FULL- OR PART-TIME
Source: MPR tabulations from C-PEP administrative data. See Table II.5.
Percentage of Families
Full-Day
Programs
Half-Day
Head Start
Preschool
for All40.0 11.4 9.5 39.0
43.4 8.2 34.8 13.7
66.3 17.1 8.1 8.5
0% 20% 40% 60% 80% 100%
Works Full-time Works Part-time No Work Not Reported

1b. What is the developmental risk status of C-PEP children and
does this vary by program?
Research has identified the following factors that may put children at developmental risk:
(1) characteristics of the child, including established diagnoses and biological vulnerabilities;
(2) parent characteristics, such as harshness or poor attachment; (3) family characteristics, such
as instability or violence; and (4) neighborhood or environmental characteristics, such as social
networks, danger, social cohesion, mutual trust, and the extent of economic opportunity (Brooks-
Gunn, Duncan, and Aber 1997; Garbarino and Ganzel 2000; Kohen, Leventhall, Dahinten, and
McIntosh 2008; Meisels and Wasik 1990; Shonkoff and Marshall 2000). Neighborhood
characteristics appear to be related to parents’ mental health and parenting styles, and together
with family characteristics and parent characteristics, can influence the degree of support and
stimulation in the home environment, and the degree of stress experienced by children. Children
at risk may show resilience or develop more positively than expected if there are factors that
buffer stress, including their own sociable, engaging personalities, adults who develop close,
guiding relationships with them, or an intervention program such as the Chicago early childhood
education programs (see, for example, Garmezy 1974; Masten et al. 1990; Sameroff and Seifer
1983; Yates, Egeland and Sroufe 2003).
Forty percent of children in Chicago’s early childhood education programs have a high
number of family demographic characteristics that may put them at developmental risk, but
the proportion varies by program. Half-Day Head Start programs have the largest proportion
of children at high risk (62 percent) and Preschool for All programs have the lowest (28
percent).
Because the C-PEP study lacks measures of children’s disabilities or biological
vulnerabilities, as well as parenting style, warmth, and attachment at home, we use measures of
more distal factors that are considered risks because of the likelihood they will influence the
home environment (Yates, Egeland, and Sroufe 2003). In this study, we have identified six
characteristics of the family that may put children at developmental risk, including: a parent with
less than a high school education, a parent who is unemployed, family income below the poverty
threshold, a single parent, household size of five or more, and a young parent (between the ages
of 17 and 24). We describe children as ―high risk‖ when they experience three or more of these
factors and ―lower risk‖ when they experience fewer than three.5 Children designated as ―lower
risk‖ include a small number who had no reported demographic risk factors, as well as many
children with one or two demographic risk factors. They are at lower demographic risk relative
to the ―high risk‖ group based on the information available, but many of these children are still at
developmental risk. Figure 6 shows that children’s high-risk status differs by program type.
Half-Day Head Start has a particularly large concentration of children in the high-risk group.
5 Since some children have missing data on more than one demographic characteristic used in the risk index,
we classified children as ―high risk‖ if 50 percent or more of the demographic information available indicates risk.
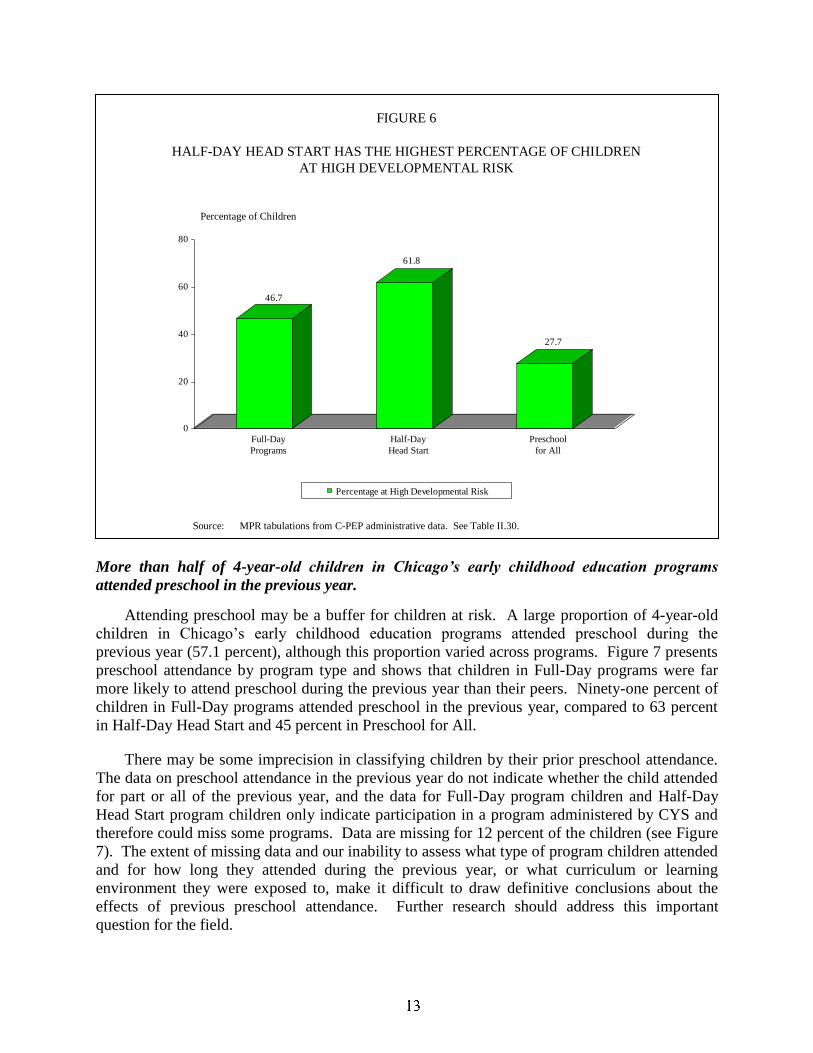
FIGURE 6
HALF-DAY HEAD START HAS THE HIGHEST PERCENTAGE OF CHILDREN
AT HIGH DEVELOPMENTAL RISK
Percentage of Children
46.7
61.8
27.7
0
20
40
60
80
Percentage at High Developmental Risk
Source: MPR tabulations from C-PEP administrative data. See Table II.30.
Full-Day
Programs
Half-Day
Head Start
Preschool
for All
More than half of 4-year-old children in Chicago’s early childhood education programs
attended preschool in the previous year.
Attending preschool may be a buffer for children at risk. A large proportion of 4-year-old
children in Chicago’s early childhood education programs attended preschool during the
previous year (57.1 percent), although this proportion varied across programs. Figure 7 presents
preschool attendance by program type and shows that children in Full-Day programs were far
more likely to attend preschool during the previous year than their peers. Ninety-one percent of
children in Full-Day programs attended preschool in the previous year, compared to 63 percent
in Half-Day Head Start and 45 percent in Preschool for All.
There may be some imprecision in classifying children by their prior preschool attendance.
The data on preschool attendance in the previous year do not indicate whether the child attended
for part or all of the previous year, and the data for Full-Day program children and Half-Day
Head Start program children only indicate participation in a program administered by CYS and
therefore could miss some programs. Data are missing for 12 percent of the children (see Figure
7). The extent of missing data and our inability to assess what type of program children attended
and for how long they attended during the previous year, or what curriculum or learning
environment they were exposed to, make it difficult to draw definitive conclusions about the
effects of previous preschool attendance. Further research should address this important
question for the field.

1c. What is the developmental status of 4-year-old children in C-PEP
programs in the fall with respect to language ability, early literacy,
early mathematics, persistence, social competence, and problem
behaviors? How does their developmental status compare with
that of 4-year-olds nationally?
FIGURE 7
CHILDREN IN FULL-DAY PROGRAMS ARE THE MOST LIKELY TO HAVE
ATTENDED PRESCHOOL IN THE PREVIOUS YEAR
Percentage of Children
44.9 37.9 17.2
63.2 21.1 15.7
90.6 9.4
0% 20% 40% 60% 80% 100%
Attended Preschool Last Year Did Not Attend Preschool in Last Year Not Reported
Source: MPR tabulations from C-PEP administrative data. See Table II.3.
Full-Day
Programs
Half-Day
Head Start
Preschool
for All
Children’s development in the fall was at the national average for early literacy but below
national averages for vocabulary and early mathematics.
We have focused on three areas of cognitive development that predict success in school:
English- and Spanish-language (vocabulary) development, early literacy, and early mathematics
(ACF 2003; Denton and West 2003; Peisner-Feinberg et al. 1999). Table 1 describes the
measures of children’s cognitive abilities. These child assessments have strong psychometric
properties, and except for the Early Mathematics Assessment (ECLS-B assessment focusing on
patterns, geometry, and measurement), include standardized scores that allow us to compare
children’s performance with that of a national sample of children the same age. For the
standardized tests of cognitive development, a score of 100 is equivalent to the national average
for children of the same age, and the standard deviation is 15. This indicates that children who
score below 85 are more than one standard deviation below the national mean, or in the bottom
16 percent of children nationally. Standardized scores also adjust for the natural progress
children make as they grow, so any gains in standardized scores can be attributed to factors other
than age. The ―W-scores‖ for the Early Mathematics Assessment, on the other hand, have not
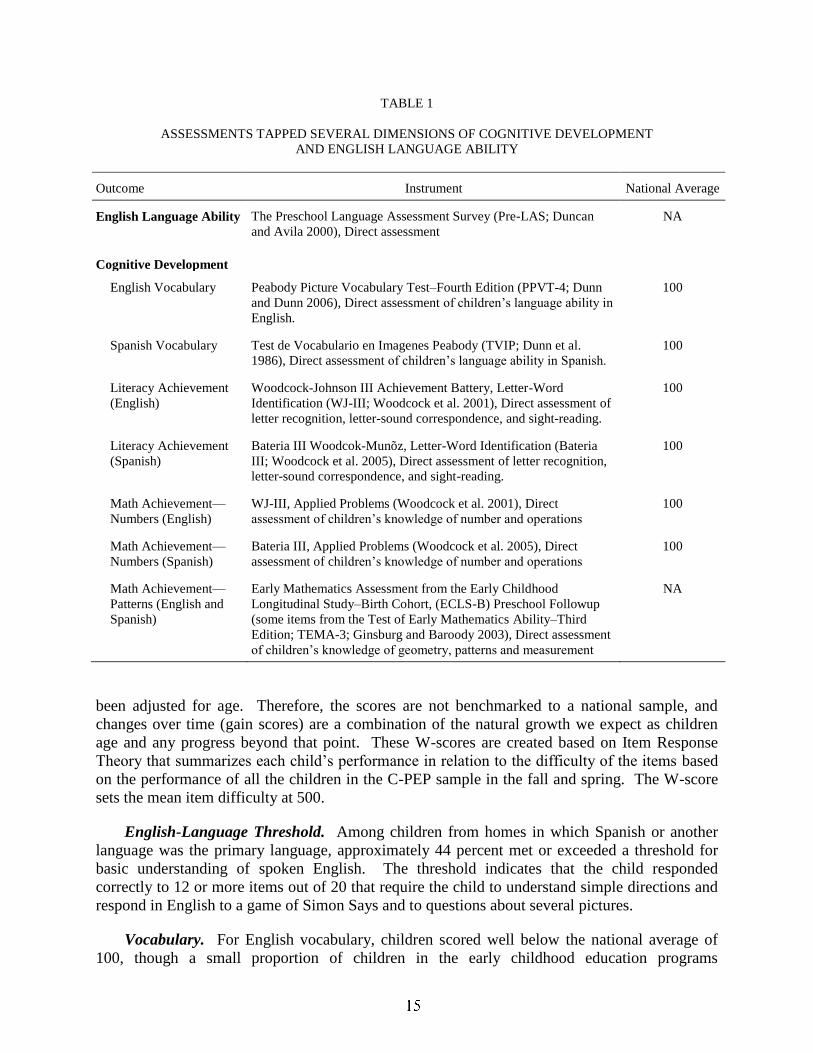
TABLE 1
ASSESSMENTS TAPPED SEVERAL DIMENSIONS OF COGNITIVE DEVELOPMENT
AND ENGLISH LANGUAGE ABILITY
Outcome Instrument National Average
English Language Ability The Preschool Language Assessment Survey (Pre-LAS; Duncan
and Avila 2000), Direct assessment
NA
Cognitive Development
English Vocabulary Peabody Picture Vocabulary Test–Fourth Edition (PPVT-4; Dunn
and Dunn 2006), Direct assessment of children’s language ability in
English.
100
Spanish Vocabulary Test de Vocabulario en Imagenes Peabody (TVIP; Dunn et al.
1986), Direct assessment of children’s language ability in Spanish.
100
Literacy Achievement
(English)
Woodcock-Johnson III Achievement Battery, Letter-Word
Identification (WJ-III; Woodcock et al. 2001), Direct assessment of
letter recognition, letter-sound correspondence, and sight-reading.
100
Literacy Achievement
(Spanish)
Bateria III Woodcok-Munõz, Letter-Word Identification (Bateria
III; Woodcock et al. 2005), Direct assessment of letter recognition,
letter-sound correspondence, and sight-reading.
100
Math Achievement—
Numbers (English)
WJ-III, Applied Problems (Woodcock et al. 2001), Direct
assessment of children’s knowledge of number and operations
100
Math Achievement—
Numbers (Spanish)
Bateria III, Applied Problems (Woodcock et al. 2005), Direct
assessment of children’s knowledge of number and operations
100
Math Achievement—
Patterns (English and
Spanish)
Early Mathematics Assessment from the Early Childhood
Longitudinal Study–Birth Cohort, (ECLS-B) Preschool Followup
(some items from the Test of Early Mathematics Ability–Third
Edition; TEMA-3; Ginsburg and Baroody 2003), Direct assessment
of children’s knowledge of geometry, patterns and measurement
NA
been adjusted for age. Therefore, the scores are not benchmarked to a national sample, and
changes over time (gain scores) are a combination of the natural growth we expect as children
age and any progress beyond that point. These W-scores are created based on Item Response
Theory that summarizes each child’s performance in relation to the difficulty of the items based
on the performance of all the children in the C-PEP sample in the fall and spring. The W-score
sets the mean item difficulty at 500.
English-Language Threshold. Among children from homes in which Spanish or another
language was the primary language, approximately 44 percent met or exceeded a threshold for
basic understanding of spoken English. The threshold indicates that the child responded
correctly to 12 or more items out of 20 that require the child to understand simple directions and
respond in English to a game of Simon Says and to questions about several pictures.
Vocabulary. For English vocabulary, children scored well below the national average of
100, though a small proportion of children in the early childhood education programs
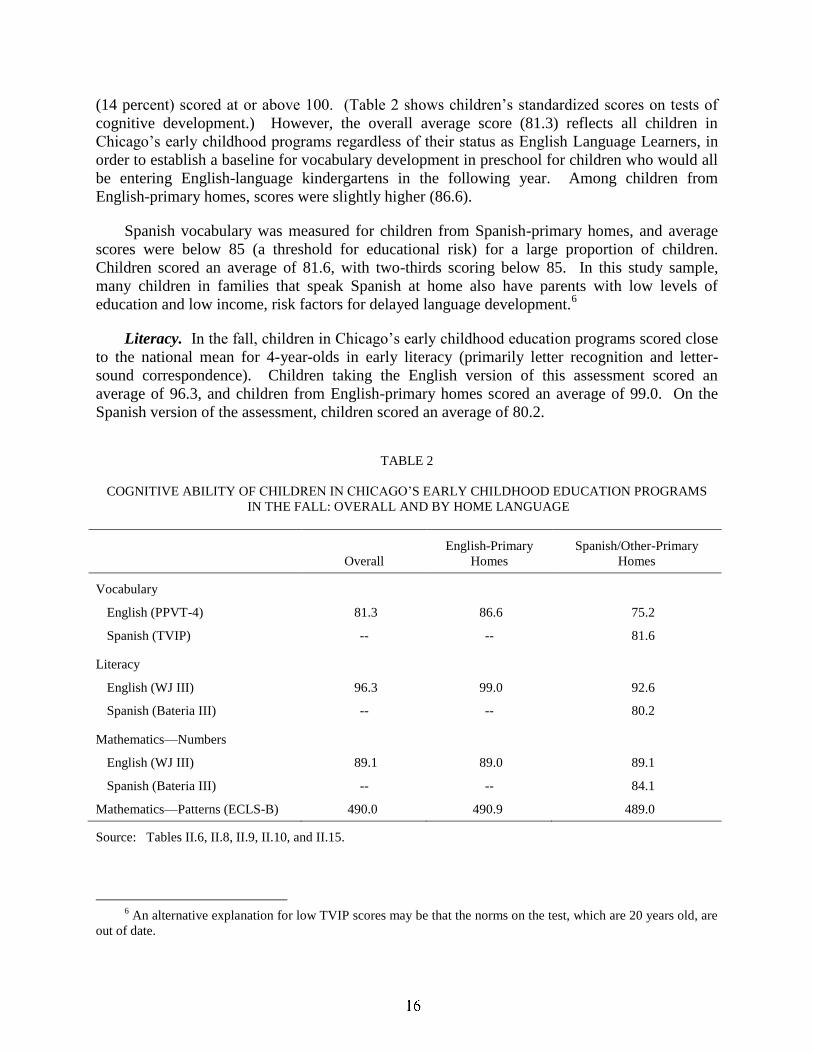
(14 percent) scored at or above 100. (Table 2 shows children’s standardized scores on tests of
cognitive development.) However, the overall average score (81.3) reflects all children in
Chicago’s early childhood programs regardless of their status as English Language Learners, in
order to establish a baseline for vocabulary development in preschool for children who would all
be entering English-language kindergartens in the following year. Among children from
English-primary homes, scores were slightly higher (86.6).
Spanish vocabulary was measured for children from Spanish-primary homes, and average
scores were below 85 (a threshold for educational risk) for a large proportion of children.
Children scored an average of 81.6, with two-thirds scoring below 85. In this study sample,
many children in families that speak Spanish at home also have parents with low levels of
education and low income, risk factors for delayed language development.6
Literacy. In the fall, children in Chicago’s early childhood education programs scored close
to the national mean for 4-year-olds in early literacy (primarily letter recognition and letter-
sound correspondence). Children taking the English version of this assessment scored an
average of 96.3, and children from English-primary homes scored an average of 99.0. On the
Spanish version of the assessment, children scored an average of 80.2.
TABLE 2
COGNITIVE ABILITY OF CHILDREN IN CHICAGO’S EARLY CHILDHOOD EDUCATION PROGRAMS
IN THE FALL: OVERALL AND BY HOME LANGUAGE
Overall
English-Primary
Homes
Spanish/Other-Primary
Homes
Vocabulary
English (PPVT-4) 81.3 86.6 75.2
Spanish (TVIP) -- -- 81.6
Literacy
English (WJ III) 96.3 99.0 92.6
Spanish (Bateria III) -- -- 80.2
Mathematics—Numbers
English (WJ III) 89.1 89.0 89.1
Spanish (Bateria III) -- -- 84.1
Mathematics—Patterns (ECLS-B) 490.0 490.9 489.0
Source: Tables II.6, II.8, II.9, II.10, and II.15.
6 An alternative explanation for low TVIP scores may be that the norms on the test, which are 20 years old, are
out of date.
Mathematics. Children scored 89 for mathematics achievement on the WJ III (focusing on
numbers and operations), which is well below the national average of 100 for 4-year-olds, but
above the at-risk threshold of 85. Children taking the Spanish mathematics assessment (Bateria
III) scored an average of 84. On the ECLS-B mathematics assessment that focused on patterns,
measurement, and geometry, the W-score was 490.
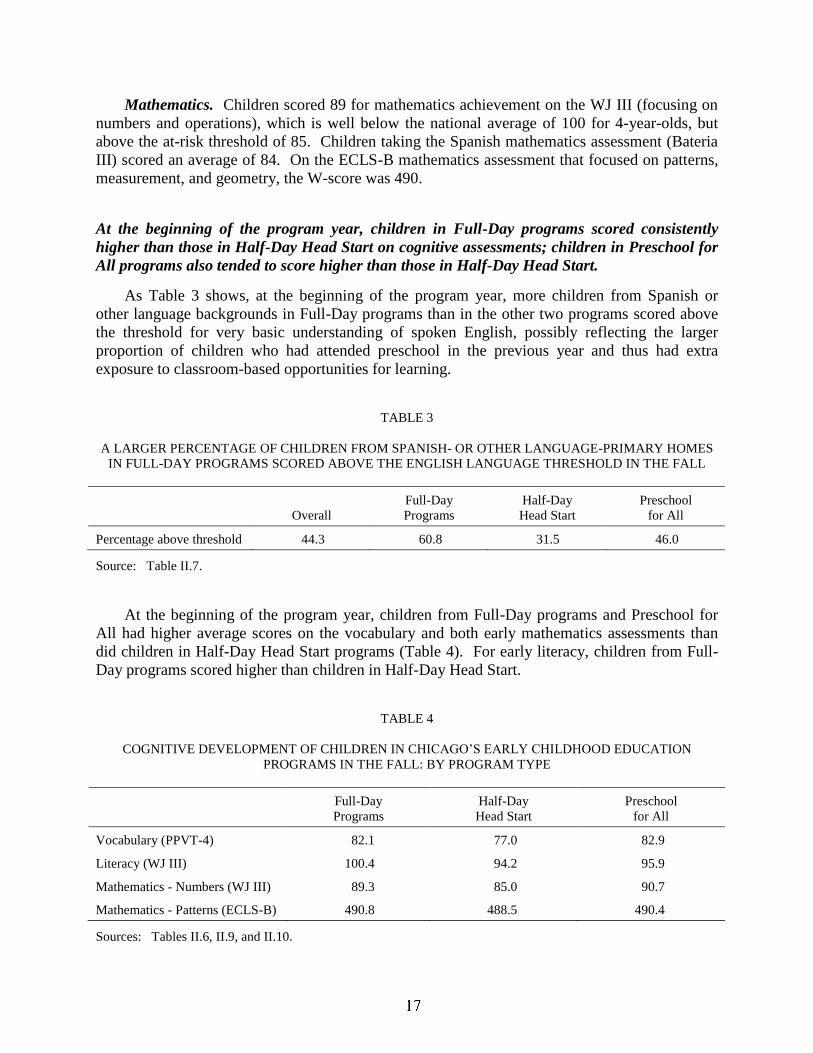
At the beginning of the program year, children in Full-Day programs scored consistently
higher than those in Half-Day Head Start on cognitive assessments; children in Preschool for
All programs also tended to score higher than those in Half-Day Head Start.
As Table 3 shows, at the beginning of the program year, more children from Spanish or
other language backgrounds in Full-Day programs than in the other two programs scored above
the threshold for very basic understanding of spoken English, possibly reflecting the larger
proportion of children who had attended preschool in the previous year and thus had extra
exposure to classroom-based opportunities for learning.
TABLE 3
A LARGER PERCENTAGE OF CHILDREN FROM SPANISH- OR OTHER LANGUAGE-PRIMARY HOMES
IN FULL-DAY PROGRAMS SCORED ABOVE THE ENGLISH LANGUAGE THRESHOLD IN THE FALL
Overall
Full-Day
Programs
Half-Day
Head Start
Preschool
for All
Percentage above threshold 44.3 60.8 31.5 46.0
Source: Table II.7.
At the beginning of the program year, children from Full-Day programs and Preschool for
All had higher average scores on the vocabulary and both early mathematics assessments than
did children in Half-Day Head Start programs (Table 4). For early literacy, children from Full-
Day programs scored higher than children in Half-Day Head Start.
TABLE 4
COGNITIVE DEVELOPMENT OF CHILDREN IN CHICAGO’S EARLY CHILDHOOD EDUCATION
PROGRAMS IN THE FALL: BY PROGRAM TYPE
Full-Day
Programs
Half-Day
Head Start
Preschool
for All
Vocabulary (PPVT-4) 82.1 77.0 82.9
Literacy (WJ III) 100.4 94.2 95.9
Mathematics - Numbers (WJ III) 89.3 85.0 90.7
Mathematics - Patterns (ECLS-B) 490.8 488.5 490.4
Sources: Tables II.6, II.9, and II.10.
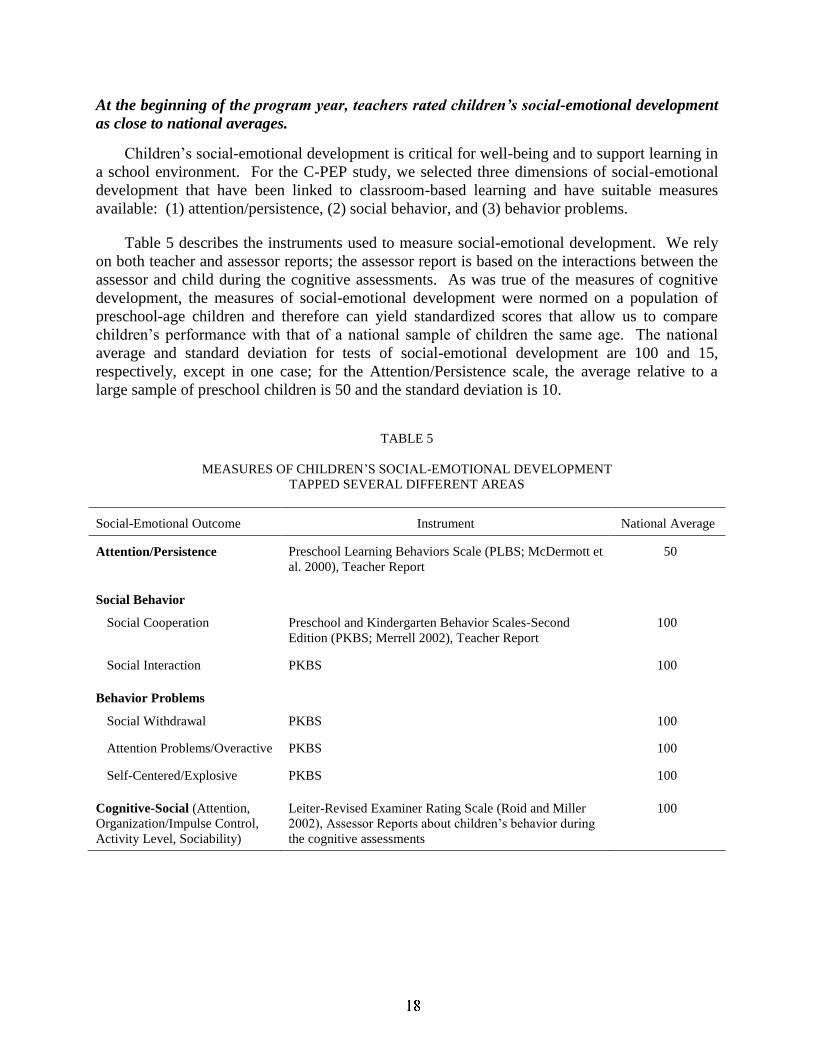
At the beginning of the program year, teachers rated children’s social-emotional development
as close to national averages.
Children’s social-emotional development is critical for well-being and to support learning in
a school environment. For the C-PEP study, we selected three dimensions of social-emotional
development that have been linked to classroom-based learning and have suitable measures
available: (1) attention/persistence, (2) social behavior, and (3) behavior problems.
Table 5 describes the instruments used to measure social-emotional development. We rely
on both teacher and assessor reports; the assessor report is based on the interactions between the
assessor and child during the cognitive assessments. As was true of the measures of cognitive
development, the measures of social-emotional development were normed on a population of
preschool-age children and therefore can yield standardized scores that allow us to compare
children’s performance with that of a national sample of children the same age. The national
average and standard deviation for tests of social-emotional development are 100 and 15,
respectively, except in one case; for the Attention/Persistence scale, the average relative to a
large sample of preschool children is 50 and the standard deviation is 10.
TABLE 5
MEASURES OF CHILDREN’S SOCIAL-EMOTIONAL DEVELOPMENT
TAPPED SEVERAL DIFFERENT AREAS
Social-Emotional Outcome Instrument National Average
Attention/Persistence Preschool Learning Behaviors Scale (PLBS; McDermott et
al. 2000), Teacher Report
50
Social Behavior
Social Cooperation Preschool and Kindergarten Behavior Scales-Second
Edition (PKBS; Merrell 2002), Teacher Report
100
Social Interaction PKBS 100
Behavior Problems
Social Withdrawal PKBS 100
Attention Problems/Overactive PKBS 100
Self-Centered/Explosive PKBS 100
Cognitive-Social (Attention,
Organization/Impulse Control,
Activity Level, Sociability)
Leiter-Revised Examiner Rating Scale (Roid and Miller
2002), Assessor Reports about children’s behavior during
the cognitive assessments
100

Teachers tended to rate children positively on social-emotional development. As shown in
Table 6, children’s Attention/Persistence and social behavior scores were close to national
means. In the case of Attention/Persistence, children in Chicago’s early childhood education
programs scored 50.8 overall, quite close to the norm for preschool children of 50. For Social
Cooperation, children in Chicago’s early education programs exceeded the national average of
100 with a score of 106.6 and fell only slightly below for Social Interaction with a score of 98.5.
Children’s scores for Social Withdrawal and externalizing behavior problems (Attention
Problems/Overactive and Self-Centered/Explosive) were rated quite a bit lower than the national
mean, indicating a lower incidence of problem behaviors. For both types of externalizing
behaviors, children in Chicago’s early education programs scored around 90.
TABLE 6
SOCIAL-EMOTIONAL DEVELOPMENT OF CHILDREN IN CHICAGO’S EARLY CHILDHOOD
EDUCATION PROGRAMS IN THE FALL: BY PROGRAM TYPE
Overall
Full-Day
Programs
Half-Day
Head Start
Preschool
for All
Attention/Persistence 50.8 48.9 51.4 51.1
Social Behavior
Social Cooperation 106.6 102.5 108.4 107.0
Social Interaction 98.5 100.0 99.4 97.8
Behavior Problems
Social Withdrawal 94.0 96.0 91.5 94.5
Attention Problems/Overactive 90.6 94.5 89.2 90.2
Self-Centered/Explosive 89.9 94.6 88.4 89.2
Cognitive-Social (Attention, Organization/
Impulse Control, Activity Level, Sociability) 84.4 85.8 82.9 84.7
Source: Table II.17.
Despite the generally positive evaluation, teachers identified a significant percentage of
children as “high risk” for behavioral or emotional problems that might warrant referral for
evaluation by a professional.
Across the five behavioral and emotional areas addressed in the C-PEP study, 16 percent of
children scored in high-risk ranges, a proportion consistent with the incidence of significant
behavioral issues reported by teachers in other studies (University of North Carolina 2008) and
the incidence of mental health problems for children and adolescents cited by the U.S. Surgeon
General (U.S. Department of Health and Human Services 1999).
While teachers’ ratings were generally positive, assessors rated children’s social-emotional
development during the assessment situation somewhat more negatively (Table 6). Overall,
children in Chicago’s early childhood education programs scored 84.4 on the Cognitive-Social
1d. How does the developmental status of 4-year-old children in Chicago’s
early childhood education programs in the fall compare with other
children in Head Start or state pre-kindergarten programs?
scale, about one standard deviation lower than the national average.7 However, the national
standardization sample included 4- to 6-year-old children, a broad age range compared with
children in this study, who at 4 years old were at the low end of this age range. The preschool-
age children in this study may have seemed less sociable than a typical 5- or 6-year-old because
they may have been less accustomed to interacting with an unknown adult in the school setting.
Moreover, the large proportion of children in the study who had difficulty understanding English
may have been more easily distracted from assessments that were conducted in English.
Across program types, children’s social-emotional development was similar, based on teacher
reports.
Table 6 shows that scores for Attention/Persistence, Social Interaction and Social
Withdrawal were close for all three groups. In only two areas, teachers’ ratings diverged.
Teachers rated children in Full-Day programs lower on Social Cooperation and higher on
externalizing behavior than children in the other programs, although the average ratings were
still well within healthy ranges for preschool-age children. The lower behavior ratings by Full-
Day program teachers may be due to increased opportunities to observe problem behaviors or to
lower tolerance for misbehavior after many hours with children.
At the beginning of the program year, children in Chicago’s Full-Day and Half-Day Head
Start programs had lower vocabulary ability and higher early literacy achievement than
children in Head Start nationally. Children in Chicago’s Preschool for All program had
lower vocabulary and early mathematics achievement than children in 11 state pre-
kindergarten programs in the fall. These differences in children’s development in the fall may
be related to the higher percentage of English Language Learners and lower parent education
levels among children in Chicago compared with their peers nationally.
To provide a benchmark for the developmental progress of children in Chicago, we compare
cognitive outcomes among children in Chicago’s early childhood education programs to
outcomes among children in the following recent national studies: The Head Start Family and
Child Experiences Study, 2003 cohort (Head Start FACES; ACF 2006) and the Multi-State
Study of Pre-Kindergarten and the State-Wide Early Education Program (SWEEP) studies (Early
et al. 2005). Unfortunately, social-emotional measures were not comparable across the studies.
Children in Chicago’s early childhood education programs were different in terms of
language background, parent education, and parent employment from the children in the
programs nationally. Children from the Chicago Head Start programs included in this study
(full- or half-day) are more likely to speak Spanish in the home than children in Head Start
7 An average of 84.4 means that approximately half of the children in Chicago’s early childhood education
programs received scores below 85, while just 16 percent of the national standardization sample scored below that
level.

nationally, based on the Head Start FACES 2003 report (38 percent versus 28 percent); their
parents have lower education levels (41 percent without a high school diploma in Chicago versus
28 percent in Head Start FACES); and their parents are more likely to be working full-time
(53 percent of caregivers in Chicago versus 35 percent of mothers in Head Start FACES).
Comparing children in Preschool for All programs with other state pre-kindergarten programs,
we find more children in Chicago for whom English is not the primary language at home
(56 percent in C-PEP versus 17 percent in eleven state pre-kindergarten programs).
We find that, at the beginning of the program year, children in Full-Day and Half-Day Head
Start programs in Chicago scored lower than Head Start 4-year-olds on receptive vocabulary, but
they exceeded Head Start children nationally in early literacy achievement and they scored
similarly to Head Start children on early mathematics. Children in Preschool for All programs
had average vocabulary and early mathematics achievement that was lower than scores for
children in state pre-kindergarten programs nationally. Differences in vocabulary ability
between children in Chicago’s early childhood education programs and the national programs
may reflect the differences in parents’ education levels and differences in the proportion of
children who speak English in the home, as well as other differences not measured in this study.
Higher early literacy achievement among Chicago’s Full-Day and Half-Day Head Start children
relative to Head Start 4-year-olds nationally may reflect the fact that children in the national
study were all new Head Start participants, while many of the children in Chicago’s early
childhood education programs had attended preschool for at least part of the previous year. Early
literacy achievement for 4-year-olds typically involves recognizing letters of the alphabet and
matching letters with their sounds. Since the number of letters to be learned is much less than the
number of vocabulary words that could be learned, it may be easier for children who have had
some exposure to preschool and to educational television to show achievement in early literacy
compared to vocabulary. Table 7 shows scores for vocabulary, early literacy, and early
mathematics.
TABLE 7
COGNITIVE DEVELOPMENT OF C-PEP CHILDREN IN THE FALL OF THE PRESCHOOL YEAR
AND OF CHILDREN IN NATIONAL PRESCHOOL STUDIES
C-PEP Head Start
Programs (Full-
and Half-Day)
Head Start
FACES 2003
C-PEP Preschool for
All Programs
Multi-State
Pre-Kindergarten
and SWEEP
Vocabulary
(PPVT) 80.5 85.8 85.1 94.0
Early Literacy
(WJ-LWI) 96.9 93.1 95.9 not rated
Mathematics
(WJ-AP) 86.9 88.4 90.7 98.4
Source: Table II.26. In most cases, C-PEP used more recent versions of the measures than did the national studies,
which were conducted three years earlier. The average PPVT score for C-PEP children is based on
children who completed other English-language assessments, rather than all children, for greater
comparability with the national studies.

2a. What are the demographic characteristics of teachers in CPS/CYS early
childhood classrooms? How much education, training, and teaching
experience do they have?
FIGURE 8
THE RACE/ETHNICITY OF TEACHERS IN FULL-DAY PROGRAMS IS MORE REFLECTIVE
OF THE RACE/ETHNICITY OF CHILDREN IN THE PROGRAMS THAN
IN HALF-DAY HEAD START OR PRESCHOOL FOR ALL
36%
40%
24%
0%
Latino White African American Other
27%
7%
26%
40%42%
3%
48%
7%
Full-Day Programs Half-Day Head Start Preschool for All
Source: MPR tabulations from C-PEP Teacher Interview. See Table III.1.
RESEARCH QUESTION 2
WHAT ARE THE CHARACTERISTICS OF TEACHERS AND THE QUALITY OF
CLASSROOMS IN CHICAGO’S EARLY CHILDHOOD EDUCATION PROGRAMS?
The Chicago preschool classrooms offer an early education environment to support
children’s development across a comprehensive range of domains, including cognitive and
social-emotional development and approaches to learning, in an effort to enhance young
children’s well-being and success in school. The Full-Day programs, Half-Day Head Start, and
Preschool for All set different educational and certification requirements for teachers, offer
different professional development opportunities, and operate on different schedules. These
policy differences directly influence the level of education that teachers have and the
professional development teachers receive in each program.
Teachers in Chicago’s early childhood education programs are primarily women and are
ethnically diverse.
Consistent with national patterns, nearly all of the teachers in Chicago’s early childhood
education programs are women.
The racial-ethnic background of teachers in Full-Day programs reflects that of the children
in the classrooms; 42 percent are Latino and 48 percent are African American In contrast, Half-
Day Head Start and Preschool for All programs have a larger proportion of white teachers, and
correspondingly fewer Latino teachers, than is true for the population of children in these
programs (Figure 8).

2b. What training and technical assistance are available to teachers on the
curriculum, and how do teachers obtain support?
FIGURE 9
TEACHERS IN HEAD START PROGRAMS HAVE AT LEAST AN ASSOCIATE’S DEGREE,
AND TEACHERS IN PRESCHOOL FOR ALL HAVE AT LEAST
A BACHELOR’S DEGREE
Source: MPR tabulations from C-PEP Teacher Interview. See Table III.4.
63
24
13
39
3130
0
31
69
0
10
20
30
40
50
60
70
Associate's Degree Bachelor's Degree Graduate Degree
Full-Day Programs Half-Day Head Start Preschool for All
Percentage of Teachers
Teacher education levels meet or exceed the requirements for Chicago’s early childhood
education programs, which are on the high end of such requirements nationally.
Teachers in Full-Day programs and community-based Half-Day Head Start programs must
have at least an associate’s degree; teachers in Preschool for All and Chicago Public Schools
Half-Day Head Start programs must have at least a bachelor’s degree. In fact, the majority of
teachers in Preschool for All programs have graduate degrees (Figure 9). Additionally, about
one-third of teachers were pursuing additional formal education opportunities at area colleges
and universities.
Preschool teachers in Chicago’s early childhood education programs generally have
considerable experience, whether based on a measure of any classroom experience (15 years
on average), preschool classroom experience (10 years on average), or years with their current
employer (6 years on average).
All of the programs have a substantial proportion of teachers with a decade or more of
experience teaching preschool, from 39 percent in Full-Day programs to 48 percent in Preschool
for All. However, the Preschool for All program also has a substantial proportion of teachers (31
percent) with fewer than 3 years of experience, reflecting significant recent growth in the
program.
The vast majority of teachers had received curriculum-related professional development in the
previous year.
Hours of professional development did not vary significantly across program groups.
Programs offered professional development support in different ways. Teachers in Full-Day
2c. What are teacher compensation levels and job benefits, and how satisfied
are teachers with their work and their work environment?
2d. How many teachers and children are in the classroom?
programs reported that mentors/master teachers or supervisors/education coordinators provided
professional development support. Half-Day Head Start programs relied on early childhood
coaches (for CPS programs), supervisors/education coordinators, or regional office training and
technical assistance staff (for CYS programs). Preschool for All programs primarily offered
early childhood coaches. Numbers of professional development hours may be underestimates
because the teacher survey question asked only about curriculum-focused training. Teachers
may have received additional professional development unrelated to the curriculum.
Teachers’ earnings vary considerably by program, which could reflect the various funding
streams that support these programs or differing levels of teacher education in each program.
Average annual earnings were $30,400 for Full-Day programs, $39,400 for Half-Day Head
Start, and $51,800 for Preschool for All. Across all programs, most teachers reported receiving
benefits, such as vacation, health coverage, and retirement benefits, as part of their
compensation.
Teachers across all three programs reported high levels of satisfaction with teaching as their
daily work and as a career. Teachers also tended to be positive about the level of program
support.
Nevertheless, the work of a preschool teacher can be challenging. When asked an open-
ended question about the biggest challenge they faced, teachers identified several different
issues, including parents with low levels of education who cannot easily extend learning at home,
excessive paperwork, meeting the diverse needs of children, and the management of children’s
behavior (Figure 10). Many of the responses indicate concerns about how much the children
need to learn during the preschool year in order to be ready for school.
Group sizes and child-teacher ratios in Chicago’s early childhood classrooms were within
professional guidelines set by the National Association for the Education of Young Children
(18 or fewer children in classes with 3-year-olds and 20 or fewer children in classes with 4-
year-olds).
Full-Day program and Preschool for All classrooms were similar in size, with about
19 students on average and child-teacher ratios of 8.6 or 8.7, respectively, to 1. Half-Day Head
Start classrooms had an average of 16 children and a child-teacher ratio of 7.6 to 1.

2e. What curricula are used, what learning activities take place, and what
assessments do teachers use? What activity centers focusing on math,
reading, computers, science, drama, and so on are available to children?
FIGURE 10
TEACHERS CITED MANY CHALLENGES IN TEACHING PRESCHOOL
Source: MPR tabulations from C-PEP Teacher Interview. See Table III.20.
2
5
5
7
10
14
14
18
23
0 10 20 30
Teachers Who Cited Challege
Partnering with parents
Excessive paperwork
Meeting children’s diverse needs
Managing children’s behavior
Not enough support from program
Percentage of Teachers
Enough time to do everything
Children’s language barriers
Desire to improve as a teacher
Child turnover
Challenge:
Most teachers use the Creative Curriculum as their primary curriculum (69 percent).
The three early childhood education programs included in the study have basic requirements
for the educational program, although they do not prescribe a specific curriculum. In addition to
Creative Curriculum, many teachers use other, secondary curricula to strengthen early literacy or
early mathematics activities. Among the three programs, Preschool for All teachers are least
likely to use the Creative Curriculum as their primary curriculum (52 percent) and often employ
Opening the World of Learning as the primary curriculum (15 percent).
Teachers reported using similar initial screening assessments and they assess children three
times during the preschool year to inform their teaching.
Most teachers (88 percent) reported screening children at the start of the year using the Early
Screening Inventory–Revised (ESI-R; Meisels, Marsden, Wiske, and Henderson 2006). In
keeping with Head Start requirements, the Full-Day and Half-Day Head Start teachers also start
the year with a mental health screener. Full-Day Head Start primarily employs the Ages &
Stages Questionnaire: Social Emotional (ASQ:SE; Squires, Bricker, and Twombly 2002), while
Half Day Head Start teachers use that screener or the ABLE Mental Health Scales (Barbarin

FIGURE 11
TEACHERS REPORTED CONDUCTING MANY LANGUAGE AND
READING ACTIVITIES 3 OR MORE TIMES EACH WEEK
Source: MPR tabulations from C-PEP Teacher Interview. See Table III.16.
55
57
60
68
68
76
77
83
85
97
100
0 20 40 60 80 100
3+ Times per Week
Listen to teacher read stories
Learn names of letters
Learn about conventions of print
Write their own names
Discuss new words
Practice writing alphabet letters
Work on phonics
Dictate stories to an adult
Retell stories
Learn about rhyming words
Percentage of Classrooms
Learn about common prepositions
2004). Head Start teachers assess children three times during the school year, using the Creative
Curriculum Developmental Continuum (Dodge et al. 2002), which is accessed and recorded on
the web-based CreativeCurriculum.net and can tie assessment findings back to the curriculum.8
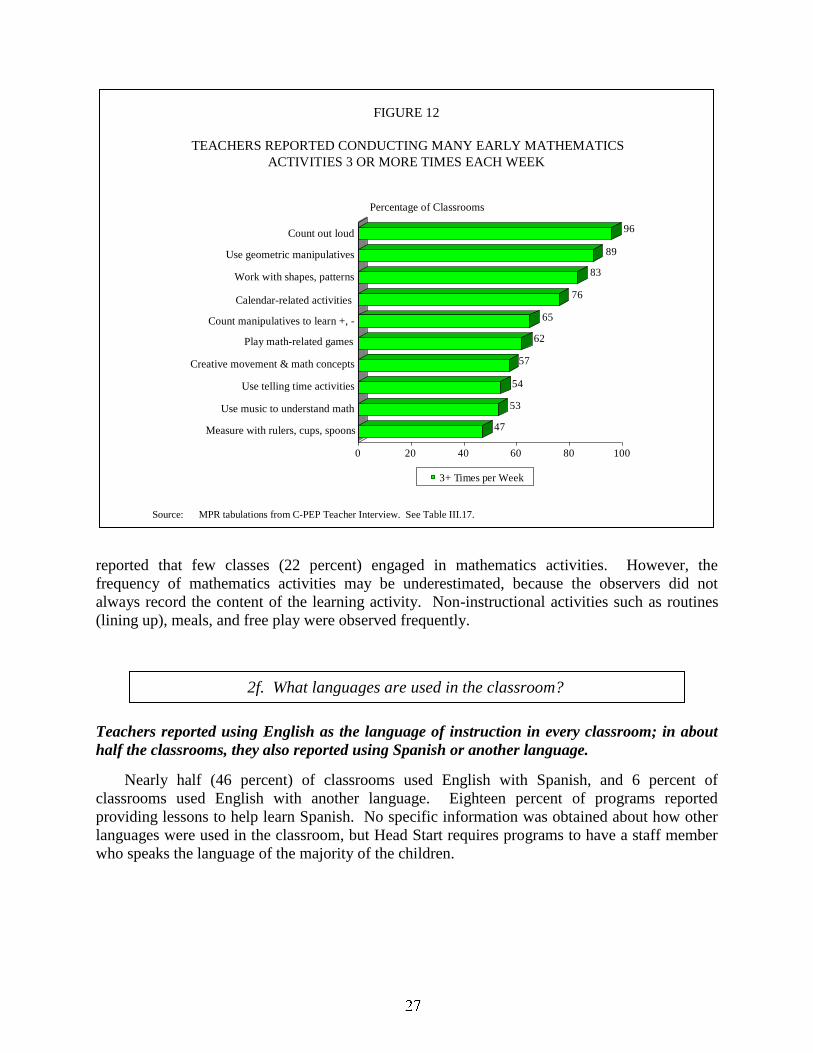
Chicago’s early childhood education classrooms have a full range of activity centers, and
teachers engage in varied learning activities each week.
Activity centers include areas for reading, writing, mathematics, science, computer work,
art, and dramatic play and private areas in which children can be alone. Most teachers reported
conducting reading, language, and mathematics activities with high frequency (three or more
times per week). High-frequency reading and language activities included book reading,
learning letter names and conventions of print, writing children’s names, and discussing new
words (Figure 11). High-frequency mathematics activities included counting; working with
geometric manipulatives, shapes, or patterns; and working with counting manipulatives
(Figure 12). Observations of the classroom indicated that a high proportion of classes
(90 percent) engaged in language or literacy activities. Despite teacher reports, observers
8 At the time of the C-PEP study, CPS teachers were using the Child Assessment Profile, developed by CPS for
its early childhood programs. However, CPS began using the Creative Curriculum assessment in 2007-08 .
2f. What languages are used in the classroom?
reported that few classes (22 percent) engaged in mathematics activities. However, the
frequency of mathematics activities may be underestimated, because the observers did not
always record the content of the learning activity. Non-instructional activities such as routines
(lining up), meals, and free play were observed frequently.
Teachers reported using English as the language of instruction in every classroom; in about
half the classrooms, they also reported using Spanish or another language.
Nearly half (46 percent) of classrooms used English with Spanish, and 6 percent of
classrooms used English with another language. Eighteen percent of programs reported
providing lessons to help learn Spanish. No specific information was obtained about how other
languages were used in the classroom, but Head Start requires programs to have a staff member
who speaks the language of the majority of the children.
FIGURE 12
TEACHERS REPORTED CONDUCTING MANY EARLY MATHEMATICS
ACTIVITIES 3 OR MORE TIMES EACH WEEK
Source: MPR tabulations from C-PEP Teacher Interview. See Table III.17.
47
53
54
57
62
65
76
83
89
96
0 20 40 60 80 100
3+ Times per Week
Count out loud
Use geometric manipulatives
Work with shapes, patterns
Calendar-related activities
Count manipulatives to learn +, -
Percentage of Classrooms
Play math-related games
Creative movement & math concepts
Use telling time activities
Use music to understand math
Measure with rulers, cups, spoons

2g. What is the level and range of emotional support, instructional support,
classroom organization, and provisions for learning in CPS/CYS early
childhood classrooms? How do they compare to other preschool
classrooms in the United States?
The quality of emotional support and provisions for learning in most of Chicago’s early
childhood classrooms was in the middle to high range. The quality of classroom organization
was in the middle range, and the quality of instructional support was in the low to middle
range. Across these dimensions of quality, Chicago’s early childhood classrooms were similar
to Head Start and state pre-kindergarten classrooms nationally.
Several dimensions of preschool classroom quality and teacher behavior have been
identified as important for young children’s development (e.g. Helbern 1995). In C-PEP, we
measured the following aspects of quality (see Table 8): (1) provisions and materials for
learning, (2) emotional supportiveness of the interactions between teachers and students,
(3) classroom organization, and (4) instructional support. These dimensions of quality were
measured using the Early Childhood Environment Rating Scale–Revised (ECERS-R) and the
Classroom Assessment Scoring System (CLASS). We assessed the materials available for
learning with the ECERS-R Provisions for Learning subscale. The ECERS-R Teaching and
Interactions subscale measures the emotional and educational quality of interactions and the
encouragement of language development. The CLASS Emotional Support subscale measures
positive and negative aspects of the emotional climate in the classroom and the teacher’s
sensitivity to children and ability to encourage children to express ideas and practice autonomy.
The CLASS Classroom Organization subscale captures factors such as the pro-active
management of children’s behavior, the efficient use of classroom time for learning activities,
and the use of multiple modes of instruction. Finally, the CLASS Instructional Support subscale
measures the teacher’s modeling of rich and varied language, provision of high-quality feedback
to scaffold children’s learning, and support for concept development that deepens understanding.
All of these scales are scored from 1 to 7, with 7 indicating the highest quality.
TABLE 8
DIMENSIONS OF CLASSROOM QUALITY MEASURED IN C-PEP
Dimension Instrument
Teaching and Interactions Early Childhood Environment Rating Scale-Revised (ECERS-R; Harms,
Clifford, and Cryer 1998; Clifford et al. 2005)
Provisions for Learning ECERS-R
Emotional Support Classroom Assessment Scoring System (CLASS; Pianta et al. 2008)
Classroom Organization CLASS
Instructional Support CLASS

FIGURE 13
MOST CLASSROOMS WERE IN THE MIDDLE TO HIGH RANGE
OF EMOTIONAL SUPPORT
01
3
23
44
28
0
0
10
20
30
40
50
1.0 - 1.9 2.0 - 2.9 3.0 - 3.9 4.0 - 4.9 5.0 - 5.9 6.0 - 6.9 7
Emotional Support
Percentage of Classrooms
Source: Authors’ tabulations from Chicago Program Evaluation Project Classroom Observations.
The Chicago early childhood education programs included in the C-PEP study scored in the
middle to high range for materials for learning. On the ECERS-R Provisions for Learning
subscale, which measures the quality of classroom furnishings and materials for learning in the
preschool classrooms, the Chicago early childhood education classrooms averaged 5.1 on a scale
ranging from 1 to 7, corresponding to a ―good‖ rating. Nearly all classrooms (92 percent) scored
between 4 and 7 on this subscale. Since this scale reflects program support rather than individual
teacher choices, it suggests that the programs generally provide adequate materials and
furnishings to support a good-quality preschool program.
The preschool classrooms scored in the middle to high range for emotional supportiveness.
Teachers’ emotional supportiveness was measured by both the ECERS-R Teaching and
Interactions subscale and the CLASS Emotional Support subscale. Scores on the Teaching and
Interactions subscale averaged 5.0, corresponding to a ―good‖ rating on the ECERS-R, with the
majority of classrooms (85 percent) scoring between 4 and 7. The 15 percent of classrooms that
fell below that range suggest significant issues with teacher-child interactions and children’s
experiences in those classrooms. Emotional Support in Chicago preschool classrooms was rated
5.4 on average, which is on the high end of the middle range for CLASS scores. (The middle
range of the CLASS includes scores from 3 to 5.) Just over one-quarter of classrooms scored in
the high range (6 to 7), which reflects a consistently high level of teacher responsiveness and
positive affect in the classroom (Figure 13).
Classrooms in the C-PEP study scored in the middle range for classroom organization.
Classrooms scored an average of 4.8 on the CLASS Classroom Organization subscale, which
measures the extent to which teachers use proactive, anticipatory behavior management, get the
most out of each learning day, and use multiple modes of instruction to maintain children’s
interest in learning.
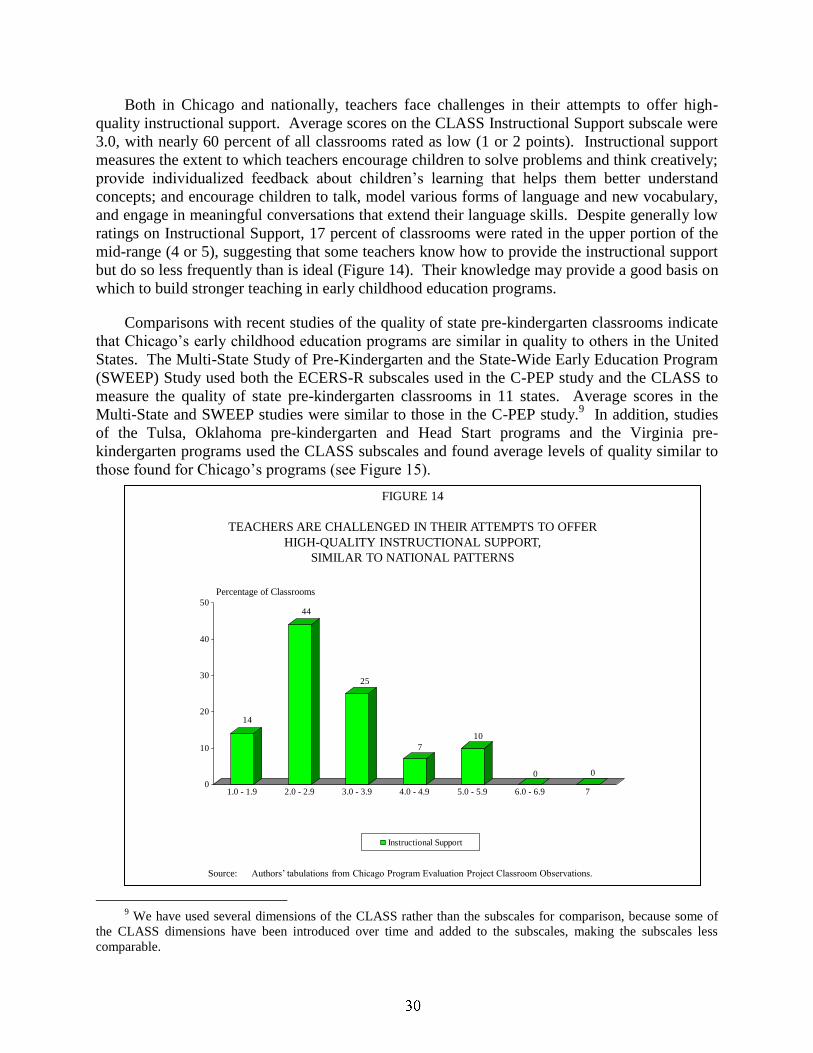
Both in Chicago and nationally, teachers face challenges in their attempts to offer high-
quality instructional support. Average scores on the CLASS Instructional Support subscale were
3.0, with nearly 60 percent of all classrooms rated as low (1 or 2 points). Instructional support
measures the extent to which teachers encourage children to solve problems and think creatively;
provide individualized feedback about children’s learning that helps them better understand
concepts; and encourage children to talk, model various forms of language and new vocabulary,
and engage in meaningful conversations that extend their language skills. Despite generally low
ratings on Instructional Support, 17 percent of classrooms were rated in the upper portion of the
mid-range (4 or 5), suggesting that some teachers know how to provide the instructional support
but do so less frequently than is ideal (Figure 14). Their knowledge may provide a good basis on
which to build stronger teaching in early childhood education programs.
Comparisons with recent studies of the quality of state pre-kindergarten classrooms indicate
that Chicago’s early childhood education programs are similar in quality to others in the United
States. The Multi-State Study of Pre-Kindergarten and the State-Wide Early Education Program
(SWEEP) Study used both the ECERS-R subscales used in the C-PEP study and the CLASS to
measure the quality of state pre-kindergarten classrooms in 11 states. Average scores in the
Multi-State and SWEEP studies were similar to those in the C-PEP study.9 In addition, studies
of the Tulsa, Oklahoma pre-kindergarten and Head Start programs and the Virginia pre-
kindergarten programs used the CLASS subscales and found average levels of quality similar to
those found for Chicago’s programs (see Figure 15).
9 We have used several dimensions of the CLASS rather than the subscales for comparison, because some of
the CLASS dimensions have been introduced over time and added to the subscales, making the subscales less
comparable.
FIGURE 14
TEACHERS ARE CHALLENGED IN THEIR ATTEMPTS TO OFFER
HIGH-QUALITY INSTRUCTIONAL SUPPORT,
SIMILAR TO NATIONAL PATTERNS
14
44
25
7
10
0 0
0
10
20
30
40
50
1.0 - 1.9 2.0 - 2.9 3.0 - 3.9 4.0 - 4.9 5.0 - 5.9 6.0 - 6.9 7
Instructional Support
Source: Authors’ tabulations from Chicago Program Evaluation Project Classroom Observations.
Percentage of Classrooms

2h. What are the relationships among teacher characteristics, program
characteristics, and aspects of classroom quality (including emotional
support, instructional quality, and provisions for learning)?
Teacher education, professional development, and experience are associated with higher
quality measured by the CLASS Instructional Support and Classroom Organization subscales.
Subgroup analyses found that instructional quality was higher when teachers had graduate
degrees compared with associate’s degrees. Subgroup analyses also found that instructional
quality was higher when teachers had 10 or more years of preschool teaching experience.
However, additional variables may be influencing these relationships between education,
experience, and quality.
Multivariate analyses measured associations between classroom quality and teacher
characteristics (education, experience, professional development focusing on the curriculum),
classroom characteristics (child-staff ratios) and program (Full Day program, Half-Day Head
Start in CYS, or Preschool for All). We separately examined each subscale of classroom quality,
including CLASS Instructional Support, CLASS Classroom Organization, CLASS Emotional
Support, ECERS-R Teaching and Interactions, and ECERS-R Provisions for Learning. In these
analyses, any effect of program type indicates that some aspect of program-related policy or
support that we were unable to measure separately has an influence on quality.
FIGURE 15
CHICAGO EARLY CHILDHOOD CLASSROOMS ARE SIMILAR IN QUALITY
TO THOSE IN OTHER STATES ON
SELECTED DIMENSIONS OF THE CLASS
Average Score (Scale 1-7)
Source: MPR compilation from C-PEP Observations and other studies. For comparison, we have selected several dimensions of
the CLASS that make up the subscales because some dimensions have been introduced over time, making subscales less comparable.
5.4 5.35.1 5.0
5.2
4.8 4.74.8 4.8
4.3
5.3
5.0 5.04.4 4.9 5.0
4.4
5.2 5.15.4
2.82.1
2.82.6 2.7
3.33.5
3.7
2.9
0
1
2
3
4
5
6
7
Positive Climate Teacher Sensitivity Behavior Management Productivity Concept Development Language Modeling
C-PEP Classrooms Multi-State & SWEEP Tulsa Pre-K Tulsa Head Start Virginia Pre-K
Teacher education—in particular, having a graduate degree—was related to higher ratings
on both Instructional Support and Classroom Organization, controlling for other teacher and
program characteristics. Higher ratings on Classroom Organization were positively related to
teachers having a bachelor’s or a graduate degree and 20 or more years of experience teaching
preschool. Lower child-staff ratios were related to more positive quality ratings. The positive
correlation between subscales that relate to the preschool classroom’s educational environment
and the teacher’s education and experience as well as the number of children in the classroom
suggest a role for standards in enhancing the educational environment of preschool classrooms
that could be explored using more rigorous research designs.
These analyses also found that unmeasured program-specific characteristics were associated
with the quality ratings. Policies, educational requirements, and support for professional
development across the programs should be examined in more detail to identify differences that
should be explored in future research. Nevertheless, many potentially important factors have not
been included in these models, as in total, the teacher, classroom, and program characteristics
measured here only accounted for one-quarter of the variance in the ratings of Instructional
Support and Classroom Organization.
Higher ratings on CLASS Emotional Support were related to unmeasured program
characteristics and (inversely) to child-staff ratios. Higher ratings on Teaching and Interactions
related to preschool teaching experience beyond the novice level (three or more years) and
inversely to child-staff ratios. This suggests that with fewer children, teachers can dedicate more
time to enhancing the emotional as well as the instructional qualities of the classroom.
Provisions for Learning, which measures the quality and availability of equipment and
materials considered to be important components of a preschool classroom, appears to be largely
related to unmeasured program characteristics and not to teacher characteristics. This is
consistent with the idea that programs provide resources for and establish expectations regarding
the equipment and materials found in preschool classrooms. Teachers are not on their own in
choosing all of the materials and equipment in their classrooms, so it is not surprising that
teacher characteristics are not related to this measure of quality.

3a. How much progress do children in Chicago’s early childhood education
programs make in language development, early literacy skills, and early
mathematics skills during the preschool year? How does this compare
with preschoolers nationally?
RESEARCH QUESTION 3
WHAT DEVELOPMENTAL PROGRESS DO CHILDREN MAKE
DURING THE PRESCHOOL YEAR?
Children in Chicago’s early childhood programs made significant progress in language
development, early literacy skills, and early mathematics skills during the five- to six-month
period encompassed by the fall and the spring assessments; the gains were likely greater over
the full preschool year.
Children from homes where Spanish or another language was the primary language made
greater progress than children from English-primary homes.
By the spring assessment point, children scored on average close to the national mean in early
literacy (99). Their average score was below the national average of 100—at 87 and 91
respectively—in English vocabulary and mathematical reasoning.
Table 10 presents the gains in cognitive achievement over the five- to six-month period
encompassed by the fall and spring assessments, as well as the effect sizes for those gains.
Effect sizes enable us to make comparisons of the gains across the different domains of
development by putting the gain scores into standard deviation units. Effect sizes can be judged
using a rule of thumb laid out by Cohen (1988), which suggests that an effect size of .2 is small,
.5 is medium, and .8 is large. To calculate effect sizes, we divided the gain score by the standard
deviation of the assessment (for standardized measures we used 15 as the standard deviation).
English-Language Threshold. Seventy-nine percent of children scored above the threshold
for English-language ability in the spring, an 11 percent increase over the proportion that
exceeded this threshold in the fall. The effect size of .24 indicates that the rate improved by
about one-quarter of a standard deviation. Nevertheless, approximately 20 percent of the
children appeared to still have difficulty understanding spoken English in April or May, after
seven to eight months in the preschool classroom.
Vocabulary. Table 10 presents English vocabulary scores for children who took the PPVT-
4, regardless of the language spoken at home. Children’s receptive vocabulary increased to 86.8
in the spring, an increase of 4.8 points over the fall score obtained five to six months earlier, or
nearly one-third of a standard deviation gain.

TABLE 10
COGNITIVE DEVELOPMENT OF CHILDREN DURING THE PRESCHOOL YEAR FOR THOSE
WHO HAD VALID SCORES ON COGNITIVE ASSESSMENTS IN THE FALL
AND THE SPRING (A FIVE- TO SIX-MONTH PERIOD)a
Falla
Spring Gain Effect Size
English Language Ability (Percentage above threshold) 68.4 79.4 11.0* .24
Language Development
All Children: English Vocabulary (PPVT-4) 82.0 86.8 4.8* .32
Children from English Primary Homes:
English Vocabulary (PPVT-4) 87.6 90.5 2.9* .19
Children from Spanish/Other Primary Homes:
English Vocabulary (PPVT-4) 75.7 82.7 7.0* .47
Children from Spanish Primary Homes:
Spanish Vocabulary (TVIP) 82.1 85.3 3.2 .21
Early Literacy and Mathematics Achievement
Literacy (WJ-III) 96.3 98.9 2.5* .17
Mathematics—Numbers (WJ-III) 89.5 91.4 1.9* .13
Mathematics—Patterns (ECLS-B) 490.3 497.0 6.8* .61
Source: Tables IV.2 and IV.4.
aThe average fall scores presented here differ slightly from those presented in Table 2, because we exclude children
who (1) did not have an assessment score available in the spring, and (2) took the Spanish version of the cognitive
assessments in the fall and the English version in the spring. Most children who were excluded in the spring
(12 percent of the original fall sample) had left the program after the fall assessment. Children with fall and spring
assessments were somewhat more advantaged than those who left the sample after the fall assessment. Children
with both fall and spring assessments had slightly higher scores on the fall English Vocabulary assessment and were
slightly more likely to have parents who reported being married and having annual family incomes over $20,000.
Comparing children’s English vocabulary scores by home language shows that children
from homes in which Spanish or another language was the primary language made much larger
gains than did children from English-primary homes. Children from Spanish/other language-
primary homes increased their scores by 7 points, from 75.7 in the fall to 82.7 in the spring,
while children from English-primary homes increased their scores by 2.9 points, from 87.6 in the
fall to 90.5 in the spring. Figures 16 and 17 display the distribution of fall and spring scores for
both groups of children. Scores below 85 are substantially below the average for 4-year-old
children nationally, since 16 percent of all 4-year-olds scores are in this range. For this reason,
85 is considered a threshold to indicate children who are at educational risk. In both English-
primary and Spanish/other language-primary subgroups of children, significantly fewer children
scored below 85 in the spring compared with the fall, and more scored between 85 and 100.
Among children from Spanish-primary homes, Spanish vocabulary also improved over the
five- to six-month period encompassed by the child assessments. The increase in TVIP scores
from the fall to the spring was not statistically significant; however, fewer children scored below

FIGURE 16
MOST CHILDREN FROM ENGLISH-SPEAKING HOMES SCORED BELOW THE NATIONAL
AVERAGE FOR VOCABULARY (100 POINTS) IN THE FALL AND SPRING,
BUT SCORES IMPROVED OVER TIME
38
28
42
49
18 19
3 4
0
10
20
30
40
50
60
Below 85 85-100 100-115 Above 115
English Vocabulary Scores
Fall (N = 298) Spring (N = 298)
Percentage of Children
Source: Authors’ tabulations from Chicago Program Evaluation Project Fall and Spring Child Assessments.
FIGURE 17
FEWER CHILDREN FROM SPANISH/OTHER LANGUAGE-PRIMARY HOMES SCORED
IN THE BOTTOM 16 PERCENT OF CHILDREN NATIONALLY (BELOW 85 POINTS)
IN ENGLISH VOCABULARY IN THE SPRING THAN IN THE FALL
68
50
22
40
9 9
0 1
0
10
20
30
40
50
60
70
80
Below 85 85-100 100-115 Above 115
English Vocabulary Scores
Fall (N = 272) Spring (N = 272)
Percentage of Children
Source: Authors’ tabulations from Chicago Program Evaluation Project Fall and Spring Child Assessments.

85 (a threshold for educational risk) in the spring than in the fall (21 percent in the spring
compared with 34 percent in the fall).
Literacy. Children’s early literacy achievement reached 98.9 points in the spring, a
2.5 point increase over the five- to six-month period since the fall assessment, and close to the
national average of 100 for 4- to 5-year-old children. As in the case of English vocabulary, gains
in early literacy from the fall to the spring assessments were larger for children whose home
language was Spanish/other than for children whose home language was English. The increase
of 2.5 standard points in measured early literacy achievement is fairly small, but children in
Chicago’s early childhood education programs performed near the averages for preschoolers
nationally. Moreover, fewer children scored below 85 on the early literacy assessment in the
spring than in the fall (16 percent in the spring compared with 29 percent in the fall).
Mathematics. Children’s early mathematics achievement on the WJ-III was 91.4 in the
spring, an increase of 1.9 points over their performance five to six months earlier in the fall.
Gains for children were similar regardless of home language. The smaller increase in early
mathematics achievement relative to language development may be attributable to less-frequent
mathematics-related activities during the preschool day compared with language-related
activities. On the Early Mathematics Assessment (ECLS-B), scores increased by 6.8 points from
the fall to the spring.10
National Comparisons. A national study of children in Head Start (Head Start FACES,
2003 cohort; ACF 2006) and the eleven-state study of state pre-kindergarten programs (Howes et
al. 2008) provide benchmarks for comparing the cognitive gains made by children in Chicago’s
early childhood education programs to children nationally. Such comparisons should be viewed
cautiously, as the national studies are a few years older than C-PEP (2001-2004 compared to
2006-2007), the measures used in C-PEP are more recent, and as mentioned earlier, Chicago’s
children may be at greater educational risk than the national samples because of higher
proportions of English Language Learners and parents with lower levels of education. Therefore,
we need to judge differences across the studies carefully.
As noted earlier, children in Chicago’s early childhood education programs gained 4.8
standard points on the vocabulary assessment, while nationally, children in Head Start gained 3.1
points and children in eleven state pre-kindergarten programs gained 2.9 points. The larger gain
for children in Chicago could reflect the larger proportion of English Language Learners in the
sample, who made greater gains in vocabulary during the preschool year than children from
English-primary homes. The substantial progress on English vocabulary made by English
Language Learners could reflect rapid improvement from very low initial levels, good classroom
instructional practices, and other factors. Children in Chicago’s early childhood education
programs gained 2.5 points on the early literacy assessment while children in Head Start
nationally gained 0.7 points; this assessment was not used in both of the state pre-kindergarten
studies. The difference in scores may reflect demographic differences, instruction, and
3b. How does children’s risk status relate to cognitive development
during the preschool year?
3c. What are the relationships among measures of classroom quality, such as
emotional support, instructional support, and provisions for learning,
and children’s cognitive development during the preschool year?
differences in the assessment, as C-PEP used a more recent version of the early literacy
assessment, with more recent normative comparisons to a nationally-representative sample.
Finally, children in Chicago’s early childhood education programs gained 1.9 points on the early
mathematics (numbers) assessment, while nationally, children in Head Start demonstrated a gain
of 1.5 points, and children in state pre-kindergarten programs gained 1.2 points.
Thus, the gains by children in Chicago’s early childhood education programs in cognitive
development over the five to six months between the fall and the spring assessments represent
progress for educationally at-risk children. Given the study design, we cannot be certain about
how much of the improvement is attributable to the programs or to other characteristics of
children’s home or out-of-home experiences, but children in Chicago clearly made learning gains
during the preschool year.
Children’s risk status appears to have a strong relationship with the level of cognitive
development in both the fall and the spring, but it does not appear to influence the size of the
cognitive gains that children make.
Subgroup analyses comparing children in high-risk (three or more risk factors) and lower-
risk families (fewer risk factors) show that the gains in cognitive development during the five- to
six-month period encompassed by the fall and spring assessments were similar across risk
groups. Children with high family risk who started out with lower cognitive assessment scores
in the fall continued to have lower scores in the spring.
The size of children’s cognitive gains between the fall and the spring were not related to
instructional support or emotional support in the preschool classrooms. This lack of a
statistical relationship may reflect insufficient variation in the measures of quality in this
sample, too few classrooms to detect a relationship, or it may reflect a greater influence of
home environments over preschool environments.
In subgroup analyses, we find no difference in children’s cognitive gains over the 5 to 6
month period between the fall and spring child assessments based on the level of classroom
Instructional Support (CLASS) or Emotional Support (CLASS). The gains in cognitive
development made by children in classrooms rated higher on Instructional Support (3.5 or above)
were not significantly different from the gains made by children in classrooms rated lower on
instructional support. Similarly, the gains in cognitive development made by children in
classrooms rated higher on emotional support (6.0 or above) were not significantly different from
the gains made by children in classrooms rated lower on emotional support.

3d. Do children’s levels of attention/persistence improve during the preschool
year? How do children’s social skills and levels of problem behaviors
change during the preschool year? How does this vary by risk status?
The lack of a relationship between higher Instructional Support and the size of children’s
cognitive gains may reflect the fact that the threshold for higher Instructional Support (which
includes just one-third of the classrooms) is in fact not high enough. Pianta et al. (2008) define
―high‖ scores on the Instructional Support subscale as ranging from 6 to 7, but the C-PEP study
found no classrooms scoring in this range. Instead, we looked for differences in child outcomes
between children in low-scoring classrooms and those in mid-range-scoring classrooms. This
comparison may not have provided enough variation in instructional support to find differences
in children’s cognitive gains. Additionally, the sample of classrooms may be too small to detect
differences in average cognitive gains across these subgroups. Further, it is possible that the
influence of children’s home environments overwhelms any possible influences of good
instruction in the classrooms. Consistent with other research in the field, multiple influences on
children’s development make it difficult to measure the contribution of any one of them. There is
significant need for additional research on the contribution of good preschool instructional
practices to children’s cognitive gains in preschool.
Children’s Attention/Persistence and social behavior improved during the five- to six-month
period encompassed by the fall and the spring assessments, while behavior problems remained
at low levels.
Children’s ability to settle into activities, avoid distraction and concentrate, pay attention to
the teacher, and cooperate with group activities—characteristics measured by the
Attention/Persistence subscale—are critical abilities for success in learning in school settings. In
addition, social behavior, including cooperation, empathy, the ability to compromise with peers,
and social leadership, reflect social skills that will help children interact positively with peers and
adults in school. Teachers reported that children’s Attention/Persistence and social behavior
improved between the fall and the spring, and the incidence of behavior problems remained
steady at fairly low levels between the fall and the spring (see Table 11). The assessors also
rated children more favorably in the spring compared with the fall on the Cognitive-Social scale,
corroborating the teachers’ positive ratings of children’s attention, self-control, and social
behavior.
Improvements in children’s social-emotional development were not related to the number of
demographic risk factors.
Improvements in children’s social-emotional development between the fall and the spring
did not differ significantly by whether children had more demographic risk factors (three or
more) or fewer risk factors. With only one exception (Attention/Persistence, favoring children
with fewer demographic risks), teachers’ and assessors’ ratings of children’s behavior during the
spring assessment did not differ significantly by family risk subgroup.
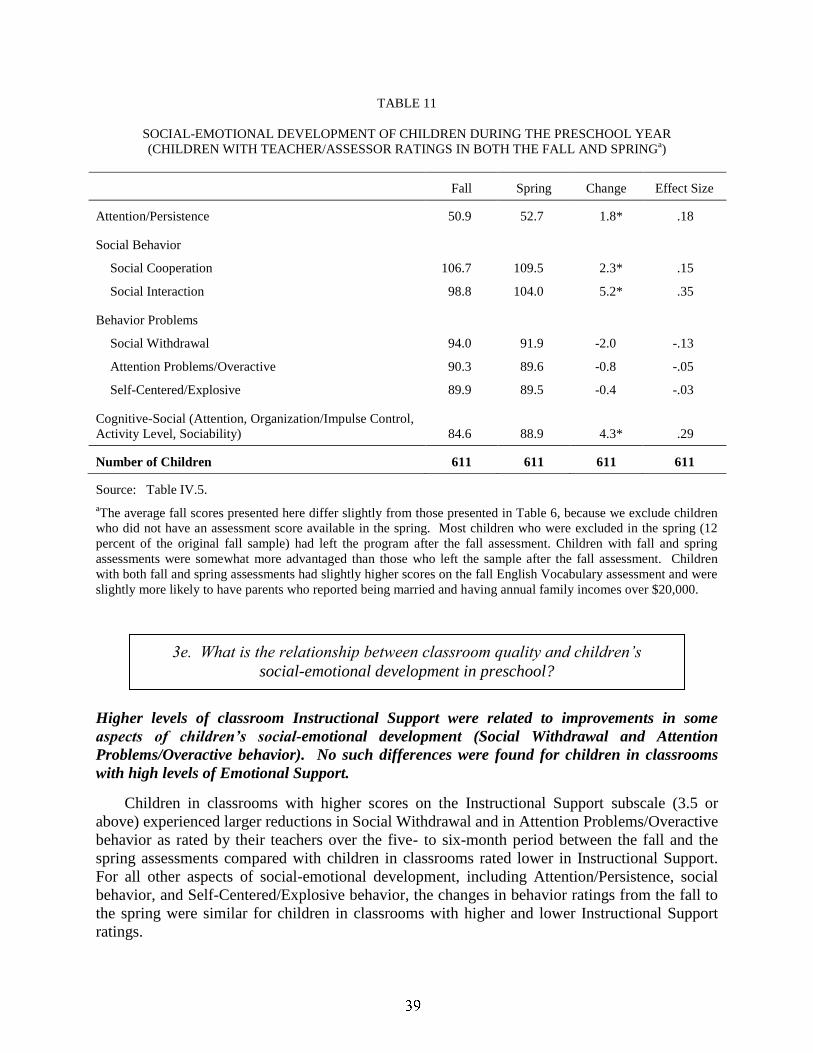
3e. What is the relationship between classroom quality and children’s
social-emotional development in preschool?
TABLE 11
SOCIAL-EMOTIONAL DEVELOPMENT OF CHILDREN DURING THE PRESCHOOL YEAR
(CHILDREN WITH TEACHER/ASSESSOR RATINGS IN BOTH THE FALL AND SPRINGa)
Fall Spring Change Effect Size
Attention/Persistence 50.9 52.7 1.8* .18
Social Behavior
Social Cooperation 106.7 109.5 2.3* .15
Social Interaction 98.8 104.0 5.2* .35
Behavior Problems
Social Withdrawal 94.0 91.9 -2.0 -.13
Attention Problems/Overactive 90.3 89.6 -0.8 -.05
Self-Centered/Explosive 89.9 89.5 -0.4 -.03
Cognitive-Social (Attention, Organization/Impulse Control,
Activity Level, Sociability) 84.6 88.9 4.3* .29
Number of Children 611 611 611 611
Source: Table IV.5.
aThe average fall scores presented here differ slightly from those presented in Table 6, because we exclude children
who did not have an assessment score available in the spring. Most children who were excluded in the spring (12
percent of the original fall sample) had left the program after the fall assessment. Children with fall and spring
assessments were somewhat more advantaged than those who left the sample after the fall assessment. Children
with both fall and spring assessments had slightly higher scores on the fall English Vocabulary assessment and were
slightly more likely to have parents who reported being married and having annual family incomes over $20,000.
Higher levels of classroom Instructional Support were related to improvements in some
aspects of children’s social-emotional development (Social Withdrawal and Attention
Problems/Overactive behavior). No such differences were found for children in classrooms
with high levels of Emotional Support.
Children in classrooms with higher scores on the Instructional Support subscale (3.5 or
above) experienced larger reductions in Social Withdrawal and in Attention Problems/Overactive
behavior as rated by their teachers over the five- to six-month period between the fall and the
spring assessments compared with children in classrooms rated lower in Instructional Support.
For all other aspects of social-emotional development, including Attention/Persistence, social
behavior, and Self-Centered/Explosive behavior, the changes in behavior ratings from the fall to
the spring were similar for children in classrooms with higher and lower Instructional Support
ratings.
3f. How do cognitive and social-emotional development relate to family
background (risk status and home language), classroom quality,
and program characteristics (full-day or half-day)?
We found no differences in children’s progress in Attention/Persistence, social behavior, and
behavior problems when we compared those in classrooms with high scores on the Emotional
Support subscale (6.0 or higher) and lower scores on that subscale. The lack of any difference
may reflect very little variation on this subscale, as most classrooms that were not rated 6.0 or
higher were rated very close to that level (see Figure 13).
Classroom quality, teacher characteristics, and program characteristics are not consistently
associated with children’s cognitive gains; however, higher family risk status is associated
with smaller gains in vocabulary and early mathematics for children from English-primary
homes.
To further explore the influence of family background, classroom quality and program
characteristics on cognitive development from the fall to the spring, we conducted multivariate
analyses of children’s gains on tests of English vocabulary, literacy and mathematics (WJ III,
Applied Problems). Because descriptive information shows that cognitive development between
the fall and the spring was very different for children from homes in which English is the
primary language and those in which Spanish/other languages were primary, we conducted
separate analyses for these two groups. In our analyses, we controlled for additional
characteristics of the children and teachers so that we could isolate the effects of key variables.
Classroom quality, teacher characteristics, and program characteristics are not consistently
associated with children’s cognitive gains; however, family risk status is. We find that children
from English-primary homes with higher demographic risk levels (three or more risks) had
smaller gains on assessments of English vocabulary and early mathematics achievement than
children from families with low risk levels. For children from homes with a primary language
other than English, having a higher number of family risk factors was not related to the size of
cognitive gains between the fall and the spring. Finally, having a higher number of family risk
factors had no relationship to changes in early literacy achievement for children, regardless of
the primary language spoken at home.
None of the other family background or teacher characteristics was consistently associated
with children’s fall to spring progress in English vocabulary ability, early literacy achievement,
or early mathematics achievement. Teacher education was positively associated with gains in
early literacy for children in both home-language subgroups. Teachers’ hours of professional
development had an inconsistent relationship with fall to spring cognitive gains, perhaps because
the professional development measure only focused on curriculum-based professional
development. Previous preschool attendance was not related to the size of gains in cognitive
development; however, the measure of previous preschool attendance is imprecise, and a
descriptive study cannot support firm conclusions about the relationship between an additional
year of preschool and children’s cognitive gains. This question needs to be addressed by a study
designed to specifically examine the effects of a second year of preschool on children’s cognitive
development.

The quality of Instructional Support was not consistently and positively associated with fall-
spring gains in children’s cognitive development, which is surprising because this measure
focuses on the kind of teaching that theory would predict helps children to make greater
cognitive gains. The lack of relationship between Instructional Support and fall-spring gains was
found when teacher characteristics were included in the model and when they were not in the
model. At the same time, the family, teacher, and classroom characteristics included in the
regression models explained just 25 percent to 40 percent of the variation in fall-spring gains in
the sample of children, so many factors responsible for children’s progress remain unmeasured in
this study. Moreover, many of the programs serve children for only a few hours per day (2.5 to
3.5 hours), so the effects of the programs may not be very large compared with all other
influences the child encounters during the day. When alternative measures of classroom quality
were substituted for Instructional Support (including CLASS Emotional Support and ECERS-R
Teaching and Interactions), the results were similar.
Improvements in children’s social-emotional development between the fall and the spring
were not related to either the number of demographic risk factors or the child’s home
language. However, some aspects of social-emotional development appear related to
Instructional Support and teacher education.
Teachers and assessors rated children’s social-emotional development as positive in both the
fall and the spring, and indicated that children showed significant improvements in
Attention/Persistence, social behavior and Cognitive-Social domains between the fall and the
spring.
Subgroup analyses found no relationship between improvements in children’s social-
emotional development between the fall and the spring and the number of demographic risk
factors or the child’s home language. However, teachers rated children from Spanish/other
language-primary homes more favorably in the areas of Attention/Persistence, Social
Cooperation, and behavior problems compared with children from English-primary homes.
Assessors had a different view, rating children from English-primary homes higher than children
from Spanish/other language-primary homes on the Cognitive-Social scale in the spring.
Additionally, assessors reported larger improvements in Cognitive-Social abilities from the fall
to the spring for children whose home language was English. This discrepant view of children’s
social-emotional development by teachers and assessors may be attributable to the different
contexts in which behavior was observed. Many of the children from English-primary homes are
in Full-Day programs and, as discussed above, teachers in these programs tended to rate
children’s behavior more negatively than did teachers in the other programs. The more negative
assessor evaluations of children from Spanish/other language-primary homes may reflect that
children who had more difficulty understanding English had more trouble adapting to the
assessment situation.
Subgroup analyses also indicated that higher classroom Instructional Support was associated
with improvements in some aspects of children’s social-emotional development, including Social
Withdrawal and Attention Problems/Overactive behavior, as rated by their teachers between the
fall and the spring. Children’s gains in social-emotional development did not appear to be
related to differences in classroom Emotional Support.
Higher levels of teacher education were also associated with greater improvements in
children’s social-emotional development. Teachers with a graduate degree consistently related
children’s behavior as significantly better on every dimension in the spring compared with the
fall, and the reported gains were larger than for teachers with an associate’s or bachelor’s degree.
Assessor ratings generally corroborated the teacher reports.

RESEARCH QUESTION 1
WHAT ARE THE CHARACTERISTICS AND DEVELOPMENT OF CHILDREN ENTERING
EARLY CHILDHOOD EDUCATION PROGRAMS IN THE FALL?
Major investments in early childhood education at the federal and state levels have sparked
questions about how best to support preschool children’s development and whether the programs
are improving the school readiness of economically-disadvantaged children. Illinois has been in
the forefront of states making significant investments in early childhood education, and Chicago
now offers a diverse array of early childhood education programs that serve low-income and
educationally at-risk children from families in a variety of circumstances.
The Chicago Program Evaluation Project was developed to document children’s experiences
in these early childhood education programs, assess their development, and provide information
on their readiness to succeed in kindergarten. The information is intended to inform program
improvement efforts and funding directions for Chicago’s early childhood education programs,
and to provide a baseline for future research. The descriptive information in this report provides
a rich picture of the children, families, and programs that make up the early childhood education
landscape in Chicago, and suggests avenues for further research to inform program and policy
development.
The study included a representative sample of classrooms and children from Chicago’s Full-
Day, Half-Day Head Start, and Preschool for All programs. Full-Day programs are community-
based Head Start programs that offer wrap-around child care funded by the state’s Child Care
Assistance Program. Half-Day Head Start programs include those in community-based centers
and the Chicago Public Schools. Preschool for All programs in this study include only those in
the Chicago Public Schools.
To measure children’s outcomes and the preschool environments, we conducted fall and
spring assessments of children’s cognitive development (a span of five to six months) and
obtained teacher ratings of children’s social-emotional development. We interviewed teachers to
learn about their education, experience, and teaching practices, and we conducted classroom
observations to measure the quality of emotional support, instruction, equipment, and materials
in the classrooms. We obtained high response rates to all components of the study.
FINDING
Chicago’s early childhood education programs include many English Language Learners;
addressing their dual need to learn English as well as to make progress in early literacy and
mathematics is critical.
Chicago’s early childhood education programs serve a high proportion of English Language
Learners, although the proportions vary by program. In Full-Day programs, 33 percent of
children come from homes in which English is not the primary language; for Half-Day Head
Start and Preschool for All, the proportions of children from such homes are 45 percent and 56
percent, respectively. Some of these children already understand and use English, but across all
of the programs, 32 percent of the children had little or no understanding of spoken English in
the fall. By the spring, significantly more children had an understanding of and ability to use
English, yet 20 percent still had substantial difficulties with spoken English. For children
entering preschool with limited English ability, learning to understand and speak English was a
major task of preschool. For some children, learning English will also be a major task of
kindergarten. More in-depth research on how young English Language Learners acquire English
in preschool classrooms, and how best to support early literacy and early mathematics
achievement while children are learning English would be useful to inform practice. In addition,
since many classrooms serve a mix of children with English and other-language backgrounds,
research focusing on how best to support language, early literacy, and early mathematics
development among these diverse groups of children would be useful.
FINDING
In addition to linguistic challenges, children enter Chicago’s early childhood education
programs with high levels of family demographic risk, including poverty, single parenthood,
and low parental education, although the proportions vary across programs.
The demographic characteristics of the children and families served by the programs differ
(for example, family income and parents’ employment status), reflecting differences in eligibility
rules and service priorities across the programs. Half-Day Head Start programs have the largest
percentage of children with high levels of demographic risk (62 percent), and Preschool for All
programs have the smallest percentage of such children (28 percent). Previous preschool
attendance, which can offer an educational boost to children, was highest among the 4-year-old
children in Full-Day programs.
FINDING
Substantial proportions of children in Chicago’s early childhood education programs were
below the average for preschool-age children nationally in the fall based on vocabulary and
early mathematics achievement, but were close to national averages for early literacy
achievement.
Consistent with the high levels of family demographic risk and large proportion of English
Language Learners, 4-year-old children in Chicago’s early childhood education programs in the
fall were considerably below national averages for vocabulary and early mathematics, but close
to the national average for early literacy relative to children of the same age nationally. The
average PPVT-4 score was 82.0, while the average WJ-III Applied Problems score was 89.5.
The WJ-III Letter-Word Identification was 96.3 on average. These are standardized scores that
compare to a national average of 100.

RESEARCH QUESTION 2
WHAT ARE THE CHARACTERISTICS OF TEACHERS AND THE QUALITY OF
CLASSROOMS IN CHICAGO’S EARLY CHILDHOOD EDUCATION PROGRAMS?
FINDING
Most children’s social-emotional behavior in the fall was rated positively by teachers, with no
differences across programs.
Teachers in Chicago’s early childhood education programs viewed the social-emotional
development of their children positively at the start of the program year, often rating their social
interactions and behaviors as on par with children nationally. However, they rated some children
as having low levels of social skills and/or high levels of behavior problems. Approximately 16
percent of children were rated as having behavioral issues warranting evaluation by a
professional, consistent with national estimates of significant levels of behavioral problems
among children.
The assessors’ ratings of children’s behavior during the cognitive assessments were well
below national averages, but this might be attributable to the fact that the children included in
those national averages were ages 4 to 6, while the children in this study are on the lower end of
that age range.
FINDING
Teachers in Chicago’s early childhood education programs meet or exceed the education
requirements of the programs, which are on the high end of such requirements nationally,
resulting in a well-educated teaching force.
All teachers in Full-Day and CYS Half-Day Head Start programs have at least an associate’s
degree, and all teachers in Preschool for All and CPS Half-Day Head Start have at least a
bachelor’s degree. Many teachers have gone beyond these requirements to acquire a graduate
degree, and many others were pursuing further education at local colleges and universities.
FINDING
Teachers across all three programs reported high levels of satisfaction with teaching as their
daily work and as a career.
Most teachers viewed work with preschool children as important and fulfilling. Most also
identified challenges in teaching preschool. Many of the challenges cited reflect how much
children need to learn during the preschool year in order to be ready for kindergarten, excessive
paperwork, and issues with children’s behavior.

FINDING
The quality of Chicago’s early childhood education classrooms was in the middle to high
range for emotional support and provisions for learning; in the middle range for classroom
organization, and in the low to middle range for instructional support.
Classrooms scored in the middle to high range on the ECERS-R Provisions for Learning
subscale, reflecting program support for the variety of classroom furnishings and materials
expected in good preschool classrooms. Classrooms scored in the middle to high range for
emotional supportiveness, measured by the ECERS-R Teaching and Interactions subscale and
the CLASS Emotional Support subscale, reflecting the extent to which the classroom has a
positive tone, the teacher is sensitive toward children, and the teacher recognizes children’s
perspectives. While the vast majority of classrooms scored in the higher range of these scales (5
and above), the very small proportion scoring in the lower range (below 4) indicate the need for
continuing technical assistance for teachers to help improve the learning environments for
children.
Classrooms scored in the middle range for Classroom Organization, which measures
proactive behavior management, the productive use of time, and use of a variety of instructional
formats to maintain children’s interest. Classrooms scored in the low to middle range on the
Instructional Support subscale, indicating less frequent or less enriching language modeling,
concept development, or quality of feedback. These subscales reflect teaching practices that may
support children’s learning, and lower scores on these subscales suggest such practices are not
widely used. One of the reasons that Instructional Support scores are low could be the mix of
activities observed during the morning period. In Head Start programs, which offer
comprehensive services, observed activities could include mealtime or handwashing. Program
monitors who observe the classrooms from the perspective of both program requirements and
instructional opportunities might be able to find opportunities for learning that could be added to
routines and transitions in these programs (e.g., singing songs or otherwise engaging children
while they are waiting in line to wash their hands or brush their teeth).
FINDING
The quality of Chicago’s early childhood education programs was similar to that of Head
Start and state pre-kindergarten programs nationally.
Middle- to high-level scores on the Provisions for Learning and the emotional
supportiveness scales, and low- to middle-range scores on the Instructional Support scale are
consistent with the findings from studies of preschool classrooms across the country. Across
most studies, including those of high-quality, well-funded preschool programs, teachers are
challenged to provide high levels of Instructional Support.

FINDING
Identifying ways to improve Instructional Support in preschool classrooms through
professional development and education could enhance the learning opportunities in
preschool.
Only 42 percent of teachers in Chicago’s early childhood education programs offer
instruction in the middle range (3 to 5 on a 7-point scale), and none offer instruction rated high
(6 or 7) on Instructional Support. Multivariate analyses explored the relationships between
Instructional Support, Classroom Organization, and teacher and program characteristics to
identify policies that might influence these aspects of quality and be explored more
systematically in future research.
Teacher education—in particular, having a graduate degree—was related to higher ratings
on both Instructional Support and Classroom Organization, controlling for other teacher and
program characteristics. Higher ratings on Classroom Organization were positively related to
teachers having a bachelor’s or a graduate degree and 20 or more years of experience teaching
preschool. Lower child-staff ratios were related to more positive quality ratings. The positive
correlation between subscales that relate to the preschool classroom’s educational environment
and the teacher’s education and experience as well as the number of children in the classroom
suggest a role for standards in enhancing the educational environment of preschool classrooms
that could be explored using more rigorous research designs.
The lack of an association between Instructional Support and hours of professional
development may stem from the fact that the professional development measure in this study
focused on curriculum-related training, which may not encompass all of the professional
development that teachers received, particularly teachers with higher levels of education. More
research on the relationship between Instructional Support and the amount, form, and content of
professional development could identify ways to boost the learning content of preschool.
Program-specific characteristics that were not separately measured but that could include
policies, educational requirements, and support for professional development were also
associated with the ratings of Instructional Support, as well as with the other dimensions of
classroom quality. These program characteristics should be examined in more detail to identify
differences that should be explored in future research.
RESEARCH QUESTION 3
WHAT DEVELOPMENTAL PROGRESS DO CHILDREN MAKE
DURING THE PRESCHOOL YEAR?
FINDING
Children in Chicago’s early childhood education programs made significant progress during
the five- to six-month period encompassed by the fall and spring assessments in terms of
vocabulary development in English, early literacy achievement, and early mathematics
achievement.
Children’s vocabulary improved by 4.8 points overall, approximately one-third of a standard
deviation over their fall performance. Early literacy increased by 2.5 points overall, to within
one point of the average for preschool-age children nationally by spring. Early mathematics
increased by 1.9 points overall, a small increase, but still a gain relative to what would be
expected through maturation over the same period. The average gains were largest for English
Language Learners, whose performance on assessments improved substantially as they acquired
English vocabulary during the preschool year. Since the preschool year is longer than the five-
to six-month period between the fall and spring assessments, children’s actual growth during the
preschool year was likely greater than was measured here.
FINDING
Children at highest academic risk made substantial progress during the preschool year in
terms of vocabulary development, early literacy achievement, and early mathematics
achievement.
The standardized measures of children’s vocabulary, early literacy, and early mathematics
achievement permit the identification of children who perform below 85, which is one standard
deviation below the mean for children of the same age nationally. Scores below 85 correspond to
scores received by approximately 16 percent of 4-year-old children nationally, and therefore, 85
is considered to be a threshold for educational risk. Many of these children, who scored below
85 on the assessments in the fall, were able to move above the threshold score of 85 by the spring
assessment five to six months later. On English vocabulary, the proportion scoring below 85
decreased from 52 percent in the fall to 39 percent in the spring. On early literacy, the
proportion scoring below 85 declined from 29 percent in the fall to 16 percent in the spring. On
early mathematics, the percentage scoring below 85 declined from 33 percent in the fall to 29
percent in the spring. Many of the children moving out of the category of significant academic
risk were English Language Learners who were improving their English vocabulary ability
during the preschool year.

FINDING
Despite the substantial gains by children at educational risk, continued support may be
necessary to close gaps in the early years of school.
Despite the important gains children made in English vocabulary ability between the fall and
the spring, the average score in April/May of the preschool year was 86.8 overall (90.5 among
children from English-primary homes, and 82.7 among children from Spanish- or other-primary
homes). These scores are significantly below the population average for preschool-age children,
which could cause difficulties later as children encounter unfamiliar words in reading and in
various subjects in school. The findings regarding the level of vocabulary achievement among
children in Chicago’s early childhood education programs, however, are consistent with those of
other studies of low-income and educationally at-risk children in preschool. Although children’s
early literacy skills were on par for age by spring (based on national norms for preschool-age
children), the norms for the early literacy assessment appear to expect children to recognize
letters and letter-sound correspondence, but not to sight read at this point. Making the transition
from recognizing letters and sounds to reading words on a page could be a challenge for children
if vocabulary is lagging. While it may be unrealistic to expect a half-day preschool program to
close a vocabulary gap that has grown during the first four years of life, strong support for
language development that continues into the early grades of school would be realistic. Such
support, extending through the beginning reading period of the early grades, would be helpful to
maintain the high performance children have shown in early literacy through the preschool year.
Moreover, stronger support for vocabulary development during the preschool year might
also be feasible. The scores for Language Modeling (one dimension of the CLASS) among
teachers in the Chicago preschool programs averaged 3.3, offering some room for improvement
of an activity that could help children’s vocabulary development.
The relatively modest progress made in early mathematics may reflect a lack of focused
activity on this area during preschool. Early mathematics is just beginning to receive attention
by the preschool community, and more attention to this area would provide an important boost to
children who have had little exposure to mathematical concepts before preschool.
FINDING
Children’s Attention/Persistence and social behavior improved during the preschool year,
according to teacher ratings, and the incidence of behavior problems was below expected
levels for age. These findings bode well for children’s adjustment to school.
Children’s ability to settle into activities, avoid distraction and concentrate, pay attention to
the teacher, and cooperate with group activities—characteristics measured by the
Attention/Persistence subscale—are critical abilities for success in learning in school settings. In
addition, social behavior, including cooperation, empathy, social leadership, and the ability to
compromise with peers, reflect social skills that will help children interact positively with peers
and adults in school. Children’s Attention/Persistence and social behavior improved between the
fall and the spring, and the incidence of behavior problems remained steady at fairly low levels
between the fall and the spring (see Table 11). The assessors also rated children more favorably
in the spring compared with the fall on the Cognitive-Social scale, corroborating the teachers’
positive ratings of children’s attention, self-control, and social behavior. The improvement in

children’s attention and social behavior and the fact that scores are within age norms suggest that
most children are prepared for the behavioral demands of school.
FINDING
The extent of children’s growth in language, early literacy, and early mathematics during the
preschool year does not seem to be related to the quality of classroom instructional support or
emotional support, controlling for other teacher and program characteristics. More research
is needed to understand the extent to which improvements in Instructional Support or other
aspects of quality can support children’s growth in preschool.
The quality of Instructional Support was not consistently and positively associated with fall-
spring gains in children’s cognitive development, which is surprising because this measure
focuses on the kind of teaching that theory would predict helps children to make greater
cognitive gains. The lack of relationship between Instructional Support and fall-spring gains was
found when teacher characteristics were included in the model and when they were not in the
model. At the same time, the family, teacher, and classroom characteristics included in the
regression models explained just 25 percent to 40 percent of the variation in fall-spring gains in
the sample of children, so many factors responsible for children’s progress remain unmeasured in
this study. Moreover, many of the programs serve children for only a few hours per day (2.5 to
3.5 hours), so the effects of the programs may not be very large compared with all other
influences the child encounters during the day. In alternative specifications using different
measures of quality (including Emotional Support, Teaching and Interactions, and Classroom
Organization), the findings are the same.
A recent study examining this question with a much larger sample of classrooms and
children found a positive relationship between Instructional Support and cognitive outcomes, but
the effect is small: a 1-point increase in instructional quality increases spring cognitive scores by
0.7 to 1.1 standardized points, which is at best a .07 effect size difference attributable to quality
(Mashburn et al. 2008). This finding is consistent with a large body of education literature on
the importance of family background relative to schools. In addition, researchers have identified
numerous school characteristics, teacher behaviors, and other factors that might affect children’s
progress. Differences in the family backgrounds of the children served, school leadership,
resources, teacher background and professional development, and many other factors complicate
the task of estimating the relationship between particular aspects of quality (for example,
emotional support or instructional support) and child outcomes. Clearly, some variations in
teacher behavior and classroom processes make a difference for children, but more research is
needed to identify changes that would be both feasible to implement and substantially beneficial
to children in early childhood education programs on a broader scale.
CONCLUSION
Chicago’s early childhood education programs serve substantial proportions of children with
high levels of family demographic risk and children who are English language learners. In the
fall, children’s English vocabulary ability and early mathematics achievement were well below
national averages for preschool-age children, although early literacy was near national norms.

Children’s behavior – attention/persistence, social behavior, and behavior problems – were rated
by teachers as within norms for preschool-age children in the fall.
The early childhood education classrooms are of good quality, with child-staff ratios within
professional guidelines, and teachers with relatively high education levels, significant experience
teaching preschool, and high levels of satisfaction with teaching preschool. Classrooms are well-
stocked with furnishings and materials characteristic of good early childhood programs. The
emotional tone and quality of teacher-child interactions is good. Instructional Support is in the
low to middle range of quality, similar to most other preschool classrooms nationally.
During the preschool year, children in Chicago’s early childhood education programs made
significant progress in terms of English vocabulary development, early literacy achievement, and
early mathematics achievement. Children at highest academic risk (those scoring below 85,
considered an indicator of educational risk) and English Language Learners made substantial
progress. Yet, children’s vocabulary and early mathematics achievement remain below that of
preschool-age children nationally. Continued support for vocabulary development, early
literacy, and early mathematics may be necessary to preserve the gains made and to further
reduce achievement gaps during the early years of school.
Children’s Attention/Persistence and social behavior improved during the preschool year,
and behavior problems remained at low levels, according to teacher ratings, and corroborated by
assessors. These developments suggest that children will be ready for the behavioral demands of
school.
In-depth, qualitative research to focus on challenging aspects of teaching and learning in
preschool would be helpful in improving programs. Key topics might include identifying
promising strategies for (1) supporting the acquisition of English in the classroom, (2) supporting
the cognitive development of both English-speaking children and English Language Learners in
the same classroom, and (3) increasing the opportunities for programs to include interesting
instructional content during routine activities and mealtimes. In addition, initiatives that would
continue to provide strong support for children’s vocabulary development, early literacy, and
early mathematics skills during the transition to reading in the early grades of school may be
important in preserving the gains made in preschool and further closing achievement gaps.
Rigorous research that can measure the effects of alternative policies could help in
identifying the best investments for early childhood education programs. Research could (1)
examine alternative approaches to professional development that could enhance Instructional
Support, (2) consider the impact of a greater intensity of preschool services (full-day or an
additional year), and (3) measure the value of introducing an early mathematics curriculum.
These research projects could help identify the most promising investments in early childhood
education services to benefit educationally at-risk preschool children in Chicago.

REFERENCES
Administration for Children and Families. ―Head Start Program Fact Sheet. Fiscal Year 2007.‖
Washington, DC: U.S. Department of Health and Human Services, February 2007.
[http://www.acf.hhs.gov/programs/hsb/research/2007factsheet.pdf]. Accessed June 10,
2007.
Administration for Children and Families. ―Children’s Outcomes and Program Quality in Head
Start.‖ FACES 2003 Research Brief. Washington, DC: Administration for Children and
Families, December 2006.
Administration for Children and Families. The Head Start Path to Positive Child Outcomes.
Washington, DC: ACF, Updated Summer 2003.
Administration for Children and Families. Head Start FACES 2000: A Whole-Child Perspective
on Program Performance. Washington, DC: U.S. Department of Health and Human
Services, May 2003.
Barbarin, Oscar. ABLE Mental Health Scales, Level I and Level II. Chapel Hill, NC: HiPoint,
2004.
Barnett, W. Steven, Jason T. Hustedt, Allison Friedman, and Judi Stevenson Boyd. The State of
Preschool: 2007 State Preschool Yearbook. New Brunswick, NJ: National Institute for
Early Education Research, 2007.
Barnett, W. Steven, Kenneth B. Robin, Jason T. Hustedt, and Karen L. Schulman. The State of
Preschool: 2003 State Preschool Yearbook. New Brunswick, NJ: National Institute for
Early Education Research, 2003.
Bowman, Barbara T., M. Suzanne Donovan, and M. Susan Burns (eds.). Eager to Learn:
Educating Our Preschoolers. Washington, DC: National Academies Press, 2001.
Brooks-Gunn, Jeanne, Greg J. Duncan, and J. Lawrence Aber, Eds. Neighborhood Poverty:
Context and Consequences for Children. Volume I. New York: Russell Sage Foundation,
1997.
Campbell, Frances A., Craig T. Ramey, Elizabeth Pungello, Joseph Sparling, and Shari Miller-
Johnson. ―Early Childhood Education: Young Adult Outcomes from the Abecedarian
Project.‖ Applied Developmental Science, vol. 6, no. 1, 2002, pp. 42–57.
Chicago Public Schools. Child Assessment Profile. Chicago: CPS, 2004.
Clements, D.H., and J. Sarama. ―Standards for Preschoolers.‖ Teaching Children Mathematics,
September 2000, pp. 38–41.

Clifford, R.M., Oscar Barbarin, F. Chang, Diane M. Early, Donna Bryant, Carollee Howes,
Margaret Burchinal, and Robert Pianta. ―What Is Pre-Kindergarten? Characteristics of
Public Pre-Kindergarten Programs.‖ Applied Developmental Science, vol. 9, no. 3, 2005,
pp. 126–143.
Cohen, J. (1988). Statistical Power Analysis for Behavioral Sciences. Hillsdale, NJ: Lawrence
Erlbaum.
Cunha, Flavio, James J. Heckman, Lance Lochner, and Dimitriy V. Masterov. ―Interpreting the
Evidence on Life Cycle Skill Formation. In Handbook of the Economics of Education,
Volume I, edited by Eric A. Hanushek and Finis Welch. New York: Elsevier, 2006.
Denton, Kristin, and Jerry West. Children’s Reading and Mathematics Achievement in
Kindergarten and First Grade. Publication no. NCES 2002-125. Washington, DC:
National Center for Education Statistics, 2002.
Dodge, Diane Trister, Laura Colker, and Cate Heroman. The Creative Curriculum
Developmental Continuum Assessment Toolkit for Ages 3-5. Washington, DC: Teaching
Strategies, Inc., July 2002.
Duncan, S.E., and E. DeAvila. Preschool Language Assessment Survey 2000 Examiner’s
Manual: English Forms C and D. Monterey, CA: CTB/McGraw-Hill, 1998.
Dunn, L.M., and L.M. Dunn. Peabody Picture Vocabulary Test, Fourth Edition. Examiner’s
Manual and Norms Booklet. Circle Pines, MN: American Guidance Service, 2006.
Dunn, L.M., Lloyd Eligio R. Padilla, D.E. Lugo, and L.M. Dunn. Test de Vocabulario en
Imagenes Peabody. Circle Pines, MN: American Guidance Service, 1986.
Dunn, Lloyd M., and Douglas M. Dunn. Peabody Picture Vocabulary Test, Fourth Edition:
Manual. Minneapolis, MN: Pearson Assessments, 2007.
Early, Diane M., Kelly L. Maxwell, Margaret Burchinal, Randall H. Bender, Caroline Ebanks,
Gary T. Henry, Jeniffer Iriondo-Perez, Andrew J. Mashburn, Robert C. Pianta, Soumya
Alva, Donna Bryant, Karen Cai, Richard M. Clifford, James A. Griffin, Carollee Howes,
Hyun-Joo Jeon, Ellen Peisner-Feinberg, Nathan Vandergrift, and Nicholas Zill. ―Teachers’
Education, Classroom Quality, and Young Children’s Academic Skills: Results from Seven
Studies of Preschool Programs.‖ Child Development, March/April 2007, vol. 78, no. 2,
pp. 558–580.
Early, Diane M., Donna M. Bryant, Robert C. Pianta, Richard M. Clifford, Margaret R.
Burchinal, Sharon Ritchie, Carollee Howes, and Oscar Barbarin. ―Are Teacher’s Education,
Major, and Credentials Related to Classroom Quality and Children’s Academic Gains in
Pre-Kindergarten?‖ Early Childhood Research Quarterly, vol. 21, 2006, pp. 174–195.

Early, Diane, Oscar Barbarin, Donna Bryant, Margaret Burchinal, Florence Chang, Richard
Clifford, Gisele Crawford, Wanda Weaver, Carollee Howes, Sharon Ritchie, Marcia Kraft-
Sayre, Robert Pianta, and W. Steven Barnett. ―Pre-Kindergarten in Eleven States:
NCEDL’s Multi-State Study of Pre-Kindergarten and Study of State-Wide Early Education
Programs (SWEEP).‖ Preliminary descriptive report. NCEDL working paper. Chapel Hill,
NC: University of North Carolina, Chapel Hill, May 24, 2005.
Garbarino, James and Barbara Ganzel. ―The Human Ecology of Early Risk.‖ In Handbook of
Early Childhood Intervention, Second Edition, edited by Jack P. Shonkoff and Samuel J.
Meisels. New York: Cambridge University Press, 2000.
Garmezy, Norman. ―The Study of Competence in Children at Risk for Severe
Psychopathology.‖ In The Child in His Family: Children at Psychiatric Risk, Volume 3,
edited by E.J. Anthony and C. Koupernik. New York: Wiley, 1974, pp. 77–97.
Ginsburg, Herbert P., and Arthur J. Baroody. Test of Early Mathematics Ability-Third Edition
(TEMA-3). Austin, TX: PRO-ED, Inc., 2003.
Hamre, Bridget K., Andrew J. Mashburn, Robert C. Pianta, Jennifer Locasale-Crouch,
and Karen M. LaParo. ―CLASS Technical Appendix.‖ [http://www.class
observation.com/research/research_prek.php]. Accessed October 10, 2007.
Harms, Thelma, Richard M. Clifford, and Debbie Cryer. Early Childhood Environment Rating
Scale (Revised edition). New York: Teachers College Press, 1998.
Helburn, Suzanne M., L. Culkin, J. Morris, Naci Mocan, Carollee Howes, L. Phillipsen, Donna
Bryant, Richard Clifford, Debbie Cryer, E. Peisner Feinberg, Margaret Burchinal, Sharon
Lynne Kagan, and J. Rustici. Cost, Quality, and Child Outcomes in Child Care Centers.
Denver, CO: University of Colorado, 1995.
Henry, Gary T., Craig S. Gordon, and Dana K. Rickman. ―Early Education Policy Alternatives:
Comparing Quality and Outcomes of Head Start and State Prekindergarten.‖ Educational
Evaluation and Policy Analysis, vol. 28, no. 1, spring 2006, pp. 77–99.
High/Scope Educational Research Foundation. High/Scope Preschool Child Observation
Record. Ypsilanti, MI: High/Scope Educational Research Foundation, 2003.
Howes, Carollee, Margaret Burchinal, Robert Pianta, Donna Bryant, Diane Early, Richard
Clifford, and Oscar Barbarin. ―Ready to Learn? Children’s Pre-Academic Achievement in
Pre-Kindergarten Programs.‖ Early Childhood Research Quarterly, vol. 23(1), 2008, pp. 29-
50.
Kohen, Dafna E., Tama Leventhall, V.S. Dahinten, and C.N. McIntosh. ―Neighborhood
Disadvantage: Pathways of Effects for Young Children.‖ Child Development, vol. 79 (1),
2008.
LaParo, Karen M., Robert C. Pianta, and Megan Stuhlman. ―The Classroom Assessment
Scoring System: Findings from the Prekindergarten Year.‖ Elementary School Journal,
vol. 104, no. 5, 2004, pp. 409–426.

Mashburn, Andrew J., Robert C. Pianta, Bridget K. Hamre, Jason T. Downer, Oscar A. Barbarin,
Donna Bryant, Margaret Burchinal, Diane M. Early, and Carollee Howes. ―Measures of
Classroom Quality in Prekindergarten and Children’s Development of Academic, Language,
and Social Skills.‖ Child Development, vol. 79 (3) (May/June 2008), pp. 732-749.
Masten, Ann S., K.M. Best, and Norman Garmezy. ―Resilience and Development:
Contributions from the Study of Children Who Overcome Adversity.‖ Development and
Psychopathology, vol. 2, 1990, pp. 425–444.
McDermott, P.A., N.M. Leigh, and M.A. Perry. ―Development and Validation of the Preschool
Learning Behaviors Scale.‖ Psychology in the Schools, vol. 39, 2002, pp. 353–365.
McDermott, P.A., L.F. Green, J.M. Francis, and D.H. Stott. ―Scoring Procedure: Preschool
Learning Behaviors Scale.‖ Philadelphia, PA: Edumetric and Clinical Science, Revised
April 2000.
McGrew, Kevin S., and Richard W. Woodcock. Woodcock-Johnson III Technical Manual.
Itasca, IL: Riverside Publishing Co., 2001.
Meisels, Samuel J., and Barbara A. Wasik. ―Who Should Be Served? Identifying Children in
Need of Early Intervention.‖ In Handbook of Early Childhood Intervention, edited by
Samuel J. Meisels and Jack P. Shonkoff. New York: Cambridge University Press, 1990.
Meisels, Samuel J., Dorothea B. Marsden, Martha S. Wiske, and Laura W. Henderson. Early
Screening Inventory-Revised (ESI-R). Minneapolis, MN: Pearson Assessments, 2006.
Merrell, Kenneth W. Preschool and Kindergarten Behavior Scales, Second Edition, Examiner’s
Manual. Austin, TX: PRO-ED, Inc., 2002.
National Council of Teachers of Mathematics. Principles and Standards for School
Mathematics. Reston, VA: NCTM, 2000.
Peisner-Feinberg, Ellen S., Margaret R. Burchinal, Richard M. Clifford, Noreen Yazejian, Mary
L. Culkin, Janice Zelazo, Carollee Howes, Patricia Byler, Sharon Lynn Kagan, and Jean
Rustici. ―Children of the Cost, Quality, and Outcomes Study Go to School.‖ Technical
report. Chapel Hill, NC: University of North Carolina, 1999.
Phillips, Deborah, William T. Gormley, and Amy Lowenstein. ―Classroom Quality and Time
Allocation in Tulsa’s Early Childhood Programs.‖ Paper presented at the biennial meetings
of the Society for Research in Child Development, Boston, MA, March 30, 2007.
Pianta, Robert C., Karen M. LaParo, and Bridget K. Hamre. Classroom Assessment Scoring
System Manual, Pre-K. Baltimore, MD: Paul H. Brookes Publishing Co., 2008.
Pianta, Robert, Carollee Howes, Margaret Burchinal, Donna Bryant, Richard Clifford, Diane
Early, and Oscar Barbarin. ―Features of Pre-Kindergarten Programs, Classrooms, and
Teachers: Do They Predict Observed Classroom Quality and Child-Teacher Interactions?‖
Applied Developmental Science, vol. 9, no. 3, 2005, pp. 144–159.
Roid, Gale H., and Lucy J. Miller. ―Leiter International Performance Scale-Revised (Leiter-R)
Examiners Manual.‖ In G.H. Roid and L.J. Miller, Leiter International Performance Scale-
Revised. Wood Dale, IL: Stoelting Co., 2002.
Sameroff, Arnold J., and R. Seifer. ―Familial Risk and Child Competence.‖ Child Development,
vol. 54, 1983, pp. 1254–1268.
Shonkoff, Jack P. and Paul C. Marshall. ―Neurological Basis of Developmental Vulnerability.‖
In Handbook of Early Childhood Intervention, Second Edition, edited by Jack P. Shonkoff
and Samuel J. Meisels. New York: Cambridge University Press, 2000.
Shonkoff, Jack P., and Deborah A. Phillips (eds.). From Neurons to Neighborhoods: The
Science of Early Childhood Development. Washington, DC: National Academies Press,
2000.
Squires, Jane, Diane Bricker, and Elizabeth Twombly. Ages & Stages Questionnaires: Social-
Emotional (ASQ:SE). Baltimore, MD: Brookes Publishing, 2002.
University of North Carolina. ―Preschoolers Benefit from Mental Health Screening.‖ University
of North Carolina-Chapel Hill News, January 16, 2008.
[http://uncnews.unc.edu/news/humanities-and-social-sciences/preschoolers-benefit-from-
mental-health-screening.html]. Accessed January 20, 2008.
U.S. Department of Health and Human Services. Mental Health: A Report of the Surgeon
General. Rockville, MD: DHHS, 1999.
Woodcock, Richard W., Ana F. Munoz-Sandoval, Kevin McGrew, Nancy Mather, and Fred Schrank. Bateria III Woodcock-Muñoz. Itasca, IL: Riverside Publishing, 2005.
Woodcock, Richard W., Kevin McGrew, and Nancy Mather. Woodcock-Johnson III Tests of Achievement. Itasca, IL: Riverside Publishing, 2001.
Yates, Tuppett M., Byron Egeland, and L. Alan Sroufe. ―Rethinking Resilience: A
Developmental Process Perspective.‖ In Resilience and Vulnerability: Adaptation in the
Context of Childhood Adversities, edited by Suniya S. Luthar. New York: Cambridge
University Press, 2003.
Zigler, Edward F., and Sally Styfco. ―Head Start and Early Childhood Intervention: The
Changing Course of Social Science and Social Policy.‖ In Children, Families, and
Government: Preparing for the Twenty-First Century, edited by Edward F. Zigler, Sharon
Lynn Kagan, and Nancy W. Hall. New York: Cambridge University Press, 1996.