Embed Size (px)
Citation preview
1
The Chemistry of Natural Waters
Barbara Jennings
11/10/08
Chem 111
Section 107
TA: Shradda Surve
Group: Anne Hartman,
Kristin Hartmann, and Jackie Hakes

2
Introduction:
Water is the most essential element to the survival of all living species on Earth. The natural
cleaning process of water is known as the water cycle. In this cycle, the water on the earth receives heat
from the sun and evaporates into the atmosphere. It then condenses into clouds until it eventually
precipitates back down to the earth. Through this cycle, water is purified from any dissolved substances
that it might have picked up during its time on the earth’s surface. Among all of the impurities that filter
into water, two of the most common are the cations of calcium (Ca2+) and magnesium (Mg2+)[15].
Water hardness is determined by the presence of these dissolved divalent cations, calcium and
magnesium, in water. Waters that contain a high concentration of calcium and magnesium cations are
harder than that of waters that contain a low concentration of calcium and magnesium cations. Water
with low concentration are said to be soft. Since we are using water faster than it can be replaced, as
one can imagine, the hardness of the water is gradually increasing on average [8].
Calcium carbonate, measured in milligrams per liter, determines the hardness of water. Water
hardness is often measured in terms of calcium carbonate equivalent, which is an expression of the
concentration of calcium and magnesium ions in water in terms of their equivalent value of calcium
carbonate[17]. Calcium carbonate occurs in water because when carbon dioxide dissolves in water it
creates a weak carbonic acid. This acid dissolves such rock sources as limestone and other minerals in
the earth. The carbon dioxide will trickle through the limestone releasing calcium and magnesium ions
as their soluble bicarbonates into the water [18]. These calcium ions can also be found in other rock
sources besides limestone, such as dolomite and gypsum. Magnesium ions can also be found in rock
sources such as olivine, pyroxenes, dolomite, and dark colored micas [15].

3
It is especially important for to know and understand water hardness because of the many
problems associated with it. For example, in the areas of soap and industrial boilers the increase in
water hardness increases problems. Soap’s purpose is to lessen surface tension in order to remove
“dirt” when used with water. However, if the water contains a high concentration of calcium and
magnesium, the ions will react with the soap to produce an insoluble precipitate that deters the
effectiveness of soap [15]. Manufactures that use pipes, boilers, evaporators, and any other devices to
heat up hard water sources face the major problem called scale formation. When hard water is heated
the excess ions are left behind forming rocklike deposits. These deposits coat the surface of the pipes,
boiler walls, and many other surfaces that the hard water comes in contact with. This causes a number
of problems for the industries. It can reduce water flow, heat transfer is insufficient, pipes become
blocked and narrow, and eventually metal corrosion and structural weakness occurs. It is very expensive
to remove the scale buildup or replace the corroded pipes. This is why many industries have chosen to
soften their water to prevent the buildup of cation deposits [3].
Water is also a vital component of life and is an essential necessity to the survival of all living
organisms. That is why it is important we understand the chemistry behind what is affecting our water
supply.
“The Chemistry of Natural Waters” experiment from the PSU Version of Chemtrek was designed
to compare the hardness of selected samples of water through various methods. The first method in
this experiment was the Total Dissolved Solids (TDS) test. Dissolved solids refer to any minerals, salts, or
metals dissolved in a water sample. The Total Dissolved Solids test provides a qualitative measure of the
amount of dissolved ions in a water sample. The amount of residue left over after evaporating the water
is referred to as total dissolved solids (TDS) [15]. This method will measure ions that contribute to water
4
hardness, like calcium and magnesium, but also those that do not, like sodium. This method does not
tell us the nature or ion relationship in the water [16].
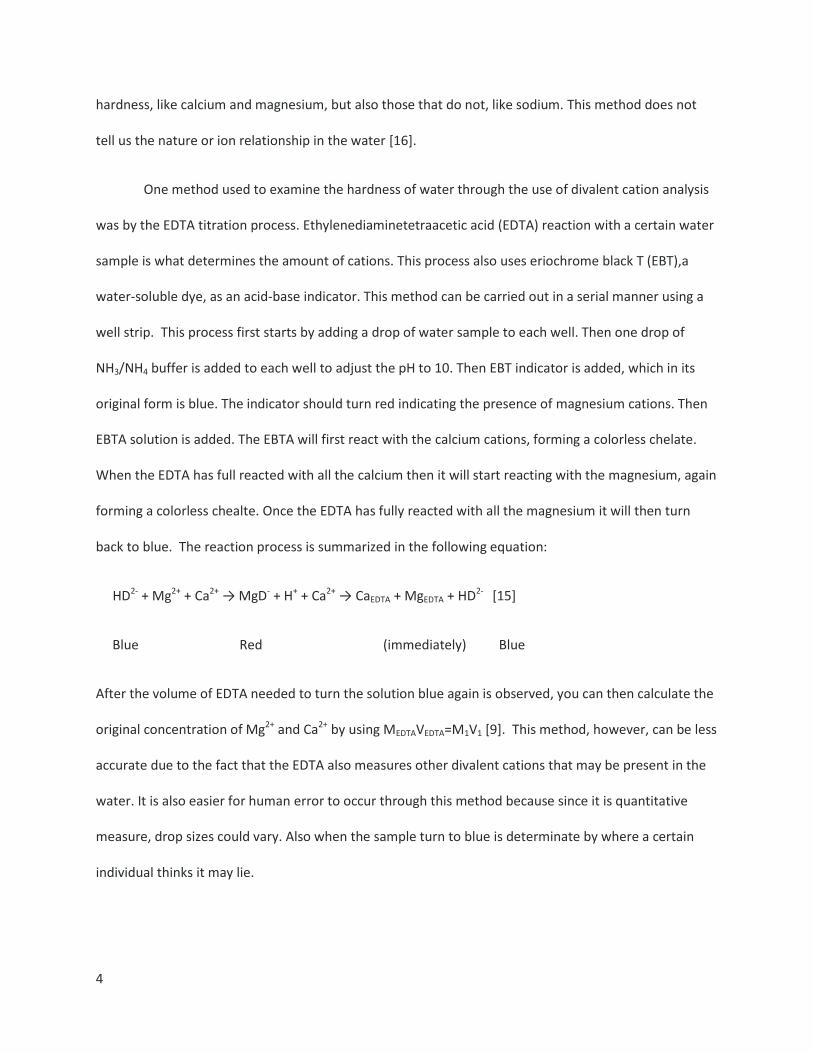
One method used to examine the hardness of water through the use of divalent cation analysis
was by the EDTA titration process. Ethylenediaminetetraacetic acid (EDTA) reaction with a certain water
sample is what determines the amount of cations. This process also uses eriochrome black T (EBT),a
water-soluble dye, as an acid-base indicator. This method can be carried out in a serial manner using a
well strip. This process first starts by adding a drop of water sample to each well. Then one drop of
NH3/NH4 buffer is added to each well to adjust the pH to 10. Then EBT indicator is added, which in its
original form is blue. The indicator should turn red indicating the presence of magnesium cations. Then
EBTA solution is added. The EBTA will first react with the calcium cations, forming a colorless chelate.
When the EDTA has full reacted with all the calcium then it will start reacting with the magnesium, again
forming a colorless chealte. Once the EDTA has fully reacted with all the magnesium it will then turn
back to blue. The reaction process is summarized in the following equation:
HD2- + Mg2+ + Ca2+ → MgD- + H+ + Ca2+ → CaEDTA + MgEDTA + HD2- [15]
Blue Red (immediately) Blue
After the volume of EDTA needed to turn the solution blue again is observed, you can then calculate the
original concentration of Mg2+ and Ca2+ by using MEDTAVEDTA=M1V1 [9]. This method, however, can be less
accurate due to the fact that the EDTA also measures other divalent cations that may be present in the
water. It is also easier for human error to occur through this method because since it is quantitative
measure, drop sizes could vary. Also when the sample turn to blue is determinate by where a certain
individual thinks it may lie.

5
Another method used for determining water hardness is through Atomic Absorption
Spectrophotometry, also known as AA. This method is used to determine the concentration of a specific
element. The atomic absorption spectrophotometer consists of three regions. The first region supplies
the monochromatic light through a water sample. When the light is shown through the sample being
aspirated, the atoms in the sample with the same electronic energy separation (measured by delta E) as
the light will absorb the light. The absorbance of light will correspond to the change in energy associated
to that particular element [15]. The amount of absorbance is directly proportional to the concentration
of the metal atoms. The Beer-Lambert law (A = a(lambda) * b * c where A is the measured absorbance,
a(lambda) is a wavelength-dependent absorptivity coefficient, b is the path length, and c is the analyte
concentration) is the linear relationship between absorbance and concentration of an absorbing species
and can be used to calculate the unknown metal concentration in the sample.[3]
The atomic absorption process begins in region one when a monochromatic light, in this case
either a calcium or magnesium hollow cathode lamp, passes through the water sample in region two,
the sample chamber.[9] In the sample chamber water is aspirated and converted from a liquid to a
aerosol. An intense heat of approximately 2300 degrees Celsius atomizes the water sample. The light
from region one then passes through these newly formed atoms. The light that is passing through will
only be absorbed if it matches the same element that is present in the sample. The remaining light that
wasn’t absorbed goes to region three [15].
In region three, the monochrometer is a grating that allows only a set wavelength of light
through which correspond with the element that is being tested. The second part of region three is the
detector which is a photo multiplier tube (PMT). Since metal atoms absorb some of the light passing
through the flame from the lamp, a decrease in the initial signal is detected by the PMT. This decrease is
also proportional to the concentration of the metal in the sample [15]. The concentration of a metal in a
6
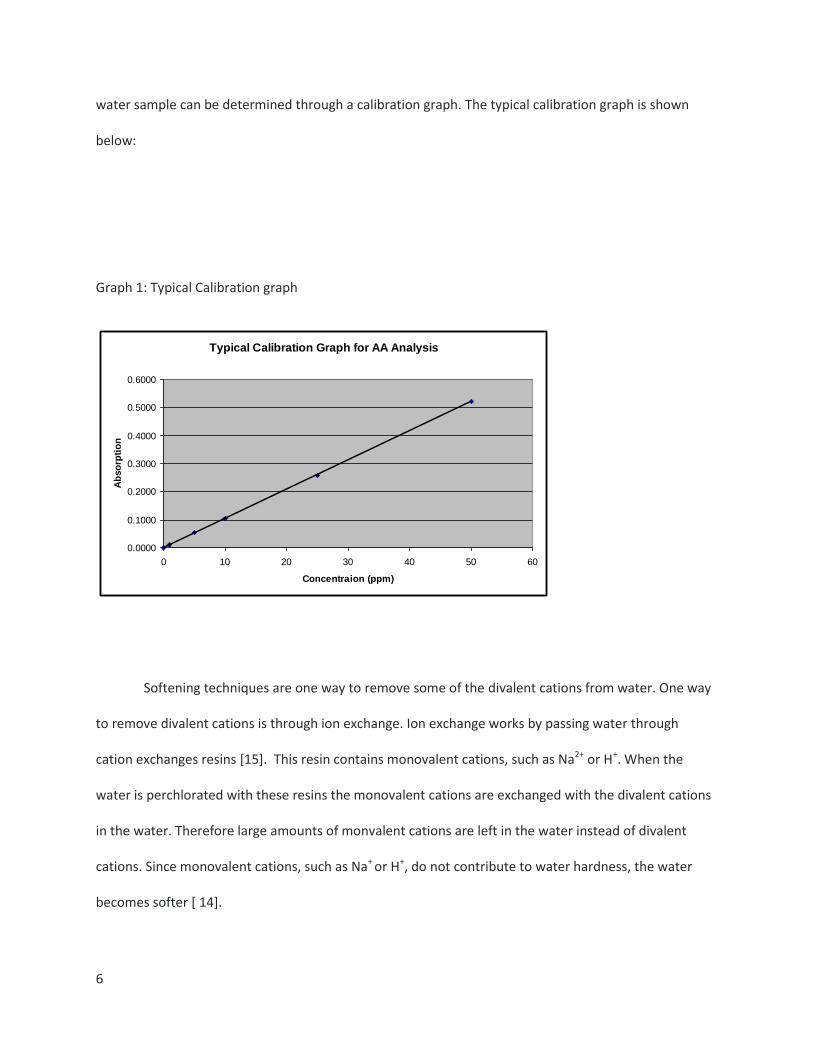
water sample can be determined through a calibration graph. The typical calibration graph is shown
below:
Graph 1: Typical Calibration graph
Typical Calibration Graph for AA Analysis
0.0000
0.1000
0.2000
0.3000
0.4000
0.5000
0.6000
0 10 20 30 40 50 60
Concentraion (ppm)
Ab
so
rpti
on
Softening techniques are one way to remove some of the divalent cations from water. One way
to remove divalent cations is through ion exchange. Ion exchange works by passing water through
cation exchanges resins [15]. This resin contains monovalent cations, such as Na2+ or H+. When the
water is perchlorated with these resins the monovalent cations are exchanged with the divalent cations
in the water. Therefore large amounts of monvalent cations are left in the water instead of divalent
cations. Since monovalent cations, such as Na+ or H+, do not contribute to water hardness, the water
becomes softer [ 14].

7
Another way to soften water is through using a commercial water-conditioning agent. The
commercial softening agent is made from sodium bicarbonate. It performs in a similar way as the cation
ion exchange, in which the divalent cations calcium and magnesium in the water are replaced by the
monovalent cations in the softening agent [2].
The methods used to determine water hardness mentioned above were used to test four
different samples. A sample off rainwater taken from a puddle located in the parking lot adjacent to
Whitmore Laboratory, University Park, PA [12]. Another sample was taken from tap water run through a
Brita water filtration pitcher using the tap water from Porter Hall, University Park, PA [9]. Another
sample was taken from an Aquafina water bottle [10]. The last example was taken from a Fiji water
bottle [7].
Knowing that the hardness of water is a result of dissolved calcium and magnesium cations in
water, I could then hypothesize the hardness of the four samples based on this information [18]. I
hypothesized that the Aquafina water would be the softest because it goes through a seven step
filtration system to remove every impurity in the water, according to Aquafina’s website
www.aquafina.com [1]. Therefore, I expect there to be little to no calcium and magnesium cations
present in the sample. I believe this will make the sample the least hard.
I expected the Fiji water to be the hardest since its only main filtration is through mineral-rich
rocks, such as the volcanic rocks located in Viti Levu, part of the Fiji Islands, according to FiJi’s website
fijiwater. Com [5]. The only man-made filtration the water goes through is to remove particle matter
and potential pathogens. Therefore there is no attempt to remove any of the calcium or magnesium
cations in the water. I expect that the mineral-rich rock sources will leave large traces of calcium and
magnesium divalent cations in the water.

8
Next, I expected the Brita water filtration system using tap water from Porter Hall to be
moderately harder than the Aquafina water but softer than the Fiji water. I expected there to be traces
of calcium and magnesium cations in the water because even though the water source has been treated
and filtered at the city water facility and run through a softening Brita filtration pitcher 4]. This would
make sense since that there would still be large traces of ions since Pennsylvania water is among the
hardest in the nation, around 120-350 ppm hardness, according to the Water Encyclopedia [ 13]. The
water also has to travel through many pipes which will cause the water to pick up even more divalent
cations, such as calcium and magnesium. Even through the Brita water is filtered through ion exchange, I
predicted that not all calcium and magnesium will be removed.
Lastly, I expected the puddle rainwater from the parking lot adjacent to Whitmore Laboratory,
University Park, PA to be harder than the Aquafina water sample, but softer than the Brita sample. Even
though rainwater occurs naturally soft, I expected the puddle water to pick up traces of hardness
through its short-term contact with potential sedimentary rock sources [15].
In summary my hypothesis is that, the bottle Aquafina water should be the least hard, followed
by the puddle rainwater being slightly hard, the tap water from the Brita filter to be moderately hard,
and the Fiji water to be the hardest.
Procedure:
The complete and detailed procedure of “The Chemistry of Natural Water” experiment can be
found in Penn State’s Version of Chemtrek [15].
In order to observe the total dissolved solids in our water sample, we placed a drop of distilled
water, a drop of the water sample, and a drop of 1 x 10⁻³ moles of CaCl2 solution side by side a small

9
piece of aluminum foil. We then heated the foil so the water drops could evaporate on it and observe
the total dissolved solids it left behind.
To find the amount of divalent cations by EDTA titration, there were two parts to the
experiment we had to do. EDTA titration uses a “serial” titration method to find the ending point for the
EDTA. For the first part of the EDTA titration we added one drop of eriochrome black T (EBT), the
indicator, with one drop of NH3/NH4Cl buffer and one drop of 1 x 10⁻³ moles of MgSO4 solution to each
well of a 1x12 well strip. This solution was then titrated with EDTA solution in a “serial” method,
meaning adding one drop in the first well, two in the second and so on, all the way town to the 12th well.
The first well that turned blue is the point where it had excess EDTA, which is the endpoint. That well
number corresponds to the number of EDTA drops that were used. This number was then recorded and
will be used for future calculations to obtain the amount of Ca2+ concentration in the water sample. The
next part of this EDTA process was repeated again, but this time instead of adding one drop of 1 x 10⁻³
moles of MgSO4, one drop of 1 x 10⁻³ moles of CaCl2 was added to each well and the results recorded.
We then did the same serial titration with our water sample instead of using the 1 x 10⁻³ moles of CaCl2
and MgSO4 solutions. The rainwater from a puddle had to be diluted to observe a color change. The
EDTA titration method showed us the amount of hardness in the water including the calcium and
magnesium [15].
We then determined our water sample’s water hardness by using the Atomic Absorption
Spectroscopy. Before using this complex instrument, we had to fill two large pipets, one which was used
for finding the concentration of calcium and the other one for finding the concentration of magnesium.
The rainwater taken from a puddle, however, had to be diluted once since it was too hard for the
machine to read. We then proceeded to insert the aspirator tube from the AA fitted with the calcium
hollow cathode lamp into one of the pipets and did the same procedure with the AA fitted with the

10
hollow magnesium cathode lamp and the other pipet. After several seconds, the absorbance of both,
calcium and magnesium, in our water samples was shown on the screen, which we recorded for further
calculation in this section.
We experimented the softening of the water samples by adding a commercial water
conditioning agent and tested the hardness using the EDTA titration method. We mixed a small amount
of the water sample and commercial conditioning product in a vial and stirred it for a while. We then
titrated “serially” once again to test the hardness of this solution. After obtaining the hardness for the
treated water sample, we compared it with the results from the untreated water sample where there
was no softening agent.
Divalent cation removal by ion exchange was another method used as a softening process. This
was completed by mixing a sample of our water with the cation exchange resin in a vial. After stirring it,
the solution was taken out with a pipet and it was used to test the pH by using a piece of pH paper. The
soften sample was then again tested through EDTA titration and results were compared to that of the
untreated sample.

11
Ca Conc ppm
Check Standard ppm Error ppm % Error
1 0.87 0.13 15%
5 4.78 0.22 4.40%
10 10.12 0.12 1.20%
25 24.54 0.46 1.80%
50 49.15 0.85 1.70%
Mg Conc ppm
Check Standard ppm Error ppm % Error
1 1.21 0.21 21%
5 4.86 0.14 2.80%
10 9.7 0.3 3%
25 24.9 0.1 4%
30 29.93 0.07 2.30%
Ca Conc. (ppm)
Abs. at 422.7 nm
Mg Conc. (ppm)
Abs. at 202.5 nm
1 0.01203 1 0.03622
5 0.06228 5 0.14125
10 0.12872 10 0.2597
25 0.25874 25 0.57663
50 0.47084 30 0.67684
Table 1: Error for Ca2+ using AA
Table 2: Error for Mg2+ using AA
Table 3: AA calibration values obtained (see graphs 2 and 3)
Results:

12
Graph 2: Absorption vs. Concentration of Mg2+
Water Sample
Absorbance Value for Ca
Absorbance Value for Mg (ppm) (grains/gallons)
Bottled Aquafina water 0.0013 -0.0001 >1 >1
Bottled Fiji water 0.0319 0.1788 36.18 2.12
Tap water from a Brita Water Filter 0.3791 0.5349 165.54 9.68
Graph 2: absorption vs. Concentration of Ca2+
Table 4: AA absorbance and hardness values
13
Sample Calculation of Ca2+ and Mg2+ hardness (ppm) determined by AA:
Ca2+ Absorbance Value: 0.3791.
This absorbance value approximately equals 28.09 ppm, calculated by using equation y=
0.0139x-0.0114 plug 0.3791 in for y value and solve for x (see graph 1).
28.09 ppm Ca2+ * (100g CaCO3 / 1 mole) * (1 mole / 40g Ca2+) =
70.23 ppm hardness of Ca2+
Mg2+ Absorbance Value: 0.5349.
This absorbance value approximately equals 23.16 ppm, calculated by using equation y=0.0219x
+ 0.0277 plug 0.5349 in for y value and solve for x (see graph 3 in the Appendix).
23.16 ppm Mg2+ * (100g CaCO3 / 1 mole) * (1 mole / 24.3g Mg2+) =
95.31 ppm hardness of Mg2+
Total Hardness = (ppm hardness of Ca2+) + (ppm hardness of Mg2+)
(70.23 ppm) + (95.31 ppm) = 165.54 ppm of total hardness
Sample Drops of EDTA Drops of sample Diluted
Rainwater from a puddle 0.3892 0.2275 219.19 12.81
Table 5: Raw data used to determine water hardness through EDTA titration
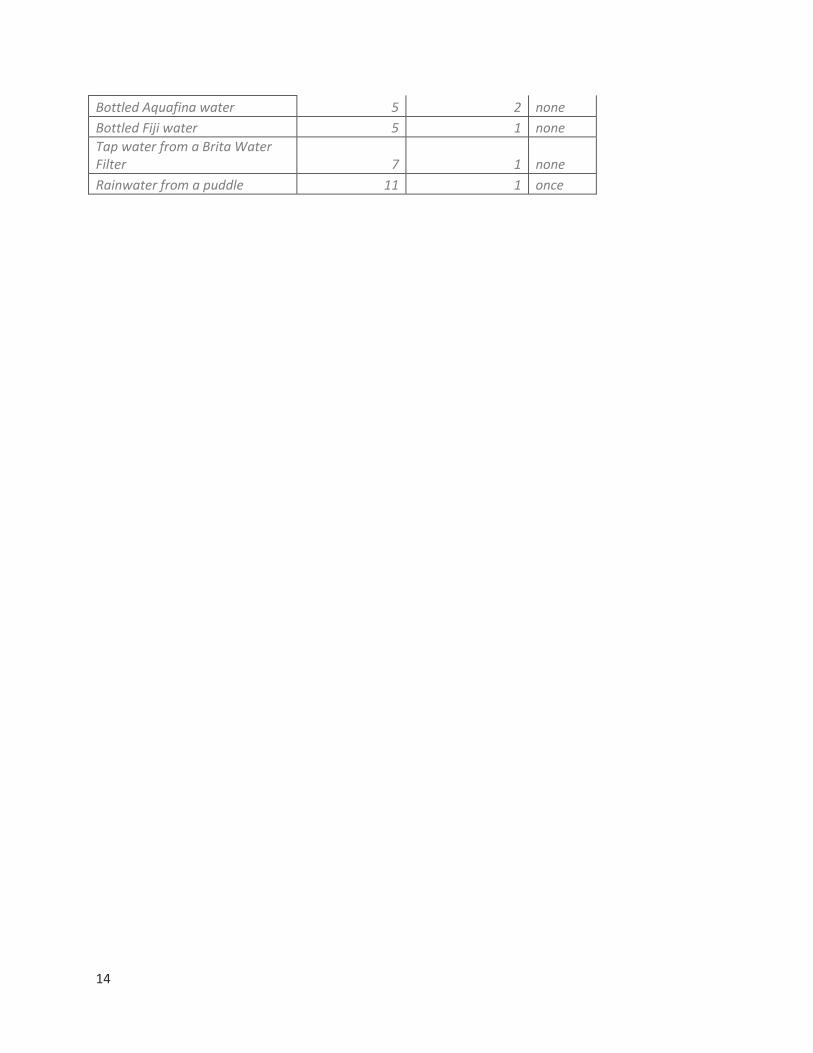
14
Bottled Aquafina water 5 2 none
Bottled Fiji water 5 1 none
Tap water from a Brita Water Filter 7 1 none
Rainwater from a puddle 11 1 once

15
Sample Calculation for Hardness (ppm):
MEDTAVEDTA = M1V1
(2.00 * 10-4 M) * (11 drops) = (x) * (1 drop)
X = 2.2 x 10⁻³ M CaCo3
(0.0022 M CaCo3 / 1 liter) * (100g CaCo3 / 1 mol CaCo3) * (1000mg CaCo3 / 1g Caco3) = 220
ppm of hardness
Sample Calculation for Grains per Gallon:
(220 ppm hardness) * (1 grain per gallon / 17.1 ppm) = 12.87 grains per gallon
Total Dissolved Solids (TDS)
Water Sample (ppm) (grains/gallon)
Bottled Aquafina water 50 2.92
Bottled Fiji water 100 5.85
Tap water from a Brita Water Filter 220 12.87
Rainwater from a puddle 280 16.4
Sample Observations
A. Distilled Water No residue
B. 1 x 10⁻³ M Ca2+ (reference) Faint ring
C. Bottled Aquafina water Faint ring compared to reference
D. Bottled Fiji water Heavy compared to reference
E. Tap water from a Brita Water Filter
Very heavy compared to reference
F. Rainwater from a puddle Very heavy compared to
Table 6: Water hardness calculated using EDTA
Table 7: TDS observations

16
reference
17
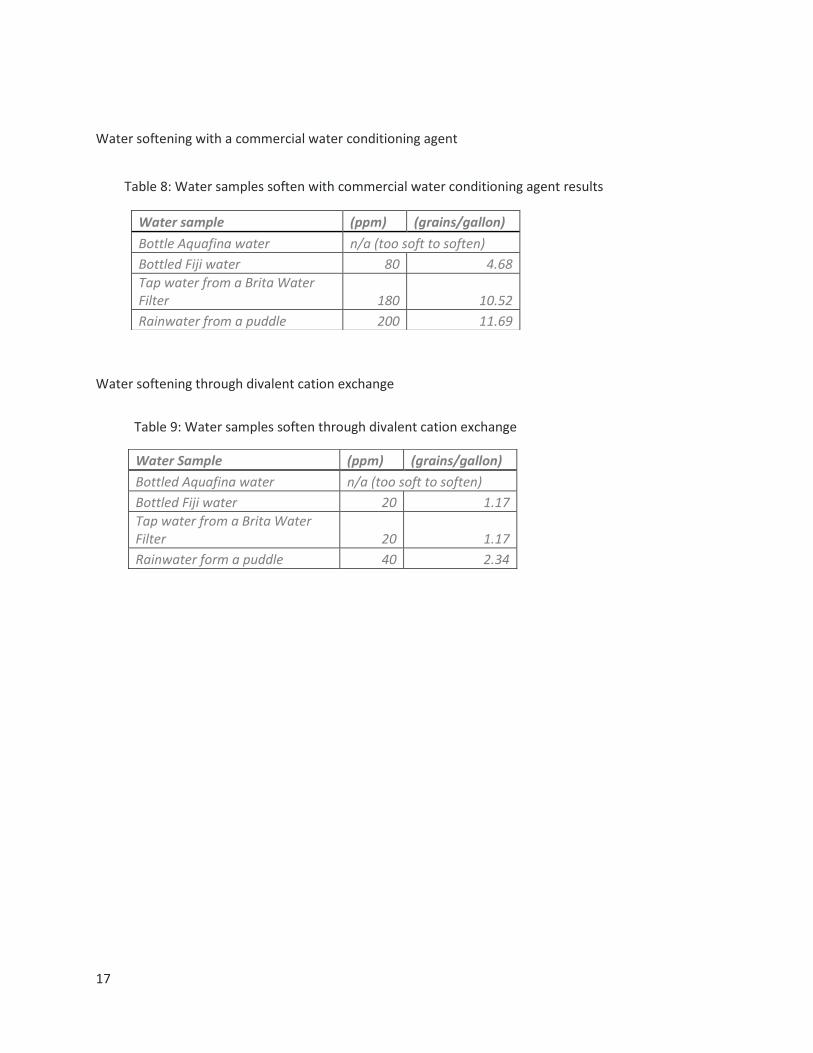
Water softening with a commercial water conditioning agent
Water softening through divalent cation exchange
Water sample (ppm) (grains/gallon)
Bottle Aquafina water n/a (too soft to soften)
Bottled Fiji water 80 4.68
Tap water from a Brita Water Filter 180 10.52
Rainwater from a puddle 200 11.69
Water Sample (ppm) (grains/gallon)
Bottled Aquafina water n/a (too soft to soften)
Bottled Fiji water 20 1.17
Tap water from a Brita Water Filter 20 1.17
Rainwater form a puddle 40 2.34
Table 8: Water samples soften with commercial water conditioning agent results
Table 9: Water samples soften through divalent cation exchange
18
Discussion:
The rainwater sample from a puddle located in the parking lot adjacent to Whitmore
Laboratory, University Park, PA resulted in being the hardest of all four water samples. It had a hardness
of 219.19 ppm calculated using atomic absorption [12]. This was different from my hypothesis because I
expected the water to be much softer since rainwater occurs naturally soft. This high level of hardness
could be due to several factors. A combination of various run-off waters, that had a high concentration
of calcium and magnesium, could have contributed to the overall hardness of the sample. Another
factor is that the rainwater, in the short time from when it precipitated and when it was collected, could
have passed through sedimentary rock sources releasing calcium and magnesium into the water [18]. It
is hard to determine the exact what the exact source of where the traces of water hardness could have
came from.
The next hardest sample was the tap water run through a Brita water filtration pitcher using the
tap water from Porter Hall, University Park, PA. The total hardness of the sample was 165.54 ppm
calculated using atomic absorption [9]. I expected the water to contain traces of hardness because the
hardness of the tap water around this area is approximately 208 ppm, according to the Water
Encyclopedia [13]. Since the filtration system uses cation ion exchange, we can then infer that not every
calcium and magnesium cation is exchanged with the monovalent cations in the resin [14]. Only some of
the divalent cations are exchange, causing the water to be softer than its original hardness from the tap,
but still maintain a high enough concentration of 165.54 ppm to be categorized as hard, between 120-
180 ppm, according to the NebGuide classification of water hardness [14]. This makes sense since the
original tap water being filtered could have been possibly very hard, approximately greater than 200
ppm. Through ion exchange the hardness of the water was able to be reduced by approximately 20% ,
from very hard to hard [14]. Other factors that could have affected the hardness were such that the

19
water from the tap being filtered through the Brita filter had to travel through many pipes, picking up
minerals found within the pipe [18].
The bottled Fiji water was found to be the third hardest sample. Its hardness was 38.18 ppm
calculated using atomic absorption [7]. This was a much different result than expected. The Fiji water
comes from an artesian well after the water has trickled through volcanic rocks, picking up minerals
along the way [5]. The only other filtration the water goes through is cleaning the water of debris or
harmful bacteria and other such pathogens [5]. The volcanic rock that the water is filtered through,
however, must not be a high sedimentary source containing large concentrations of calcium or
magnesium. We can infer this because if the rock source did contain high concentrations of such metals
the water would be much harder. Since the water contained low concentration of calcium and
magnesium, we can therefore infer that the rock sources the water came into contact with only had a
few traces of calcium or magnesium resulting in a low concentration of hardness in the water.
Finally, the bottled Aquafina water was the least hard of the samples. The hardness was less
than 1 ppm calculated using atomic absorption [10]. It was expected that this would be the softest
sample because it has been cleaned and purified to a greater extent than the other water samples
resulting in the lowest level of hardness. The water goes through an intensive 7 step filtration system.
The most important step in this system, in relation to removing calcium and magnesium metals, is the
reverse osmosis step. In this step every metal is removed completely and left behind, leaving the purist
from of water [1]. According to Aquafina’s website, found at www.Aquafina.com, Aquafina’s purification
system is designed to remove trace compounds such as carbonates, bicarbonates, calcium, and
magnesium to name a few [1]. This would directly explain why this extensive purification system would
result in such a low level of hardness.
20
With any preformed experiment there is always some chance for experimental error. For this
specific lab, some of the data taken was qualitative. When performing the EDTA titration, one person
may see one color, while another sees a different color in the same solution. The drops squeezed from
the pipets are another reason why human error might have affected the results. Each drop might have a
different volume. If more liquid came out in one drop than another, then the calculations could alter,
which could change the entire results. Overall, the experimental error was limited and did not affect the
overall outcome of this experiment.
When comparing the two methods, AA (Atomic Absorption Spectrophotometry) and EDTA
Titration used to determine the hardness in all four water sample we notice some variances between
the results. For example, the sample taken from the rainwater had an AA hardness of 219.19 and an
EDTA hardness of 280 [12].
The differences between the two methods may be accounted to the fact that EDTA takes into
account any polyvalent 2+ cations present in the water, while AA does not. The AA is element specific.
This would naturally make the value of hardness for EDTA Titration higher and the value for hardness for
AA smaller. Also, experimental error may come into play. If there was a mistake in recording or
interpreting which well the solution changes color during EDTA Titration the results would drastically
change by approximately 10% for each well you are off [12].
There are advantages and disadvantages in both methods. Some advantages of using EDTA,
however, are that it is much less expensive than determining water hardness through expensive
machinery such as the AA. Its disadvantages are that it is not as accurate as AA for determining true
water hardness. When testing for hardness, the endpoint will always be higher than the actual endpoint
may be. In fact the true hardness of the water could have been, in fact, in between the wells. Some
disadvantages of using AA, are that it is very expensive to buy the machinery and the lamps that are

21
needed. The lamps also need to be replaced often since they do not last very long, adding to the overall
cost. The AA also uses a tremendous amount of power to operate as well. Some advantages of the AA
are that it is element specific, the machine can be calibrated to what is being found, it is extremely fast,
and has great accuracy [15].
The water that was treated with commercial water softener was found to be softer than the
untreated water. For example the untreated water from the sample of rainwater from a puddle was
water had a hardness of 219.19 ppm, while the water treated with a commercial water conditioning
agent had a hardness of 200 ppm. When the rainwater softened through ion exchange it had a
significant difference of 40 ppm [12].
The change in hardness of untreated to treated water is a significant difference. The commercial
water softening agent reduced the water’s hardness by replacing the calcium and magnesium ions with
sodium ions, which were originally present in the agent as sodium bicarbonate [2]. Sodium ions do not
add to the water’s hardness value, therefore the water becomes softer. In the case of the ion exchange
the water sample was trested with a cation exchange resin that contained H+ ions. We could tell this
because when the treated water was tested with a pH paper, the paper turned red, which represented
that the water had become acidic and therefore the presence of H+ ions. The exchange resin is a polymer
containing numerous negatively changed SO32- functional groups that have H+ ions attached. The
exchange resin works is by exchanging the divalent cations (Ca+, Mg2+) in the water with monovalent
cations (H+). Because the pH paper turned red the hydrogen ion replaced the polyvalent cations in the
water [15].

22
Conclusion:
Based on the results obtained the rainwater taken from a puddle located in the parking lot
adjacent to the Whitmore Laboratory, University Park, Pa turned out to be the hardest of the water
samples. The second hardest sample was the tap water from Porter Hall, University Park, Pa filtered
through a Brita filtration pitcher. The bottled Fiji water was the third hardest, follows by the bottled
Aquafina water being the least hard. Through my results my hypothesis was proven wrong.
23
Resources:
1) Aquafina, <http://www.aquafina.com/> (accessed November 5, 2008).
2) Arm and Hammer,<http://armandhammer.com/> (accessed November 5 2008).
3) Brown, Theodore; LeMay, H. Eugene, Bruce E. CHEMISTRY – The Central Science. Pearson Education,
Inc., 11th Edition, Upper Saddle River, NJ, 2009: pg. 788.
4) FAQs-Frequently Asked Questions. Brita. <http://www.brita.net/uk/faqs_household.html?&l=1>
(accessed October 30, 2008) .
5) Fiji, <http://www.fijiwater.com/>(accessed November 5, 2008).
6) Franson, Mary Ann H., Ed. Standard Methods for the Examination of Water and Wastewater. United
Book Press, Inc Publishers, 20th Edition: Baltimore, MD, 1998, pages 1_36-1_38.
7) Hakes, Jackie, Chem 111 Laboratory Notebook, pp. 30-35.
8) Hard Water, <http://water.me.vccs.edu/concepts/hardwater.html>(accessed November 6, 2008).
9) Hartman, Anne, Chem 111 Laboratory Notebook, pp. 39-46.
10) Hartmann, Kristin, Chem 111 Laboratory Notebook, pp. 36-40.
11) International Bottled Water Association, <http://www.bottledwater.org/> (accessed November 2,
2008).
12) Jennings, Barbara, Chem 111 Laboratory Notebook, pp 50-56.

24
13) Leeden, Frits van der; Troise, Fred L.; Todd, David Keith., Ed. Water Encyclopedia. The Lewis
Publishers, 2nd Edition: Chelsea, MI, 1990, pages 424-453.
14) NebGuide, <http;//www.ianrpubs.unl.edu/epublic/live/g1491/build/g1491.pdf> (accessed
November 5, 2008).
15) Thompson, Stephen. PSU Chemtrek Small-Scale Experiments for General Chemistry. Ed. Joseph T.
Keiser. Hayden-McNeil Publishers, 15th Edition: Plymouth, MI, 2008, pages 10_2-10_11.
16) Total Dissolve Solids, <http://www.fws.gov/fire/downloads/monitor.pdf> (accessed November 5,
2008).
17) Understanding Water Hardness, <http://ca.uky.edu/wkrec/hardness.htm> (accesses November 5,
2008)
18) What Makes Water Hard and How Hard Water Can Be Improved,
<http://www.wqa.org/sitelogic.cfm? ID=207> (accessed November 4, 2008).

25