Embed Size (px)
Citation preview

The changing nature of outbound
royalties from Ireland and their impact on the taxation of the profits of US
multinationals
May 2021
Seamus Coffey
Department of Economics,
University College Cork
Disclaimer: This paper has been prepared by Seamus Coffey of University College Cork. The
views presented in this paper are those of the author alone and do not represent the official
views of the Department of Finance or the Minister for Finance. The paper was prepared in
the context of ongoing analysis of Ireland's Corporation Tax regime and reflects the data
available to the author at a given point in time.

ii
Summary
Large outbound royalty payments are made from Ireland as license fees for intellectual
property developed elsewhere. These outbound payments were €84.3 billion in 2019 and
preliminary figures for 2020 show a figure of €83.6 billion. Both of these were in excess of
20 per cent of GDP, with the majority of the payments arising the operations of US
multinational companies in Ireland.
An analysis of the geographic breakdown of these flows from Balance of Payments data
shows a very significant change in 2020. Up to 2020, the majority of the outbound royalty
payments from Ireland were directed to offshore financial centres such as Bermuda and the
Cayman Islands. In 2020, a number of US MNCs, particularly in the ICT sector, announced
changes to the licensing arrangements for the use of their intellectual property by their
international operations. Several US ICT MNCs began licensing their intellectual property
from the United States during 2020. After averaging €8 billion a year in the five previous
years, royalty payments from Ireland to the US jumped to €52 billion in 2020, and are likely
to be higher in future years.
In a case study of a US ICT MNC, this report analyses the impact of the changing nature of
outbound royalties from Ireland on the taxation of the profits of US multinationals. In
particular, the analysis focuses on three elements of the 2017 Tax Cuts and Jobs Act. These
are the one-time transition tax on pre-2018 profits of US MNCs which had benefitted from
deferred taxation, the US tax due on what is deemed to be global intangible low-taxed
income, and the relief provided by the US for foreign derived intangible income. Using
publicly available information including financial statements, the case study explores how
these have impacted the effective tax rate of a US MNC.
In time, the impact of these revised structures which is already evident in balance of
payments data will also be evident in other datasets including the aggregate statistics
published by the IRS and the OECD from the country-by-country reports filed by
multinational companies. The changes will also have a significant impact on the data on the
Activities of US Multinational Enterprises published by the Bureau of Economic Analysis
which have historically overstated the level of profits earned by the subsidiaries of US
multinational companies in Ireland.
The changes highlighted in the case study illustrate that the use of “double irish” type
structures is ending. It is non-controversial that the Irish operations of US companies have
to pay for the use of technology that is developed elsewhere and, in many cases, these
payments will continue to be made in form of outbound royalties. However, it is not clear
that the scale of these payments is a signal of aggressive tax planning as a greater and
greater share of these payments, particularly from the ICT sector, will flow directly and in
full to the United States. The changed pattern of royalty flows from Ireland is now more in
line with the economic substance of these companies and the reporting of their profits is
better aligned with the function, assets and risks that generate those profits

iii
Table of Contents
1 Introduction ............................................................................................................................ 1
2 Aggregate analysis of changes in royalty payments ............................................................... 1
2.1 Sectoral analysis ............................................................................................................... 2
2.2 Destination analysis ......................................................................................................... 3
3 The revised structures of US ICT MNCs .................................................................................. 6
3.1 Identifying revised structures in Ireland’s Balance of Payments statistics ...................... 6
3.2 A case study of these changes in company accounts data .............................................. 8
4 The impact on tax of the identified changes in royalty flows............................................... 12
4.1 Global Intangible Low-Taxed Income ............................................................................. 13
4.2 Foreign-Derived Intangible Income ................................................................................ 14
4.3 Why have US MNCs changed their structure? ............................................................... 15
4.4 How these changes will impact other statistics ............................................................. 16
4.5 The end of the “double-irish” ........................................................................................ 17
4.6 Complying with a Country-Specific Recommendation .................................................. 18
5 Conclusion ............................................................................................................................. 19
REFERENCES ............................................................................................................................. 20

iv
List of Figures
Figure 1: Outbound Royalty Payments …….………………….……………………….……………………………….2
Figure 2: Outbound Royalty Payments by Sector …………………………………….…………………………….2
Figure 3: Outbound Royalty Payments by Destination ……….…………………………..…………………….3
Figure 4: Outbound Royalty Payments to the Euro Area ……….……………..……………………………….6
Figure 5: Outbound Royalty Payments to Offshore Financial Centres…….……..……………………….7
Figure 6: Outbound Royalty Payments to the United States…………………..……………..……………….8
Figure 7: Profit in Bermuda by Ultimate Parent Jurisdiction………….…………………………………….15
List of Tables
Table 1: US ICT MNC Income from continuing operations before income taxes………………………8
Table 2: Holding Company Subsidiary of US MNC in Bermuda……………………………………………..…9
Table 3: Trading Company Subsidiary of US ICT MNC in Ireland……………………………………………10
Table 4: Consolidated Tax Reconciliation Statement of a US ICT MNC………………………………….12
Table 5: Profit of US Multinationals attributed to selected jurisdictions……………………………….16
Table 6: Income from continuing operations before income taxes of a US ICT MNC…….……....17

1
1 Introduction
The subsidiaries of US multinational companies (MNCs) operating in Ireland generate their
revenues from the sales of products and services that are the result of research and
development that is primarily undertaken in the United States. These include
pharmaceutical medicines and computer chips which are manufactured at Irish facilities and
advertising and other services sold on online platforms by information and communication
technology (ICT) companies that have their international headquarters in Ireland.
Recent years have seen significant changes introduced that impact on the taxation of these
companies. These changes include those brought about through the Organisation for
Economic Cooperation and Development’s original Action Plan under the Base Erosion and
Profit Shifting (BEPS) project, the Tax Cuts and Jobs Act signed into US law in 2017 and
changes to corporate tax residency rules in Ireland. These changes have been significant
and have triggered significant responses.
This note examines some of these changes and, in particular, focusses on outbound royalty
payments from Ireland. Section 2 looks at the major changes that have occurred since the
start of 2020 in the destination of these royalty payments. Section 3 provides some case-
study analysis exploring the evidence of revised structures of US MNCs from publicly-
available data. Section 4 continues this analysis and looks at the taxation of the profits from
such royalties with an emphasis on the relevant provisions of the US tax code including
those introduced by the Tax Cuts and Jobs Act of 2017 and also provides a brief analysis of
how the revised structures are likely to impact on some of the data sources used to assess
the activities of US MNCs. Section 5 draws together the main conclusions.
2 Aggregate analysis of changes in royalty payments
It is non-controversial that the Irish operations of US companies have to pay for the use of
technology that is developed elsewhere. There are essentially two ways in which this can be
achieved:
1. An outright purchase with the subsidiary in Ireland acquiring the rights or license to
use the technology;
2. Recurrent payments with the subsidiary in Ireland getting access to the technology
via royalty payments.
Historically, the latter was the main method used and recent years have seen an increase in
outright purchases or a combination of the two. Even still, it is likely that royalty payments
from Ireland will remain very significant over the coming years. However, there have been
important changes in the nature of these payments.
Figure 1 shows that in 2019, outbound royalties from Ireland were €84.3 billion, with the
preliminary figures for 2020 recording a small drop to €83.6 billion. Latest estimates are
that Irish GDP in 2020 was €366.5 billion meaning that the outbound royalty payments
made were equivalent to around 22.5 per cent of GDP.

2
The headline totals in recent years may have been relatively stable but there have been very
significant changes in the composition of outbound royalties from Ireland. In this section,
aggregate data by sector and by destination will be considered with Section 3 providing a
case study of company-specific outturns.
2.1 Sectoral analysis Some of the changes in the composition of outbound royalties can be seen if we look at the
contribution of the pharmaceutical and ICT sectors to the total in recent years. Figure 2
shows that, in 2016, the amount of outbound royalties for the ICT and pharmaceutical
sectors were broadly the same. In recent years these amounts have diverged, with
outbound royalties in the ICT sector rising and those for the pharmaceutical sector falling.
0
20,000
40,000
60,000
80,000
€million
2012 2013 2014 2015 2016 2017 2018 2019 2020
Source: Central Statistics Office, Balance of Payments
Value of Annual Irish Royalty Imports with all Countries
Figure 1: Outbound Royalty Imports
0
20,000
40,000
60,000
80,000
€million
2016 2017 2018 2019 2020 Source: Central Statistics Office, Balance of Payments
Value of Annual Irish Royalty Imports with all Countries by selected NACE Categories
Figure 2: Outbound Royalty Imports by Sector
Other Sectors
Pharmaceutricals
Information and Communication

3
Compared to 2016, outbound royalty payments by the pharmaceutical sector in Ireland
have reduced from €24 billion to €14 billion. Over the same period, outbound royalty
payments linked to the ICT sector have risen from €28 billion to €57 billion. Payments from
all other sectors excluding these two have also declined.
The share of outbound royalties from Ireland arising from the ICT sector has risen from 40
per cent in 2016 to almost 70 per cent in 2020. As a result of this much of the subsequent
analysis, including the case study beginning in Section 3, focusses on the ICT sector.
2.2 Destination analysis
Royalty payments leaving Ireland for technology developed elsewhere is only a part of the
story. Where they go to is also relevant. Up to recently the largest destination of these
royalties had been what are termed ‘offshore financial centres’. In the notes for its Balance
of Payments statistics, Ireland’s Central Statistics Office sets out that:
This category overlaps with the regions referred to above and covers Andorra, Antigua and Barbuda, Anguilla, Netherlands Antilles, Barbados, Bahrain, Bermuda, Bahamas, Belize, Cook Islands, Curacao, Dominica, Grenada, Guernsey, Gibraltar, Hong Kong, Isle of Man, Jersey, Jamaica, St. Kitts and Nevis, St Maarten, Turks and Caicos Islands, Cayman Islands, Lebanon, Saint Lucia, Liechtenstein, Liberia, Marshall Islands, Montserrat, Maldives, Nauru, Niue, Panama, Philippines, Singapore, Saint Vincent and the Grenadines, British Virgin Islands, US Virgin Islands, Vanuatu, Samoa.
Figure 3 provides a geographic breakdown of the main destinations of outbound royalty
payments from Ireland. In 2019, €37 billion or almost 45 per cent of total outbound
royalties from Ireland were paid to offshore financial centres.
0
20,000
40,000
60,000
80,000
€million
2012 2013 2014 2015 2016 2017 2018 2019 2020 Source: Eurostat, Balance of Payments
Value of Annual Irish Royalty Imports with Selected Regions
Figure 3: Outbound Royalty Imports by Destination
Other Regions Euro Area
Offshore Financial Centres United States

4
It can be seen that the amounts going to offshore financial centres were relatively modest
up to 2013 after which they increased rapidly. A likely reason for this is that up to then
Ireland levied a withholding tax on outbound royalty payments paid to non-treaty
countries. If royalty payments were made by an Irish resident person or entity to these
jurisdictions some of the payment would have to be withheld and paid to the Irish tax
authority, the Revenue Commissioners, to cover potential tax liabilities.
There was a fairly straightforward workaround for companies to avoid Ireland’s withholding
tax on outbound royalties to non-treaty countries. Under the EU’s Interest and Royalties
directive EU Member States cannot levy a withholding tax on royalty payments made by a
company to an associated company that is resident of another Member State.1
And as is well known The Netherlands does not levy a withholding tax on outbound
payments from there to locations such as Bermuda. This means that Figure 3 does not fully
represent the amount of outbound royalties from Ireland that are directed to ‘offshore
financial centres’.
Data on royalty flows from Ireland to The Netherlands is not available from Eurostat for all
years. However, for those years which it is available, the data shows that almost all of the
royalty payments made from Ireland to the rest of the euro area went to The Netherlands.
For example, in 2019, of the €29.0 billion of royalties from Ireland to the euro area, €26.4
billion went to The Netherlands. Similar shares are evident for the other years for which
data is available. Further, as will be shown in the next section, it is safe to assume that via
this “dutch sandwich” these royalties from Ireland were further transferred from The
Netherlands to jurisdictions such as Bermuda.
All of the companies involved in these transactions are US multinationals. The US tax
system has allowed (and incentivised) US companies to locate licenses for the use of their
technologies outside the US in low-tax jurisdictions such as Caribbean Islands.
So, while the Irish subsidiaries were correctly paying for the use of technology generated
elsewhere these payments were going to locations where the companies had no substance
rather than where the technology was actually developed, i.e., the United States. The
primary tax payments affected by these strategies are US tax payments.
There are many reasons why these strategies will no longer be effective. Revisions to the
OECD Transfer Pricing Guidelines including those brought about by Actions 8 to 10 of Action
Plan from BEPS v1.0 means that while such payments to entities that license the technology
can be made, they should not be retained if the legal owners have no or limited involvement
in the functions that lead to the development of the intellectual property being licensed.
This is formally set out in paragraph 6.42 of the 2017 update to the OECD’s Transfer Pricing
Guidelines:
1 An associated company is where Company A holds 25 per cent of the voting power in Company B; or Company C holds 25 per cent of the voting power of Companies A and B.

5
6.42 While determining legal ownership and contractual arrangements is
an important first step in the analysis, these determinations are separate and
distinct from the question of remuneration under the arm’s length principle.
For transfer pricing purposes, legal ownership of intangibles, by itself, does
not confer any right ultimately to retain returns derived by the MNE group
from exploiting the intangible, even though such returns may initially accrue
to the legal owner as a result of its legal or contractual right to exploit the
intangible. The return ultimately retained by or attributed to the legal owner
depends upon the functions it performs, the assets it uses, and the risks it
assumes, and upon the contributions made by other MNE group members
through their functions performed, assets used, and risks assumed. For
example, in the case of an internally developed intangible, if the legal owner
performs no relevant functions, uses no relevant assets, and assumes no
relevant risks, but acts solely as a title holding entity, the legal owner will not
ultimately be entitled to any portion of the return derived by the MNE group
from the exploitation of the intangible other than the arm’s length
compensation, if any, for holding title.
OECD (2017), p.262
Under these guidelines if the owner of the intangible asset does not undertake the relevant
functions a set of service transactions must be entered to pay for these functions. The price
set in these transactions will determine the profit that accrues to the owner of the
intangible asset. This will depend on the level of functions carried out by the owner of the
intangible and the pricing approach used by the jurisdiction where the functions are
undertaken.
As well as these changes to the OECD’s transfer pricing guidelines, revisions to Ireland’s
residence rules for Corporation Tax meant it was no longer as feasible for US companies to
avail of the deferral provisions in the US tax code such as the “same country exemption” –
with the original basis for the “double irish” being that two companies were registered in
the same country.2 Significantly, the Tax Cuts and Jobs Act (TCJA) effectively abolished the
principle of deferral for the US tax due on the profit from passive income such as royalties
which was the primary motivation for the creation of these structures.
2 These structures were multi-layered and a similar outcome could be achieved a number of ways. For example, the introduction by the IRS in 1997 of the “check the box” election for entity classification facilitated the broader use of ‘disregarded entities’ for tax purposes in the structures of US MNCs. This election was formalised via the temporary introduction of the ‘look-through rule’ for disregarded entities into Subpart F of the US tax code. There were a number of occasions on which the ‘look-through rule’ was set to expire but each time the US Congress passed an Act that included a provision for its extension. A feature of the “same country exemption” is that it is a permanent feature of the US tax code that did not require a Congressional vote for its extension or rely on an IRS regulation which could be changed.

6
3 The revised structures of US ICT MNCs
It is only US companies that have structures similar to the “double irish with a dutch
sandwich”. A number of companies, most notably in the ICT sector, have made public
statements that they are ending this arrangement. In its annual filing with the Securities
and Exchange Commission (SEC) for 2020, one US ICT company announced:
“As of December 31, 2019, we have simplified our corporate legal entity
structure and now license intellectual property from the U.S. that was
previously licensed from Bermuda resulting in an increase in the portion of
our income earned in the U.S.”
While another US ICT MNC, which previously made payments directly from Ireland to an
offshore financial centre, issued a statement in December 2020 which said:
“Intellectual property licenses related to our international operations have
been repatriated back to the US. This change, which has been effective since
July this year, best aligns corporate structure with where we expect to have
most of our activities and people. We believe it is consistent with recent and
upcoming tax law changes that policymakers are advocating for around the
world.”
3.1 Identifying revised structures in Ireland’s Balance of Payments statistics These changes have been made and the impact on royalty payments can be seen in the
data. As noted above, Eurostat don’t provide a complete series for royalty payments from
Ireland to the Netherlands (many of the values are redacted) but there is a complete series
for quarterly royalty payments from Ireland to the Euro Area and this is shown in Figure 4.
The available data suggest that payments to The Netherlands make up 90 per cent of royalty
payments from Ireland to the Euro Area.
0
2,500
5,000
7,500
10,000
€million
2011 2012 2013 2014 2015 2016 2017 2018 2019 2020
Source: Eurostat, Balance of Payments
Value of quarterly outbound royalties from Ireland to the rest of the Euro Area (EA19)
Figure 4: Royalty Imports with the Euro Area
7
It is clear there was a significant change at the start of 2020 with a large drop in royalties
payments made from Ireland to the Euro Area, which means there was a large drop in these
payments from Ireland to The Netherlands.
This change doesn’t make a significant immediate difference to the companies’ operations
in Ireland. The Irish company must still pay for the right to use the technology or platform it
is using but these license payments or royalties are no longer going to an offshore financial
centre via The Netherlands. The ending of this arrangement will not have a material impact
on the amount of Corporation Tax paid in Ireland.
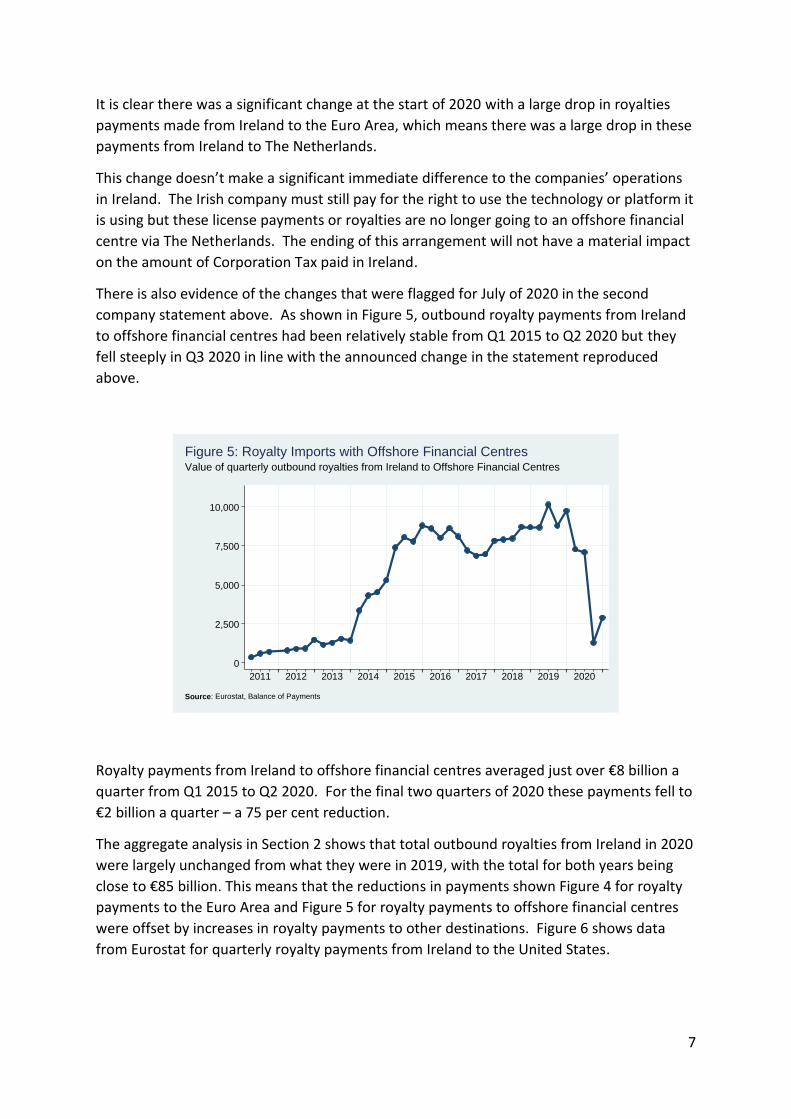
There is also evidence of the changes that were flagged for July of 2020 in the second
company statement above. As shown in Figure 5, outbound royalty payments from Ireland
to offshore financial centres had been relatively stable from Q1 2015 to Q2 2020 but they
fell steeply in Q3 2020 in line with the announced change in the statement reproduced
above.
Royalty payments from Ireland to offshore financial centres averaged just over €8 billion a
quarter from Q1 2015 to Q2 2020. For the final two quarters of 2020 these payments fell to
€2 billion a quarter – a 75 per cent reduction.
The aggregate analysis in Section 2 shows that total outbound royalties from Ireland in 2020
were largely unchanged from what they were in 2019, with the total for both years being
close to €85 billion. This means that the reductions in payments shown Figure 4 for royalty
payments to the Euro Area and Figure 5 for royalty payments to offshore financial centres
were offset by increases in royalty payments to other destinations. Figure 6 shows data
from Eurostat for quarterly royalty payments from Ireland to the United States.
0
2,500
5,000
7,500
10,000
€million
2011 2012 2013 2014 2015 2016 2017 2018 2019 2020
Source: Eurostat, Balance of Payments
Value of quarterly outbound royalties from Ireland to Offshore Financial Centres
Figure 5: Royalty Imports with Offshore Financial Centres

8
We can conclude that the royalty payments that went to The Netherlands up to Q4 2019
began flowing to the US in Q1 2020, with a further increase in the second half of 2020
coinciding with the drop in royalty payments from Ireland to offshore financial centres.
After averaging €8 billion a year in the five previous years, royalty payments from Ireland to
the US reached €52 billion in 2020. The total is likely to be even higher in 2021 as
restructures that were put in place in the middle 2020 will be effective for the full year.
Royalty payments from Ireland as a share of GDP are likely to remain at a level that is much
higher than other countries but future years are likely to see most of these payments go to
the United States where the technologies used by the subsidiaries of US MNCs in Ireland are
developed.
3.2 A case study of these changes in company accounts data We have further evidence of these changes in royalty flows from the filings made by US
companies to the Securities and Exchange Commission (SEC). Table 1 shows the split of one
company’s income before taxes in profit from domestic operations and profit from foreign
operations:
Table 1: Income from continuing operations before income taxes for a US ICT MNC
2015 2016 2017 2018 2019 2020
$m $m $m $m $m $m Domestic Operations 8,300 12,000 10,700 15,800 16,400 37,600 Foreign Operation 11,400 12,100 16,500 19,100 21,200 10,500
Total 19,700 24,100 27,200 34,900 37,600 48,100
Source: Annual 10K SEC Filings (figures rounded to the nearest $hundred million)
0
5,000
10,000
15,000
20,000
25,000
€million
2011 2012 2013 2014 2015 2016 2017 2018 2019 2020
Source: Eurostat, Balance of Payments
Value of quarterly outbound royalties from Ireland to the United States
Figure 6: Royalty Imports with the United States

9
In the context of US MNCs, the figures for domestic operations refer to the income
attributed to the functions, assets and risks that are located in the United States and foreign
operations refers to activities in other jurisdictions. For this multinational, up to 2019, more
of its income was deemed as foreign rather than domestic. For the five years from 2015 to
2019, an average of 55 per cent of income before income taxes was attributed to foreign
operations. This is somewhat at odds with the economic footprint of these companies as
most of the functions, assets and risks that generate their profits, most notable the research
and development activities, are located in the US.
Included in those foreign profits up to 2019 would have been the profit from the royalty
flows out of Ireland. The outbound royalties from Ireland were payment for technology
developed in the US but the US approach to transfer pricing allowed the rights to this
technology to be advantageously placed offshore. Companies were then able to locate
these licenses in no-tax jurisdictions such as Bermuda and the approach at the time allowed
them to fully attribute the profit from these licenses to their legal owners. Table 2 gives the
income statement for the years from 2017 to 2019 for an IP holding company based in
Bermuda of a US ICT MNC.
Table 2: Holding Company Subsidiary of US ICT MNC in Bermuda
2017 2018 2019
$m $m $m
Statement of Profit and Loss and Other Comprehensive Income
Turnover 22,334 25,740 26,520
Cost of sales -94 -108 -87
Gross profit 22,240 25,632 26,433
Administration expenses -10,552 -11,122 -14,123
Other operating income 44 - 39
Other operating expenses -27 -56 -1
Operating profit 11,704 14,454 12,347
Income from shares in group undertakings 1,974 3 598
Interest receivable and other income 869 1,075 767
Interest payable and other expenses -18 -15 -1
Profit on ordinary activities before tax 14,529 15,517 13,711
Tax on profit on ordinary activities - - -
Profit for the financial year 14,529 15,517 13,711
Source: Filings with Irish Companies Registration Office
The turnover of this holding company subsidiary was the royalties received from a related
holding company subsidiary in The Netherlands. In turn, the subsidiary in The Netherlands
received royalties from trading subsidiaries in Ireland and Singapore. In its 2019 accounts
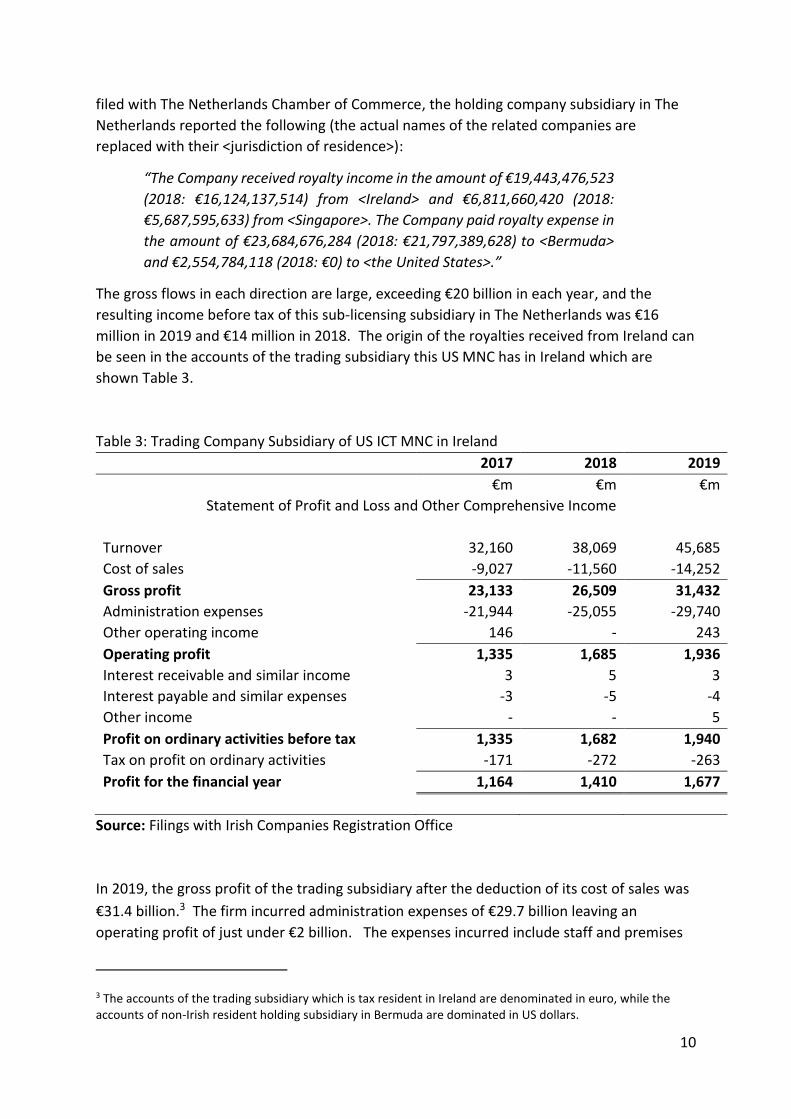
10
filed with The Netherlands Chamber of Commerce, the holding company subsidiary in The
Netherlands reported the following (the actual names of the related companies are
replaced with their <jurisdiction of residence>):
“The Company received royalty income in the amount of €19,443,476,523
(2018: €16,124,137,514) from <Ireland> and €6,811,660,420 (2018:
€5,687,595,633) from <Singapore>. The Company paid royalty expense in
the amount of €23,684,676,284 (2018: €21,797,389,628) to <Bermuda>
and €2,554,784,118 (2018: €0) to <the United States>.”
The gross flows in each direction are large, exceeding €20 billion in each year, and the
resulting income before tax of this sub-licensing subsidiary in The Netherlands was €16
million in 2019 and €14 million in 2018. The origin of the royalties received from Ireland can
be seen in the accounts of the trading subsidiary this US MNC has in Ireland which are
shown Table 3.
Table 3: Trading Company Subsidiary of US ICT MNC in Ireland
2017 2018 2019
€m €m €m
Statement of Profit and Loss and Other Comprehensive Income
Turnover 32,160 38,069 45,685
Cost of sales -9,027 -11,560 -14,252
Gross profit 23,133 26,509 31,432
Administration expenses -21,944 -25,055 -29,740
Other operating income 146 - 243
Operating profit 1,335 1,685 1,936
Interest receivable and similar income 3 5 3
Interest payable and similar expenses -3 -5 -4
Other income - - 5
Profit on ordinary activities before tax 1,335 1,682 1,940
Tax on profit on ordinary activities -171 -272 -263
Profit for the financial year 1,164 1,410 1,677
Source: Filings with Irish Companies Registration Office
In 2019, the gross profit of the trading subsidiary after the deduction of its cost of sales was
€31.4 billion.3 The firm incurred administration expenses of €29.7 billion leaving an
operating profit of just under €2 billion. The expenses incurred include staff and premises
3 The accounts of the trading subsidiary which is tax resident in Ireland are denominated in euro, while the accounts of non-Irish resident holding subsidiary in Bermuda are dominated in US dollars.

11
costs in Ireland and fees paid to other group undertakings to provide services and support
to customers in local jurisdictions. However, by far the largest component of these expenses
incurred by the Irish trading subsidiary is the royalty it must pay for the license to use the
MNC’s platform and technology. As the accounts of the subsidiary in The Netherlands show,
these payments were equal to €19.4 billion in 2019 and €16.1 billion in 2018, with almost all
of this subsequently paid to an IP holding company subsidiary in Bermuda.
The Bermudan IP holding company obtained the rights that allowed it to charge royalties for
the use of the MNCs technology in markets outside the Americas via a cost-sharing
agreement. This meant the IP holding company had to make a contribution to the overall
research and development costs incurred by the multinational, with this cost-sharing
payment forming the bulk of the Administration expenses in the Statement of Profit and
Loss of the IP holding company subsidiary shown in Table 2.
For the three years for which the income statement of the holding company is shown, the
operating margin of the holding company was around 50 per cent. That is, it paid out
around 50 per cent of the turnover received (the royalties that originated in Ireland and
Singapore) with the bulk of this going to fund the R&D activities in the US.
As of the start of 2020, this cycle of flows has ended. For this US multinational, the royalty
from Ireland which previously went to Bermuda with about half being paid onwards to the
US to cover expenses now directly, and in full, flows to the United States. This payment
structure is in line with the economic reality and substance of the MNC as the technology
used by the Irish subsidiary to generate sales was almost wholly developed in the United
States.
This is evident from Table 1 in the 2020 split of the MNCs profit into domestic and foreign.
The MNC’s domestic profit rose from $16.4 billion in 2019 to $37.6 billion in 2020. There
was an offsetting change to profits from foreign operations which fell from $23.2 billion in
2019 to $10.5 billion in 2020.
These changes can be fully explained by the transfer of the 2020 equivalent of $13.7 billion
of profit reporting by the holding company in Bermuda in 2019 into the US in 2020. This
MNC is no longer using a “double-irish” structure involving two Irish-registered subsidiaries
– one a trading company in Ireland and the other a holding company in an offshore financial
centre.4 The trading company in Ireland continues as before but there is no longer a role for
the IP holding company in a no-tax jurisdiction. The MNC has transferred the IP assets of
this holding company back to the US and is now reporting most its profit where the
functions, risks and assets that generate it are located – in the US. The figures from Table 1
show that in 2020 around 80 per cent of the income before taxes of the MNC were
attributed to operations in the US.
4 The trading company was resident in Ireland for tax purposes but the IP holding company was not.

12
4 The impact on tax of the identified changes in royalty flows
We can get some insights into the tax implications of these changes from Table 4 which is
the reconciliation of the MNC’s effective tax rate with the statutory federal corporate
income tax rate in the US. It should be noted that this rate was 35 per cent up to 2017 and
has been 21 per cent since.
Table 4: Consolidated Tax Reconciliation Statement of a US ICT MNC
2015 2016 2017 2018 2019 2020
% % % % % %
U.S. federal statutory tax rate 35.0 35.0 35.0 21.0 21.0 21.0
Foreign income taxed at different rates (13.4) (11.0) (14.2) (4.4) (4.9) (0.3)
Foreign derived intangible income deduction - - - (0.5) (0.7) (3.0)
One-time transition tax - - 37.6 - - -
Federal research credit (2.1) (2.0) (1.8) (2.4) (2.5) (2.3)
Stock-based compensation expense 0.3 (3.4) (4.5) (2.2) (0.7) (1.7)
European Commission fines 0.0 0.0 3.5 3.1 1.0 0.0
Deferred tax asset valuation allowance - 0.1 0.9 (2.0) 0.0 1.4
State and local income taxes - - 0.1 (0.4) 1.1 1.1
Other adjustments (3.0) (0.6) (3.2) (0.4) 1.1 0.0
Effective tax rate 16.8 19.3 53.4 12.0 13.3 16.2
Source: Annual 10K SEC Filings
The three key provisions we are looking for the impact of are:
1. The one-time transition tax;
2. The abolition of deferral and the introduction of the tax on GILTI;
3. The introduction of relief for FDII.
All of these were introduced with the Tax Cuts and Jobs Act (TCJA) which was passed by the
US Congress in late 2017. Under the “double irish”, a significant share of the profits of
certain US MNCs ended up in jurisdictions with no income taxes such as
Bermuda. However, that didn’t mean the profit was not subject to income tax.
The US operates a worldwide corporate income tax regime so US companies owe US tax on
their profits wherever arising. US MNCs might have been able to shift the highly-valuable
license for the use of their platforms and technology out of the US and attribute significant
profits to the legal owner of that license in a no-tax jurisdiction but US tax was still due on
those profits.
Of course, pre-TCJA, companies could defer the payment of this US tax until the profit was
formally repatriated back to the US, if ever. For the US ICT MNC under examination here

13
this shows in Table 4 with the double-digit negative impact on the effective tax rate in the
row for foreign income taxed at different rates. The ability of US MNCs to defer the US tax
due on these profits until formally repatriated into the US significantly reduced their tax
payments at the time the profit was earned. In the example here, foreign income taxes at
different rates reduced this US MNCs effective tax rate by between 11 and 14 percentage
points from 2015 to 2017.
The TCJA introduced a “deemed repatriation tax” for these historical profits taxed at lower
rates but at a rate lower than the 35 per cent that would have applied without the deferral.
In its annual report for 2017, filed with the SEC in early 2018 after the passing of the TCJA,
the company for which the tax reconciliation in Table 4 applies noted the following:
One-time transition tax
The Tax Act requires us to pay U.S. income taxes on accumulated foreign
subsidiary earnings not previously subject to U.S. income tax at a rate of
15.5% to the extent of foreign cash and certain other net current assets and
8% on the remaining earnings. We recorded a provisional amount for our
one-time transitional tax liability and income tax expense of $10.2 billion.
We have recorded provisional amounts based on estimates of the effects of
the Tax Act as the analysis requires significant data from our foreign
subsidiaries that is not regularly collected or analyzed.
As permitted by the Tax Act, we intend to pay the one-time transition tax in
eight annual interest-free installments beginning in 2018.
This one-off tax applies to the pre-2018 foreign profits of US MNCs and the MNC here
reports that it faces a US tax bill of $10.2 billion on these profits. The impact of this can be
seen in the 2017 column in the Table 4 table with the row for the One-time transition tax
adding 37.6 percentage points to the company’s effective tax rate in 2017, giving rise to an
overall effective tax rate in that year of over 50 per cent.
For 2017, this US MNC reported an income before income taxes of $27.2 billion. The $10.2
billion tax liability that arose from the one-time transition tax is 37.6 per cent of the MNC’s
2017 pre-tax profit. However, the tax is due on historical profits and it is likely that the
previously unrepatriated profits earned by the IP holding company in Bermuda are
responsible for the bulk of this US tax liability. The amount of historical profit that was
subject to the one-time transition tax is not provided but the size of the tax liability and the
rates at which the tax is levied indicate a range of $65 billion to $127 billion of profits which
were subject to the tax.
4.1 Global Intangible Low-Taxed Income In effect, the TCJA effectively abolished the deferral provisions which meant the US tax due
on foreign passive income was not paid at the time the profit was earned and introduced
the tax on GILTI for these profits. GILTI is an acronym for Global Intangible Low-Taxed
Income. The detail is complex but at its essence GILTI imposes a 10.5 per cent US tax on

14
eligible foreign income in excess of the company’s foreign tangible assets with no additional
US tax due if the foreign tax paid on these profits exceeds 13.125 per cent.
As set out in Section 3, prior to 2020 a large share of this MNC’s foreign income ended up in
Bermuda. Those profits that were earned before 2018 were subject to the one-time
transition tax and the profit that ended up in Bermuda in 2018 and 2019 was subject to US
tax at 10.5 per cent regardless of whether it was repatriated to the US or not. Of course,
10.5 per cent is significantly lower than the statutory 21 per cent rate that was also
introduced by the TCJA, so having a large share of its profit taxed at 10.5 per cent would
reduce the MNC’s effective rate.
This can be seen in the tax reconciliation table for the row foreign income taxed at different
rates. As noted above, up to 2017, this row reflects the benefits from deferral while from
2018, among other things, it shows the impact of having GILTI taxed at 10.5 per cent instead
of 21 per cent. These different rates reduced the MNC’s effective tax rate by 4.4 percentage
points in 2018 relative to the 21 per cent statutory rate, while in 2019 the impact of foreign
income taxed at different rates was a 4.9 percentage point reduction in the effective tax
rate.
Under the new structure discussed in this note, where the foreign income of the MNC has
fallen substantially, the impact of foreign income taxed at different rates resulted in a
reduction of just 0.3 percentage points in 2020 effective tax rate. This implies that the
average tax rate on foreign profit in 2020 was close to 21 per cent and that the MNC no
longer has substantial income in non-US subsidiaries that is subject to the GILTI provisions.
4.2 Foreign-Derived Intangible Income So, does this mean that the profit previously reported in Bermuda is now subject to tax in
the US at 21 per cent? Not quite. We now turn to another TCJA provision, FDII – Foreign
Derived Intangible Income. This is also a complex provision but essentially is the reduced tax
that is applied when companies in the US sell or license property for a non-US resident to
use.
The MNC in the US is licensing the right to use its technology in markets around the world to
a trading subsidiary in Ireland. The fee that the Irish subsidiary pays (the royalty) is taxed
under the FDII provisions. This imposes a 13.1 per cent US tax on these profits (though the
calculation of the actual amount of taxable income subject to this tax is far from
straightforward).
The changed structure in 2020 means the MNC has moved from a situation where the profit
earned selling to customers via Ireland was taxed by the US at 10.5 per cent under the tax
on GILTI to this profit being taxed at 13.1 per cent under the tax on FDII.
The impact of this can again be seen in the tax reconciliation table and is easy to identify
with the row labelled Foreign-derived intangible income deduction. Table 4 shows that this
increased in 2020 – to coincide with the increased royalty payments from Ireland to the US
– and that having this profit taxed under the FDII provisions rather than at the statutory

15
headline rate of 21 per cent reduced the multinational’s 2020 effective tax rate by 3.0
percentage points. This item had a much lower impact on the effective tax in 2018 and
2019 as the MNC was not doing its main licensing for international markets from the US. A
useful summary of the impact of the GILTI and FDII provisions in the 2018 tax returns of 81
of the largest US MNCs is provided in Dowd, Giosa and Willingham (2020).
4.3 Why have US MNCs changed their structure? There are many reasons why US MNCs have made these changes including changes in tax
law in Ireland and the US. An overarching reason is the OECD’s BEPS project. One of the
aims of this project is to try to ensure that company profits are better aligned with
substance. These US MNCs had little or no substance in offshore financial centres so
declaring a large amount of profit there did not align with the location of their functions,
risks and assets.
Transfer pricing rules, particularly in relation to the pricing of intangibles, have changed to
reduce firms’ ability to do this. Most notable among these changes have been the
introduction of DEMPE rules for intangible assets. These mean the extent to which profits
are attributed to an intangible asset must reflect the development, enhancement,
maintenance, protection and exploitation functions carried out by the owner.
Of course, getting the license out of the US in the first place and into a no-tax jurisdiction is
the ultimate reason such profits ended up there. It is US rules, such as the US approach to
cost-sharing arrangements, that mean profits from US firms dominate in places like
Bermuda. This can be seen in Figure 7 which illustrates the profits of subsidiaries in
Bermuda by the jurisdiction of their ultimate parent from the OECD’s publication of 2016
data compiled from country-by-country reports of reporting MNCs.
-306
-0
-0
6
120
175
352
500
572
24,900
0 10,000 20,000 30,000US$ millions
China
Indonesia
South Africa
Mexico
Luxembourg
Australia
Italy
Brazil
India
United States
Source: OECD
Profit Before Tax from OECD Aggregate Data from Country-by-Country Reports
Figure 7: Profit in Bermuda by Ultimate Parent Jurisdiction, 2016

16
The figures for 2016 are from a limited sample of parent jurisdictions but the overall picture
is unlikely to change as the OECD publishes later updates of this data for the subsequent
years up to 2019. The bulk of the profit that ended up in jurisdictions such as Bermuda was
due to US MNCs. From the analysis shown in this note there will be a significant change in
this data for 2020 as IP licenses that were previously held in Bermuda by US MNCs were
relocated, again in line with the changed nature of outbound royalty payments from Ireland.
4.4 How these changes will impact other statistics The changes are also likely to impact the outcomes for Ireland and other jurisdictions shown
in other data sources. This includes the data on the Activities of US Multinational
Enterprises published by the Bureau of Economic Analysis (BEA). The reason these changes
will impact this data is because of the use by the BEA of country of incorporation in
assigning some outcomes to geographic areas in this data. If a US multinational has an Irish-
registered IP holding company subsidiary that is not resident in Ireland for tax purposes but
is based in Bermuda then the BEA data on the Activities of US Multinational Enterprises will
attribute any profit it earns to Ireland thus overstating profits actually earned in Ireland.
Table 5 compares the profit figures for recent year from the BEA data on the Activities of US
Multinational Enterprises and those reported by the Internal Revenue Service (IRS) based on
the country-by-country tax reports filed with them by US multinationals. This BEA data has
been used in a number of analyses to assess US multinationals including Zucman and Wright
(2018).
Table 5: Profit of US Multinationals attributed to selected jurisdictions
Ireland Bermuda UK Islands, Caribbean
BEA IRS BEA IRS BEA IRS $m $m $m $m $m $m
2016 76,913 31,390 -5,544 24,900 11,272 26,082 2017 81,268 29,478 4,388 32,476 12,906 61,441 2018 97,867 49,142 7,948 97,212 12,273 53,671
Source: BEA refers Bureau of Economic Analysis data on the Activities of US Multinational
Enterprises. The figures used are “profit-type return of affiliates” from Part II Table F.7.
IRS refers Internal Revenue Service Statistics of Income (SOI) Division data from Country-by-
Country Reports (Form 8975). The figures used are for “profit (loss) before income tax”
from Table 1A.
Note: UK Islands, Caribbean is comprised of British Virgin Islands, Cayman Islands,
Montserrat, and Turks and Caicos Islands.
As can be seen in Table 5, the BEA data on the Activities of US Multinational Enterprises
significantly overstates the profit of US multinationals that should be attributed to Ireland

17
while understating the profit reported for tax purposes in jurisdictions such as Bermuda and
the Cayman Islands.
The case study explored in the earlier sections shows the subsidiary that was in Bermuda
will have no such profits to report after 2019. The 2020 update of the BEA data on the
Activities of US Multinational Enterprises will be published in the third quarter of 2022. This
will likely show a significant drop in the amount of profit attributed to the activities of US
multinationals in Ireland – though most of this will actually be profit that was previously
reported in jurisdictions such as Bermuda or the Cayman Islands. This will likely bring the
figures for Ireland in the BEA data much more in line with those published by the Internal
Revenue Service (IRS) using data from country-by-country tax reports filed with it.
These differences have been noted in more recent analysis of the activities of US
multinationals. Garcia-Bernardo, Janský and Tørsløv (2021) use both BEA and IRS data to
assess US multinationals and they note that their “results are consistent across the data sets
with the exception of Ireland, for which the BEA and BEA 2 data sets provide much higher
excess profits than the remaining data sets.” Klausing, Saez and Zucman (2021) also
highlight the differences between the BEA and IRS data and when pointing to the greater
reliability of the IRS data they state that “since the data are known to be used for transfer
pricing risk assessment, it is unlikely that companies will have an incentive to overstate their
income, especially in tax havens.”
4.5 The end of the “double-irish” The changes in the licensing structures for a US ICT MNC discussed above illustrate the end
of the “double-irish”. The impact can also be seen if we look at other companies. Table 6 is
the split of income before taxes into that attributed to domestic operations and attributed
to foreign operations from the 2020 annual report of another US ICT MNC.5
Table 6: Income from continuing operations before income taxes of a US ICT MNC
2015 2016 2017 2018 2019 2020
$m $m $m $m $m $m
Domestic Operations 2,802 6,368 7,079 8,800 5,317 24,233
Foreign Operation 3,392 6,150 13,515 16,561 19,495 8,947
Total 6,194 12,518 20,594 25,361 24,812 33,180
Source: Annual 10K SEC Filings
5 This table is similar to Table 1 for the company examined in the case study in Section 3.

18
Again, we see a very significant change in 2020 with a much larger share of the MNC’s profit
being attributed to its domestic, i.e., US, rather than foreign operations. In 2019, over 75
per cent of this MNCs income before taxes was attributed to foreign operations. In 2020
this fell to 25 per cent. This is because this multinational transferred the license to sell
services on its online platforms in international markets from the Cayman Islands back to
the US.
We could go through the same analysis on the one-time transition tax and the impact of the
GILTI and FDII provisions for this US multinational as undertaken in the case study in
sections 3 and 4, but it is not necessary. The conclusion is simple: the “double-irish” is
redundant. The heretofore foreign profit of some of the US MNCs that used such structures
has been shifted back to the US.
The fact that these profits were already subject to US tax6 means this has not resulted in a
significant increase in these companies’ effective tax rates but the changes do mean that
much more of the profit of these US MNCs is reported where the functions, risks and assets
that generate those profits are located.
4.6 Complying with a Country-Specific Recommendation The European Commission have raised concerns with the level of outbound royalty
payments from Ireland. In its 2020 Country-Specific Recommendations to Ireland, the
Commission note:
“[T]he high level of royalty and dividend payments as a percentage of GDP
suggests that Ireland’s tax rules are used by companies that engage in
aggressive tax planning, and the effectiveness of the national measures
will have to be assessed.”
European Commission (2020), p.7
The analysis in this note has shown that royalty payments from Ireland are likely to continue
at a high level as a percentage of GDP relative to the levels seen in other Member States.
However, it is not clear that this is a signal of aggressive tax planning as a greater and
greater share of these payments, particularly from the ICT sector, flow directly and in full to
the United States. Are national measures being effective if, in conjunction with changes
agreed internationally, they are resulting in a large reduction in the level of outbound
royalty payments being directed to offshore financial centres? The pattern of royalty flows
from Ireland is now more in line with the economic substance of these companies.
6 Either upon repatriations under the pre-TCJA US corporate income tax regime, under the one-off transition tax introduced by the TCJA or under the GILTI provisions of the same Act.

19
5 Conclusion
The subsidiaries of US multinationals operating in Ireland generate significant sales through
the use of technologies developed in the US. It is incontrovertible that the Irish operations
of these multinationals pay for the use of technology and much of these payments are made
in the form of outbound royalties. In 2020, outbound royalty payments from Ireland were
€83.4 billion which is equivalent to 22.5 per cent of Irish GDP in that year.
There was a significant change in 2020 in the destination of these royalty payments. Many
US MNCs, most notably in the ICT sector, have restructured the licensing arrangements for
their technology as a result of changes to the OECD Transfer Pricing Guidelines, revisions to
Ireland’s residency rules for Corporation Tax and the changes to the US tax code introduced
by the Tax Cuts and Jobs Act of 2017. A case study of US MNCs in the ICT sector shows that
under the revised structures the use of technology in international markets is no longer
licensed from jurisdictions such as Bermuda and the Cayman Islands but instead is licensed
directly from the United States. This is in line with the economic footprint of these
companies and aligns the reporting of their profits with the location of their substance. The
annual reports for 2020 for these companies show a large rise in the share of their profits
being attributed to domestic, or US-based, operations. These US operations include the
bulk of these companies’ research and developments activities which is a key driver of their
profits.
Outbound royalty payments continue to be made from Ireland for the use of the resulting
technology but rather than being routed to offshore financial centres benefitting from a
deferral of US tax as was the case under the pre-2018 US tax regime, this income is now
being directed to the United States. In 2020, around 60 per cent of the royalty payments
from Ireland went to the United States. This share is likely to increase in coming years.
20
REFERENCES
Clausing, K., Saez, E. and Zucman, G. (2021). Ending corporate tax avoidance and tax
competition: A plan to collect the tax deficit of multinationals. UCLA School of Law, Law-
Econ Research Paper No. 20-12, http://dx.doi.org/10.2139/ssrn.3655850
Dowd, T. and Giosa, C.P. and Willingham, T. (2020). Corporate behavioral responses to TCJA
for tax years 2017–2018. National Tax Journal.
https://www.journals.uchicago.edu/doi/10.17310/ntj.2020.4.09
European Commission (2020). Recommendation for a Council Recommendation on the 2020
National Reform Programme of Ireland and delivering a Council opinion on the 2020 Stability
Programme of Ireland. https://ec.europa.eu/info/sites/default/files/2020-european-
semester-csr-comm-recommendation-ireland_en.pdf
Garcia-Bernardo, J., Janský, P. and Tørsløv, T. (2021). Multinational corporations and tax
havens: evidence from country-by-country reporting. International Tax and Public Finance.
https://doi.org/10.1007/s10797-020-09639-w
Organisation for Economic Cooperation and Development (2017). Transfer pricing guidelines
for multinational enterprises and tax administrations. https://www.oecd.org/tax/transfer-
pricing/oecd-transfer-pricing-guidelines-for-multinational-enterprises-and-tax-
administrations-20769717.htm
Wright, T., and Zucman, G. (2018). The exorbitant tax privilege. National Bureau of Economic
Research Working Paper, 24983. https://www.nber.org/papers/w24983