Embed Size (px)
Citation preview

THE CENTRE FOR MARKET AND PUBLIC ORGANISATION
The Centre for Market and Public Organisation, a Research Centre based at the University of Bristol, was established in 1998. The principal aim of the CMPO is to develop understanding of the design of activities within the public sector, on the boundary of the state and within recently privatised entities with the objective of developing research in, and assessing and informing policy toward, these activities.
Centre for Market and Public Organisation University of Bristol
Department of Economics Mary Paley Building
12 Priory Road Bristol BS8 1TN Tel: (0117) 954 6943
Fax: (0117) 954 6997 E-mail: [email protected]
Persistency of pension contributions in the UK: Evidence from aggregate and micro-data
Sarah Smith
January 2006
Working Paper No. 06/139
ISSN 1473-625X

CMPO Working Paper Series No. 06/139
CMPO is jointly funded by the Leverhulme Trust and the ESRC
Persistency of pension contributions in the UK: Evidence from aggregate and micro-data
Sarah Smith
CMPO, The University of Bristol
January 2006
Abstract This paper presents evidence on the persistency of contributions to individual pensions, including an analysis of micro-data from the British Household Panel Survey. It finds variation in persistency rates by gender, earnings and household income. Changes in income and consumption needs (for example, becoming unemployed or the arrival of a new baby) increase the probability of lapse, but household income also matters, suggesting that pensions may be less affordable for those on low incomes, even in the absence of shocks. The introduction in 2001 of stakeholder pensions, with a charge cap of 1% of fund value, transfers the financial penalty associated with lapsing from consumers to providers. Arguably this will makes it less likely that pensions are sold to those for whom they are less suitable. The only risk is if providers walk away from low income groups altogether. Keywords: Pension contributions, persistency JEL Classification: J26, G23
Acknowledgements The author would like to thank former colleagues at the Financial Services Authority, Stephen Diacon and two anonymous referees for comments. Data from the British Household Panel Survey were made available from the ESRC data archive. Address for Correspondence CMPO Department of Economics University of Bristol 12 Priory Road Bristol BS8 1TN [email protected] www.bris.ac.uk/Depts/CMPO/
2
The UK, like the US, is undergoing a significant shift in private pension provision
away from employer-provided defined benefit (DB) schemes that typically guarantee
a pension linked to years’ service and final salary, towards defined contribution (DC)
schemes, where the value of the pension depends on contributions and investment
returns. The majority of these DC schemes are individual pension accounts in the
form of personal or stakeholder1 pensions. This shift from employer-provided DB
pensions to individual DC pensions, combined with the decline in the value of the
state pension relative to private pensions, means that retirement income security
increasingly depends on individuals’ willingness and ability to save.
A number of studies in the UK and the US have looked at the factors that affect
whether or not individuals take out a DC pension plan, and how much they
contribute.2 There has been much less attention paid to another important determinant
of final retirement income – the extent to which individuals persist in making
contributions over time. Yet, aggregate data on the persistency of pension
contributions published by the financial services regulator, the Financial Services
Authority (FSA), suggest that this is an important issue. According to the most
recently published figures, approximately one in eight people who bought a personal
pension stopped contributing after one year and, after four years, the figure is more
than one in three. Preliminary figures for stakeholder pensions show similar levels of
lapsing. If individuals are not switching to other pensions3 or saving in another form,
these figures indicate that many people may not be building up decent-sized funds for
their retirement.
1 Stakeholder pensions are individual pension accounts similar to personal pensions, but with a charge
cap of 1% of fund value and no minimum contribution limits. The product regulations were introduced
by the government in 2001 to encourage pension take-up among middle and low-earners. See Chung et
al (2004) for further discussion. 2 See for example Guariglia and Markose (2000) for the UK and Smith et al (2004), Munnell et al
(2001) for the US. 3 Research carried out for AXA Sun life in 1999 indicated that 15% of holders of personal pension
policies who stop contributing take a transfer value, compared to 85% who leave the policy paid-up.
Quoted in Cook and Johnson (2000). But, of course, some who don’t switch to another individual DC
pension may join an employer’s scheme.

3
There are a number of possible reasons why people might stop contributing to a
pension. One possibility is that consumers experience a change in their circumstances
that means that they can no longer afford to continue contributing (for example if they
become unemployed and their income falls, or a new baby arrives and their other
spending needs rise). Their circumstances may also change in such a way as to make
an individual DC pension no longer suitable for their financial needs, for example,
they may start working for a new employer offering a generous DB pension plan or,
with young children, feel they need to save in a more liquid asset.4
Another possibility is that the product fails to match the consumer’s expectations.
Consumer satisfaction is defined by Fournier and Glenn (1999) as the confirmation of
pre-consumption product standards. High lapse rates, particularly after one year, may
indicate a low level of customer satisfaction with the product. However, pensions,
like other financial products, may be hard for customers to judge before or after
purchase (see Office for Fair Trading, 1997) and it may be more meaningful to think
in terms of product suitability, ie whether the product meets the consumer’s financial
needs. Most pensions in the UK are sold through financial advisors who are required
by regulation to sell suitable products, but may be incentivised by commission to sell
a product that is unsuitable, ie one that does not match the consumer’s risk profile, or
that the consumer cannot afford.5 Typically low levels of financial literacy among
many consumers, who may not fully appreciate the nature or risks of a product, may
also result in unsuitable sales.
The aim of this paper is to examine evidence on persistency of pension contributions
from aggregate data (provider returns to the regulator) and micro-data (the British
Household Panel Survey) in order to shed light on these alternative explanations for
why so many people stop contributing. In particular it asks:
• What are the main trends in persistency of pension contributions over time and
across sales channel?
4 In the UK, unlike the US, there is no possibility of withdrawing money from an individual DC
pension before the minimum age of 50. 5 See Charles River Associates (2002) for evidence on unsuitable product recommendations arising
from commission bias.

4
• How does persistency vary across different groups in the population?
• What factors appear to explain why people stop contributing to individual
pensions?
The plan of the paper is as follows. The next section summarizes key findings from
related literature on determinants of take-up and contributions to individual DC
pensions, as well as from a small number of studies on persistency on life assurance
and pensions. Section 2 presents evidence on trends in persistency over time and
across sales channel using aggregate data, while section 3 analyzes the individual-
level data from the British Household Panel Survey. Section 4 offers some
conclusions.
1. Related literature
A number of studies have examined data on contributions to individual DC pensions
and looked at what determines whether or not people participate and how much they
contribute (see Smith et al, 2004, Munnell et al, 2001, Guariglia and Markose, 2000).
A common finding is that take-up and contributions rise with an individual’s age,
earnings and household income. Job tenure also matters for participation – the longer
someone is with an employer, the more likely they are to participate – and, in the UK,
Guariglia and Markose find that education has a positive effect on participation and
contributions.
More recently, there has been considerable interest in the extent to which employers –
or governments – can affect participation and contributions through scheme design
(see Choi et al, 2004, for an overview). Automatic enrolment of individuals into a
pension scheme when they join an employer, and matching contributions from the
employer have both been found to have a significant, positive effect on participation, 6
6 Most of the evidence on the effect of automatic enrolment is from “before and after” studies, which
may over-estimate the effect of the introduction of automatic enrolment since the decision to change is
often motivated by employers’ desire to raise partic ipation and may be accompanied by increased
commitment to pensions/ increased communications.
5
although the evidence on the effect of matching on contributions is mixed.7 Many of
these studies have concluded that individuals follow the “path of least resistance”
when it comes to planning their pensions and suggested that there is considerable
inertia in behaviour (eg individuals maintaining contribution levels in spite of
changing earnings and employer contribution rates).
However, Smith et al (2004) found considerable fluctuation in pension contributions
when they used data from the US Survey of Income and Program Participation to look
at the dynamics of individual contributions to employer-sponsored 401(K) plans over
(up to) a twelve year period. They found that only 27% of individuals were steady
contributors (ie made persistent contributions at a stable contribution rate). 19% of
contributors were intermittent (ie had breaks in their contributions), 24% were rising
contributors, 8% were falling contributors and 23% were fluctuating contributors.
Interestingly, the study did not find changes in contributions associated with negative
income shocks or changing consumption needs, but was looking at contributions,
conditional on participation.
Other evidence from the US suggests low persistency of contributions to individual
retirement accounts, similar to the level in the UK. Smith (2001), using a sample of
tax returns from 1987 – 1996, found a high rate of initial drop off in pension
contributions to Individual Retirement Accounts (IRAs). Of those contributing in
1987, only 45% were still contributing in 1992, although 40% continued to contribute
through 1996. Like the FSA persistency survey data, these administrative data are
highly reliable, but lack detailed information on individual characteristics to allow
further analysis of the factors that might explain a lack of persistency.
Diacon and O’Brien (2002) analysed the UK provider- level data on persistency of
contributions to pensions and other financial products and found that persistency rates
for the same provider are correlated for different product types within the same
distribution channel and for different distribution channels for the same product type.
They concluded that this showed “an inability of insurers to meet the service
7 Theory is also ambiguous on the effect of matching on contributions – those currently contributing
below the match threshold get a positive substitution effect, but a negative income effect, while those
currently contributing above the match threshold get only a negative income effect.

6
expectations of a whole range of customers”. But, the differences may also reflect
customer heterogeneity across provider and/or differential data quality.
There is interesting information on reasons for lapsing on long-term savings products,
including pensions, from a qualitative survey of 400 people who had recently lapsed
on regular premium policies (Financial Services Authority, 2000). The responses
indicated a wide range of reasons. In a quarter of cases, the reason cited for lapsing
was to do with the product (poor performance, disappointment with the sale or a
feeling that the product wasn’t right). Ten per cent of cases of lapse were thought to
be due to changes in circumstances that were genuinely unpredictable at the time of
the sale. These were cases where people cited marital or domestic reasons for lapsing
(eg having children, moving home or getting divorced). In the remainder of cases, the
reason cited for lapsing was that it was, or became, unaffordable (unemployment,
change in income, need/desire to free up money for other things). However, because
the study was based on recollection of the reasons for lapsing, there may be some ex-
post rationalisation by consumers.
A number of studies have looked at the persistency of life assurance premia.
Renshaw and Haberman (1986) analyzed data on 750,000 individual policies sold by
seven scottish life offices in 1976. Like Diacon and O’Brien, they found significant
variation across offices, although again, with limited information on individual
characteristics, this may be explained by different consumer profiles. They also find
that lapse rates decrease with duration and with the individual’s age. Kuo et al
(2003), applying cointegration analysis to aggregate life insurance data from 1951 –
88, found that lapse rates are sensitive to the unemployment rate in the short term, but
that, in the long term, it is the interest rate (which represents the opportunity cost of
continuing to pay into a life assurance product) that has an economically more
significant effect.
This paper adds to the literature in two ways. First, building on the studies that have
looked at the relationship between individual characteristics and pension take-up and
contributions, it looks at whether the same factors also affect persistency of
contributions. Unfortunately, with the data used here, it is not possible to analyse the
effect of scheme design on persistency. Secondly, complementing existing studies
that have looked at persistency in pension and life assurance contributions, which
have typically use administrative or aggregated data, it analyses persistency using data

7
from a household panel survey which contains a wide range of individual- level
information. Before looking at the evidence from the BHPS, however, the next
section summarizes the main trends in the aggregate persistency data.
2. Evidence on persistency: aggregate data
Since 1995 regulated firms have been required to submit annual returns to the
regulator – first the Personal Investment Authority and then the Financial Services
Authority (FSA) – giving information about the persistency of contributions to
different products – personal pensions (including group and individual personal
pensions), endowment assurances (including mortgage endowments), whole life
assurances and other life business. For the first time in 2002, information was
collected separately on the persistency of contributions to stakeholder pensions.8 For
each product, data are collected for different distribution channels (tied advisers and
independent financial advisers (IFAs)9 and, in some cases, direct sales). In all cases,
returns are limited to a period of four years from commencement of the policy. Table
1 summarises the aggregate persistency rates for personal pensions, by sales channel,
and, for comparison, figures for endowments and whole of life policies.10
In each case, persistency is calculated as the proportion of investors who continue to
pay regular premiums to their life and pensions policies, or who do not surrender their
single premium policy, who might be expected to do so. In other words, the
persistency figures remove all deaths, retirements and maturities. But, payment
holidays do count as non-persistency in the aggregate figures. This leads to an over-
reporting of true lapse rates, but, if the number of people taking payment holidays
remained fairly constant, should not present too much of a problem for looking at
systematic variation over time. In practice, the move towards more flexible products,
which make payment holidays easier, could tend to bias the data over time and make
8 This paper does not analyse stakeholder pensions, but the early results suggest that the persistency
rates are similar to those for personal pensions. 9 Tied advisers can only advise on or sell products from single provider (or marketing group), while
IFAs advise on and sell products from across the market. 10 The analysis focuses only on regular premium products where there is some expectation that people will
continue making regular payments.
8
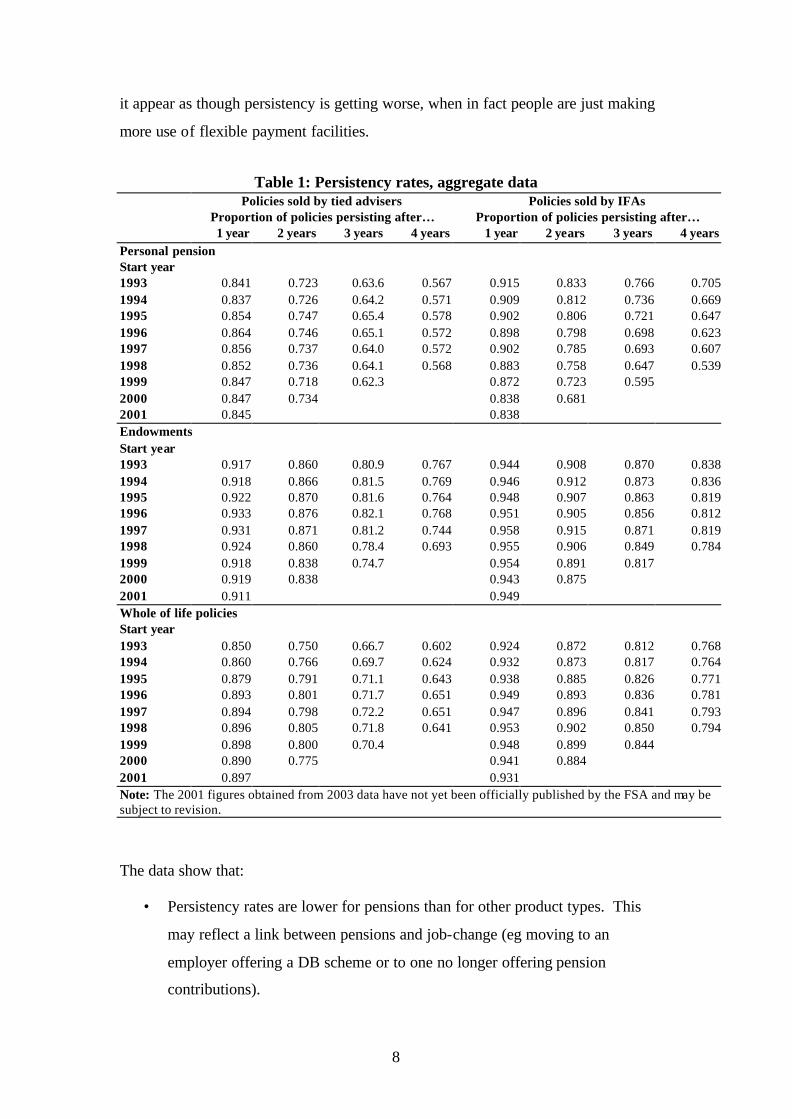
it appear as though persistency is getting worse, when in fact people are just making
more use of flexible payment facilities.
Table 1: Persistency rates, aggregate data Policies sold by tied advisers Policies sold by IFAs Proportion of policies persisting after… Proportion of policies persisting after… 1 year 2 years 3 years 4 years 1 year 2 years 3 years 4 years Personal pension Start year 1993 0.841 0.723 0.63.6 0.567 0.915 0.833 0.766 0.705 1994 0.837 0.726 0.64.2 0.571 0.909 0.812 0.736 0.669 1995 0.854 0.747 0.65.4 0.578 0.902 0.806 0.721 0.647 1996 0.864 0.746 0.65.1 0.572 0.898 0.798 0.698 0.623 1997 0.856 0.737 0.64.0 0.572 0.902 0.785 0.693 0.607 1998 0.852 0.736 0.64.1 0.568 0.883 0.758 0.647 0.539 1999 0.847 0.718 0.62.3 0.872 0.723 0.595 2000 0.847 0.734 0.838 0.681 2001 0.845 0.838 Endowments Start year 1993 0.917 0.860 0.80.9 0.767 0.944 0.908 0.870 0.838 1994 0.918 0.866 0.81.5 0.769 0.946 0.912 0.873 0.836 1995 0.922 0.870 0.81.6 0.764 0.948 0.907 0.863 0.819 1996 0.933 0.876 0.82.1 0.768 0.951 0.905 0.856 0.812 1997 0.931 0.871 0.81.2 0.744 0.958 0.915 0.871 0.819 1998 0.924 0.860 0.78.4 0.693 0.955 0.906 0.849 0.784 1999 0.918 0.838 0.74.7 0.954 0.891 0.817 2000 0.919 0.838 0.943 0.875 2001 0.911 0.949 Whole of life policies Start year 1993 0.850 0.750 0.66.7 0.602 0.924 0.872 0.812 0.768 1994 0.860 0.766 0.69.7 0.624 0.932 0.873 0.817 0.764 1995 0.879 0.791 0.71.1 0.643 0.938 0.885 0.826 0.771 1996 0.893 0.801 0.71.7 0.651 0.949 0.893 0.836 0.781 1997 0.894 0.798 0.72.2 0.651 0.947 0.896 0.841 0.793 1998 0.896 0.805 0.71.8 0.641 0.953 0.902 0.850 0.794 1999 0.898 0.800 0.70.4 0.948 0.899 0.844 2000 0.890 0.775 0.941 0.884 2001 0.897 0.931 Note: The 2001 figures obtained from 2003 data have not yet been officially published by the FSA and may be subject to revision.
The data show that:
• Persistency rates are lower for pensions than for other product types. This
may reflect a link between pensions and job-change (eg moving to an
employer offering a DB scheme or to one no longer offering pension
contributions).

9
• There was a general improvement in persistency rates for all products across
both channels in the mid/late 1990s. This trend has since been reversed.
• Persistency rates vary across distribution channels. Persistency tends to be
higher on products sold via IFAs than through the tied channel, although this
difference had been reversed by the end of the period in the case of pensions.
The fall in persistency rates for pensions sold by IFAs may reflect a growth in
sales of Group Personal Pension business.11 The generally higher level of
persistency in the IFA channel may reflect the quality of advice,12 or
something about the typically different set of consumers served by tied and
independent advisers.13 Using the BHPS data, it is possible to look at
persistency rates across different consumer groups, but unfortunately, there is
no information on use of distribution channels.
Diacon and O’Brien (2002) argue that unsuitable sales, or dissatisfied consumers, will
be more likely to terminate quickly. By contrast, lapses caused by changes in
circumstances are equally likely to occur at any duration. Significantly higher lapse
rates in the first year, compared to subsequent years, may therefore be an indicator of
poor sales/ advice. To explore this, Figure 1 below shows lapse rates for personal
pensions by channel.14 In each case, separate lines are drawn for lapse rates at
different durations. In the tied channel, lapse rates fall systematically at higher
durations – lapse rates are highest in the first year and lowest in the fourth year.15
But, this does not appear to be the case in the IFA channel. While the lapse rate in
11 A group personal pension is a cluster of individual DC plans set up by an insurance company for an
employer. Each employee has an individual pension under the administrative umbrella of the employer
and both employer and employee will normally contribute to the plan. While the pensions are fully
portable, an individual may be more likely to let a GPP lapse than a purely individual personal pension
if they, for example, lose employer contributions. 12 With a wider range to choose from, IFAs are arguably more likely to be able to recommend a
suitable product. 13 Consumers in the tied channels tend to be in lower socio-economic groups and, arguably, may be
more likely to experience the type of employment/ income shocks that cause them to lapse. 14 The lapse rate in year t is defined as (Pt-1-Pt)/Pt-1 where Pt is the persistency rate in year t. 15 Average lapse rate in year one is 15.03; average lapse rate in years two – four is 12.65. This
difference is statistically significant at the 5% level (t-ratio = 5.58).

10
year four is lower, the lapse rate in year one is not significantly higher than the lapse
rate in years two – four and the highest lapse rate is in year two.16 Following Diacon
and O’Brien’s story, this is consistent with a poorer quality of advice in the tied
channel, but without further information, it is not conclusive.17
Figure 1a: Personal pensions sold through the tied channel
05
1015
20P
erce
ntag
e
1994 1996 1998 2000 2002Year of lapse
1 year duration 2 year duration3 year duration 4 year duration
Figure 1b: Personal pensions sold by Independent Financial Advisers
05
1015
20P
erce
ntag
e
1994 1996 1998 2000 2002Year of lapse
1 year duration 2 year duration3 year duration 4 year duration
16 Average lapse rate in year one is 11.96; average lapse rate in years two – four is 11.59. This
difference is not statistically significant at the 5% level (t-ratio = 0.28). 17 Lapse rates would also tend to fall over time if “quitters” tend to lapse earlier, increasingly leaving a
pool of “stayers” who are less likely to lapse. If so, the observed differences by channel could be
explained by greater heterogeneity in the tied sector than in the IFA channel
11
3 Evidence on persistency: micro-data
This section analyses data on pension contributions from the British Household Panel
Survey (1992-2003).18 This has a reasonable sized sample of people who contribute
to individual DC pensions – over 2,500 individuals are present in the survey for at
least three consecutive waves, have no missing data, are aged 18-64 and have
contributed to a pension at least once. The BHPS also collects a wealth of
information on individuals' income, employment and household circumstances
allowing analysis of the relationship between persistency and individual
characteristics.
Because the survey is broad and not focused specifically on persis tency of pension
contributions, it does not drill down precisely into the reasons why people lapse, and
it may not be possible to find a reason for lapse in every case. But, the BHPS data
can be used to look at variation in persistency rates across different types of
consumers, and to draw inferences about the possible reasons why people lapse, based
on their circumstances, and changes in those circumstances at the time they lapse,
avoiding problems of post-hoc rationalization.
Take-up and contributions to individual DC pensions
Before looking at pension persistency, we first look at who contributes to a personal
private pension and, if they make additional contributions, at how much they
contribute. The analysis is based on a sub-sample of potential contributors who are
not offered a pension by their employer. In the UK, over half of people who have a
private pension have a DB occupational pension; those who have an individual DC
pension will typically be those not offered such a scheme19 and will, therefore, be a
selected sub-sample of all those in employment.20 As table 2 shows, compared to
everyone in employment, those who are not offered an employer’s pension have
lower average income, earnings and qualifications and is more likely to work part-
18 In practice, we drop those living in Scotland and Wales since they are over-sampled from wave 9. 19 Some people who are offered a DB scheme may choose to join an individual DC plan if, for
example, they are not likely to stay with the employer for long. See Disney and Emerson. 20 In practice, the question on employer pensions in the BHPS does not distinguish between employer
DB and DC schemes, which may include group personal pensions and omitting people who are offered
an employer’s scheme may therefore miss some people who have individual personal pensions.

12
time and for a small firm. Any modelling of the factors that affect take-up and
contributions, beyond the scope of this study, would need to take this selection into
account.
Table 2 Sample sizes and composition
Sample = everyone in employment
Sample = those not offered an
employer’s pension Employer pension 52.1% 0.0% Private personal pension 21.4% 28.0% No pension 34.5% 72.0% Mean age 38.8 37.7 Mean monthly (nominal) equivalised income £2,249.71 £1,877.37 Mean monthly (nominal) earnings £1,308.65 £913.37 Post-school educational qualifications 44.2% 33.0% No qualifications 13.1% 19.0% Female 51.1% 56.5% Children in household 38.8% 40.4% Married 75.4% 72.2% Works in the public sector 69.2% 89.2% Works part-time 20.9% 32.5% N 40,025 12,050 Note: Observations refer to separate person-year observations, so the same person may be in the
sample up to 12 times. No account is taken here of repeated observations on the same individual.
The following questions are used to identify whether or not someone has a personal
pension:
• I'd like to ask you now about private personal pensions, that is a pension that
you yourself have taken out on your own behalf. In the past year, that is since
September 1st [previous year] have you paid any contributions or premiums
for a private personal pension, or had such contributions paid on your behalf
by the Department of Social Security?21
And how much they contribute.
21 In the UK, individuals can choose to opt out of the state second pension system into an individual
DC scheme (either a personal or stakeholder pension). If so, the government pays contributions into
their scheme (contracted out rebates) intended to yield a pension of similar value to the state pension
they have opted out of.
13
• Since September 1st [previous year], over and above those contributions paid
on your behalf by the Department of Social Security, have you yourself made
any extra contributions towards your personal pension? How much did you
contribute?
The value of contributions does not, therefore, include the value of contracted out
rebates.
Table 3 summarizes information on pension take-up and contributions according to a
wide range of individual characteristics.22 As in table 2, each person-year observation
is treated as a separate observation.
• Participation generally rises with age, but peaks among people in their 40s.
Contributions rise with age in absolute terms and as a percentage of earnings.
This may reflect the limits on contributions attracting tax relief, which also
rise with age.23
• Participation rises with household income and, even more so, with individual
earnings.24 Contributions increase in absolute terms, but not as a percentage
of earnings. Education also has a positive effect on participation and
contributions in absolute terms
• Men are more likely to have a personal pension and make larger (absolute)
contributions, but women contribute more in percentage terms. The gender
difference is mirrored in differences between part-time and full-time workers.
• Those with children are less likely to have a pension than those without and
contribute less in absolute terms and as a percentage of earnings.
22 Of course, a lot of the variables are likely to be correlated. A simple probit regression of whether or
not someone has a pension confirms that the factors discussed here are independently significant. The
results are not reported, but are available on request. 23 In the UK until April 2006, tax relief at the marginal rate is given on contributions up to 17.5% of
earnings for those under 35, up to 20% for those aged 36-45, up to 25% for those aged 46-50, up to
30% for those aged 51-55, up to 35% for those aged 56-60 and up to 40% for those aged 60+. 24 In both cases, quintiles are defined within the year. The probit results confirm that the earnings
gradient (conditional on income) is steeper than the income gradient (conditional on earnings).

14
Table 3 Pension take-up and contributions
Has a personal pension
(%)
Makes voluntary
contributions (%)
Mean monthly
contribution (£)
Contribution as a % of earnings
(%) Average 28.0 69.3 72.20 5.7 Age <30 20.6 66.3 50.93 4.1 Age 30s 33.8 71.9 66.23 4.7 Age 40s 34.3 66.6 77.11 6.3 Age 50+ 25.3 72.5 99.36 8.2 Income quintile 1 13.6 60.2 42.30 6.5 Income quintile 2 23.0 69.2 44.18 5.3 Income quintile 3 27.6 70.5 66.25 5.8 Income quintile 4 33.9 70.0 65.52 5.5 Income quintile 5 42.0 71.0 104.60 5.7 Earnings quintile 1 7.0 53.8 35.78 14.5 Earnings quintile 2 13.3 63.9 42.30 8.7 Earnings quintile 3 24.9 66.3 55.10 5.4 Earnings quintile 4 39.9 70.0 56.19 5.1 Earnings quintile 5 55.1 73.4 99.88 4.7 Higher qualifications 33.5 71.0 90.36 5.6 School qualifications 26.1 69.1 61.36 5.4 No qualifications 23.4 65.6 55.57 6.3 Female 19.1 66.2 59.36 6.7 Male 39.7 71.2 79.67 5.1 No kids 30.6 69.5 77.06 6.1 Kids 24.3 66.7 63.11 4.9 Married 30.4 69.6 71.70 5.7 Divorced-widowed separated 20.7 67.2 102.04 6.1 Never married 22.3 68.7 63.90 5.4 Works in the public sector 16.2 65.7 82.96 7.9 Works in the private sector 29.5 69.5 71.53 5.5 Same job as last year 32.4 68.9 74.27 5.8 New job 20.9 70.3 67.12 5.4 Works full-time 36.1 70.5 75.37 5.2 Works part-time 11.2 61.1 47.83 9.4 No health limits 28.5 69.7 72.91 5.6 Health limits 21.7 62.1 58.24 6.6 Doesn’t save 22.4 68.1 64.31 5.3 Saves 35.2 70.6 78.53 5.9 Sample – all those in the BHPS who are not offered an employer’s pension (12,050 obs)
• As previous studies have found, those with limited job tenure are less likely to
have a pension, but there is little difference in contributions.
• People who work in the private sector are more likely to have a personal
pension, but of course more people in the public sector will be covered by an
employer’s DB scheme.

15
• Those who report that their health limits their daily activities25 are less likely
to have a pension and typically contribute less in absolute terms, but not as a
percentage of earnings.
• Those who report that they save 26 are more likely to have a pension and
typically contribute more in absolute terms and as a percentage of earnings.
Persistency of pension contributions
The sample used to analyse persistency includes individuals who are self-employed in
addition to individuals who are employed and not eligible for an employer’s pension.
Nearly 2,600 individuals are observed to make a contribution for at least one period
and in total there are nearly 3,800 spells of contributions.27 Nearly one-third of the
sample is observed to make more than one spell of contributions; in the analysis, these
are treated separately. The mean observed spell duration is three years, but of course
the sample is right-censored.
Table 4 summarises persistency rates for pension contributions by duration, using the
BHPS data. Someone is defined as stopping contributions (lapsing) if they have made
a contribution over the previous 12 months (including contracted out rebates), but do
not make a contribution over the next 12 months. Of course, some people leave the
sample before they stop contributing. These are retained in the sample since the
censored length of duration will be informative for the regression analysis below.
But, they are not treated as lapsers in calculating persistency rates. Using the BHPS
data it is possible to calculate persistency figures beyond the four-year period of the
FSA survey; the figures show that persistency continues to fall at a decreasing rate
after four years.
The persistency rates calculated using the BHPS data are low compared to the
aggregate figures presented in Table 1. Some of this is likely to reflect measurement
25 This variable is not present in wave 9, but a value can be imputed on the basis of individuals’
responses in waves 8 and 10. 26 The question on which this variable is based is the following: “Do you save any amount of your
income for example by putting something away now and then in a bank, building society, or Post
Office account other than to meet regular bills? 27 A spell is measured from when an individual starts making contributions until they stop making
contributions or exit the sample.

16
error, particularly for people with multiple spells. No attempt is made to try to gap-
fill – since the main aim is to consider differences across groups then, so long as the
measurement error is similar, the main findings will not be affected. Another possible
explanation is that single-year spells reflect one-off contributions, which cannot be
easily separated from regular premium policies.
Table 4: Persistency rates, BHPS data
Proportion of individual still contributing after …
1 year 2 yrs 3 yrs 4 yrs 5 yrs 6 yrs 7 yrs 8 yrs 9 yrs 10 yrs
All 0.606 0.464 0.381 0.316 0.274 0.241 0.216 0.195 0.175 0.158
Male 0.627 0.497 0.415 0.349 0.304 0.271 0.248 0.227 0.205 0.190
Female 0.575 0.417 0.332 0.267 0.231 0.197 0.168 0.147 0.132 0.111
Age
< 30 0.629 0.473 0.398 0.319 0.270 0.238 0.206 0.186 0.164 0.150
30s 0.585 0.459 0.369 0.311 0.273 0.245 0.228 0.204 0.185 0.162
40s 0.626 0.478 0.399 0.330 0.295 0.257 0.230 0.209 0.194 0.178
50s 0.582 0.444 0.356 0.298 0.248 0.212 0.178 0.162 0.131 0.116
Equivalised household income
Quintile 1 0.517 0.388 0.306 0.230 0.193 0.172 0.156 0.137 0.121 0.115
Quintile 2 0.593 0.448 0.372 0.309 0.276 0.253 0.227 0.204 0.188 0.160
Quintile 3 0.629 0.484 0.401 0.341 0.295 0.245 0.222 0.202 0.190 0.183
Quintile 4 0.578 0.457 0.383 0.326 0.288 0.245 0.213 0.194 0.155 0.137
Quintile 5 0.712 0.547 0.450 0.381 0.327 0.301 0.267 0.243 0.231 0.201
Usual (real) earnings
< £10K 0.518 0.380 0.303 0.220 0.181 0.154 0.135 0.112 0.096 0.088
£10–20K 0.617 0.466 0.368 0.297 0.259 0.221 0.188 0.172 0.151 0.138
£20–30K 0.562 0.427 0.352 0.303 0.251 0.216 0.204 0.176 0.167 0.150
> £30K 0.620 0.469 0.390 0.320 0.288 0.273 0.245 0.227 0.196 0.164
Note: Age is age when the pension was started. Income and earnings are both averaged over the spell.
Sample = 2,687 completed contribution spells
The micro-data allow calculation of persistency rates for different sub-groups of the
population. Here, persistency rates are shown separately for men and women, and by
age, income and earnings.

17
• Women have lower persistency rates than men. After one year, the
persistency rate for women is five percentage points lower than it is for men
and this difference increases at higher durations. It is well-known that women
are less likely to have a personal pension than men and this evidence suggests
that part of the explanation might lie in higher lapse rates.
• There appears to be little systematic difference in persistency according to the
age someone is when they start contributing to a pension. Those aged 50+
when they start contributing have the lowest persistency rate.
• Persistency varies by household income and earnings. Individuals in the
lowest (highest) income quartile and earnings band have the lowest (highest)
persistency rates. One possibility is that those with low earnings/income are
more likely to experience the kind of negative income shocks that would make
them likely to stop contributing (the BHPS shows a negative correlation
between earnings and the probability of becoming unemployed); another
possibility is that pensions are unaffordable – and therefore unsuitable – for
for those with low income/ earnings. These alternative explanations are
explored further in the regression analysis below.
Possible reasons for lapsing
Using the BHPS data, some of the possible reasons for lapsing can be inferred from
looking at what the individual’s family and economic circumstances were at the time
they stopped making contributions, and whether their circumstances had changed
from the previous year.
Table 5 considers a number of possible factors that might be considered relevant for
lapsing, such as changing job, having a baby etc.28 In each case, the proportion of
lapsers29 who experience the event is compared with the proportion of persisters.30
28 Matching the timing of the event to the timing of the lapse is not entirely straightforward. A lapse is
defined as making a contribution between t-1 and t, but not between t and t+1, where t is the date of
interview. In some cases the individual’s circumstances are assessed at t, in other cases, we are
considering things that happen between t and t+1. 29 Defined as the final observation in a completed spell 30 Defined as all other observations during a spell

18
For example, the first row of the table shows that 5.2% of individuals changed job to
an employer with a pension at the same time as they stopped contributing to their
pension. Among individuals continuing to contribute to their pension, the figure is
3.5%. This difference is significant, suggesting that job change is likely to be a
significant factor in understanding lapse.
Table 5: Life events and lapsing
% of lapsers % of persisters
Move to a new job that offers an employer pension 5.2** 3.5
Move to a new job 10.2* 9.1
Financial circumstances are worse than 12 months ago 29.0** 23.7
Worse health 3.9** 2.7
Out of work 9.4** 3.7
Retired 1.6** 0.4
Have a baby 4.7** 3.0
Change marital status 5.3** 3.1
Move house 9.7** 7.8
Notes
** indicates that difference is significant at the 5% level, * at the 10% level.
Move to a new job, Change marital status and Move house refer to change in status between period t
and t+1; Worse health refers to change in health between period t-1 and t; Have a baby is defined as
having a youngest child aged 0 at t+1; Financial circumstances, Out of work and Retire refer to status at
time t. Financial circumstances are self-assessed.
Sample = 11,276 person-year observations
The results presented in Table 5 suggest that there is a link between pension
contributions and changes in an individual’s income and/or consumption needs,
measured by financial circumstances, health, unemployment or retirement, having a
baby, moving house and changing jobs. In each of these cases, the proportion of
lapsers who experiences this event is higher than the proportion of persisters.
Regression analysis
Of course, a number of these events may be correlated (such as moving house and
having a baby and becoming out of work and experiencing worsening financial
circumstances). In order to investigate their separate effect on lapsing, as well as the

19
effect of other individual characteristics, the following proportional hazards model is
estimated:
( ) ( ){ } ( ) ( )mmm xxxthxxxth βββ +++= ...exp...,, 2211021
The hazard rate at time t (h(t)) is the probability that someone will lapse at time t,
conditional on surviving until t-1. This is modelled as a function of the baseline
hazard (h0(t)), the hazard when all independent variable values are equal to zero, and
the m covariates (x1, x2 … xm). The main advantages of this approach over, say, an
OLS regression, is that allows censored observations to be incorporated into the
analysis and it does not rely on any assumptions concerning the nature or shape of the
underlying survival distribution.
Table 6 presents the estimated hazard ratios. These measure the relative probability
of lapse for each covariate, compared to the base case. A hazard rate greater than 1
implies that the covariate increases the probability of lapse (compared to the base); a
hazard rate less than one implies that the covariate reduces the probability of lapse.
• Those aged 50+ are significantly more likely to lapse than younger ages.
• Household income has a strong negative effect on the probability of lapse.
Individuals in the bottom income quintile are significantly more likely to lapse
than other individuals. When income is included, earnings do not enter
significantly, implying that income matters more for persistency. This is the
opposite of the case for pension take-up. Once income is controlled for, the
fact that someone reports current financial problems is not significant, but a
worsening of financial circumstances compared to the previous 12 months
does have a positive and significant effect on the probability of lapse.
• Unemployment and retirement both have a significant, positive effect on the
probability of lapse. Interestingly, the self-employed are significantly less
likely to lapse than those who are in employment. This may be because their
individual DC pension is a more important part of their overall retirement
saving.
• Women are more likely to lapse than men, but this is significant only at the
10% significance level. The presence of children in the household does not

20
have a significant effect, but the probability of lapse increase with the arrival
of a new baby.
Table 6: Estimated hazard ratios
Hazard ratio Age 30s 1.0251 Age 40s 1.0222 Age 50s 1.1524** Income quintile 2 0.8409** Income quintile 3 0.8245** Income quintile 4 0.8205** Income quintile 5 0.7672** Earnings £10-20K 0.9201 Earnings £20-30K 0.9824 Earnings >£30K 0.9626 Earnings missing 0.9182 Financial problems 1.0404 Financial circumstances worsened 1.1350** Out of work 1.3829** Retired 1.7178** Self-employed 0.5523** Female 1.0813* Children in the household 1.0359 New baby 1.2397** New job 0.8221** New job with a pension 1.3797** Moving house 1.0631 Health worse 1.1955* Change in marital status 1.3270** Saver 0.9198** Notes
** indicates significant at the 5% level, * indicates significant at the 10% level
Base is male, aged <30, in the bottom income quintile, earning <£10K a year, in
employment, with no financial problems and no children.
The regression also includes a set of year dummies
Sample = 11,276 person-year observations
• Changing to a new job per se does not increase the probability of lapse – it
actually significantly reduces it. But changing to a new job that offers an
employer’s pension is associated with a significant increase in the probability
of lapse.
• There is no significant effect of moving house, once other covariates are
conditioned on. Worsening health is associated with an increase in the
21
probability of lapse, but this is only significant at the 10% level. A change in
marital status has a positive and significant effect.
• The variable “saver” enters negatively and significantly, suggesting that there
is important variation in people’s propensity to save which makes them more
or less likely to continue paying into a pension, as well as taking out a
pension.
4 Conclusions and implications
While many studies have previous looked at the effect of individual characteristics on
take-up and contributions to individual DC pensions, this is the first to look at
persistency of contributions. Analysis of data from the British Household Panel
Survey has found significant variation in persistency rates – between men and women
and by individual earnings and household income. This suggests that the dynamics of
contributions need to be analysed alongside take-up and contribution rates in order to
get a complete picture of individuals’ saving for retirement.
The evidence suggests a wide range of reasons why individuals stop contributing.
Changes in individuals’ circumstances – unemployment, worsening health and
financial position, arrival of a new baby and a change in marital status – are all
associated with stopping contributions. Also, moving to a new employer who offers a
pension.
But these factors are present in less than half of all cases of lapse. Also important is
an individual’s underlying propensity to save (measured by whether or not they save
regularly in another form), and an individual’s household income. Low levels of
persistency among those on low incomes do not just reflect a higher probability of
negative shocks, but may indicate that pensions are less likely to be affordable for this
group. The evidence from the aggregate data is consistent with a higher level of
unsuitable sales in the tied channel, which typically serves low-income consumers.
Before the introduction of stakeholder pensions in 2001, there were often quite severe
financial penalties for consumers who lapsed, because of high upfront charges on
pension. In part, these charges were intended to cover the cost of acquisition,

22
estimated to be around 50% of the total costs associated with a pension. 31 With the
imposition of a charge cap of 1% of fund value, the introduction of stakeholder
pensions transferred the burden of these costs consumers to providers.32 Arguably,
this gives providers more of an incentive to encourage persistency and less incentive
to sell to consumers for whom pensions are unaffordable. Since the providers now
face the penalty, the benefit may be fewer unsuitable sales, the only risk is if
providers walk away from low and middle- income groups altogether.
References
Charles River Associates (2002) Polarisation: Research into the effect of commission
based remuneration on advice, Financial Services Authority Research Report
http://www.fsa.gov.uk/pubs/other/pol_res1.pdf
Choi, J., Laibson, D. and Madrian, B. (2004) “Plan design and 401(K) savings
outcomes”, National Tax Journal LV11(2)
Diacon, S. and O'Brien, C., (2002) Persistency in UK Long-Term Insurance:
Customer Satisfaction and Service Quality, Centre for Risk and Insurance
Studies Discussion Paper, 2002.III
Chung, W., Disney, R., Emerson, C. and Wakefield, M. (2004) Public policy and
saving for retirement: Evidence from the introduction of stakeholder pensions
in the UK, University of Nottingham Centre for Policy Evaluation working
paper 4/04
http://www.nottingham.ac.uk/economics/cpe/publications/RD_stakeholderpen
sions.pdf
Cook, M. and Johnson, P. (2000) Saving for retirement; How taxes and charges affect
choice, Financial Services Authority Occasional Paper no. 8
http://www.fsa.gov.uk/pubs/occpapers/Op08.pdf
Disney, R. and Emerson, C. (2002) Choice of pension scheme and job mobility in the
UK, IFS working paper W09/09 http://www.ifs.org.uk/wps/wp0209.pdf
31 See Fletcher and Orszag (2002) 32 And, ulimately, to shareholders and, possibly, other consumers with non charge-capped products.

23
Kou, W., Tsai, C. and Chen, W. (2003) “An empirical study on the lapse rate: The
cointegration approach”, The Journal of Risk and Insurance 70(3)
Financial Services Authority (2000) Persisting - why consumers stop paying into
policies, Consumer Research Report 6 http://www.fsa.gov.uk/pubs/consumer-
research/crpr06.pdf
Fletcher, F. and Orszag, M. (2002) “Distribution and private pensions: Lessons from
the UK experience” in Regulating Private Pensions Schemes: Trends and
Challenges, OECD Private Pensions Series, 4
Fournier, S. and Glen, D. (199) “Rediscovering satisfaction”, Journal of Marketing
63(4)
Guariglia, A. and Markose, S. (2000) Voluntary contributions to personal pension
plans: Evidence from the British Household Panel Survey, Fiscal Studies 21
(4)
Munnell, A., Sunden, A. and Taylot, C. (2001) “What determines 401(K)
participation and contributions” Social Security Bulletin 64(3)
Office of Fair Trading (1997) Consumer detriment under conditions of imperfect
information
Renshaw, A. and Haberman, S. (1986) “Statistical analysis of life assurance lapses”,
Journal of the Institute of Actuaries 112
Smith, P. (2001) A longer term perspective on IRA participation: Evidence from a
penal of tax returns, US Office of Tax Analysis, Department of Treasury
Smith, K., Johnson, R. and Muler, L. (2004) “Deferring income in employer-
sponsored retirement plans – the dynamics of participant contributions”,
National Tax Journal LV11(3)