Embed Size (px)
Citation preview

University of Arkansas, Fayetteville University of Arkansas, Fayetteville
ScholarWorks@UARK ScholarWorks@UARK
Horticulture Undergraduate Honors Theses Horticulture
5-2020
The Biofiltration Ability of Asparagus densiflorus to Remove Sulfur The Biofiltration Ability of Asparagus densiflorus to Remove Sulfur
Dioxide from the Indoor Atmosphere Dioxide from the Indoor Atmosphere
Rhiannon de la Rosa
Follow this and additional works at: https://scholarworks.uark.edu/hortuht
Part of the Horticulture Commons, and the Other Plant Sciences Commons
Citation Citation de la Rosa, R. (2020). The Biofiltration Ability of Asparagus densiflorus to Remove Sulfur Dioxide from the Indoor Atmosphere. Horticulture Undergraduate Honors Theses Retrieved from https://scholarworks.uark.edu/hortuht/7
This Thesis is brought to you for free and open access by the Horticulture at ScholarWorks@UARK. It has been accepted for inclusion in Horticulture Undergraduate Honors Theses by an authorized administrator of ScholarWorks@UARK. For more information, please contact [email protected].

1
The Biofiltration Ability of Asparagus densiflorus to Remove Sulfur Dioxide from the Indoor
Atmosphere
An Honors Thesis submitted in partial fulfillment of the requirements of Honors Studies in
Horticulture, Landscape, and Turf Sciences
by
Rhiannon de la Rosa
Spring 2020 Horticulture
Dale Bumpers College of Agricultural, Food and Life Sciences University of Arkansas

BIOFILTRATION OF SO2 USING A. DENSIFLORUS 2
Acknowledgements
I would like to thank the University of Arkansas Dale Bumpers College of Agricultural,
Food & Life Sciences, the University of Arkansas Honors College, the University of Arkansas
Division of Agriculture, and the Arkansas SURF Program for their generous funding.
Thank you also to Dr. Savin’s Lab Group, Dr. Garry McDonald, and Dr. Lisa Wood for
their invaluable guidance.

BIOFILTRATION OF SO2 USING A. DENSIFLORUS 3
Table of Contents
Abstract ........................................................................................................................................... 4 Introduction .................................................................................................................................... 5
Literature Review ........................................................................................................................... 6 Indoor Air Pollution ............................................................................................................................... 6 Sulfur Dioxide ......................................................................................................................................... 6 Botanical Biofiltration ............................................................................................................................ 7 Sulfur as a Plant Nutrient ...................................................................................................................... 8 Asparagus densiflorus ............................................................................................................................. 9
Objectives & Hypothesis ................................................................................................................ 9 Objectives ................................................................................................................................................. 9 Hypothesis .............................................................................................................................................. 10
Experimental Approach ............................................................................................................... 10 Materials & Methods ................................................................................................................... 11
Materials ................................................................................................................................................ 11 Methods .................................................................................................................................................. 12 Data Analysis ......................................................................................................................................... 13
Results .......................................................................................................................................... 14 Discussion .................................................................................................................................... 15
Conclusion .................................................................................................................................... 17 Further Research ......................................................................................................................... 18
References .................................................................................................................................... 19 Figures .......................................................................................................................................... 21
Tables ............................................................................................................................................ 28
BIOFILTRATION OF SO2 USING A. DENSIFLORUS 4
Abstract
Sulfur dioxide is an inorganic compound (IC) and air pollutant that causes health risks in
humans at concentrations as small as 6 ppm. The buildup of sulfur dioxide in enclosed indoor
spaces is therefore a concern to human health, especially since the average person spends 90% of
his/her time indoors. This study focused on decreasing a sulfur dioxide concentration in a cost-
effective and simple way—by using botanical biofiltration, or the uptake of pollutants by plants.
Research in biofiltration has focused mostly on the remediation of volatile organic compounds
(VOCs) and which plant species are most proficient at VOC uptake. However, research has also
shown that species that remediate VOCs efficiently also have the potential for superior IC
remediation. Asparagus densiflorus, which has a large capacity for VOC uptake, has been
researched very little concerning ICs, and has not yet been tested for the uptake of sulfur dioxide.
Therefore, this study sought to fill that research gap by testing the remediation of Asparagus
densiflorus of sulfur dioxide in an airtight container. This was accomplished by measuring the
amount of sulfur dioxide removed during 3 hours in an airtight container in the presence of an
Asparagus densiflorus plant divided by the amount of sulfur dioxide in the absence of the plant.
This result was considered the fraction of sulfur dioxide remediated by the plant. The final
results in this experiment, although showing significant fraction of sulfur dioxide removal, were
too variable to be conclusive about the amount of sulfur dioxide removed from an enclosed
atmosphere and therefore of the biofiltration ability of A. densiflorus. Nonetheless, further
research using a different research design is recommended to investigate whether A. densiflorus
is more efficient than other plants at removing sulfur dioxide from the atmosphere and therefore
could be used in larger-scale biofilters that must utilize space effectively.

BIOFILTRATION OF SO2 USING A. DENSIFLORUS 5
Introduction
According to surveys conducted in 1989 and 2001, the average American spends about
90% (or 22 hours a day) of his or her time indoors (U.S. Environmental Protection Agency,
1989; Klepeis et al., 2001). For urban residents, from 58 to 78% of their time is in a building
with air that is considered contaminated to some extent (Compton, 2011). Therefore, indoor air
quality should be a priority concern for all individuals who spend this much time within
buildings and sealed structures.
Two main chemical categories contribute to indoor air pollution: volatile organic
compounds (VOCs) such as benzene and toluene, as well as inorganic compounds (ICs)
including sulfur dioxide (SO2). Both contribute to many health risks and are regulated in order to
protect individuals. If a limit of one of these compounds were to be exceeded, the options for
remediation can be very expensive: repairing ventilation systems, replacing faulty appliances, or
even remodeling structures. A more cost-effective way to reduce pollutants is botanical
biofiltration—the removal of contaminants from the environment using green plants (Soreanu et
al., 2013).
Previous research has focused mostly on VOCs, though it is evident in the literature that
plants efficient in the uptake of VOCs may also be efficient in the uptake of ICs (Esguerra et al.,
1982; Wolverton et al., 1985; Yang et al., 2009). One plant that has been categorized as superior
in VOC remediation is Asparagus densiflorus (Yang et al., 2009). However, it has not been used
widely in IC remediation studies, and has not been investigated for the uptake of SO2. Therefore,
this study was established to determine A. densiflorus’ capacity for SO2 remediation.

BIOFILTRATION OF SO2 USING A. DENSIFLORUS 6
Literature Review
Indoor Air Pollution
The most common source of indoor air pollution results from the combustion of fossil
fuels by improperly vented gas appliances, worsened by buildings, which are sealed in order to
conserve energy (Wolverton et al., 1985). These pollutants include carbon monoxide, sulfur
oxides, nitrogen oxides, and various VOCs, especially hydrocarbons (Solá, 1998) and are present
both indoors and outdoors. Indoor air pollution can be considered of greater immediate concern
to human health as pollutant concentration indoors can be 2-4 times greater than that outdoors
(Jafari et al., 2015).
Sulfur Dioxide
The IC sulfur dioxide is a gas with a density more than twice that of air and a molecular
mass of 64 g/mol. Sulfur dioxide originates primarily from the combustion of fossil fuels, and
becomes a problem in the indoor environment when household appliances such as gas heaters
and stoves are not functioning properly (Solá, 1998). Another source of SO2 is pollution from
out-of-doors entering the building either by passive (openings in the structure) or active means
(ventilation systems with improper filtration) (Solá, 1998).
Sulfur dioxide is a pollutant of priority concern for air quality, along with carbon
monoxide, lead, nitrogen dioxide, ozone, and particle pollution, as outlined in the Clean Air Act
(U.S. Environmental Protection Agency, 1990). In the outdoor atmosphere, the Clean Air Act
sets a maximum limit of 75 ppb (parts per billion) of SO2 (U.S. Environmental Protection
Agency, 1990).
BIOFILTRATION OF SO2 USING A. DENSIFLORUS 7
Indoors, concentrations of SO2 as small as 6 parts per million (ppm) can be irritating to
the nose and throat, with larger concentrations progressing from eye irritation to irritation of
moist skin at 12 ppm (Compton, 2011). Prolonged exposure can be harmful to the respiratory
tract, with possible lung damage, chronic bronchitis, as well as worsening preexisting heart
disease (Compton, 2011).
Due to these health risks, the Occupational Safety and Health Administration (2017) has
set workplace environment limits at 5 ppm SO2. While it is common to use electric SO2 meters
that directly measure ambient concentrations in parts per million, another method for analyzing
SO2 levels was proposed by Hochheiser (1964) using an absorbent solution and titration to find
the amount of SO2 captured. This method relies on the reaction of SO2 and hydrogen peroxide to
form sulfuric acid, which is then neutralized by the titrant sodium hydroxide solution
(Hochheiser, 1964).
Botanical Biofiltration
Botanical biofiltration, as defined by Soreanu et al. (2013), is a hybrid term incorporating
both phytoremediation, the remediation of contaminants by green plants, and biofiltration, the
remediation of contaminants by biological activity. Pollutant uptake in botanical biofiltration has
been predicted to occur by any combination of the following mechanisms: rhizosphere
degradation via soil microorganisms, phytoextraction (plant-liquid extraction), stomatal uptake
(plant-gas extraction), phytodegradation via the enzymes within plant tissue, and/or
phytovolatilization by means of evaporation from leaves or plant transpiration (Soreanu et al.,
2013). The activity in the rhizosphere is the main mechanism of pollutant remediation.

BIOFILTRATION OF SO2 USING A. DENSIFLORUS 8
Regardless of mechanism(s) involved, optimization of large biofilter systems calls for the
identification of the most efficiently remediating plants.
The mechanism of pollutant uptake by plants in phytoextraction, stomatal uptake, and
phytodegradation is via concentration gradient, in which the concentration of pollutant is greater
in the air than it is in plant cells; however, the flow of the pollutant into plant cells is limited by
the resistances of the stomata and mesophyll (Esguerra, et al. 1982). Due to the differences in
structure of both pollutant and plant, Hörmann et al. (2018) suggested that remediation
capabilities are both plant species and contaminant dependent. Not only does botanical
biofiltration offer a cost-effective method of remediating indoor air pollution, but the presence of
green plants can be a décor and morale boost to the inhabitants of the building.
Sulfur as a Plant Nutrient
Sulfur is an element required for plants to grow, considered a secondary macronutrient
after nitrogen, phosphorus, and potassium (Acquaah, 2009). Plants use sulfur from the
environment in the synthesis of amino acids cysteine and methionine and in protein synthesis
(Ernst, 1998). Furrer (1967) found that not only do plants obtain their sulfur requirements from
the soil, but also from atmospheric sulfur in the form of SO2. In this, phytoremediation of indoor
SO2 pollution may not only benefit inhabitants’ health but may alleviate sulfur deficiency in
plants.
It is important to remember, however, that the plant may be exposed to a level of SO2 that
could become excessive and hurt the plant. Injury may appear up to four days after exposure
(Esguerra et al., 1982) and includes leaf rolling, drooping, appearance of dark brown or ashen

BIOFILTRATION OF SO2 USING A. DENSIFLORUS 9
spots (Chung et al., 2011). The occurrence and severity of the reaction are dependent on species
resistance to SO2, exposure time, and exposure concentration (Soreanu et al., 2013).
Asparagus densiflorus
Asparagus densiflorus is a common house plant known as an “Asparagus Fern”. It has
vibrant green, needle-like foliage and mounded growing habit. Furthermore, A. densiflorus takes
up the VOCs benzene, toluene, octane, trichloroethylene, and α-pinene designated at a superior
rating of total uptake of all pollutants by square meter of leaf surface (Yang et al., 2009). Yang et
al. (2009) reported VOC uptake rates by A. densiflorus of 2.65, 7.44, 3.76, 6.69, and 11.40 μg
pollutant • m-3 (container volume) • m-2 (leaf area) per hour, respectively, for each of the
previously listed compounds. Hörmann et al. (2018) investigated A. densiflorus’ capacity to take
up the VOCs 2-ethylhexanol and toluene under light and dark conditions and did not detect a
significant difference in remediation between light and dark treatments. In light, A. densiflorus
had an hourly uptake rate of 2 L 2-ethylhexanol • m-2 leaf area and 4 L toluene • m-2 leaf area
(Hörmann et al., 2018). In the dark, A. densiflorus had an hourly uptake of 1.7 L 2-ethylhexanol •
m-2 leaf area and 3.4 L toluene • m-2 leaf area (Hörmann et al., 2018).
Objectives & Hypothesis
Objectives
The goal of this research was to determine the amount of SO2 A. densiflorus could
absorb. The objective of this study was to determine the amount of SO2 a single A. densiflorus
plant could absorb from a closed system in three hours.

BIOFILTRATION OF SO2 USING A. DENSIFLORUS 10
Hypothesis
The null hypothesis was that SO2 measured in a defined empty volume (i.e. in the
absence of A. densiflorus) after 3 hours of exposure to a source of 10 ppm SO2 would be the
same as the SO2 measured in the presence of an A. densiflorus plant in the same defined volume
after 3 hours of exposure to the same source of 10 ppm SO2.
Experimental Approach
This experiment was modeled after Hochheiser’s (1964) gas sampling train, with
modifications to incorporate a 0.3 x 0.3 x 0.3 meter, 28 liter airtight box that contained the A.
densiflorus plant and a fan to ensure uniform mixing of the air (Figure 1). In addition, a safety
trap was added in line to ensure that all SO2 was captured. The SO2 at an original concentration
of 10 ppm from a tank was pulled through the box and into an impinger filled with 0.3 N
hydrogen peroxide absorbing solution. The impinger (Figure 2) bubbled the incoming air
through 75 mL of the 0.3 N hydrogen peroxide solution, which captured all SO2 before the
cleaned air breaking the surface of the 0.3 N hydrogen peroxide solution. This absorption is
based on the chemical reaction of sulfur dioxide and hydrogen peroxide to form sulfuric acid. Air
with any remaining SO2 was pulled from the impinger through the side port into a safety trap
filled with approximately 200 mL of 0.3 N hydrogen peroxide, which acted much like a large
impinger, in order to ensure there was no remaining SO2 in the air before it was pulled through
the vacuum pump and released into the hood and subsequently the atmosphere.
The modified gas sampling train was assembled and smoke tested for airtightness before
beginning the experiments testing four treatments: 1) ambient air with no plant present, 2)
BIOFILTRATION OF SO2 USING A. DENSIFLORUS 11
ambient air with a plant, 3) SO2 with no plant exposed to a source of 10 ppm SO2 in a defined
volume for three hours, and 4) SO2 with the plant present exposed to a source of 10 ppm SO2 in a
defined volume for three hours.
Materials & Methods
Materials
The source of SO2 (10 ppm SO2, balance air) was obtained from AirGas USA, LLC
(Durham, NC) and the tank was secured to a lab bench with a chain and had a safety duct system
placed above it in case of leaks. The airtight box was constructed with five 0.3 x 0.3 meter
acrylic sheets of half centimeter thickness and silicone caulk. Hinges and latches were glued onto
the outside, and a rubber gasket was fastened to the top edge. A sixth acrylic sheet was then
glued to the hinges to form a lid that sealed with the gasket when the box was closed. The box
was then tested for airtightness by burning incense in the latched box. If any scent or smoke
escaped, the leak was sealed. To protect from the outflow of SO2 in the case of any damage to
the box, it was placed in a sealed glove bag during the experiment (Figure 3). These components
were attached to the flow control, impinger, safety trap, and vacuum pump with Tygon tubing
and plastic connectors.
The absorbing solution was 3% hydrogen peroxide solution while the sodium hydroxide
titrant was 0.002 N sodium hydroxide. The mixed indicator was comprised of bromocresol green
and methyl red in methanol. A standard 50 mL burette was used for the titration.
Four A. densiflorus plants (Lowe’s, Fayetteville, AR) were purchased and kept in the
Horticulture Department greenhouse to acclimate for four months before being divided into 12
plants in total in potting soil. After dividing, plants were maintained in the Horticulture

BIOFILTRATION OF SO2 USING A. DENSIFLORUS 12
Department greenhouse with regular watering for four additional months to regulate
physiological processes before the experiment (Figure 4).
Methods
First, the airtight box was latched with the fan, and plant if applicable, inside. The bag
was sealed around the box, and the connections were checked to ensure attachment to the rest of
the sampling train. The impinger was filled with 75 mL of the 0.3 N hydrogen peroxide solution
and connected via Tygon tubing to a valve, which controlled outflow from the airtight box. The
safety trap was filled with approximately 200 mL of the 0.3 N hydrogen peroxide solution. Once
all components were confirmed in the sampling train, the SO2 tank (if applicable) was set to have
an output of 5 psi while the vacuum was set at a suction of 10 inches Hg. The treatment was run
for 3 hours. The SO2 tank was then detached, the vacuum was shut off, and the 75 mL of 0.3 N
hydrogen peroxide solution in the impinger was collected and transferred to a beaker. The 0.3 N
hydrogen peroxide solution in the safety trap was checked regularly for the presence of SO2 from
possible overflow and none was ever detected.
To determine the amount of SO2 collected during each run, 4 drops of the mixed indicator
were added to the 0.3 hydrogen peroxide solution from the impinger (or safety trap) that was
stirred continuously with a magnetic stir bar. The sodium hydroxide titrant was added dropwise
via the burette until the titer turned green. Amount of SO2 (mg) was found by multiplying the
total sodium hydroxide titrant used by 64.07, as calculated based on the equation below.
𝑥𝐿𝑁𝑎𝑂𝐻1 𝑥
0.002𝑚𝑜𝑙𝑁𝑎𝑂𝐻1𝐿 𝑥
1𝑚𝑜𝑙𝐻!𝑆𝑂"2𝑚𝑜𝑙𝑁𝑎𝑂𝐻 𝑥
1𝑚𝑜𝑙𝑆𝑂!1𝑚𝑜𝑙𝐻!𝑆𝑂"
𝑥64.07𝑔𝑆𝑂!1𝑚𝑜𝑙𝑆𝑂!
𝑥1,000mg𝑆𝑂!
1𝑔𝑆𝑂!

BIOFILTRATION OF SO2 USING A. DENSIFLORUS 13
Data Analysis
Treatments 1 (ambient air with no plant present) and 2 (ambient air with a plant) were
replicated four times. Treatment 3 (SO2 with no plant exposed to a source of 10 ppm SO2 in a
defined volume for three hours) was replicated six times. To evaluate replicability in treatment 3,
treatment 3b consisted of six additional replicates (another 6 replications). Treatment 4 (SO2 with
the plant present exposed to a source of 10 ppm SO2 in a defined volume for three hours) was
replicated six times.
The first two treatments measured SO2 content in ambient air. Any measured amount of
SO2 in treatment 1 would need to be subtracted from treatment 3, and any measured amount of
SO2 in treatment 2 would need to be subtracted from treatment 4.
The descriptive statistics, including the mean, median, first and third quartiles, minimum,
maximum were calculated for the SO2-no plant (treatment 3) and SO2-plant treatment (treatment
4) and are displayed in a box plot. Percent relative difference was calculated for a pair of SO2-no
plant runs. Standard deviation and relative standard deviation were calculated for the SO2-no
plant (treatment 3 and 3b) and SO2-plant treatments (treatment 4).
The SO2-no plant (treatment 3b) and SO2-plant treatments (treatment 4) were run in pairs
(n = 5) and used to determine SO2 uptake for the purposes of the study. To find percentage
uptake (or fraction removed), each pair of treatments (SO2-plant and SO2-no plant) was
analyzed. The SO2-plant (SO2P) value was subtracted from the SO2-no plant (SO2N) value. The
difference was divided by the SO2-no plant value and multiplied by 100, shown in the equation
below.
Percentageuptake=SO2N-SO2P
SO2Nx100

BIOFILTRATION OF SO2 USING A. DENSIFLORUS 14
The distribution of the total of 12 replications of SO2-no plant (treatment 3 and 3b) is
displayed in a histogram. After a log transformation in order to normalize the distribution of
samples, a paired t-test was run to evaluate significance of SO2 removal.
Results
The SO2 content of treatment 1 and 2 was expected to be 0 mg. For four replications of
treatment 1 (ambient air, no plant) and treatment 2 (ambient air, plant), all runs had 0 mg SO2.
Repeated sampling is generally expected to follow a normal distribution and statistical analyses
are often based on that normal distribution and those tests are parametric tests. A histogram was
created of the 12 samples of SO2 in the absence of the plant to determine if samples followed a
normal distribution. Sample distribution is shown in Figure 5, displaying a non-normal, right
skewed distribution.
Regardless, of sample distribution, results demonstrate that amounts of SO2 are variable
(Figure 6). The mean of the first six replications of SO2 in the absence of the plant (i.e. treatment
3) is less the mean of the second six replications within the same treatment (i.e. treatment 3b).
The median is a robust measure of central tendency; however, the median is also much larger
(2.6 times larger) in the second six replicates (i.e. treatment 3b) compared to the first six of the
same treatment (i.e. treatment 3). The range of values is more than 4 times greater in the second
six replicates compared to the first six. Even in the presence of plants, treatment 4, the range of
values is 1.8 times greater than in the absence of plants. To analyze the data despite variability
among the means, coefficient of variation (CV) or relative standard deviation was used (Table
1). The CVs varied between the first six and second six replicates in the SO2 treatment in the
absence of a plant, treatments 3 and 3b, respectively, and compared to the presence of a plant, or
BIOFILTRATION OF SO2 USING A. DENSIFLORUS 15
in treatment 4. However, a repeated run of SO2 in the absence of the plant yielded a percent
relative difference between duplicates of 17.3 % (data not shown), which is within generally
accepted values of less than 20%. Due to these facts, the first six replicates (treatment 3) were
disregarded and the second six (treatment 3b) were paired with each replicate of treatment 4. The
fifth replicate was discarded due to a failure in data collection and a total of five paired
replications were used to analyze percent removal.
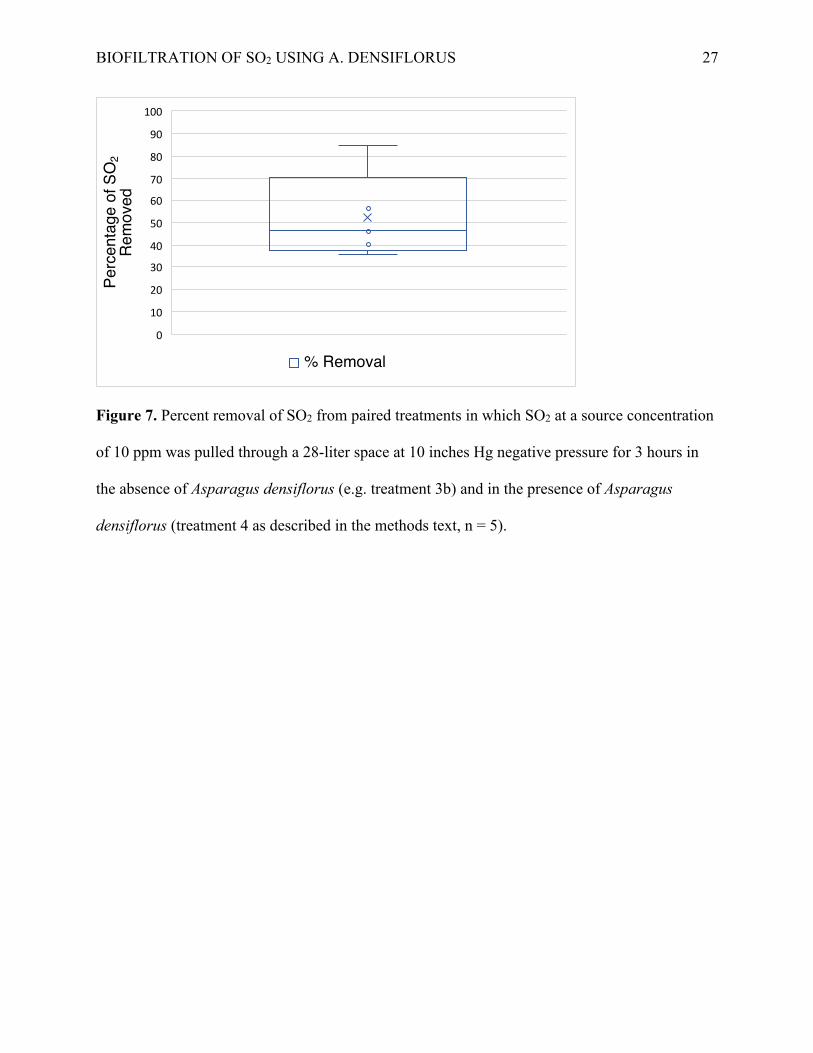
Percent of SO2 removal from the atmosphere ranged from 35 to 84%, with a mean
removal rate of 53% and median of 46% (Figure 7). A paired t-test indicated significant percent
removal of SO2 from the enclosed atmosphere under these defined conditions for 3 hours (P =
0.011).
Discussion
While there was a significant difference in SO2 removal with the presence of the plant,
the data are too widely variable to make a definitive statement about the removal capacity of
Asparagus densiflorus. The original treatment 3 with six replicates was varied, and so an
additional 6 replicates were tested (treatment 3b). However, instead of shrinking the variability
as was expected, the additional 6 replicates increased variability. Thus, while the pairs of
treatment 3b and treatment 4 each indicated a certain percentage of removal, up to 84%, the
inherent variability of the data creates an issue in claiming to what extent the plant may
remediate SO2.
The gas regulator itself provided a possible source of error, as the output was not
consistent across treatments involving SO2. To circumnavigate this potential source of error,
SO2-no plant and SO2-plant runs were conducted consecutively in pairs without turning the gas

BIOFILTRATION OF SO2 USING A. DENSIFLORUS 16
regulator on or off; however, given the variability within and between runs, it is difficult to
determine if this error was minimized.
In relation to the inconsistent gas regulator, the original concentration of 10 ppm SO2
could not be confirmed as being the same concentration in the airtight box. The amount of liters
of air flowing through the system could not be measured, and thus a concentration within the
system could not be determined. Ideally, at any given time there would have been 280 mg of SO2
in the 28 L box, yielding a concentration of 10 ppm. However, this could not be confirmed and
thus remains as a possible source of error.
If the data had not been so variable as to not be reliable, the mean removal capacity of A.
densiflorus would have been 296 mg SO2 in three hours, or 99 mg SO2 per hour. The results here
are difficult to compare to other studies where remediation capacity was reported in other, more
inclusive units. Yang et al. (2009) found A. densiflorus to take up VOCs at 2.65 to 11.40 μg of
pollutant • m-3 container volume • m-2 leaf area per hour, and Hörmann et al. (2018) measured A.
densiflorus to take up VOCs at 1.7 to 4 L pollutant • m-2 leaf area per hour. Esguerra et al. (1982)
found an uptake range from 0.15 to 2.77 μg SO2 • m-2 leaf area • s-1 for three hours. All these
measurements were taken in relation to exposed leaf area, and all experiments covered the soil
surface in order to isolate effect on pollutant concentration by aboveground plant tissue.
In the case of a standard houseplant that had the soil exposed to the atmosphere, the
uptake measured in this study would increase, though it should not be attributed to the actual
remediation of A. densiflorus but instead remediation by the soil and related microbes
performing rhizosphere degradation of SO2 (Soreanu et al., 2013). Soreanu et al. (2013) also
summarized research that suggested that phytoremediation is a collective effort between plants
and microorganisms, which depends on interactions with each other.

BIOFILTRATION OF SO2 USING A. DENSIFLORUS 17
It also must be accepted that in experiments such as this, the closed, modified
environment used to measure uptake cannot be compared to uptake in a normal indoor condition.
Similarly, the closed box increased concentration of SO2 around the plant, and therefore created
a greater concentration gradient. A concentration gradient will eventually cause sulfur levels in
both plant tissue and air to equalize, stopping uptake until the sulfur is metabolized and
transported elsewhere (Hörmann et al., 2018). This greater concentration would therefore create
the appearance of greater or faster uptake in comparison to within a large room in which the
amount of SO2 may be the same, but the concentration itself would be substantially lower.
However, hypothetically speaking, if the mean 99 mg SO2 per hour rate found in this
study was to be used as a calculation, a standard 4 by 4 by 4 cubic meter room at 5 ppm SO2
would require 20 plants to remediate all SO2 in a week. Calculations such as these are difficult to
substantiate when the remediation rate is not only determined from variable data, but also from
an experiment lasting only three hours in a closed system with conditions unlike that of a larger
room. These challenges also compound when scaling up remediation rates to incorporate into a
larger biofilter system.
Conclusion
It was determined that the experimental design resulted in data that was too variable to
assess confidently Asparagus densiflorus’ uptake of sulfur dioxide. Any repetitions of the
experiment would require a more constant and reliable method of delivery of SO2 and
measurement of plant uptake of SO2.

BIOFILTRATION OF SO2 USING A. DENSIFLORUS 18
Further Research
With further resources, this experiment could be expanded in multiple directions. The
priority would be to utilize a more consistent method of pollutant delivery to deliver and be able
to measure the same output of gas across runs. A calibrated SO2 meter is expensive but is needed
to be able to measure concentration accurately in real time, as well as a meter in order to measure
flow rate to determine units of output.
Another source of data that would better detail uptake would be to measure sulfur in the
plant biomass and compare sulfur in plants in the absence of SO2 to sulfur in plants in the
presence of SO2. With improved logistical operations in place, investigation of exposure times
ranging from 3 hours to 3 days would be beneficial. Additional research may include different
contaminants or different species of plants that have been shown to be efficient in remediation,
including Hemigraphis alternata, Hedera helix, Tradescantia pallida, and Hoya carnosa (Yang
et al., 2009).

BIOFILTRATION OF SO2 USING A. DENSIFLORUS 19
References
Acquaah, G. 2009. Horticulture: Principles and practices. Pearson Education. Upper Saddle
River, New Jersey.
Chung, CY., PL. Chung, and SW. Liao. 2011. Carbon fixation efficiency of plants influenced by
SO2. Environmental Monitoring and Assessment. 173:701-707.
Compton, B.W. (Ed.). 2011. SO2: Properties, applications and hazards. Nova Science
Publishers, Inc., Hauppauge, New York.
Ernst, W. H. O. 1998. Sulfur metabolism in higher plants: potential for phytoremediation.
Biodegradation. 9:311-318.
Esguerra, C. J., E. C. Santiago, N. R. Aquino, and M. L. Ramos. 1982. The uptake of SO2 and
NO2 by plants. Science Diliman. 2:44-56.
Furrer, O. J. 1967. The amount of sulphur dioxide absorbed by plants from the atmosphere.
Symposium on the use isotopes in plant nutrition and physiology studies. Vienna,
Austria.
Hochheiser, S. 1964. Methods of measuring and monitoring atmospheric sulfur dioxide. U.S.
Department of Health, Education, and Welfare. Cincinnati, Ohio.
Hörmann, V., KR. Brenske, and C. Ulrichs. 2018. Assessment of filtration efficiency and
physiological responses of selected plant species to indoor air pollutants (toluene and 2-
ethylhexanol) under chamber conditions. Environmental Science and Pollution Research.
25(1):447-458.
Jafari, J. M., A. A. Khajevandi, S. A. M. Najarkola, M. S. Yekaninejad, M. A. Pourhoseingholi,
L. Omidi, and S. Kalantary. 2015. Association of sick building syndrome with indoor air
parameters. Tanaffos. 14(1):55-62.

BIOFILTRATION OF SO2 USING A. DENSIFLORUS 20
Klepeis, N., W. C. Nelson, W. R. Ott, J. P. Robinson, A. M. Tsang, P. Switzer, J. V. Behar, S. C.
Hern, and W. H. Engelmann. 2001. The national human activity pattern survey
(NHAPS): A resource for assessing exposure to environmental pollutants. Journal of
Exposure Science & Environmental Epidemiology. 11:231-252.
Solá, X. G. 1998. Chapter 44: Indoor air quality. In J. M. Stellman (Ed.), Encyclopaedia of
occupational health and safety (44.2-44.26). International Labour Organization. Geneva,
Switzerland.
Soreanu, G., M. Dixon, and A. Darlington. 2013. Botanical biofiltration of indoor gaseous
pollutants—A mini-review. Chemical Engineering Journal. 229:585-594.
U.S. Environmental Protection Agency. 1989. Report to Congress on indoor air quality: Volume
2. EPA/400/1-89/001C. Accessed 20 February 2020. Available at
https://nepis.epa.gov/Exe/ZyPURL.cgi?Dockey=9100LMBU.TXT
U.S. Environmental Protection Agency. 1990. NAAQS table. Accessed 17 March 2020.
Available at https://www.epa.gov/criteria-air-pollutants/naaqs-table
U.S. Occupational Safety and Health Administration. 2017. Table Z-1-limits for air
contaminants. Code of Federal Regulations. Accessed 20 February 2020. Available at
https://www.osha.gov/laws-regs/regulations/standardnumber/1910/
Wolverton, B. C., R. C. McDonald, and H. H. Mesick. 1985. Foliage plants for indoor removal
of the primary combustion gases carbon monoxide and nitrogen dioxide. Journal of the
Mississippi Academy of Sciences. 30:1-8.
Yang, D. S., S. V. Pennisi, KC. Son, and S. J. Kays. 2009. Screening indoor plants for volatile
organic pollutant removal efficiency. HortScience. 44(5):1377-1381.

BIOFILTRATION OF SO2 USING A. DENSIFLORUS 21
Figures
Figure 1. The experimental setup that was used to evaluate A. densiflorus’ ability to take up SO2
from the atmosphere in a defined volume. The air-tight system was attached first to a safety trap
in order to absorb any overflow of SO2, then to a vacuum pump in order to control the flow
through the system. (fig. by de la Rosa)

BIOFILTRATION OF SO2 USING A. DENSIFLORUS 22
Figure 2. A schematic of how the hydrogen peroxide solution-filled impinger collects SO2. Air
containing SO2 (shown as red arrows) flows down the impinger tube and to the bottom of the
hydrogen peroxide solution. As bubbles of SO2-contaminated air are formed in the solution (red
circles), they react with the hydrogen peroxide in order to form sulfuric acid and remove all SO2
from the bubbles until there is none within them (white circles) before they break the surface of
the solution and the cleaned air is pulled through the outer port.

BIOFILTRATION OF SO2 USING A. DENSIFLORUS 23
Figure 3. The airtight box used in the experiment to test the presence or absence of atmospheric
SO2 is surrounded by the sealed bag, with tape-reinforced inlets and outlets for the Tygon tubing.
Box contains either no plant or one plant and a fan regardless of the presence or absence of the
plant.

BIOFILTRATION OF SO2 USING A. DENSIFLORUS 24
Figure 4. One of the divided A. densiflorus plants used in the experiment prior to exposure to
sulfur dioxide. Shown with plastic wrap used to prevent contact of rhizosphere with atmosphere.

BIOFILTRATION OF SO2 USING A. DENSIFLORUS 25
Figure 5. A histogram showing the distribution of the data collected in the presence of an
original source of 10 ppm SO2 but in the absence of Asparagus densiflorus for 3 hours in a space
of 28 liters (n = 12).
Range of SO2 (mg)[77, 223] (223, 370] (370, 517] (517, 663] (663, 810] (810, 956] (956, 1,103] (1,103, 1,249]
Num
ber o
f Sam
ples
0
1
2
3
4
5
6

BIOFILTRATION OF SO2 USING A. DENSIFLORUS 26
Figure 6. The amount of SO2 in mg when pulled at an original concentration of 10 ppm at 10
inches of Hg negative pressure for 3 hours in a space of 28 liters in the absence of Asparagus
densiflorus, evaluated twice (treatment 3 is No plant1 and treatment 3b is No plant2, n = 6), and
in the presence of Asparagus densiflorus (treatment 4 is Plant, n = 5).
SO2
(mg)
0
200
400
600
800
1,000
1,200
1,400
No plant1 No plant2 Plant
BIOFILTRATION OF SO2 USING A. DENSIFLORUS 27
Figure 7. Percent removal of SO2 from paired treatments in which SO2 at a source concentration
of 10 ppm was pulled through a 28-liter space at 10 inches Hg negative pressure for 3 hours in
the absence of Asparagus densiflorus (e.g. treatment 3b) and in the presence of Asparagus
densiflorus (treatment 4 as described in the methods text, n = 5).
Perc
enta
ge o
f SO2
Rem
oved
0
10
20
30
40
50
60
70
80
90
100
% Removal

BIOFILTRATION OF SO2 USING A. DENSIFLORUS 28
Tables
Table 1. Mean, standard deviation, and coefficient of variation (or relative standard deviation
expressed as a fraction of mean divided by the standard deviation) of mg SO2 in the absence or
presence of Asparagus densiflorus, and given the percent removal attributed to Asparagus
densiflorus within a defined volume after 3 hours exposure to a source of 10 ppm SO2.
Property Mean Value Standard Deviation CV
SO2 (mg) absence of Asparagus densiflorus – 1st 6 reps
223.2 115.6 51.8
SO2 (mg) absence of Asparagus densiflorus - 2nd 6 reps
546.7 419.2 76.7
SO2 (mg) presence of Asparagus densiflorus (n = 5)
223.0 213.7 95.8
% Removal of SO2 (n = 5) 52.5 19.5 37.2