Embed Size (px)
Citation preview

The Best Foot Forward Project:Substituting Teacher-Collected Video for In-Person Classroom ObservationsFirst Year Implementation Report
Thomas J. KaneHunter GehlbachMiriam GreenbergDavid QuinnDaniel Thal

AcknowledgmentsWe gratefully acknowledge generous support from Kenneth C. Griffin and the Bill & Melinda Gates Foundation. Min Lee, from the Ken and Anne Griffin Foundation, and Steve Cantrell, from BMGF, provided many helpful insights throughout the project. We also thank our partners employed in state departments of education and school districts and our collaborators from technology and video-coaching vendors, TNTP, thereNow, BloomBoard, and Swivl. Without their help, this work would not be possible. Most importantly, we are grateful for the participation of the principals, assistant principals, and teachers; the time and perspectives they shared have informed and pushed our thinking throughout the Best Foot Forward project.
13 The Best Foot Forward Project: Substituting Teacher-Collected Video for In-Person Classroom Observations
I. IntroductionAs school districts around the country implement new teacher evaluation systems, the Center for Education Policy Research at Harvard University has been investigating an alternative approach to traditional classroom observations: allowing teachers to submit their own recorded lesson videos in lieu of in-person observations (Jacobs, Doherty, Lakis, Lasser, & Staresina, 2014).Digital video offers a number of potential advantages over in-person observations, such as providing a more detailed, objective record than an observer’s written notes for teachers to discuss with administrators, allowing principals to time-shift their observational duties to quieter times of the day or week, and facilitating the use of external observers and content experts. However, in order to explore such potential benefits, we needed to respond to teacher concerns over video collection. In the end, our district partners offered teachers a trade: in return for teachers’ willingness to record and watch videos of their own lessons, teachers would control the camera and choose which lesson videos to submit for their observations. In other words, teachers were given the opportunity to use video to put their “best foot forward.”
In Delaware, Georgia, Colorado and California, 347 teachers and 108 administrators volunteered to participate and were randomly assigned to treatment and control groups. Teachers in the treatment group were given a special video camera and access to a secure website for storing and viewing their own recorded lessons. The treatment teachers collected an average of 13 videos of lessons. They were allowed to choose a subset of their videos to submit to observers, which included their supervisors as well as content experts outside their school. A secure software platform allowed principals as well as external content experts to watch the videos and provide time-stamped comments aligned to specific moments in the videos. The videos were used in one-on-one discussions between teachers and principals and between teachers and the external content experts. The teachers in schools randomly assigned to the control group continued to use in-person classroom observations.
In this paper, we describe impacts on teacher and principal perceptions of the observation process. We report six sets of findings from the first year of implementation:
• Were teachers willing to record and watch their lessons?
Yes. Giving control of the cameras to teachers successfully shifted the mode of classroom observations from in-person to video. Nearly all (96 percent) treatment teachers completed all three observations by submitting videos to their administrator. Nearly all (96 percent) also completed at least one observation with their virtual coach and 85 percent completed two observations with a virtual coach. Treatment teachers collected an average of 13 videos of their own lessons, though they were only required to collect five videos. Treatment teachers also reported fewer in-person classroom observations than their control counterparts. Very few of those in the control group (13 percent) reported using any video in their own observations.
• How did the use of video change teacher perceptions of their own teaching and their classroom?
The opportunity to watch their own lessons resulted in treatment teachers being more self-critical. At the end of the year, they rated their own instruction lower than comparison teachers, particularly in terms of time management and their ability to assess student mastery during class. Of teachers in the treatment group, 42 percent reported that while watching the videos, they noticed previously unnoticed student behaviors or their own behaviors “quite often” or “extremely often.”
• How did the use of video change the conversations between teachers and supervisors? Teachers in the treatment group perceived their supervisors to be more supportive and their observations to be fairer. They reported fewer disagreements on the ratings they received and were more likely to describe a specific change in their practice resulting from their post-observation conference. Likewise, treatment administrators reported that their post-observation conferences with teachers were less defensive.
14 The Best Foot Forward Project: Substituting Teacher-Collected Video for In-Person Classroom Observations
• How did the use of video affect supervisors’ time?
Treatment administrators reported spending more time observing and less time on paperwork. Moreover, the ability to watch video allowed supervisors to time-shift their observation duties: two-thirds of log-ins occurred during non-instructional school hours (lunch hour, the two hours immediately after school, evenings, weekends and holidays). Among administrators in the treatment group, 84 percent reported that they were able to fulfill their observation duties during quieter times of the day or week, as compared to their experiences with in-person observations in previous years.
• If teachers were choosing which lessons to submit, was it still possible to identify strong and weak teaching?
Allowing teachers to choose which lessons to submit did not get in the way of identifying those who were struggling. We asked external observers to score a sample of lessons that teachers submitted to their administrators, as well as a set of videos that they did not submit. When lessons were scored on the Classroom Assessment Scoring System (CLASS), the scores for the submitted lessons were half of one standard deviation higher, on average, than the un-submitted lessons. However, the dis-attenuated correlation between the lessons that a teacher submitted and her remaining lessons was quite high, at 0.75. In other words, teachers who were stronger (or weaker) in their submitted lessons also tended to be stronger (or weaker) in the lessons they chose not to submit.
• Would teachers and administrators support the use of video in the future?
Because both treatment and control teachers volunteered to be part of the project, we would expect them to be supportive of the use of video in classroom observations. Still, after having been through one year of actual video use, the treatment teachers were even more likely than teachers in the comparison group to support use of video as a replacement for some or all of their in-person classroom observations. Although supervisors in the treatment group were not more supportive than those in the control group, on the whole, supervisors in both groups were more supportive of the use of video than teachers.
In sum, giving teachers control of the video collection and submission process improved several dimensions of the classroom observation process. It boosted teachers’ perception of fairness, reduced teacher defensiveness during post-observation conferences, led to greater self-criticism by teachers and allowed administrators to shift observation duties to quieter times of the day or week. Moreover, granting teachers the opportunity to self-select videos changed teacher rankings only slightly; the submitted lessons from the best teachers were still better than the submitted lessons from struggling teachers.
In this report, we focus on the impact of video on the observation process experience of teachers and supervisors. In our next report, we will provide evidence on whether these apparent improvements were sufficient to generate improvements in student achievement.
Below, we provide a brief literature review and describe the intervention, experimental design and data collection efforts. We then summarize the evidence on differences between the treatment and comparison groups. Finally, we describe impacts on teacher and principal perceptions in a variety of domains.

15 The Best Foot Forward Project: Substituting Teacher-Collected Video for In-Person Classroom Observations
II. Literature ReviewTeacher evaluation systems typically include measures of student achievement as well as classroom observations. However, unlike the test-based measures, classroom observations are intended to provide direct feedback on the specific teacher behaviors. Teachers and principals are trained on a common rubric—providing a common vocabulary for discussing instruction. Moreover, by connecting feedback to teaching behavior, classroom observations are intended to support instructional change.
A number of studies have confirmed that when observers are trained on one of the major observational rubrics, they can apply them reliably (although achieving a reliability coefficient greater than 0.7 requires averaging over several observers). Moreover, such observation scores are valid predictors of larger-than-expected student achievement gains. (Kane, McCaffrey, Miller, & Staiger, 2013; Araujo, Carneiro, Cruz-Aguayo, & Schady, 2014; Bacher-Hicks, Chin, Hill, & Staiger, 2015).
However, the theory of action (usually implicit) linking in-person observations to student achievement is quite indirect: (a) by establishing a common vocabulary about key aspects of instruction (i.e., training teachers and supervisors on a rubric) and (b) having a supervisor observe and take notes while sitting in on a teacher’s lessons, (c) the observer’s written and oral feedback during the post-observation conference would lead the teacher to recognize previously unrecognized aspects of her behavior and/or students’ behavior that fall short of the standards, (d) the conversation between the principal and teacher would allow the teacher to identify at least one desired instructional change which would move closer toward the standard, (e) the teacher would be both willing and able to incorporate the new behaviors in her instruction, and (f) student achievement would rise.
There is evidence to support the first two propositions. Principals can be trained to apply an instructional rubric (Kane & Staiger, 2012) and principals can observe their own teachers just as reliably as they can observe teachers they do not know (i.e., their observation scores are reflecting what they see in the observation rather than being driven by prior interactions with a teacher) (Ho & Kane, 2012). However, there is less direct evidence available on the mechanisms behind stages (c) through (f), whereby the feedback from in-person observations is expected to lead to improved outcomes for students.
Taylor and Tyler (2012) studied the impact of implementing a formal, rubric-based classroom observation for experienced teachers in Cincinnati (Ohio) Public Schools between 2005 and 2010. Experienced teachers were evaluated every five years, based on their hire date. During their evaluation year, teachers were observed four times (three times by a trained observer from outside their school and once by their supervisor or principal). After each classroom observation, the observers provided written comments to the teacher and they met at least once in person. Controlling for student baseline scores and characteristics, Taylor and Tyler found that student achievement rose 0.07 standard deviations during the evaluation year and remained 0.11 higher in the year after evaluation.
We hypothesize that the video-based observations will generate larger improvements in student achievement than the in-person observations. Specifically, we hypothesize that the video record will be more effective in allowing a teacher to see previously unrecognized aspects of his or her practice. In other words, as teachers review their own videos (e.g., before selecting which videos to submit), we expect that they will be more likely to see previously unnoticed aspects of their practice.
We also expect that giving teachers the ability to choose from among a set of recorded lessons will lead them to record more lessons. Because teachers are collecting video far more than four times during the year (the average treatment group teacher collected 13 videos), they will have more opportunities for self-reflection.
Finally, we expect that incorporating video evidence into their conversation would allow teachers and supervisors to more readily identify specific changes in instructional behavior. Moreover, teachers might be more successful in implementing behavior change because they will be able to use the video to monitor their own efforts to change instruction.
There is some reason to hope that video feedback can help change instruction and student outcomes more effectively than in-person observations. In a randomized controlled experiment, Allen, Pianta, Gregory, Mikami, and Lun (2011) studied the effect of a twice-per-month video-based coaching model on secondary school teachers. Teachers submitted

16 The Best Foot Forward Project: Substituting Teacher-Collected Video for In-Person Classroom Observations
videos, and a coach identified clips with examples of strong and weak teacher-student interactions based on a formal observation rubric (CLASS). Although the authors reported no statistically significant impact on student achievement during the intervention year, student achievement was 0.22 standard deviations higher in the treatment teachers’ classrooms during the year following the intervention. Accordingly, we will be reporting impacts of the Best Foot Forward intervention on student achievement in the year following the intervention.
III. Intervention and Experimental Design In the spring of 2013, the study team recruited principals in four sites: small districts across the state of Delaware, a mid-sized district in Georgia, a collection of smaller districts in Colorado, and a large California school district. The study team worked with principals to recruit teachers in each of the schools. To be eligible, a minimum of three teachers in a school must have agreed to participate in the study. In October 2013, eligible schools were randomly assigned to a treatment or control group. The total randomized sample consisted of 101 principals and 347 teachers.
While the control group continued with their traditional classroom observation process, teachers in the treatment condition were given a video camera with which to record their lessons. The core philosophy of the intervention was that teachers should control the camera and choose which of their lessons to submit for observation (that is, they were allowed to put their “best foot forward”).
A private contractor, BloomBoard, provided video storage and a software platform for teachers to collect a library of videotaped lessons and observation artifacts (such as lesson plans and handouts). Working with a hardware supplier, thereNow, the study team distributed camera kits to all treatment teachers. The cameras incorporated two video streams (one for the teacher and one for students) and three audio channels (one for the teacher and two for general classroom audio). At the end of each lesson, the portable device merged the video and audio streams into a single video file. When the device was plugged into an Ethernet port, the file was piped securely to a teacher’s individual online account. Each teacher had a unique log-in, and only they could view and share videos in their account.
After a teacher shared a video with an observer, the observer logged in, tagged specific moments of the video, and commented on specific moments in the lesson. The software was customized so that the tags would correspond to each district’s observation rubric. During playback, the observer’s comments would appear at the specific point in the video when the observer entered them. The observer then shared the video evidence and commentary with the teacher before the two parties sat down in person to discuss the video feedback and determine a final score.
Teachers were required to record themselves multiple times a year and to choose five videos for the purposes of observation (three for evaluations by a school administrator and two for unofficial feedback from an external coach). Administrators watched three video lessons per participating teacher and gave online and in-person feedback. Teachers also received developmental feedback (which did not contribute to their formal evaluation) on two videos from a virtual peer coach, provided by The New Teacher Project.
In the fall of 2013, participants in the treatment group (51 administrators and 162 teachers) were trained to use the platform and video cameras for their observations in the 2013-14 school year. The training consisted of three to four hours of hands-on workshop-style activities. The team visited each site for camera distribution and training, and received ongoing training and technology support.
The training included guidance for administrators on methods for giving feedback using video evidence. The training focused on minimizing teacher-perceived vulnerability, focusing on high-leverage moments in the video and using questioning strategies to shift the analysis of practice from administrator to teacher.
The average teacher in the treatment group uploaded 13 videos during the year. Nearly all treatment teachers (96 percent) completed all three video observations with their administrator in the first year. Nearly all (96 percent) also completed at least one observation with their virtual coach; 85 percent completed two observations with a virtual coach.

17 The Best Foot Forward Project: Substituting Teacher-Collected Video for In-Person Classroom Observations
IV. Data CollectionSchool and teacher recruitment took place in the fall of 2013, after teaching assignments had been made. Random assignment occurred at the school level. Teachers and principals completed a baseline survey asking about their teaching experience and prior experiences with classroom observations. Students were surveyed in January 2014, and teachers were provided with anonymized and aggregated reports on their students’ responses.1 The survey assessed the extent to which students experienced the classroom environment as engaging, demanding, and supportive of their intellectual growth.
After each observation, teachers and principals were asked to complete a post-observation survey. Principals were surveyed weekly from November 2013 through May 2014 regarding time spent on teacher observation activities. Teachers, principals and students were also surveyed at the end of the school year. Appendix Table 1 reports response rates on each of the survey instruments.
V. External Validity: Participating Versus Non-participating Teachers and SchoolsAs reported in Table 1, students in the participating classrooms were similar to the students taught by non-participating teachers in the same schools. As shown in the first three columns, there was no statistically significant difference in student baseline test scores or the proportion receiving free or reduced price lunch in participating and non-participating classrooms in the same schools. The participating classrooms had a slightly higher percentage of white, non-Hispanic students (36 percent versus 32 percent) and a higher percentage of students with an individualized education plan (11 percent versus 8 percent).
While the first three columns focus on the differences between classrooms within participating schools, the last two columns of Table 1 report the differences between students at participating and non-participating schools in the same sites. There were no differences in baseline scores or other characteristics for the teachers in participating schools.
Table 1 also shows that there were no differences in terms of teachers’ gender, teaching experience or race and ethnicity, either within participating and non-participating classes in the same school or between participating and non-participating schools.2
VI. Internal Validity: Baseline Characteristics and AttritionTable 2 summarizes the differences in baseline characteristics between the students assigned to treatment and control teachers. As we would expect given that participating schools were randomly assigned to treatment, there were no differences in the average test scores or race/ethnicity in the treatment versus control schools.
In terms of administrator characteristics, the treatment sample had a statistically significantly higher percentage of male administrators (59 percent versus 38 percent). However, neither their experience nor race and ethnicity was significantly different from those in the control group.
In terms of their mean years of experience, gender, and race/ethnicity, the treatment teachers were not statistically different from the control teachers.3
1 The survey instrument was developed by Hunter Gehlbach, and the constructs were informed by the constructs from Tripod most highly correlated with student achievement. For more on the properties of the Tripod measure, see Kane & Staiger (2010).
2 We were not able to obtain data on non-participating teachers in the Georgia district and Eagle County, Colorado. As a result, the bottom panel of Table 1 excludes teachers from those two counties.
3 On the baseline survey, we were able to collect data on teacher and administrator characteristics in all sites. Unlike Table 1, Table 2 includes teachers in Georgia District and Eagle counties.

18 The Best Foot Forward Project: Substituting Teacher-Collected Video for In-Person Classroom Observations
VII. Teacher and Administrator Impressions of the Evaluation ProcessTable 3 reports the differences between the treatment and control groups on the number and types of observations recalled by teachers and administrators on the end-of-year survey. Teachers in the treatment group reported that principals spent 0.7 hours less time in teachers’ classrooms and completed 1.06 fewer in-person observations. Interestingly, the treatment principals did not recall spending significantly less time in treatment teachers’ classrooms. However, they did report a net increase in 2.54 observations using video. Video-based observations in the control group were quite rare, with only 13 percent of control principals reporting having done a video observation for one of the control-group teachers. In other words, there was little evidence that the control group were implementing their own version of the treatment.
Several findings suggest that the ability to submit recorded lessons helped create an environment more conducive to learning. Table 4 compares the perceptions of treatment and control teachers of their school’s evaluation processes at the end of the year, as well as after their first post-observation meeting.4 On the end-of-year survey, teachers in the treatment group were statistically significantly less likely to report that their conversations had been adversarial (six percentage points less likely to say “almost always” or “often”) or that they disagreed with the administrator about the appropriate score (six percentage points less likely to say “almost always” or “often”). They were more likely to describe the observation process as “moderately fair” or “very fair” (twelve percentage points). They were sixteen percentage points more likely to be able to identify a specific change in their practice resulting from post-observation conversations.
Teachers in the treatment group were also nine percentage points more likely to report that they had shared a video with a professional learning community or collaborative group at their school.
When surveyed after their first post-observation conference, teachers reported similar experiences to those they reported on the end of year survey.5 Treatment teachers were more likely than comparison teachers to report that administrators were “supportive,” that administrators had “tried to take their perspective,” that the conversations were “productive,” that they agreed with the administrator rating, and that the administrator was knowledgeable about instructional practice and pedagogy (although not more knowledgeable about the subject matter).
Table 5 reports administrators’ perceptions of the evaluation process. Regarding the level of defensiveness and adversarial nature of the post-observation discussions, responses of administrators were similar to those of teachers. Administrators in the treatment group were 28 percentage points more likely to report that teachers were “never” or “rarely” defensive during the post-observation conference.
However, treatment administrators were not as confident as teachers that the video would lead to improvements in teachers’ practice; treatment administrators were no more likely to report that post-conference meetings had a positive effect on their subsequent instruction.
Administrators expressed some specific concerns about the video observations as a substitute for in-person observations. For instance, treatment administrators were 21 percentage points less likely to report that they had a better understanding of student learning or classroom challenges in their school as a result of classroom observation process. In other words,
4 For survey response rates, see Appendix Table 1.
5 We focus on the first post-observation conference because 92 percent and 88 percent of the treatment and control teachers provided at least one response. We did not use teacher responses on subsequent post-observation surveys, since treatment teachers were disproportionately likely to respond to all the post-observation surveys (78 percent versus 62 percent).

19 The Best Foot Forward Project: Substituting Teacher-Collected Video for In-Person Classroom Observations
treatment administrators seemed to believe that the video was a poor substitute for physical presence when it came to understanding students’ learning. In future implementations, schools might maintain at least one in-person observation.
VIII. Impacts on Teacher Self-EvaluationsOn the end-of-year survey, teachers were asked to rate their own instructional practice on several dimensions using a 5-point Likert scale. Teachers assigned to video-based observations rated their own practice lower than the comparison group. Treatment teachers were less likely to report themselves to be “quite proficient” or “extremely proficient” in terms of their ability to assess students’ mastery of the content (14 points), in terms of their classroom management skills (9 points), and in terms of their ability to engage students in the curriculum (8 points). These are all skills that would be observable in a video recording.
Yet, on these same dimensions, teachers in the video-based observation group were more likely to report that their practice had improved during the year of the intervention. They reported that their time management practices (13 points) and lesson pacing (9 points) had “improved somewhat more” or “improved much more” in the current year than in recent years. Curiously, the treatment teachers were less likely to report that their knowledge and understanding of their subject/field had improved during the year (9 points).
IX. Principal Time Use and Time-ShiftingEach week during the 2013-14 school year, we asked administrators in the treatment and control groups to describe the time devoted to various duties related to observations. Each week, we asked them about a randomly selected teacher within the study sample. Table 7 reports the results. In terms of the total time devoted to teacher observations, there was no difference between the treatment and control groups. Both groups spent slightly more than 41 minutes per week per teacher on various aspects of the observation process. (This includes 55 percent of surveys in which principals reported no observations for the selected teacher.)
On average, the administrators in the treatment group spent 4.5 more minutes per week observing teachers
than the control group. That is 45 percent more time observing than the control group mean of 10.1 minutes. Over the course of 20 weeks, that would amount to roughly 1.5 hours per teacher. However, the treatment group also reported spending less time on other aspects of the observation, such as completing forms. (In an in-person observation, the observer needs to document what they saw, given the absence of a recording, and file the necessary paperwork.)
Although the intervention did not save time in the aggregate, administrators in the video group shifted their observation work to times of the day or week when classes were not being held and they could not have been performing in-person observations. We tracked the times when principals in each of the sites navigated into the observation viewing software. We compared the time stamps against the start and end of the school day and the scheduled lunch times at each school. We observed a total of 3,821 instances of principals navigating into the video viewing platform. Of these, roughly two-thirds (64 percent) of principal navigations occurred during non-instructional hours (before school, immediately after school, during lunch, in the evenings, on weekends, or holidays). This ranged from a low of 49 percent in Colorado to a high of 72 percent in Georgia. In our California district, nearly a quarter of administrator navigations (22 percent) occurred on weekends or holidays.
X. The Representativeness of Teacher-Submitted VideosGiving teachers control of the cameras may have increased their willingness to use cameras, but there were potential costs as well. For instance, by allowing teachers to select their own videos, the treatment may have made it more difficult for supervisors to identify struggling teachers. In this section, we attempt to quantify that cost.
An earlier study by Ho and Kane (2012) suggested that the rankings of teaching practice on teacher-chosen videos were similar to rankings one would have had on a broader sample of a teacher’s videos. In Hillsborough County, Florida, teachers participating in the Measures of Effective Teaching project were allowed to choose which of their videos would be scored by their own principals. However, any of their videos could be scored by other principals and peer observers in Hillsborough County. While the mean observation rating was 0.19 standard deviations higher on the teacher-selected

110 The Best Foot Forward Project: Substituting Teacher-Collected Video for In-Person Classroom Observations
videos, the dis-attenuated correlation between a teacher’s score on his or her selected and unselected videos was approximately one. While most teachers performed better on the selected videos (a good sign, since it implies that teachers understood which of their lessons would score better on their rubric), the rankings were largely the same on the teacher-selected lessons as on the non-selected lessons.
For each video that a teacher submitted to their administrator, we chose at random a video from the same period of the school year (from before the actual observation was conducted) which the teacher chose not to submit. We identified a sample of 197 such videos from a sample of 60 teachers randomly selected from the treatment group (30 elementary, 15 middle school math, 15 middle school English/Language Arts). We contracted with a non-profit organization, Teachstone, to have a set of 15 trained raters score the videos. Raters were blind as to which videos had been submitted by the teacher. Eight raters were assigned to score middle school videos; seven raters were assigned to score elementary videos. Each rater scored two videos—one submitted and one unsubmitted—from all 30 teachers in their grade range.
The videos were scored using CLASS (Hamre, Pianta, & Choomat-Mooney, 2009). They were evaluated on four domains (emotional support, classroom organization, instructional support, and student engagement). Raters were certified on the CLASS rubric prior to the project and required to calibrate on four separate occasions during the project.
Mean scores on the submitted videos were approximately one-quarter of a standard deviation higher than the scores on the remaining videos. However, as reported by Ho and Kane (2012), the dis-attenuated correlation between a teacher’s score on the videos she or he chose to submit to his or her administrator and on those not submitted was moderately high (0.75).6
For each teacher, we were able to calculate the mean score on his or her submitted as well as un-submitted videos. Figure 1 shows a scatterplot of these scores for each teacher. The horizontal axis measures the average score on the lessons which the teacher chose not to submit to their administrator as scored by the observers in their grade grouping; the vertical axis measures the average score on the lessons that the same teacher submitted. The dotted line in Figure 1 represents the 45 degree line, along which scores would have been identical. For two-thirds of teachers, the average score
on the submitted lesson was higher than the non-submitted lessons. However, as reported in Figure 1, the teachers who scored better on their submitted lessons also tended to score higher on their unsubmitted lessons.7
We also studied any differences in the official evaluation ratings submitted by supervisors at the end of the year. If there was any advantage of being able to submit videos instead of having in-person observations, administrators seem to have adjusted for it. As shown in Appendix Table 2 (see page 15), there was no difference in the mean evaluation score of teachers in the treatment and control group.
6 Following Ho and Kane (2012), we calculated the dis-attenuated correlation as follows:
where Scorechosen,i,r is the score of a chosen video from teacher i by rater r , Scoreunchosen,i,r’ is the score of an unchosen video from teacher i by a different rater r’, and relchosen and relunchosen are the reliability of chosen and unchosen video scores, respectively.
7 The measures used in Figure 1 demonstrate a correlation of .64. However, this correlation is measuring a different concept than the disattenuated correlation above. On one hand, the disattenuated correlation is assuming no measurement error. In Figure 1, because we are averaging over 7.5 submitted or unsubmitted ratings and not an infinite sample, there is measurement error in both measures, which is diminishing the correlation. On the other hand, any rater by teacher variance component is also being included, which is inflating the correlation. That component is not included in the disattenuated correlation, since we estimate the covariance in submitted and unsubmitted scores for different raters.
Figure 1. Relationship between Teachers’ Mean Scores on Chosen and Unchosen Videos
3
4
5
6
3 4 5 6
45º Line
Teacher averageScore on Chosen vs. Unchosen Lesson
Note: Each point is an average of 7 scores each on chosen and unchosen videos for elementary teachers. For middle school teachers, each point is an average of 8 scores each on chosen and unchosen videos.
Average Unchosen Score
Ave
rage
Cho
sen
Scor
e

111 The Best Foot Forward Project: Substituting Teacher-Collected Video for In-Person Classroom Observations
XI. Treatment Group Perceptions of Video-Based ObservationsBecause all of the administrators and teachers in the study were volunteers, one would expect them to be positively inclined toward using video in observations. However, only those in the treatment group were actually exposed to the use of video for observations. As a result, we test the impact of that experience on teachers’ and administrators’ views on the use of video.
In Table 9, we report teacher responses. Specifically, we asked, “To what extent would you oppose or support being allowed to use a camera to voluntarily record and submit videos for your classroom observations INSTEAD OF having in-person observations?” Roughly half (51 percent) of the control group participants were “moderately” or “strongly” supportive. However, at the end of the treatment, the teachers in the treatment group were 12 percentage points more supportive than the control group at 63 percent supportive.
We then asked, “To what extent would you oppose or support being allowed to use a camera to voluntarily record and submit videos for SOME of your classroom observations (in addition to at least one in-person observation)?” A slightly higher percentage of the control group (53 percent) was supportive of the partial replacement of in-person observations with video. But, again, the treatment group teachers were 15 percentage points more likely to favor the use of video than the control group at 68 percent supportive.
We also asked, “To what extent would you oppose or support being allowed to use a camera to voluntarily record and submit videos for purely formative feedback (not part of the formal observation process)?” Of the control group, 57 percent were in favor of the use of video for formative feedback. Again, the treatment group teachers were 12 percentage points more likely to be supportive, at 69 percent supportive.
In addition, we asked a series of questions just of the treatment group’s experience with the process. Below is a brief summary of the responses from treatment group teachers outlined in Table 9:
• Nearly half of teachers (46 percent) reported that the feedback from the virtual coach based on video was “quite helpful” or “extremely helpful” and 59 percent were able to identify a specific change in practice they made as a result of the virtual coach’s feedback.
• Only 30 percent of teachers reported that the feedback from the student survey that we did at mid-year was “quite helpful” or “extremely helpful.” However, nearly half (45 percent) were able to identify a specific change in instructional practice they made as a result of the student survey feedback they received in the middle of the year.
• Nearly two-thirds of treatment teachers (63 percent) reported that video was “quite helpful” or “extremely helpful” in identifying areas where they need to improve.
• Approximately one-third (37 percent) reported that they “quite often” or “extremely often” saw student reactions or behaviors in the videos that they had not noticed while teaching the class. Roughly one-third (32 percent) reported that they “quite often” or “extremely often” noticed things that they themselves said or did (or failed to say or do) that they had not noticed while in class. Forty-three percent reported that they “quite often” or “extremely often” saw either a student behavior or a personal behavior that they had not noticed during the lesson.
• Half of treatment teachers found having the camera in their classroom “moderately” or “much” less distracting than having a supervisor physically present. Two-fifths (41 percent) found video to be similar, slightly more or slightly less distracting, and 8 percent reported that having the camera in class was “moderately more” or “quite a bit more” distracting than having an observer physically present.
• Roughly one out of ten teachers (9 percent) reported that students behaved “quite” or “extremely” differently when the camera was on.
In Table 10, we report the administrators’ responses. We asked about their support for teachers being allowed to use a camera to voluntarily report and submit videos as a replacement for in-person observations, as a replacement for some of their observations, and for purely formative feedback. Large percentages of the control group were in favor of all three uses (67 percent, 83 percent, and 91 percent, respectively). Such rates of support were even higher than among teachers. However, the treatment group principals were not more likely to be in favor of the use of video than the control group principals.
112 The Best Foot Forward Project: Substituting Teacher-Collected Video for In-Person Classroom Observations
Table 10 also reports the administrators’ perceptions of the video-based observation process, including:
• More than eight out of ten administrators (84 percent) reported that the availability of the video allowed them to do their observations during quieter times of the day or week.
• Nearly three-quarters of administrators reported that the video was moderately or extremely effective at capturing the teacher narrative and teacher directives. However, only about one-quarter of administrators reported that the video allowed them to observe class discussions, group work or board work “moderately” or “extremely” effectively.
• A small percentage of administrators described having difficulties with the software for viewing and embedding comments in a teacher’s video.
XII. ConclusionDigital video can improve classroom observations, by providing more detailed, objective feedback to teachers, allowing principals to perform their observation duties at quieter times of the day or week, and facilitating the inclusion of content experts from outside the school in the observation process.
However, in order to enjoy the advantages of video, schools systems must build trust among teachers and overcome teacher anxiety related to video recording. We have tested one approach to reducing teacher anxiety—that of giving teachers control of the camera and allowing them to choose which lessons to submit for review.
Our evidence suggests that video does improve a number of dimensions of classroom observation. Teachers believed using video for observations resulted
in evaluations which were fairer. Both teachers and administrators reported that post-observation discussions were less defensive and adversarial. At the same time, treatment teachers were more self-critical, especially with respect to time management and questioning, and they were more likely to be able to identify a specific change they made in their practice as a result of observation and feedback. In addition, principals were able to perform many of their observational duties during quieter times of the day or week.
In a recent field experiment in Tennessee, Papay, Taylor, Tyler, and Laski (2015) identified teachers with strong and weak observation scores in the state’s teacher evaluation database. In a randomly chosen subset of schools, the stronger teachers were asked to mentor the weaker teachers in their own schools. Student achievement was 0.055 standard deviations higher in the treatment schools overall and 0.12 standard deviations higher in the weaker teachers’ classrooms. If the use of video can improve the quality of supervisor-to-teacher interactions, it might also be useful for improving the quality of teacher-to-teacher interactions.
However, we also encountered some practical challenges in implementing teacher-collected video. In particular, video seems to limit administrators’ perceived ability to understand student engagement and small group discussions. For such aspects of a classroom observation, allowing for some in-person observations may still be useful.
In a future report, we will report impacts of the treatment on student achievement.

113 The Best Foot Forward Project: Substituting Teacher-Collected Video for In-Person Classroom Observations
ReferencesAllen, J. P., Pianta, R. C., Gregory, A., Mikami, A. Y., & Lun,
J. (2011, August 19). An interaction-based approach to enhancing secondary school instruction and student achievement. Science, 333(6054), 1034-1037.
Araujo, M. C., Carneiro, P., Cruz-Aguayo, Y., & Schady, N. (2014). A helping hand? Teacher quality and learning outcomes in kindergarten. Washington, DC: Inter-American Development Bank.
Bacher-Hicks, A., Chin, M., Hill, H. C., & Staiger, D. O. (2015). Explaining teacher effects on achievement using measures from multiple research traditions. Manuscript submitted for publication.
Hamre, B. K., Pianta, R. C., & Choomat-Mooney, L. (2009). Conducting classroom observations in school-based research. In L. Dinella (Ed), Conducting psychology research in school-based settings: A practical guide for researchers conducting high quality science within school environments (pp. 79-106). Washington, DC: APA Press.
Ho, A. D., & Kane, T. J. (2012). The reliability of classroom observations by school personnel. Seattle, WA: Bill & Melinda Gates Foundation.
Jacobs, S., Doherty, K. M., Lakis, K., Lasser, P., & Staresina, L. N. (2014). 2014 state teacher policy yearbook. Washington, DC: National Center on Teacher Quality.
Kane, T. J., & Staiger, D. O. (2010). Learning about teaching: Initial findings from the Measures of Effective Teaching Project. Seattle, WA: Bill & Melinda Gates Foundation.
Kane, T.J. & Staiger, D.O. (2012). Gathering Feedback on Teaching: Combining High-Quality Observations with Student Surveys and Achievement Gains (Seattle, WA: Bill & Melinda Gates Foundation)
Kane, T. J., McCaffrey, D. F., Miller, T., & Staiger, D. O. (2013). Have we identified effective teachers? Validating measures of effective teaching using random assignment. Seattle, WA: Bill & Melinda Gates Foundation.
Papay, J., Taylor, E., Tyler, J., & Laski, M. (2015). Learning job skills from colleagues at work: Evidence from a field experiment using teacher performance data (Brown University Working Paper, July 2015).
Taylor, E., & Tyler, J. (2012). The effect of evaluation on teacher performance. American Economic Review, 102(7), 3628-3651.

114 The Best Foot Forward Project: Substituting Teacher-Collected Video for In-Person Classroom Observations
Table 1. Study Participants versus Non-Participants
Study Participants
Non-participating
classes in participating
schools
Participating Classes – Non-
Part.Classes Difference
(s.e.)
Non-participating
schools
Participating School – Non-Part. School Difference
(s.e.)
Student Characteristics
Average prior score – math -0.007 0.020 -0.005 0.019 -0.025
(0.045) (0.059)
Average prior score – ELA -0.026 0.011 -0.002 -0.004 0.012
(0.037) (0.058)
Proportion Free or Reduced Price Lunch 0.555 0.565 0.003 0.715 -0.001
(0.008) (0.043)
Proportion White, Non-Hispanic 0.356 0.317 0.014** 0.168 -0.006
(0.007) (0.032)
Proportion Black, Non-Hispanic 0.252 0.260 0.001 0.145 0.030
(0.007) (0.035)
Proportion Hispanic 0.293 0.310 -0.005 0.614 -0.043
(0.008) (0.030)
Proportion Limited English Prof. 0.204 0.232 -0.010 0.428 -0.019
(0.011) (0.023)
Proportion w/ IEP 0.108 0.077 0.031** 0.079 0.008
(0.012) (0.005)
Teacher Characteristics
Proportion Male 0.291 0.289 0.026 0.288 0.025
(0.041) (0.022)
Years as Teacher 10.330 10.152 0.107 9.773 -0.148
(0.502) (0.176)
Proportion White, Non-Hispanic 0.669 0.611 -0.021 0.480 0.006
(0.030) (0.036)
Proportion Black, Non-Hispanic 0.087 0.090 0.022 0.105 0.002
(0.018) (0.020)
Proportion Hispanic 0.180 0.213 -0.000 0.308 -0.013
(0.025) (0.038)
Note. *, **, *** indicates significance at the 90%, 95%, and 99% level, respectively. Teachers’ years of practice, race, and gender data were not available in Georgia District, and teachers’ race and gender data were not available in Eagle County, Colorado. The sample excludes special education classes (defined as classes where 75% or more of students have an individualized education plan, or IEP) taught by non-Best Foot Forward teachers. Prior scores are reported in standard deviation units, after standardizing scores by state, grade, and subject. The difference between Best Foot Forward teachers and non-sample teachers in participating schools (column 3) was estimated controlling for school fixed effects. The difference between students and teachers in participating and non-participating schools (column 5) was estimated after controlling for a district fixed effect. In all cases, standard errors are reported in parentheses, and allow for clustering within a school.

115 The Best Foot Forward Project: Substituting Teacher-Collected Video for In-Person Classroom Observations
Table 2. Difference Between Treatment and Control Groups at Baseline
Treatment ControlT-C Difference
(s.e.)School Characteristics Average Percent Proficient – Math 0.663 0.665 -0.021
(0.024)
Average Percent Proficient – ELA 0.727 0.706 -0.001
(0.019)
Proportion Free or Reduced Price Lunch 0.565 0.550 0.034
(0.033)
Proportion White, Non-Hispanic 0.371 0.333 0.022
(0.036)
Proportion Black, Non-Hispanic 0.238 0.248 -0.022
(0.036)
Proportion Hispanic 0.317 0.304 0.045
(0.030)
# of Schools 41 44
Administrator CharacteristicsProportion Male 0.585 0.377 0.211**
(0.090)
Years as Administrator 8.868 10.642 -1.764
(1.383)
Proportion White, Non-Hispanic 0.635 0.588 0.014
(0.081)
Proportion Black, Non-Hispanic 0.212 0.275 -0.051
(0.072)
Proportion Hispanic 0.154 0.098 0.071
(0.048)
# of Administrators 53 53
Teacher CharacteristicsProportion Male 0.585 0.377 0.211**
(0.090)
Years as Teacher 11.792 11.991 -0.099
(0.753)
Proportion White, Non-Hispanic 0.600 0.628 -0.019
(0.050)
Proportion Black, Non-Hispanic 0.237 0.201 0.013
(0.049)
Proportion Hispanic 0.106 0.104 0.014
(0.034)
# of Teachers 166 179
Note. *, **, *** indicates significance at the 90%, 95%, and 99% level, respectively. The adjusted difference between control and treatment is the result of a regression of the dependent variable against fixed effects for randomization strata and a treatment indicator. Standard errors are reported in parentheses, and in the teacher and administrator models they allow for clustering within a school. School characteristics are from the 2012/13 school year, as that was the most recent data available at the time of randomization. An F Test of whether the above variables are jointly significant as predictors of treatment status for schools is marginally significant, with F(6,67) = 2.00 and p=0.0784; for teachers is insignificant, with F(5,297) = 0.06 and p=0.9978; and for administrators is insignificant, with F(5,87) = 1.53 and p=0.1894.

116 The Best Foot Forward Project: Substituting Teacher-Collected Video for In-Person Classroom Observations
Table 3. Impacts on the Number and Type of Observations
Control MeanT-C Difference
(se) N
Teacher Survey
How many times did a supervisor, principal, or assistant principal conduct a classroom observation in-person in your classroom this school year? (count, censored at “12 or more”)
4.41 -1.06*(.43) -0.021
Approximately, what was the total amount of time that a supervisor, principal, or assistant principal was inside your classroom this year conducting an observation? (in hours, censored at “more than five hours”)
2.07-0.69***
(.18) 315
Administrator Survey
How many times did you conduct a classroom observation in-person? (count variable, censored at “more than 10”)
4.23 .22(.60) 95
How many times did you conduct a classroom observation using video? (count variable, censored at “more than 10”)
.31 2.54***(.19) 95
How many times did you conduct a classroom observation using video? (binary variable, one for all non-zero values)
.13 0.81***(.06) 95
Note. The differences were estimated in a regression model controlling for randomization block and whether the school is an elementary or middle school. For teacher items, standard errors are clustered at the school level.

117 The Best Foot Forward Project: Substituting Teacher-Collected Video for In-Person Classroom Observations
Table 4. Impacts on Teacher Perceptions of the Observation Process
Control MeanT-C Difference
(se) NTeacher End-of-Year Survey
Thinking about your post-conference…
How well did the observer understand your lesson plan and your goals for the class? (“extremely” or “quite”) .64 .08
(.05) 317
How often did you feel the conversation was adversarial? (“almost always” or “often”) .12 -.06*
(.03) 316
How often did you and the observer disagree about what actually happened during lesson? (“almost always” or “often”) .06 -.03
(.02) 318
How often did you and the observer disagree about the appropriate score for the lesson? (“almost always” or “often”) .08 -.06*
(.03) 318
Overall, how fair was the classroom observation process this year? (“very fair” or “moderately fair”) .58 .12***
(.05) 319
Can you identify a specific change in your teaching practice you made as a result of the feedback from your school administrator this year? (1=Y, 0=N)
.55 .16**(.05) 316
Since January of this year, have you shared a video of your teaching in a professional learning community or other collaborative group? (1=Y, 0=N)
.10 .09**(.04) 318
Surveys After the First Post-Observation Meeting:
How supportive was your observer during the post-observation conference? (1=“extremely” or “quite”) .84 .10***
(.03) 300
How would you describe the relationship, at present, with your observer? (1=“very positive” or “somewhat positive”) .84 .06
(.04) 308
During the post-observation conference, how much effort did your observer put into taking your perspective? (1=“tremendous amount” or “quite a bit”)
.67 .16***(.05) 298
How productive did you find the post-observation conference overall? (1=“extremely” or “quite”) .57 .18***
(.05) 300
How familiar is your observer with your strengths and weaknesses as a teacher? (1=“very familiar” or “somewhat familiar”) .71 .05
(.05) 309
To what extent did you agree or disagree with your observer or her/his recommendations? (1=“completely agree” or “moderately agree”)
.70 .13***(.05) 301
*p<.10 **p<.05 ***p<.01
Note. For each comparison, the outcome is a dichotomous indicator for whether the respondent chose one of the top two categories on the Likert scale (e.g., on a 7-point Likert scale for agreement that ranges from “completely disagree” to “completely agree,” the binary variable indicates a response choice of “completely agree” or “moderately agree”; Likert scales ranged across items from 5 points to 7 points). The differences were estimated in a regression model controlling for randomization block and whether the school is an elementary school. Standard errors are clustered at the school level. For teacher post-observation survey results we used only the first post-observation conference because 92% and 88% of the treatment and control teachers provided at least one response. We did not use all teacher responses, since treatment teachers were disproportionately likely to respond to all the post-observation surveys (78% versus 62%).

118 The Best Foot Forward Project: Substituting Teacher-Collected Video for In-Person Classroom Observations
Table 5. Impacts on Administrator Perceptions of the Observation Process
Control MeanT-C Difference
(se) NAdministrator End-of-Year Survey
Thinking about the teachers who were part of the study this year….
How confident are you that your classroom observation provided an accurate rating of their teaching? (“quite” or “extremely”) .76 -.05
(.09) 97
Do you believe your post-conference meetings had a positive or negative impact on their subsequent instruction? (“large positive” or “moderately positive”)
.64 .04(.10) 96
How often were teachers defensive as you discussed your observation notes with them? (“never” or “rarely”) .65 .28***
(.07) 97
How often did you and the teacher disagree about what actually happened during the lesson? (“never” or “rarely”) .04 -.03
(.03) 95
How often did you and the teacher disagree about the appropriate score for the lesson? (dichotomous; 1=“never” or “rarely”) .07 -.04
(.04) 96
How often did the following occur as a result of your classroom observations? (“extremely often” or “quite often”)
I better understand my teachers' skills .87 -.10(.08) 97
I better understood my teachers’ development areas. .74 .05(.09) 97
I better understood what students were learning. .85 -.21**(.09) 97
I gave teachers helpful feedback. .63 .04(.10) 97
I better understood the classroom challenges at my school. .83 -.21**(.09) 97
I helped my teachers reflect on their practice. .67 .05(.10) 97
*p<.10 **p<.05 ***p<.01
Note. For each comparison, the outcome is a dichotomous indicator for whether the respondent chose one of the top two categories on the Likert scale (e.g., on a 4-point Likert scale for amount learned that ranges from “nothing” to “quite a bit,” the binary variable indicates a response choice of “quite a bit” or “some”; Likert scales ranged across items from 4 points to 7 points). The differences were estimated using regression models controlling for randomization block and whether the school was an elementary school.

119 The Best Foot Forward Project: Substituting Teacher-Collected Video for In-Person Classroom Observations
Table 6. Impacts on Teacher Self-Assessments of Instructional Practice and Improvement
Control MeanT-C Difference
(se) N
In thinking about your teaching practice, please rate your proficiency in the following areas… (“extremely” or “quite” proficient)
Assessing students' level of mastery of content/skills .88 -.14***(.05) 317
Using multiple methods of assessment of student learning .75 -.03(.05) 317
Differentiating instruction for different learning styles .67 -.02(.05) 317
Classroom management .86 -.09**(.04) 317
Engaging students in the curriculum .85 -.08*(.04) 317
How much did you learn this year about your practice in the following areas… (“some” or “quite a bit”)
Your time management practices .72 .13***(.04) 318
Your lesson pacing .74 .09**(.04) 318
Your handling of student discipline and behavior .64 -.01(.05) 318
Your knowledge and understanding of your main subject/field(s) .77 -.09*(.05) 317
*p<.10 **p<.05 ***p<.01
Note. For each comparison, the outcome is a dichotomous indicator for whether the respondent chose one of the top two categories on the Likert scale (e.g., on a 4-point Likert scale for amount learned that ranges from “nothing” to “quite a bit,” the binary variable indicates a response choice of “quite a bit” or “some”; Likert scales ranged across items from 4 points to 7 points). Estimates were derived from models that controlled for randomization block and whether the school was an elementary or middle school. Standard errors were clustered at the school level.

120 The Best Foot Forward Project: Substituting Teacher-Collected Video for In-Person Classroom Observations
Table 7. Impacts on Administrator Time Use
(in minutes per week for a randomly chosen teacher) Control MeanT-C Difference
(se) N
Total 41.531 -0.119(5.423) 105/2460
Observing teachers 10.105 4.542**(1.492) 105/2460
Preparing to deliver feedback 4.500 0.434(0.771) 105/2460
Delivering feedback 5.617 -0.382(0.715) 105/2460
Pre-conference 2.445 -0.493(0.450) 105/2460
Scheduling an observation 2.029 -0.290(0.370) 105/2460
Writing the observation report 9.581 -1.592(1.412) 105/2460
Completing other forms for this teacher’s observation 7.255 -2.338*(1.349) 105/2460
Note. *, **, *** indicate significance at the 90, 95, and 99% levels, respectively. Models control for fixed effects of randomization blocks and a fixed elementary school effect. Standard errors are clustered by principal. Missing values on surveys that were otherwise completed were imputed as zero minutes. Surveys that were not returned were excluded.

121 The Best Foot Forward Project: Substituting Teacher-Collected Video for In-Person Classroom Observations
Table 8. Times When Treatment Principals Performed Observations
Percent of all navigations to Best Foot Forward observations occurring in each time period
Total Colorado Delaware Georgia California
During Instructional Hours (Excluding Lunch):
Before Lunch 19.0 29.7 26.5 12.6 18.5
After Lunch 17.0 21.1 18.4 15.1 16.5
Subtotal Percent: 36.0 50.8 44.9 27.7 35.0
During Non-Instructional Hours:
Before School (4 a.m.-start) 5.0 8.6 5.9 2.9 5.7
During Lunch 15.2 10.4 14.4 19.8 8.4
After School Hours (end-6 p.m.) 16.9 12.5 14.0 19.1 18.0
Evenings (6 p.m.-4 a.m.) 12.7 8.3 7.5 16.6 10.9
Weekends and Holidays 14.2 9.3 13.4 13.9 22.0
Subtotal Percent: 64.0 49.2 55.1 72.3 65.0
Total # Navigations 3,821 815 479 1,873 654
Note. Based on time-stamp data from BloomBoard.

122 The Best Foot Forward Project: Substituting Teacher-Collected Video for In-Person Classroom Observations
Table 9. Teacher Perceptions of Video-based Observations (Treatment Only)Mean(se) N
Overall, how helpful was the feedback you received from your virtual coach this year in helping you to improve your teaching? (“extremely” or “quite” helpful)
.46(.04) 154
Can you identify a specific change in your teaching practice you made as a result of the feedback from your virtual coach this year? (1=Y, 0=N)
.59(.04) 153
Overall, how helpful was the feedback you received from the student surveys this year in helping you to improve your teaching? (“extremely” or “quite” helpful)
.30(.04) 152
Can you identify a specific change in your teaching practice you made as a result of the feedback you received from the student surveys this year? (1=Y, 0=N)
.45(.04) 153
To what extent did watching the video help you identify the areas where you need to improve? (“extremely” or “quite”)
.63(.04) 156
When watching your videos, how often did you see students' reactions and students' behaviors that you did not remember seeing during the class? (“extremely often” or “quite often”)
.37(.04) 155
When watching your videos, how often did you notice things you said or did (or did not say or do) that you did not notice during the class? (“extremely often” or “quite often”)
.32(.04 155
Proportion responding “extremely” or “quite” often to either of the above two questions. 0.43(.04) 155
As compared to having a supervisor physically observe in your classroom, how distracting was the presence of the video camera in your classroom?
“Much more” or “Moderately more” .08(.02) 156
“Similar,” “Slightly more,” or “Slightly less” .41(.04)
“Much less” or “Moderately less” .50(.04)
How differently did the students behave when the camera was on? (“extremely” or “quite” differently)
.09(.02) 156
Note. Unless otherwise noted, the outcome is a dichotomous indicator for whether the respondent chose one of the top two categories on the Likert scale (e.g., on a 5-point Likert scale for helpfulness that ranges from “not at all helpful” to “extremely helpful,” the binary variable indicates a response choice of “extremely helpful” or “quite helpful”; Likert scales ranged across items from 5 points to 7 points).

123 The Best Foot Forward Project: Substituting Teacher-Collected Video for In-Person Classroom Observations
Table 10. Administrator Perceptions of Video-based Observations (Treatment Only) Mean(se) N
As compared to in-person observations, did the video allow you to perform your observation work at less busy times of the day or week? (1=Y, 0=N)
.84(.05) 51
Have you used teachers’ videos for anything other than the observation process? (1=Y, 0=N)
.27(.06) 51
How effectively did the videos you rated capture the following aspects of the teachers’ lessons? (“extremely effective” or “moderately effective”)
Board work .25(.06) 51
Teacher lesson narrative .67(.07) 51
Teacher directives .73(.06) 51
Student activities .44(.07) 50
Student comments .44(.07) 51
Class discussions .27(.06) 51
Group work (e.g., activity centers) .27(.06) 51
How difficult were each of the following aspects of the video observation process? (“extremely” or “quite” difficult)
Knowing when a teacher’s video was ready to be viewed .02(.02) 51
Watching videos on your computer .06(.03) 51
Logging into BloomBoard .02(.02) 51
Entering comments and tags for teachers on BloomBoard .04(.03) 51
Scoring the video .04(.03) 51
Completing the post-conference and post-conference forms .02(.02) 51
Accessing artifacts (e.g., lesson plans) .02(.02) 51
Accessing help/support 0.00(0.00) 51
Note. Unless otherwise noted, the outcome is a dichotomous indicator for whether the respondent chose one of the top two categories on the Likert scale (e.g., on a 7-point Likert scale for effectiveness that ranges from “extremely ineffective” to “extremely effective,” the binary variable indicates a response choice of “extremely effective” or “moderately effective”; Likert scales ranged across items from 5 points to 7 points).
124 The Best Foot Forward Project: Substituting Teacher-Collected Video for In-Person Classroom Observations
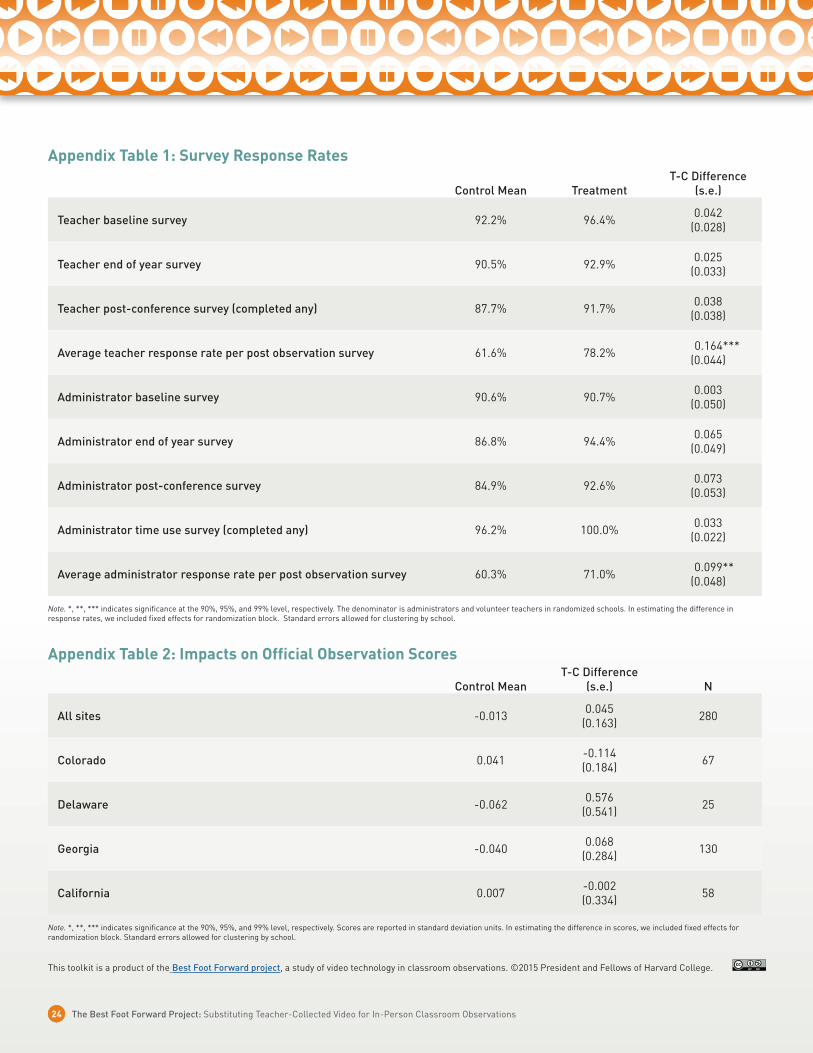
Appendix Table 1: Survey Response Rates
Control Mean TreatmentT-C Difference
(s.e.)
Teacher baseline survey 92.2% 96.4% 0.042(0.028)
Teacher end of year survey 90.5% 92.9% 0.025(0.033)
Teacher post-conference survey (completed any) 87.7% 91.7% 0.038(0.038)
Average teacher response rate per post observation survey 61.6% 78.2% 0.164***(0.044)
Administrator baseline survey 90.6% 90.7% 0.003(0.050)
Administrator end of year survey 86.8% 94.4% 0.065(0.049)
Administrator post-conference survey 84.9% 92.6% 0.073(0.053)
Administrator time use survey (completed any) 96.2% 100.0% 0.033(0.022)
Average administrator response rate per post observation survey 60.3% 71.0% 0.099**(0.048)
Note. *, **, *** indicates significance at the 90%, 95%, and 99% level, respectively. The denominator is administrators and volunteer teachers in randomized schools. In estimating the difference in response rates, we included fixed effects for randomization block. Standard errors allowed for clustering by school.
Appendix Table 2: Impacts on Official Observation Scores
Control MeanT-C Difference
(s.e.) N
All sites -0.013 0.045(0.163) 280
Colorado 0.041 -0.114(0.184) 67
Delaware -0.062 0.576(0.541) 25
Georgia -0.040 0.068(0.284) 130
California 0.007 -0.002(0.334) 58
Note. *, **, *** indicates significance at the 90%, 95%, and 99% level, respectively. Scores are reported in standard deviation units. In estimating the difference in scores, we included fixed effects for randomization block. Standard errors allowed for clustering by school.
This toolkit is a product of the Best Foot Forward project, a study of video technology in classroom observations. ©2015 President and Fellows of Harvard College.


