Embed Size (px)
Citation preview
THE BATTLE OF THE GRIDS 2030/2050
Frauke Thies, Greenpeace
Stockholm, 30 September 2011
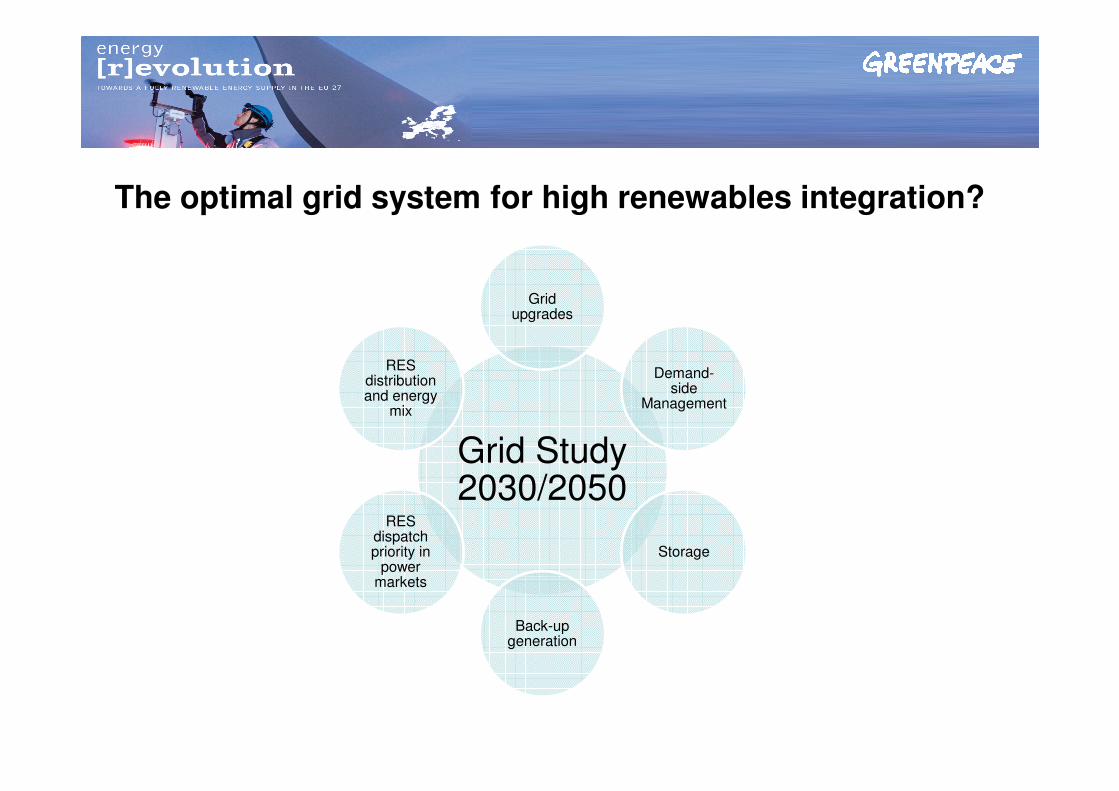
Grid Study 2030/2050
Grid upgrades
Demand-side
Management
Storage
Back-up generation
RES dispatch priority in
power markets
RES distribution and energy
mix
The optimal grid system for high renewables integration?

Assumed Power Mix
68% RE 98% RE
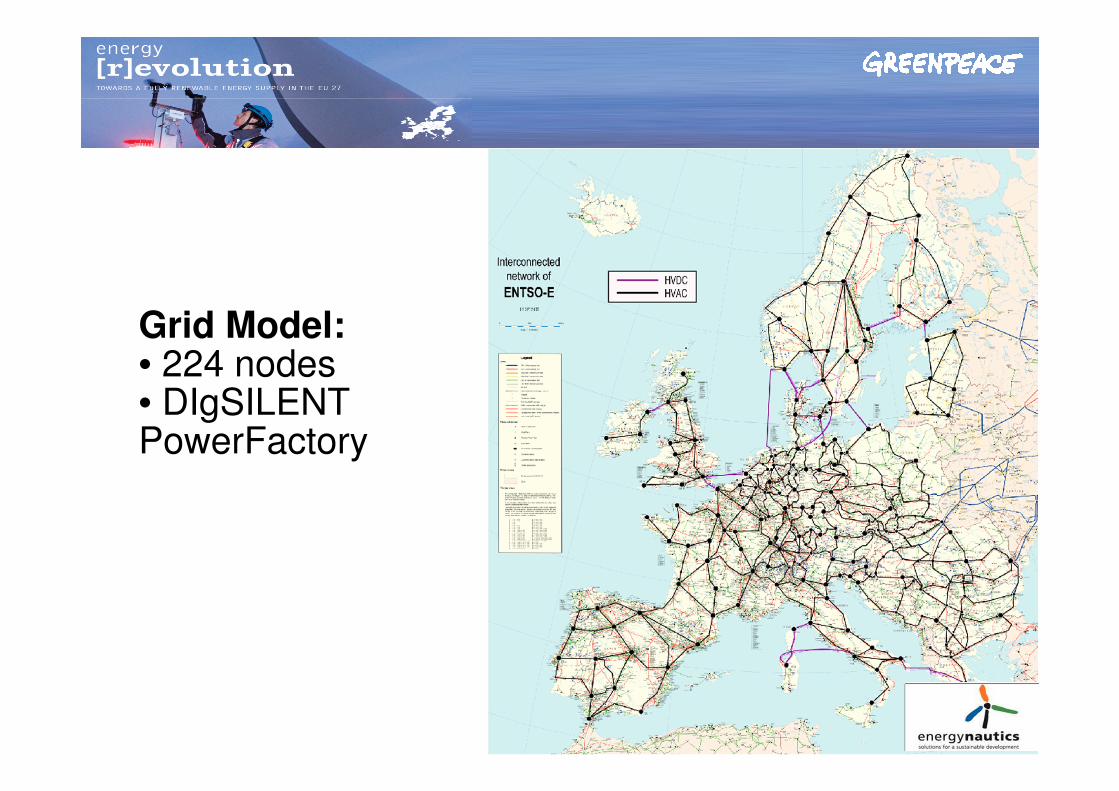
Grid Model:• 224 nodes• DIgSILENT PowerFactory

Simulations 2030/2050
1. Full-year (hourly); 2. Extreme weather situations (30 years)

MAIN RESULTS

Short-term
storage and
DSM
Back-up
capacity and long-
term storage
Grid
upgrade
Priority
dispatch
for RE Security of Supply
RES Integration
1. Large-scale integration entirely feasible
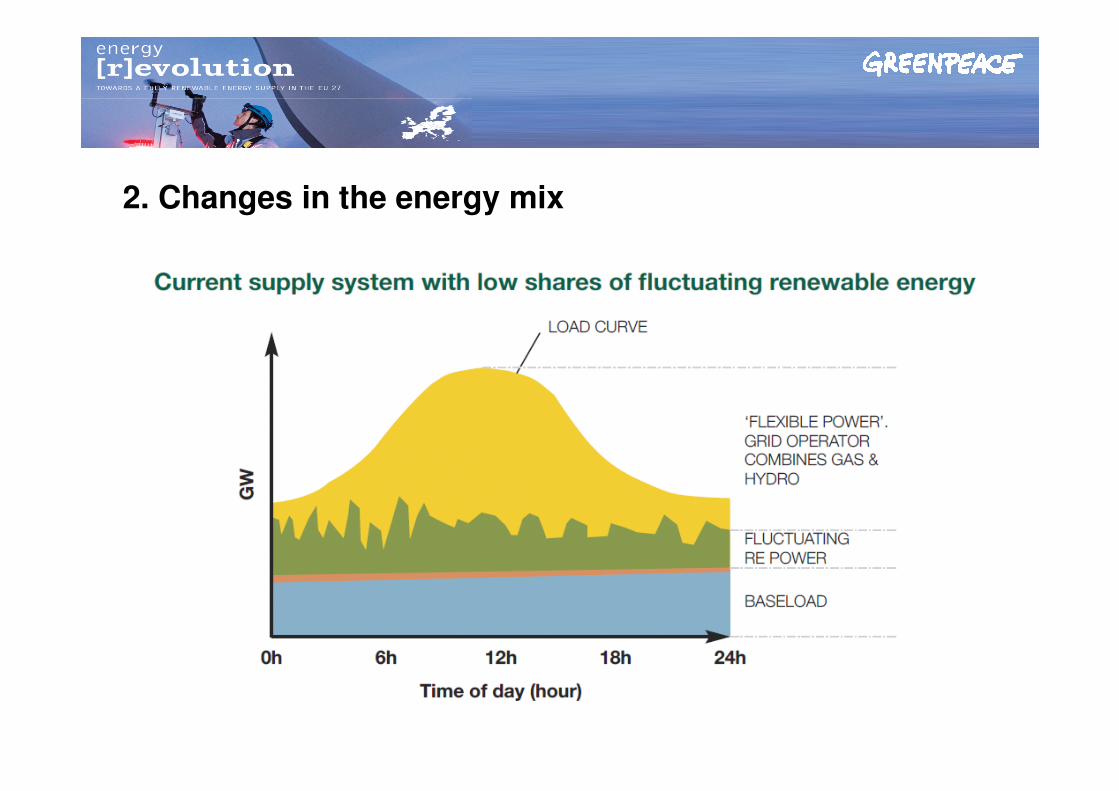
2. Changes in the energy mix

Curtailment losses of
€32bn/ year
Inflexibility leads to inefficiencies

“baseload” plants
running only 46% of
the year in 2030
Baseload investments become uneconomic

2030:• “missing links”
• offshore wind grids
• first step onshore
supergrid
230 000 km € 74-98 bn
280 000 km € 150-170 bn
2050 regional scenario:
RES close to demand
2050 import scenario:
60GW import (North Africa)
500 000 km € 530-680 bn
3. Necessary grid upgrades

Source: Reproduced by energynautics with permission of ENTSO-E
2030
1. South to Central
Europe
2. North Sea Offshore
12

Source: Reproduced with permission of ENTSO-E by energynautics.
2050
(High Grid case)

flexibility
Grid upgrades
Storage
Phase out
nuclear/ coal
Gas-bridge
but limited
Improved market rules
Stable RE
support
Conclusions for 2050 Roadmap?

Optimised
Scenario 2030
Import
Scenario 2050
Regional
Scenario 2050
Distance
(thousand km)
HVAC 170 242 190
HVDC Onshore 19 125 26
HVDC Offshore 43 135 62
Total 233 501 278
Cost of
upgrades vs
2010 grid
(billion euro)
HVAC 20 59 31
HVDC Onshore 21 -49 300 – 452 65 – 89
HVDC Offshore 29 168 53
Total 70 - 98 528 - 679 149 – 173
© Copyright to energynautics GmbH.
3. Grid investments of € 70-98 bn by 2030 and € 149-679 bnby 2050
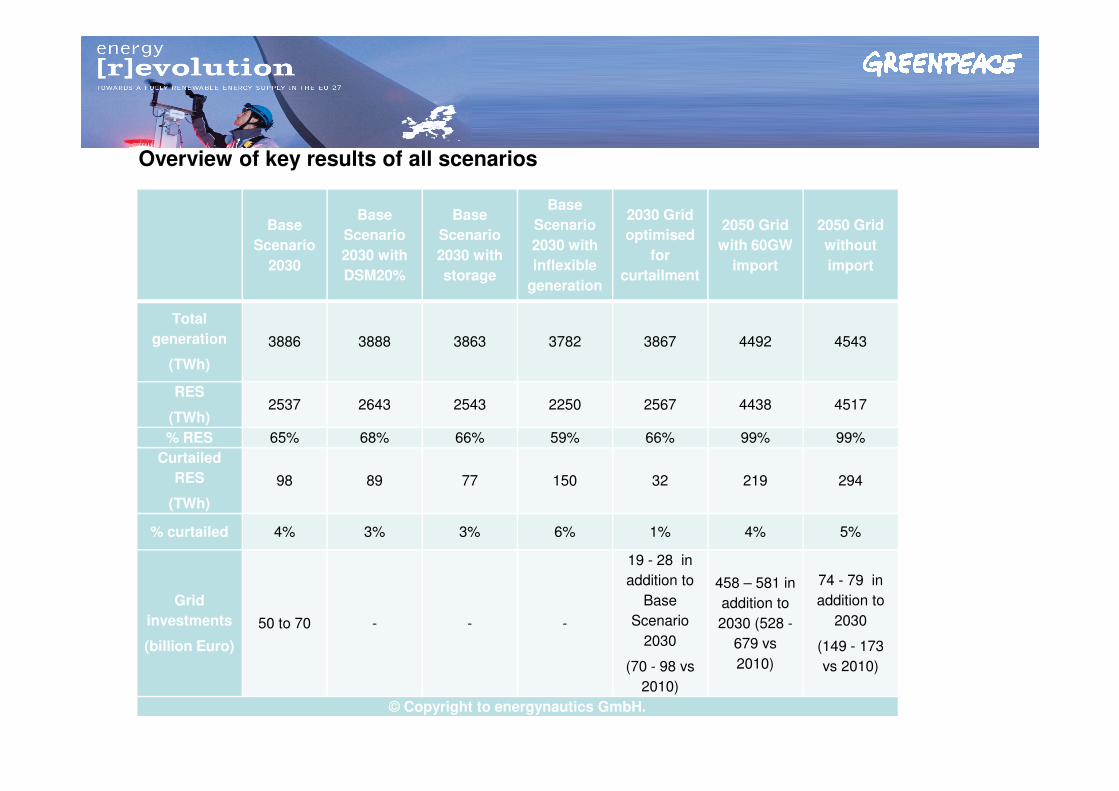
Base
Scenario
2030
Base
Scenario
2030 with
DSM20%
Base
Scenario
2030 with
storage
Base
Scenario
2030 with
inflexible
generation
2030 Grid
optimised
for
curtailment
2050 Grid
with 60GW
import
2050 Grid
without
import
Total
generation
(TWh)
3886 3888 3863 3782 3867 4492 4543
RES
(TWh)2537 2643 2543 2250 2567 4438 4517
% RES 65% 68% 66% 59% 66% 99% 99%
Curtailed
RES
(TWh)
98 89 77 150 32 219 294
% curtailed 4% 3% 3% 6% 1% 4% 5%
Grid
investments
(billion Euro)
50 to 70 - - -
19 - 28 in
addition to
Base
Scenario
2030
(70 - 98 vs
2010)
458 – 581 in
addition to
2030 (528 -
679 vs
2010)
74 - 79 in
addition to
2030
(149 - 173
vs 2010)
© Copyright to energynautics GmbH.
Overview of key results of all scenarios