Embed Size (px)
Citation preview
-~ ·- -·····r•••·-···-· ---
The Barnstable Harbor Shellfish Recruitment
Enhancement Project
(BHSREP)
A Final Report compiled by:
Tom Marcotti Shellfish Biologist
Natural Resources Division Health, Safety, and Environmental Services Department
Barnstable, MA
and
Dale F. Leavitt, Ph.D. Fisheries and Aquaculture Specialist
Sea Grant Program Woods Hole Oceanographic Institution
Woods Hole, MA
1 7 January 1997

Executive Summary: Soft shell clam recruitment onto tidal flats is a poorly understood phenomenon that is
thought to be dependent on physical, chemical, and biological factors in the environment. In Barnstable Harbor, a number of sites have undergone a substantial change in their ability to attract and support soft shell clam sets. Many sites in the harbor have a history of promoting clam sets but inspection of these sites today reveals a lack ofharvestable resources. How do we manage these flats to bring them back to their historical levels of clam production?
Two methods were proposed by a collaborative group consisting of the Barnstable Shellfishermen's Association, the Town of Barnstable Division ofNatural Resources, and shellfish biologist Dale Leavitt (Sea Grant Program at Woods Hole Oceanographic Institution). The first proposed method to enhance soft shell clam recruitment was to physically turnover the sediment using a disk harrow. This technique has been used previously for soft shell clam recruitment and is thought to change sediment structure, reduce predators, change sediment chemistry, and increase bottom roughness on a short-term basis. The second proposed technique was to place suspended tents of plastic netting over the flats. This technique has also been previously used to promote clam recruitment and is thought to be etTective due to changing the hydrodynamics across the flats and by excluding predators of small clams.
Five replicated treatments were administered at four sites within Barnstable Harbor. The sites were Huckins Island, The Cove, Green Point, and Eel Grass Cove and the treatments were no manipulations, mechanical cultivation, netting over a cultivated area, 5/16 inch mesh plastic netting, and 1/4 inch mesh plastic netting. The flats were sampled for sediment characteristics and/or clam density and size at four time intervals during the experiment, including before manipulating, two weeks post-manipulation, in the Fall of 1995, and in the Fall of 1996. In addition, data were collected on money and time expended to complete the project.
Equipment costs for placing clam tents on the flats was approximately $2,363 per acre. Labor costs for placing the nets on the flats were defrayed by using volunteer labor so that the time expended for the complete project of approximately 45 acres cultivated and 3.5 acres netted equaled 814 hours of volunteer help, 293 hours of salaried help, and $5,230 for net retrieval. The total cost for completing the program was approximately $3,900 per acre.
Although summer 1995 is suspected to have been a very poor year for soft shell clam recruitment in Massachusetts Bay, the results from the present study allow for guarded optimism in the efficacy of using human intervention to promote soft shell clam recruitment in Barnstable Harbor. Cultivation of the sediment did not prove to be effective during this study but more research is suggested to finally conclude that this technique is not appropriate for Barnstable Harbor. On the whole, the density of clams in the areas covered with clam tents did not change following tenting although two areas netted at one site (Green Point) did receive a significant set of clams due to the tents. The density of young of the year soft shell clams at Green Point under the 1/4 inch mesh netting increased from 26 clams per ft2 before the treatment to 109 clams per ft2 by Fall of 1995. This set resulted in a final density of 12 legally harvestable soft shell clams per ft2 in the fall of 1996 compared to no legally harvestable clams in control areas. The economic return associated with the soft shell clam production achieved under the nets at Green Point approaches $37,925 per acre resulting in an economic gain of up to $113,775 per acre to the Town of Barnstable.
2
•
•
•

• _ _, -- -----...--·------- ---
Background and Justification for the Project:
The recruitment of bivalve larvae onto intertidal and subtidal flats is a poorly understood
phenomena. Studies dating back into the 1800's have investigated and speculated on what
factors influence the distribution of young bivalves on the mud flats. To this day, although much
is now known about bivalve settling behavior, the complete story is not fully understood. It is
generally accepted that three general categories of environmental factors play a role in regulating
the set of young clams. These categories include physical, chemical, and biological factors.
The soft shell clam (Mya arenaria) spawns primarily in the spring (May- July) and
sometimes a second time in the fall (Sept.- Oct.) depending on the local environmental
conditions at the flat. Following fertilization of the egg, the developing larvae will spend a short
time, two weeks to a month, swimming in the water column while continually being transported
by the prevailing wind and currents. As the larvae become ready to metamorphose to a bottom
dwelling lifestyle they become negatively buoyant and start making excursions to the bottom
looking for suitable habitat to settle on. Because clam larvae are very weak swimmers, the
location of their settlement is largely at the mercy of the hydrodynamics of the water body they
• are resident in. Yet the competent, i.e. ready to settle, larvae demonstrate some selective
capacity by controlling their height off the bottom, by way of swimming, thereby either
•
promoting contact with the bottom or taking advantage of local water currents to move the
larvae over different bottom conditions ..
As stated above, the distribution of clam settling is generally thought to be controlled by
a combination ofthree factors, thechemical, biological, and physical components of the
environment. Many researchers have noted the influence chemical properties within the flats
may have on settling clam spat. Properties such as salinity, temperature, level of organic content
of the substrate, light, and possible chemical cues from resident adults are all thought to play a
role in clam settling. The actual importance of chemical cues to bivalve recruitment are thought
to be relatively minor once the basic life requirements for the clam are met. For example, clams
will not be resident in flats that are routinely flushed with freshwater, yet if the salinity stays
within an acceptable range, approximately 5 parts per thousand (ppt) up to 35 ppt, then salinity
3

-~ - ~---··-r--·• --·-
will not inf1uence settling behavior and post-set survival. Clams also will not survive if the flat
should experience any interval where the oxygen level drops below a critical level. Low ambient
oxygen is a common cause of seed clam mortality and low recruitment during the summer
months in some of Cape Cod's enclosed bays and estuaries.
Both the biological and the physical characteristics of the flats play a significant role in
the distribution of settling spat. For biological properties, the most important consideration is
predation on the young clams. Soft shell clam populations totally disappeared in the Annapolis
Basin in Nova Scotia, Canada in the early 1980s, following the installation of a tidal power
generating facility upstream from the flats. Rowell ( 1992) reported that the disappearance of the
clam population was due, in part, to heavy predation on existing clam populations by the ribbon
worm (Cerebratulus lacteus). The authors did not associate the presence of the nemertean worm
with the construction of the power plant. Other researchers have also documented the role that
predators play in controlling soft shell clam populations following settlement.
At the conclusion of a study investigating the role biotic factors played on soft shell clam
recruitment, Beal (1990) stated his "results suggest that previously accepted models employing
simple biotic mechanisms to explain recruitment patterns of intertidal marine bivalves are not
sufficiently adequate and must be modified to include physical parameters such as sedimentary
dynamics." The most important factor in controlling clam settlement distributions is thought to
be the physical characteristics of the site. Two characteristics appear to be important- the water
movement patterns and the sand grain size distribution. Turner ( 1953) suggested that enhanced
clam recruitment could be expected where there was a decrease in water t1ow velocity. This is
supported by reports of clam settlement patterns along slack water gradients or within eddies
(Newell and Hidu 1986). In a recent Sea Grant funded study in Buzzards Bay, MA, Garland and
Mullineaux ( 1992) concluded that coastal eddies do appear to concentrate late stage bivalve
larvae except during periods of high wind stress. Coastal eddies, formed on the lee side of
headlands, were first theorized to be sinks for bivalve larvae in 1903 (Kellogg 1903 ), where he
described the phenomena as similar to tea leaves gathering in the middle of a swirling cup.
•
•
• 4

• ....!to,. ·- --· ------- ----
Other physical factors that impact water velocity near the bottom and could influence bivalve
settlement include tidal current asymmetry and bottom roughness.
Sediment composition has also been implicated in playing a role in clam settlement. In
addition to predation by the ribbon worm, Rowell ( 1992) demonstrated that the water flow
patterns had changed in the Annapolis Basin following installation of the tidal power plant with
the end result being the bottom becoming covered with a 1-2 inch layer of watery fine sediments.
This layer effectively blocked the settling soft shell clam larvae from getting access to the
bottom. Phil Schwind ( 1977) observed that "slimy bottom will prohibit the setting of clam seed,
and soft mud containing hydrogen sulfide or other organic acids caused by decaying vegetation
will prohibit growth and erode shells."
Within Barnstable Harbor, a number of sites have undergone a substantial change with
respect to their ability to attract and support clam sets. Sites such as next to Mussel Point in The
Cove and Green Point traditionally recruited large sets of soft shell clams but today are totally
non-productive. These sites fit the hydrodynamic model for optimal clam recruitment by being
probable eddy areas. Other currently non-productive sites within the harbor, such as Huckins
• Island, and Eel Grass Cove, also have a history of promoting clam sets and may have potential
•
for clam recruitment. Inspection of many of these sites today reveals that the sediment is
covered with a fine silt-clay mud and there are high numbers of ribbon worms, moon snails, and
other predators. The question that needs to be asked is how do we manage these tlats to bring
them back to their historical levels of clam productivity?
One method that repeatedly appears in the scientific and management literature is
cultivation of the flats. Schwind ( 1977) reports that flat cultivation was practiced over 100 years
ago as a means to maintain clam flat productivity but is not currently used. It has been suggested
by Rask ( 1986), Schwind ( 1977), MacKenzie ( 1979), Kite and Chew ( 1975), Pfitzenmeyer
(1972), and many others as an acceptable means to promote clam recruitment. How does it
promote recruitment?
Cultivation of the flats promotes clam recruitment through a number of different means.
The first is that cultivation changes the grain size distribution of the sediment. It reduces the
5

...:.... - ...--· ---.--·- ---~
proportion of the fine silt-clay fraction thereby increasing the grain size of the sediment (Rask
1986, Haven 1970, Godcharles 1971 ). In Maine, Kyte ( 1975) found that sediment cultivation
increased clam recruitment while in the Chesapeake· region cultivation had no effect on clam
recruitment (Haven 1970, Pfitzenmeyer 1972). Macfarlane (1983) observed fewer "seed" clams
on cultivated flats, although her definition of "seed" was anything less than 1.5 inches, not really
addressing the young of the year, and the cultivation took place during the peak period of clam
settlement, thereby interrupting the primary settlement event in the spring. She reported
increased settlement on the tilled flats the following year, probably representing the fall set
which occurred immediately post-cultivation.
Cultivating the flats may reduce the density of predators through physical disturbance of
the flats during the interval when the clams are settling. This will give the newly settled clams a
chance to grow to a size where predators cannot prey on the clam.
Turning over the flats potentially resuspends and releases some of the organic material
that may be contributing to both the level of organic acids as referenced by Schwind ( 1977) and
the biological or chemical oxygen demand (BOD or COD) within the sediment. BOD and COD
can deplete oxygen levels in the clam's microenvironment. Less sediment organic content has
also been reported to support increased growth rates of soft shell clams (Belding 1930).
A second technique to enhance bivalve recruitment onto intertidal flats is through the use
of"clam tents". This technique entails placing a relatively fine mesh plastic netting ( 1/8 to 1/2"
mesh size) over the tidal flats and suspended above the sediment water interface. Clam tents
have been used with varying degrees of success at many sites on Cape Cod and are currently
popular tools to promote soft shell clam recruitment on aquaculture leases in the town of
Wellfleet and at other sites on Cape Cod.
The mechanism of action whereby these tents promote clam recruitment is largely
unknown although it is suspected that hydrodynamics may be a key factor. As outlined above,
hydrodynamics plays several roles in distributing soft shell clam larvae during the free
swimming stage and the early post-set. During the larval stage, distribution of clam veligers is
primarily controlled by water movement. Recent research suggests that immediately post-set
•
•
• 6

• • .lro.. ·- ........... ~ -· .... ·- ----- --- -
and up to a valve length of 5mm, juvenile soft shell clams are routinely transported by water
currents as a component of the bedload. The placement of netting, in the form of a suspended
cover over the sediment and in the same plane as the bedload transport vector, will reduce water
movement at the sediment surface therefore allowing particles entrained in the water current,
such as larval or juvenile clams, to settle onto the sediment.
Clam tents may also physically inhibit crabs and other surface moving predators from
gaining access to the newly settled clams. Because predation is thought to be the primary
mechanism for loss of newly settled bivalve larvae, any obstruction to the predators will
·significantly increase the probability of juvenile clam survival post-set. Clam tents establish an
appropriate microenvironment to promote the settlement, survival, and growth of soft shell
clams in the intertidal flats.
Both types of flat manipulation, tlat cultivation and clam tents, have potential to re
establish soft shell clams onto flats in Barnstable Harbor Although many of these flats have
traditionally supported populations of clams large enough to allow commercial harvesting, they
no longer do so. We propose to experimentally test the efficacy of these two flat manipulation
• techniques to promote soft shell clam recruitment at selected locations in Barnstable Harbor.
•
Experimental Methods:
We proposed to investigate how effective flat manipulations, in the form of flat
cultivation and/or net tents, are in promoting soft shell clam recruitment in Barnstable Harbor.
To achieve this objective, we established ten experimental squares at each of four sites within
Barnstable Harbor (Figure 1 ). The 50 by 50 foot experimental squares (2,500 ft2) were
established at:
1) Huckins Island (Plot #2),
2) The Cove (Plot #4 ),
3) Green Point (Plot #5), and
4) Eel Grass Cove (Plot #6) .
7
This research effort was part of a larger effort undertaken by the Barnstable Shellfishermen's
Association and the Barnstable Department of Natural Resources to enhance soft shell clam
recruitment within the Harbor.
At each experimental plot, randomly selected replicated squares were assigned to be
manipulated by the following techniques:
1) control (no manipulation),
2) mechanical cultivation by disk harrow,
3) 51 Ott-brand plastic netting over cultivated sediment,
4) 51 0tt-brand plastic netting (5/16 inch mesh),
5) Plurima-brand plastic netting (1/4 inch mesh).
The experimental deployments at each plot are identified in the plot schematics in Figures 2
through 5. Each experimental square consisted of a 50 by 50 foot square with a 25 foot buffer
strip between any two adjoining squares. Each square was demarcated by wooden corner stakes
to allow repeated sampling during the experimental time period.
Prior to the application of the prescribed treatment at each square, one sediment core
(two inch diameter) within each of the ten squares was collected for sediment analysis. The
depth of the anaerobic horizon was recorded and the sediment cores were divided into two
subsections consisting of the top one inch of sediment as subsection A and the next one inch of
sediment as subsection B. The sediment samples are archived, by freezing at -1 0°C, for grain
size analysis dependent on the outcome of the experimental manipulations. To analyze for
faunal composition in each the experimental squares, one core (one ft2) was collected at each of
the ten squares, the core contents were sieved on site through a 2 mm sieve, and all living soft
shell clams were collected for measurement of size class distribution prior to treatment. Size, in
millimeters, was measured as the longest length of the valves along the anterio-posterior axis.
Two weeks following the completion of the plot manipulations, sediment cores were
taken as described above and preserved for sediment grain size analysis, as outlined above.
The squares were experimentally manipulated during the time interval of 22 April to 27
June 1995,~prior to the predicted soft shell clam spring recruitment event in Barnstable Harbor .
•
., '·.
•
• 8

•
•
•
_..,_ - ...,_ .. ------- ----
The squares were allowed to sit untouched during the summer. During November 1995, from
each of the ten squares at each experimental site, one core (two inch diameter) was collected for
sediment grain size analysis as described above, one core (two inch diameter) was collected for
total sediment organic content analysis, and one core (eight inch diameter) was collected and
sieved, as described above, for faunal analysis.
One year following the Fall 1995 sampling period, a second series of replicated cores
(eight inch diameter) were collected (8 October 1996) at all experimental squares that showed
visual evidence of soft shell clams.
Results and Discussion:
Overall:
The timeline for the flat manipulations, including the associated research sampling effort,
is presented in Table 1. The experimental deployments at each of the plots are diagrammed in
Figures 2 through 5 and also included are the plans for the complete net deployments at each
plot.
Summaries of the total amounts of areas netted and estimated costs of materials for each
site are included in Tables 2 and 3. These data include all areas covered with clam tents,
including the research squares. The areas netted and the estimated costs of materials at each site
are 0.9 acres netted at Huckins Island at a materials cost of $2,324 (Table 2a); 0.3 acres of The
Cove netted at a cost of$747 (Table 2b); l.4 acres of Green Point netted at a cost of$2,335
(Table 3a); and 0.9 acres of Eel Grass Cove netted at a cost of$2,218 (Table 3b). The mean cost
of materials per acre netted is approximately $2,363.
An estimate of total effort, both volunteered and salaried, for cultivating the flats and
deploying the nets are included in Table 4. A total of 814 person-hours were volunteered for
starting this project, in conjunction with 123 hours of salaried DNR employee time.
As ofthe 20 December 1995, a large amount of netting remained deployed on the flats
due to a lack of volunteer effort in removing the netting. Because this was a breach of the
"Order of Conditions" placed on the project and because the volunteer support diminished to the
9

point where no help was forthcoming, the Barnstable DNR instituted a bounty system for net
retrievals to expedite net removal from the flats. Due to the bounty system there was a large
effort to remove the remaining nets, including all of the remaining nets associated with the
research program, and this was completed as of 21 March 1996. The costs associated with the
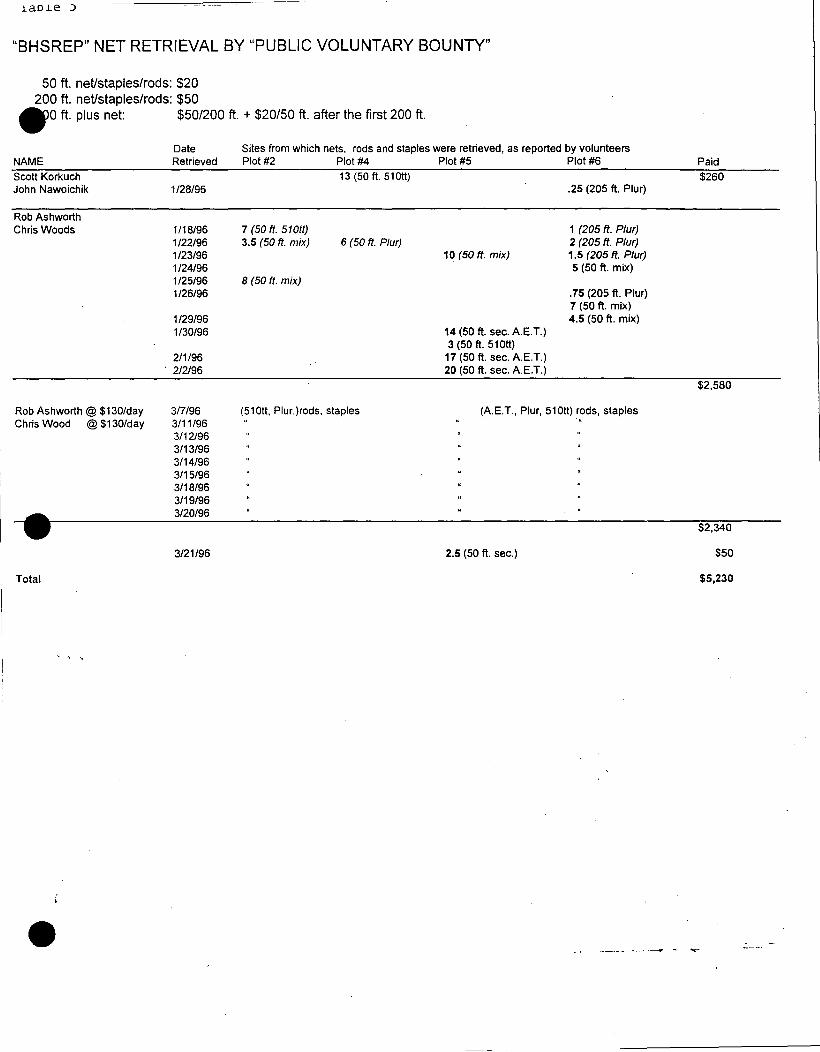
net bounty program was $5,230 and these are itemized in Table 5. In addition to the bounty
program, Barnstable DNR committed 170 hours of salaried time for net removal (Table 4 ).
The total cost for deploying and removing clam tents on the four flats in Barnstable
Harbor can be calculated in two different ways, depending on how one handles the labor
·volunteered in the beginning of the program. If the 810 hours of volunteer labor is charged off at
$15.00 per hour then the total cost per acre for placing clam tents on the four plots and removing
them, including materials costs, was approximately $7,500. If the volunteer labor is not charged
off then the cost per acre is approximately $3,900. These costs are rough estimates due to the
fact that included in the labor tally is the time volunteered to cultivate the flats as welt as the
time dedicated to placing tents. The record keeping did not differentiate between labor
commitments based on each task completed.
A listing of general observations made for each of the experimental sites is included in
Table 6. In general, observations indicated that sediment deposition beneath the netted areas
occurred at all plots except Eel Grass Cove. This could be an indication ofthe relative levels of
water movement at each of the sites, where Eel Grass Cove was an area of relatively quiescent
water. Sediment deposition was observed as an i~c'rease in sediment elevation beneath the
netted areas, sometimes approaching a maximum of 6-8 inches of new sediment. This suggests
that bedload transport of sediment, and potentially other particles such as small clams, occurs
routinely in many areas within Barnstable Harbor. The presence of the net tents succeeded in
reducing sediment movement at the netted sites and enhanced particle deposition on site. As a
follow-up to these observations, a WHOI scientist (Dr. Lauren Mullineaux) has had a Sea Grant
proposal funded to investigate the potential for bedload transport as an important mechanism in
soft shell clam dispersal in Barnstable Harbor, scheduled to begin in 1997.
10
•
•
•

•
•
•
The Research Component:
The results of the research component of the Barnstable Harbor Shellfish Recruitment
Enhancement Project are summarized and discussed as follows.
The sediment structure was monitored throughout the experimental time period.
Samples were collected to measure changes in the depth ofthe anaerobic horizon, changes in the
particle size composition of the sediment at the sediment surface and at one inch depth, and
changes in the total organic content of the surface layer of sediment within each of the
experimental plots at each of the four sites. The samples collected for sediment particle size
analysis and for organic analysis are currently archived in a freezer at -10°C at Woods Hole
Oceanographic Institution. At present, there are no compelling reasons to expend the time to
analyze the sediment characteristics. The only site to actively recruit soft shell clams was a site
where the treatment was to apply a net tent with no sediment manipulation. Therefore, the
sediment characteristics within this treatment would have minimally changed during the course
of the experiments. Because analyzing the sediment characteristics is a labor intensive
procedure, the results of this study does not warrant this expenditure of time .
The one sediment character that was routinely monitored was change in the depth of the
anaerobic horizon due to the experimental flat manipulations. The results from this analysis are
summarized in Table 7. The depths of the anaerobic horizon were compared between sites,
between times, and between treatments using a three-way analysis of variance (ANO VA)
technique. Significant differences were noted in the depth of the horizon when comparisons
were made between locations (Table 7-B 1 ), times (Table 7-82), and a two-way interaction
between location and time (Table 7-84). Due to variability in the sediment composition and
water flow patterns at each site, it is not surprising that differences were noted between
locations. It is interesting to note, although not unexpected, that the plots with the highest tidal
flow rates (Huckins Island and Green Point) had the deepest anaerobic horizons. Differences in
the horizon between times of measurement may be the result of changes in ambient temperature,
although the largest difference is between the start of the experiments and two weeks following
treatment. One would be tempted to prescribe the observed differences in depth of the horizon
11

as the result of the manipulations to the flats but this is not supported by analysis of the data. No
differences were noted between treatments (Table 7-BJ; p=0.258) or between the interaction of
time and treatment (p=0.157). These data further support the conclusion not to carry on with the
analyses of the sediment characteristics. Because no treatment differences were observed, it is
unlikely that changes in sediment characteristics influenced the one successful set of clams
observed. The interpretation of the results concerning differences in the depth of anaerobic
horizon between sites and times would require a more complete study to ascertain why these
differences were observed.
Changes in soft shell clam density throughout Barnstable Harbor due to experimental
manipulations of the clam flats are summarized in Table 8. Clam densities at the start ofthe
experimental period were low at all sites, averaging 4.5 clams per ft2 , with a range from 1. 7
clams/ft2 at Eel Grass Cove to a high of9.9 clams/ft2 at The Co~e. Massachusetts Division of
Marine Fisheries sets a criteria of a minimum of three clams per ft2 as a threshold for a
productive flat. The average density for all sites during the Fall 1995 sampling time was 3.1
clams per ft2, probably not significantly different from densities at the start of the experiment
( 4.6 clams/ft2), based on the variability in the observed density. The density in the Fall of 1995
ranged from a low ofO clams/ft2 at Huckins Island and The Cove to a high of 12.2 clams/ft2 at
Green Point. After one and one-half years post-treatment, the average density of soft shell clams
at all of the sites was 0.7 clams/ft2, significantly lower than that observed the previous year. The
range at this time was from a low of 0 clams/ft2 at Huckins Island, Eel Grass Cove, and The
Cove to a high of 2. 7 clams/ft2 at Green Point. On the whole, none of the treatments appeared to
have an effect on promoting recruitment and survival of young of the year soft shell clams. The
one exception to these observations was noted at Plot # 5 - Green Point in squares one and eight
and this will be discussed below.
The size frequency distribution of the clams sampled at the start of the experiments at all
four sites were very similar (Figure 6). Therefore the size frequency data from all sites were
combined (Figure 7) to demonstrate the size composition of the clam population in Barnstable
Harbor prior to this experiment. As demarcated in Figure 7, the population structure of soft shell
12
•
•
•

•
•
•
clams in the smaller valve size ranges (5-18 mm) can be identified as two specific recruitment
events during the previous year, corresponding to a spring and a fall set in 1994. Individual
cohorts of clams can routinely be identified shortly after recruited but, as the clams grow, the
individual variability in growth rates results in the lose of one's ability to follow the cohort as it
grows beyond the first or second year post-set.
The size distribution presented in Figures 6 and 7 demonstrate an important consideration
when investigating soft shell clam recruitment in Barnstable Harbor. It is very interesting to note
that no clams larger than a valve length of 30 mm were found at any of the sites sampled, even
though none of the sites had been commercially or recreationally harvested in the recent past.
For some unexplained reason clams were not surviving long enough at these sites to grow to
legal size (slightly larger than 50 mm). A number of theories could be put forth to explain this
phenomenon, including inadequate food resources or high predation pressure, but the important
point to note is that although the clam densities met the MaDMF criteria as productive flats, the
reality is that the productivity of the flats sampled proved to be zero based on producing a
harvestable resource, for none of the resource grew to a harvestable size .
Sets of bivalves, other than soft shell clams, were observed at many of the sites. For
example, high densities of the false angel wing clam (Petricola pholadiformis) were observed
under netting at The Cove, as was a large set of the jellybean clam (Solemya velum). Also a
large set of blue mussels (Mytilus edulis) was observed on the netting at Huckins [sland.
As noted above, on the whole there was no net increase in the population densities of
soft shell clams in any of the experimental manipulations. A lack ofyoung ofthe year clams
throughout Barnstable Harbor (T. Marcotti, personal observation) suggests that 1995 was a poor
year for soft shell clam recruitment on the Massachusetts Bay side of Cape Cod. This has
subsequently been confirmed by town shellfish biologists throughout Cape Cod. In an attempt to
confirm a lack of a strong recruitment yeiu within Barnstable Harbor, core samples were
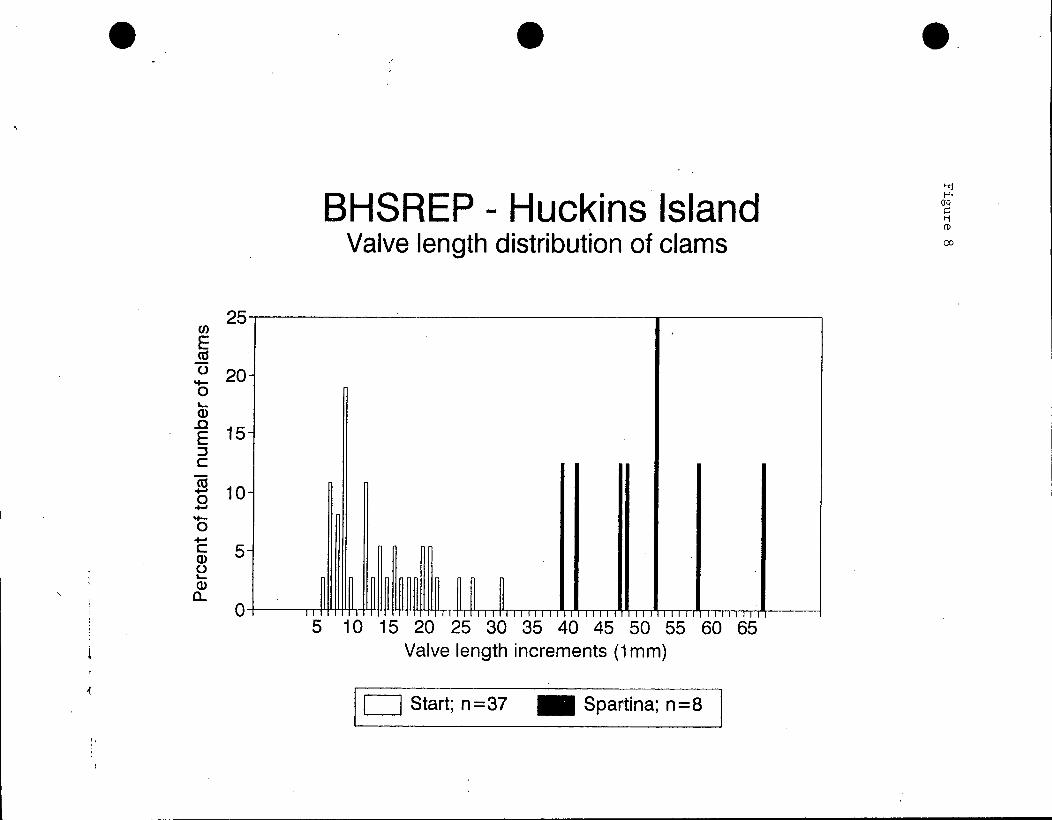
collected within the Spartina island located next to the experimental site on Huckins Island
during the Fall 1995 sampling interval. The Spartina islands on Huckins Island routinely
accumulate clam set if one occurs within the harbor. As can be observed in Figure 8, there were
'·
13

no small clams found in the Spartina bed on Huckins Island when sampled in November 1995
(solid black bars) although many small clams were present during sampling of this area in the
Spring of 1995 (open white bars) prior to the start of the experiment. The size distribution
within the Spartina bed in the Fall 1995 started at the 40mm size range and progressed up into
larger legally harvestable clams. The larger clams sampled in Fall 1995 reflect the anticipated
growth rate of the 1994 year class identified during the Spring 1995 sampling. The soft shell
clam set for 1995 was not apparent in the Spartina islands of Huckins confirming that the last
good year for soft shell clam recruitment in Barnstable Harbor was 1994.
The one exception to the observation of a lack of strong soft shell clam recruitment in
Barnstable Harbor in 1995 was detected under the Plurima netting on experimental square eight
at Green Point during the Fall 1995 sampling jJeriod and squares one and eight during the Fall
1996 sampling period. A large set of clams under the tents on square eight resulted in
approximate clam densities of greater than 109 clams per ft2 in Fall 1995. This population of
clams sustained itself during the ensuing year resulting in a final density of more than 12
•
clams/ft2 in Fall 1996 (Table 8). In addition, during the Fall 1996 sampling interval, an parallel •
occurrence of the same set was detected under the Plurima netting deployed in square one at
Green Point. For unexplainable reasons, the set on square one was not detected during the Fall
1995 sampling interval. The sampling protocol during Fall 1995 was single cores at each
experimental square unless clams were detected during a preliminary visual inspection and this
may have contributed to missing the set during the initial evaluation.
The size frequency distribution for the soft shell clams sampled by replicated cores in
square eight at Green Point during the one and one-half year sampling period is reported in Table
9 and Figure 9. The cohort of clams observed within experimental squares one and eight at
Green Point originated from one recruitment event during the summer of 1995, probably the first
(spring) set in May-June immediately after setting the tents. This observation is based on the
relative size of the clam set as related to the time of sampling and compared to the size
frequency distribution of the clams collected at the beginning of the experiment (Figures 6 and
7). The clams in the cohort observed at Green Point in Fall 1995 (Figure 9A) and proposed to be
14 / ,•
•

_.3o,. ·- -- --· .. ·----··--- ---
.- from the Spring 1995 set were the same size as the clams observed in the May 1995 sampling
and determined to be from the Fall 1994 set.
•
•
The size frequency distribution measured on the same cohort of clams one year later, Fall
of 1996, shows some startling results (Figure 9B). The mean valve length ofthis cohort is now
greater than 71 mm in length, growing from a mean length of 6.3 mm, eleven months prior to
this collection (Table 9). This indicates that the clams recruited onto Green Point during the
spring of 1995 had grown to a harvestable size (greater than 50 mm) in approximately one year.
This growth rate for soft shell clams is the fastest rate of growth the authors have observed in
soft shell clam populations anywhere within the Cape Cod region.
Conclusions:
Overall, the results from the present study allow for guarded optimism in the efficacy of
using human intervention to promote soft shell clam recruitment in Barnstable Harbor.
Although, on the whole, 1995 is suspected to have been a poor year for soft shell clam
recruitment throughout the Massachusetts Bay side of Cape Cod, we were able to significantly
enhance the set of soft shell clams at one site in the harbor due to flat manipulation. The
replicated sample manipulation that used the Plurima-type plastic netting, with a 1/4 inch mesh
size, enhanced the set of soft shell clams at one site in Barnstable Harbor. In addition, the
population of clams that recruited under the clam tent were able to grow to a harvestable size
within one year. Although the clams' growth rate was very fast at the experimental site, this was
not a result of the experimental manipulations; but it does indicate the site is very good for
sustaining clam growth if recruitment can be realized.
Cultivating the sediment as a means to promote soft shell clam recruitment did not prove
to be effective during this study. Neither did the use of a larger mesh size plastic netting (51 0tt
netting) or combining the 51 Ott netting with substrate cultivation. It can not be irrefutably
concluded that these techniques will not work to promote shellfish recruitment as on the whole
soft shell clam recruitment was so poor in 1995. More research should be conducted to confirm
15

the lack of efficacy of substrate cultivation and other types of plastic netting as a means to
reintroduce and promote clam stocks in the harbor.
MacKenzie ( 1979) has suggested that for a management procedure to be incorporated
·into a management program it must meet five criteria. These criteria are:
1) it must meet an urgent need,
2) it must be technically a.nd operationally feasible,
3) it can offer no damaging risks to the flats,
4) it can't impinge on other interests,
5) it must yield a return that exceeds the primary investment.
Flat manipulation to promote recruitment of the soft shell clam potentially fulfills each of these
five criteria. It may be an appropriate choice as a component ofthe Town of Barnstable's
shellfish management program
Given the history of soft shell clam harvests in Barnstable Harbor relative to the present
•
rate of commercial harvesting, it is evident that there is an urgent need to understand and •
enhance clam recruitment within the harbor (criteria 1 ). Areas of the harbor that have supported
extensive harvesting efTorts during the 1940's through the 1960's are now barren. The
commercial shellfishing industry in Barnstable needs technical and managerial assistance to
allow the industry to thrive in the town rather than subsist. •
The data presented to date adequately demonstrates the technical and operational
feasibility of projects such as cultivation and "tenting" the clam t1ats (criteria 2). Although the
program was not ideal during this .initial attempt, the regulatory and technical managers have
demonstrated that a flat manipulation program can be organized and undertaken within the
community. Relying on strictly volunteer labor will require rethinking but is not completely out
ofthe question. A combination of volunteer efforts and paid assistance, as the present program
has evolved into, may be the more appropriate means to undertake enhanced recruitment efforts
for the Town of Barnstable.
No adverse environmental impacts were noted in the short-term during the initial
cultivation and net deployment steps (criteria 3). There was nothing observed that suggests these
16
•

•
•
•
_ _,., ·- ..---- ---..---·
techniques offer any long-term risk to the flats or the surrounding environment either. There
were no reported incidents of impact on other organisms, such as the endangered diamondback
terrapin nor did the flat manipulations seem to change the overall faunal structure of the flats.
The one major concern with respect to environmental insult revolves around removing the
deployed clam tents expeditiously in the fall. It is evident that relying on volunteer labor is
inappropriate for this type of project. It is imperative that the netting be removed before the
winter months as ice and winter storms can wreak havoc on the netting by moving it all around
the harbor. Therefore, if this type of flat manipulation is to be incorporated into a clam
management program, careful attention must be paid to planning for guaranteed net removal
during the late fall. and ensuring that it occurs.
Flat manipulations, such as those tested in this study, are relatively innocuous techniques
that have very little possibility of impinging on other user interests (criteria 4). This statement is
supported by the observation that little to no user conflicts occurred during the manipulations in
the present study. The only known interaction between the flat manipulations and other users
was minor damage done to the nets on two experimental squares at Huckins Island due to a
recreational boater cutting across the flats at too shallow a tidal stage. This damage was
inconsequential to both the experimental project and the recreational boater.
The economic success ofthe project is unmeasured at this point (criteria 5). We have
observed enhanced recruitment at one site and the clam population survived and grew to a
harvestable size. Using a back of the envelope calculation, based on the recruitment data
observed during this study (Table 8), one could argue that the technique of placing clam tents on
the flats may provide significant economic benefit in terms of harvestable returns to the shellfish
industry in the Town of Barnstable (Table 10). lfrecruitment could be enhanced routinely in a
·predictable way then the economic return per acre of manipulated flat would be$ 37,925. Given
an economic multiplier of three, representing the cost benefit of the income derived on the flats
to the town in increased business and derived from a recent economic analysis of the soft shell
clam fishery in Casco Bay, Maine, the economic benefit to the Town of Barnstable per acre of
flat netted could reach$ 113,775 .
17
...,.._. ~. --- ·- -----··
Using clam tents as a means to promote soft shell clam recruitment in Barnstable Harbor
has been shown to have potential as a management tool. However, more research will be needed
to understand where and how this technique can be used most effectively in the harbor. It is
obvious that the scale of manipulations attempted during the present program was far beyond
that needed to test the etTectiveness of flat manipulations to recruit soft shell clams. In an
attempt to fine tune the manipulation techniques, the authors would like to recommend that
these techniques should continue to be tested on a much smaller scale. Any research effort
should be directed primarily at testing the engineering and placement of clam tents although
more work is required to justify dismissing substrate cultivation as an alternate means for
restocking clams.
In closing, we have included a document published by the Merrimack Valley Planning
Commission in November 1995 that outlines a shellfish enhancement research project that was·
instituted in the towns of Ipswich and Gloucester. The North Shore Shellfish Enhancement
Project is a near mirror image to the Barnstable Harbor Shellfish Recruitment Enhancement
Project (even the names are similar) and was conceived and undertaken entirely independent to
the BHSREP. A classic example of convergent evolution of shellfish management programs.
. 18
•
•
•

•
•
•
References:
Beal, B.F. 1990. Biotic and abiotic factors influencing the recruitment of soft-shell clams, Mya arenaria L., to soft-bottom intertidal areas in downeast Maine. J. Shellfish. Res. 8:455.
Godcharles, M.F. 1971. A study ofthe effects of a commercial hydraulic clam dredge on benthic communities in estuarine areas. Tech. Ser. 64. FL. Dept. Nat. Resources, Research Lab., St. Petersburg, FL. 51 pgs.
Haven, D. 1970. A study of hard- and soft-shell clam resources of Virginia. U.S. Fish and Wildt. Serv., Commer. Fish. Res. Dev. Act. Annual Rpt. 69 pgs.
Kellogg, J.L. 1903. Conditions governing tpe existence and growth of the soft clam (Mya arenaria). Report ofthe Commisioner. U.S. Comm. ofFish and Fisheries. 29:195-224.
Kyte, M.A., P. Averill, and T. Hendershott. 1975. The impact of the hydraulic escalator shellfish harvester on an intertidal soft-shell clam flat in the Harraseeket River, Maine. Project Completion Report. Dep. Mar. Res. Augusta, ME .
Kyte, M.A. and K.K. Chew. 1975. A review of the hydraulic escalator shellfish harvester and its known effects in relation to the soft-shell clam, Mya arenaria. Washington Sea Grant Program. WSG 75-2. 32p.
MacFarlane, S.L. 1983. Harvesting clams with a pump- the effects on the seed. A Report to the Town of Orleans Shellfish Department, Orleans, MA. 7p.
MacKenzie, C.L., Jr. 1979. Management for increasing clam abundance. Mar. Fish. Rev. 41:10-22.
Newell, C.R. 1983. Increasing clam harvests in Maine: a practical guide. Maine/New Hampshire Sea Grant College Prog. TR-MSG83-3
Newell, C.R. and H. Hidu. 1986. Species profiles: life histories and environmental requirements of coastal fish and invertebrates (North Atlantic) - soft shell clam. U.S.F.W.and U.S.A.C.O.E. Biological Report 82 (11.53). TR EL-82-4. 17p.
Pfitzenmeyer, H.T. 1962. Periods of spawning and setting ofthe soft-shelled clam,Mya areizaria, at Solomons, Maryland. Chesapeake Scientist 3:114-120.
Rankin, K.L., L.S. Mullineaux, and W.R. Geyer. 1994. Transport of juvenile gem clams (Gemma gemma) in a headland wake. Estuaries 17:655-667 .

•
•
•
Rask, H.K. 1986. The effect of hydraulic harvesting on sediment characteristics related to shellfish abundance. A Report to the University of Massachusetts Cooperative Extension Service, Barnstable, MA. 8p.
Rowell, T.W. and P. Woo. 1992. Predation by the nemertean worm, Cerebratulus lacteus Verrill, on the soft-shell clam, Mya aenaria Linnaeus, 1758, and its apparent role in the destruction of a clam flat. J. Shellf Res. 9:291-297.
Schwind, P. 1977. Practical Shellfish Farming. International Marine Publishing Company, Camden, ME. 91p.
Turner, H.J. 1953. A review ofthe biology of some commercial molluscs ofthe east coast ofNorth America. Sixth Rpt. Invest. Shellfisheries of Mass. Dept. Nat. Res., Div. Mar. Fish. Boston, MA pp. 39-74 .

•
•
•
List ofTables:
Table 1: A timeline of the BHSREP project from conception to final report.
Table 2: Estimated materials costs and area netted for Huckins Island and The Cove in the BHSREP program.
Table 3: Estimated materials costs and area netted for Green Point and Eel Grass Cove in the BHSREP program.
Table 4: Estimates of total labor used during the course of the BHSREP project.
Table 5: Tally of costs associated with the net bounty program instituted to complete the net removal from the clam flats.
Table 6: A list of general observations made during the duration of the BHSREP project.
Table 7: The depths of the anaerobic horizon at the four experimental sites during the three sampling periods defined within the BHSREP project. A) the raw data~ Bl) mean depth of the anaerobic horizon reported by site~ 82) mean depth of the anaerobic horizon reported by time sampled; B3) mean depth of the anaerobic horizon reported by treatment; B4) mean depth of the anaerobic horizon reported by site and time.
Table 8: A summary of the clam density data within the experimental sites during all sampling periods.
Table 9: The size frequency and mean size data for clams collected at Plot #5 (Green Point) experimental square eight during the three sampling periods.
Table 10: A back of the envelope estimate of the economic return for placing clam tents on Green Point, based on the observed recruitment success at the site in Fall 1996 .
. - ·---- -- ........ - _ ____,., - 1$.

•
•
•
01-31-95
02-08-95 02-14-95 02-21-95 02-28-95 04-04-95
04-08-95 04-11-95 04-19-95
04-20-95 04-21-95 04-22-95
04-23-95
04-25-95 04-26-95 04-28-95 04-29-95
'04-30-95 05-03-95
05-06-95
Table 1: Barnstable Harbor Shellfish Recruitment
Enhancement Project (BHSREP) Timeline of Project
Meeting at W.H.O.I between Peter Jasin and Dale Leavitt conception of BHSREP.
Dale Leavitt met with Barnstable DNR to discuss BHSREP. DNR filed N.O.I. with Conservation Commission. DNR filed N.O.L with Ma D.E.P. Meeting at DNR to discuss project. Surveyed{5) BHSREP field sites with Grant Kelly, A.C.O.E; Dale Leavitt, W.H.O.L; Darcy Munson, Con. Comm.; Peter Jason, B.S.A.; a representative from N.M.F.S.; Thomas Marcotti, D.N.R.; Mark Forrest, Rep. Studd's office. Prepared approx. (54) 50ft. nets. Met with Barnstable Conservation Commission. Prepared bridges, staples and floats .. Met with Barnstable Shellfish Association at Sturgis Library. Prepared nets, bridges, staples and floats. Prepared nets, bridges, staples and floats. Huckins Island Flat (Plot #2): Harrowed; (20) sediment cores obtained on (10) expt'l squares (sample H-1); fauna sampled; expt'l squares #1 and #3 netted. Huckins Island Flat (Plot #2): Expt'l squares #4, #6, #8, and #10 netted; (22) other nets deployed . Green Point Flat (Plot #5): (10) sediment cores obtained on (10) expt'l squares (sample G-I); fauna sampled; expt'l squares # 1, #2,#8 and# I 0 netted. Prepared nets, bridges, staples and floats. Prepared nets, bridges, staples and floats. Prepared nets, bridges, staples and floats. Prepared nets, bridges, staples and floats. Green Point Flat (Plot #5): Harrowed. Prepared nets, bridges, staples and floats. Prepared nets, bridges, staples and floats. Huckins Island Flat (Plot #2): ( 19) 50ft. nets deployed. Eel Grass Cove Flat (Piot-#6): Expt'l squares surveyed and staked~ Prepared nets, bridges, staples and floats. Huckins Island Flat (Plot #2): (I 0) sediment cores obtained on expt'l squares (sample H-II). Eel Grass Cove Flat (Plot #6): Harrowed, (IO) sediment cores obtained on (10) expt'l squares (sample E-I); fauna sampled. Green Point Flat (Plot #5): (I 0) 50ft. ne~s deployed .
• --- ______ .... _____ _., - "'C""

•
• '.'
•
05-07-95 05-17-95
05-19-95 05-20-95
05-27-95
06-17-95
06-18-95 06-27-95 07-02-95
-weekly-11-19-95
11-30-95
12-12-95 I2-17-95
01-01-96 01-09-96 03-21-96 10-08-96
I1-15-96 OI-17-97
Eel Grass Cove Flat (Plot #6): ( 18) 50ft. nets deployed on expt'l squares. Green Point Flat (Plot #5): (I 0) sediment cores, collected on ( 1 0) ·expt'l squares (sample G-Il); A. E. T. netting deployed. Prepared nets, bridges, staples and floats. The Cove Flat (Plot #4): Harrowed, sample squares surveyed and staked. Green Point Flat (Plot #5): A. E. T. netting deployed. Eel Grass Cove Flat (Plot #6): (10) sediment cores obtained on expt'l squares (sample E-ll).
The Cove Flat (Plot #4): Harrowed, (10) sediment cores obtained on (10) expt'l squares (sample C-I); fauna sampled; (2) expt'l squares netted. The Cove Flat (Plot #4): (2) expt'l squares netted. The Cove Flat (Plot #4): (2) expt'l squares netted. The Cove Flat (Plot #4): (10) sediment cores obtained on (10) expt'l squares (sample C-II).
Visited field sites to check on integrity of net systems. Huckins Island Flat (Plot #2): (10) sediment cores obtained on (10) expt'l squares (sample H-Ill), fauna sampled.
The Cove Flat (Plot #4 ): ( 10) sediment cores obtained on ( 10) expt'1 squares (sample C-III); fauna sampled.
Green Point Flat (Plot #5): (10) sediment cores obtained on ( 10) expt'l squares (sample G-Ill); fauna sampled.
Met with Barnstable Conservation Commission to discuss progress ofBHSREP. Eel Grass Cove Flat (Plot #6): (10) sediment cores obtained on (10) expt'l squares (sample G-Ill); fauna sampled . Barnstable DNR established bounty system to expedite net removal from flats. Preliminary report submitted to Barnstable DNR. Last net removed from flats in bounty program. Visited field sites to check on clam densities: replicated cores at squares I and 8 at Green Point Flat (Plot #5) for faunal analysis. Draft final report submitted to Barnstable DNR. Final report submitted to Town of Barnstable.·
. - ---- ~------ _,.._....., - ~

•
•
•
Huckins Island Flat (Plot #2) Equipment Costs and Acreage Netted
I Equipment Type #Units Equipment Type/Cost Total Cost
15ft. end rods 118 1/4in. mild steel @ $0.0555/ft. $98.24 15ft. bridge rods 246 $204.80 34in. bridge supports 246 $36.41 27in. rod staples 806 $100.65 30in. wire staples 2,360 9 gauge wire @ $0.0324/ft. $191.16 7.5 oz. floats 324 7.5 oz. floats @ $0.26 each $84.24 51 Ott430(14'X50'net) 37 51 Ott430 net @ $0.0362/sq. ft. $937.58 Plurima (13'X50'net) 22 Plurima net @ $0.0469/sq. ft. $670.67
I Total Cost I $2,323.75
Acreage Netted: 51 Ott430 net 25,900 sq. ft. 0.595 acres Plurima net 14,300 sq. ft. 0.328 acres
I Total 140,200 sq. ft. I 0.923 acres
The Cove Flat (Plot #4) Equipment Costs and Acreage Netted
I Equipment Type #Units
15ft. end rods 36 15ft. bridge rods 141 34in. bridge supports 87 27in. rod staples 216 30in. wire staples 720 7. 5 oz. floats 54
· , ·510tt430 (14'X50'net) 12 Plurima (13'X50'net) 6
Acreage Netted: 51 Ott430 net Plurima net
I Total
Equipment Type/Cost Total Cost
1/4in. mild steel @ $0.0555/ft. $29.97 $117.38 $13.68 $26.97
9 gauge wire @ $0.0324/ft. $58.32 7.5 oz. floats @ $0.26 each $14.04 510tt430 net@ $0.0.362/sq. ft. $304.08 Plurima net @ $0.0469/sq. ft. $182.91
I Total Cost I $747.35
; 8,400 sq. ft. 3,900 sq. ft.
112,300 sq. ft.
0.19 acres 0.09acres
I 0.28 acres
- ---- ----- -- _ ..... ___ --....<~# - ~

Green Point Flat (Plot #5) Equipment Costs and Acreage Netted
I Equipment Type #Units Equipment Type/Cost Total Cost
• 15ft. end rods 46 1/4in. mild steel @ $0.0555/ft. $38.30 15ft. bridge rods 190 $158.18 34in. bridge supports 171 $26.89 27ih. rod staples 350 $43.71 30in. wire staples 4,368 9 gauge wire @ $0.0324/ft. $353.81 7.5 oz. floats 828 7.5 oz. floats @ $0.26 each $215.28 510tt430 ( 14'X50'net) 16 510tt430 net@ $0.0362/sq. ft. $405.44 Plurima (13'X50'net) 6 Plurima net @ $0.0469/sq. ft. $182.91
(13'X205'net) 1 $124.87 A.E.T.6155(1 O'X1 OO'net) 1 A.E.T.6155 @ $0.0189/sq. ft. $18.90
(1 O'X275'net) 3 $155.93 (1 O'X300'net) 4 $226.80 {10'X312'net) 2 $117.94 (1 O'X375'net) 1 $70.88 (1 O'X475'net) 1 $89.78 (1 O'X560'net) 1 $105.84
I Total Cost I $2,335.46 I Acreage Netted: 51 Ott430 net 11,200 sq. ft. 0.257 acres
Plurima net 6,565 sq. ft. 0.151 acres
• A.E.T.6155 net 41,590 sq. ft. 0.955 acres I Total I 59,355 sq. ft. 11.363 acres
Eel Grass Cove Flat (Plot #6) Equipment Costs and Acreage Netted
- , ,j Equipment Type #Units Equipment Type/Cost Total Cost
•
15ft. end rods 15ft. bridge rods 34in. bridge supports 27in. rod staples 30in. wire staples 7.5 oz. floats 510tt430 (14'X50'net) Plurima (13'X50'net)
(13'X205'net)
64 254
:254 416 2,272 144 18 6 8
Acreage Netted: 51 Ott430 net Plurima net
I Total
1/4in. mild steel @ $0.0555/ft.
9 gauge wire @ $0.0324/ft. 7.5 oz. float @ $0.26 each 510tt430 net@ $0.0362/sq. ft. Plurima net @ $0.0469/sq. ft.
I Total Cost
$53.28 $211.46 $39.94 $53.87 $184.03 $37.44 $456.12 $182.91 $998.96
1 $2,218.o1
12,600 sq. ft. 25,220 sq. ft.
0.289 acres 0.579 acres
I 37,820 sq. ft. I 0.8.68 acres .. __ - T"l

Table 4: Estimates of total labor used in the Barnstable Harbor Shellfish· • Recruitment Enhancement Project (BHSREP).
average total total number of volunteer salaried
Task volunteers hours hours per day
1 ) Prepare nets, bridges, staples and floats 7.4 278 34 (12 days)
2) Huckins Island- tilling and netting (3 days)
20.0 290 17
3) Green Point - tilling and netting 6.0 91 7 (4 days)
4) The Cove - tilling and netting 4.0 56 24 (4 days)
5) Eel Grass Cove- tilling and netting 6.0 66 8 • (3 days)
6) Sample collection __LQ _TI 33 (11 days)
SUBTOTAL 814 h 123h
7) Collection of net from the flats
TOTAL 814 h 293 b
* collected under bounty system
• . --- ·------ ___ .... __ . ··- - .....
1aoJ.e ::>
"BHSREP" NET RETRIEVAL BY "PUBLIC VOLUNTARY BOUNTY"
50 ft. net/staples/rods: $20 200 ft. net/staples/rods: $50
.0 ft. plus net: $50/200 ft. + $20/50 ft. after the first 200 ft.
Date Sites from which nets, rods and staples were retrieved, as reported by volunteers NAME Retrieved Plot #2 Plot#4 Plot #5 Plot #6
Scott Korkuch 13 (50 ft. 51 0tt) John Nawoichik 1/28/96 .25 (205 ft. Plur)
Rob Ashworth Chris Woods 1/18/96 7 (50 ft. 51 Ott) 1 (205 ft. Plur)
1/22/96 3.5 (50 ft. mix) 6 (50 ft. Plur) 2 (205 ft. Plur) 1/23/96 10 (50 ft. mix) 1.5 (205 ft. Plur) 1/24/96 5 (50 ft. mix) 1/25/96 8 (50 ft. mix) 1/26/96 .75 (205ft. Plur)
7 (50 ft. mix) 1/29/96 4.5 (50 ft. mix) 1/30/96 14 (50 ft. sec. A.E.T.)
3 (50 ft. 51 Ott) 2/1/96 17 (50 ft. sec. A.E.T.)
. 2/2/96 20 (50 ft. sec. A.E.T.)
Rob Ashworth @ $130/day 3/7/96 (510tt, Plur.)rods, staples (A.E.T., Plur, 51 Ott) rods, staples Chris Wood @ $130/day 3/11/96 "
3/12/96 3/13/96 3/14/96 3/15/96 3/18/96 3/19/96 3/20/96
3/21/96 2.5 (50 ft. sec.)
Total
•
Paid
$260
$2,580
$2,340
$50
$5,230
~ ·- ---- ___ .... __ - _ ___., - *'C-

•
•
Table 6:
Barnstable Harbor Shellfish Recruitment
Enhancement Project (BHSREP):
General Observations
1)1/lyanassa congregated on nets at all sites- potential predator?
HUCKINS ISLAND FLATS
1) squares 1, 3, & 4 collected coarse grained sediment under nets without being buried
(3-4" build-up)
2) sedimentation pattern continued in the extra squares all along south edge
3) early in season minor build up of drift algae (primarily Codium)- snagged by nets
4) squares 8 & 10 (plurima netting) had mussel (Mytilu<; edu/is) set on them without much
sedimentation but with brown alga (> 1 mm first Aug=> approximately 40 mm in mid Nov.)
5) bamboo worms (Clymene/la spp.) colonized under extra plots similar to pattern of sedimentation
6) Minor damage to two nets- cut by local boat traffic
THE COVE
l) Ruppia growing under nets on north side of experimental squares during August
2) sedimentation occurring mid-Sept. onward ( 1" build-up)
, , . 3) diatoms (microalgae) observed on all nets by end of August which collected fine particles in
matrix- occluded net
4) no macroalgal build-up
5) Petri cola set in squares 5 & 10 (northern most pi ots in Ruppia area)
6) Solemya velum set in square 8
7) historically productive area with large numbers of 3-5" boxes
• --- -··- ------- _ ____., - .......

•
•
•
GREEN POINT
1) no macroalgal build-up
2) sedimentation on NE end and most extreme SE end (l-2" in Aug =>2-3" inNov.), fine grained
3) sedimentation in square l was coarse grained under netting (4-5")
4) high current area obvious
5) square 8a (Plurima w/ floats) had clam set under it
6) microalgae build-up similar to THE COVE on all nets (particularly on bridged nets)
7) historically productive area
EEL GRASS COVE
1) minimal sedimentation at all sites
2) net maintenance easiest (low flow area)
3) dispersed brown macroalgal build-up usually where net in contact with substrate - started here the
earliest (late July)
4) Enteromorpha in early July around edges and gone by Sept.
. ··- --~--~ ___ _.. _____ __.., -- ..........

Table 7
Barnstable Harbor Shellfish Recruitment Enhancement Project
• A) Anaerobic Horizon Data Start
Treatment depth Square horizon
(inches)
Plot# 2: Huckins lslan 22 April 1 51 0tt 2.50 2 1.75 3 51 0tt 1.38 4 T +51 0tt 1.63. 5 Tilled 1.25 6 T +51 0tt 1.38 7 Tilled 1.13 8 Plurima 0.88 9 0.75 10 Plurima 1.07
Plot #4: The Cove 17 June 1 Tilled 0.50 2 Plurima nd 3 T + 510tt 0.38 4 51 0tt 0.25 5 51 0tt 0.88 6 Tilled 0.50 7 0.25 8 T +51 0tt 0.50 • 9 0.50 10 Plurima
Plot #5: Green Point 23 Apr 1 Plurima nd 2 51 0tt nd 3 T + 510tt 1.25 4 Tilled 1.50 5 T+510tt 1.00
· .. ·' 6 1.50 7 2.00 8 Plurima 1.00 9 Tilled 1.00 10 Plurima 2.00
Plot #6: Eel Grass Cov 6 May 1 Plurima 0.75 2 Plurima 0.50 3 0.38 4 T +51 0tt 0.38 5 Tilled 0.88 6 T + 510tt 0.75 7 510tt 0.50 8 51 0tt 1.13 9 0.88 10 Tilled 0.63
•
2 Weeks Fall depth depth
horizon horizon (inches) (inches)
6 May 19 Nov 0.75 0.50 0.75 1.00 0.75 1.25 0.88 2.00 0.38 1.00 1.00 0.63 0.38 0.63 0.75 2.00 0.38 0.75 0.88 0.50
2 July 30 Nov 0.50 0.75 0.38 0.38 0.25 0.75 0.88 1.00 0.63 0.63 0.50 0.63 0.75 0.50 0.50 1.00 1.00 0.50 0.50 0.50
17 May 30 Nov 1.75 0.50 1.00 0.50 1.25 1.25 1.25 1.00 0.50 nd 1.63 0.75 1.25 1.00 1.63 1.00 1.13 0.50 1.25 nd
27 May 17 Dec 0.50 0.75 0.63 0.50 0.50 0.63 0.38 0.50 0.63 0.50 0.50 0.50 0.38 1.00 0.50 1.25 1.00 1.00 0.75 0.50
.. '
B) Anaerobic Horizo n Data Summary
!,§vel
1) by Plot Huckins Island The Cove Green Point Eel Grass Cove
2) by Time Start 2 weeks after Fall, 1995
3) by Treatment control tilled tilled + 51 Ott 51 0tt Plurima
4) by Plot and Tim
Plot=> Time Huckins Island
The Cove
Green Point
Eel Grass Cove
Mean Std Dev Depth
{tnc!Jl
[ different ( <0.001)] 1.03 0.52 0.58 0.22 1.17 0.43 0.65 0.24
_I different ( 0.98 0.78 0.38 0.80 0.38
[ not different (p=0.258)) 0.89 0.46 0.77 0.32 0.83 0.46 0.95 0.53 0.82 0.46
[different (p<0.001)] Mean
Std Dev}
. --·- -·---···-···- -· ~

Table 8
Barnstable Harbor SheiHish Recruitment Enhancement Project
• Summary of clam density data
Before Exp't Fall1995 Fall1996 (23 April 1995) (30 November) (8 October)
mean mean mean mean mean mean
Site value #clams #clams n #clams #clams n #clams #clams n
(#/m"' 2) (#/ft"' 2) (#/m"'2) (#/ft"' 2) (#/m"' 2) (#/ft"' 2) Huckins Island mean 28.2 2.6 10 0.0 0.0 10 0.0 0.0 visual
(Plot #2) stds 28.1 2.6 Green Point mean 43.1 4.0 10 166.2 12.2 10 37.0 2.7 visual
(Plot #5) stds 85.4 7.9 498.5 36.6 78.3 5.7 +2 square 1 only mean 43.1 4.0 1 0.0 0.0 1 200.4 14.7 2
stds 21.8 1.6
square 8 only mean 279.9 26.0 1 1495.6 109.8 2 169.6 12.4 2
, stds 937.6 68.8 63.5 4.7
Eel Grass Cove mean 18.3 1.7 10 3.4 0.3 10 0.0 0.0 vi sua
(Plot #6) stds 14.4 1.3 9.4 0.7 square 1 only mean 43.1 4.0 1 30.8 2.3 1 0.0 0.0 visual
stds The Cove mean 106.6 9.9 10 0.0 0.0 10 0.0 0.0 visual
(Plot #4) stds 72.6 6.7
All mean 49.0 4.6 4 42.4 3.1 4 9.3 0.7 4
Sites stds 39.7 3.7 82.5 6.1 18.5 1.4
•
• ~ --- ·--··- -· ------ -- - ~

•
•
Table 9
Barnstable Harbor Shellfish Recruitment Enhancement Project
Green Point Experimental Site
Initial clam aurY$y
(23 April1995)
Core sample area (rectangular sample)
D::; 0.305 m 1.00
A:::; 0093 m"'2
mean mean
Expt'l #dams #dams # dams
Square /Core (#/m~2) (#!ft~2)
43.1
0 0.0
4 43.1
Q 0 .
10.8
6 10 8
43.1
26 279.9
9 0.00 0.0
10' 0.00 0.0
squares 1 and 8 ccmbined
mean 15.0 161.5
stds
all squares
mean
stds
15.6
4.0
7.9
167.4
43.1
85.4
4.00
0.00
4.00
Q.OO
100
, 00
4.00
26.00
0.0
0.0
15.0
15.6
4.0
7.9
Valve
Lengttl
(mm)
18.99
18.93
16.87
15.68
14 87
8.15
7.53
6 97
25.33
24.07
24.00
23.13
21.89
19.07
18.71
16.01
15.18
14.57
14.40
13.80
13.79
13.48
13.08
12.54
12.15
7 25
5.79
665
6.31
6.03
5.89
5.81
5.65
5.29
5.15
5.02
4.95
4.77
4.65
4.55
10.43
5.15
12.20
6.50
Fall1995
(30 November)
Core sam pte area (small core)
D= 0203 m
A= 0.032 m"2
0.75 ft
0.442 n~2
mean mean
Expt'l # dams # dams # dams
Square .-core (#/m~2) (#/ft~2)
Sa
'lb
squares
mean
stds
27
70
48.5
30.4
NOT SAMPLED
832.6
2158.5
1495.6
937.6
61.1
158.4
109.8
68.8
Valve
length
(mm)
24.71
11.27
8.56
8.10
Valve
:englh
{mm)
5.46
5.42
5.10
4.77
7.54 4.74
7.11
6.35
6.24
6.22
6.17
6.04
6.04
5.85
5.58
40.27
15.17
10.10
8.83
8.76
8.24
7.87
7.56
7.55
7.49
7.44
7.23
7.18
7.04
6.99
6.93
6.62
6.51
6.51
6.46
6.41
5.31
6.27
6.26
6.22
6.15
6.12
6.01
5.96
5.91
5.91
5.63
4.43
4.40
4.34
4.24
4.16
4.03
3.96
3.44
5.46
5.39
5.38
5.27
525
5.20
5.20
5.20
5.18
5.13
5.09
5.02
4.95
4.92
4.80
4.71
468
4.59
4.56
4.54
4 54
4.47
4.38
4.21
4.20
4.16
4.14
3.93
3.82
3.78
3.68
3.60
5.57 3.42
5.56
5.53
6.33
4.35
3.41
3.31
•
Fall1996
(8 Oclober)
:.:.-re sample area {small core)
0.203 m
~= 0.032 m~2
0.75 ft
0.442 ft~ 2
mean mean
Exot'l #dams #dams #clams
Scuare /COre {#lm"'2) (#/ft"2l
sauare 1
~ean
3a
ob
sauare 6
mean
5~:::S
6
6.5
0.7
4
4.5
0.7
185.0
215.9
200.4
218
154.2
123.3
138.8
21.8
souares 1 and a comb1ned
mean
stcs 55
21
169.6
133.5
13.6
15.8
14.7
1 6
11.3
91
10.2
1.6
12.4
4.7
Valve
length
(mm)
72.97
69.44
68.78
68.70
62.00
58.34
81.76
78.26
74.70
74.12
73.86
71.90
71.90
71.29
6.18
79.62
79.14
74.02
68.38
57.78
78.01
75.03
71.90
71.90
72.86
6.77
71.11
25.19
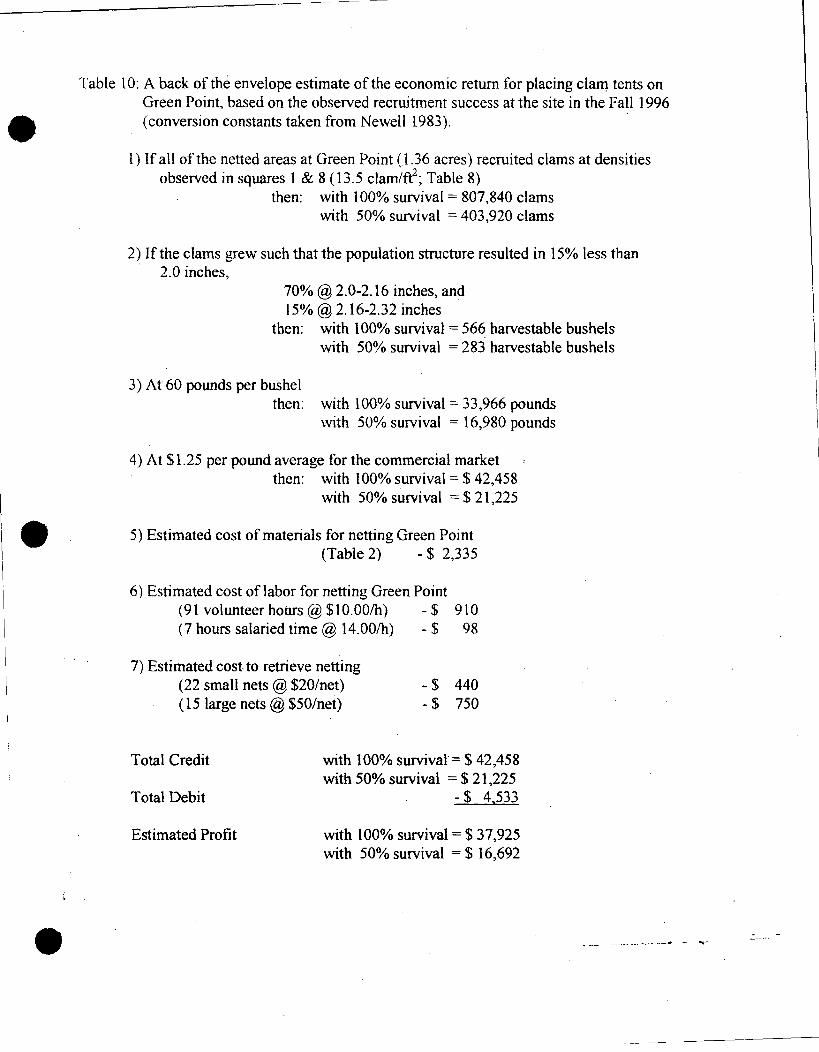
Table 10: A back of the envelope estimate of the economic return for placing clam. tents on Green Point, based on the observed recruitment success at the site in the Fall 1996
• (conversion constants taken from Newell 1983).
•
•
l) If all of the netted areas at Green Point (1.36 acres) recruited clams at densities observed in squares 1 & 8 ( 13.5 clam/ft2; Table 8)
then: with 100% survival= 807,840 clams with 50% survival = 403,920 clams
2) If the clams grew such that the population structure resulted in 15% less than · 2.0 inches,
70%@ 2.0-2.16 inches, and 15% @ 2.16-2.32 inches
then: with 100% survival = 566 harvestable bushels with 50% survival = 283 harvestable bushels
3) At 60 pounds per bushel then: with 100% survival= 33,966 pounds
with 50% survival = 16,980 pounds
4) At $1.25 per pound average for the commercial market then: with 100% survival=$ 42,458
with 50% survival = $21,225
5) Estimated cost of materials for netting Green Point (Table 2) - $ 2,335
6) Estimated cost of labor for netting Green Point (91 volunteer hours@ $10.00/h) - $ 910 (7 hours salaried time@ 14.00/h) - $ 98
7) Estimated cost to retrieve netting (22 small nets@ $20/net) -$ 440 ( 15 large nets@ $50/net) -$ 750
Total Credit
Total Debit
Estimated Profit
with 100% survival= $ 42,458 with 50% survival = $ 21 ,225
-$ 4,533
with 100% survival=$ 37,925 with 50% survival = $ 16,692
~ --- --·-- -- ....... - ·-- - .......

•
•
•
List of Figures:
Figure 1: A map of Barnstable Harbor defining the sites for the experimental manipulations in the BHSREP project.
Figure 2: A schematic of the Huckins Island site demarcating the experimental area and other areas of net deployment in the BHSREP project.
Figure 3: A schematic of The Cove site demarcating the experimental area and other areas of net deployment in the BHSREP project.
Figure 4: A schematic of the Green Point site demarcating the experimental area and other areas of net deployment in the BHSREP project.
Figure 5: A schematic of the Eel Grass Cove site demarcating the experimental area and other areas of net deployment in the BHSREP project.
Figure 6: A size frequency histogram of the valve lengths of clams collected at the four experimental sites at the start of the BHSREP project.
Figure 7: A size frequency histogram of the valve lengths of all clams collected during the start of the BHSREP project.
Figure 8: A size frequency histogram ofthe valve lengths of clams collected from Huckins Island at the start and from a Spartina bed during the Fall 1995 sampling period of the BHSREP project.
Figure 9: A size frequency histogram of valve lengths of clams collected at Green Point at the start and during the Fall 1995 sampling period (A) and the Fall 1996 sampling period (B) of the BHSREP project.
Figure 10: A newsletter from the Merrimack Valley Planning Commission describing the "Shellfish Enhancement Project" currently underway on the North Shore of Massachusetts .
. --- ----------- -- - .......

. 0 .. ":······ " ~. ··················. ····· 3
·········
·,
~ ....... L 4 ............ ~ ... ···· ........ ~ .............. <.~ ..... · 3 ........ ~ .. .. ....
·' 2
BARNSTABLE HARBOR S· ,SHELL CL,
RECRUITMENT ENHAN.fENT PROJEC

Fi~ure 2
HUCKINS ISLAND FLAT (P LOT #2)
•
t N
[ ~ro t:t
~/<.) tt • ----- (_s-, a t-t. .. '£"(<.) tt
";"to -i;.t: f) ~1 I £to tt.
~~/uc-t: n !..!__Ot.t st
{s1ott s-1o t:C.' ' 1 ::f .. flt..ur<..
r 5& 51o t-t: . {[t...ur~
:-rott rS"S" IQ:~ui~
;"I ott' }.s-v
~/0 -tt i{
( s-d . !tt.v~
I PI..\J(i_ ) lfivr.z... /Jt lil
' 11.1 /G !
~ i
'
• --------...
J :> ~
I :S"I
]st> (lfi?
f46 , <f=1
l 'lb
l 'f5
j 'f'r'
\ '(j · •..
j I(Z
I 'it
(51o H- ) J~
'f~ro tf ) ]8
, i'a 171"
·510 J!.,.
1510 ·H- 1$"
/p F f "!'1
~f'-Ut2_ F, T'!.
[Pt.. F) ~?..
!P w~ F I ?•
IP LUR.. F-/1~
,, 5""1 ott f Z"'
!p t..._v_r?-__ F J -z?.
(r F l 2=1
fs tott
l p
I -zc.
-, 'Z~ ---r~ lol;t ) 2'( ---cr fOtt-
·s-/(.) tt .--:r z ~
t 2Z
15 ... _,u_t:_e. __ lz' lp L.vrc..
,_ _.;; _______ --- _,_
-------. I 1 c f!:t..urz. I I
: Bj Pt...v~ T --l~ I
I I
,. A{rz..un.. ~ T ~ : I - -.. ~ 11 t' ·--- -<2:!1
I ----,_____ (
/ c /Jt 0 t-t ::..._1 - -,, I . I 1
: 1 rr.frto&t '"fl 1
I I ..:.... I
: d) : Afr;?fl Fj I --- I I
I ------- '-- 'f H I I I ---- -l
II c[fj.ur<.. fl ~·' '7":= - - ' I /";:;- '"'""'""-- C ~10 ff J'/ :
8t!'Lu;<. FJ. B Gto tt F Jj
II A~Lur~ I A f5to-l:t: _/.__ ,' I 8 - -~---- I CD I -----~----1 I I I •
(
- -- --r , I I
I I
: ®/-# / @ : '·-- - - -- ,_ , I --- ---- I
'c['Ertott / / ('" -- :._- --, : <:rs-'ott I ! 1
f175tO-f..t ] I --------.J. I
I
i I
( 'fo
(r
.. _ I zo
., ,, f ~ ::_ ,' _B Qto H ~~ 1
, A!jtu+f F/ ~ ,' - A Sl 'l t. "tl . F :' (§)1-/ I I
~ I I - --------.- - -· !. - I
- ------·----.J.
·--~----~-- -- ........ - -- ~-
--- -----. ------- ----·- ···-- ...

•
•
•
THE COVE FLAT (PLOT #4)
Figure 3
;·-
I ,_. ... - - - -I
1 .._[ FL_u ~----JJ C
I
: j PLur< J r
: /.Pt-u~~ \A I
/0\ I .
----·,
L.-[ >_to_-tt:_-.-)1 C :
(._s-_t_o_t_t __ ...-,.] E 1
}.._ s_, o-t~t~-....J] A
CD -- -- --·---
1
r- - - - - - - - -I
.._[ ~--to_t_t: __ __,/ C I i
~_[5_1o tt_--..J) ~ 1
I .,51<> tt I A I ·--=--..__:
(f) -- -· ------1
: [sIb tt F ) ( IS/ 0 it J c :
: [st c tf f J rs , /sto tt 1 f) :
'~----1 l5to tt F l A ; { 510 H J A ;
I
'I
r
@ i ---. -,.rr;~----J ---------
-·-- --
I N
(f) --·- -·-··· ___ ... ____ ___,. - ~
...._---I - - - -. -----

•
• -It) :tt to ....I a. -1-<( ....I LL 1-z -0 a. z w , ..
Figure 4
~z
•. ',\
_....,~z
r'") ~z
'.s·.., oz-z
:i. (}
~
"" '--' :u. i :., I : ~ I . '
\.
VI
I
..... ~ ... ~ S:i ~ ~,
~~ \L Ql
I 1 rol
I~~ I I , . I I
I I I I I
I I I
I
I I I
I I I I
\ \1\ t\-("\
~ ~ .... ... LL \.L 0 0
.._j) ..il
' ' N 1'4
~ M
\--= ~ -•W
;. ;. ;. . U.,> .. ,.. .. -IC I I ~I r ~
' u... /U. I
4 0 ,~
I~
I~ !t: \U "(
~
~
' \ ' ' () I) () 0 il () 0 ()
!"' ("\ M ~
'\
"' ~
~ ~ ~ ~ ~ .
:l .... \U ul \i.)
~ . .
'<( "( ~ <
'
~ I
. <
I ~: I I
:-~:- ~--~~~-- -~-- ----:---.- ----: I - - - I I I l ~ t:! .J I (;:L\ I a' : ;) 3 3 o;) : ~ : ~J I ~ ~ ll.. 1 I t - • ' ------------------------- ~---
j.-~o; ..... Si: Z
(.:1 0_9 .... >cz
I ::lo~ .,5t.-z (
')..' ~ '.'(/ , ---·--
. .~.. 3. -~ I ·_.~..·3·v I

•
•
•
Figure 5
EEL GRASS COVE FLAT (PLOT #6)
7-Z--~ c. -~
t ------N
-;..z..
~ c ~
~
----------- --- -~--- -, : _)·. {_· -. • .... --- ------·-----~ ~
I I @H
1--- --- -1-
'r 1'-S"-1 a-t-e--f { c 1 (Slott ]c ' I
(sto -8: 1 g I (sto H.
1 \ S""lo tt fA
I (§)H 1- - -- - -
I \S"to* JA I I @II I C!!JH I
~ - - - - - - - .L- -- . - - - -'
I \PWJ(Z.. l c I lPt-.U~ )c. I
(Pt..vrl I e ( fwtt 'B 1 \ PL-vrl.. :JA i c;5
--+- ~.-7 -- ---·-----
I z_,
--------------------------~
;z.o S' I 2 z.. ~~~------~~-----------
,
zoS / l z; ~~~------~~-----------
II
~~, )n ~~~--------~~----------~
II
{ ~..:i':....t..._u_r?-_______ z.;;_o...;;S;...._" _______ r ·n fln.•ob~ s
L:.( P..:"~u..;.;,"-;;:;__ ___ .:;;z._o...;;;S_" ______ ) ::1. i'
LS1o-t-t F-f [Si.o·it" r I
{sto;± F(
- - - --·-- ~--- ...... - -- - ""C""

{
I•
' :
•-
20 (/)
E 18 as () 16 -0 '- 14 Q)
~ 12 ::::J c 10 s .9 8 -0 6 +-' c: Q) 4 ~ ·~ 2
0
•
BHSREP - All sites @ start Valve length distribution of clams
16 :a ~ . ~ B I I I I I I I I
5 10 15 20 25 30 35 Valve length increments (1 mm)
D Huckins; n=37 D Green Point; n=40 -Eelgrass Cove; n=17 ~The Cove; n=99
• ''1 f-'·
()Q
~ 'i ro ,:)'\

•
!•
16
en E 14 ro 0 0 12 ..... (]) .0 10 E ::J c
s .9 -0 .......
8
6
c 4 (]) 0 ..... &. 2
0
-
I
I
•
BHSREP - All sites @ start Valve length distribution of clams
fall1994 spring 1994 set set
II I
.·. '/,
r
.,
'· n n ... •n n non n I I I I I I 1 I I I I I I I I
5 10 15 20 25 30 35 Valve length increments (1 mm)
I GJ All data; n=193 I
•
-
hi ,_... (,Q
.: l"i (1)
__,
•
25 C/)
E m 0 20 -0 '-Q) ..c
15 E :J c: ca
10 ..... 0 ..... -0 .....
5 s:: Q) e Q)
'- a.. 0
:·
•
BHSREP - Huckins Island Valve length distribution of clams
-
~ I~ ~ ~ I I I I I I I I I I I I I I I II II I I I I
5 1 0 15 20 25 30 35 40 45 50 55 60 65 Valve length increments (1 mm)
j CJ-st~rt; n=37 - Spartina; n=B I
• t-rj t-'·
(JQ
c ti (1)
ry:,

•
•
•
Fi~ure 9
BHSREP - Green Point Size distribution of clams
5.0,----------------------..
4.5
4.0
E 3.5 ca (.) 3.0 -~ 2.5 (I)
~ 2.0 ::J z 1.5
'1.0
o.5L---r-r ............ ~LL~JIJIII,J~U_J 0.0
50 55 60 65 70 75 80 Valve length (mm)
ltm Fall1996; n=22 I
BHSREP - Green Point Size distribution of clams
25~---------------------------~
20 rJ)
E m (.) 15 -0 '-(I)
.a 10 E ::J z
5
o~-~~~~~~~~~~~~~~rn~-~ 5 1 0 15 20 25 30 35 40 45 -··· ..
Valve length (mm) . -- ------ -- ....... - .-..., - ~-
,_Before start: n=40 D Fall1995: n=97

• Figure 10
MERRIMACK VALLEY
PLANNING COMMISSION
Progress Report
The Merrimack Valley Planning Commission (MVPC), in partnership with the Town of Ipswich and the City of Gloucester, has embarked on an exciting shellfish enhancement demonstration project for the North
~ore. Funded by the U.S. ~conomic Development
Administration and MVPC, this two-year project will assess the feasibility of profitably culturing soft-shell clams (Mya arenaria L.)
on unproductive tidal flats. To accomplish this, MVPC's environmental staff is evaluating the costs and success rates of a variety of different aquaculture techniques that are intended to attract and anchor clam larvae ("spat") while controlling natural predators, such as green crabs, which feed on seed clams.
The project is a direct outgrowth ofMVPC's affiliation and work with the Eight Towns and the Bay Committee (8T&B) and the Massachusetts Bays Program. 'Jerrard Whitten, MVPC Environmental Planner and field manager for the project, has worked closely with 8T&B's Wayne Castonguay and Dave Sargent, the Ipswich and Gloucester Shellfish Advisory Committees, Phil Kent and Robert "Stubby" Knowles (Ipswich and Gloucester Shellfish Wardens), and Dr. 13rian Beal ofthe University of Maine (Machias) to
.ign and implement the project.
.\.orth Shore Shellfish Enhance me !II Proiect
November 1995
In launching the project, the first challenge was to identify appropriate unproductive tidal flats. Through consultations with Division of Marine Fisheries (DMF) biologists and the local shellfish advisory committees, MVPC developed a series of specific site selection criteria and subsequently chose two promising test sites - Eagle Hill River flat (Ipswich) and Little River flat (Gloucester). The necessary regulatory permits were then applied for from DMF, the two municipalities, the bordering property owners, and the Army Corps of Engineers.
By mid Ju!y, all permits were in hand and set-up of
Ipswich: defining the study area and test plots using wooden stakes
·-- ---- ------- -- - "'C""

the plots was initiated. In all, 54 plots (27 per site) were established. The plots were laid
.ut using 4 foot wooden stakes marking the comer of each 12' x 12' study area. Prior to the application of individual aquaculture treatments, a preliminary inventory was made of existing site conditions and biology (species types, density, and distribution, including predators). To conduct this inventory, one sediment core was taken from each of the defined plots. The cores were then sieved on window screening (l.2 mm aperture). All benthic inhabitants retained on the sieve were identified and counted. This inventory will serve as the baseline for gauging productivity changes over time. Primary inhabitants of the benthos included duck
..-Lams (Macoma balthica), Wriwinkles (Littorina littorea), bamboo worms
(Clymene/la torquata), and clam worms (Nereis virens). Other inhabitants included an occasional moonsnail (Lunatia heros), blood worm (Glycera dibranchiata), and tape worm (Cerebratulus lacteus). Incidentally, only one legal-size clam (2 inches or greater) was found among all 54 core samples.
I 12' Site layout
Once the site inventory was completed, it was time to apply the individual aquaculture treatments and seed the flats. ApP.roximately 58,000 seed clams were dispersed over l 0 plots at each site. A total of five treatments are being evaluated: l) net and seed; 2) net without seed; 112'
5) no net, no seed (control). Each treatment is replicated five times for a total of25 plots at each site. Two larger plots measurfng 12' x 50' also were established at each site. The purpose of these larger plots is to better simulate the area a commercial aquaculturist might use.
Sampling of the plots has begun, and will continue on a monthly basis until the end of the growing season. The · sampling is performed both to assess clam survival and to monitor monthly growth. The presence and abundance of other species encountered during sampling also are being recorded. Preliminary results suggest that nearly all clams distributed over the unprotected plots have suffered predation. Conversely, the clams protected by netting have shown excellent survival. ~et and cultivate; 4)
• without net; and • NETTED PLOT
• UN-NETTED PLOT
Page 2 North Shore Shellfish Enhancement Project

•
• In early December, the protective netting will be
removed from the flats to avoid damage from ice. Although predator activity declines during periods of cold water, clams may still suffer mortality as a result of exposure to ice and scouring from winter storms. This information will become important when the overall costs and benefits are tallied for each treatment.
To date, the primary problem encountered has been mortality of clams due to green crab predation. Up until late July, juvenile green crabs were small enough to move freely in and out of the protective netting. However, once the crabs had increased sufficiently in size, they became trapped beneath th~ nets, and ~ould be
•ured and removed g baited minnow
traps .
.Vorrh Shore Shellfish Enhancement Proiect
The sampling will be resumed on the original 54 plots in the spring of 1996; in addition, 27 new plots per site will be established. Sampling at both sites will continue through the fall of 1996. Final sampling will be performed in the spring of 1997, at which point the cultured clam populations will be left in the care of the communities to harvest or manage as they deem appropriate. Project fmdings will be compiled and made available in an interim report in the winter of 1995/96 and·in a final report in the winter of 1996/97. MVPC will be meeting with representatives of the shellfishing industry, interested municipal boards, and abutting landowners during the course of the project to apprise them of the project's progress, and will sponsor an informational workshop on North Shore aquaculture opportunities upon completion of the project in the spring of 1997.
For further information .on MVPC's Shellfish Enhancement Demonstration Project, contact
Jerrard Whitten at the MVPC offices (508/374-0519). _
'),..,..,. ., .~

,II\
Step f.~ Growing clams on unproductive tidal flats . digging trenches to secure protective netting
·r-----------------------------------~
~ MERRIMACK
VALLEY PLANNING
COMMISSION
Page .J
160 Main Street Haverhill, MA 01830-5000
Dale Leavitt Sea Grant Program Coastal Research Laboratory Woods Hole Oceanographic Institute Woods Hole, MA 02543
•''
.Vorth Shore Shellfish Enhancemem Project
'I • ' ' . ~ i I 1 I ' : ~ t f 1 I l 1 1 I , , I 6 , , • , • I • • • I t t , I • I , 1 , I • • , ' o. • '