Embed Size (px)
Citation preview

NOAA Atlantic Oceanographic & Meteorological Laboratory
The Atlantic Multidecadal Oscillation: Impacts, mechanisms & projections
David Enfield, Chunzai Wang, Sang-ki Lee NOAA Atlantic Oceanographic & Meteorological Lab Miami, Florida
Enfield, D.B., A.M. Mestas-Nuñez, and P.J. Trimble, 2001: The Atlantic multidecadal oscillation and its relationship to rainfall and river flows in the continental U.S.. Geophys. Res. Lett., 28: 2077-2080.
Goldenberg, S.B., C.W. Landsea, A.M. Mestas-Nuñez, and W.M. Gray, 2001: The recent increase in Atlantic hurricane activity: Causes & implications. Science.
Enfield, D.B., and L. Cid-Serrano, 2006: Projecting the risk of future climate shifts. Int’l J. Climatology, 26: 885-895.
Wang, C., S.-K. Lee, and D.B. Enfield, 2008: Climate response to anomalously large and small Atlantic warm pools in summer. J. Climate 2437-2450.
Some relevant publications:
Luis Cid-Serrano Dept. Statistics, Universidad de Concepción, Chile

NOAA Atlantic Oceanographic & Meteorological Laboratory
… describe the AMO & importance to climate & water resources,
… discuss proposed mechanisms for AMO & its impacts
… discuss the prospects for model-based predictions,
… show how probability analysis of proxy reconstructions can allow us to make risk projections for future AMO regime shifts,
In this talk, we shall ….
… A multidecadal oscillation of SST found mainly in the North Atlantic — the Atlantic multidecadal oscillation (AMO)

NOAA Atlantic Oceanographic & Meteorological Laboratory
Global warming model w/ greenhouse gases & solar forcing (red) …residual fluctuations (blue) not explained by GHGs (red) …implies that residual reflects natural fluctuations in SST

NOAA Atlantic Oceanographic & Meteorological Laboratory
Cool Atlantic
1971-1994 ==> 25 years of AMO cool phase.
Only 15 major hurricanes and US landfalling hurricanes are infrequent.
Then: Windstorm insurance is cheap. Underwriters and actuaries are unaware of climate risk shifts.
Warm Atlantic
1953-1970 & 1995-2000 ==> 25 years of AMO warm phase.
33 major hurricanes and frequent US landfalling hurricanes.
Now: Windstorm insurance skyrockets. Wide public consciousness of the AMO-related shift in risk.
Goldenberg et al. (Science, 2001)!
NOAA Atlantic Oceanographic & Meteorological Laboratory
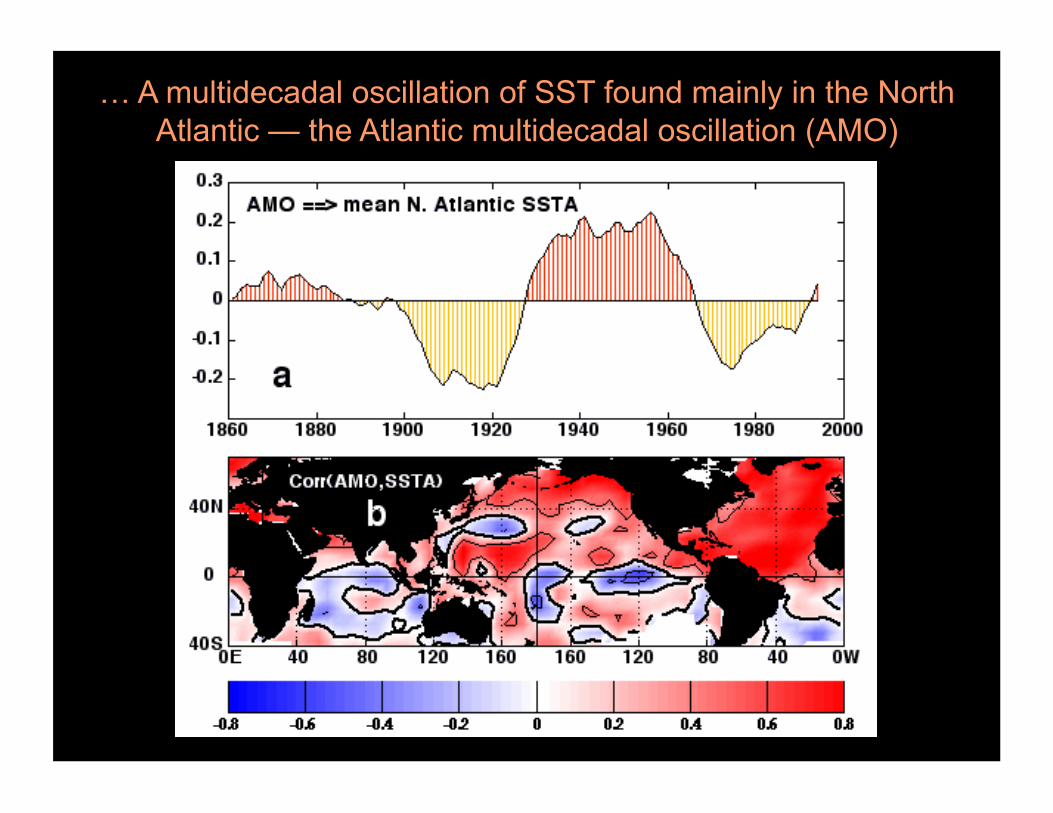
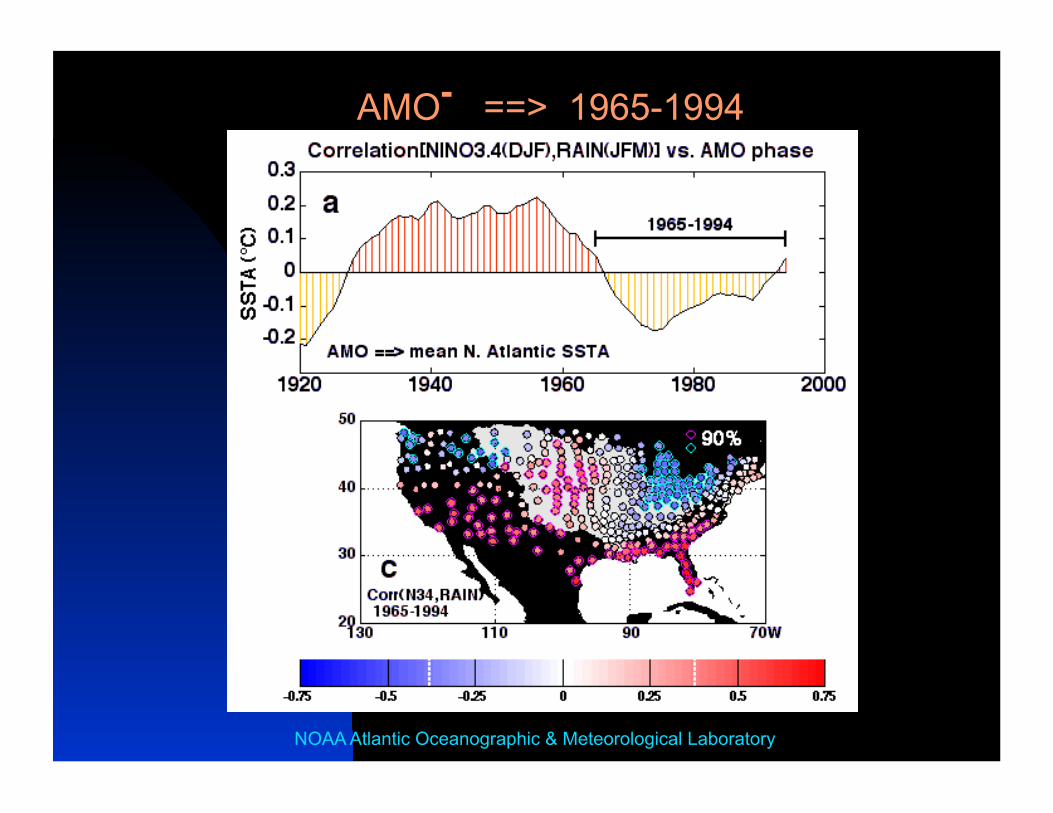
Correlation of AMO vs. July-September rainfall

Correlation of AMO with U.S. divisional rainfall (1895-1999) Enfield et al. (2001)

NOAA Atlantic Oceanographic & Meteorological Laboratory
Lake Okeechobee inflow vs. AMO

NOAA Atlantic Oceanographic & Meteorological Laboratory
SW Florida WMD Report (2003)
NOAA Atlantic Oceanographic & Meteorological Laboratory
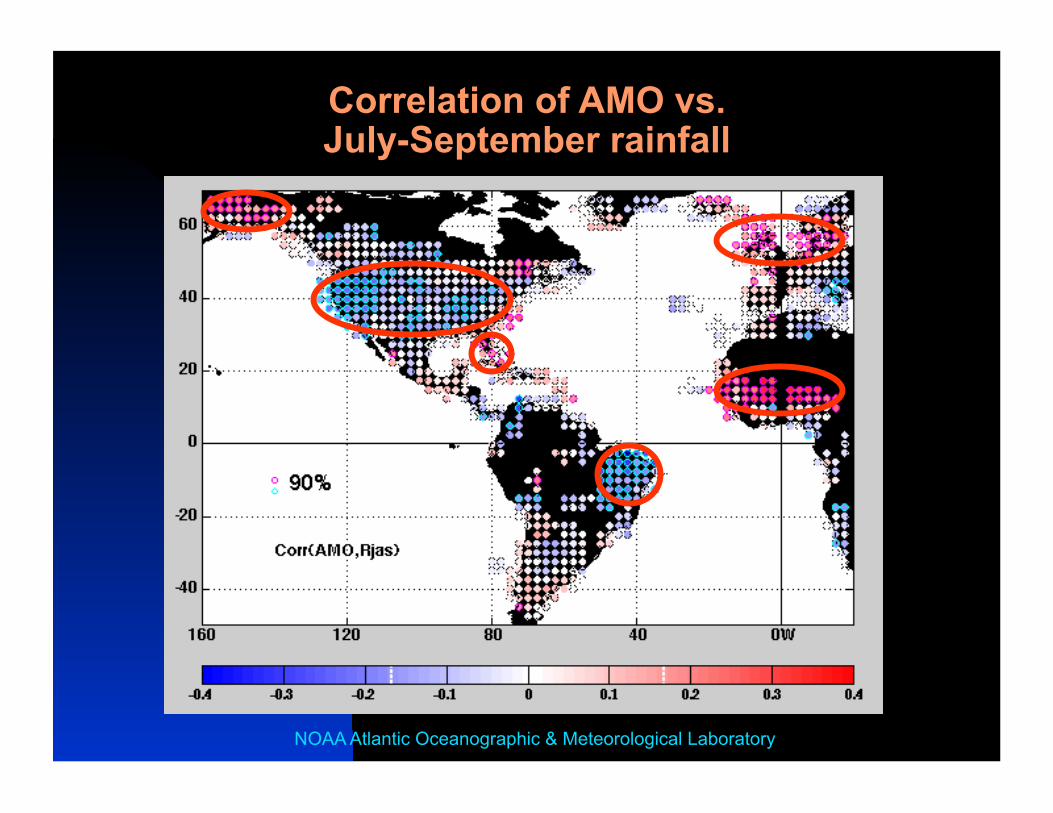
20-year running correlations
NOAA Atlantic Oceanographic & Meteorological Laboratory
AMO- ==> 1965-1994

NOAA Atlantic Oceanographic & Meteorological Laboratory
AMO+ ==> 1930-1959

NOAA Atlantic Oceanographic & Meteorological Laboratory
Together , PDO/AMO govern US mega-droughts
McCabe et al., 2004
+/- +/+
-/+ -/-

NOAA Atlantic Oceanographic & Meteorological Laboratory
High-quality calibration Severe drought, high AMO
Good water supply, low AMO 2 severe droughts, high AMO
Lees Ferry (dark) & reconstruction (light)!

NOAA Atlantic Oceanographic & Meteorological Laboratory
Coupled numerical models suggest that the engine for the AMO involves the Meridional Overturning Circulation (MOC) of the Atlantic Ocean…
…aka the “global conveyor belt”
References:
Delworth and Mann (Climate Dynamics, 2000)
Knight et al. (GRL, 2005)
NOAA Atlantic Oceanographic & Meteorological Laboratory
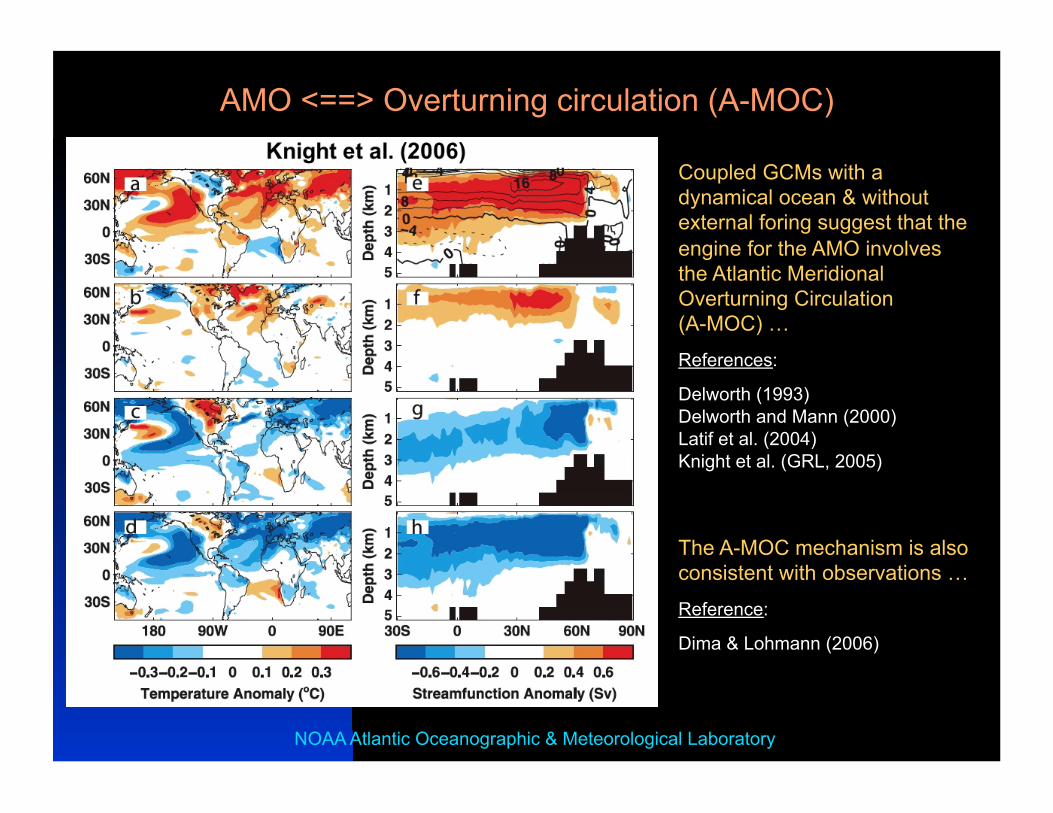
AMO <==> Overturning circulation (A-MOC)
Coupled GCMs with a dynamical ocean & without external foring suggest that the engine for the AMO involves the Atlantic Meridional Overturning Circulation (A-MOC) …
References:
Delworth (1993) Delworth and Mann (2000) Latif et al. (2004) Knight et al. (GRL, 2005)
The A-MOC mechanism is also consistent with observations …
Reference:
Dima & Lohmann (2006)

80% of large (small) AWPs occur during AMO+ (-)
AMO & AWP ==> similar impacts Rainfall regressions very similar
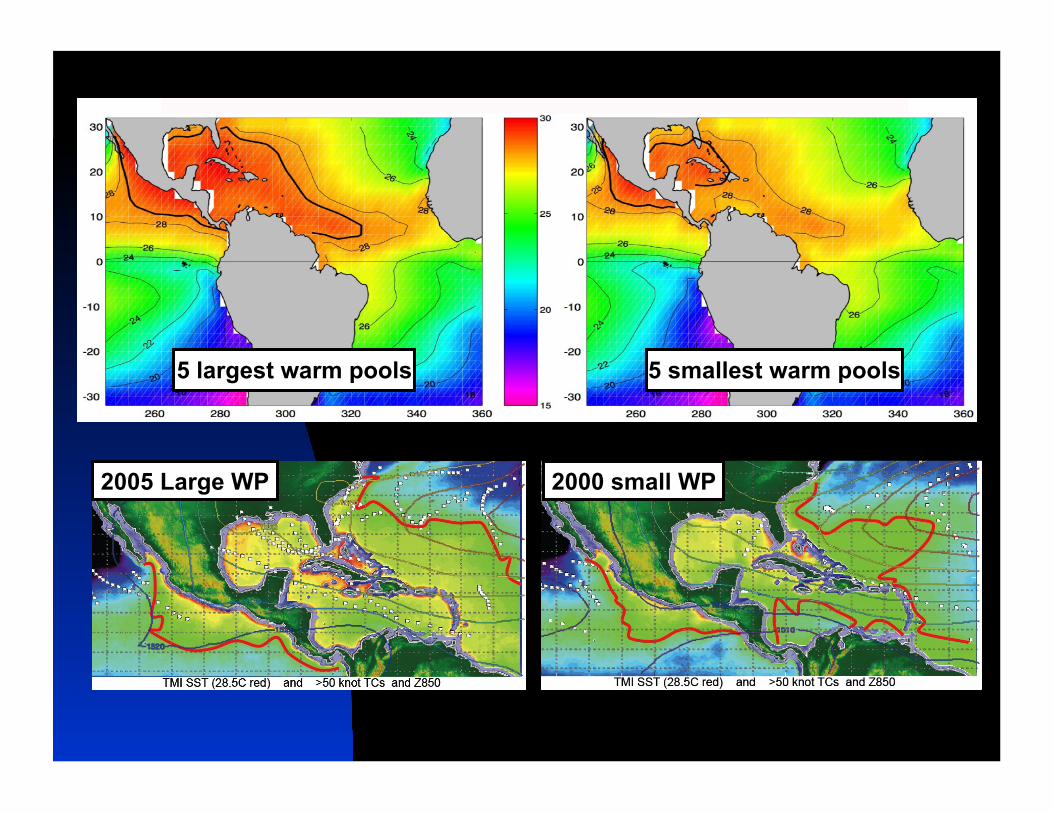
Centerpiece of IASCLIP: the Atlantic warm pool (AWP)
5 largest warm pools 5 smallest warm pools
2005 Large WP 2000 small WP

NOAA Atlantic Oceanographic & Meteorological Laboratory
Eastern US and European tree rings have been “calibrated” to give an extended 425-year index of the AMO.
Gray et al. (2004) AMO reconstruction!
The extended AMO proxy (b) correlates highly with the instumental index (a) and allows us to identify long and short regime intervals of the AMO (c).
Strong evidence that the AMO is a natural climate mode, not anthropogenic.
NOAA Atlantic Oceanographic & Meteorological Laboratory
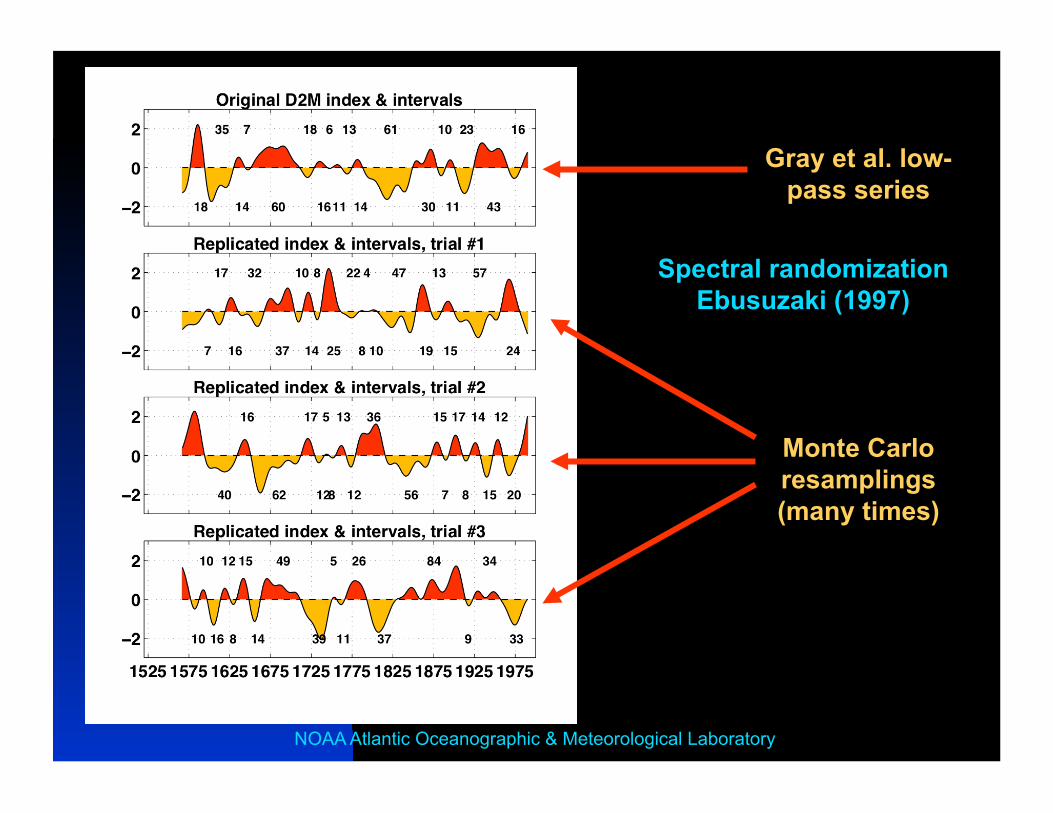
Monte Carlo resamplings (many times)
Gray et al. low-pass series
Spectral randomization Ebusuzaki (1997)
NOAA Atlantic Oceanographic & Meteorological Laboratory
End with new series series
Start with original series
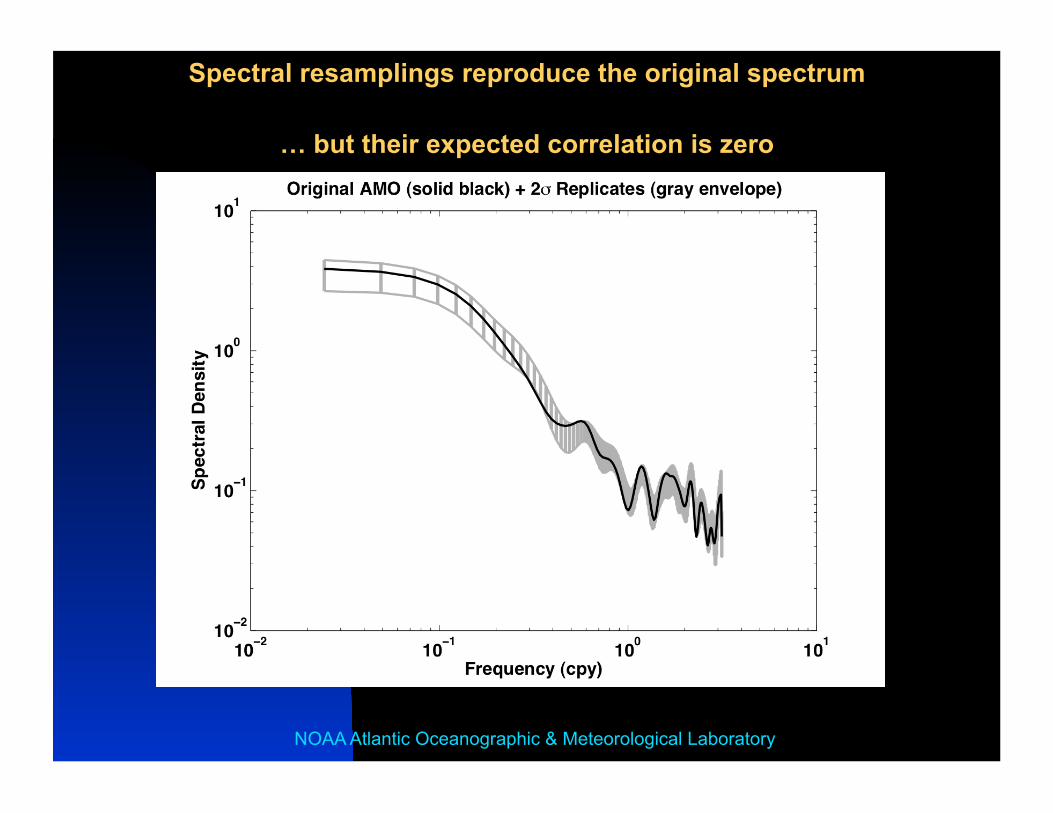
… but their expected correlation is zero
Fourier transform
€
∑aj∗exp(−iφ
j)Δf
Randomize phases φj
Reverse Fourier
transform
Spectral resamplings reproduce the original spectrum

NOAA Atlantic Oceanographic & Meteorological Laboratory
By doing a Monte Carlo resampling of regime intervals in the Gray et al. extended AMO index, we get a histogram of AMO regime intervals (blue), which can be successfully fit by a Gamma (Γ) distribution (PDF, red).
A K-S goodness-of-fit test of the CDF usually shows the fit to be valid. Assuming that the future distribution is unchanged, we can compute the probability of future regime shifts from the estimated Γ parameters (A,B).
A= B=
NOAA Atlantic Oceanographic & Meteorological Laboratory
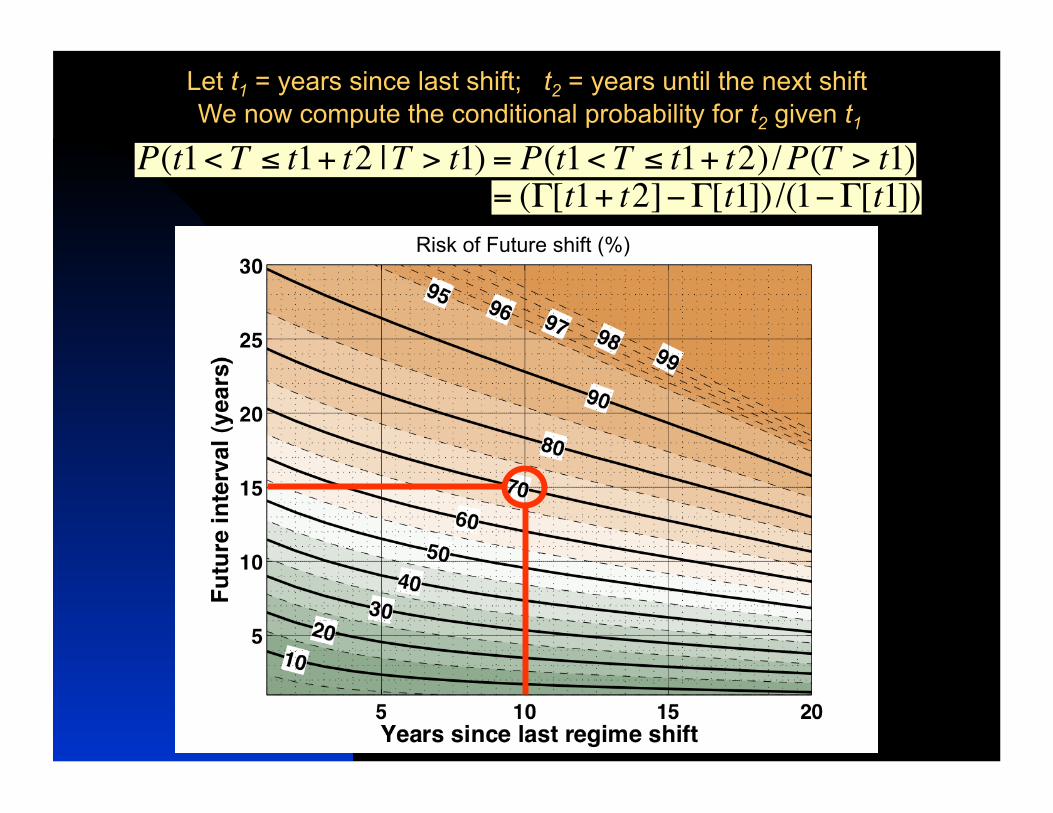
Risk of Future shift (%)
€
P(t1< T ≤ t1+ t2 |T > t1) = P(t1< T ≤ t1+ t2)/P(T > t1)
€
= (Γ[t1+ t2]−Γ[t1])/(1−Γ[t1])
Let t1 = years since last shift; t2 = years until the next shift We now compute the conditional probability for t2 given t1
NOAA Atlantic Oceanographic & Meteorological Laboratory
Conclusions… The AMO appears to be a natural climate oscillation that has probably
existed for centuries and which probably involves fluctuations in the overturning circulation of the Atlantic Ocean.
The AMO exerts a strong influence on rainfall and hurricanes in the Western Hemisphere, and we see larger Atlantic warm pools during AMO(+) than
during AMO(-). This may be the mechanism by which many climate impacts occur.
Although progress is being made in using global models to diagnose the AMO, we probably can’t realistically expect useful numerical predictions of AMO reversals in the near future.
Application of probability analysis to proxy records allows us to make risk projections for future climate regime shifts, subject to assumptions about stationarity. This approach may prove useful for long-horizon applications such as water management and insurance risk during the next 2-3 decades while better models are being developed.