Embed Size (px)
Citation preview

The nature of sliding and the analysis of friction 391
Bowden and Ridler 1935 Proc. Camb. Phil. 31, 431.-------- 1936 Proc. Roy. Soc. A, 154, 640.
Bridgman 1918 Proc. Amer. Acad. Arts Sci. 53, 269.— 1935 Phys. Rev. 48, 825.— 1936 J . Oeol. 44, 653.— 1937 Proc. Amer. Acad. Arts Sci. 71, 387.— 1937 J- A ppl. Physics, 8, 328.
Coulomb 1785 “ M&moires de Math6matique et de Physique de l’Acad&nie Royale des Sciences”, p. 161.
De la Hire 1732 “ Histoire de l’Acad6mie Royale des Sciences”, p. 104.Derjaguin 1934 Z. Phys. 88, 661.Elam 1935 ‘‘Distortion of Metal Crystals”, p. 147. Oxford Univ. Press.
— 1938 Proc. Roy. Soc. A, 165, 568.Euler 1750 ‘‘Histoire de l ’Acad6mie Royale des Sciences et Belles-Lettres”, Annee
1748, Berlin, 1750, p. 122.Ewing, Sir A. 1892 Not. Proc. Roy. Instn. 13, 387.
— 1912 J. Inst. Met. 8, 4.Hardy, Sir W. B. 1936 “ Collected Works”. Camb. Univ. Press.H im 1854 Bull. Soc. Indust. Mulhouse, 26, 188.Morin 1835 “ Nouvelles experiences sur le frottem ent.. .faites Metz en 1833.”
Paris.Nadai 1931 “ Plasticity.” New York: McGraw-Hill Book Company.Rennie 1829 Philos. Trans. 34, 143.Taylor and Farren 1925 Proc. Roy. Soc. A, 107, 448.Tomlinson 1929 Phil. Mag. 7, 905.
The area of contact between stationary and between moving surfaces
Bx F. P. B owden and D. Tabor Laboratory of Physical Cambridge
( Communicated by 0 . 1 . Taylor, F.—Received 8 August 1938—Revised 29 October 1938)
[Plates 25, 26]
When two plane surfaces are placed together the area of intimate contact must be very much less than the apparent area. Even if the surfaces are very carefully polished and are made as flat as possible, hills and valleys will still be present on the surface. The upper surface will be supported on these irregularities, and large areas will be separated by a distance which is great compared with the dimensions of a molecule. We do not
on August 18, 2018http://rspa.royalsocietypublishing.org/Downloaded from

392 F. P. Bowden and D. Tabor
know very much about the size of these irregularities nor the degree of flatness of the surfaces. Optical methods cannot reveal irregularities much smaller than half a wave-length of light. The scattering of protons (Knauer and Stern 1929) or the diffraction of electrons (Thomson 1934; Finch, Quarrell and Wilman 1935) can give information about the structure of a small portion of the surface, but these methods would not reveal the presence of isolated peaks nor show how flat are the surfaces over a large area. Since it is difficult, even with the most refined technique, to prepare surfaces which are flat to within one or two thousand angstroms, we may expect that the area of intimate contact, that is, the area over which the surfaces are within the range of the molecular attraction, will, for most surfaces, be very small. Some knowledge of the real area of contact is essential for any complete understanding of the mechanism of friction, and this paper describes an attem pt to estimate this area for both stationary and for moving surfaces.
1. The area of contact between stationary surfaces
In 1881 Hertz published his celebrated paper on the elastic deformation of solid surfaces and calculated how the area of contact between curved surfaces should depend upon the load. Bidwell (1883) measured the electrical conductance between crossed cylinders of carbon and bismuth, and Meyer (1898) made some careful measurements of the conductance of steel spheres in contact. Meyer assumed Hertz’s equations to hold and deduced that the specific resistance of the steel within the area of contact was proportional to the pressure a t that point. From the work of later investigators it appears that his surfaces could not hsfve been clean. Further work on the resistance between polished plates was published by Auren (1903) and Browning (1906). The next important contribution was made by Binder (1912), who showed that the conductance was smaller than would be expected if the whole area of the surfaces were touching. He suggested that real contact took place only over a small portion of the surface. Experimental verification of these observations was obtained by Pedersen (1916), although the interpretation he gave was different and was based on the assumption of a thin transitional layer of relatively high resistance. Support for Binder’s views comes from the work of Holm and his collaborators who have published an exhaustive series of papers from 1922 onwards. Holm shows that the contact resistance between clean metals obeys Ohm’s Law and is a “ spreading resistance”, i.e. it is produced as
on August 18, 2018http://rspa.royalsocietypublishing.org/Downloaded from

a result of the constriction of the current stream through a small area of contact. He concludes tha t for flat surfaces the contact occurs over a large number of small areas.
§ 1 of this paper describes the measurement of the area of contact between stationary surfaces by electrical and by visual means. Surfaces of different size, shape and material are used and the measurements are made over a wide range of loads, so tha t the results can be correlated with the frictional measurements described in the preceding paper.
GeneralHertz has shown that, if elastic deformation is assumed, the theoretical
radius of contact a between a spherical surface resting on a plane of the same material is given by
8 IZWnra ==J ~ 8E ~ ’
where W = load between surfaces.E = Young’s modulus.
r = radius of curvature of spherical surface.n = a numerical factor lying between 3 and 4 according as Poisson’s
ratio lies between \ and 0.Hence a lies between the values
1-08 {Wr/E)* and M 5
In what follows we shall use a value of
M (Wr/fi)*.(1)
If two cylinders of the same material and the same radius r are pressed together with their axes at right angles, they will make contact over a circle the radius of which is also given by equation (1).
I f now we consider a circular constriction of radius a in an infinite conductor of specific conductivity A, the current is concentrated into the “ neck” and spreads out on either side of it. This constriction of the current stream introduces a “ spreading resistance” the value of which depends only on a and A. A solution to a similar problem is given by Maxwell (1873) for the case of a cylindrical conductor of radius a with its extremity in metallic contact with a massive electrode. The spreading resistance involved is shown to be very nearly equal to JaA. The spreading resistance R of the case considered above will be twice this, i.e.
R = %a\.
Area of contact between stationary and moving surfaces 393
(2)
on August 18, 2018http://rspa.royalsocietypublishing.org/Downloaded from

394 F. P. Bowden and D. Tabor
This expression is, however, only strictly true for a current flowing through a plane circular constriction into a concentric sphere of infinite radius. I f the conductor does not extend to infinity, the resistance will be less. If the conductor is a concentric sphere of radius r, the resistance will be approximately
when r is small compared with a ; and more nearly
when r tends to a. Thus so long as a is considerably smaller than r, the correction involved is small, and as subsequent measurements show is negligible.
Hence if two conductors make metallic contact over a circle of radius a, where a is small compared with the dimensions of the conductors, the electrical conductance A of the “ junction” can be written with sufficient accuracy as
A — 2aA. (5)
From equations (1) and (5) A = k1 W*, (6)
where Aq is a constant, so tha t if we assume elastic deformation the electrical conductance should be proportional to the cube root of the load.
If we assume plastic deformation we may consider that the surface irregularities will flow under the applied load until the cross-section of the contact is sufficient to support the load. In this case
W = na2f . (7)
Where / i s the maximum pressure the metal can withstand without flowing. Combining equations (5) and (7) it follows tha t
A - k 2 Wi,(8)
where k2 is a constant, i.e. the electrical conductance should be proportional to the square root of the load.
If the metal is very soft and the pressure is great, the diameter of the contact area may be of the same order of magnitude as the dimensions of the metal surfaces forming the contact. In this case the spreading
on August 18, 2018http://rspa.royalsocietypublishing.org/Downloaded from

resistance is more nearly represented by equation (4) where it is seen tha t when a — r the spreading resistance is zero. We can rewrite equation (4) as
A = 2\ — . (9)r — a
ExperimentalThe first experiments were carried out on the contact formed between
two crossed cylinders with their axes a t right angles. The electrical conductance A of the junction was measured by a current-potential method. A known current i was passed through the contact, and the potential v was measured with a potentiometer or sensitive galvanometer of relatively
Area of contact between stationary and moving surfaces 395
POTENTIOMETER
CURRENT
Fig. 1. Diagram showing arrangement of cylinders.
high resistance, the arrangement being as shown in the accompanying diagram (fig. 1). Since separate current and potential leads were used, the conductance is given by A — ijv. The lines of current flow are also indicated. These are not the same as for a constriction at the centre of a spherical conductor, but so long as the constriction is small compared with the radius of the cylinders, the difference does not appear to be very great and is neglected.
Subsidiary experiments showed that the conductance thus measured was independent of the current flowing, provided that the potential across the contact did not exceed a certain critical value. This aspect of the problem has been dealt with exhaustively by Holm (1929).
The load on the surfaces was varied by running water into or syphoning it out of a vessel to which the cylinders were suitably attached. The load range was 20-600 g. Using mercury instead of water the range was extended to about 6000 g. For large loads a special lever machine was used. The load
on August 18, 2018http://rspa.royalsocietypublishing.org/Downloaded from

396 F. P. Bowden and D. Tabor
was applied by means of a spring balance and could be increased to 1000 kg. The surfaces were cleaned and prepared in various ways, by fine grinding, by polishing, by etching with various reagents and by scraping with a sharp edge. The method of preparation did not have much influence on the results except tha t the scraped surfaces seemed to give more reproducible results.
Results
When the metal surfaces were placed together with a light load the conductance was at first variable. If a vibrating tuning-fork was held against the surfaces the conductance increased slightly and reached a steady state which was comparatively reproducible. This technique was first developed by Meyer (1898). For heavy loads this procedure was not effective, but a slight relative movement of the surfaces produced the same effect. I t is evident that this process causes a better fitting together of the two surfaces and probably crushes out contamination at the region of contact.
The effect of load and the nature of the metal on electrical conductanceIf the clean surfaces are placed together with a heavy load and are
subjected to vibration, the value of the electrical conductance becomes reasonably reproducible. If the load is gradually reduced the conductance decreases in a uniform manner. I f now the load is again increased (without vibration) there is only a small increase in the conductance, and further cyclic variations in load produce successively less change in the conductance. The reason for this hysteresis is not clear, but it is possibly due to the successive formation of oxide on the surface which may occur during the tearing of the metallic junctions (see later). If the load is again applied and the surfaces subjected to vibration, the conductance again rises to its former value. The following measurements were made on the reproducible part of the curve, i.e. the initial heavy load was applied to the freshly cleaned surfaces, and the surfaces were subjected to vibration. The load was then decreased gradually and the electrical conductance observed.
Experiments showed that the absolute value of the conductance for individual measurements in different experiments might vary in the case of heavy loads by 10-20 %. In the case of light loads the variation might be still greater. The slope of the curves was, however, much more reproducible. The results obtained for crossed cylinders of various metals and for carbon are shown in fig. 2. Each curve represents the mean of a large
on August 18, 2018http://rspa.royalsocietypublishing.org/Downloaded from

number of determinations. On the same figure the specific conductivities of the metals are plotted and it will be seen th a t :
(a) The variation of conductance with load for decreasing load follows a simple law of the type A = TcW1,n.
(b) The position of the curve for each material is in the order of the specific conductivity of the material.
Area'of contact between stationary and moving surfaces 397
COPP ERC O P P E R
ANTI MONY
b i s m u t h
10*BI SMUTH
CARBON
CARBON
L O A D ( G m s . W t . )
Fig. 2
Comparison of experimental results with theoretical curves for plastic and elastic deformation
In fig. 3, curve I, the experimental results for crossed cylinders of copper and steel are shown in more detail. The theoretical values of the conductance
on August 18, 2018http://rspa.royalsocietypublishing.org/Downloaded from

398 F. P. Bowden and D. Tabor
calculated on the assumption of elastic deformation (curve II) and plastic deformation (curve III) are also plotted on the same figure for comparison. In these cases the radius of contact is small compared with the diameter of the cylinders and equation (5) is used. I t is seen tha t the general agreement between theoretical and experimental results is quite good, and that the observed slope of the curve corresponds more closely to 'plastic than to elastic deformation.
Some results for crossed cylinders of silver under heavy loads are given in fig. 4. In these experiments the radius of contact a was actually measured by visual means. After each load had been applied the cylinders were separated and the diameter of the impression determined with a microscope. Since at these heavy loads the radius of the contact was not negligible compared with the radius of the cylinders, equation (9) was used to calculate the conductance in terms of a. These values are plotted on curve II, whilst the experimental values of the conductance are plotted on curve I. I t will be seen that the agreement between experiment and theory is again quite good.
The influence of the size and shape of the surfaces on the electrical conductance
According to the empirical theory of plastic deformation, a spherical surface resting on a flat one should have essentially the same conductance as two crossed cylinders, and experiments were carried out to test this. The results for steel are plotted in curve I, fig. 5. The crosses refer to crossed cylinders and the circles to a sphere on a flat. The spherical surface had an initial radius of curvature of 0*3 cm. During the experiment some flattening occurred, so that the radius of curvature increased to several cm., but this had no appreciable influence on the load-conductance curve. I t will be seen that the results for both types of contact are essentially the same: the values lie on top of one another and the slope is again one half.
The results for flat steel surfaces are shown in the same figure (curves IIa , I I 6). These surfaces were not polished: they were finely ground and were flat to a few fringes. They were then cleaned with rouge and water, caustic soda, water and acetone. Curve II a is for a flat surface 0*8 sq. cm. in area, curve I I 6 for a flat surface 21 sq. cm. in area. The flat disks were placed in contact, a heavy load applied, and the disks were then given a sharp tap in a direction parallel to the surface. The conductance rose to a fairly reproducible value. The load was then gradually reduced and the conductance observed. The results were fairly reproducible and the points plotted are the mean of about twenty runs.
on August 18, 2018http://rspa.royalsocietypublishing.org/Downloaded from

EL
EC
TR
fCA
L
CO
ND
UC
TA
NC
E
Mh
Area of contact between stationary and moving surfaces 399
I — — — O b s e r v e dDl — — - A s s u m i n g P l a s t i c D e f o r m a t i o n I I — . As s u mi n g E l a s t i c D e f o r m a t i o n
LOAD IG m s Wt.)
Fig. 3
C a l c u l a t e d f r o m v i s ua l i m p r e s s i o n
•O b s e r v e d
2 tO*
LOAD ( G m s . w t , ^
Fig. 4. Silver contacts. Crossed cylinders (diam. 2r=0*9 cm.)
on August 18, 2018http://rspa.royalsocietypublishing.org/Downloaded from

400 F. P. Bowden and D. Tabor
The results for flat surfaces do not lie on a straight line, but it is clear that the values of the conductance are not very different from those observed with curved surfaces.
LOAD (6 ms.Wt )
Fig. 5
Magnitude of the area of contactWe may form an estimate of the actual area of contact in several ways:(i) From the observed value of the electrical conductance. The area
of contact is then given by na2, where a is obtained from equation (9).
on August 18, 2018http://rspa.royalsocietypublishing.org/Downloaded from

Bowden and Tabor Proc. Boy. A, vol. 169, Plate 25
* (30VaJL JLHOn) 3 D N V l O n ( 3 N O D 9NlSV3dONl
(Facing p. 400)
on August 18, 2018http://rspa.royalsocietypublishing.org/Downloaded from
INC
RE
ASI
NG
C
ON
DU
CT
AN
CE
—
*> IN
CR
EA
SIN
G
CO
ND
UC
TA
NC
E
Bowden and Tabor Proc. Roy. Soc., A ,vol. 169, Plate 26
Fig. 8
a ) Woac/s or% Steei
ft \ root A »-* iV^V
b) Steei on Steel (R»j»d }
b ) W<jo4 Metal on Steel c) Silver S.iver (<?,g,4|| I I I ■ I I I I I | | i n i 11 M i j
O Secs. O-1 O Secs..CMFig. 9 F ig 10
INC
RE
ASI
NG
C
ON
DU
CT
AN
CE
—
i» {D
AR
K
TR
AC
E)
on August 18, 2018http://rspa.royalsocietypublishing.org/Downloaded from

For small loads equation (5) is sufficiently accurate, but above a load of about 50 kg. the correction becomes appreciable and equation (9) must be used.
(ii) From microscopic examination of the impressions left on the surfaces of the contacts.
(iii) From calculations assuming plastic flow. Here we can assume that equation (7) holds. This involves a knowledge of the flow pressure of the metal. We do not know this with certainty, but some data are available (Taylor and Farren 1925; Nadai 1931; O’Neill and Greenwood 1932).
Approximate calculations by these three independent methods are given in Table I for contacts of crossed cylinders, of steel and silver. The conductivity of a metal is of course dependent on the pressure and the relation is given by the empirical expression Ap = A0(l 10 where the pressurep is expressed in g./cm.2. For silver n = 3*6 and for steel n is probably of the same order. Even at the region of contact where the pressure reaches the flow pressure of the material, the specific conductivity is altered only by a few per cent. The effect of this on the conductance of the junction is less than the experimental error and is neglected.
Table IExperimental area Calculated
Observed of contact sq. cm. area ofLoad conductance ,---------------- ------------------ , contact sq. cm.kg. mhos Electrical Visual plastic flow
Area of contact between stationary and moving surfaces 401
Steel contacts: r = 0 5 cm .; / = 107 g./cm.2; sp. cond. A = 75,000 mhos cm.1 1,000 0 00013 — 0-00015 2,200 0-00061 — 0-0005
50 6,200 0-0045 0-0045 0-005500 22,700 0-042 0-045 0-05
Silver contacts: r = 0*45 cm .; / = 2*5 x 106 g./cm.2; sp. cond. A = 620,000 mhos0-5 10,000 0-0002 — 0-00025 33,000 0-002 — 0-002
50 111,000 0-018 0-019 0-02500 550,000 0-15 0-19 0-2
Influence of the physical state of the surface on the electrical conductance.Some attempts were made to investigate the influence of the physical
state of the surface on the electrical conductance and hence on the area of contact. The surface of the steel cylinders was rubbed with a coarse file, so that it was as rough as possible and the conductance was compared with that of a very finely ground surface. No appreciable difference between the two was observed.
Vol. CLXIX. A. 26
on August 18, 2018http://rspa.royalsocietypublishing.org/Downloaded from

402 F. P. Bowden and D. Tabor
Discussion
An examination of fig. 1 shows that the measured values of the conductance between metal surfaces lie in the same order as the specific conductivities of the metals. Since the mechanical properties are not widely different, this suggests that the measured resistance is essentially metallic (or carbon/carbon) and is not that of oxides or contaminating films on the surface. I t would be an odd coincidence if the electrical conductivities of the oxides or other surface films stood in exactly the same order as the conductivity of the metals. I t is clear that if contaminating films are present between the surfaces they must be so thin that their contribution to the electrical resistance is very small.
The results show quite clearly tha t the conductance varies in an orderly manner with the applied load. If we assume elastic deformation of the metal to occur at the contact we know from equation (6) that the conductance should be proportional to the cube root of the load. On the other hand, equation (8) shows that if plastic flow occurs the conductance should be proportional to the square root of the load. Owing to the uncertainties involved in the conductance measurements it is not always easy to distinguish between these two possible characteristics. Fig. 3 does, however, indicate that the variation of conductance with load is in much better agreement with plastic than with elastic deformation. This is shown most clearly for high loads on contacts of silver in fig. 4, but the fact that it is valid for small loads too, means that even for loads of the order of 40 or 50 g. the metal flows.
For surfaces which, by their geometric form, make contact in a single region (e.g. crossed cylinders, or sphere-on-flat) the measured values of the conductance suggest that intimate contact occurs over the whole of the deformed area. This is shown very clearly in Table I. The area of contact between crossed cylinders has been calculated assuming plastic flow. This value is compared with experimental values obtained in two quite different ways—from measurements of the electrical conductance and from the size of the visual impression. I t will be seen that the area of contact deduced from these methods is in surprisingly good agreement with the calculated value. In fig. 5, curve I, contacts composed of crossed cylinders and sphere-on-flat are compared. Though for the latter contact the radius of curvature of the spherical surface varied by a factor of a t least ten, the absolute values of the conductance and the slope of the curves are almost identical. We can conclude that, provided the actual contact is localized in a single continuous area, the conductance and hence the real area of
on August 18, 2018http://rspa.royalsocietypublishing.org/Downloaded from

contact will be reasonably independent of the shape and radius of curvature of the surfaces.
The results for flat surfaces are shown in curves I I a and I I 6, fig. 5. I t will be seen that, although the possible area of contact is enormously greater than tha t of the curved surface, the observed value of the conductance is of the same order of magnitude. At a load of 5 kg. for example, the area of contact of the curved steel contact is 5 x 10~4 sq. cm. If nearly all the surface of the 21 sq. cm. flat were in contact, the area of contact and hence the conductance, would be ca. 40,000 times as great. Experiment shows in fact that it is only twice as great. I t is thus clear that only a small fraction of the area of the flat surfaces can be in intimate contact: they must touch at a number of legs or bridges. I t will also be noted that the conductance of both sets of flats is almost the same, although their apparent areas stand in a ratio of 30 : 1. We can conclude that the conductance is almost independent of the apparent area of the surfaces: it depends mainly on the load.
I t is difficult in the case of flat contacts to make an exact estimate of the real area of contact from the conductance measurements alone. The value of the conductance must depend both on the size of the metallic bridges and on their number. Since the spreading resistance of each bridge is inversely proportional to its diameter, and the area of contact is proportional to the square of the diameter, it follows that, for a given conductance the area of contact is inversely proportional to the number of bridges. We do not know this number with any certainty, though in the case of flat surfaces it is clear that the number of legs on which they rest cannot be less than three. Experiments suggest in fact, that the number of points of contact is greater than this. Thus when the surfaces were separated and examined, a very large number of small marks were observed distributed over the whole area. I t is not certain that contact occurred simultaneously at all these points, but as a conservative estimate we may assume that the surfaces were resting on ten legs. On this basis we can calculate the fraction of the apparent area really in contact, at any given load. The following results are for the 21 sq. cm. flats.
T a ble II
Area of contact between stationary and moving surfaces 403
Load Fraction of macroscopickg. area in contact300 1/130100 1/70020 1/10,000
3 1/170,00026-2
on August 18, 2018http://rspa.royalsocietypublishing.org/Downloaded from

404 F. P. Bowden and D. Tabor
I t is thus clear that for flat surfaces the real area of contact even for appreciable loads is a small fraction of the apparent area. The flat surfaces are held apart by small surface irregularities which form bridges of an essentially metallic nature. These bridges flow under the applied pressure or their number increases until their total cross-section is sufficient to enable them to support the applied load.
In general the load conductance curve for flat contacts appears to be steeper than for curved surfaces, but it is difficult to put forward a satisfactory quantitative hypothesis to explain this.*
2. The area of contact between moving surfaces
The measurements were extended to moving surfaces. The method of measuring the conductance was similar, except tha t the potentiometer was replaced by an instrument of rapid period such as an Einthoven galvanometer or a cathode-ray oscillograph. The friction was measured by a high-frequency apparatus similar to that described in the preceding paper. The lower surface was in the form of a flat plate and was driven at a uniform rate by a water piston. The upper surface which rested on it was usually curved. The conductance and the friction measurements were both photographed by the same moving-film camera, so that a simultaneous record of both quantities was obtained. The lower surfaces were ground flat and cleaned by the methods previously described.
Results
(1) Higher melting metal on lower melting metal.Fig. 6 a (Plate 25) shows the results obtained for a curved surface of
constantan sliding on a steel plate. The dark trace represents friction and the white trace the electrical conductance. The direction of motion is from right to left as shown by the arrow. The load was 430 g., and the speed 0*005 cm./sec.
Fig. 66 (Plate 25) was obtained with an upper surface of steel sliding on a flat tin surface. Other combinations, molybdenum on steel, nickel on steel, platinum on steel, steel on tin, lead on tin, platinum on silver, were used and the general result was the same, although the magnitude of the slip and of the conductance change varied with the nature of the metals. Fig. 6 c (Plate 25) shows the results for steel on steel.
* See, for example, Holm’s ingenious hypothesis of a “ sieve-resistance”. This would explain a slope of 1 for flat contacts. The absolute values would, however, be considerably different from the values he observes.
on August 18, 2018http://rspa.royalsocietypublishing.org/Downloaded from

(2) Lower melting metals on higher melting metals.In this case the upper curved contact had a melting point less than that
of the lower flat surface. The load and the speed were of the same order. Fig. 7 a is for tin on steel, fig. 7 6 for lead on steel, and fig. 7 c for zinc on steel (Plate 25). Other combinations of Wood’s metal on steel and Wood’s metal on nickel were used and gave similar results.
(3) Similar metals.Both the upper and the lower surfaces were made of the same metal.
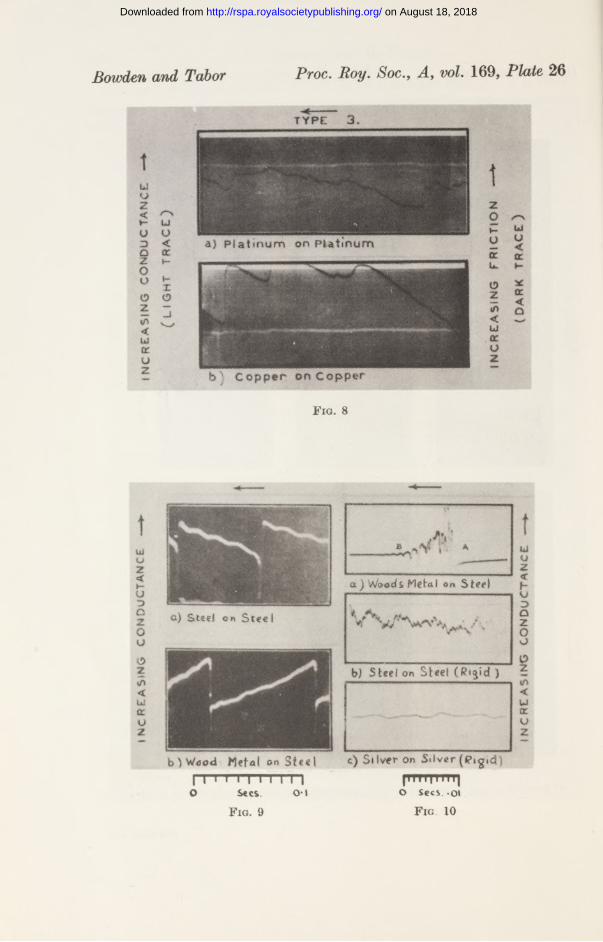
The results for platinum on platinum are shown in fig. 8a and for copper on copper in fig. 86 (Plate 26). Combinations of tin on tin, silver on silver and nickel on nickel gave similar results.
DiscussionThe change in area of contact during sliding.
I t is clear from these experiments that the area of contact between moving surfaces does not remain constant. The average value of the conductance is not very different from that observed at stationary surfaces, but large fluctuations may occur in it during sliding. These changes show a close correlation with the frictional stick-slip, and the exact behaviour depends upon the nature of the metals. In the case of a curved slider of high-melting metal sliding on a low-melting metal (figs. 5a, b) the area of intimate contact increases during the stick. The moment slip occurs there is a sudden decrease in this area. The results lend strong support to the suggestion put forward in the earlier paper, that the friction under these conditions {type 1) is due primarily to the small irregularities on the high-melting metal ploughing through the surface of the softer metal. The characteristic cut scratch is observed with this type of behaviour. Steel on steel behaves in a similar manner though this anomaly is probably due to its inhomogeneous nature (see preceding paper).
In the case of a low-melting metal sliding on one of high melting-point the behaviour is the opposite of this. An examination of figs. 7 a, 6, c shows that the conductance decreases during the stick. The moment after slip occurs it rises to a maximum value. This supports the suggestion that in this case {type 2) the local high pressure aided by the temperature rise caused by the frictional heat, welds or solders the lower-melting metal on to the surface of the higher melting one: the area of contact is then at a maximum. During the stick, the increasing pull will draw out these soldered junctions thinner and thinner (conductance decreasing) until they suddenly break and slip occurs. The process is then repeated.
Area of contact between stationary and moving surfaces 405
on August 18, 2018http://rspa.royalsocietypublishing.org/Downloaded from

406 F. P. Bowden and D. Tabor
When both surfaces are of the same metal, the conductance measurements show that the area of contact is somewhat greater and it remains much more constant during sliding. An examination of fig. 8 a (Plate 26), for example, shows that the average conductance between two platinum surfaces is about 1200 mhos as compared with about 100 mhos for platinum on steel. Only small variations occur in this value during sliding. The friction is high and shows slow fluctuations and the characteristic torn track is formed. This behaviour is generally observed with similar metals provided they are homogeneous. Again, these conductance measurements lend support to the suggestion that in the case of similar metals (type 3) a mutual welding of the two surfaces takes place. The local high pressures and temperatures will cause a flow of both surfaces which now contribute equally to the welded junctions. These mutual junctions will probably be more easily formed, and the real area of contact and the friction will tend to be greater. When movement occurs both surfaces will be damaged and the metal in the resulting track will be badly distorted and torn.
Calculation of area of contact.If we consider, in the case of a curved surface sliding on a flat plate, that
the maximum conductance A m corresponds to a single circular metallic junction of diameter 2a, then
or 2 a /l(Ai +A2)2AjA2
where ^ and A2 are the specific conductivities of the two metals. We may also form an estimate of 2a by direct microscopic measurement of the width of the track produced on sliding.
In calculating 2a from the conductance, the normal values of the electrical conductivity were used. As mentioned earlier, the pressure effect on A is very small and may be neglected. The effect of temperature, however, is considerably greater. Thus with most metals a rise in temperature of 10° C will decrease the conductivity by a few per cent. I t is very difficult to make an accurate correction for this effect because the temperature distribution at the surface irregularities is not known with certainty. Experiments have shown however tha t the high temperature is confined to a very thin layer on the surface (Bowden and Ridler 1936) so that the effect on the measured conductance is probably small. The calculated values of 2a can only be regarded as approximations. The temperature
on August 18, 2018http://rspa.royalsocietypublishing.org/Downloaded from

effect would if anything increase these values, and this would tend to bring them into better agreement with the visual observations.
Table I I I shows some values of 2 a calculated from the conductance and from visual measurements. The table is divided into three groups which correspond to the three types of sliding. The load was roughly the same in each case (about 400 g.) and the sliding speed ca 0*01 cm./sec. I t will be seen that when the upper curved surface is of the higher-melting metal {type 1) the agreement between the electrical and the visual measurements of the diameter of contact is quite good. The values are given in columns 3 and 4.
Area of contact between stationary and moving surfaces 407
T a b l e II I2a cm. Area of
contact AAfn Calc. Visual sq. cm.
mhos from Am track width Calc, from A.
Type 1Steel on tin 60 10-3 2-3 x 1 0 -3 001 x lO -4Nickel on steel 200 3 x 10⁻³ 4 x 10⁻³ 0 07 x 10-4Platinum on steel 150 2 x 10~3 1-2 x10-* 0-03 x 10~4Molybdenum on steel 330 4 x 10⁻³ 10 x10~3 0-12 x 10-4Steel on copper 700 8 x 10~3 10 x 1 0 -3 0*5 x 10“4Steel on steel 100 1*7 x 10-3 2-3 x 1 0 -3 0 03 x 10-4
Type 2Tin on steel 200 3 x 10⁻³ 50 x 1 0 -3 0-07 x 10-4Zinc on steel 100 M x 10-3 60 x 10~3 0-01 x 10-4
Type 3Platinum on platinum 1200 13 x 1 0 -3 18 x 1 0 -3 1-2 x 10~4Copper on copper 5000 9 x 10⁻³ 12 x 1 0 -3 0-6 x 10⁻⁴Nickel on nickel 1000 7 x 10⁻³ 10 x 10-3 0*4 x 10-4Silver on silver 6000 10 x 1 0 -3 17 x10~3 0-8 x 10⁻⁴
When the upper curved surface is of a lower-melting metal, however, the agreement is very bad. The observed track width is considerably wider than that calculated from the conductance. The large disparity between these two quantities is characteristic of this type of contact and is to be expected. The conductance depends upon the real area of contact, whereas the track width merely corresponds to a broad smear within which the real points of contact occur.
In the case of similar metals {type 3) is somewhat greater than that previously observed, and the values of 2a calculated by both methods are again in good agreement. The last column of the table shows the real
on August 18, 2018http://rspa.royalsocietypublishing.org/Downloaded from

408 F. P. Bowden and D. Tabor
area of contact calculated from the conductance measurements. These values are necessarily only approximate as already pointed out. I t will be seen that at this load the real area of contact lies between one ten- thousandth and one-millionth of a square centimetre. I t tends to be greater for surfaces of type 3 than for surfaces of types 1 and 2.
The sliding of flat surfaces.In order to determine how far the behaviour was influenced by the shape
of the surface, experiments were carried out with flat surfaces. The upper curved surface was replaced by a flat disk ca. 1 cm. in diameter. Experiments were made with tin on steel and steel on steel. The results were essentially the same as for a curved contact. The friction, the electrical conductance and the variations in these quantities were almost identical with those observed with a curved slider. Further experiments were carried out with large flat surfaces of steel 21 sq. cm. in area. Although the possible area in this case was some million times as great as that for a curved surface the actual value of the conductance was almost the same.
An interesting confirmation of this observation is given by measurements of the surface temperature of sliding metals. Bowden and Ridler (1936) have shown that when metals slide on one another the surface temperature may reach a high value. Some unpublished experiments (Ridler 1936) showed that the actual temperature reached is almost independent of the apparent area of the surfaces. Thus when the load and speed were kept constant (80 g. and 150 cm./sec. respectively) the recorded temperature of metal surfaces 0-008 sq. cm. in apparent area was 120° C. When the area was increased to 0-64 sq. cm. it was 90° C. I t is seen that although the possible area of contact had been increased by a factor of 80, the surface temperature rise was nearly as great. This suggests that the area at which the heat is liberated, tha t is the area of intimate contact, is approximately the same in both cases.
Analysis of the slip.The measurements so far described were carried out with an Einthoven
galvanometer, so that the observations were limited by the period of the instrument, which was approximately one-thousandth of a second. W ien a cathode-ray ospillograph was used the measurements could be extended to events happening in less than one hundred-thousandth of a second, so that a more detailed analysis of the conductance changes was possible.
A typical photograph showing in more detail the behaviour of metals of type 1 during slip is shown in fig. 9 (Plate 26). The time base was
on August 18, 2018http://rspa.royalsocietypublishing.org/Downloaded from
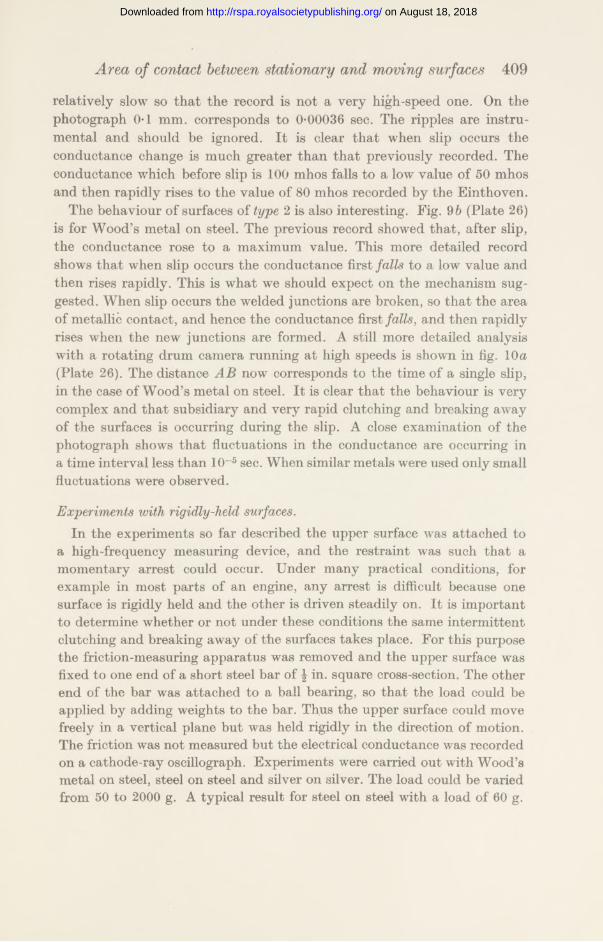
relatively slow so that the record is not a very high-speed one. On the photograph 0*1 mm. corresponds to 0*00036 sec. The ripples are instrumental and should be ignored. I t is clear tha t when slip occurs the conductance change is much greater than tha t previously recorded. The conductance which before slip is 100 mhos falls to a low value of 50 mhos and then rapidly rises to the value of 80 mhos recorded by the Einthoven.
The behaviour of surfaces of type 2 is also interesting. Fig. 96 (Plate 26) is for Wood’s metal on steel. The previous record showed that, after slip, the conductance rose to a maximum value. This more detailed record shows tha t when slip occurs the conductance first falls to a low value and then rises rapidly. This is what we should expect on the mechanism suggested. When slip occurs the welded junctions are broken, so that the area of metallic contact, and hence the conductance first falls, and then rapidly rises when the new junctions are formed. A still more detailed analysis with a rotating drum camera running at high speeds is shown in fig. 10a (Plate 26). The distance A B now corresponds to the time of a single slip, in the case of Wood’s metal on steel. I t is clear that the behaviour is very complex and that subsidiary and very rapid clutching and breaking away of the surfaces is occurring during the slip. A close examination of the photograph shows that fluctuations in the conductance are occurring in a time interval less than 10~5 sec. When similar metals were used only small fluctuations were observed.
Experiments with rigidly-held surfaces.In the experiments so far described the upper surface was attached to
a high-frequency measuring device, and the restraint was such that a momentary arrest could occur. Under many practical conditions, for example in most parts of an engine, any arrest is difficult because one surface is rigidly held and the other is driven steadily on. I t is important to determine whether or not under these conditions the same intermittent clutching and breaking away of the surfaces takes place. For this purpose the friction-measuring apparatus was removed and the upper surface was fixed to one end of a short steel bar of \ in. square cross-section. The other end of the bar was attached to a ball bearing, so that the load could be applied by adding weights to the bar. Thus the upper surface could move freely in a vertical plane but was held rigidly in the direction of motion. The friction was not measured but the electrical conductance was recorded on a cathode-ray oscillograph. Experiments were carried out with Wood’s metal on steel, steel on steel and silver on silver. The load could be varied from 50 to 2000 g. A typical result for steel on steel with a load of 60 g.
Area of contact between stationary and moving surfaces 409
on August 18, 2018http://rspa.royalsocietypublishing.org/Downloaded from

410 F. P. Bowden and D. Tabor
and a surface speed of 0-025 cm./sec. is shown in fig. 106 (Plate 26). I t is clear that variations in the electrical conductance and hence in the area of contact still occur during sliding. These variations are smaller than those observed with the first type of restraint and they are very rapid. On the photograph 0-1 mm. corresponds to 7 x 10~5 sec. The sliding speed is 0-025 cm./sec., so that the relative movement of the surfaces daring this time is only 10~6 cm. Although this relative movement corresponds only to the distance of a few atoms the measurements show that a clutching and breaking away occurs. We should expect that the length of the stick would be controlled by the elasticity of the moving system and in the limiting case by the elasticity of the surface irregularities themselves.
Amontons’s law.There has been considerable difficulty in explaining the experimental
observations, first made by Amontons, that the tangential frictional force is directly proportional to the normal load. I t was usual to assume that elastic deformation of the solids occurred, so tha t the real area of contact A should vary as the two-thirds power of the normal load. A good discussion of this has been given recently by Adam (1938), who points out that on such an assumption Amontons’s law would imply that the tangential frictional force must increase in proportion to A i, “ a result so unlikely that the meaning of the law is still mysterious” .
I t is clear from these measurements, however, that the deformation of the surface irregularities is not elastic: it is plastic. The real area of contact is directly proportional to the normal load. The difficulty then disappears. The total cross-section of the junctions and hence the tangential force required to break them will be directly proportional to the applied load, and we should expect Amontons’s law to hold true.
In the same way these measurements offer an explanation of Amontons’s other observation, tha t the friction is independent of the macroscopic area of the surfaces. Since the area of intimate contact is nearly independent of the apparent area we should naturally expect that the friction would also be independent of the size of the surface.
Lubricated surfaces.Some preliminary experiments were made with steel surfaces lubricated
under -boundary conditions. With mineral oils and pure hydrocarbons the electrical conductance was of the same order of magnitude as that observed with unlubricated surfaces, indicating that the conductance w as essentially metallic. When the surfaces were set in motion, the same charac
on August 18, 2018http://rspa.royalsocietypublishing.org/Downloaded from

teristic fluctuations in the friction and conductance occurred as for unlubricated metals. The fall in conductance during the slip was, however, considerably greater: in some cases it fell almost to zero. This suggests tha t during the slip a relatively thick wedge of oil may form between the surfaces. When long-chain fatty acids were used, so tha t continuous sliding occurred, the conductance was still high, but it showed little variation.
The 'pressure on boundary films.The fact tha t the real area of contact is so small also has important
practical implications. Even with lightly loaded surfaces the local pressure between unlubricated surfaces may be sufficiently great to cause the flow of steel. When large surfaces are used it does not necessarily mean that the real pressure is much less but merely that the points of contact are more widely distributed.
If the surfaces .are separated by a thick layer of oil so that the conditions are those of fluid lubrication the pressure will, of course, be inversely proportional to the area of the surfaces. Under boundary lubrication conditions, however, this will not be the case since the load is carried by the surface irregularities. In this sense all boundary lubricants may be extreme pressure lubricants. Unless the lubricant molecule possesses an active group capable of attaching it very firmly to the surface, the local high pressures will force it from underneath the points of contact. When very heavy loads are used (the so-called “ extreme-pressure” conditions) the local pressure may not in reality be very much greater since it cannot exceed the flow pressure of the metal. The frictional heat liberated, however, and the local surface temperatures may under these conditions be very great. As shown elsewhere (Bowden and Ridler 1936) “ extreme-pressure” lubricants should perhaps be called “ extreme-temperature” lubricants.
The work described above was carried out as part of the programme of the Lubrication Research Committee and is published by permission of the Department of Scientific and Industrial Research. The authors wish to express their thanks to the Royal Society and to the Chemical Society for grants for apparatus.
Area of contact between stationary and moving surfaces 411
Summary
An estimate of the real area of contact between stationary and between moving metal surfaces has been made by electrical and by visual means. Experiments with stationary surfaces show that the area of intimate contact is very small. I t varies with the pressure, but for flat steel surfaces
on August 18, 2018http://rspa.royalsocietypublishing.org/Downloaded from
412 F. P. Bowden and D. Tabor
it may be less than one ten-thousandth of the apparent area. The real area of contact is not greatly affected by the size, shape and degree of roughness of the surface: it depends mainly on the pressure. The general behaviour is consistent with the view that the surfaces are held apart by small irregularities. This means that even with lightly loaded surfaces the local pressure may be sufficiently great to cause steel to flow plastically. This conclusion is supported by the observed relation between the pressure and the electrical conductance.1 The slope of such a curve indicates that, at the points of contact, plastic flow of the metal has occurred. Although the stresses may cause elastic deformation in the bulk of the metal, the experiments suggest that the irregularities on which the bodies are supported are crushed down until their cross-section is sufficient to enable them to support the applied load.
Measurements made with moving surfaces show that the area of contact is not constant but is fluctuating rapidly during sliding. A detailed analysis shows a remarkable correlation between these fluctuations and the frictional and temperature changes described in an earlier paper. I t is clear that an intermittent clutching and breaking away of the surfaces is taking place and the results support the view that metallic junctions between the metals are being rapidly formed and broken. The nature of these junctions depends on the relative physical properties of the two metals and there is again evidence that three main types may occur.
The conductance measurements show that even if the metals are lubricated with mineral oils and other lubricants, metallic contact may still occur through the film of lubricant. When the surfaces slide, fluctuations in the area of contact are observed and the behaviour may be essentially the same as for unlubricated surfaces.
R eferences
Adam, N. K. 1938 “ The Physics and Chemistry of Surfaces”, p. 232. Oxford Univ. Press.
Aur6n, T. E. 1903 Ark. Mat. Astr. Fys. 1, 25-41.Bidwell, S. 1883 Proc. Roy. Soc. A, 35, 1-19.Binder, L. 1912 Elektrotech. u. Maschinenb. 38, 781-8.Bowden, F. P. and Ridler, K. E. W. 1936 Proc. Roy. Soc. A, 154, 640-56. Browning, W. 1906 J . Instn Elect. Engrs, 37, 372-4.Finch, G. I., Quarrell, A. G. and Wilman, H. 1935 Trans. Faraday Soc. 31, 1050-80. Hertz, H. 1881 J. reine angew. Math. 92, 156-71. Also “ Collected Works.”Holm, R. 1922 Z. tech. Phys.3, 290-4, 320-7, 349-57.
— 1925 Z. tech. Phys. 6, 166-72.— 1927 Z. tech. Phys. 8, 141-54.— 1929 Wiss. Verojf. Siemens-Konz. 7, 2, 217-71.
on August 18, 2018http://rspa.royalsocietypublishing.org/Downloaded from

Holm 1931 Wi88. Veroff. Siemens-Konz. 10, (4), 1-19, 20-64.Holm, ft. and Friman, E. 1926 Z. tech. Phys. 7, 198-200.Holm, R. and Holm, E. 1929 Wise. Veroff. Siemens-Konz. 7, 2, 272-305.Knauer, F. and Stem , O. 1929 Z. Phys. 53, 779-91.Maxwell, C. 1873 “ Electricity and Magnetism”, 1, art. 308.Meyer, A. 1898 Ofvers. VetenskAkad. Fork., Stockh., 55, 199-215.Nadai, A. 1931 “ Plasticity” . New York: McGraw-Hill Book Company.O’Neill, H. and Greenwood, H. 1932 J . Inst. Met. 48, 47-67.Pedersen, P. O. 1916 Electrician, 76, 589—91, 625-7.Taylor, G. I. and Farren, W. S. 1925 Proc. Roy. Soc. A, 107, 422-51.Thomson, G. P. 1934 Phil. Mag. 18, 640-56.
Area of contact between stationary and moving surfaces 413
The electronic structure of some polyenes and aromatic molecules
VII. Bonds of fractional order by the molecular orbital method
B y C. A . Co ulso n
University Chemical Laboratory and Trinity College, *
( Communicated by J. E. Lennard- Jones,F.R.S.— Received 3 September 1938)
1. Introduction
I t is known that in aromatic molecules the individual links have a length which is neither that of a pure single bond, nor of a pure double bond, but which is, in general, intermediate between the two. In earlier papers of this series (Lennard-Jones 1937; Penney 1937) two methods have been outlined for calculating these lengths and the energies associated with them. An approximate description of a particular link can be given if we assign to it an order. This order will be the sum of two parts, the one from the (r-bonds which is assumed to have the value unity in all cases, and the other from the Tr-bonds. We may call this latter contribution the “ mobile order” p, since it arises from the motion of those electrons which Lennard- Jones (1937) calls “ mobile electrons” . For a pure single bond such as ethane, the total order is 1; for a pure double bond such as ethylene, the
* Now at University College, Dundee.
on August 18, 2018http://rspa.royalsocietypublishing.org/Downloaded from