Embed Size (px)
Citation preview

0
Tezukayama RIEB Discussion Paper Series No. 3
Airport Pricing of Private Airports in an Asymmetric Hub–Spoke Network
MORIMOTO, Yu
Graduate School of Economics, Kyoto University
TERAJI, Yusuke
Faculty of Economics, Tezukayama University
First Draft: May 2013
Revised Version: July 2015
Tezukayama University
Research Institute for Economics and Business
7-1-1 Tezukayama, Nara 631-8501, Japan
1
Airport Pricing of Private Airports in an Asymmetri c Hub–Spoke Network1)
MORIMOTO, Yu and TERAJI, Yusuke
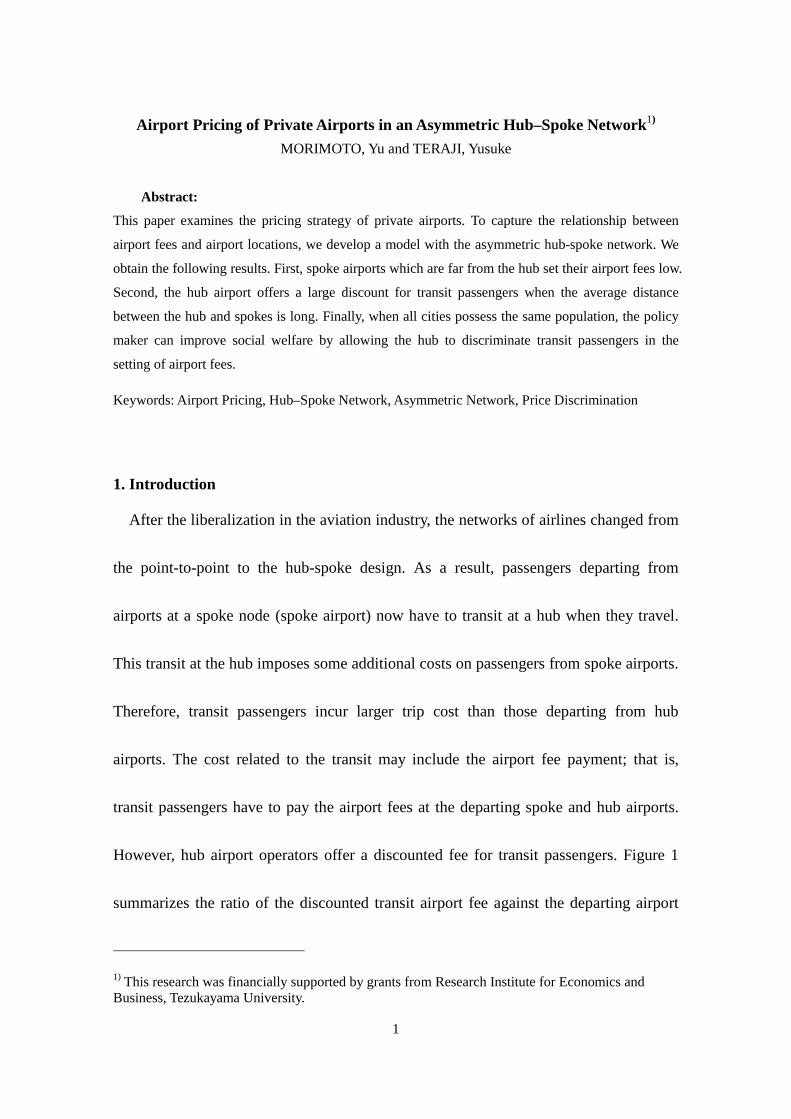
Abstract:
This paper examines the pricing strategy of private airports. To capture the relationship between
airport fees and airport locations, we develop a model with the asymmetric hub-spoke network. We
obtain the following results. First, spoke airports which are far from the hub set their airport fees low.
Second, the hub airport offers a large discount for transit passengers when the average distance
between the hub and spokes is long. Finally, when all cities possess the same population, the policy
maker can improve social welfare by allowing the hub to discriminate transit passengers in the
setting of airport fees.
Keywords: Airport Pricing, Hub–Spoke Network, Asymmetric Network, Price Discrimination
1. Introduction
After the liberalization in the aviation industry, the networks of airlines changed from
the point-to-point to the hub-spoke design. As a result, passengers departing from
airports at a spoke node (spoke airport) now have to transit at a hub when they travel.
This transit at the hub imposes some additional costs on passengers from spoke airports.
Therefore, transit passengers incur larger trip cost than those departing from hub
airports. The cost related to the transit may include the airport fee payment; that is,
transit passengers have to pay the airport fees at the departing spoke and hub airports.
However, hub airport operators offer a discounted fee for transit passengers. Figure 1
summarizes the ratio of the discounted transit airport fee against the departing airport
1) This research was financially supported by grants from Research Institute for Economics and Business, Tezukayama University.

2
fee for the five largest airports in Europe in 2011: London Heathrow (LHR), Charles de
Gaulle (CDG), Frankfurt (FRA), Amsterdam (AMS) and Madrid (MAD). In Figure 1,
the degree of the discount differs among these five airports: LHR offers the highest
transit fee, 82% of the departing fee, while MAD offers the lowest, 53% of the
departing fee. Here, the fees include both airline fees (landing fees, noise charges and
parking charges) and passenger fees (the Passenger Service Facility Charge (PSFC) and
Passenger Security Service Charge (PSSC)). The object of discount is the latter.
The formation of the hub-spoke network may also affect the spoke airport fee. Figure
2 shows the relationship between the fee of European airports and the minimal distance
to the five largest airports in Europe: LHR, CDG, FRA, AMS, and MAD. Each dot
represents an European airport with more than one million passengers in 2011, while the
bold line in Figure 2 represents the fitted line. The fitted line may suggest that the
airport fee decreases as the minimal distance to the major hubs increases. This paper
aims to clarify the mechanisms of the data presented in Figures 1 and 2; that is, (i) why
do spoke airports, which are farther from the hubs, set their airport fees lower and (ii)
what is the determinant of the discount rate for the transit passengers offered by hub
airports?
<Figure1: HERE>

3
<Figure2: HERE>
Silva and Verhoef (2013), Silva et al. (2014), Pels and Verhoef (2004) and Czerny and
Zhang (2015) examined welfare-maximizing public airports. These studies showed that
optimised airport charges internalise congestion externalities and correct the
inefficiency caused by airlines’ market power exertion. However, research focused on
private airports is needed because many airports all over the world, especially in the
United Kingdom, have been privatised, or undergoing the process of privatisation.
Focusing on the private airport setting, airport competition is the largest concern. Teraji
and Morimoto (2014) explained the mechanism whereby airports in relatively small
cities are chosen as hub airports by the model in which two airports compete for the hub
position. Kawasaki (2014) studied price discrimination strategy of two competing
airports. Czerny et al. (2013) focused on competition between two ports in two
countries for demand in a third region. These studies have a problem in which they
assume a symmetric network or focus only on one or two airports.
We develop the model with private airports in an asymmetric hub–spoke network to
analyse how distance between the hub and spoke airports affects airport charges. In the
model, spoke airports locate at an arbitrary distance from the hub and the number of
spoke airports is also arbitrary.

4
The rest of this paper is organized as follows. In Section 2, we describe the model,
which is used to clarify the reason why spoke airports that are farther from the hubs set
their airport fees lower and what affects the discount rate for the transit passengers at
hub airports. In Section 3, we solve the game among airports and compare the analytical
results with some stylized facts described above. In Section 4, we derive the welfare
effect for each spoke market and analyse how the distance to the hub affects the welfare
loss of each market. In Section 5, we suggest the discriminatory pricing policy to
improve the social welfare. Finally, Section 6 states concluding remarks.
2. The Model
Let us consider a situation in which an airline connects airports with a foreign
country by forming a hub-spoke network as shown in Figure 3.2 In Figure 3,
represents the distance between the hub and each spoke s, and we normalize the
distance between the hub and foreign country to 1. Hereafter, we refer to the hub airport
as Airport h, each spoke airport as Airport s ( ), and City i
( ) is the city in which Airport i is located. The population of City i is
represented by and we normalize the population of City h to 1, .
2 Long-haul flights from Airport h to the foreign county represent flights such as those from Europe to Asia or to the United States.

5
<Figure 3: HERE>
The economy has three agents: airports, airline, and consumers. The sequence of
decisions among these agents is as follows. First, all airports set their airport fees
simultaneously to maximize their revenue. Second, the airline sets its fares to maximize
its profit. Finally, consumers in each city decide their demand for flights to the foreign
country. Hereafter, we trace the decision-making process.
The demand for air services is
where denotes the airfare. and denote the airport fees of the hub for the
departing passengers and for the transit passengers, respectively. We call the former
“departing fee” and the latter “transit fee.” In Eq. (1.2), is the airport fee of a spoke
airport. Hereafter, we refer to passengers departing from Airport h as “hub passengers”
and passengers departing from Airport s as “spoke passengers.”
The airline creates the hub-spoke network and provides two types of flights,
connecting flights between Airport h and each spoke airport, and direct flights between
Airport h and the foreign country. We assume that the airline’s operating cost is
proportional to the passenger-kilometer. Specifically, operating cost per passenger is
for the connecting flight and for the direct flight. The total operating cost is
6
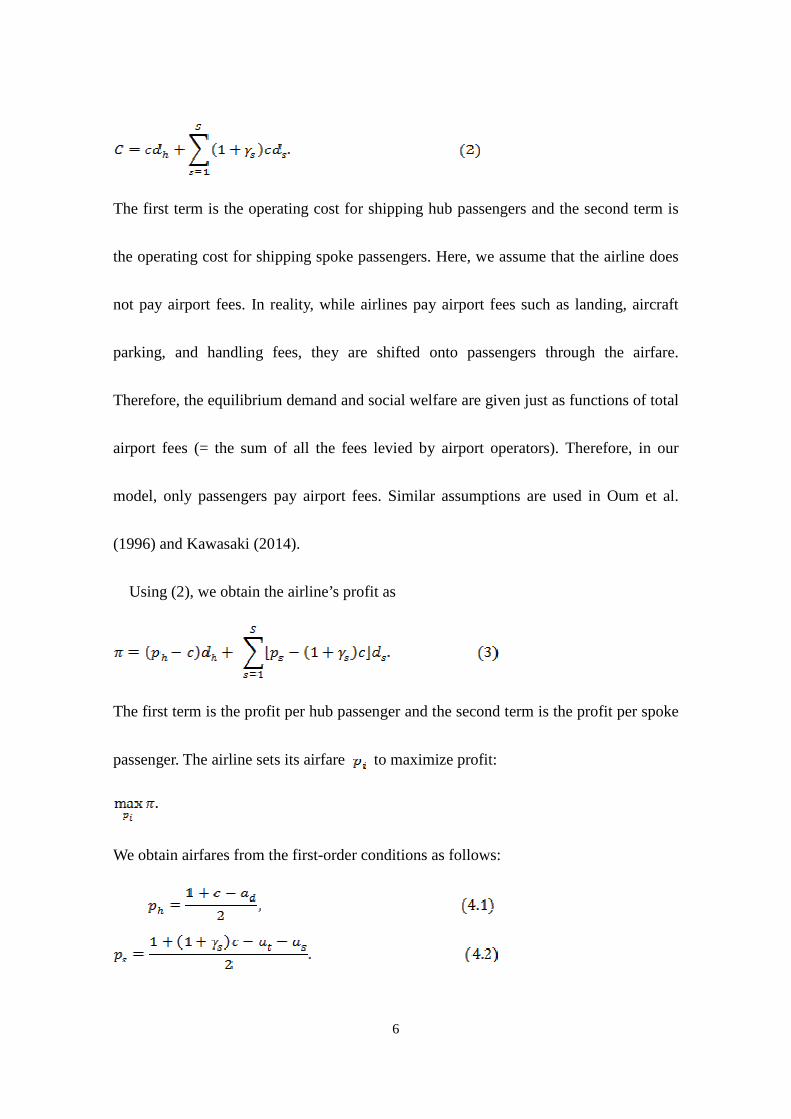
The first term is the operating cost for shipping hub passengers and the second term is
the operating cost for shipping spoke passengers. Here, we assume that the airline does
not pay airport fees. In reality, while airlines pay airport fees such as landing, aircraft
parking, and handling fees, they are shifted onto passengers through the airfare.
Therefore, the equilibrium demand and social welfare are given just as functions of total
airport fees (= the sum of all the fees levied by airport operators). Therefore, in our
model, only passengers pay airport fees. Similar assumptions are used in Oum et al.
(1996) and Kawasaki (2014).
Using (2), we obtain the airline’s profit as
The first term is the profit per hub passenger and the second term is the profit per spoke
passenger. The airline sets its airfare to maximize profit:
We obtain airfares from the first-order conditions as follows:
7
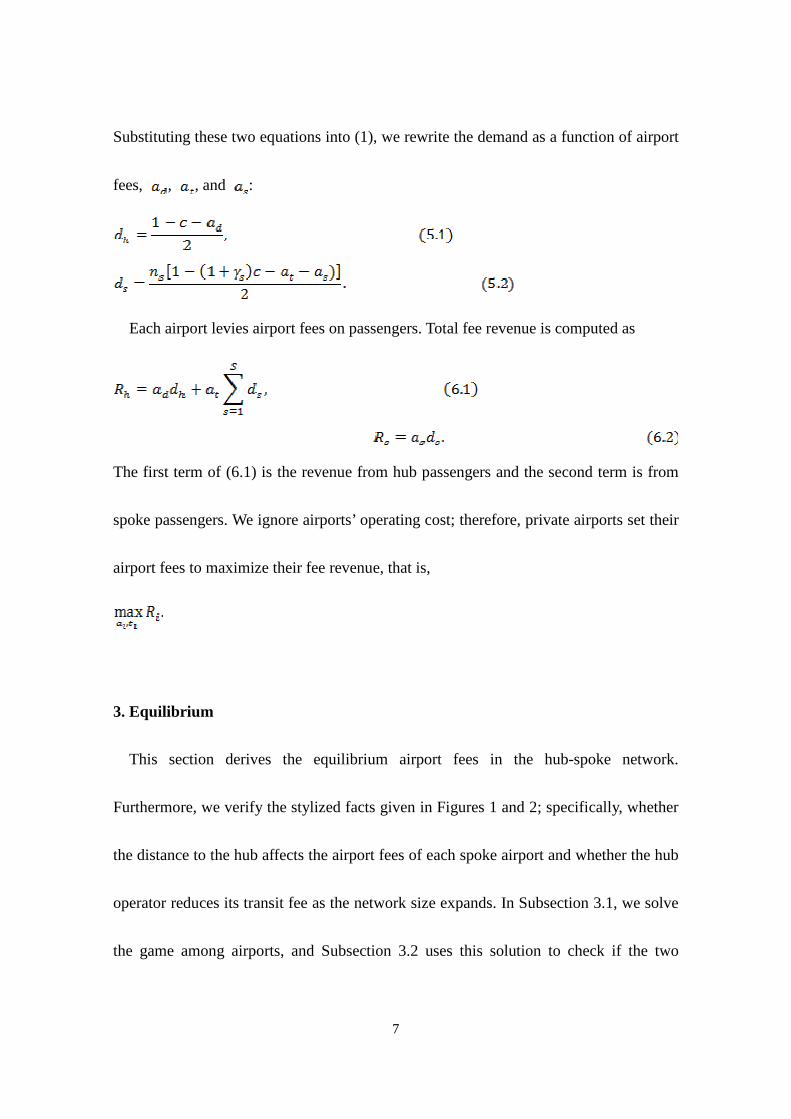
Substituting these two equations into (1), we rewrite the demand as a function of airport
fees, , , and :
Each airport levies airport fees on passengers. Total fee revenue is computed as
The first term of (6.1) is the revenue from hub passengers and the second term is from
spoke passengers. We ignore airports’ operating cost; therefore, private airports set their
airport fees to maximize their fee revenue, that is,
3. Equilibrium
This section derives the equilibrium airport fees in the hub-spoke network.
Furthermore, we verify the stylized facts given in Figures 1 and 2; specifically, whether
the distance to the hub affects the airport fees of each spoke airport and whether the hub
operator reduces its transit fee as the network size expands. In Subsection 3.1, we solve
the game among airports, and Subsection 3.2 uses this solution to check if the two

8
stylized facts work in our setting.
3.1. Equilibrium Airport Fees
Solving each airport’s revenue maximizing problem, we obtain the best reaction
functions as follows:
Here, is the population-weighted average distance between the
hub and spokes. See appendix A for the derivation of the best responses and
equilibrium airport fees. According to (7), we obtain Lemma 1:
Lemma 1
The transit fee of the hub and the airport fee of spoke airports are strategic substitutes.
For spoke passengers, airport services at the hub and each spoke are complementary
goods. Therefore, if one airport increases its fee, the other airport has to decreases its
fee.
By solving (7), we obtain the equilibrium airport fees as

9
3.2. Pricing strategies of private airports
In this subsection, we discuss pricing strategies by focusing on the distance. We start
with airport fees of spoke airports. Hereafter, Airport is farther from the hub than
Airport s, that is, . From (8.2), we obtain
This result is summarized in Proposition 1.
Proposition 1
Airport fees of the spoke airport decreases as the distance to the hub, , increases.
Demand for connecting flights decreases and becomes more elastic as the distance
between a spoke airport and the hub increases because airfares become higher due to the
airline’s higher operating cost. Therefore, the spoke airport lowers its airport fee to
boost demand. This result explains the fitted line in Figure 2. When the distance to the
hub is long, the spoke airport chooses the lower airport fee, which offsets the higher
airfare and increases the demand.
We move to pricing strategies of the hub airport and investigate the discount for
transit passengers. According to (7.1) and (8.1), we obtain the ratio of the transit fee to

10
departing fee as follows:
Differentiating (9) with respect to , we obtain Proposition 2.
Proposition 2
The ratio of the transit fee to the departing fee decreases as the weighted average
distance, , increases.
The hub lowers its transit fee and compensates for higher airfare of spoke routes to
attract more transit passengers when spoke airports are located far from the hub. On the
other hand, the departing fee is independent from the location pattern of spoke airports.
Therefore, the transit fee gets relatively small compared to the departing fee as the
average distance becomes large. Note that in Figure 1, the discount ratio of MAD is the
lowest among the five largest airports. This can be interpreted as follows. Since MAD
locates at the fringe of Europe compared to the other four airports, the operator of MAD
discounts the transit fee more than the others to attract more transit passengers from
spoke airports.
4. Welfare Analysis
This section clarifies the effect of distance to the hub upon the social welfare for each
spoke route. To deal with this problem, we designate Route s as the route from Airport s

11
to the foreign country via the hub. We define the social welfare for Route s as the gross
consumer benefit minus the social cost.
The first term is the lower part of the inverse demand function and the second term is
the operating cost. The social welfare in the equilibrium is
Here, and .
At the optimum, airfare should be equal to the airline’s marginal cost, and airport fees
should be zero. Therefore, the social welfare in the optimum, , is
See Appendix B for the derivation of these social welfare functions. The welfare loss is
, and we define the welfare loss ratio on Route s as
This ratio indicates the degree of market distortion. A large means large welfare loss
and large market distortion.
To analyze the relationship between the welfare loss and the distance, let us compare
the two spoke airports, and ( ). From (13), we can state

12
Since, , then : therefore,
. Summarizing this, we obtain Proposition 3.
Proposition 3
The welfare loss ratio, , increases as the distance between the hub and spoke, ,
increases.
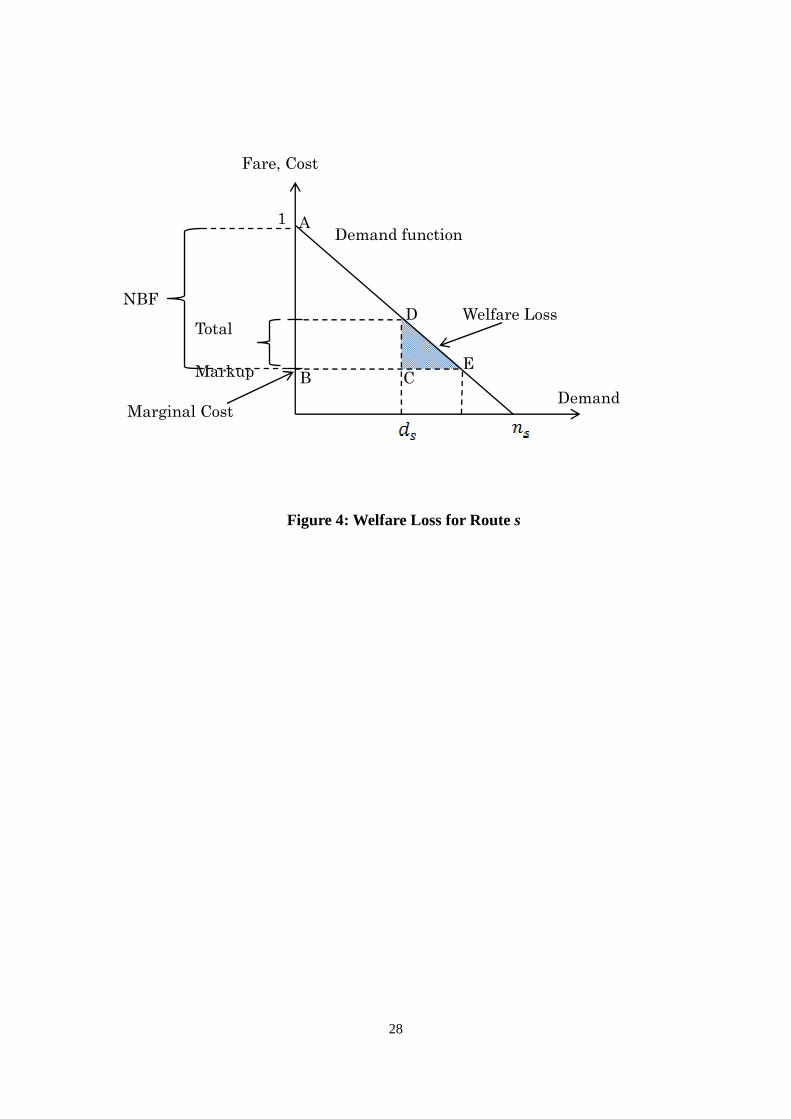
<Figure 4: HERE>
This result is derived from the hub’s transit fee which is identical for all transit
passengers. To clarify this mechanism, we define the “Net Benefit of the First trip
( ” and the “Total Markup ( .” captures the net social gain of the first
trip along Route s, which is computed as the highest willingness to pay (equal to unity)
minus marginal cost of the flight operation, . That is, .
captures the aggregate private gains of the airline, the hub and Airport s: that is,
In Figure 4, the area CDE is the welfare loss and the area ABE is the social welfare in
the optimum. Since the slope of the demand curve is unity, according to Figure 4, the
welfare loss ratio is written as . While both and are
13
decreasing in , the decrease of is less significant than due to the
identical transit fee at the hub. Therefore, is increasing in .
In this section, we analyzed social welfare for each route under the identical transit
fee. Next, we evaluate the welfare effect of the “discriminatory fee scheme” under
which the hub can set different transit fees for each route.
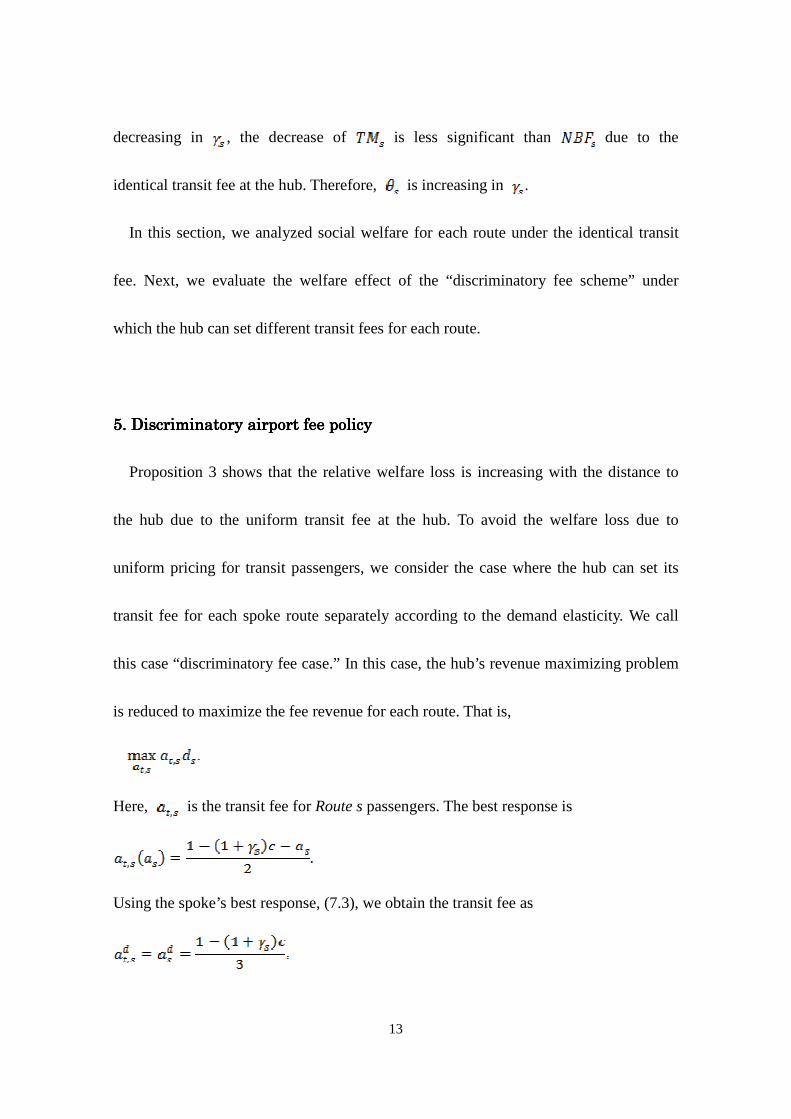
5. Discriminatory airport fee policy5. Discriminatory airport fee policy5. Discriminatory airport fee policy5. Discriminatory airport fee policy
Proposition 3 shows that the relative welfare loss is increasing with the distance to
the hub due to the uniform transit fee at the hub. To avoid the welfare loss due to
uniform pricing for transit passengers, we consider the case where the hub can set its
transit fee for each spoke route separately according to the demand elasticity. We call
this case “discriminatory fee case.” In this case, the hub’s revenue maximizing problem
is reduced to maximize the fee revenue for each route. That is,
Here, is the transit fee for Route s passengers. The best response is
Using the spoke’s best response, (7.3), we obtain the transit fee as
14
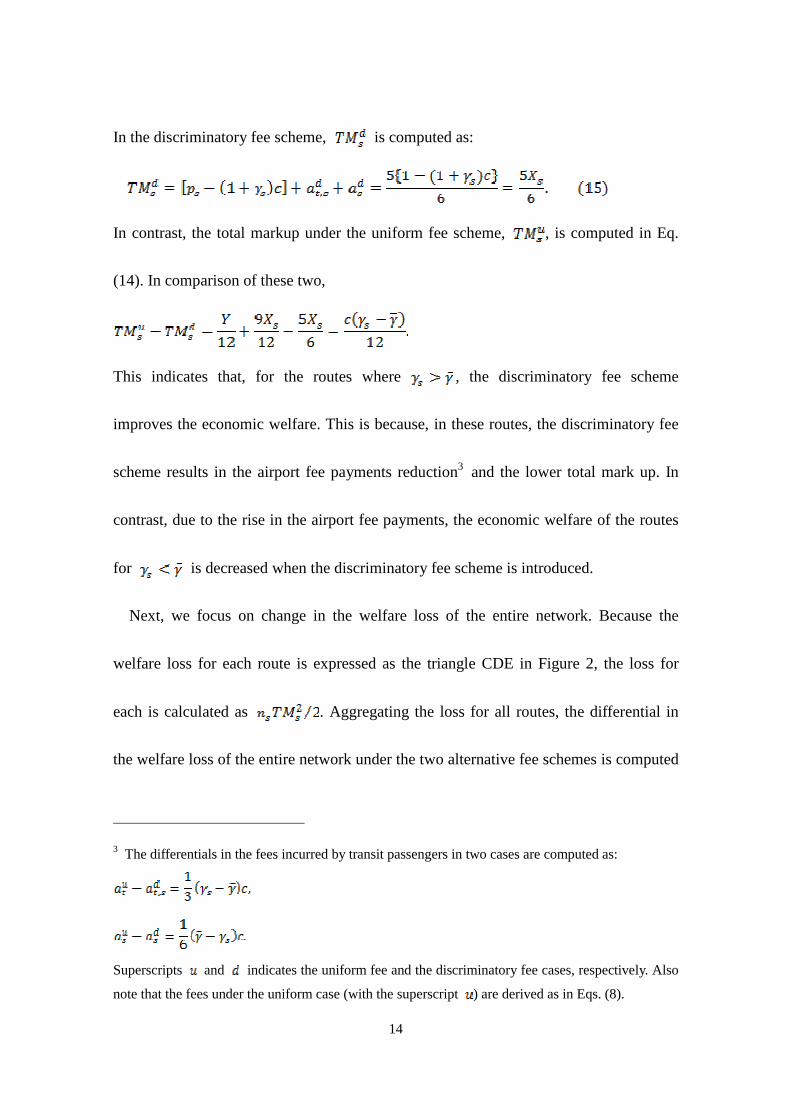
In the discriminatory fee scheme, is computed as:
In contrast, the total markup under the uniform fee scheme, , is computed in Eq.
(14). In comparison of these two,
This indicates that, for the routes where , the discriminatory fee scheme
improves the economic welfare. This is because, in these routes, the discriminatory fee
scheme results in the airport fee payments reduction3 and the lower total mark up. In
contrast, due to the rise in the airport fee payments, the economic welfare of the routes
for is decreased when the discriminatory fee scheme is introduced.
Next, we focus on change in the welfare loss of the entire network. Because the
welfare loss for each route is expressed as the triangle CDE in Figure 2, the loss for
each is calculated as . Aggregating the loss for all routes, the differential in
the welfare loss of the entire network under the two alternative fee schemes is computed
3 The differentials in the fees incurred by transit passengers in two cases are computed as:
Superscripts and indicates the uniform fee and the discriminatory fee cases, respectively. Also
note that the fees under the uniform case (with the superscript ) are derived as in Eqs. (8).

15
as:4
If this sign is negative, the discriminatory fee scheme is more efficient than the uniform
scheme; that is, the discriminatory fee scheme improves the economic welfare. To
obtain a clear result, we assume that all spoke cities have the same population, that is,
. We rewrite Eq. (16) as:
where is the variance of [see Appendix C for derivation of Eq. (17)]. This result
is summarised as follows:
Proposition 4
When all the spoke cities have an identical population size, the discriminatory fee
scheme is more efficient than the uniform scheme in terms of the entire welfare.
As shown in Proposition 4, when all the spoke cities have an identical population size,
the policy maker can improve social welfare by allowing airports to discriminate
passengers in setting airport fees. However in reality, price discrimination is banned in
many countries. For example, the EU Airport Charges Directive (2009/12/EC) prohibits
4 Since, under the two alternative fee schemes, the hub passengers incur an identical airfare and airport fee, the loss at the hub airport remains at the same level; therefore, we ignore the change in the loss at the hub.

16
differentiated fees to airlines using the same service. In the US, airports are compelled
to offer same fees for same service by 2013 FAA’s Policy Regarding Airport Rates and
Charges. Since these restrictions harm social welfare, we suggest that the discriminatory
fee scheme should be introduced based on our results.
6. Conclusion
In this study, we analyzed airport pricing in an asymmetric hub-spoke network and
obtained three results. First, the airport fees of a spoke airport decreases as the distance
to the hub increases. This is because the demand from the spoke airport gets relatively
smaller as the distance between the spoke and the hub increases, due to the high
operating cost and airfare. Second, the ratio of the transit fee to the departing fee
diminishes as the weighted average distance increases. Demand of a spoke route is a
decreasing function of the distance. Therefore, the hub lowers its transit fee in attempt
to boost the demand for transit services when spoke airports locate farther than average
from the hub. Third, the welfare loss ratio increases as the distance between the hub and
spoke increases. The mark-up ratio of a long spoke route is large due to the identical
transit fee. According to the large mark-up ratio, the welfare loss ratio also becomes
large. Moreover, we showed the possibility that the discriminatory fee scheme improves
17
the social welfare.
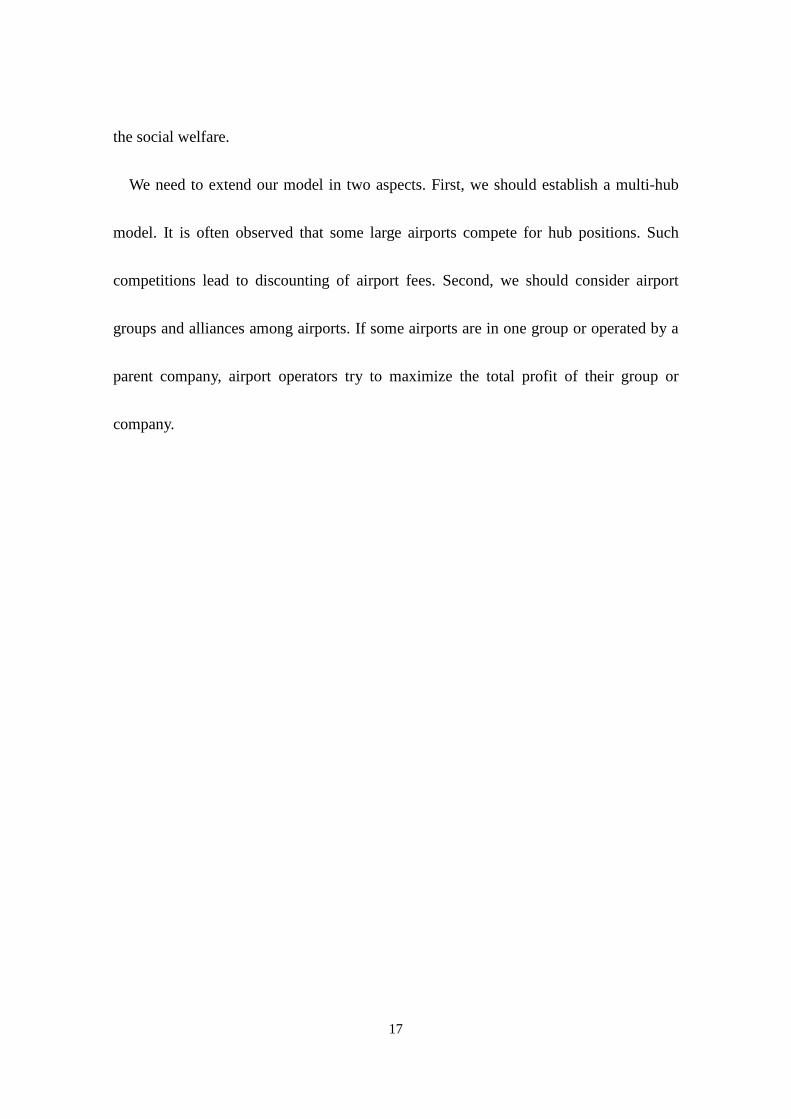
We need to extend our model in two aspects. First, we should establish a multi-hub
model. It is often observed that some large airports compete for hub positions. Such
competitions lead to discounting of airport fees. Second, we should consider airport
groups and alliances among airports. If some airports are in one group or operated by a
parent company, airport operators try to maximize the total profit of their group or
company.
18
Reference:Reference:Reference:Reference:
Czerny, A., Höffler, F. and Mun, S. (2013): “Port competition and welfare effect of
strategic
Privatization”, EWI Working Paper, No. 13/13
Czerny, A. and Zhang, A. (2015): “How to mix per-flight and per-passenger based
airport charges”, Transportation Research Part A, No.71, 77–95.
Kawasaki. A. (2014): “Uniform or discriminatory pricing in the international hub
airport”, The 4th Asian Seminar in Regional Science.
Oum, T. H., Zhang, A. and Zhang, A. (1996): “A note on optimal airport pricing in a
hub-and-spoke system”, Transportation Research Part B, No.30, 11–18.
Pels, E. and Verhoef, E. (2004): “The economics of airport congestion pricing”,
Journal of Urban Economics, No.55, 257–277.
Silva, H. and Verhoef, E. (2013): “Optimal pricing of flights and passengers at
congested airports and the efficiency of atomistic charges”, Journal of Public
Economics, No.106, 1–13.
Silva, H., Verhoef, E. and Berg, V. (2014): “Airline route structure competition and
network policy”, Transportation Research Part B, No.67, 320–343.
Teraji, Y. and Morimoto, Y. (2014): “Price competition of airports and its effect on the

19
airline network”, Economics of Transportation, No.3, 45–57.

20
Appendix A: Derivation of best responses.
We differentiate (6.1) with respect to and , and the first order conditions for
the revenue maximization problem are:
Here,
We differentiate (6.2) with respect to the total fee, , and the first order
condition is
Here,
We arrange (A.1), (A.2), and (A.5) for , and using (A.3) and (A.5) and
obtain
21
We delete in (A.6) using (A.7) and obtain
Here,
Solving (A.8) for , we obtain

22
Appendix B: Derivation of social welfare
(i) The social welfare in the equilibrium
Plugging (1) into (11), we delete and obtain
Plugging (4.2) into (B.1), we delete and obtain
Plugging (8.1) and (8.3) into (B.2), we delete and and obtain
Here, and
(ii) The social welfare in the optimum condition
Conditions for the optimum are that airfare should be equal to the airline’s marginal
cost and that airport fees should be zero. Under these conditions,
And then, the demand in the optimum is

23
Plugging (B.4)s into (11), we obtain the welfare function in the optimum as
24
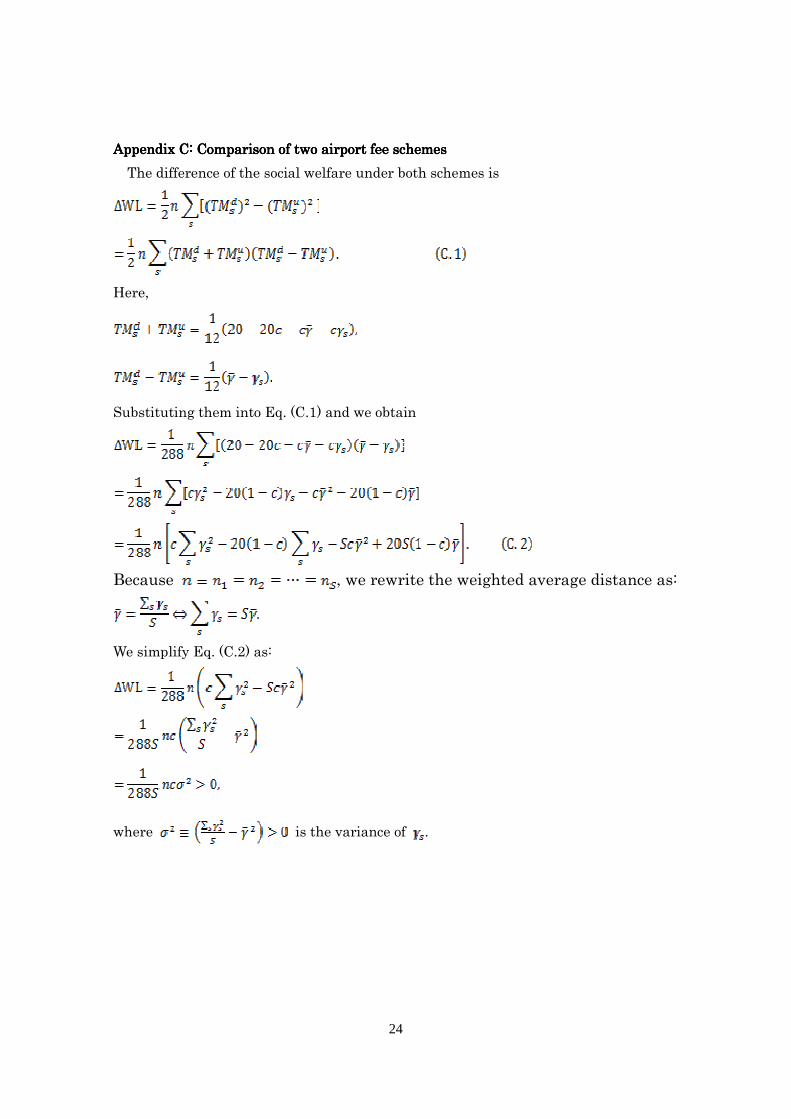
Appendix C: Comparison of two airport fee schemesAppendix C: Comparison of two airport fee schemesAppendix C: Comparison of two airport fee schemesAppendix C: Comparison of two airport fee schemes
The difference of the social welfare under both schemes is
Here,
Substituting them into Eq. (C.1) and we obtain
Because , we rewrite the weighted average distance as:
We simplify Eq. (C.2) as:
where is the variance of .

25
Figure 1: The ratio of the transit fee against the departing fee*
*This figure compares the fees of departing and transit passengers from a B787 passenger jet (280 seats).
To compute the fees, we use the IATA Airport, ATC and Fuel Charges Monitor (IATA, 2013) and set
several assumptions: the aircraft utilises the parking for three hours during the daytime; the loading factor
is 71%; and the MTOW (Maximum Takeoff Weight) is 301 t.

26
Figure 2: The relationship between the airport fee and the distance to the hub*
*: This figure demonstrates the departing fees for passengers boarding a B787 passenger jet (280 seats)
for European international airports, which are appeared in the IATA Airport, ATC and Fuel Charges
Monitor (IATA, 2013). In computing the airport charges, we set the same assumptions as in Figure 1.

27
Figure 3: Hub–Spoke Network
Distance:
Foreign country Distance:
Airport h
Airport s
28
Figure 4: Welfare Loss for Route s
Welfare Loss
Fare, Cost
Demand
NBF
Total
Markup
Demand function
1
Marginal Cost
A
B C
D
E