Embed Size (px)
Citation preview

ISSN 1833-4474
The Ageing, Longevity and Crowding Out Effects on Private and Public Savings: Evidence from Dynamic Panel Analysis
Kam Ki Tang School of Economics
The University of Queensland Brisbane, QLD 4072, Australia [email protected]
Brisbane St Lucia, QLD 4072, Australia
Benjamin ShiJie Wong School of Economics
The University of Queensland Brisbane, QLD 4072, Australia
THIS VERSION: December 2009
Life-cycle theory predicts ageing exerting long-term macroeconomic impacts through the reduction of private savings. Ageing can be brought either through a fall in fertility rates or a rise in longevity. However, empirical research studying macroeconomic determinants of savings generally regard age dependency as the measure capturing the process of ageing, overlooking longevity exerting an opposite impact on private savings. Since longevity and dependency are correlated determinants of private savings, omitting either potentially causes omitted variable bias. This paper considers the joint effects age dependency and longevity have on savings. In contrast to the wider literature, not only private, but also public, savings was studied. Applying dynamic panel modelling techniques to a dataset of 55 countries from 1972-2004, age dependency is found to still exert a negative effect on private savings. However, it is found that some of these reductions can potentially be offset by increased longevity. The study also reveals some level of crowding out of private sector savings associated with changes in public sector savings and find that the Ricardian Equivalence Hypothesis cannot be entirely dismissed. JEL Classification: J10, C33, E21, D91, H62 Keywords: Demography, Dynamic Panel, System GMM, Public Savings, Private Savings, Ricardian Equivalence
1
The Ageing, Longevity and Crowding Out Effects on Private and Public Savings: Evidence from Dynamic Panel Analysis
Kam Ki Tanga, b, c & Benjamin ShiJie Wong
School of Economics, University of Queensland
Abstract
Life-cycle theory predicts ageing exerting long-term macroeconomic impacts through the reduction of private savings. Ageing can be brought either through a fall in fertility rates or a rise in longevity. However, empirical research studying macroeconomic determinants of savings generally regard age dependency as the measure capturing the process of ageing, overlooking longevity exerting an opposite impact on private savings. Since longevity and dependency are correlated determinants of private savings, omitting either potentially causes omitted variable bias. This paper considers the joint effects age dependency and longevity have on savings. In contrast to the wider literature, not only private, but also public, savings was studied. Applying dynamic panel modelling techniques to a dataset of 55 countries from 1972-2004, age dependency is found to still exert a negative effect on private savings. However, it is found that some of these reductions can potentially be offset by increased longevity. The study also reveals some level of crowding out of private sector savings associated with changes in public sector savings and find that the Ricardian Equivalence Hypothesis cannot be entirely dismissed.
Keywords: Demography, Dynamic Panel, System GMM, Public Savings, Private Savings,
Ricardian Equivalence
JEL Classification: J10, C33, E21, D91, H62
a Kam Ki Tang would like to acknowledge the support by a grant from Australia Research Council (DP0878752).
b Corresponding author. The University of Queensland, School of Economics, QLD 4072, Australia. Tel: +617
3365 9796. Fax: +617 3365 7299. Email: [email protected]
c We would like to thank Michael Graff for his valuable comments on an earlier draft of the paper. Obviously all
remaining errors are ours.
2
I. INTRODUCTION Within a few decades, the demographic structures of most, if not all, economies will be vastly
different from today. Advances in medical science will conceivably result in continual
increases in life expectancy. This resulting rise in longevity will see a greater proportion of
people making it into higher age brackets. Coupled with the falling fertility rates that have
been observed for some time, demographic structure are expected to shift towards the aged.
The macroeconomic impact that ageing brings about cannot be understated. One of the
channels where demographic structures can exert its influence is through aggregate savings.
Ageing reducing savings has already been well established in the literature (see de Serres &
Pelgrin 2003; Loayza, Schmidt-Hebbel & Serven 2000). Nonetheless, despite the stylised fact
that ageing is largely a by-product of both higher life expectancy and falling fertility, the
direct link between life expectancy and savings has only recently started to come forth within
the literature through work such as Li, Zhang & Zhang (2007) and Kinugasa & Mason
(2007). The impact of life expectancy on savings are very different from those of an older
population structure, yet as life expectancy and aging dependency are highly correlated,
analysis of the impact of one without due consideration paid to the other is likely to result in
bias.
Using a large panel dataset covering 55 countries and data from 1972-2004, this paper sets
forth to investigate the joint effect of higher age dependency and rising longevity on savings
through the use of dynamic panel modelling with Generalised Methods of Moments (GMM)
estimation. The contributions of this paper are threefold.
Firstly, our model jointly considers the effects of higher age dependency and greater life
expectancy on savings, thus avoiding potential bias in previous studies that neglect one of the
two factors. In terms of theoretical foundation, our model is similar to that of Li, Zhang &
Zhang (2007) and Kinugasa & Mason (2007). What sets this paper apart is its empirical
approach motivated by our attempt to model the dynamics of savings. The observation that
savings exerting a fair degree of inertia makes it necessary to distinguish between the long
and short run impacts. This paper makes this distinction through the use of dynamic panel
models.
Secondly, most studies of demographic aged structures on savings tend to focus on either
national savings or private savings, with public savings largely neglected. This lack of
3
attention on public savings is rather curious considering their potential role in driving growth.
Furthermore, the more theoretical literature starts to question the exogeneity of public savings
(Alesina & Drazen 1991: Alesina & Tabellini 1990a and 1990b). Therefore, the other
contribution of this paper is to include public savings in the analysis alongside private and
national savings.
Lastly, theories like the substitutability between private and public expenditure and the
Ricardian Equivalence Hypothesis suggest the potential for changes in public savings to
crowd out private savings. The Ricardian Equivalence Hypothesis in the strictest sense
predicts that any changes in public savings stemming from changes in tax revenues will be
offset one for one by private savings, leaving national savings unchanged. If a crowding out
effect exists, policies aimed at changing the national savings rate should look to alter the
incentives to save within the private sector. This paper thus also sets forth to analyse to what
extent any impact ageing has on public savings are offset by responses in private savings.
The rest of the paper is organised as follows. Section II gives an overview of the literature.
Section III and IV offer a discussion of the data and methodology respectively. Section V
presents and discusses the results. The final section concludes.
II. Literature Review The Life-Cycle Hypothesis (LCH)1 suggests that individuals save during their economically
active years to finance their consumption during retirement (Modigliani & Brumberg 1954).
Accordingly, increases in the dependency ratio, be it youth or age dependency, will lead to a
decrease in average private savings. As national savings is largely made up of private
savings, it is expected that, ceteris paribus, increases in dependency ratios will reduce
national savings. The seminal work of Leff (1969) found that higher dependency ratios,
whether be it youth, aged or total dependency, reduced national savings2. Despite early
criticisms levelled by Gupta (1971), Goldberger (1973) and Ram (1982), among others,
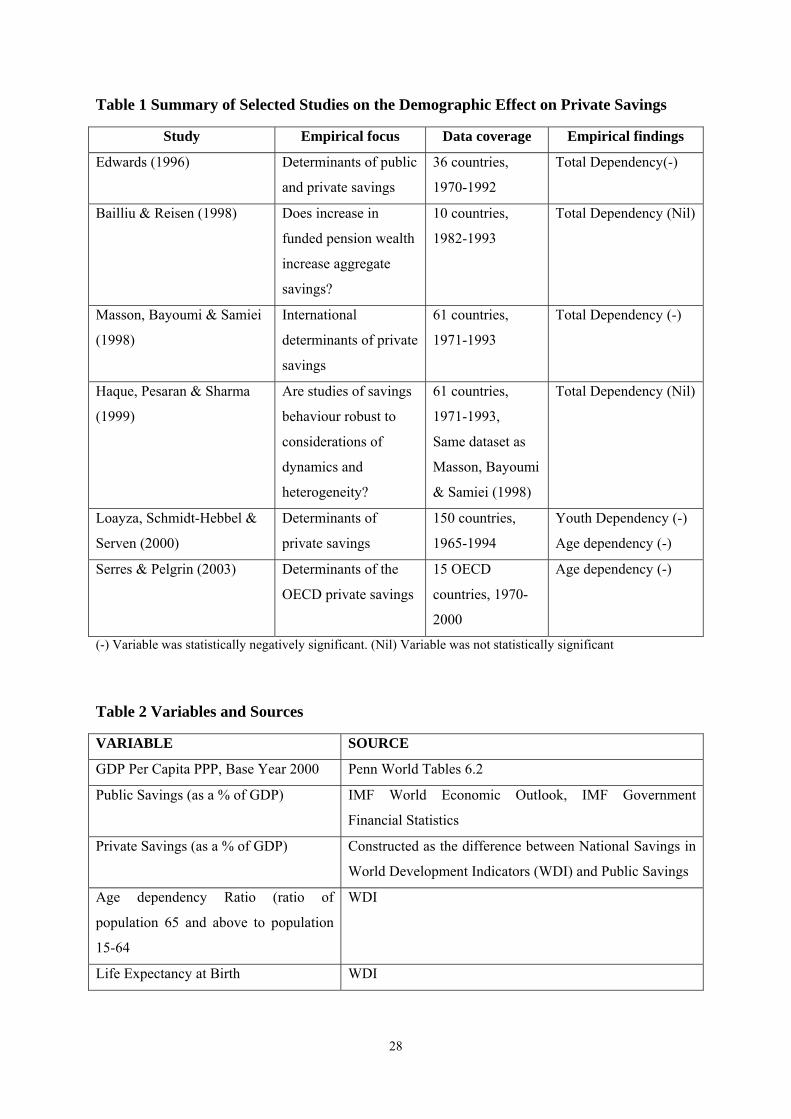
subsequent studies tend to support Leff’s conclusions. As indicated in Table 1, there exists
considerable consensus within the more recent literature that higher dependency acts as a
drag on savings.
1 The Permanent Income Hypothesis gives essentially the same predictions as the LCH. For simplicity, we only refer to the LCH in the paper. 2 While Leff used national savings, the theoretical underpinnings of his ideas were very much similar to the LCH. It was very likely he used national instead of private savings because of the lack of data.
4
[INSERT Table 1]
Previous work, however, has largely ignored the fact that ageing is brought about by, besides
falling fertility rates, longer life expectancy. While it is true that higher age dependency
would increase the number of non-savers relative to savers in the economy, thus bringing
about a reduction in the private savings rates in aggregation, this idea largely rests upon the
assumption that although saving rates vary amongst different age groups, the saving rate of
individual age group remains largely unchanged over different cohorts. Closer examination of
the LCH suggests that this might not necessarily be the case. Increases in longevity can serve
as motivation for agents to save more, allowing the financing of a longer retirement. In fact,
such increases in saving rates may not even be linear. The elderly may be encouraged to save
even more aggressively, or at least to rundown their assets at a slower rate, since longevity
brings about more uncertainty of future medical expenses and the risk of outliving one’s
assets (De Nardi, French & Jones 2009). Furthermore, there is no real reason to still expect
the retirement age to stay constant if life expectancy increases. Ando et al. (1995), for
example, found that the elderly in Japan had a high probability of maintaining employment,
not dissaving as much as theoretical predictions. Work by Ehrlich & Lui (1991), Lee, Zhang
& Zhang (2003) Lee, Mason & Miller (2003) and Sheshinski (2009) provide theoretical
support for the positive impact longevity has on private savings. Empirical evidence provided
by Bloom, Canning & Graham (2003) and Kinugasa & Mason (2007) reaffirms this
theoretical prediction.
Since higher age dependency and rising longevity exert opposite effects on private savings,
the impact of ageing with regards to private savings are therefore equivocal. This ambiguity
motivated more recent work by Graff, Tang & Zhang (2008) and Li, Zhang & Zhang (2007)
jointly considering both higher age dependency and rising longevity.
The link between demography and public savings, in comparison to private and national
savings studies, is a much neglected field within the literature. In fact the study of public
savings in general has never gathered much attention (Krieckhaus 2002). Edwards (1996)
commented that until very recently, the notion of public savings being exogenous was a
commonplace within the literature. This view has only started to change in the last 20 years,
with the introduction of theoretical modelling of public savings from a political economy
perspective (see Alesina & Drazen 1991; Alesina & Tabellini 1990a; Alesina & Tabellini
1990b for examples). Some recent theoretical studies of demographic change on public
5
expenditure have been framed with such a political economy focus3. While looking at public
expenditure, and therefore public savings, through the interaction of ageing and political
factors is appealing, this would somewhat detract from the focus of the current paper, which
is simply on how ageing, per se, affects public savings.
Keeping everything equal, higher age dependency has the potential to reduce productivity,
and thus the tax base, resulting in lower tax revenues. Higher age dependency also brings
together the possibility of higher health and social security spending. Taken together, the
view that higher age dependency will reduce public savings is quite plausible. The potential
impact of longevity on public savings, however, is not as clear. Bloom et al (2007) showed
theoretically that for individuals, the optimal response to an exogenous increase in longevity
was to delay retirement. If this is indeed the case, increased longevity will serve to prop up
the tax base. In reality, though, this has not been observed. Both Blöndal & Scarpetta (1998)
and Duval (2003), studying retirement behaviour in the OECD, found that despite rises in life
expectancy, social security schemes have actually created incentives for people to retire at the
same age as a generation ago resulting in longer periods being dependent on the social
security system.
Social security spending is not the only form of spending that is projected to rise with ageing.
In term of health spending, as the elderly people consume more resources than the young,
gains in life expectancy can be expected to put upward pressure on public expenditure, thus
lowering public savings. However, the association between higher age dependency and
longevity on the one side, and increasing public health spending on the other side is not
definite. Firstly, there is contention whether rising longevity actually means people are
spending more years in bad health. A study using New Zealand data by Bryant et al. (2004)
found that it is the time distance to death rather than one’s biological age that acted as a better
predictor of public health expenditure. They found that while an ageing population can
reasonably be expected to increase public health expenditure, the increases in health spending
attributed to just the sheer number of elderly, or higher age dependency, is more modest
when compared to that attributed to those disabled or requiring specialised aged care.
Consistent with that view, Cutler & Sheiner (1998) argued that whether ageing increases
public health expenditure, and so reduces public savings, crucially depended on disability
rates in the economy, as well as sex and age distributions. These factors act as key
3 See Razin, Sadka & Swagel (2002), Galasso & Profeta (2002) Sanz & Velazquez (2007) among others.
6
considerations when assessing the impact ageing has on public health expenditure. For
example, living alone increases the likelihood of entering a long term aged care facilities,
which can act as a drain on public finance. Regardless, projections of public health
expenditure increasing, at least to some extent, with ageing were put forward by Cutler &
Sheiner (1998) and Bryant et al.(2004). In contrast, Gouveia (1996) found that public health
expenditure as a percentage of GDP fell with a higher proportion of aged, suggesting the
notion that ageing necessarily brings about higher public health expenditure cannot be taken
uncritically.
While empirical studies looking at the effect demography itself on public savings are few,
they do exist. Edwards (1996) found that age dependency had no statistically significant
effect on public savings in a sample of Latin American countries. However, his methodology
was handicapped by the estimation procedures that predated the recent developments of
dynamic panel modelling. Kim & Lee (2008), using a panel VAR approach with G7 countries
data, found total dependency exerting a negative influence on public savings. The IMF
(2004) also came to the same conclusion. Disney (2007) showed that the size of the welfare
state within an OECD sample increases with higher dependency, though the degree of it
depended on the design of the social security system itself. These studies, however, shared
something in common; they neglected the role longevity can play in the determination of
public savings. Untangling the respective impacts of age dependency and longevity on public
saving could potentially be useful for the design of public policy in dealing with ageing. For
example, if the dependency ratio is the main cause of the fall in public savings, policy
regarding immigration and fertility in dealing with the dependency ratio should take priority.
Alternatively, if longevity exerts a negative impact on public savings, then perhaps there
should be evaluation of the age threshold for pension and other age-related welfare.
The preceding discussion focused only on the impact ageing has on private and public
savings separately. However, is it possible that changes in public savings can crowd out
private savings leaving national savings unchanged? The 19th century classical economist
David Ricardo (1820) first posted a question of this kind in that whether there was a
difference between funding a war with a one off tax hike, or with the issuance of government
consols and paying off the interests through future taxation. Ricardo argued that households
would be indifferent to both propositions if they were forward looking. The Ricardian
Equivalence Hypothesis (REH) was later revisited and formalised by Barro (1974). The
public policy implications of this theory are clear. If the theory holds true, any reduction
7
(increase) in taxes, and by extension, public savings, would be perfectly offset by an increase
(reduction) in private savings, leaving national savings unchanged. This view, however, does
not gain universal currency. Objections to the REH have been raised by Feldstein (1976) and
Buchanan (1976), among many, who criticised Barro of ignoring other factors, for example
growth, in his analysis. The empirical evidence suggests that while there is a partial offsetting
of taxes and private savings, this offset does not quite hold one for one (see Corbo &
Schmidt-Hebbel 1991; Doménech, Taguas & Varela 2000; Holmes 2006 for examples).
The REH, however, is not the only theory that suggests substitutability between public and
private savings. Specifically, the REH in the strictest form only considers changes in taxes
entering into the household saving decision. It is possible that changes in the expenditure
component of public savings can elicit a corresponding response in private savings through a
separate channel that has nothing to do with the hypothesis. One such channel is the interest
rate. In the spirit of intertemporal models allowing for substitution of consumption and
savings between time periods, Blanchard (1985) and Auerbach & Kotlikoff (1987) found that
increased government expenditure created incentives for households to save by pushing up
interest rates. The relative magnitude of this response, though, depended on the time
preferences for consumption of the household. Furthermore, Gouveia (1996) found that a $1
increase in public health expenditure reduced private health expenditure by 70 cents. While
not a full crowding out, it suggests that there exist high levels of substitutability between at
least some components of public and private expenditure. In short, there are various channels
hinting public savings crowding out private sector savings and this will be considered in the
following empirical analysis.
III. Data For this empirical study, an unbalanced panel dataset of 55 countries with observations from
year 1972-2004 was used. OPEC countries were excluded from the dataset, alluding to the
fact that fluctuations in their savings are likely to be driven more by world demand and
supply of crude oil than by factors like demography. In addition, countries with a population
size of 1 million or less were excluded as their economies tend to compose mainly of a small
group of, at times maybe as few as one or two, key industries. Demand or supply shocks to
these industries can cause disproportionately large swings in their income and thus savings,
introducing a large amount of noise into the dataset.

8
The variables used for this study and their respective sources are listed in Table 2.
[INSERT Table 2]
Panel ADF tests were conducted to check all the variables for stationarity. The results of
these tests are presented in the appendix. GDP per capita was found to contain a unit root, so
the first difference of the series, i.e. income growth rate, was used in the model. Furthermore,
given that saving was expressed as a percentage of GDP, the effect of income on the level of
saving had already been controlled for. The full description of countries with their respective
year coverage and summary statistics of variables used in the dataset can be found in the
appendix.
IV. Methodology Model specification
Savings behaviour, whether private or public, is likely to exhibits some degree of inertia. To
allow for the “time to change” property, the following dynamic models were estimated:
PUBi,t = ρPUBi,t-1 + δ1GROWTHi,t-1 + δ2AGEDi,t + δ3LIFEi,t + θi + vi,t (1)
PRIi,t = ζPRIi,t-1 + π 1GROWTHi,t-1 + π2AGEDi,t + π3LIFEi,t + π4PUBi,t + λi + ηi,t (2)
where PUB is public savings, PRI is private savings, GROWTH is real income growth per
capita, AGED is age dependency ratio (defined as the ratio of population 65 and above to
population 15-64), LIFE is life expectancy at birth, θ and λ are the country fixed effects, and
v and η are the error terms. As will be discussed later, a two-step robust standard error
correction for dynamic panel models was used, the distribution of the error terms is thus not
crucial; correcting for standard errors in this manner allows for the weighing matrix to take
into account both heteroskedasticity across individuals and autocorrelation within individuals.
Lagged dependent variables were used in the model to capture the dynamic nature of both
private and public savings. The life cycle variables, age dependency and life expectancy,
were included to investigate the impact of ageing on savings. Standard growth models
suggest that savings has the ability to drive income growth through capital accumulation. To
mitigate reverse causality, the lagged of income growth is used. The theoretical argument of
public savings crowding out private savings had been discussed earlier. On the contrary, there
is no widely accepted theory of private savings driving public savings; private saving
9
therefore does not enter (1). By the same logic, public saving can enter (2)
contemporaneously as reverse causality is not an issue here. The public savings equation
model is notably parsimonious. The literature hints that political and institutional variables
are perhaps the most natural regressors for such a study. However, since institutional and
political structures take many years or decades to evolve, the relative time invariant nature of
such measures means that the country specific (i.e. fixed) effects should be sufficient to
capture any such effect.
Endogeniety and Instrumental Variables
Nickell (1981) showed that estimating models presented by equation (1) and (2) as fixed
effects panel data models introduces biasness and inconsistency of the estimator.4 To
circumvent this issue, instrumental variable (IV) techniques can be used. This technique starts
off by taking the first differences to purge the fixed effects, following which appropriate
instruments are chosen to account for endogeneity before finally estimating the coefficients.
Taking the first difference of equation (1) and (2) yields
∆PUBi,t = ρ∆PUBi,t-1 + δ1∆GROWTHi,t-1 + δ2∆AGEDi,t + δ3∆LIFEi,t + ∆vi,t (3)
∆PRIi,t = ζ∆PRIi,t-1 + π 1∆GROWTHi,t-1 + π2∆AGEDi,t + π3∆LIFEi,t + π4∆PUBi,t + ∆ηi,t (4)
The terms ∆PUBi,t-1 and ∆PRIi,t-1 are correlated with the transformed error terms ∆vi,t and ∆ηi,t
respectively. Anderson & Hsiao (1982) suggested the second lag of the dependent variable
(i.e. PUBt-2 and PRIt-2) as candidate instruments to break this correlation with the transformed
error term. Arellano & Bond (1991) went a step further and proposed the second and deeper
lag of the dependant variables as valid instruments since these observations would also not be
correlated with the error term either. This procedure is commonly known within the literature
as difference GMM. More recently, as an extension to difference GMM, Arellano & Bover
(1995) and Blundell & Bond (1998) proposed additional moment conditions that could be
exploited as valid instruments in a method known as system GMM. This firstly uses the first
and deeper lag changes in the dependent variable to instrument for the lag of the dependent
variable in the levels equation like (1) and (2)5. Following which, using similar instruments as
a difference GMM technique, the level and difference equations (similar to (3) and (4)) can
be estimated as a system of two equations. In essence, difference GMM uses levels as
instruments for differences while system GMM uses both differences and levels as 4 Greene (2008) and Verbeek (2008) also provide a proof to this proposition 5 For example, this would mean Pubt-1in equation (1) can be instrumented by ∆PUBt-1, ∆PUBt-2, ∆PUBt-3 etc..
10
instruments in a system of equations. Besides efficiency, there are practical benefits to using
system GMM. If the dependent variable has a data generating process that is close to a
random walk or exhibits a high level of persistency, differences make better instruments than
levels since they generate better forecasts.
Besides instrumenting the lagged dependent variable to remove the dynamic panel bias in the
estimation process, instruments were also used to deal with endogeneity as in any regular IV
or 2SLS framework. Age dependency ratios and life expectancy were taken to be exogenous
in the models. It should be mentioned that while an exogenous and unmodelled shock can
affect savings, age dependency and life expectancy, we chose to regard the latter two
variables as exogenous in our model for two key reasons. Firstly, the most common
exogenous shocks that can affect these variables simultaneously are events like pandemics,
war, civil unrest etc. Since income growth was included in the model, most of these
exogenous events had already been implicitly accounted for, thus reducing the chance that
these exogenous events/shocks being captured by the error term. Secondly, the value of life
expectancy at time t is constructed using mortality rates of different age groups in periods
earlier6. Therefore, by construction, life expectancy is at least a weakly exogenous variable.
Similarly, age dependency is also at least a weakly exogenous variable because its value
depends on the fertility and mortality rates from the past up to the current period. In short,
within our estimation framework, it is unlikely that ∆AGEDi,t and ∆LIFEi,t are correlated with
our transformed error terms, ∆vi,t and ∆ηi,t. At the same time, models estimated using
instrumental variables by nature generate larger standard errors than ordinary least square
estimates (Greene 2008), introducing needless imprecision. Therefore, it is paid in practice to
‘restrict’ the number of endogenous variables in the model whenever it is theoretically
appropriate to do so.
Income growth was regarded as endogenous in our estimation due to its contemporaneous
relationship between savings and income growth. A simple national account identity shows
consumption, and by extension, savings, to be a function of income. Valid instruments for
∆GROWTHi,t-1 in equation (3) and (4) will be the second and deeper lags of growth (i.e.
GROWTHi,t-2, GROWTHi,t-3 etc). In a system GMM framework, valid instruments for
6 In theory the value of life expectancy at year t is constructed using mortality rates of different age groups at year t. However, due to either missing data or too few deaths in a particular year for robust estimates, mortality rates from earlier years are often used.
11
Growthi,t-1 in equation (1) and (2) will correspondingly be the lag changes of income growth
(i.e. ∆GROWTHi,t-1, ∆GROWTHi,t-2 etc).
Public savings in equation (2) and (4) were taken as “predetermined” in the estimation and
also instrumented. The first and deeper lags of public savings are thus valid instruments for
∆PUBi,t in equation (4) and the change and all lag changes of public savings (i.e. ∆PUBi,t,
∆PUBi,t-1 etc) are valid instruments for PUBi,t in equation (2). Implicitly, this implied that we
regarded PUBi,t as being uncorrelated with ηi,t, proposing there exists no simultaneous
determination of both the private and public saving levels once we controlled for income
growth. Certainly, if public reacts instantly or even pre-emptively if they have forward
looking expectations and information of a future change of public savings, this condition will
no longer hold. Public savings will then be endogenous. We however, argue that using public
savings as predetermined is valid. This mainly stems from the fact that private agents need
time to learn about public saving rates before reacting and changing private savings
accordingly. We take the view that private agents will rarely have such information of future
changes in public savings since fiscal policy tends to be articulated through means like a
budget announcement or an official government statement. Apart from that, it is unlikely that
private agents can have any accurate idea of the true stance or state of fiscal policy.
Furthermore, it must be noted that public expenditure and tax revenue are to a large extent
determined by the fiscal policy stance of the government and therefore have a discretionary
component. In any case, it was found ex post that even if we treated public savings as an
endogenous variable, it did not change any of the conclusions found in this paper7.
While the theoretical reasons for the validity of the instruments have been justifed in the
preceding discussion, an econometric issue still arises if there exists correlation between the
instrument set and the errors, rendering the instrument set invalid. Using equation (3) as an
example, if ∆vi,t is correlated with ∆vi,t-2, this means PUBi,t-2 is invalid as an instrument since
PUBi,t-2 is correlated with ∆vi,t-2 through vi,t-2. In this case, only the third and deeper lags of
public savings are valid instruments assuming ∆vi,t is not correlated with ∆vi,t-3. This
underlines the simple idea behind Arellano & Bond’s (1991) AR test. An AR(2) test will for
example test whether ∆vi,t is correlated with ∆vi,t-2. Deeper order AR tests can also be
conducted.
7 The point estimates only diverged at the 5th decimal place onwards and the standard errors only started differing at the 4th decimal place onwards.
12
Like any standard IV estimation, using more instruments than endogenous variables results in
an overidentified system. Tests can be conducted to see if the additional moment conditions
are valid to be exploited as instruments. Commonly used tests are the Hansen and Sargan
tests, also known as the J and C tests respectively. Roodman (2006), however, cautions that
these tests should not be relied on too faithfully. It is known that the Sargan test is not
consistent, and the Hansen tests can be weakened by too many instruments to the point that
even extremely reassuring evidence of the validity of the instruments can be rendered
meaningless. This is especially an issue for system GMM as the instrument set has the
potential to blow up rapidly. In addition, while excess instruments have the potential of
allowing for greater precision, they are also known to bias estimators. While the literature is
not helpful in providing a guide as to how many instruments is considered “too many”, as a
general thumb of rule, the number of instruments used should not exceed the number of
observations (Roodman 2006). Even so, Windmeijer (2005) had shown that this limit can still
be overly generous.
The practical benefits of a larger instrument set generating greater precision cannot be
ignored for our empirical study. Mindful of the pitfalls of large instrument sets biasing our
estimators, some practical strategies were undertaken to ensure this would not be the case.
Firstly, the instrument set can be reduced when doing robustness checks since this will
presumably increase the power of the Hansen Test. Our J test results revealed the validity of
our instruments, with insufficient evidence to suggest the contrary. This was still the case
even when the instrument set was reduced. Secondly, the AR(2) test did not reject the null of
no autocorrelation at conventional significance levels for all the regressions in this paper, so
providing no evidence to invalidate our instrument choices.
To recap, in the levels equation (i.e equation (1) and (2)), the first and deeper lag changes
were used as instruments for the lagged dependent variable and lag income growth. All lag
changes of public savings were used as instruments. For the difference equations (i.e.
equation (3) and (4)), the second and deeper lags of the lagged dependent variable and
income growth were used as instruments for the first lagged change income growth and the
dependent variable. The first and deeper lags of public savings were used as instruments for
∆PUBi,t.
Finally, a two-step standard error correction method was used to allow for heteroskedasticity
and autocorrelation. However, this method is known to cause a downward bias in the
13
standard errors; they are thereby further adjusted using Windmeijer (2005) corrected standard
errors.
V. Results and Discussion Base Model Results
Equations (1) and (2) were estimated using system GMM. The results are presented in Table
3. The results confirm that private saving rate exhibits a high level of inertia, with the
coefficient on its lag being equal to 0.74 and highly significant. The presence of this inertia
suggests that changes in private savings would happen over a considerable period of time,
hinting at a static model’s inability to adequately capture the full impact of crowding out of
private savings over the long-run, especially if the time dimension of the dataset is short.
Income growth has a positive sign but is not significant.
[INSERT Table 3]
Age dependency is found to have a negative impact on private savings. In this respect, our
findings support the LCH. We found that a one percentage point increase in the age
dependency ratio decreases private savings as a percentage of GDP by 0.124 and 0.475
percentage points in the short and long-run respectively. Unfortunately, the vast majority of
the literature cannot be directly compared to these results. Firstly, many previous studies used
static models while ours was a dynamic model. Secondly, as ageing was our focus, we used
age dependency. This meant that we could not compare with papers that used total
dependency.8 Thirdly, the sample coverage might be different. Notwithstanding these, our
long-run coefficient is quite similar to those obtained by Serres & Pelgrin (2003), who found
the long-run coefficient to be in the range of -0.5 to -0.6 in a variety of specifications.
Increases in life expectancy had a positive impact on private savings, confirming the
theoretical validity of the LCH. For a 1 year increase in life expectancy, we expect private
savings as a percentage of GDP to increase by 0.108 and 0.413 percentage points in the short
and long-run respectively. Rising life expectancy, on the other hand, does not cause any
significant decrease in public savings. Recall that there is a literature suggesting that most of
the health expenditure is used for the last few years of life, so a longer lifespan does not
necessary imply higher (public) health expenditure as suggested by the likes of Cutler &
8 In later section we will report our results using youth and total dependency ratios respectively.
14
Sheiner (1998). In addition, countries may actually be reforming their social security system
to increase the age where individuals can draw benefits from the system. Our results are also
similar to those obtained by Bloom, Canning & Graham (2003). Once again though, we have
to be careful with comparing the results between dynamic and static models. Nevertheless,
these similarities provide some degree of reassurance of our results.
The short and long-run coefficients of public savings in the private savings equation are
statistically significantly and negative. The point estimate of the long-run coefficient is equal
to -0.87, no too far off from -1, which suggests a full crowding out effect of public savings on
private savings. The 90% confidence interval for the long-run coefficient ranges from -1.62
to -0.13. Although the interval encompasses -1, it is nevertheless quite wide. The large
confidence interval is due to the fact that it takes a combination of the standard errors of the
short-run coefficients for both the lagged private savings and public savings to compute that
that of the long-run coefficient on public savings. Therefore, whilst not entirely dismissing
the possibility of a full crowding out, we acknowledge that the evidence is not overwhelming
either. Nevertheless, the lower and upper bounds of the interval are both negative; this result
being consistent with there being at least some level of crowding out. The uncovering of the
possibility of full long-run crowding out effect might be attributed to the use of a dynamic
model.
Turning to the results of the public saving equation in Table 3, the inertia of public savings is
even stronger than that of private savings, with the coefficient on its lag being equal to 0.83
and is highly significant. This is probably because many public revenue and expenditure
items are structural and cannot be changed quickly. Like that in the private saving regression,
income growth is of the positive sign but not significant.
Age dependency had also been found to reduce public savings. This is broadly consistent
with the results obtained by Kim & Lee (2008), though they used total dependency and
different model specifications. Our estimates indicated that for a one percentage point
increase in age dependency, public savings as a percentage of GDP falls by 0.035 and 0.209
percentage points in the short and long-run respectively. It is therefore clear that age
dependency reduces both private and public savings.
Life expectancy also has a positive effect on public savings like that on private savings.
However, compared to private savings results, the magnitude of the coefficient is far smaller
15
and is not significant at all. This is hardly a surprise as private savings are probably more
sensitive towards life-cycle determinants than public savings.
For completeness of the analysis, the overall impact of ageing on national savings was also
examined with the following regression:
NATi,t = αi + ρNATi,t-1 + β1GROWTHi,t-1 + β2AGEDi,t + β3LIFEi,t + vi,t (5)
where NAT is national savings. The equation is estimated in similar fashion to those of
private and public savings equations using system GMM. Lagged income growth was
regarded as endogenous, and age dependency and life expectancy treated as exogenous
variables9. The results of this regression are also presented in Table 3.
The short-run coefficients for life expectancy and age dependency were both significant. In
the long-run, private savings as a percentage of GDP will decrease by 0.52 percentage points
in response to a one percentage point increase in age dependency and increase by 0.43
percentage points in response to a one year increase in life expectancy respectively. Owing
perhaps to the imprecision of combining standard errors, the long-run coefficients are
marginally insignificant at the 10% level of significance. Notwithstanding, the point
estimates of the long-run coefficient did not deviate very much from those obtained in the
private savings regression10. This is consistent with the possibility of full crowding out effect
reported earlier, suggesting that changes in national savings may be almost entirely driven by
changes in private savings; rendering changes in public saving rates irrelevant due to an
endogenous response by the private sector. This can also be due to the size of public savings
making up a very small component of national savings, and therefore, it is relative
unimportance in the determination of national savings. Furthermore, the signs are correct,
with at least the short-run coefficients being statistically significant, indicating that increases
in both age dependency and life expectancy will, ceteris paribus, decrease and increase
national savings respectively.
Developed versus Developing Countries
9 In similar fashion, equation (5) was transformed with a first difference to get a difference equation. Thereafter, the first and deeper lagged change of income growth and national savings were used as instruments for lagged national savings and lagged income growth respectively in the levels equation presented in equation (5). In the difference equation, the second and deeper lag of national savings and income growth were used as instruments for ∆Nati,t-1 and ∆Growthi,t-1 respectively. 10 -0.52 compared to -0.48 for age dependency and 0.43 compared to 0.41 for life expectancy.
16
A natural question that arises from our results is whether our estimates are robust to different
types of countries, considering that there is a mix of 31 developed and 24 developing
countries in our dataset11. To test for this, we re-ran regressions (1) and (2), breaking the
sample into developed and developing countries. A sample of OECD member nations was
also taken. The OECD sample was taken to allow for countries that have similar institutional
features. The results of these regressions are reported in Table 4 and Table 5. In terms of the
long-run coefficient estimates, the results for the OECD and the developed countries sample
are very similar for private savings. While the point estimates for public savings regression
do differ in both samples, the same variables in both specifications are statistically
significant. This is probably because 25 out of the 31 developed economies are OECD
members.
[INSERT Table 4 and Table 5]
There is evidence that age dependency is a drag on public savings only in the developed and
OECD economies, but not in developing economies. This could be due to the fact that
developing countries often house less democratic institutions such that their governments are
less pressed to respond to demographic changes. On the other hand, our findings for private
savings are very robust to various subsamples. There was evidence across all three groups
that age dependency and life expectancy reduces and increases private savings respectively.
In fact, the long-run coefficients across all three samples are very similar for both drivers of
ageing. This result also provides assurance that findings of high age dependency reducing
private savings in the full sample are not solely being driven by developed countries alone.
Another interesting result is that there was less than a full crowding out of private savings in
the subsample of developed economies12. The developing economies sample had insufficient
evidence against the hypothesis of a full offsetting effect. However, once again, this is mostly
driven by the large standard errors blowing up the width of the confidence interval. It is
worthwhile to note that the long-run coefficient of -2.1 is very large13. It is also worth noting
that while increases in public savings will have a negative impact on private savings, only the
developing subsample has evidence of a potential full crowding out effect.
11 This is by the World Bank’s definition of developed and developing countries. 12 The upper bound for the 90% confidence interval for the long-run coefficient of public savings is even marginally positive, though at 10% level of significance, the point estimate is different from zero. 13 This confidence interval is also very large, ranging from crowding out 3 times over to only a crowding out of about 30%. A contributing factor to this imprecision is the relatively small sample size of 302 observations for developing countries.

17
Finally, while not statistically significant in the findings presented in Table 3, income growth
is a statistically significant driver of both private and public sector savings for developing
countries. Growth theory tends to predict high savings driving higher growth. This result
might hint at the possibility that developing countries can enter a virtuous cycle: higher
savings driving higher growth, which in turns drives higher savings and even higher growth.
[INSERT Table 6]
Real Interest Rate
The real interest rate14 was also considered as a determinant for private savings. There are
two key reasons why this is incorporated in the analysis. Firstly, intertemporal models of
consumption regard movement in the interest rate as a change in the relative price of
consumption between time periods. Utility maximising agents respond to this relative change
in prices by moving consumption, and thus savings, between periods. Theory thus demands
that real interest rate be considered in the empirical model. However, due to limitations on
the data coverage15, this was not done in the original empirical analysis. Nonetheless,
considering real interest rate as a determinant of private savings on a reduced sample will
provide some comparisons with the base model. Secondly, in Barro’s (1974) formalisation of
the Ricardian Equivalence Hypothesis, it was shown that real interest rates remained
unchanged and it was the changes in taxes that was driving agents to change their saving rates
in response. Therefore, if the change in the real interest rate was a channel where changes in
public savings affect public savings, we would expect to see both the real interest rate being
statistically significant and the coefficient of public savings shrinking or perhaps even
becoming statistically insignificant. The results of this regression can be found in Table 6.
The sample covers 26 developed countries and 7 developing countries.
The long-run coefficient of age dependency and life expectancy are very similar to the base
model, giving confidence to the robustness of the results16. Real interest rate is positively
significant. The long run coefficient of public savings has reduced, though still statistically
significant. This provides some support to the interest rate channel argument of the crowding
14 We have constructed the real interest rate from taking the difference between nominal interest rates and inflation. The data sources for these variables are the IMF’s International Finance Statistics series, Government Bond Yields and WDI respectively. 15 The data coverage shrinks to 680 observation when real interest rate is considered, losing slightly under half of the data set. 16 Inflation was also considered. Inflation was marginally negatively significant and the inclusion of inflation did not change the magnitude of all the other coefficients very much.
18
out effects. Nonetheless, since the coefficient of public savings is still negatively significant,
this suggests that Barro’s view of Ricardian Equivalence occurring though the tax channel
cannot be dismissed.
Wealth
Consideration for wealth affecting the savings function was also considered in the empirical
analysis. Permanent income hypothesis predicts that an increase in wealth, if translated into a
permanent increase in income, will increase consumption, and so decreasing private savings.
Therefore, we should theoretically expect a negative relationship between private savings and
wealth.
In this paper, we have used the measurement of broad money (M2) as a percentage of GDP as
a proxy for wealth. Our logic stems from the fact that higher wealth would increase the
motivation for more financial instruments to smooth consumption. The measure of broad
money thus acts as a proxy for the deepening in the financial system. The results are also
presented in Table 6.
Two broad observations can be seen when our proxy of wealth was used, giving confidence
to our earlier findings. First, the statistically significant negative sign gives the “correct” sign,
providing some evidence that our measurement of wealth has a negative association with
private savings. However, the size of the coefficient, -0.0002, is very small and can be
considered economically insignificant. Second, the statistical significance of the demographic
variables in the short run, while reduced, provides confidence of our previous results. The
main reason driving the statistical insignificance of the long run coefficients for the
demographic variables is probably mainly because the sample is heavily dominated by
developing countries owing to data constraints. The results thus mirror the results derived for
the sample of developing countries in Table 5. This measurement was thus not considered in
the main empirical exercise owning to the fact that once again, too many observations
dropped out of the sample due to data constraints and the sample was dominated by
developing countries.
To this end, estimation of such a savings-wealth function presents a number of interesting
challenges. Firstly, using permanent income hypothesis as a theoretical base, changes in
wealth has to be perceived to be permanent for there to be any discernable changes in
consumption and saving levels. Therefore, though not done in this paper, distinguishing of

19
whether the change in wealth is permanent or transitory is by itself, an important theoretical
consideration. It can also not be ruled out the small and economically insignificant magnitude
of wealth might be due to not making the distinction between permanent and transitory
changes. Secondly, measurement of wealth is by itself tricky. This is an especially thorny
issue when macro aggregated data is used. Therefore, there are issues whether the
measurement of wealth is accurately measured. Empirical analysis that can sufficiently
address the two above mention issues can be considered for future research.
Omission Bias
A practical question that confronts researchers in this field is whether the study of the
demographic effect on savings can be done without jointly considering both life expectancy
and age dependency. The correlation coefficient of both variables in our dataset was -0.68, a
figure considered moderately high. Thus, jointly considering both in the same regression
potentially introduces a high level of collinearity. On the other hand, due to the theoretical
underpinnings of age dependency and life expectancy exerting different influences in private
savings, omitting either variable could bias the estimation to the extent that it alters the sign
of the other variable. The papers listed in Table 1, while widely cited, all failed to take into
account longevity in their models. In Table 7, we show the extent of the bias in omitting life
expectancy and age dependency respectively from our base model for both private and public
savings estimated in Table 3. Clearly, omitted life expectancy caused the coefficient on age
dependency to be biased upwards from -0.124 to 0.062. The bias in our sample was
particularly strong to the point that the coefficient on age dependency was no longer
statistically significant and has the wrong sign. Likewise, omitting age dependency caused
the coefficient on life expectancy to be biased downwards from 0.108 to 0.066. Though the
coefficient remained statistically significant and correctly signed, it was now much smaller in
magnitude. For public savings, if we omitted life expectancy, the coefficient of age
dependency changed from -0.035 to -0.018. While the coefficient was still statistically
significant, there is an upward bias that understates the magnitude of the negative impact age
dependency had on public savings. However, if we dropped age dependency, life expectancy
clearly becomes negative and significant with its coefficient changing from 0.005 to -0.003.
Therefore, this omission can cause wrong conclusions to be made since it is age
dependency—not longevity—that is driving this fall in public savings.
20
The results derived from this exercise suggest that researchers have to be careful to jointly
consider both age dependency and life expectancy when ascertaining the full and
disaggregated impact of ageing.
[INSERT Table 7]
Youth and Total Dependency
To further test the robustness of our findings, we also attempted to allow youth dependency
or total dependency to enter the model instead of age dependency. These are presented in
Table 8.
[INSERT Table 8]
Youth dependency was never statistically significant for both private and public savings and
even has the ‘wrong’ sign. Therefore, it was not surprising that when total dependency was
used, it was no longer significant for public savings. For private savings, total dependency
was still significant, but since youth dependency did not affect private savings, while age
dependency did, this would indicate that this result is being driven solely by age dependency.
Life expectancy was still significant in both private savings specification; therefore once
again reaffirm the importance of jointly considering longevity. Finally, public savings was
still a significant driver of private savings for both specifications, and the 90% confidence
interval for the long-run coefficient still contained -1 in both cases.
Alternative Instruments
Finally, as presented in the appendix, the instrument set was reduced to see whether it altered
the results derived in the base model. Two ways were used in the reduction of the instrument
set. One method available was to “collapse” the instrument set matrix to reduce the
instrument count17. Since, our models were estimated using the first and deeper valid lags as
instruments, another method for reducing the instrument set was to use only the first valid lag
as an instrument18. Reducing the instrument set through both methods changed neither the
coefficient estimates very much nor the conclusions for private savings. For public savings, 17 For technical details on the construction of the instrument matrix are described in graduate econometric textbooks like Greene (2008) and Verbeek (2008). Though “collapsing” is described as non-standard by Roodman (2006), he show how this instrument matrix can be “collapsed” and this is the procedure undertaken in this paper. Instruments set in an “uncollapsed” form generates instruments that are quadratic in T. “Collapsing” shrinks the instrument matrix and thus reduces the instruments generated. 18 For example, instead of using the second and deeper lag of public savings to instrument for ∆PUBi,t-1 in equation (3), we will use only the second lag and no more.

21
though the coefficients estimates for age dependency started to deviate quite substantially
from those derived earlier, the conclusions were still the same as in that the signs were
unchanged and the same sets of coefficients were statistically significant. As described
earlier, one could find issues with the validity of our J statistics in the Hansen test because as
the instrument set is so large that it may make inferences from those J statistics useless.
Reduction of the instrument set increases the power of the Hansen Test. It was also found that
after doing so the instrument set still suggested there was insufficient evidence that the
reduced set of moment conditions were invalid. Therefore, this can be taken to suggest the
validity and the robustness of the key findings and results of the paper.
Policy Implications
The results from the various robustness tests, including using split samples, indicate that by
and large the findings in Table 3 are very robust. This relieves us from sensitivity issues
when drawing economic and policy implications from the results.
First of all, it is clear from our findings that both age dependency and life expectancy exert
opposite effects on private savings, and in turn national savings. This implies that there is
uncertainty in the overall impact of ageing on private savings, especially if an ageing society
experiences both increases in age dependency and life expectancy.
The European Commission (2002 see section I.4) suggested increasing public savings before
the onset of ageing to maintain fiscal sustainability. Floden (2003) also echoed the same
view, asking for higher taxes and public expenditure cuts to reduce the welfare impact of
debts. Our findings on crowding out cast doubts whether expenditure cuts or increased
taxation by the public sector as a preparation for population ageing might only serve the
purposes of improving public budget position, but irrelevant in terms of changing the national
savings rates. If the focus of public policy is to increase national savings, perhaps effort
should instead be targeted at influencing the level of private savings19.
The finding that longevity can increase private and thus national savings potentially creates a
development trap. Countries endowed with an unfavourable environment for health would
have low savings, low growth and thus low income, which would in turn become a barrier to
improve their life expectancy (Tang, Petrie & Rao 2009), ending up trapped in a vicious
19 Policies that could influence private savings include, for instance, taxes on investment income or capital gain.
22
cycle. A corollary of this is that health aid could potentially play an important role in
breaking the vicious cycle (Mishra & Newhouse 2009).
The positive relationship between longevity and (private and national) savings also present
some interesting implications for countries with large longevity gaps. Within our dataset, the
“best performing” country in terms of life expectancy was Japan at about 82 years in 2004.
Emerging economies like India and Brazil, with life expectancy being around 70 years, have
a longevity gap of over 10 years compared to Japan. Based on our estimates, closing this gap
could increase Brazil’s private and national savings by over 4 percentage points of GDP in
the long-run, not an insignificant figure. Even advanced economies like the United Kingdom
Belgium, and Austria could raise private savings by about 1.2 percentage points of GDP
through closing their 3-year longevity gaps with Japan. The possibility exists that even best
performing nations can still increase longevity further. Conservative projections made by Lee
& Carter (1992) and Tuljapurkar, Li & Boe (2000) predict life expectancy to increase to 90
years by 2100. Taking this estimate, private savings would increase by over 3 percentage
points for Japan. However, there are also opposite predictions that life expectancy in this
generation may be regressing, mainly due to health issues associated with obesity and
lifestyle choices (Olshansky et al. 2005). If the second scenario turns out to the case, this
would give an even more pessimistic outlook compared to previous studies that only looked
at age dependency, as the accompanying decrease in life expectancy creates a twin drag on
national and private savings.
The preceding discussion about increases in life expectancy not depressing savings and
growth outcomes of course implicitly assumed age dependency remaining constant. With
higher age dependency acting as a drag on private and, in turn, national savings, policy
influencing fertility rates will have to be implemented to allow a greater, or at least a
constant, stream of people entering the 15-64 age bracket than those entering the 65+ age
group. But is this possible? Within the literature, some have regarded falling fertility rates as
an endogenous response towards higher life expectancy (Becker & Barro 1988). To allow
rising longevity to take place without allowing for increases in age dependency will mean
either more aggressive immigration policy targeted at those in the working age bracket, or
policy to give incentives having children, or a mix of both. However, for the world as a
whole, immigration policy that boosts the proportion of the working population in the
destination country will inevitably lowers that in the source countries.
23
VI. Conclusion Demographic change has the potential to alter macroeconomic outcomes. However, besides
due consideration to the age structure, changes in longevity levels, which tends to accompany
demographic change, can also exert their influence on savings behaviour at both private and
public levels. This paper has found that age dependency exerts a drag on private and, in turn,
national savings. Rising life expectancy can result in an increase in private savings. This is in
contrast to the conventional view that ageing will only act as a drag on savings. The overall
impact ageing has on savings is likely to depend on the relative pace of increases in longevity
compared to the rise in age dependency.
The findings in this paper also indicate that in future demographic studies, age dependency
should perhaps be jointly considered with life expectancy to avoid the potential of biased
estimator. For many developed economies, despite the notion of a ceiling on life expectancy,
there is still room to increase life expectancy by as much as 5 years in the United States for
instance. Our calculations show that this can increase savings by a reasonably substantial
magnitude in the long-run. This paper also found that there exists some degree of crowding
out of private savings, with anecdotal evidence to suggest the possibility of a full crowding
out. This hints that changes in public saving rates can be potentially irrelevant in terms of
changing the national saving rate. In terms of policy implications, this suggests that countries
that need to prop up national savings should design policy to simulate saving by the private
sector.
Undoubtedly, solutions to deal with ageing populations will increasingly feature in the policy
debate in the not so distant future. This paper looks at one channel where ageing can
potentially exert a long term macroeconomic impact—savings. Ageing is primarily caused by
higher age dependency and rising longevity. To this end, this paper finds that the impact
ageing has on savings is at best ambiguous. Crucial consideration thus has to be paid to
disentangle which of the two factors dominate in the determination of savings.
REFERENCES Alesina, A & Drazen, A 1991, 'Why Are Stabilizations Delayed?', The American Economic Review, vol. 81, no. 5, pp. 1170-88. Alesina, A & Tabellini, G 1990a, 'A Positive Theory of Fiscal Deficits and Government Debt', The Review of Economic Studies, vol. 57, no. 3, pp. 403-14.

24
—— 1990b, 'Voting On The Budget Deficit', The American Economic Review, vol. 80, no. 1, pp. 37-49. Anderson, TW & Hsiao, C 1982, 'Formulation and Estimation of Dynamic Models Using Panel Data', Journal of Econometrics, vol. 18, p. 47082. Ando, A, Moro, A, Cordoba, JP & Garland, G 1995, 'Dynamics of Demographic Development and Its Impact on Personal Saving: Case of Japan', Ricerche Economiche, vol. 49, no. 3, pp. 179-205. Arellano, M & Bond, S 1991, 'Some Tests of Specification for Panel Data: Monte Carlo Evidence and an Application to Employment Equations', Review of Economic Studies, vol. 58, pp. 277-97. Arellano, M & Bover, O 1995, 'Another Look at the Instrumental Variables Estimation of Error Components Models', Journal of Econometrics, vol. 68, pp. 29--51. Auerbach, AJ & Kotlikoff, L 1987, Dynamic Fiscal Policy, Cambridge University Press, Cambridge. Bailliu, J & Reisen, H 1998, 'Do Funded Pensions Contribute to Higher Aggregate Savings? A Cross-Country Analysis', Review of World Economics, vol. 134, no. 4, pp. 692-711. Barro, R 1974, 'Are Government Bonds Net Wealth?', Journal of Political Economy, vol. 82, no. 6, pp. 1095-117. Becker, G & Barro, R 1988, 'A Reformulation of the Economic Theory of Fertility', Quarterly Journal of Economics, vol. 103, no. 1, pp. 1-25. Blanchard, OJ 1985, 'Debt, Deficits and Finite Horizon', Journal of Political Economy, vol. 93, pp. 223-47. Blöndal, S & Scarpetta, S 1998, 'The Retirement Decision', OECD Economic Outlook, no. 63 June, pp. 179-92. Bloom, D, Canning, D & Graham, B 2003, 'Longevity and Life-cycle Savings', Scandinavian Journal of Economics, vol. 105, no. 3, p. 319. Bloom, DE, Canning, D, Mansfield, RK & Moore, M 2007, 'Demographic change, social security systems, and savings', Journal of Monetary Economics, vol. 54, no. 1, pp. 92-114. Blundell, R & Bond, S 1998, 'Initial Conditions and Moment Restrictions in Dynamic Panel Data Models', Journal of Econometrics, vol. 87, pp. 115-43. Bryant, J, Teasdale, A, Tobias, M, Cheung, J & McHugh, M 2004, 'Population Ageing and Government Health Expenditures in New Zealand, 1951-2051', New Zealand Treasury Working Paper 04/14.
25
Buchanan, JM 1976, 'Barro on the Ricardian Equivalence Theorem', Journal of Political Economy, vol. 84, no. 2, pp. 337-42. Corbo, V & Schmidt-Hebbel, K 1991, 'Public Policies and Saving in Developing Countries', Journal of Development Economics, vol. 36, no. 1, pp. 89-115. Cutler, DM & Sheiner, L 1998, 'Demographics and Medical Care Spending: Standard and Non-standard Effects', NBER Working Paper No.6866. De Nardi, M, French, E & Jones, JB 2009, 'Life Expectancy and Old-Age Savings', American Economic Review, vol. 99, no. 2, pp. 110-5. de Serres, A & Pelgrin, F 2003, 'The decline in private saving rates in the 1990s in OECD countries: how much can be explained by non-wealth determinants?', OECD Economic Studies, no. 36, pp. 117-53. Disney, R 2007, 'Population Ageing and the Size of the Welfare State: Is There a Puzzle to Explain?', European Journal of Political Economy, vol. 23, no. 2, pp. 542-53. Doménech, R, Taguas, D & Varela, J 2000, 'The effects of budget deficit on national saving in the OECD', Economics Letters, vol. 69, no. 3, pp. 377-83. Duval, R 2003, 'Retirement behaviour in OECD countries: impact of old-age pension schemes and other social transfer programmes', OECD Economic Studies, no. 37, pp. 7-50. Edwards, S 1996, 'Why are Latin America's Savings Rates So Low? An International Comparative Analysis', Journal of Development Economics, vol. 51, no. 1, pp. 5-44. Ehrlich, I & Lui, FT 1991, 'Intergenerational trade, longevity, and economic growth', Journal of Political Economy, vol. 99, no. 5, pp. 1029-59. European Commission 2002, European Economy: Public Finance in the EMU no.3, Brussels. Feldstein, M 1976, 'Perceived Wealth in Bonds and Social Security: A Comment', Journal of Political Economy, vol. 84, no. 2, pp. 331-6. Floden, M 2003, 'Public Saving and Policy Coordination in Aging Economies', Scandinavian Journal of Economics, vol. 105, no. 3, pp. 379-400. Galasso, V & Profeta, P 2002, 'The Political Economy of Social Security: A Survey', European Journal of Political Economy, vol. 18, no. 1, pp. 1-29. Goldberger, AS 1973, 'Dependency Rates and Savings Rates: Further Comment', American Economic Review, vol. 63, no. 1, pp. 232-3. Gouveia, M 1996, 'The Public Sector and Health Care', International Tax and Public Finance, vol. 3, no. 3, pp. 329-49. Graff, M, Tang, KK & Zhang, J 2008, 'Demography, Financial Openness, National Savings and External Balance', in MRG@UQ Discussion Paper No.20.
26
Greene, WH 2008, Econometric Analysis, 6th edn, Pearson/Prentice Hall, Upper Saddle River, N.J. Gupta, KL 1971, 'Dependency Rates and Savings Rates: Comment', American Economic Review, vol. 61, no. 3, p. 469. Haque, NU, Pesaran, MH & Sharma, S 1999, 'Neglected Heterogeneity and Dynamics in Cross-Country Savings Regressions', IMF Working Paper No. 99/128. Holmes, M, J. 2006, 'To What Extent are Public Savings Offset by Private Savings in the OECD?', Journal of Economics and Finance, vol. 30, no. 3, p. 285. IMF 2004, 'How Will Demographic Change Affect the Global Economy?', in World Economic Outlook, September 2004 edn, International Monetary Fund, Washington D.C., pp. 137-80. Kim, S & Lee, J-W 2008, 'Demographic changes, saving, and current account: An analysis based on a panel VAR model', Japan and the World Economy, vol. 20, no. 2, pp. 236-56. Kinugasa, T & Mason, A 2007, 'Why Countries Become Wealthy: The Effects of Adult Longevity on Saving', World Development, vol. 35, no. 1, pp. 1-23. Krieckhaus, J 2002, 'Reconceptualizing the Developmental State: Public Savings and Economic Growth', World Development, vol. 30, no. 10, pp. 1697-712. Lee, R & Carter, L 1992, 'Modelling and Forecasting the Time Series of U.S. Mortality', Journal of American Statistical Association, vol. 87, no. 419, pp. 659-71. Lee, R, Mason, A & Miller, T 2003, 'Saving, Wealth and the Transition from Transfers to Individual Responsibility: The Cases of Taiwan and the United States*', Scandinavian Journal of Economics, vol. 105, no. 3, p. 339. Lee, R, Zhang, J & Zhang, J 2003, 'Rising longevity, education, savings, and growth', Journal of Development Economics, vol. 70, no. 1, pp. 83-101. Leff, NH 1969, 'Dependency Rates and Savings Rates', American Economic Review, vol. 59, no. 5, pp. 886-96. Li, H, Zhang, J & Zhang, J 2007, 'Effects of longevity and dependency rates on saving and growth: Evidence from a panel of cross countries', Journal of Development Economics, vol. 84, no. 1, pp. 138-54. Loayza, N, Schmidt-Hebbel, K & Serven, L 2000, 'What Drives Private Savings Across the World', Review of Economics and Statistics, vol. 82, no. 2, p. 165. Masson, PR, Bayoumi, T & Samiei, H 1998, 'International Evidence on the Determinants of Private Saving', World Bank Economic Review, vol. 12, no. 3, pp. 483-501.

27
Mishra, O & Newhouse, D 2009, 'Does Health Aid Matter?', Journal of Health Economics, vol. 28, no. 4, pp. 855-72. Modigliani, F & Brumberg, R (eds) 1954, Utility Analysis and the Consumption Function: An Interpretation of Cross-section Data, Post-Keynesian economics, Rutgers University Press, New Jersey. Nickell, S 1981, 'Biasness in Dynamic Models with Fixed Effects', Econometrica, vol. 49, pp. 1417-26. Oeppen, J & Vaupel, JW 2002, 'Broken limits to life expectancy', Science, vol. 296, no. 5570, p. 1029. Olshansky, SJ, Passaro, DJ, Hershow, RC, Layden, J, Carnes, BA, Jacob, B, Hayflick, L, Butler, RN, Allison, DB & Ludwig, DS 2005, 'A Potential Decline in Life Expectancy in the United States in the 21st Century', The New England Journal of Medicine, vol. 352, no. 11, pp. 1138-45. Ram, R 1982, 'Dependency Rates and Aggregate Savings: A New International Cross-Section Study', American Economic Review, vol. 72, no. 3, p. 537. Razin, A, Sadka, E & Swagel, P 2002, 'The Aging Population and the Size of the Welfare State', Journal of Political Economy, vol. 110, no. 4, pp. 900-18. Ricardo, D 1820, 'Essay on the Funding System', retrived from the Online Library of Liberty, http://oll.libertyfund.org/. Roodman, D 2006, 'How to Do xtabond2: An Introduction to "Difference" and "System" GMM in Stata', Centre for Global Development Working Paper No.103. Sanz, I & Velazquez, FJ 2007, 'The role of ageing in the growth of government and social welfare spending in the OECD', European Journal of Political Economy, vol. 23, no. 4, pp. 917-31. Sheshinski, E 2009, 'Longevity and Aggregate Savings', Centre of the Study of Rationality Discussion Paper No.519. Tang, KK, Petrie, D & Rao, DSP 2009, 'The Income-Climate Trap of Health Development: A Comparative Analysis of African and Non-Afriacan countries', Social Sceince & Medicine, vol. 69, no. 7, pp. 1099-106. Tuljapurkar, S, Li, N & Boe, C 2000, 'A Universal Pattern of Mortality Decline in the G7 Countries', Nature, vol. 15, no. 405, pp. 789-92. Verbeek, M 2008, A Guide to Modern Econometrics, 3rd edn, John Wiley & Sons, Chichester, England ; Hoboken, NJ Windmeijer, F 2005, 'A Finite Sample Correction for the Variance of Linear Efficient Two-Step GMM Estimators', Journal of Econometrics, vol. 126, pp. 25-51.
28
Table 1 Summary of Selected Studies on the Demographic Effect on Private Savings
Study Empirical focus Data coverage Empirical findings
Edwards (1996) Determinants of public
and private savings
36 countries,
1970-1992
Total Dependency(-)
Bailliu & Reisen (1998) Does increase in
funded pension wealth
increase aggregate
savings?
10 countries,
1982-1993
Total Dependency (Nil)
Masson, Bayoumi & Samiei
(1998)
International
determinants of private
savings
61 countries,
1971-1993
Total Dependency (-)
Haque, Pesaran & Sharma
(1999)
Are studies of savings
behaviour robust to
considerations of
dynamics and
heterogeneity?
61 countries,
1971-1993,
Same dataset as
Masson, Bayoumi
& Samiei (1998)
Total Dependency (Nil)
Loayza, Schmidt-Hebbel &
Serven (2000)
Determinants of
private savings
150 countries,
1965-1994
Youth Dependency (-)
Age dependency (-)
Serres & Pelgrin (2003) Determinants of the
OECD private savings
15 OECD
countries, 1970-
2000
Age dependency (-)
(-) Variable was statistically negatively significant. (Nil) Variable was not statistically significant
Table 2 Variables and Sources
VARIABLE SOURCE
GDP Per Capita PPP, Base Year 2000 Penn World Tables 6.2
Public Savings (as a % of GDP) IMF World Economic Outlook, IMF Government
Financial Statistics
Private Savings (as a % of GDP) Constructed as the difference between National Savings in
World Development Indicators (WDI) and Public Savings
Age dependency Ratio (ratio of
population 65 and above to population
15-64
WDI
Life Expectancy at Birth WDI

29
Table 3 Estimation Results Using System GMM
(1) (2) (3) Private savings Public savings National savings
Long-run coefficient
Long-run coefficient
Long-run coefficient
Lagged private savings
0.738*** (0.0744)
Lagged public savings
0.832*** (0.0552)
Lagged national savings
0.846*** (0.0679)
Lagged income growth
0.042 (0.0331)
0.160 (0.132)
0.014 (0.0301)
0.082 (0.197)
0.024 (0.0350)
0.158 (0.236)
Public savings -0.229*** (0.0615)
-0.874** (0.451)
Age dependency -0.124*** (0.0373)
-0.475** (0.253)
-0.035** (0.0176)
-0.209 (0.158)
-0.080** (0.0366)
-0.518 (0.438)
Life expectancy 0.108*** (0.0301)
0.413** (0.230)
0.005 (0.0037)
0.028 (0.025)
0.066** (0.0285)
0.426 (0.369)
90% confidence interval for long-run coefficient for public savings [-1.617, -0.131] J statistic H0: Surplus moment conditions are valid 46.46 54.63 51.10 AR(2) test p value H0: No 2nd order autocorrelation 0.336 0.127 0.184 No. of observations 1046 1046 1046 No. of instruments 1030 935 935
Standard errors in parenthesis.
***Significant at 1% level of significance. **Significant at 5% level of significance. *Significant at 10% level of significance.

30
Table 4 Public Savings by Group
(1) (2) (3) Developed countries Developing countries OECD
Long-run coefficient
Long-run coefficient
Lagged public savings
0.870*** (0.0836)
0.614*** (0.1507)
0.795*** (0.1159)
Lagged income growth
-0.018 (0.0463)
-0.142 (0.341)
0.063* (0.0339)
0.162* (0.120)
0.022 (0.0483)
0.109 (0.271)
Age dependency -0.040* (0.0241)
-0.305 (0.352)
-0.012 (0.0329)
-0.031 (0.094)
-0.018* (0.0134)
-0.086* (0.087)
Life expectancy 0.008
(0.0060) 0.064
(0.068) 0.003
(0.0073) 0.009
(0.021) -0.003
(0.0074) -0.016 (0.043)
J statistic H0: Surplus moment conditions are valid 29.93 19.12 23.74 AR(2) test p value H0: No 2nd order autocorrelation 0.128 0.310 0.346 No. of observations 744 302 667 No. of instruments 715 302 643
Standard errors in parenthesis.
***Significant at 1% level of significance. **Significant at 5% level of significance. *Significant at 10% level of significance.
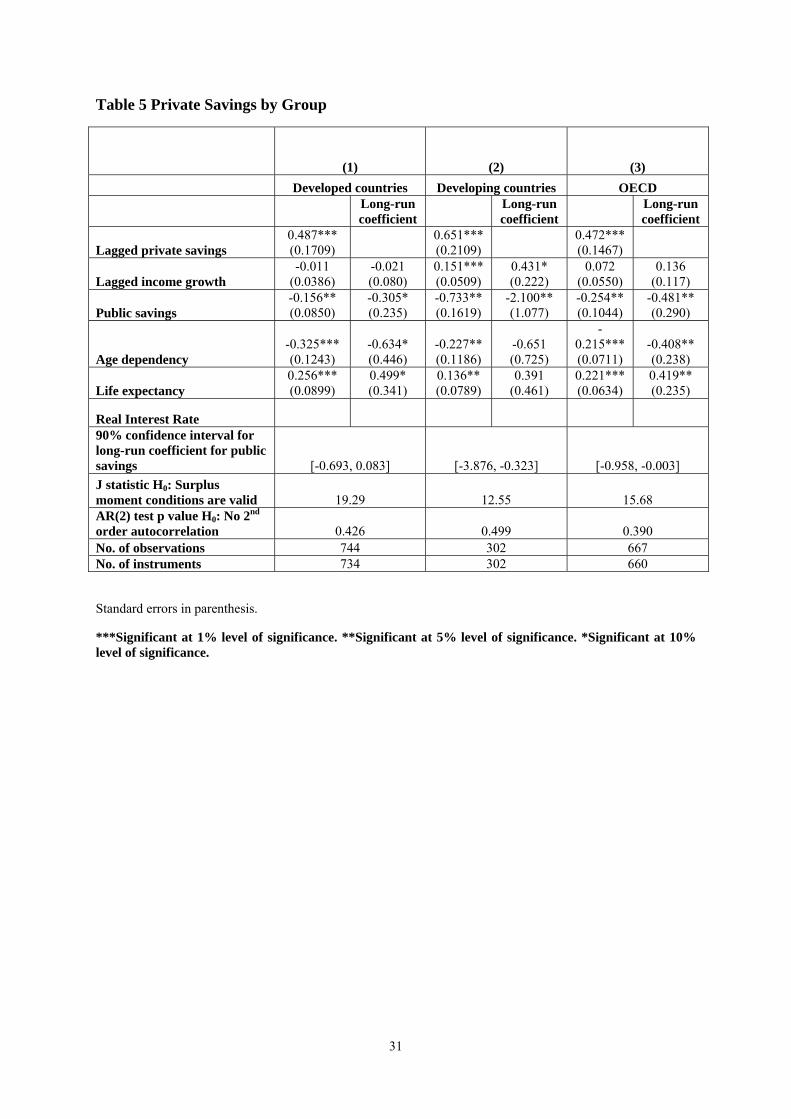
31
Table 5 Private Savings by Group
(1) (2) (3) Developed countries Developing countries OECD
Long-run coefficient
Long-run coefficient
Long-run coefficient
Lagged private savings 0.487*** (0.1709)
0.651*** (0.2109)
0.472*** (0.1467)
Lagged income growth -0.011
(0.0386) -0.021 (0.080)
0.151*** (0.0509)
0.431* (0.222)
0.072 (0.0550)
0.136 (0.117)
Public savings -0.156** (0.0850)
-0.305* (0.235)
-0.733** (0.1619)
-2.100** (1.077)
-0.254** (0.1044)
-0.481** (0.290)
Age dependency -0.325*** (0.1243)
-0.634* (0.446)
-0.227** (0.1186)
-0.651 (0.725)
-0.215*** (0.0711)
-0.408** (0.238)
Life expectancy 0.256*** (0.0899)
0.499* (0.341)
0.136** (0.0789)
0.391 (0.461)
0.221*** (0.0634)
0.419** (0.235)
Real Interest Rate 90% confidence interval for long-run coefficient for public savings [-0.693, 0.083] [-3.876, -0.323] [-0.958, -0.003] J statistic H0: Surplus moment conditions are valid 19.29 12.55 15.68 AR(2) test p value H0: No 2nd order autocorrelation 0.426 0.499 0.390 No. of observations 744 302 667 No. of instruments 734 302 660
Standard errors in parenthesis.
***Significant at 1% level of significance. **Significant at 5% level of significance. *Significant at 10% level of significance.

32
Table 6 Private Savings Specifications Using Real Interest Rate and Wealth Measure
(1) (2)
26 Developed and 7 developing
countries 19 Developed and 24 developing countries
Long-run coefficient
Long-run coefficient
Lagged private savings 0.686*** (0.1098)
0.866*** (0.0795)
Lagged income growth 0.066
(0.0849) 0.209
(0.291) 0.070
(0.0535) 0.518
(0.359)
Public savings -0.155** (0.0845)
-0.494 (0.321)
-0.213** (0.0901)
-1.589 (1.402)
Age dependency -0.157*** (0.0465)
-0.501* (0.305)
-0.073* (0.0489)
-0.541 (0.602)
Life expectancy 0.137*** (0.0478)
0.437* (0.303)
0.054* (0.0340)
0.403 (0.488)
Real Interest Rate 0.010*** (0.0027)
0.033* (0.041)
M2 percentage of GDP -0.000** (0.0001)
-0.002 (0.001)
90% confidence interval for long-run coefficient for public savings [-1.023,0.035] [-3.897,0.719] J statistic H0: Surplus moment conditions are valid 26.67 39.84 AR(2) test p value H0: No 2nd order autocorrelation 0.390 0.104 No. of observations 680 686 No. of instruments 678 686
Standard errors in parenthesis.
***Significant at 1% level of significance. **Significant at 5% level of significance. *Significant at 10% level of significance.
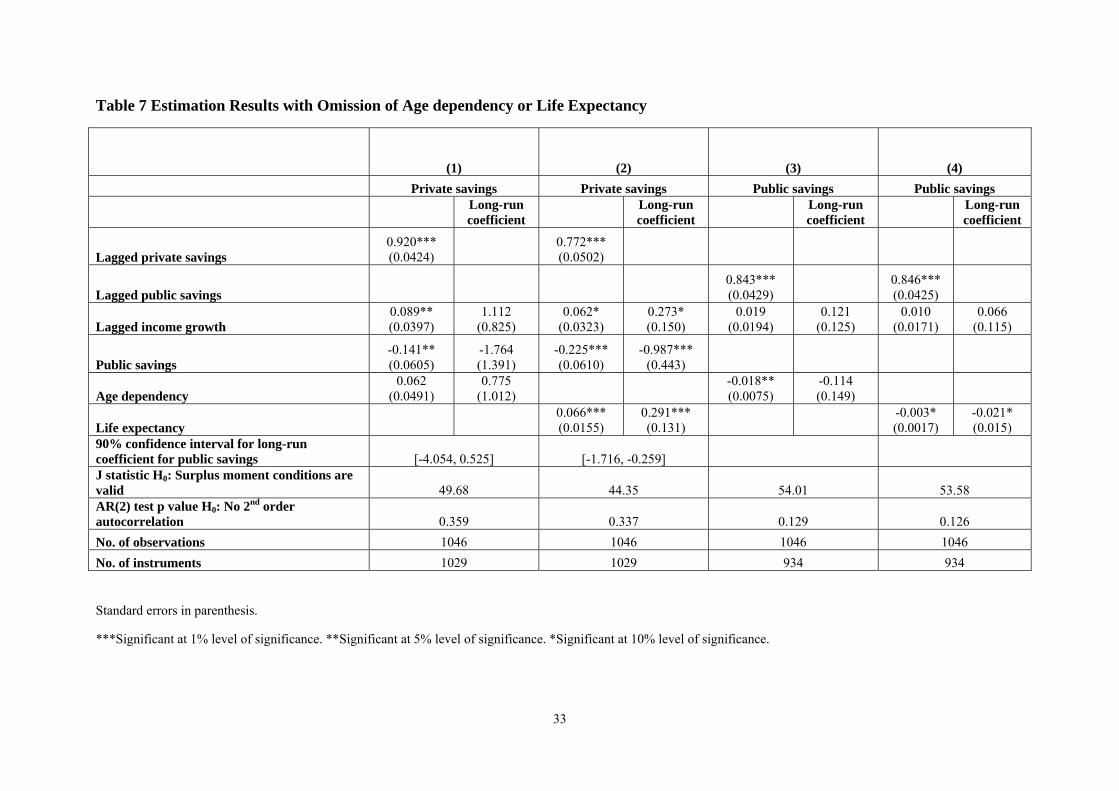
33
Table 7 Estimation Results with Omission of Age dependency or Life Expectancy
(1) (2) (3) (4) Private savings Private savings Public savings Public savings
Long-run coefficient
Long-run coefficient
Long-run coefficient
Long-run coefficient
Lagged private savings 0.920*** (0.0424)
0.772*** (0.0502)
Lagged public savings
0.843*** (0.0429)
0.846*** (0.0425)
Lagged income growth 0.089** (0.0397)
1.112 (0.825)
0.062* (0.0323)
0.273* (0.150)
0.019 (0.0194)
0.121 (0.125)
0.010 (0.0171)
0.066 (0.115)
Public savings -0.141** (0.0605)
-1.764 (1.391)
-0.225*** (0.0610)
-0.987*** (0.443)
Age dependency 0.062
(0.0491) 0.775
(1.012) -0.018** (0.0075)
-0.114 (0.149)
Life expectancy 0.066***
(0.0155) 0.291*** (0.131)
-0.003* (0.0017)
-0.021* (0.015)
90% confidence interval for long-run coefficient for public savings [-4.054, 0.525] [-1.716, -0.259] J statistic H0: Surplus moment conditions are valid 49.68 44.35 54.01 53.58 AR(2) test p value H0: No 2nd order autocorrelation 0.359 0.337 0.129 0.126 No. of observations 1046 1046 1046 1046 No. of instruments 1029 1029 934 934
Standard errors in parenthesis.
***Significant at 1% level of significance. **Significant at 5% level of significance. *Significant at 10% level of significance.

34
Table 8 Estimation Allowing for Alternative Measures of Economic Dependency
(1) (2) (3) (4) Private savings Public savings Private savings Public savings
Long-run coefficient
Long-run coefficient
Long-run coefficient
Long-run coefficient
Lagged private savings 0.815*** (0.0543)
0.808*** (0.0490)
Lagged public savings 0.838*** (0.0554)
0.847*** (0.0451)
Lagged income growth 0.055
(0.0396) 0.299
(0.216) 0.016
(0.0345) 0.101
(0.238) 0.055
(0.0398) 0.285
(0.207) 0.013
(0.0234) 0.088
(0.167)
Public savings -0.190** (0.0805)
-1.025* (0.651)
-0.182*** (0.0631)
-0.945** (0.485)
Youth dependency 0.001
(0.0059) 0.006
(0.032) 0.002
(0.0029) 0.012
(0.019)
Total dependency -0.010* (0.0073)
-0.054* (0.042)
0.000 (0.0040)
-0.003 (0.026)
Life expectancy 0.053*** (0.0171)
0.288** (0.173)
-0.005 (0.0036)
-0.029 (0.031)
0.063*** (0.0172)
0.329** (0.168)
-0.003 (0.0038)
-0.019 (0.028)
90% confidence interval for long-run coefficient for public savings [-2.096, 0.047] [-1.743, -0.146] J statistic H0: Surplus moment conditions are valid 46.88 52.57 43.18 53.59 AR(2) test p value H0: No 2nd order autocorrelation 0.346 0.128 0.348 0.128 No. of observations 1046 1046 1046 1046 No. of instruments 1030 935 1030 935
Standard errors in parenthesis.

35
***Significant at 1% level of significance. **Significant at 5% level of significance. *Significant at 10% level of significance.

36
APPENDIX
Table A1 Data Coverage
Country Year coverage Number of time periods Australia 1972-2004 33 Austria 1972-2004 33 Azerbaijan 1994-1999 6 Belarus 1995-2003 9 Belgium 1978-2004 27 Bolivia 1986-2003 18 Brazil 1980-1994 15 Bulgaria 1991-2004 14 Canada 1979-2004 26 Chile 1974-1988, 1992-2004 28 Colombia 1974-198 13 Croatia 1994-2004 11 Czech Republic 1993-2004 12 Denmark 1972-2004 33 Egypt, Arab Rep. 1975-1979, 1981-1997 22 Estonia 2000-2004 5 Finland 1972-2004 33 France 1978-2004 27 Georgia 1997-2001 5 Germany 1974-2004 31 Greece 1980-2004 25 Hong Kong, China 1980-2004 25 Hungary 1981-1999 19 Ireland 1972-2004 33 Israel 1976-2004 29 Italy 1980-2004 25 Japan 1980-2004 25 Kazakhstan 1997-2003 7 Korea, Rep. 1980-2004 25 Latvia 1994-2003 10 Lithuania 1993-2004 12 Malaysia 1996-2003 8 Mexico 1972-2000 29 Moldova 1997-2001 5 Mongolia 1992-2002 11 Netherlands 1975-2004 30 New Zealand 1980-2004 25 Norway 1980-2004 25 Panama 1990-1994 5 Peru 1990-2003 14

37
Poland 1994-2000 7 Portugal 1980-2004 25 Romania 1990-2004 15 Singapore 1972-2004 33 Slovak Republic 1996-2004 9 Slovenia 1990-2004 15 South Africa 1977-2004 28 Spain 1980-2004 25 Sweden 1978-2004 27 Switzerland 1977-2004 28 Thailand 1972-2002 31 Ukraine 1999-2003 5 United Kingdom 1973-2004 32 United States 1980-2004 25 Zimbabwe 1977-1991 15
Table A2 Summary Statistics
Variable No. of observations Mean
Standard deviation Min Max
Age dependency 1108 16.76074 6.508216 5.48 29.33 Real Income Growth per Capita 1108 5.579003 4.605773 -30.99 23.52 Life Expectancy at Birth 1108 72.88641 5.846744 44.61 82.03 Private Savings (% of GDP) 1108 23.71485 7.419446 -6.50 50.78 Public Savings (% of GDP) 1108 -0.94044 4.607695 -19.83 15.37
Table A3 Panel ADF Test
Variable Exogenous Variable(s) Used in
Test Fisher Chi Square
Test Statistic p value Age dependency Intercept, Trend 233.674 0.000 GDP Per Capita, PPP Intercept, Trend 106.102 0.587 Growth Intercept 316.608 0.000 Life Expectancy Intercept, Trend 268.396 0.000 Private Savings Intercept 181.263 0.000 Public Savings Intercept 227.424 0.000
Null Hypothesis: Unit Root. Growth is first difference of GDP Per Capita, PPP
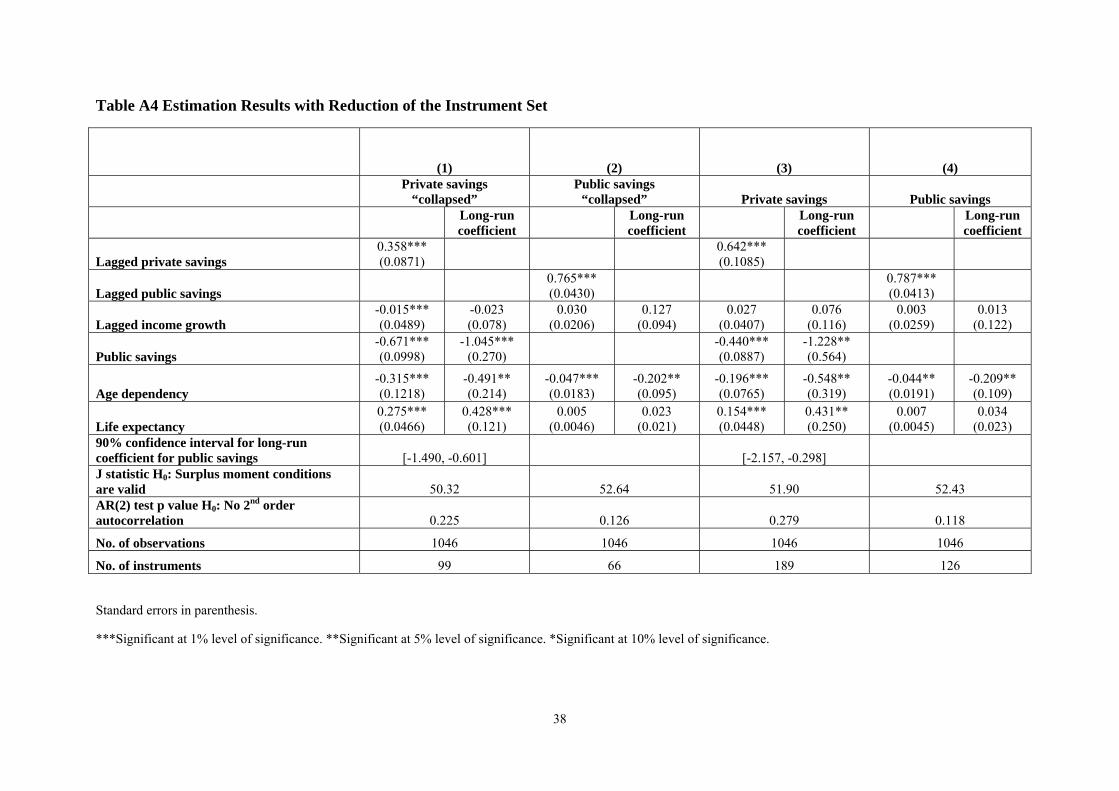
38
Table A4 Estimation Results with Reduction of the Instrument Set
(1) (2) (3) (4)
Private savings
“collapsed” Public savings
“collapsed” Private savings Public savings
Long-run coefficient
Long-run coefficient
Long-run coefficient
Long-run coefficient
Lagged private savings 0.358*** (0.0871)
0.642*** (0.1085)
Lagged public savings 0.765*** (0.0430)
0.787*** (0.0413)
Lagged income growth -0.015*** (0.0489)
-0.023 (0.078)
0.030 (0.0206)
0.127 (0.094)
0.027 (0.0407)
0.076 (0.116)
0.003 (0.0259)
0.013 (0.122)
Public savings -0.671*** (0.0998)
-1.045*** (0.270)
-0.440*** (0.0887)
-1.228** (0.564)
Age dependency -0.315*** (0.1218)
-0.491** (0.214)
-0.047*** (0.0183)
-0.202** (0.095)
-0.196*** (0.0765)
-0.548** (0.319)
-0.044** (0.0191)
-0.209** (0.109)
Life expectancy 0.275*** (0.0466)
0.428*** (0.121)
0.005 (0.0046)
0.023 (0.021)
0.154*** (0.0448)
0.431** (0.250)
0.007 (0.0045)
0.034 (0.023)
90% confidence interval for long-run coefficient for public savings [-1.490, -0.601]
[-2.157, -0.298]
J statistic H0: Surplus moment conditions are valid 50.32 52.64 51.90 52.43 AR(2) test p value H0: No 2nd order autocorrelation 0.225 0.126 0.279 0.118
No. of observations 1046 1046 1046 1046
No. of instruments 99 66 189 126
Standard errors in parenthesis.
***Significant at 1% level of significance. **Significant at 5% level of significance. *Significant at 10% level of significance.