Embed Size (px)
Citation preview

1
The Age of Computers
1950s: John Von Neuman designs the first (?) electronic computer, ENIAC, applies it to weather forecasting
Imagines uses in weather control, geo-engineering, etc.

2
The ENIAC Forecasts (1)
Image: http://maths.ucd.ie/~plynch/Publications/ENIAC-BAMS-08.pdf
3
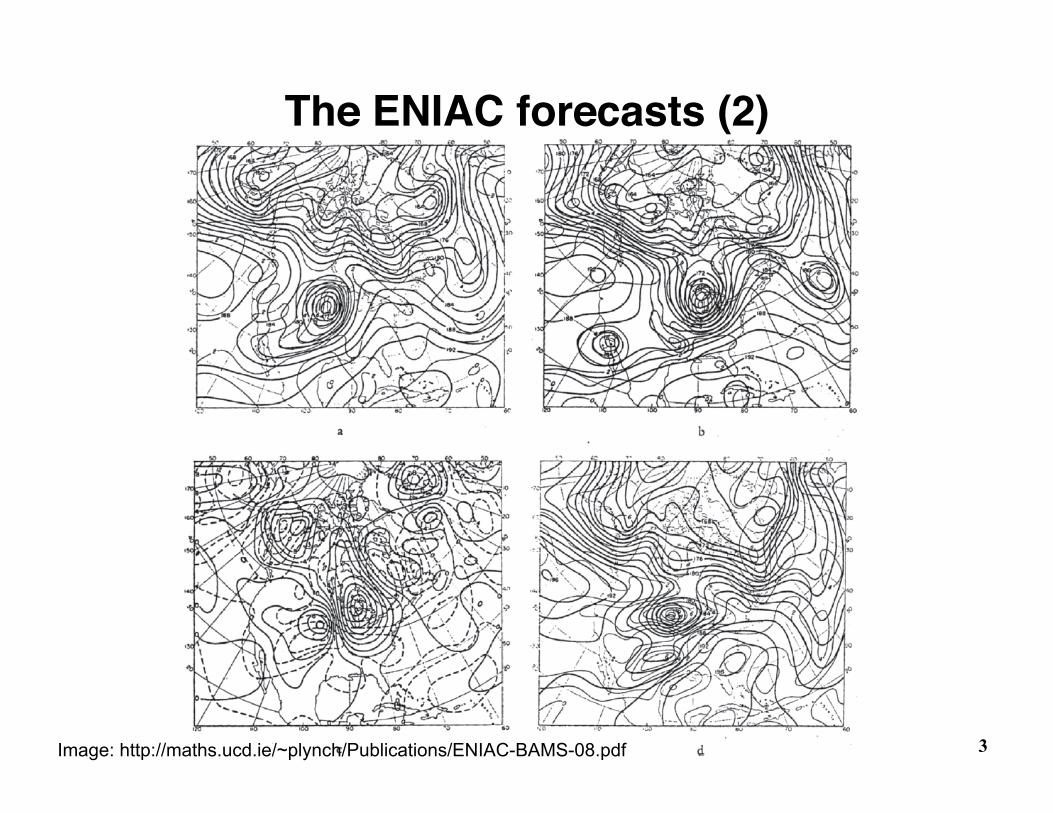
The ENIAC forecasts (2)
Image: http://maths.ucd.ie/~plynch/Publications/ENIAC-BAMS-08.pdf

4
PHONIAC
Image: http://mathsci.ucd.ie/~plynch/Publications/PHONIAC.html

5
Moore’s Law

6
Supercomputers

7
Where are these supercomputers?
http://infosthetics.com/archives/2010/05/bbc_news_visualizing_the_top_500_supercomputer_report.html

8
Reminder: How the models work
http://www.iac.ethz.ch/groups/knutti/research

9
More resolution…
http://onlinelibrary.wiley.com/doi/10.1111/j.1740-9713.2010.00403.x/abstract

10
IPCC Model evolution
http://eo.ucar.edu/staff/rrussell/climate/modeling/climate_model_resolution.html

11
Can Moore’s Law continue forever?
http://wccftech.com/moores-law-will-be-dead-2020-claim-experts-fab-process-cpug-pus-7-nm-5-nm/

12
Paper Folding
After 4 folds, 1 cm thickHow thick after 33 folds?
0
1000
2000
3000
4000
5000
6000
1 3 5 7 9 11 13 15 17 19 21 23 25 27 29 31 33
Thickness (km)
0.000001
0.00001
0.0001
0.001
0.01
0.1
1
10
100
1000
10000
1 3 5 7 9 11 13 15 17 19 21 23 25 27 29 31 33
Thickness (km)
1cm 1mm
10cm 1m
10m 100m
1km 10km
100km 1000km
10,000km

13
Understanding Exponential Growth
2014
0
5
10
15
20
25
30
35
1955 1960 1965 1970 1975 1980 1985 1990 1995 2000 2005 2010 2015
peta
FLO
PS
Peak Speed of fastest supercomputer

14
Understanding Exponential Growth
2014
0
10
20
30
40
50
60
1955 1960 1965 1970 1975 1980 1985 1990 1995 2000 2005 2010 2015
peta
FLO
PS
Peak Speed of fastest supercomputer

15
Understanding Exponential Growth
20140
50
100
150
200
250
300
350
1955 1960 1965 1970 1975 1980 1985 1990 1995 2000 2005 2010 2015 2020
peta
FLO
PS
Peak Speed of fastest supercomputer

16
Why does this graph have this shape?
http://novel-infectious-diseases.blogspot.ca/2014/10/comparing-who-and-cdc-projections-of.html

17
And this one?
Lang et al (2014). The influence of societal individualism on a century of tobacco use: modelling the prevalence of smoking, 1–20. Dynamical Systems; Physics and Society.

18
Population Growth and Projections

19
Multi-loop systems
20
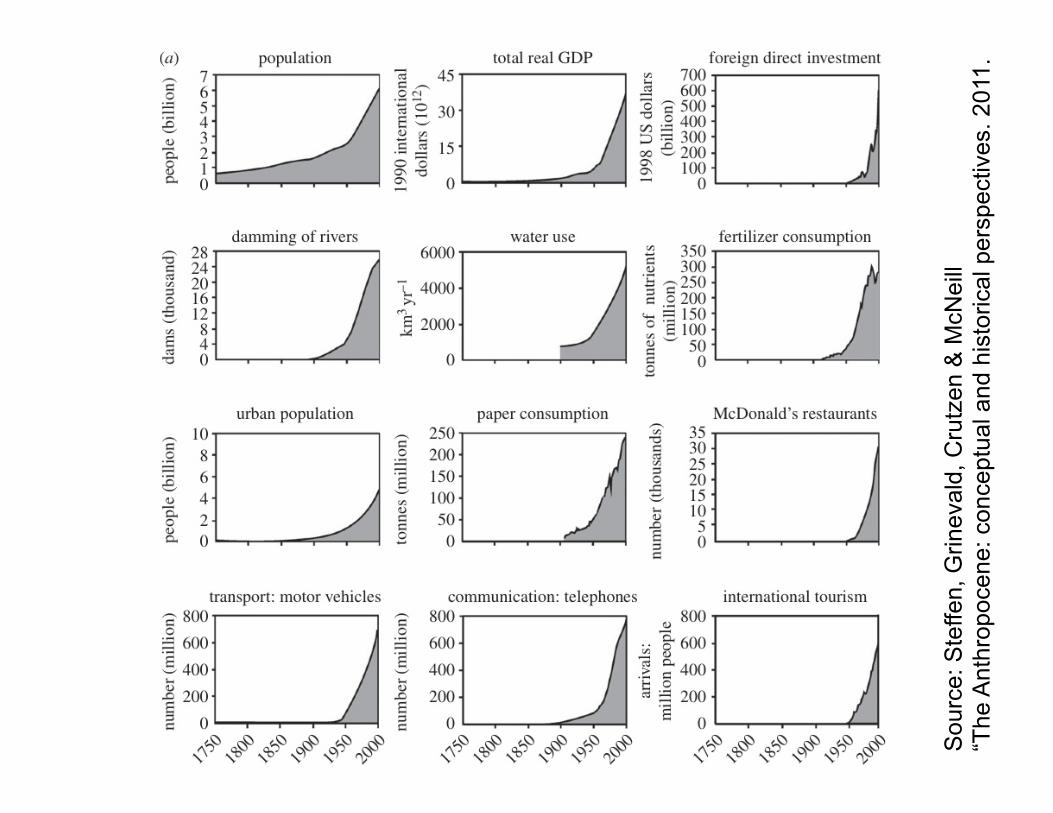
Welcome to the Anthropocene…
Sou
rce:
Ste
ffen,
Grin
eval
d, C
rutz
en &
McN
eill
“T
he A
nthr
opoc
ene:
con
cept
ual a
nd h
isto
rical
per
spec
tives
. 201
1.

21
Welcome to the Anthropocene…
Sou
rce:
Ste
ffen,
Grin
eval
d, C
rutz
en &
McN
eill
“T
he A
nthr
opoc
ene:
con
cept
ual a
nd h
isto
rical
per
spec
tives
. 201
1.

22
About that Ebola Projection…
http://www.cdc.gov/vhf/ebola/outbreaks/2014-west-africa/cumulative-cases-graphs.html

23
Dynamic Behaviour Over Time
World Population, 1800-2100
today

24
1) Some curves that look exponential are not!
2) Exponential growth cannot continue
forever
3) Predicting the peak of a growth curve is really hard
(be suspicious of any precise predictions)

25
Key ideas
Finite planet has a “carrying capacity”Growth of Population x ecological footprint will exceed it This happened sometime in the 1980sReduction is inevitable; can be managed or can be collapse
There are limits on stocks...E.g. resources such as oil, coal, scarce mineralsE.g. pollution sinks, such as CO2 in the atmosphere(In the past, we’ve been good at finding substitutions…)
…but the important limits are on flowsE.g. Rate at which we can grow food, recycle waste, etc.E.g. Rate at which we can transition to alternative technologiesHence, population can overshoot carrying capacity
People often deny a limit has been reached until after a collapse
E.g. Dotcom “bubble”; banking crisis of 2007;E.g. Economic inequality? Climate change?

26 Steffen, W., et. al. (2015). Planetary boundaries: Guiding human development on a changing planet. Science, 347(6223).
Planetary Boundaries