Embed Size (px)
Citation preview

�������������� �� �����
������� ���� � ��������������� ����� � ������ ������������

���������� �� ����������������� �������������������� ��� �������� ����������������� ��� ������ ��� ��������� ���������������� ������������������������ ���������� ����������� ������ ���� ������� ������������� � ��������� ���� �������� ��� ������������ ��������� �� �������� �������� ������������������ ��� ������ �
�������������� �� �����
������� ���� � ��������������� ����� � ������ ������������
������ �� ����������������� ������� ��
$,+:�FDW��QR��&9'���
!������� �� ����������������� ��������"##$
������������������������������ ������������������ ����������������� ���%� ������������������������������������ ��������� ��������������� �� ���������������� ���������&�'������ ��� '�������� �� � ����������� � �����������������������������������%�(���� ��)������� �%������� �� ����������������� �������%�*)+,�-�./#%� ���� ��"0#1�
������������������������ ������������������� ��������������������(���� ��)������� ��2 ��%������ �� ����������������� �������%�*)+�,�-�./#%� ���� ��"0#1%���������� �������������������3����455�������������6�
�7,8�1�/9#"9�".:�#
������������ ����
������ �� ����������������� ��������3����6�"##$��������������������7����4������� ��� ������������� ���� %� ������ ������� ��� ��4������
���� �� ���������������� ���� ������� ��
,��� ��;�7 ������
;�����;�&�����(���
� ��� '������������������ ���� ��������������� ���������������������4
���������;�����%�;������� ��&����<����(� ���� ��2 �������� �� ����������������� �������*)+�,�-�./# ���� ��"0#1
)�� �4�3#"6�0"99�1###
)������������������ �� ����������������� �������
)� �������=�����)� �� �
v
ContentsAcknowledgments ........................................................................................................................vi
1 Introduction.............................................................................................................................1
2 The survey................................................................................................................................2
2.1 The Active Australia Survey .......................................................................................... 2
3 Interviewer training and survey implementation............................................................5
3.1 The National Physical Activity Survey.........................................................................5
3.2 Handy hints for users, researchers, interviewers and analysts.................................5
3.3 Annotated survey questions for interviewers .............................................................7
4 Analysis and reporting of the survey data.......................................................................10
4.1 Measures derived from the Active Australia Survey ...............................................10
4.2 Data structure .................................................................................................................10
4.3 Number of sessions of each activity ............................................................................12
4.4 Total time spent in each activity ..................................................................................12
4.5 Average time spent in each activity ............................................................................13
4.6 Proportion of people doing ‘sufficient’ activity for health.......................................14
4.7 Proportion of people who were sedentary.................................................................17
4.8 Awareness of physical activity messages...................................................................17
5 Background to the survey ...................................................................................................19
5.1 Basis for data development ..........................................................................................20
5.2 Development of the data standards for physical activity, 1997–1999 ....................23
5.3 Current status of the proposed data standards .........................................................28
Appendix 1: Example of CATI survey coding ........................................................................31
Appendix 2: Membership of the Expert Working Group.....................................................40
Appendix 3: Parties invited to be part of the national consultation process ....................41
Bibliography..................................................................................................................................48
��
������������ �������������� ���� ������������
���������� �� �������� �����������������������
������������� ������������� � ������!�������
�����"������#�����$�$��� �������%��������"�#�&�����������'������������'��� ��������'���
�$���$ ���# �� �������� �����������������������
������(��$�� )�'�� �����*������������
�������(��� *���+������, ��� ���
������(���� )�'�� �����*���� ��
(����+�� )�'�� ������� ������ ����
-����+���� �� ������(����������� �
���������������� ���.� �+���������-�������������� � �����
����!��� �� ���������� �+�$$ ��
+�� �&��� �� �������� ����������
-�����&����$ �����$�����������������#���+���
���������� /���� �����)�'�� �������������#�
*�'����0��� ���"��)�'�� �
����" ��� ��#��������������#��������
1�����������'� �� �������� �����������������������
��'����� �� ���������������� ��� ��
2����%����� �����$�����������������#��#
+�������'������� �����$�����������������#��#
�$�����*��� �� �������� �����������������������
2�������0,(���� �� �������� �����������������������
����3��������� �� �������� �����������������������
�� ��������� ��������������+�$$�������������$�����������������#��#4
1
1 IntroductionThe Active Australia Survey is designed to measure participation in leisure-time physicalactivity and to assess knowledge of current public health messages about the health benefitsof physical activity. It offers a short and reliable set of questions that can be easilyimplemented via computer-assisted telephone interviewing (CATI) techniques or in face-to-face interviews.The Active Australia Survey was first developed and nationally implemented in 1997 toassess the effectiveness of the Active Australia campaign which was being run in New SouthWales at the time in order to promote physical activity. Since then, the survey has beenimplemented nationally through the National Physical Activity Surveys in 1999 and 2000and the Australian Diabetes, Obesity and Lifestyle Study in 1999–00. It has also been used inseveral state-based surveys, such as in Queensland, South Australia, and New South Wales.For more information on surveys of physical activity, see <http://www.aihw.gov.au>.This manual is designed to provide an overview of the survey. It includes a copy of thesurvey, an implementation guide with instructions for interviewers, a guide to the measuresthat can be derived from the survey data, information on how these measures are calculatedand examples of how they are usually reported. It also provides background information onthe development of the survey and an example of CATI coding (Appendix 1).While this manual specifically focuses on the Active Australia Survey, it is worth noting thatother surveys such as the Australian Bureau of Statistics (ABS) National Health Surveys alsocollect and present data on participation in physical activity. However the ABS results arenot directly comparable with those of the Active Australia Survey. The key differencesbetween the two surveys are (AIHW forthcoming):• The Active Australia questions apply to only one week preceding interview, whereas the
National Health Survey questions apply to the two weeks preceding interview.• The Active Australia Survey includes walking for transport, whereas the National
Health Surveys do not.• The Active Australia Survey and the National Health Surveys report levels of
participation using different measures.For more information on the ABS National Health Surveys see <http://www.abs.gov.au>.

2
2 The surveyThis section presents the core questions in the Active Australia Survey. These consist ofeight questions to assess participation in various types of activity and five statements toassess awareness of current public health messages about physical activity.The core questions are usually supplemented by questions collecting demographicinformation (age, sex, and household information). See Armstrong et al. 2000 for examplesof demographic information collected. Questions about other characteristics such as heightand weight, or items of particular interest such as awareness of local interventions or use offacilities for physical activity may also be added to the survey. The questions weredeveloped and intended for use with persons aged 18–75 years.
2.1 The Active Australia SurveyThe next questions are about any physical activities that you may have done in the lastweek:1. In the last week, how many times have you walked continuously, for at least
10 minutes, for recreation, exercise or to get to or from places?
times
2. What do you estimate was the total time that you spent walking in this way in the lastweek?
In hours and/or minutes
minutes
hours
3. In the last week, how many times did you do any vigorous gardening or heavy workaround the yard, which made you breathe harder or puff and pant?
times

3
4. What do you estimate was the total time that you spent doing vigorous gardening orheavy work around the yard in the last week?
In hours and/or minutes
minutes
hours
The next questions exclude household chores, gardening or yardwork:5. In the last week, how many times did you do any vigorous physical activity which made
you breathe harder or puff and pant? (e.g. jogging, cycling, aerobics, competitive tennis)
times
6. What do you estimate was the total time that you spent doing this vigorous physicalactivity in the last week?
In hours and/or minutes
minutes
hours
7. In the last week, how many times did you do any other more moderate physicalactivities that you have not already mentioned? (e.g. gentle swimming, social tennis,golf)
times
4
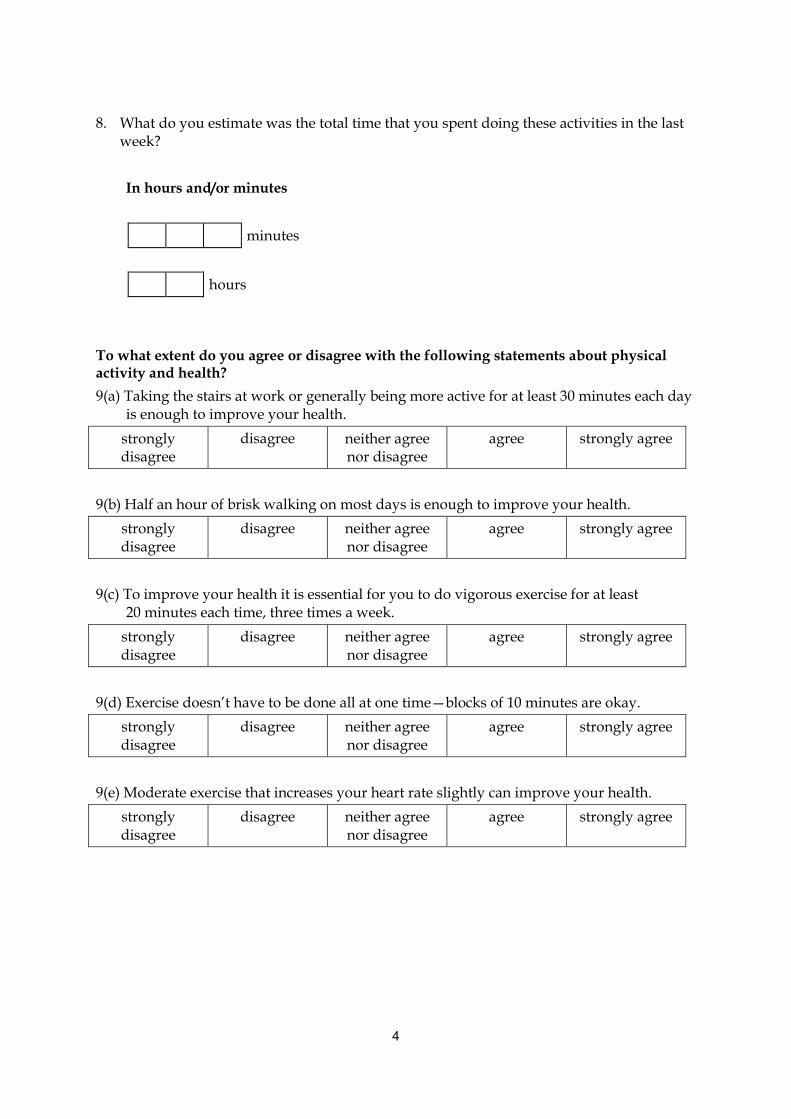
8. What do you estimate was the total time that you spent doing these activities in the lastweek?
In hours and/or minutes
minutes
hours
To what extent do you agree or disagree with the following statements about physicalactivity and health?9(a) Taking the stairs at work or generally being more active for at least 30 minutes each day
is enough to improve your health.stronglydisagree
disagree neither agreenor disagree
agree strongly agree
9(b) Half an hour of brisk walking on most days is enough to improve your health.stronglydisagree
disagree neither agreenor disagree
agree strongly agree
9(c) To improve your health it is essential for you to do vigorous exercise for at least20 minutes each time, three times a week.
stronglydisagree
disagree neither agreenor disagree
agree strongly agree
9(d) Exercise doesn’t have to be done all at one time—blocks of 10 minutes are okay.stronglydisagree
disagree neither agreenor disagree
agree strongly agree
9(e) Moderate exercise that increases your heart rate slightly can improve your health.stronglydisagree
disagree neither agreenor disagree
agree strongly agree

5
3 Interviewer training and survey implementationThis section provides a guide to implementing the Active Australia Survey in the field. First,the procedure used to implement the National Physical Activity Surveys is briefly described.Next, there are some handy hints for users, researchers, interviewers and analysts,highlighting common problems that may arise and suggesting ways to minimise reportingerrors. Finally, the eight core questions for assessing physical activity participation arereproduced, along with tips for interviewers.
3.1 The National Physical Activity SurveyThe National Physical Activity Survey was conducted in 1997 (often referred to as the ActiveAustralia Baseline Survey), 1999 and 2000 (Bauman et al. 2001; Armstrong et al. 2000; ASC1998). The three surveys were conducted at exactly the same period of the year (the last twoweeks of November and first two weeks of December) to ensure that participation rateswere not affected by seasonal conditions. This survey period was also before the summerholiday period, because participation rates during holiday periods may be influenced byincreased leisure time. Each year, the survey consisted of the Active Australia core surveyquestions listed in the previous section, plus some supplementary questions coveringdemographics, height and weight, recognition and recall of specific physical activitypromotional messages and participation in related organised activities such as ActiveAustralia Day.The survey method was a random sample population telephone survey (using CATImethodology) conducted by the Hunter Valley Research Foundation. The electronicwhite pages were used to generate a random sample of households, and an adult aged 18–75years was then randomly selected from within each household. Participation was voluntary.Those who participated were asked a series of questions (lasting about10 minutes) on their participation in, and knowledge and understanding of physical activity.An example of the CATI coding used in the 1999 survey is presented in Appendix 1. Moredetailed information regarding survey methodology can be found in Armstrong et al. 2000.
3.2 Handy hints for users, researchers, interviewers and analystsThis section presents some common problems that may arise when implementing the ActiveAustralia Survey and some suggestions for dealing with these problems and minimisingreporting errors.
Common difficultiesDifficulties may include:• ensuring the respondent understands the meaning of the questions• ensuring that ineligible activities are not included in the respondent’s answers• ensuring that eligible activities are correctly classified (i.e. as walking, vigorous
yardwork, other vigorous or other moderate activities)• ensuring that the answers recorded are meaningful and plausible.
6
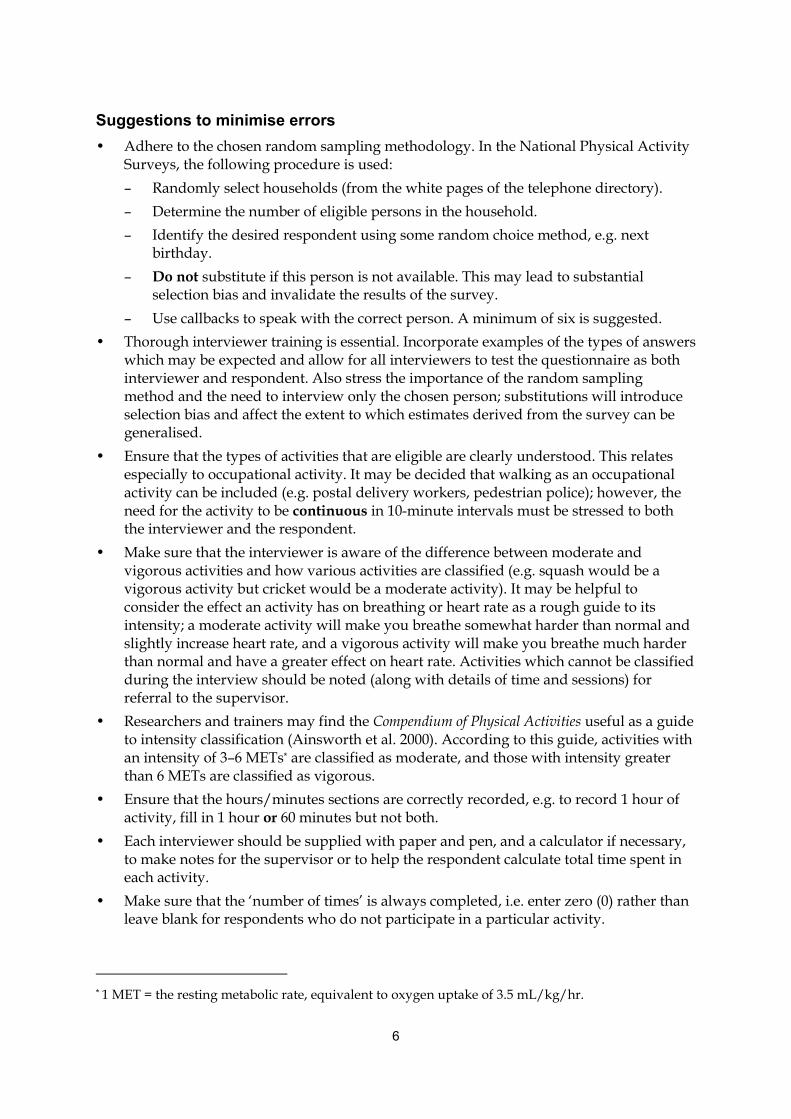
Suggestions to minimise errors• Adhere to the chosen random sampling methodology. In the National Physical Activity
Surveys, the following procedure is used:– Randomly select households (from the white pages of the telephone directory).– Determine the number of eligible persons in the household.– Identify the desired respondent using some random choice method, e.g. next
birthday.– Do not substitute if this person is not available. This may lead to substantial
selection bias and invalidate the results of the survey.– Use callbacks to speak with the correct person. A minimum of six is suggested.
• Thorough interviewer training is essential. Incorporate examples of the types of answerswhich may be expected and allow for all interviewers to test the questionnaire as bothinterviewer and respondent. Also stress the importance of the random samplingmethod and the need to interview only the chosen person; substitutions will introduceselection bias and affect the extent to which estimates derived from the survey can begeneralised.
• Ensure that the types of activities that are eligible are clearly understood. This relatesespecially to occupational activity. It may be decided that walking as an occupationalactivity can be included (e.g. postal delivery workers, pedestrian police); however, theneed for the activity to be continuous in 10-minute intervals must be stressed to boththe interviewer and the respondent.
• Make sure that the interviewer is aware of the difference between moderate andvigorous activities and how various activities are classified (e.g. squash would be avigorous activity but cricket would be a moderate activity). It may be helpful toconsider the effect an activity has on breathing or heart rate as a rough guide to itsintensity; a moderate activity will make you breathe somewhat harder than normal andslightly increase heart rate, and a vigorous activity will make you breathe much harderthan normal and have a greater effect on heart rate. Activities which cannot be classifiedduring the interview should be noted (along with details of time and sessions) forreferral to the supervisor.
• Researchers and trainers may find the Compendium of Physical Activities useful as a guideto intensity classification (Ainsworth et al. 2000). According to this guide, activities withan intensity of 3–6 METs* are classified as moderate, and those with intensity greaterthan 6 METs are classified as vigorous.
• Ensure that the hours/minutes sections are correctly recorded, e.g. to record 1 hour ofactivity, fill in 1 hour or 60 minutes but not both.
• Each interviewer should be supplied with paper and pen, and a calculator if necessary,to make notes for the supervisor or to help the respondent calculate total time spent ineach activity.
• Make sure that the ‘number of times’ is always completed, i.e. enter zero (0) rather thanleave blank for respondents who do not participate in a particular activity.
* 1 MET = the resting metabolic rate, equivalent to oxygen uptake of 3.5 mL/kg/hr.
7
• Be alert for logical inconsistencies in the data. For example, a person who reports fivesessions of walking must have recorded a total time of at least 50 minutes to satisfy the‘continuously for at least 10 minutes’ wording of the question.
• Clarify answers which may seem implausible, e.g. reporting one vigorous activitysession and a total time of 4 hours.
• Where a CATI system is being used, notes on the screen relating to the current questionmay be helpful, e.g. types of eligible activities.
• Limiting data entry fields may be helpful, e.g. limit the hours of activity field from0 to 14 as per the truncation rules. Answers which, after clarification from therespondent, are still outside the limits should be noted by the interviewer and assessedlater by the research team.
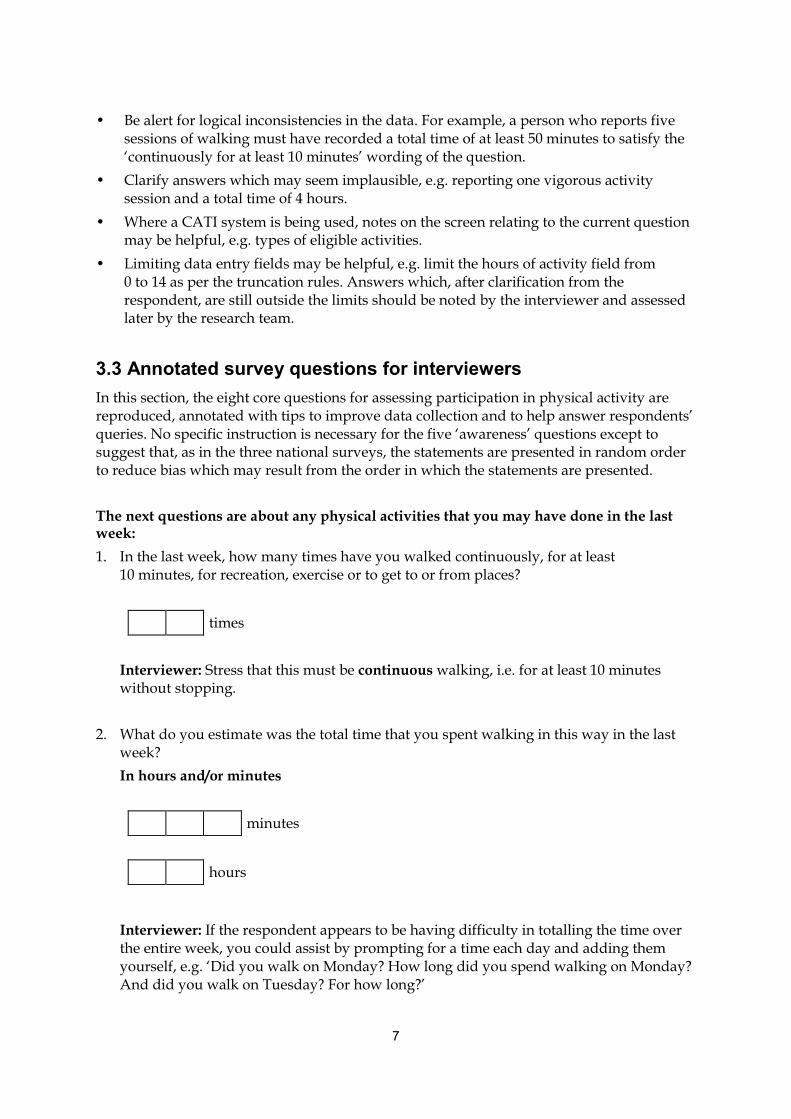
3.3 Annotated survey questions for interviewersIn this section, the eight core questions for assessing participation in physical activity arereproduced, annotated with tips to improve data collection and to help answer respondents’queries. No specific instruction is necessary for the five ‘awareness’ questions except tosuggest that, as in the three national surveys, the statements are presented in random orderto reduce bias which may result from the order in which the statements are presented.
The next questions are about any physical activities that you may have done in the lastweek:1. In the last week, how many times have you walked continuously, for at least
10 minutes, for recreation, exercise or to get to or from places?
times
Interviewer: Stress that this must be continuous walking, i.e. for at least 10 minuteswithout stopping.
2. What do you estimate was the total time that you spent walking in this way in the lastweek?In hours and/or minutes
minutes
hours
Interviewer: If the respondent appears to be having difficulty in totalling the time overthe entire week, you could assist by prompting for a time each day and adding themyourself, e.g. ‘Did you walk on Monday? How long did you spend walking on Monday?And did you walk on Tuesday? For how long?’
8
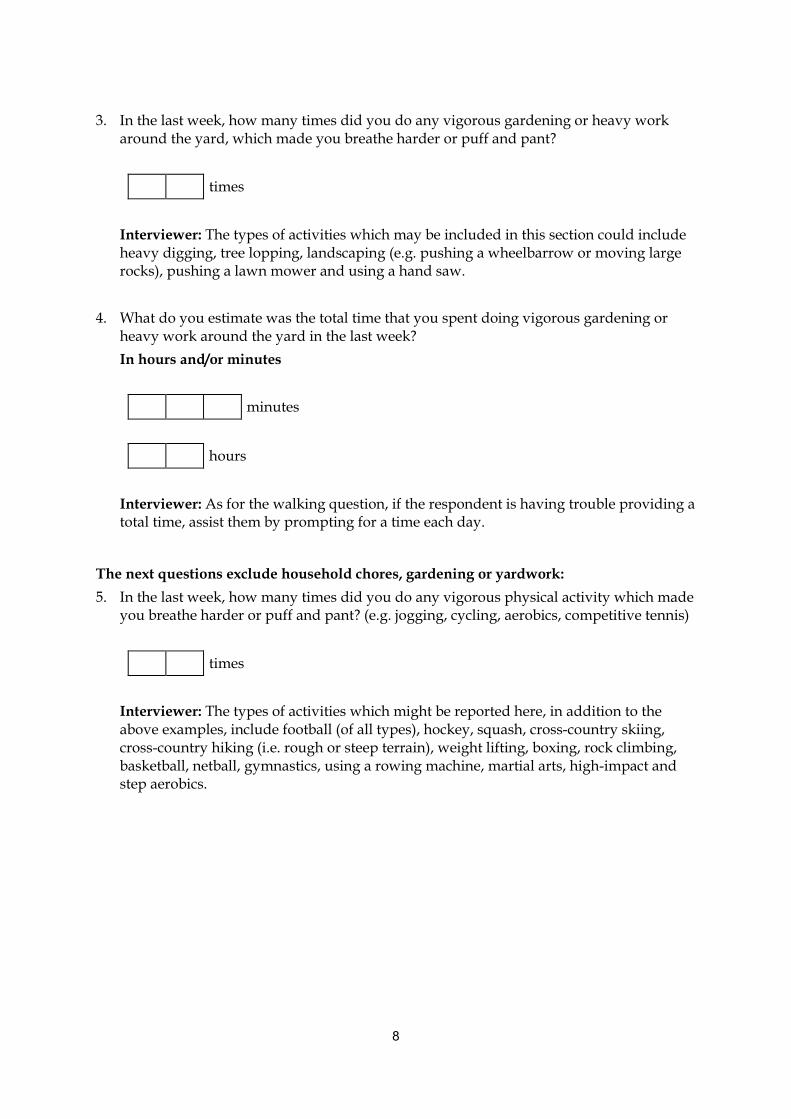
3. In the last week, how many times did you do any vigorous gardening or heavy workaround the yard, which made you breathe harder or puff and pant?
times
Interviewer: The types of activities which may be included in this section could includeheavy digging, tree lopping, landscaping (e.g. pushing a wheelbarrow or moving largerocks), pushing a lawn mower and using a hand saw.
4. What do you estimate was the total time that you spent doing vigorous gardening orheavy work around the yard in the last week?In hours and/or minutes
minutes
hours
Interviewer: As for the walking question, if the respondent is having trouble providing atotal time, assist them by prompting for a time each day.
The next questions exclude household chores, gardening or yardwork:5. In the last week, how many times did you do any vigorous physical activity which made
you breathe harder or puff and pant? (e.g. jogging, cycling, aerobics, competitive tennis)
times
Interviewer: The types of activities which might be reported here, in addition to theabove examples, include football (of all types), hockey, squash, cross-country skiing,cross-country hiking (i.e. rough or steep terrain), weight lifting, boxing, rock climbing,basketball, netball, gymnastics, using a rowing machine, martial arts, high-impact andstep aerobics.

9
6. What do you estimate was the total time that you spent doing this vigorous physicalactivity in the last week?In hours and/or minutes
minutes
hours
Interviewer: Again, prompt the respondent for daily times if they are having difficultycalculating a weekly total.
7. In the last week, how many times did you do any other more moderate physicalactivities that you have not already mentioned? (e.g. gentle swimming, social tennis,golf)
times
Interviewer: The types of activities which might be expected, in addition to the aboveexamples, include dancing, badminton, table tennis, horseback riding, canoeing,kayaking, volleyball, cricket, baseball or softball, downhill skiing, cross-training, surfingand windsurfing.
8. What do you estimate was the total time that you spent doing these activities in the lastweek?In hours and/or minutes
minutes
hours
Interviewer: Again, assist the respondent with adding daily times if necessary.
10
4 Analysis and reporting of the survey dataThis section describes the types of measures that can be constructed from the survey dataand provides instructions on how each of these measures is derived. Details and examples ofthe usual method of reporting each measure are also provided. Although the examples ofusual reporting method present the data in table form, it is also possible, and can be moreinformative, to present these data graphically. An example of a graphical presentation isprovided. These methods and measures were used in reporting the results of the threeNational Physical Activity Surveys and other national and state surveys that used the ActiveAustralia questions. With appropriate adjustments for sample demographics, use of thesesame measures allows comparisons to be made between new and previously publishedresults.For more examples of survey data presentation see Armstrong et al. 2000.
4.1 Measures derived from the Active Australia SurveyA number of different measures of participation in physical activity during the previousweek can be derived from the survey data. These include:• number of sessions of physical activity• total time spent in each activity• average time spent in each activity• proportion of people who were doing a sufficient amount of activity to gain health
benefits• proportion of people who were sedentary.The methods of constructing and reporting on each of these measures will be described inturn.The other measures that can be derived from the survey data relate to awareness of thecurrent public health messages about physical activity and health. The awareness section ofthe survey consists of five statements about physical activity and health. Survey respondentsare asked to indicate to what extent they agree with each of the statements. The methods ofanalysing and reporting these data are also described below.
4.2 Data structureThis section describes the structure of the survey data and defines the variables used in thisdocument.
Participation in physical activityFor each activity type there are two questions—number of sessions and time per week.Usually the time is recorded in hours and/or minutes, so for each activity type there will betwo time variables—hours and minutes.
11
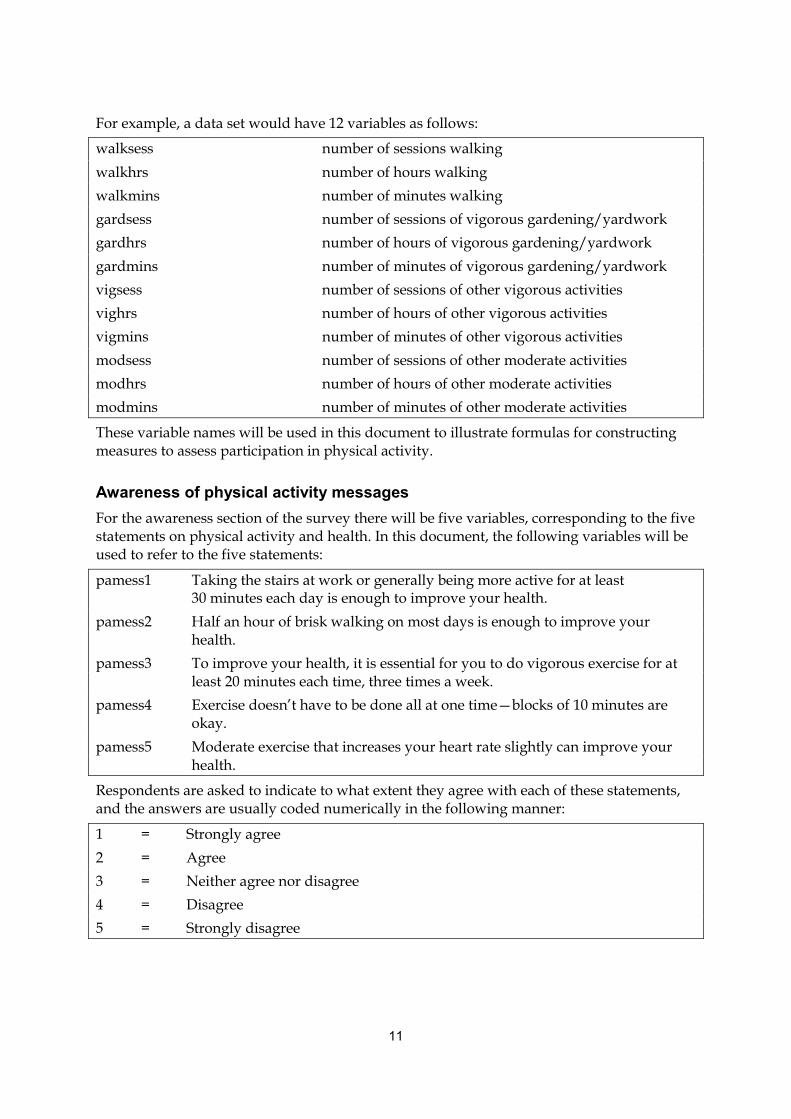
For example, a data set would have 12 variables as follows:
walksess number of sessions walkingwalkhrs number of hours walkingwalkmins number of minutes walkinggardsess number of sessions of vigorous gardening/yardworkgardhrs number of hours of vigorous gardening/yardworkgardmins number of minutes of vigorous gardening/yardworkvigsess number of sessions of other vigorous activitiesvighrs number of hours of other vigorous activitiesvigmins number of minutes of other vigorous activitiesmodsess number of sessions of other moderate activitiesmodhrs number of hours of other moderate activitiesmodmins number of minutes of other moderate activities
These variable names will be used in this document to illustrate formulas for constructingmeasures to assess participation in physical activity.
Awareness of physical activity messagesFor the awareness section of the survey there will be five variables, corresponding to the fivestatements on physical activity and health. In this document, the following variables will beused to refer to the five statements:
pamess1 Taking the stairs at work or generally being more active for at least30 minutes each day is enough to improve your health.
pamess2 Half an hour of brisk walking on most days is enough to improve yourhealth.
pamess3 To improve your health, it is essential for you to do vigorous exercise for atleast 20 minutes each time, three times a week.
pamess4 Exercise doesn’t have to be done all at one time—blocks of 10 minutes areokay.
pamess5 Moderate exercise that increases your heart rate slightly can improve yourhealth.
Respondents are asked to indicate to what extent they agree with each of these statements,and the answers are usually coded numerically in the following manner:
1 = Strongly agree2 = Agree3 = Neither agree nor disagree4 = Disagree5 = Strongly disagree
12
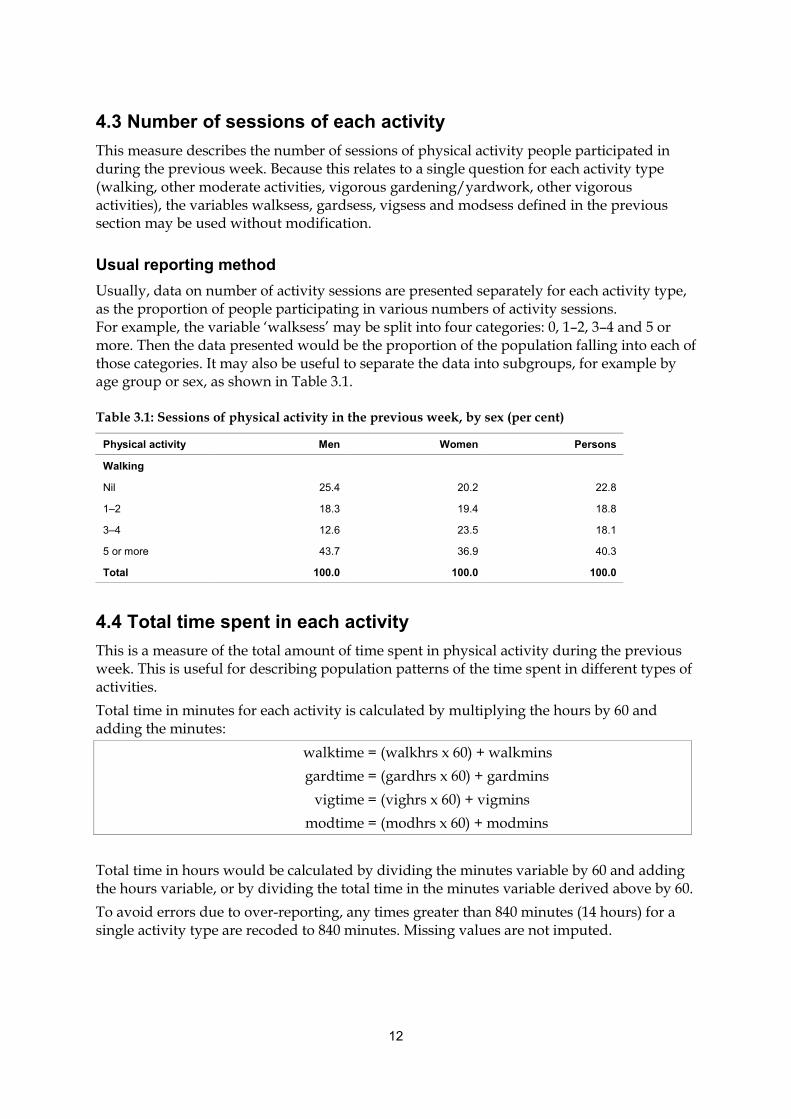
4.3 Number of sessions of each activityThis measure describes the number of sessions of physical activity people participated induring the previous week. Because this relates to a single question for each activity type(walking, other moderate activities, vigorous gardening/yardwork, other vigorousactivities), the variables walksess, gardsess, vigsess and modsess defined in the previoussection may be used without modification.
Usual reporting methodUsually, data on number of activity sessions are presented separately for each activity type,as the proportion of people participating in various numbers of activity sessions.For example, the variable ‘walksess’ may be split into four categories: 0, 1–2, 3–4 and 5 ormore. Then the data presented would be the proportion of the population falling into each ofthose categories. It may also be useful to separate the data into subgroups, for example byage group or sex, as shown in Table 3.1.
Table 3.1: Sessions of physical activity in the previous week, by sex (per cent)
Physical activity Men Women Persons
Walking
Nil 25.4 20.2 22.8
1–2 18.3 19.4 18.8
3–4 12.6 23.5 18.1
5 or more 43.7 36.9 40.3
Total 100.0 100.0 100.0
4.4 Total time spent in each activityThis is a measure of the total amount of time spent in physical activity during the previousweek. This is useful for describing population patterns of the time spent in different types ofactivities.Total time in minutes for each activity is calculated by multiplying the hours by 60 andadding the minutes:
walktime =gardtime =
vigtime =modtime =
(walkhrs x 60) + walkmins(gardhrs x 60) + gardmins(vighrs x 60) + vigmins(modhrs x 60) + modmins
Total time in hours would be calculated by dividing the minutes variable by 60 and addingthe hours variable, or by dividing the total time in the minutes variable derived above by 60.To avoid errors due to over-reporting, any times greater than 840 minutes (14 hours) for asingle activity type are recoded to 840 minutes. Missing values are not imputed.

13
Usual reporting methodTotal time spent in activity is usually reported by presenting the average of total time over apopulation or subgroup. Instructions on how to derive and report the average time areshown below.
4.5 Average time spent in each activityThis measure is used to illustrate the population distribution of the total time spent inactivity. Note that the question assessing moderate activity other than walking has beenfound to have low validity (Brown et al. 2002) and therefore should not be reported on itsown, although it is still used when calculating ‘sufficient’ activity and can be combined withthe walking question as a measure of total moderate activity.The average time per week spent in each of the activity types (walking, other moderateactivities, vigorous gardening/yardwork, other vigorous activities) can be calculated as thesum of total times reported divided by the relevant number in the sample. This number canbe calculated in two ways, depending on the desired measure: as the average for the overallpopulation, or as the average for people participating in a particular activity type.Note that vigorous activity time is not doubled when calculating these measures; this is onlyundertaken when calculating time for deriving ‘sufficient’ activity (see section 4.6).
Overall population averageThe average time spent by the overall population in a particular activity is calculated bytaking the sum of the total time spent in the activity and dividing it by the number of peoplereporting valid answers to the questions for that activity type. This includes all peoplereporting activity times of up to 840 minutes (after times greater than 840 minutes have beenrecoded, as specified previously) as well as those reporting no participation in the activity(i.e. number of sessions = 0).People who did not answer the questions relating to a particular activity type are excludedfrom the calculations for that activity, as are those who reported at least one session of theactivity but have no time recorded for it.For example, the population average time spent walking would be calculated as follows:
avgwalk1 = sum(walktime)/(number{0<walktime<=840} + number{walksess=0})where number{criteria} indicates number of people satisfying the criteria.
Average for people reporting participationThe average time for those people who participated in a particular activity type is calculatedby taking the sum of the total time spent in activity and dividing it by the number of peoplereporting a total activity time of up to 840 minutes (after times greater than 840 minuteshave been recoded).People who did not answer the questions relating to a particular activity type are excludedfrom the calculations for that activity. People who did not participate in the activity (numberof sessions = 0) are also excluded, as are those who reported at least one session of theactivity but have no time recorded for it.
14
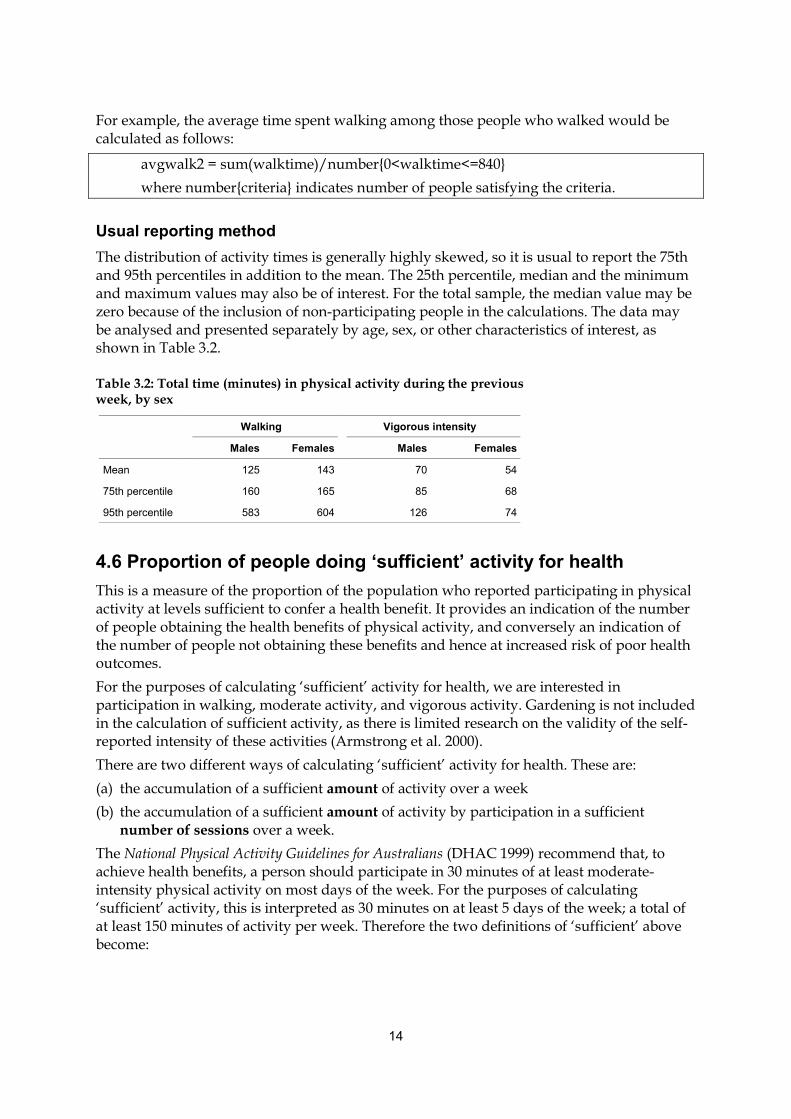
For example, the average time spent walking among those people who walked would becalculated as follows:
avgwalk2 = sum(walktime)/number{0<walktime<=840}where number{criteria} indicates number of people satisfying the criteria.
Usual reporting methodThe distribution of activity times is generally highly skewed, so it is usual to report the 75thand 95th percentiles in addition to the mean. The 25th percentile, median and the minimumand maximum values may also be of interest. For the total sample, the median value may bezero because of the inclusion of non-participating people in the calculations. The data maybe analysed and presented separately by age, sex, or other characteristics of interest, asshown in Table 3.2.
Table 3.2: Total time (minutes) in physical activity during the previousweek, by sex
Walking Vigorous intensity
Males Females Males Females
Mean 125 143 70 54
75th percentile 160 165 85 68
95th percentile 583 604 126 74
4.6 Proportion of people doing ‘sufficient’ activity for healthThis is a measure of the proportion of the population who reported participating in physicalactivity at levels sufficient to confer a health benefit. It provides an indication of the numberof people obtaining the health benefits of physical activity, and conversely an indication ofthe number of people not obtaining these benefits and hence at increased risk of poor healthoutcomes.For the purposes of calculating ‘sufficient’ activity for health, we are interested inparticipation in walking, moderate activity, and vigorous activity. Gardening is not includedin the calculation of sufficient activity, as there is limited research on the validity of the self-reported intensity of these activities (Armstrong et al. 2000).There are two different ways of calculating ‘sufficient’ activity for health. These are:(a) the accumulation of a sufficient amount of activity over a week(b) the accumulation of a sufficient amount of activity by participation in a sufficient
number of sessions over a week.The National Physical Activity Guidelines for Australians (DHAC 1999) recommend that, toachieve health benefits, a person should participate in 30 minutes of at least moderate-intensity physical activity on most days of the week. For the purposes of calculating‘sufficient’ activity, this is interpreted as 30 minutes on at least 5 days of the week; a total ofat least 150 minutes of activity per week. Therefore the two definitions of ‘sufficient’ abovebecome:
15
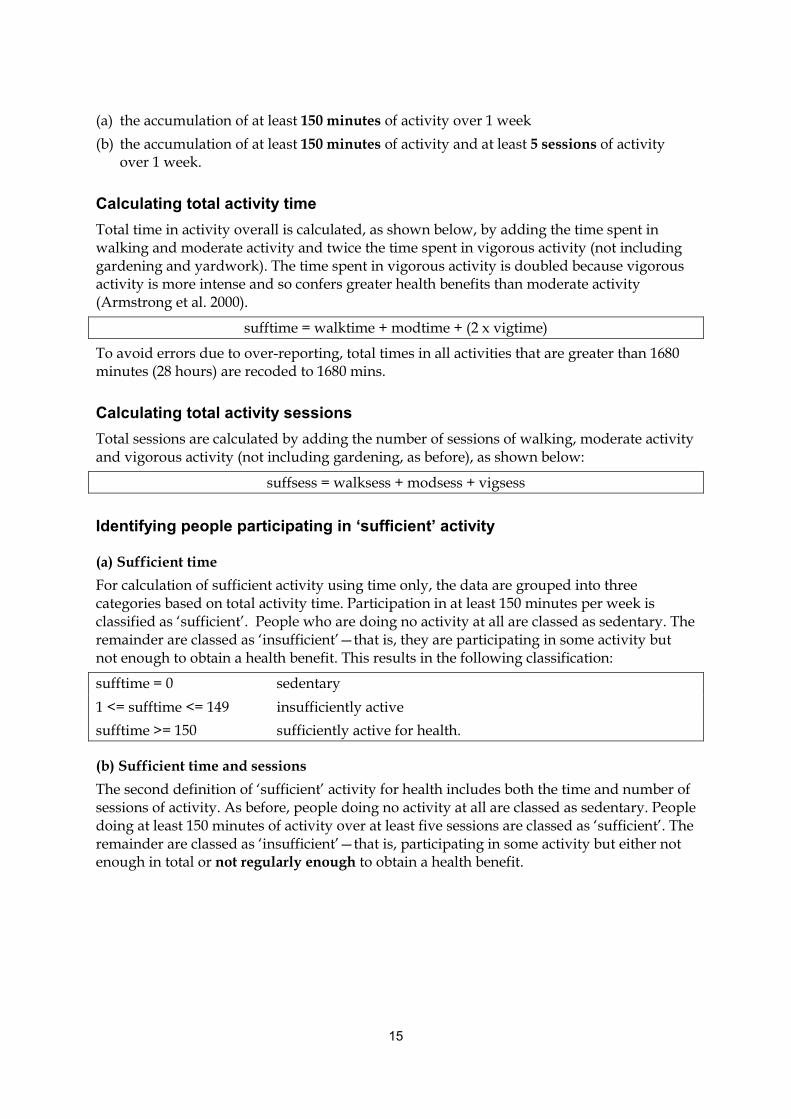
(a) the accumulation of at least 150 minutes of activity over 1 week(b) the accumulation of at least 150 minutes of activity and at least 5 sessions of activity
over 1 week.
Calculating total activity timeTotal time in activity overall is calculated, as shown below, by adding the time spent inwalking and moderate activity and twice the time spent in vigorous activity (not includinggardening and yardwork). The time spent in vigorous activity is doubled because vigorousactivity is more intense and so confers greater health benefits than moderate activity(Armstrong et al. 2000).
sufftime = walktime + modtime + (2 x vigtime)
To avoid errors due to over-reporting, total times in all activities that are greater than 1680minutes (28 hours) are recoded to 1680 mins.
Calculating total activity sessionsTotal sessions are calculated by adding the number of sessions of walking, moderate activityand vigorous activity (not including gardening, as before), as shown below:
suffsess = walksess + modsess + vigsess
Identifying people participating in ‘sufficient’ activity
(a) Sufficient timeFor calculation of sufficient activity using time only, the data are grouped into threecategories based on total activity time. Participation in at least 150 minutes per week isclassified as ‘sufficient’. People who are doing no activity at all are classed as sedentary. Theremainder are classed as ‘insufficient’—that is, they are participating in some activity butnot enough to obtain a health benefit. This results in the following classification:
sufftime = 0 sedentary1 <= sufftime <= 149 insufficiently activesufftime >= 150 sufficiently active for health.
(b) Sufficient time and sessionsThe second definition of ‘sufficient’ activity for health includes both the time and number ofsessions of activity. As before, people doing no activity at all are classed as sedentary. Peopledoing at least 150 minutes of activity over at least five sessions are classed as ‘sufficient’. Theremainder are classed as ‘insufficient’—that is, participating in some activity but either notenough in total or not regularly enough to obtain a health benefit.

16
The data are grouped into three categories as follows:
sufftime = 0 sedentary1 <= sufftime <= 149OR insufficiently activesufftime >= 150 and suffsess < 5sufftime >= 150 and suffsess >= 5 sufficiently active for health
There are some problems with this measure in that it assumes each session is undertaken ona different day. Further, the length of time spent in each session is unknown. Therefore theactivity may not equate to 30 minutes per day over 5 days. However, it is the bestapproximation to the guidelines available using the current survey questions.
Usual reporting methodThese data are usually reported by presenting the proportion of people in each of the threecategories defined above. Alternatively, the proportions of people who are sedentary andinsufficiently active can be combined and presented to show the total number of people whoare not sufficiently active for health. As for the other measures described in this document,the data can be analysed and presented separately by age group, sex, or any othercharacteristics of interest. Tables 3.3 and 3.4 and Figure 3.1 provide examples.
Table 3.3: Percentage of people achieving ‘sufficient’ time during the previousweek, by sex
Sedentary Insufficient ‘Sufficient’*
Sex
Men 15.1 24.8 60.1
Women 15.9 31.6 52.5
Persons 15.4 27.4 57.2
∗ ‘Sufficient’ time is defined as 150 minutes per week, using the sum of walking, moderate activity and vigorousactivity (weighted by two).
Table 3.4: Percentage of people achieving ‘sufficient’ time and sessions during theprevious week, by age group
Sedentary Insufficient ‘Sufficient’*
Age group (years)
18–29 8.7 39.6 51.7
30–44 13.6 42.4 44.0
45–59 19.4 40.2 40.4
60–75 22.1 38.3 39.6
All ages 16.1 40.3 43.6
∗ ‘Sufficient’ time and sessions is defined as 150 minutes (using the sum of walking, moderate activity and vigorousactivity (weighted by two)) and five sessions of activity per week.
}

17
4.7 Proportion of people who were sedentaryThis is a measure of the proportion of the population who reported no leisure-time physicalactivity or walking during the previous week. This gives an indication of the number ofpeople who are at increased risk of poor health because of inactivity.The proportion of people who were sedentary can be obtained from the calculations forsufficient activity described previously. Alternatively, people who were sedentary can beidentified by adding the time spent in walking, moderate and vigorous activities (notincluding gardening and yardwork) as follows:
tottime = walktime + modtime + vigtime
Any person who has tottime = 0 is classified as sedentary.
Usual reporting methodThe proportion of people sedentary is usually presented in a table or graph, grouped by age,sex or other characteristics of interest, similar to the method for reporting proportionundertaking ‘sufficient’ activity.
4.8 Awareness of physical activity messagesThis is a measure of the extent to which people recognise and acknowledge the currentpublic health messages concerning physical activity and health. It indicates the success (orotherwise) of the promotion of physical activity messages in the community.
0
10
20
30
40
50
60
70
80
90
100
18–29 30–44 45–59 60–75 All ages
MenWomen
Figure 3.1: Percentage of people achieving ‘sufficient‘ time during the previous week
Per cent
Age group (years)

18
For each statement, the response variable provides five categories of agreement, and thesecan be considered as they are without modification as numbers or proportions of peoplestrongly agreeing, agreeing, disagreeing, strongly disagreeing, or having no opinion aboutthe statements. However, if a message has been very successful in its uptake by thecommunity, the number of people in the ‘disagree’ and ‘strongly disagree’ categories may beextremely small. Therefore it is usual to group the five agreement categories into two: onefor those who agree or strongly agree with the statement, and the other for those who do notagree or have no opinion. This indicates the number of people who are aware of and acceptthe relevant public health message, which is commonly the most desired information forassessing the impact of promotional efforts. Alternatively, examination of the characteristicsof the group that do not agree with the messages may indicate possible target groups fordifferent or more focused interventions.
Usual reporting methodThe data on awareness of physical activity messages is usually presented in a table, showingthe percentage of people who agree or strongly agree with each statement. As with each ofthe other measures described, the data can be presented by age group, sex or othercharacteristics of interest. Table 3.5 gives an example.
Table 3.5: Percentage of people agreeing (combined ‘strongly agree’ and ‘agree’) with knowledgestatements, by sex
Message 1 Message 2 Message 3 Message 4 Message 5
Sex
Men 84.6 87.7 70.1 71.6 94.6
Women 91.3 93.8 63.8 75.1 96.3
Persons 87.4 89.9 66.4 73.2 95.1
Message 1: Taking the stairs at work or generally being more active for at least 30 minutes each day is enough to improve your health.Message 2: Half an hour of brisk walking on most days is enough to improve your health.Message 3: To improve your health, it is essential for you to do vigorous exercise for at least 20 minutes each time, three times a week.Message 4: Exercise doesn’t have to be done all at one time—blocks of 10 minutes are okay.Message 5: Moderate exercise that increases your heart rate slightly can improve your health.

19
5 Background to the surveyThis section provides an overview of the development of the Active Australia Survey. Thematerial is sourced from a document written to chart the progress of the development ofdata standards for physical activity measurement (AIHW: Dixon T unpublished). Thisprovides some background information about the importance of physical activity, theframework for national data standards, and ways in which physical activity is measured. Italso describes the means by which the questions in the Active Australia Survey weredeveloped.In 1997, the Commonwealth Department of Health and Family Services (now Department ofHealth and Ageing) commissioned the Australian Institute of Health and Welfare (AIHW) todevelop national data standards, methods and definitions for the measurement of physicalactivity and health, with a view to including these in the National Health Data Dictionary(NHDD) and the National Health Information Knowledgebase (now known as theKnowledgebase). This would assist in the collection of uniform, standardised data forphysical activity among Australian adults.To facilitate this project, the Expert Working Group on Physical Activity Measurement (theExpert Group) was established by the AIHW. During the following 2 years, the ExpertGroup reviewed existing physical activity measures, examined the issues surroundingmeasurement of physical activity, undertook related research and consulted widely withvarious interested bodies and experts, both in Australia and overseas, before identifying anumber of data elements (discrete items of information or variables) necessary for physicalactivity measurement. These were:• Physical activity (data concept)• Physical activity—context• Physical activity—duration• Physical activity—frequency• Physical activity—intensity• Physical activity—type• Physical activity—health benefit.The Expert Group considered these elements to be the best available given the evidence andfunding available at the time. In September 1999, the elements were entered with draftstatus into the Knowledgebase, but not into the NHDD. This was because of concerns raisedby the National Health Data Committee that the elements did not capture all the desirableaspects of physical activity, that the questions related to measurement of these elements hadnot been validated, and that some members had not had sufficient time and information toconsider them. There was also a concern that once the data elements were included in thedictionary it could be difficult to alter them should better measures become available.Concurrently, the Expert Group developed the Active Australia Survey as a means ofcollecting data consistent with these elements and evaluating the Active Australia initiative.The Expert Group drew from questions used in the National Heart Foundation Risk FactorPrevalence Survey, the ABS National Health Surveys, and the New South Wales StateHealth Surveys to develop a series of questions, six of which are used to derive a measure ofphysical activity that can be assessed for health benefit. The survey has been used nationally

20
in 1997, 1999 and 2000, and in several state-based surveys. It exhibits good reliability, facevalidity, criterion validity and acceptability.
5.1 Basis for data developmentThis section provides an overview of the importance of physical activity with regard tohealth, describes government initiatives promoting physical activity between 1996 and 2001,and outlines the framework for developing national data standards for measuring physicalactivity.
Why is physical activity important?Physical inactivity is a modifiable behavioural risk factor for coronary heart disease,ischaemic stroke, type 2 diabetes mellitus, colon cancer and breast cancer. Being physicallyactive not only reduces the risk of developing these chronic diseases, but also increasesmusculoskeletal strength, thus decreasing the risk of falls, improves general wellbeing, andreduces symptoms of depression, anxiety and stress (Armstrong et al. 2000). Physicalactivity therefore has a beneficial association with six of the seven National Health PriorityAreas (cardiovascular disease, diabetes, cancer, mental health, arthritis and musculoskeletalhealth, and injury).Physical inactivity accounts for 7% of the total burden of disease in Australia, second only totobacco smoking as a risk factor for ill health (Mathers et al. 1999). It accounts for the highestburden among females. It is estimated that the direct health-care cost attributable to physicalinactivity is around $377 million per year, with $262 million of this due to cardiovasculardiseases (Stephenson et al. 2000). There is also evidence that physical inactivity is associatedwith other risk factors such as overweight and obesity, high blood pressure, and high bloodcholesterol.Physical activity has therefore become an important public health issue, and there has beensubstantial investment in its promotion by the Commonwealth, state and territorygovernments, reflected in the establishment of the Active Australia campaign in 1996 and theNational Physical Activity Guidelines for Australians in 1999.
Active AustraliaLaunched in December 1996 and formally functioning until 2001, Active Australia was anational public health initiative that aimed to promote regular moderate-intensity physicalactivity and to increase participation in sports. It involved a partnership between theDepartment of Health and Family Services, the Australian Sports Commission, state andterritory sport and recreation departments and the National Office of Local Government.Active Australia had three main goals:• to realise and enhance lifelong participation in physical activity• to realise the social, health and economic benefits of participation in physical activity• to develop quality infrastructure, opportunities and services to support participation in
physical activity.A number of media campaigns were produced under the Active Australia brand, includingthe ‘Regularly, not seriously’ tagline in New South Wales, the ‘Rusty’ campaign and othersimilar campaigns targeting older Australians in various states.

21
The National Physical Activity GuidelinesThe National Physical Activity Guidelines for Australians were established in 1999. Theseguidelines outline the level of physical activity considered necessary to achieve a healthbenefit (DHAC 1999). They state that adults should accumulate at least 30 minutes ofmoderate-intensity physical activity on most, preferably all, days of the week. Thiscorresponds to current research, where ‘adequate’ physical activity for health benefit isdefined as the accrual of 150 minutes of moderate-intensity physical activity over 1 week.Research, and the guidelines, also suggest that benefit can result from activity undertaken ina number of short sessions of 10 minutes rather than a single longer session.
National data standardsIn Australia some systems have been developed to facilitate collection of data in a standardand consistent manner. These include the NHDD and the Knowledgebase, maintainedunder the umbrella of the National Health Information Agreement. These, and theirrelationship to the development of data standards for measuring physical activity, aredescribed below. More detailed information can be found on the AIHW web site<http://www.aihw.gov.au>.
The National Health Data DictionaryPublished annually (10th edition in 2001), the NHDD contains definitions of the dataelements (discrete items of information or variables) currently formally approved by theNational Health Information Management Group (NHIMG). Under the National HealthInformation Agreement, the NHDD is the authoritative source of health data definitionsused in Australia where national consistency is required. It is designed to improve thecomparability of data across the health arena. It is also designed to make data collectionactivities more efficient by reducing the duplication of effort in the field and more effectiveby ensuring information to be collected is appropriate to its purpose. Data elements in theNHDD can be revised as new evidence becomes available. This encourages users to reachconsensus around common concepts while further research is undertaken. While adherenceto the NHDD standard data element definitions is not mandatory, it is highly recommendedto ensure consistent and comparable data collection.
The KnowledgebaseThe Knowledgebase (formerly known as the National Health Information Knowledgebase)is an electronically accessible health, community services and housing metadata registrydesigned and created by the AIHW on behalf of the NHIMG. The core of the health sectionof the Knowledgebase is an electronic version of the NHDD. However, the Knowledgebasealso holds information on superseded, retired, abandoned, and draft data elements, whichare not published in the printed NHDD. Details of National Minimum Data Sets, NationalHealth Performance Indicators and the National Health Information Model are alsoavailable in the Knowledgebase.
The National Health Information AgreementThe National Health Information Agreement, in effect from June 1993 between theCommonwealth, state and territory health authorities, the ABS and the AIHW, aims toensure that the collection, analysis and dissemination of national health information isundertaken appropriately and efficiently. A project focusing on cardiovascular disease risk

22
factors was established under the National Health Information Work Program, with theAIHW’s National Centre for Monitoring Cardiovascular Disease as the responsible agency.The aim of this project was the development of standard definitions and a minimum data seton the basis of nationally agreed definitions and standards for all agencies collecting andreporting data on cardiovascular disease risk factors. Subprojects were to be set up for eachspecific risk factor, with those for overweight/obesity, smoking and physical activity to beestablished first. The expected outputs of these subprojects were data item definitions (dataelements) for each of these risk factors. The processes involved were:• a literature search and review of means of assessment of the risk factors, measurement
strategies, definitions, standards and measurement issues• a review of national and international survey techniques and questionnaires• the establishment of expert working groups to assist with the development of
definitions.To facilitate the physical activity project, the Expert Working Group on Physical ActivityMeasurement (the Expert Group) was established by the AIHW. Members of the ExpertGroup included representatives from universities, research centres, government and non-government organisations, some of whom were concurrently involved in the World HealthOrganization project to develop an international physical activity questionnaire (Appendix2).
Terms of reference of the Expert Working Group on Physical ActivityMeasurementUnder the terms of the National Health Information Project, the focus of the Expert Groupwas on physical activity as a risk factor for cardiovascular disease. Their terms of referencewere as follows:• The Expert Group is required to develop standard methods and definitions for
measuring and reporting on the prevalence of physical activity in adults for use inAustralian population surveys and data collections.
• The data elements to be addressed by the Expert Group are adult leisure-time physicalactivity. The Expert Group may be required to develop other data elements for adultleisure-time and adult non-leisure-time physical activity.
• The proposal developed by the Expert Group should conform to the criteria andrecommended formats for input into the NHDD.
• The Expert Group should use a national consultation process to demonstrate consensus.• The proposal should be submitted to the National Health Data Committee by
November 1997 for inclusion in the NHDD by July 1998.

23
5.2 Development of the data standards for physical activity,1997–1999This section provides a brief overview of the various means of measuring physical activity,outlines the rationale behind the Expert Group’s chosen measure (self-report survey) anddescribes the two measures initially developed by the Expert Group. The remainder of thesection follows the continuing development of the preferred measure, including a discussionof the assessment of ‘sufficient’ activity for health, and describes the process of nationalconsultation and submission of the data standards to the National Health Data Committee.
Measurement of physical activityA measure of physical activity is needed to determine the prevalence of physical activity inthe population, to monitor changes over time, and to assess the effect of any interventions.At the time the Expert Group began their work, there were no nationally accepted uniformprocedures for collecting or analysing data on physical activity. Methodologies used wereuncoordinated and incomplete. Standards for data and methodology, and a recognisedmeasurement instrument, were needed to ensure that results from different studies werecomparable, and that trend data were meaningful. The Expert Group believed that, ifpossible, the measurement instrument should:• provide information on how many Australians attain the recommended ‘adequate’ level
of physical activity for health• be suited to both self-administration and telephone interview• be accurate, valid and reproducible• preferably, be short.A number of methods are available to measure physical activity levels (Montoye et al. 1996).These include:• self-report measures• direct behavioural observation• physiological testing• indirect estimates of maximal or submaximal cardiorespiratory oxygen uptake
(e.g. via treadmill or cycle ergonometer tests)• mechanical/electronic devices such as pedometers and motion sensors• activity diaries.There are issues regarding the use of each of these methods in population surveys. Directobservation, physiological testing, treadmill/ergonometer tests and the use of electronicdevices have high-cost, time and acceptability implications in wide-scale application.However they are useful for validating self-report measures. Activity diaries involve a largeamount of time and effort on the part of participants, and there are concerns that the act offilling out such diaries may influence behaviour, therefore providing inaccurate results. Self-report measures, while less accurate than other methods and subject to recall bias, arerelatively inexpensive, acceptable to survey participants, and can be adapted to suit CATItechniques. After considering the issues surrounding each of the above methods, the ExpertGroup decided that self-report measures were the most appropriate for population surveys.
24
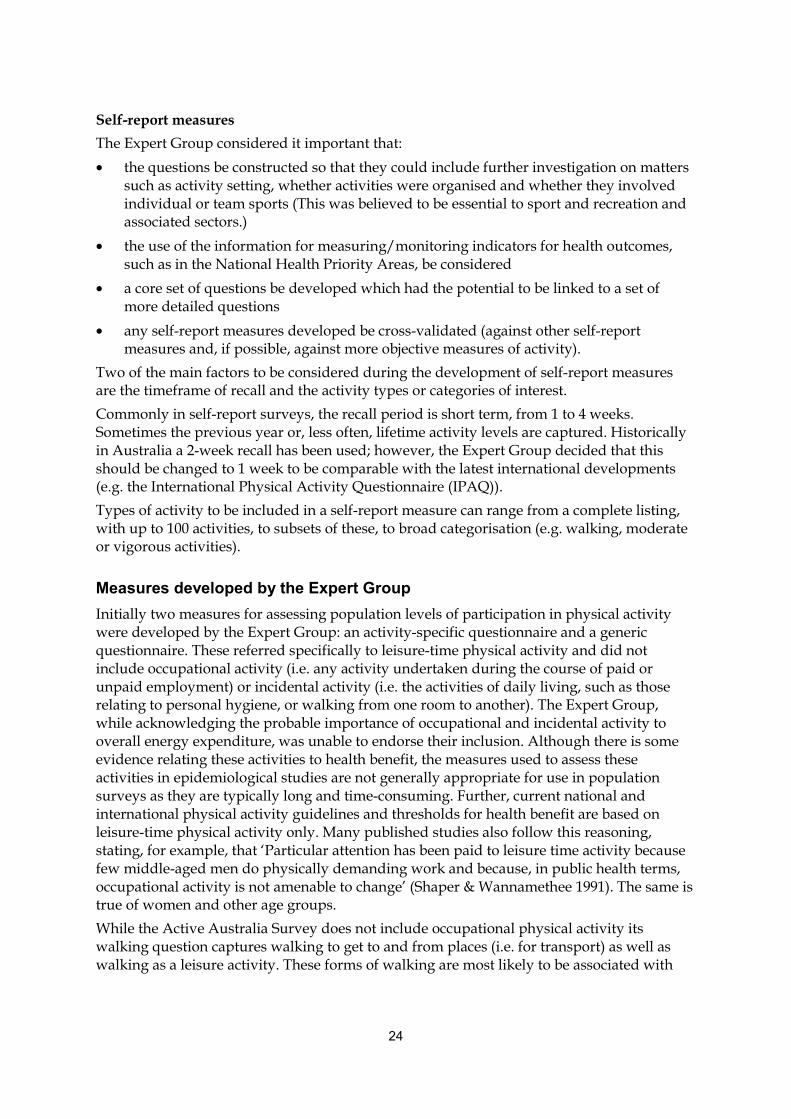
Self-report measuresThe Expert Group considered it important that:• the questions be constructed so that they could include further investigation on matters
such as activity setting, whether activities were organised and whether they involvedindividual or team sports (This was believed to be essential to sport and recreation andassociated sectors.)
• the use of the information for measuring/monitoring indicators for health outcomes,such as in the National Health Priority Areas, be considered
• a core set of questions be developed which had the potential to be linked to a set ofmore detailed questions
• any self-report measures developed be cross-validated (against other self-reportmeasures and, if possible, against more objective measures of activity).
Two of the main factors to be considered during the development of self-report measuresare the timeframe of recall and the activity types or categories of interest.Commonly in self-report surveys, the recall period is short term, from 1 to 4 weeks.Sometimes the previous year or, less often, lifetime activity levels are captured. Historicallyin Australia a 2-week recall has been used; however, the Expert Group decided that thisshould be changed to 1 week to be comparable with the latest international developments(e.g. the International Physical Activity Questionnaire (IPAQ)).Types of activity to be included in a self-report measure can range from a complete listing,with up to 100 activities, to subsets of these, to broad categorisation (e.g. walking, moderateor vigorous activities).
Measures developed by the Expert GroupInitially two measures for assessing population levels of participation in physical activitywere developed by the Expert Group: an activity-specific questionnaire and a genericquestionnaire. These referred specifically to leisure-time physical activity and did notinclude occupational activity (i.e. any activity undertaken during the course of paid orunpaid employment) or incidental activity (i.e. the activities of daily living, such as thoserelating to personal hygiene, or walking from one room to another). The Expert Group,while acknowledging the probable importance of occupational and incidental activity tooverall energy expenditure, was unable to endorse their inclusion. Although there is someevidence relating these activities to health benefit, the measures used to assess theseactivities in epidemiological studies are not generally appropriate for use in populationsurveys as they are typically long and time-consuming. Further, current national andinternational physical activity guidelines and thresholds for health benefit are based onleisure-time physical activity only. Many published studies also follow this reasoning,stating, for example, that ‘Particular attention has been paid to leisure time activity becausefew middle-aged men do physically demanding work and because, in public health terms,occupational activity is not amenable to change’ (Shaper & Wannamethee 1991). The same istrue of women and other age groups.While the Active Australia Survey does not include occupational physical activity itswalking question captures walking to get to and from places (i.e. for transport) as well aswalking as a leisure activity. These forms of walking are most likely to be associated with
25
health benefits, while walking at work in most cases is unlikely to be of sufficient intensityor duration to influence health.
Activity-specific questionnaireThe activity-specific questionnaire captured (during the previous week):• frequency, duration and self-rated intensity of walking• type, frequency and duration of three most common vigorous activities• type, frequency and duration of three most common moderate activities• frequency, duration and self-rated intensity of household chores• frequency, duration and self-rated intensity of gardening or yardwork.For each activity type, it was decided to measure total time spent over the week rather thantime per session of activity. The Expert Group felt that this had the advantages of decreasingrecall bias, reducing arithmetical errors and increasing international comparability of thedata. Household chores and gardening/yardwork were included as separate questionsbecause their contribution to physical activity for health benefit is unclear and it wastherefore thought better to separate them from other activities.The questionnaire was similar to that used in the 1990–91 Pilot Survey of the Fitness ofAustralians (PSFA). Part of that survey captured frequency, duration and intensity of allsport and recreational activities performed over the previous 2 weeks. Re-analysis of thesedata by members of the Expert Group showed that there was little difference in prevalencerates across numbers of activities when counting three activities or more, but a significantdrop in prevalence occurred when only two activities were counted. Therefore, the ExpertGroup’s questionnaire was designed to capture a person’s three ‘most common’ activities.
Generic short-form questionnaireThe generic questionnaire recorded the frequency and duration over the previous week of:• walking• vigorous exercise• household chores• gardening or yardwork• moderate activities.Similarly to the activity-specific questionnaire, duration was recorded as total time in theprevious week, and gardening and household-chore activities were captured separately. Thegeneric questionnaire was very similar to tools being refined at the time in the United Statesand Canada, and in fact the walking component of the questionnaire was later appropriatedfor use in the US Behavioural Risk Factor Surveillance Study (BRFSS). The short form of theIPAQ, which was circulated some months after the Expert Group’s generic questionnairewas developed, proved to be much like the Australian survey.As it is worded, the walking question captures walking as a leisure activity as well aswalking for transport. In this way moderate or brisk-paced walking, which is most likely tobe associated with health benefit, is captured rather than walking at work which in mostcases is unlikely to be of sufficient intensity or duration to influence health, and would besubject to recall bias. Current opinion, along with evidence from two Australian studies (A

26
Hills personal communication; Gunn et al. 2002), suggest that this self-reported walking issufficiently intense to confer health benefit.
Pilot testingBoth questionnaires were tested in a pilot study run through the ABS Population SurveyMonitor in June–July 1997. The generic questionnaire was well received and understood,though there was some confusion about what constituted ‘moderate’ activity. The ABSreported that the questionnaire was easy to administer and elicited meaningful responsesfrom participants. The activity-specific questionnaire was also well received; however,respondents seemed to have some difficulty estimating the intensity of their activities,especially those around the house and yard. Some changes to the ordering of the questionsand the inclusion of examples of activity types in both questionnaires were suggested.Because of the length of the activity-specific questionnaire and the need to produce aninstrument which could be used as a short telephone survey, the Expert Group decided todiscontinue its development and focus only on the generic questionnaire as a populationmeasure for developing data standards.
Validity and reliabilityAn early version of the generic questionnaire (where the same questions were asked butapplied to a 2-week recall period) was used as part of the 1994 and 1996 New South WalesHealth Promotion Surveys. The results were cross-validated against responses to specific-activity questions (from the PSFA) which were asked in the same survey. Reports of thenumber of sessions of moderate and vigorous activity correlated highly with those reportedin the activity-specific questions (r = 0.86 and 0.95, respectively), as did reported total timespent in these activities (r = 0.97 and 0.89, respectively).A reliability study conducted on the final version of the generic questionnaire (the NationalPhysical Activity Questions) found all items had good to excellent reliability, with intraclasscorrelation coefficients from 0.71 to 0.86 and Spearman’s Rho from 0.54 to 0.77 (Bull 2000).In 2001 the Department of Health and Aged Care (now Department of Health and Ageing)funded further research into the psychometric properties of this and other physical activityinstruments. This found that the Active Australia questions exhibited good reliability andacceptable validity (Brown et al. 2002).
Assessment of ‘adequate’ (or ‘sufficient’) activityIt was initially intended that the duration of each activity be multiplied by its MET value*
and individual body mass to produce estimates of weekly energy expenditure (kcal/wk)over and above the energy expended through ‘normal’ living activities. These energyexpenditure estimates would then be used to determine if a person was ‘adequately’ activefor health using a threshold value of 800 kcal/wk, in line with the recommendation of theUS Surgeon General. However, it was noted that this method biases against those of lighterweight; five 30-minute sessions of moderate exercise for a 65 kg person equates to 569 kcal,whereas the same amount of activity for a person weighing 95 kg equates to 831 kcal. In thiscase, the heavier person would be classed as undertaking ‘adequate’ activity, but the lighter
* 1 MET = the resting metabolic rate, equivalent to oxygen uptake of 3.5 mL/kg/hr. For the purposesof this assessment, walking and moderate activities were defined as having an energy expenditurerate equivalent to 3.5 METs and vigorous activities as 9.0 METs.

27
person would not. Therefore, the Expert Group explored the concept of METmins—anestimate of energy expenditure independent of body weight. Calculation of METminsinvolves multiplying the MET value of a particular activity by its duration in minutes overthe week. This means that in the above example both people would have undertaken 525METmins of activity, regardless of their different weights.However, the use of energy expenditure estimates of any form has problems, as they ideallyneed to be adjusted not only for body weight but also for age. This is because an olderperson generally cannot perform activities at the same intensity as a younger person. METsare a function of oxygen uptake and therefore reflect maximal uptake (VO2max). For a 25-year-old, the PSFA estimated VO2max at 43 mL/kg/min. Thus a vigorous activity, estimatedat 9.0 METs, is performed at 73% of VO2max. Compare this with a person aged 70 whoseestimated VO2max is 30 mL/kg/min. To perform a 9.0 MET activity this person would needto sustain an oxygen uptake of 105% of their VO2max—an impossible task. Hence, using avalue of 9.0 METs for vigorous activity for all ages would result in an over-estimate ofenergy expenditure in older people.The Expert Group therefore decided not to rely on estimates of energy expenditure to assesswhether adequate activity was being undertaken, but instead chose to compare the durationof activity to the amount recommended in national and international guidelines. Theevidence-based National Physical Activity Guidelines for Australians (DHAC 1999) suggestthat, to obtain a health benefit, 30 minutes of moderate activity should be undertaken onmost days of the week, and that more vigorous activity will result in greater benefits. Thecriteria for ‘adequate’ physical activity were therefore redefined as accumulating 150minutes (5 x 30 minutes) of moderate activity or 90 minutes of vigorous activity per week.These levels approximate the 800 kcal/wk energy expenditure suggested previously.Further, 90 minutes (or 3 x 30 minutes) of vigorous activity reflected the earlier physicalactivity and health message of the American College of Sports Medicine (ACSM 1975).Because the relationship between physical activity and health appears to be a dose–responsegradient, any particular level of activity is better than a lower level in terms of health benefit.However, these thresholds for ‘adequate’ activity were chosen, based on epidemiologicalevidence, as representing a level associated with a significant reduction in both all-causemortality and the development of and mortality due to diseases such as coronary heartdisease, colon and breast cancers, and type 2 diabetes mellitus.
The data standards—submission to the National Health Data CommitteeThe Expert Group identified a set of data elements relating to physical activity anddeveloped an entry (or definition) for each one for inclusion in the NHDD. These elementsrepresent discrete components which, when combined, completely describe participation inphysical activity. Four draft elements (frequency; duration; intensity; and adequatefrequency, duration and intensity) were first submitted to the National Health DataCommittee (NHDC) in May 1999. The NHDC were generally pleased with the elements andsuggested some revisions, including the addition of an ‘activity type’ element. The revisedfive elements were resubmitted to the NHDC and circulated for national consultation (seebelow) in July 1999. Some further revisions were made, notably the removal of householdchores as an activity type of interest. This was due to a lack of evidence showing that thistype of activity provides a health benefit, and the fact that household chores are notcommonly reported as physical activities in surveys. In addition, the ‘adequate’ element wasrenamed to ‘Physical activity—health benefit’. In September–October 1999 further

28
consideration by the NHDC resulted in the addition of one further element, namely thecontext of activity, and the recommendation that the elements be included as draft dataelements in the National Health Information Knowledgebase. The NHDC were, however,not in agreement that the elements in their current form should be included in the NHDD.
The consultation processIn July 1999, the draft data standards (the elements and proposed questionnaire) werecirculated for comment and endorsement to 172 individuals. They included representativesof the Commonwealth, state and territory governments, non-government organisations,professional bodies and consumer groups, as well as public health researchers,epidemiologists and other relevant individuals (Appendix 3). Forty-one replies werereceived; 21 endorsed the standards, 4 did not, and the remainder did not specifically makea statement regarding endorsement. The concerns of the four respondents who did notendorse the standards were related to:• the apparent lack of evidence for the impact of physical activity on health• the non-inclusion of occupational activity• concerns that endorsement at the time would slow the impetus of further work.In response to the comments received, the Expert Group made a number of changes to thedata elements and survey instrument. These included:• stressing that the data elements and survey questions relate primarily to leisure-time
physical activity• changing the criterion for ‘adequate’ activity for health benefit (now generally referred
to as ‘sufficient activity’) so that it was defined as accumulating a total of150 minutes of activity per week, with the duration calculated by summing the timespent in walking and moderate and vigorous activities, where vigorous activity isweighted by a factor of two to account for its higher intensity
• removing all reference to housework as a type of physical activity to be measured.
5.3 Current status of the proposed data standards
The physical activity questionsThe current version of the Active Australia Survey (see Section 2), proposed in late 1999,incorporates changes made in response to comments from the national consultation process.The survey consists of five statements about physical activity to assess knowledge of publichealth messages, and eight questions capturing the frequency and duration over theprevious week of:• walking, for at least 10 minutes continuously, for recreation, exercise, or transport• vigorous gardening or heavy work around the yard• vigorous physical activities (excluding gardening, yardwork and household chores)• moderate physical activities (excluding walking, gardening, yardwork and household
chores).The questions in this format (with or without additional questions assessing householdactivities) have so far been used in three national surveys (1997, 1999 and 2000) and several
29
state surveys, including Queensland (2001), New South Wales (1996–2001), Victoria (1997),Western Australia (1999) and South Australia (1998, 2001).In 2001, two projects assessing the validity and reliability of the Active Australia questionsand other international measurement instruments were funded by the Department of Healthand Aged Care. The key recommendation of these projects was:
The measurement properties (test-retest reliability, convergent validity and criterionvalidity) of the Active Australia survey are as good as those of any of the surveysassessed in this series of studies. For this reason, and because this survey has been usedin three consecutive population surveys in Australia, it is recommended that this surveybe adopted for continuing population monitoring of physical activity (PA) in Australia.(Brown et al. 2002)
The data elementsThe data elements proposed for physical activity are the data concept of Physical Activity,the five related data elements of context, duration, frequency, intensity and type of physicalactivity, and a derived data element of physical activity—health benefit. These standards aredefined as follows:• Physical activity (data concept): Physical activity may be defined as ‘any bodily
movement produced by skeletal muscles that results in energy expenditure’ (Caspersenet al. 1985). This includes exercise, sport, active recreation, fitness, incidental activity,and active living. The majority of data collected in population surveys refers to leisure-time physical activity since methods to measure other forms of activity are not yet welldeveloped.
• Physical activity—context: The context in which a person participates in physicalactivity (i.e. leisure time or other).
• Physical activity—duration: The length of time spent participating in physical activityas self-reported by an adult person (measured in minutes over a period of1 week).
• Physical activity—frequency: The number of times an adult person self-reportedparticipating in physical activity (over a period of 1 week).
• Physical activity—intensity: The self-perceived and self-reported intensity at which anadult person participated in physical activity (i.e. moderate or vigorous). Moderatephysical activity increases heart rate but does not necessarily make a person puff orpant. Moderate-intensity activities include walking, golf, gentle swimming and socialtennis. Information on walking is included as a moderate activity. Vigorous physicalactivities generally make a person breathe harder or puff and pant and include activitiessuch as jogging, cycling, aerobics, competitive tennis and hockey.
• Physical activity—type: The specific physical activities self-reported by adults(i.e. walking, gardening and yardwork, or other).
• Physical activity—health benefit: Participation in walking and leisure-time physicalactivity of sufficient intensity and duration to confer a health benefit.
The derived data element pertaining to health benefit is denoted as adequate or inadequate(in practice, generally referred to as ‘sufficient’ and ‘insufficient’) after calculating a person’stotal activity level from the duration and intensity definitions. The number of minutes spentin walking, moderate and vigorous leisure-time activities (not including gardening and
30
yardwork) are summed, with vigorous activity being weighted by a factor of two to accountfor its greater intensity. Total leisure-time activity of 150 minutes per week or more isconsidered to be sufficient to obtain health benefit. The extra element measuring frequencycan be used to assess a person’s activity level against the National Physical ActivityGuidelines which recommend activity be undertaken on most days of the week.The data elements are still classified as ‘draft’ in the Knowledgebase. They have not beenentered into the NHDD, because of concerns raised by the NHDC that the elements do notcapture all the desirable aspects of physical activity and that some members had not hadsufficient time and information to consider the proposed elements. They were alsoconcerned that once the data elements were included in the dictionary it could be difficult toalter them should better measures become available. It is, however, possible to makealterations to data elements in the NHDD.These data elements are generic and applicable not just to the Active Australia Survey but tomost of the instruments currently used to measure physical activity both in Australia andaround the world. They would require little or no modification should, for example, theIPAQ or the US BRFSS questions be used to measure population activity levels. During2001–02, the Department of Health and Ageing worked with other interested parties,including the Computer Assisted Telephone Interview Health Surveys Technical ReferenceGroup (CATI-TRG), to revise and eventually resubmit the physical activity data elements forinclusion in the NHDD.

31
Appendix 1: Example of CATI survey codingAn extract from the methods and coding manual used in the 1999 National Physical ActivitySurvey is included in this section as an example of the implementation of the ActiveAustralia Survey in a CATI setting.

32
An extract from:
1999 Physical Activity SurveyNational Physical Activity Survey
Methods, Coding Manual andQuestionnaire
Prepared for theAustralian Institute of Health and Welfare
ByThe Hunter Valley Research FoundationA.C.N. 000 185 393
Downie Street, Maryville, NSW 2293Telephone: (049) 69 4566Facsimile: (049) 61 4981
December 1999The information herein is believed to be reliable and accurate. However, no responsibility or liability for the contents, or
any consequence of its use, will be accepted by The Hunter Valley Research Foundation or the Foundation staff
involved in its preparation
33
Completed interview databases
Notes: A field containing -1 indicates that the question was not asked. This occurred
whenever a question(s) was (were) skipped as part of the questioning process.
Field name: ID
Field type: Numeric
Content: The ID number given to each randomly chosen telephone number. The
ID for each number did not change during the interview process.
Therefore, the ID field can be used to link the response rate database
(AUS99RR.DBF) with the completed interview databases (AUS99.DBF
and NSW99AGE.DBF).
PHONE NO. IS {instruction to interviewer}
Hello, is this ‘phone number’?
Hello, my name is …, I’m calling on behalf of … We are conducting a national study on
physical activity.
[READ FOLLOWING PARAGRAPH IF HELPFUL.]
The research results will be important for the planning of future health and exercise
programs in your local area. Your telephone number has been selected randomly from the
White Pages. A member of your household will be asked to answer a few questions over the
phone.
{Selection of required household member}
WHEN REQUIRED PERSON IS ON PHONE ASK:

34
Hello, are you (RESPONDENT'S NAME)? My name is … I’m calling on behalf of … We are
conducting a national study on physical activity.
The research results will be important for the planning of future health and exercise
programs. All that is involved is answering a few questions over the phone. Your answers
will be kept confidential. We don’t need to know your name and no individuals will be
identified or described in any reports. [If there are any questions you prefer not to answer
just say so.]
The survey should take NO MORE THAN 15 minutes. Can you help us with this study?
[IF YES] Is it OK to talk to you now?
When would be the best time to call back to speak to you?
RECORD ON THE LOG SHEET.
{Additional questions—omitted here}
We would like to ask you about the physical activity you did in the last week:
Question: Q8. IN THE LAST WEEK how many times have you walked
continuously, for at least 10 minutes, for recreation, exercise or to get
to or from places?
Field name: Q8
Field type: Numeric
Content: # number of times
99 = Don’t know—use only as an absolute last resort
If: Q8 = 0, skip to Q12

35
Question: Q9. What do you estimate was the total time that you spent walking in
this way IN THE LAST WEEK? [INTERVIEWER: THIS IS
‘CONTINUOUS’ WALKING]
Field names: Q9M Q9H
Field type: Numeric Numeric
Content: Minutes Hours
77 = Don’t know 777 = Don’t know
If: Q9M < 1 AND Q9H < 1, skip to Q9m
Program check—interview could not proceed without an
answer
Question: Q12. IN THE LAST WEEK how many times did you do any vigorous
gardening or heavy work around the yard, which made you breathe
harder or puff and pant?
Field name: Q12
Field type: Numeric
Content: # number of times
99 = Don’t know—use only as an absolute last resort
If: Q12 = 0, skip to Q14
Question: Q13. What do you estimate was the total time that you spent doing
vigorous gardening or heavy work around the yard IN THE LAST
WEEK?
Field name: Q13M Q13H
Field type: Numeric Numeric
Content: Minutes Hours
77 = Don’t know 777 = Don’t know
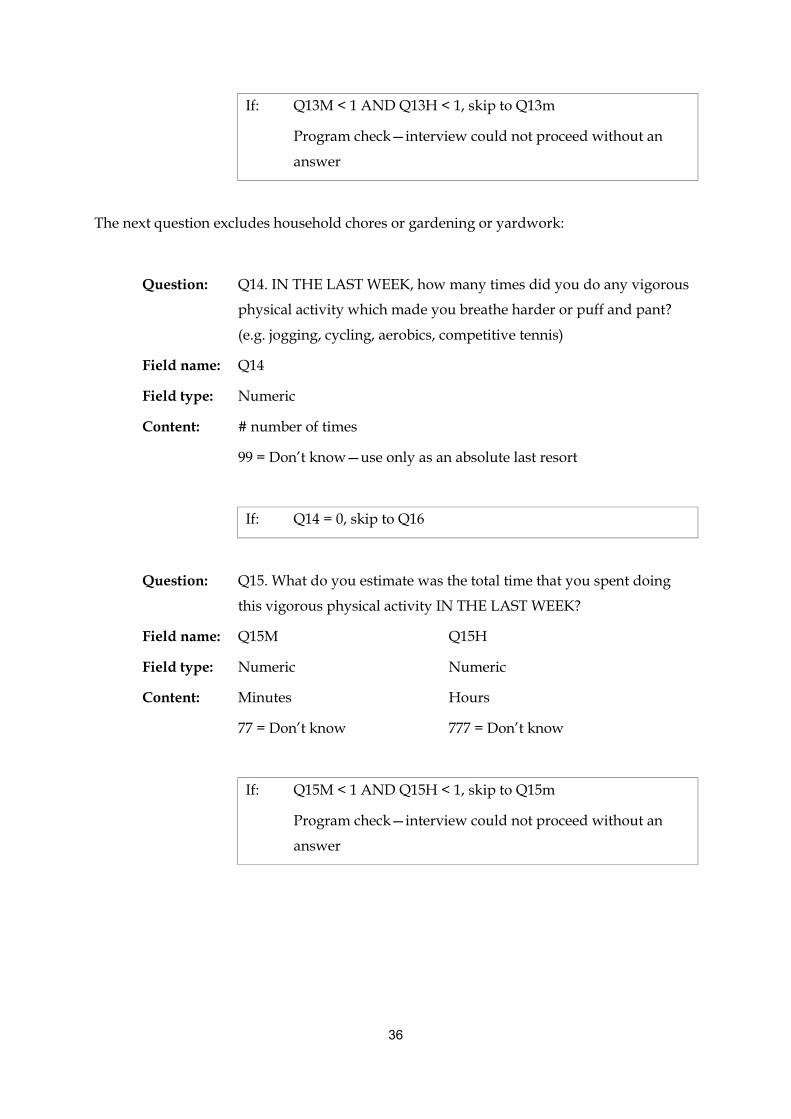
36
If: Q13M < 1 AND Q13H < 1, skip to Q13m
Program check—interview could not proceed without an
answer
The next question excludes household chores or gardening or yardwork:
Question: Q14. IN THE LAST WEEK, how many times did you do any vigorous
physical activity which made you breathe harder or puff and pant?
(e.g. jogging, cycling, aerobics, competitive tennis)
Field name: Q14
Field type: Numeric
Content: # number of times
99 = Don’t know—use only as an absolute last resort
If: Q14 = 0, skip to Q16
Question: Q15. What do you estimate was the total time that you spent doing
this vigorous physical activity IN THE LAST WEEK?
Field name: Q15M Q15H
Field type: Numeric Numeric
Content: Minutes Hours
77 = Don’t know 777 = Don’t know
If: Q15M < 1 AND Q15H < 1, skip to Q15m
Program check—interview could not proceed without an
answer

37
The next question excludes household chores or gardening or yardwork:
Question: Q16. IN THE LAST WEEK how many times did you do any other
more moderate physical activity that you have not already mentioned?
(e.g. gentle swimming, social tennis, golf)
Field name: Q16
Field type: Numeric
Content: # number of times
99 = Don’t know—use only as an absolute last resort
If: Q16 = 0, skip to Q9m
Question: Q17. What do you estimate was the total time that you spent doing
these activities IN THE LAST WEEK?
Field name: Q17M Q17H
Field type: Numeric Numeric
Content: # minutes # hours
77 = Don’t know 777 = Don’t know
If: Q17M < 1 AND Q17H < 1, skip to Q17m
Program check—interview could not proceed without an
answer
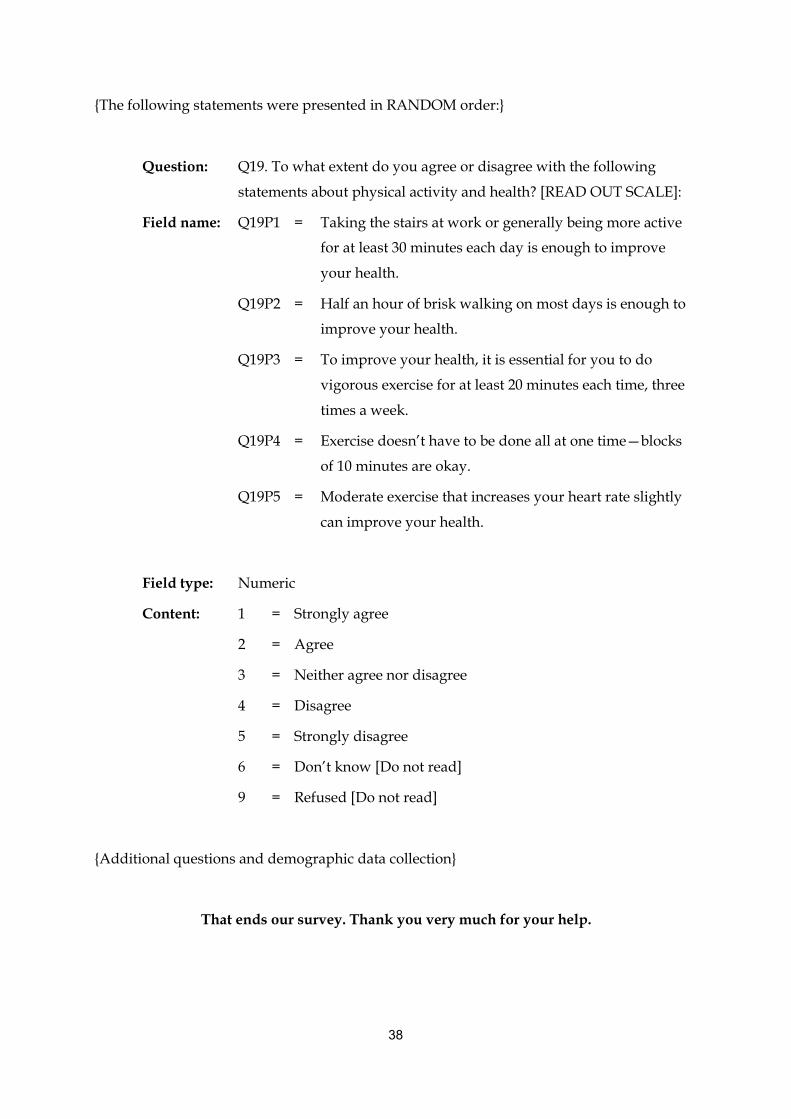
38
{The following statements were presented in RANDOM order:}
Question: Q19. To what extent do you agree or disagree with the following
statements about physical activity and health? [READ OUT SCALE]:
Field name: Q19P1 = Taking the stairs at work or generally being more active
for at least 30 minutes each day is enough to improve
your health.
Q19P2 = Half an hour of brisk walking on most days is enough to
improve your health.
Q19P3 = To improve your health, it is essential for you to do
vigorous exercise for at least 20 minutes each time, three
times a week.
Q19P4 = Exercise doesn’t have to be done all at one time—blocks
of 10 minutes are okay.
Q19P5 = Moderate exercise that increases your heart rate slightly
can improve your health.
Field type: Numeric
Content: 1 = Strongly agree
2 = Agree
3 = Neither agree nor disagree
4 = Disagree
5 = Strongly disagree
6 = Don’t know [Do not read]
9 = Refused [Do not read]
{Additional questions and demographic data collection}
That ends our survey. Thank you very much for your help.

39
Question: [INTERVIEWER: USE THE FOLLOWING FIELD TO DESCRIBE ANY
UNUSUAL ASPECTS OF THIS RESPONDENT OR HIS/HER
ACTIVITIES.]
Field name: QCOM
Field type: Character
Content: Used when the respondent noted issues/characteristics which might
have influenced the survey answers. For example ‘respondent is a
farmer—walks 5 kilometres every day’.
Field name: COMMENTS
Field type: Character
Content: Interviewer comments about the interview
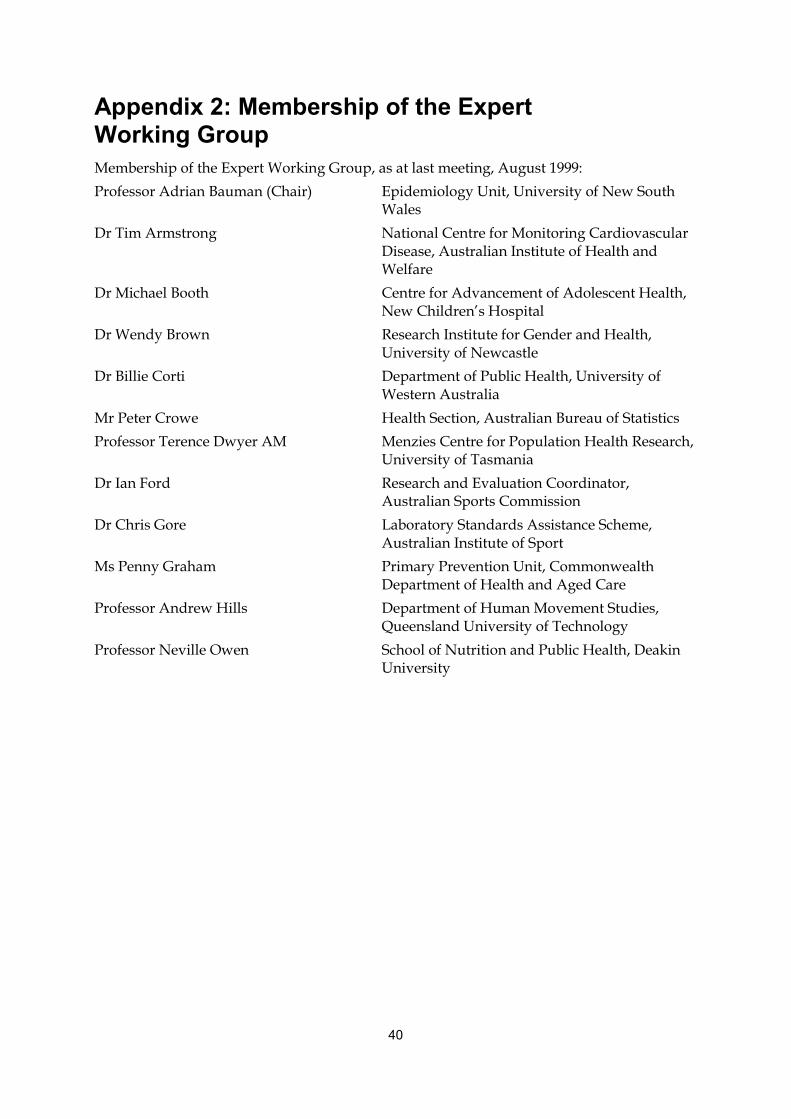
40
Appendix 2: Membership of the ExpertWorking GroupMembership of the Expert Working Group, as at last meeting, August 1999:Professor Adrian Bauman (Chair) Epidemiology Unit, University of New South
WalesDr Tim Armstrong National Centre for Monitoring Cardiovascular
Disease, Australian Institute of Health andWelfare
Dr Michael Booth Centre for Advancement of Adolescent Health,New Children’s Hospital
Dr Wendy Brown Research Institute for Gender and Health,University of Newcastle
Dr Billie Corti Department of Public Health, University ofWestern Australia
Mr Peter Crowe Health Section, Australian Bureau of StatisticsProfessor Terence Dwyer AM Menzies Centre for Population Health Research,
University of TasmaniaDr Ian Ford Research and Evaluation Coordinator,
Australian Sports CommissionDr Chris Gore Laboratory Standards Assistance Scheme,
Australian Institute of SportMs Penny Graham Primary Prevention Unit, Commonwealth
Department of Health and Aged CareProfessor Andrew Hills Department of Human Movement Studies,
Queensland University of TechnologyProfessor Neville Owen School of Nutrition and Public Health, Deakin
University

41
Appendix 3: Parties invited to be part of the nationalconsultation processInput was received from those parties in bold type.Dr Peter Abernethy Department of Human Movement Studies,
University of QueenslandDr Michael Ackland Epidemiology Unit, Public Health Branch (Vic.)Dr Michael Ackland Chair, National CATI-TRGMs Sue Baker-Finch Chief Executive Officer, Australian Division of
General Practice (ACT)Ms Jeanette Baldwin Manager National Diabetes Strategies, Diabetes
AustraliaMr Bill Bellew Director, Health Promotion, NSW Department
of HealthDr David Ben-Tovin Clinical Epidemiology and Health Outcomes
Unit, Flinders Medical CentreMs Colleen Bichel Centre for General Practice Integration Studies,
School of Community Medicine, University ofNew South Wales
Professor Colin Binns School of Public Health, Curtin University ofTechnology
Ms Jo Blunt Education Support Evaluation (Qld)Dr Ron Borland Anti-Cancer Council of VictoriaMs Kelli Brown Top End Division of General PracticeDr Mark Brown Department of Biomedical Science, University of
WollongongMr Doug Browning Weight Management Code Administration
Council of AustraliaDr Fiona Bull Department of Public Health, University of
Western AustraliaMr Ron Burns Confederation of Australian SportProfessor Ian Caterson Human Nutrition Unit, Department of
Biochemistry, University of SydneyProfessor John Catford Director of Public Health, Department of
Human Services (Vic.)Ms Michelle Charlton General Practice Branch, Department of Health
and Aged CareMr Joe Christensen Data Management Unit, Australian Institute of
Health and WelfareDr Glenn Close Western Sydney Area Division of HealthA/Professor Stephen Colagiuri Australian Diabetes Society, Department of
Endocrinology, Prince of Wales HospitalDr John Condon Epidemiology and Statistics Branch, Territory
Health ServicesDr Bill Coote Australian Medical Association
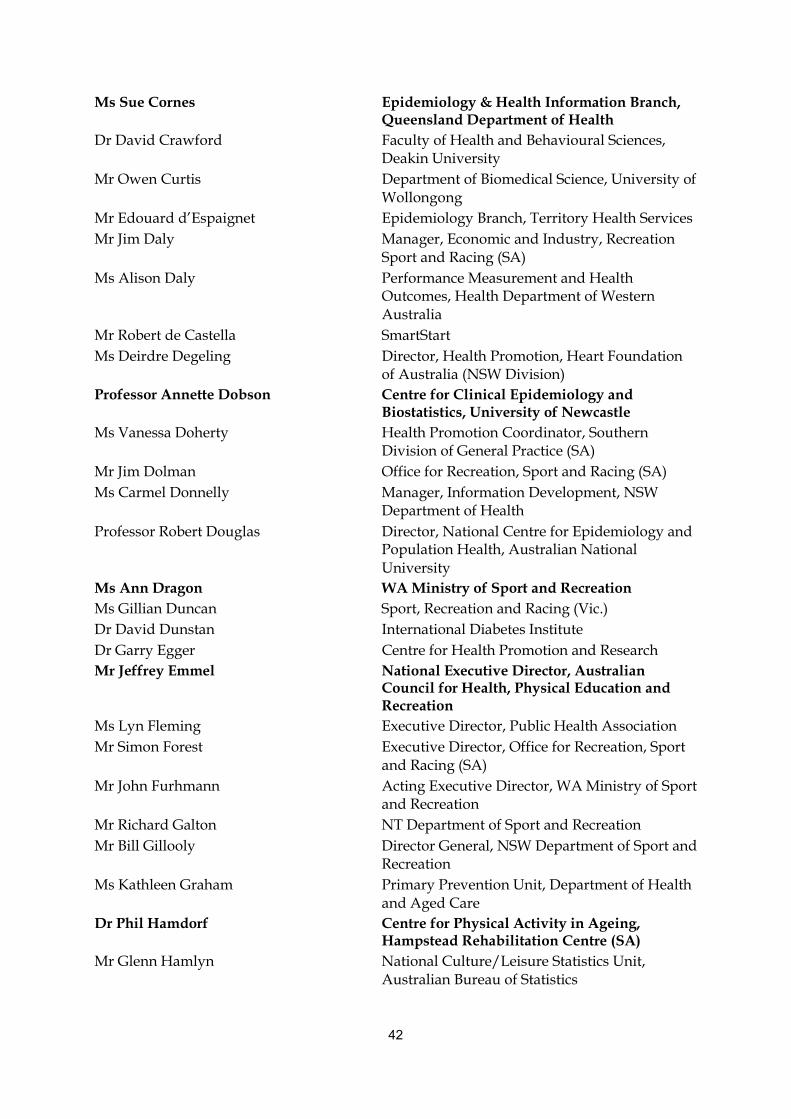
42
Ms Sue Cornes Epidemiology & Health Information Branch,Queensland Department of Health
Dr David Crawford Faculty of Health and Behavioural Sciences,Deakin University
Mr Owen Curtis Department of Biomedical Science, University ofWollongong
Mr Edouard d’Espaignet Epidemiology Branch, Territory Health ServicesMr Jim Daly Manager, Economic and Industry, Recreation
Sport and Racing (SA)Ms Alison Daly Performance Measurement and Health
Outcomes, Health Department of WesternAustralia
Mr Robert de Castella SmartStartMs Deirdre Degeling Director, Health Promotion, Heart Foundation
of Australia (NSW Division)Professor Annette Dobson Centre for Clinical Epidemiology and
Biostatistics, University of NewcastleMs Vanessa Doherty Health Promotion Coordinator, Southern
Division of General Practice (SA)Mr Jim Dolman Office for Recreation, Sport and Racing (SA)Ms Carmel Donnelly Manager, Information Development, NSW
Department of HealthProfessor Robert Douglas Director, National Centre for Epidemiology and
Population Health, Australian NationalUniversity
Ms Ann Dragon WA Ministry of Sport and RecreationMs Gillian Duncan Sport, Recreation and Racing (Vic.)Dr David Dunstan International Diabetes InstituteDr Garry Egger Centre for Health Promotion and ResearchMr Jeffrey Emmel National Executive Director, Australian
Council for Health, Physical Education andRecreation
Ms Lyn Fleming Executive Director, Public Health AssociationMr Simon Forest Executive Director, Office for Recreation, Sport
and Racing (SA)Mr John Furhmann Acting Executive Director, WA Ministry of Sport
and RecreationMr Richard Galton NT Department of Sport and RecreationMr Bill Gillooly Director General, NSW Department of Sport and
RecreationMs Kathleen Graham Primary Prevention Unit, Department of Health
and Aged CareDr Phil Hamdorf Centre for Physical Activity in Ageing,
Hampstead Rehabilitation Centre (SA)Mr Glenn Hamlyn National Culture/Leisure Statistics Unit,
Australian Bureau of Statistics
43
Dr Graeme Hankey Department of Neurology, Royal PerthHospital
Professor Mark Harris Director, General Practice Unit, FairfieldHospital (NSW)
Dr Noel Hayman Inala Community Centre (Qld)Professor Richard Heller Professor of Community Medicine and Clinical
Epidemiology, University of NewcastleMs Michele Herriot Manager Health Promotion Unit, SA
Department of Human ServicesDr David Hill Director Centre for Behavioural Research in
Cancer, Anti-cancer Council of VictoriaA/Professor Michael Hobbs Department of Public Health, University of
Western AustraliaMs Vivienne Hobson Manager Food and Nutrition Unit, Territory
Health ServicesMr Arnold Puggy Hunter Chairperson, National Aboriginal Community
Controlled Health OrganisationDr Konrad Jamrozik Department of Public Health, University of
Western AustraliaMs Jenny Jeffreson Director, General Practice Branch, Department
of Health and Aged CareDr Louisa Jorm NSW Department of HealthMs Wilawan Kanjanapan Commonwealth Department of Health and
Aged CareMr Terry Kearney Chairman, Recreation Council of AustraliaMr Ross Kennedy Executive Director, Sport, Recreation and
Racing (Vic.)Mr Ian Kett Executive Director, VICFITMr Arthur Konstad Office for Recreation, Sport and Racing (SA)Dr Steve Larkin Chief Executive Officer, National Aboriginal
Community Controlled Health OrganisationA/Professor Christina Lee Women’s Health Australia, University of
NewcastleProfessor Stephen Leeder Department of Community Medicine,
Westmead HospitalMs Eva Leslie Research Coordinator, Physical and Health
Program, School of Health Sciences, DeakinUniversity
Ms Jeanette Lewis Manager, Information and Statistics,Department of Community and Health Services
Ms Ceciclia Lim Bikesouth, SA Department of TransportDr John Litt Department of Evidence Based Care, Noarlunga
HospitalMs Melanie Little NT Department of Sport and RecreationA/Professor Doune Macdonald Department of Human Movement Studies,
University of Queensland

44
Dr Geoff Marks Director, Nutrition Program, University ofQueensland
Ms Cristy Massingham NSW Department of Sport and RecreationMr Colin McDougal Course Coordinator, Master of Primary Health
Care, Flinders UniversityMs Robyn Miller Manager Nutrition Program, Health
Department (WA)Ms Kate Moore Executive Director, Consumers’ Health Forum
of AustraliaMs Elizabeth Moss Information Development, Territory Health
ServicesMr Lucio Nacarrella Coordinator, Public Health and Health
Innovation SEPUMr Theo Neumann Ass. Dir. Population Survey Monitor, Australian
Bureau of StatisticsMs Kim Nichols ACT Government Bureau of Sport and
RecreationA/Professor Kevin Norton School of Physical Education, Exercise and
Sports Studies, University of South AustraliaProfessor Don Nutbeam Professor of Public Health, University of SydneyMr John O’Brien Director, Information Management, South
Australian Health CommissionDr Brian Oldenburg School of Public Health, Queensland University
of TechnologyMs Henny Oldenhove Director, Participation Division, Australian
Sports CommissionDr Timothy Olds Human Bioenergetics Laboratory, University of
New South WalesMr Mark Owens General Manager, ACT Government Bureau of
Sport and RecreationMr Robbie Parker Chairperson, Fitness AustraliaProf Hedley Peach Department of Health and Community
Medicine, The University of MelbourneMs Michelle Peuch Public Health Officer, NSW Health
DepartmentDr Louis Pilotto Clinical Epidemiology and Health Outcomes
Unit, The Queen Elizabeth HospitalDr Gayle Pollard Senior Analyst, Epidemiology Services,
Queensland Health (CATI representative)Ms Jenny Purtell Heart Foundation of Australia, Kings Meadow
Community Health Centre (Tas.)Mrs Yvonne Rate Australian Sports CommissionMs Marelle Rawson Director, Health Statistics Section, Australian
Bureau of StatisticsMs Myree Rawsthorne ACT Department of Health and Community
Care
45
Ms Angela Reddy Head, Health Priorities and Outcomes Section,Department of Health and Family Services
Mr Matthew Reid Chief Executive Officer, Sports MedicineAustralia
Dr Ian Ring Epidemiology and Prevention Unit,Queensland Department of Health
Dr Lyn Roberts Health Development and Delivery, HeartFoundation of Australia
Dr David Roder Director Epidemiology Branch, South AustralianHealth Commission
Ms Fidelma Rogers Director, Primary Prevention Section,Department of Health and Aged Care
Professor Ari Rotem Director, Centre for Public Health, University ofNew South Wales
Dr Lori Rubenstein Department of Human Services (Tas.)Ms Trish Ryan Data Management Unit, Australian Institute of
Health and WelfareDr David Scrimgeour Menzies Centre for Health Research (NT)Ms Jane Seberry Physical Activity Coordinator, Heart
Foundation of Australia (NSW Division)Mr Tony Sedgewick Head, Institute for Fitness Research and
Training (SA)Dr Bruce Shadbolt Director Epidemiology and Population Health,
Department of Health and Community Care(ACT)
Ms Noella Sheerin GP Support Officer, Heart Foundation ofAustralia (NSW Division)
Mr Tony Sheppard NSW Police ServiceMr Mike Shetter Office for Recreation, Sport and Racing (SA)Mr Trevor Shilton Heart Foundation of Australia, Western
Australia DivisionMr Colin Sindall Population Health Division, Department of
Health and Aged CareDr Ben Smith Manager, Active Practice Project, Epidemiology
Unit, Liverpool HospitalDr Merran Smith General Manager, Epidemiology Unit, Health
Department (WA)Mr Fred Smith Executive Director, Office of Sport and
Recreation (Qld)Dr Simon Spedding Royal Australian College of General
PractitionersMr Paul Sproule Director, Office of Sport and Recreation (Tas.)Dr Don Staines Manager, Southern Public Health Unit
Network (Qld)Ms Alison Standen Menzies Centre for Population Health Research,
University of Tasmania

46
Mr Gary Starr Centre for Population Studies andEpidemiology, C/- Department of HumanServices (SA)
Ms Kate Steinbeck Metabolism and Obesity Clinic (NSW)Prof Len Storlien Dean of Faculty of Health and Behavioural
Science, University of WollongongMr Alan Sutherland Health Promotion Policy Officer, Department
of Health and Human Services (Tas.)Mr Martin Sweeney Medical Education Coordinator, RACGPMr Martin Sweeney VICFITMs Susan Tabak Physical Activity Manager, Department of
Human Services (Vic.)Ms Anne Taylor Manager, SERCIS, Epidemiology Branch,
Department of Human Services (SA)Ms Jenny Thomas Assistant Secretary, Health Service Outcomes
Branch, Department of Health and FamilyServices (ACT)
Dr Neil Thompson Director Epidemiology Branch, HealthDepartment (WA)
Professor Andrew Tonkin Director Health, Medical and Scientific Affairs,National Heart Foundation
Mr Martin Turnbull Manager Health Enhancement, Department ofHuman Services (Vic.)
Ms Loretta Vaughan Epidemiology Section, Department of HumanServices (Vic.)
Mr Phillip Vita A/Manager Sun Exposure, Nutrition andPhysical Activity, NSW Department of Health
Professor Mark Wahlqvist Monash Medical CentreDr Melanie Wakefield Epidemiology Branch, South Australian Health
CommissionMr Peter Wallace Chief Executive Officer, National Heart
FoundationDr Peter Wan Head, Epidemiology Unit, Department of
Health and Human Services (Tas.)Ms Nicole Watson Epidemiology Section, Department of Human
Services (Vic.)Dr Karen Webb Senior Lecturer in Public Health Nutrition,
Department of Public Health and CommunityMedicine, Westmead Hospital
Ms Char Weeks Office of the Secretary-General, RoyalAustralian College of General Practitioners
Mr Mark Williams Senior Project Officer, SA Department ofHuman Services
Ms Margaret Williamson Manager, Health Survey Program, NSWDepartment of Health
Ms Shirley Willis Australian Sports Commission
47
Dr David Wilson Head of Centre for Population Studies andEpidemiology, C/- Department of HumanServices (SA)
Dr Robert Withers Reader in Exercise Physiology, School ofEducation, Flinders University
Ms Elizabeth Woods Office of Sport and Recreation (Qld)Dr Tony Worsley Professor of Community Medicine, University
of AdelaideMs Sue Wragge Office of Sport and Recreation (Tas.)Ms Cheryl Wright National Physical Activity Program Director,
Heart FoundationProfessor Paul Zimmet International Diabetes InstituteHealth Promotion Foundation of Western AustraliaHealth Promotion Foundation of the Australian Capital TerritoryHealth Promotion Foundation of South AustraliaHealth Promotion Foundation of Victoria

48
BibliographyAIHW (Australian Institute of Health and Welfare): Dixon T unpublished. The ActiveAustralia physical activity questions—a history of the development of questions and relateddata elements for measuring physical activity in Australian adults, 1997–2000. Canberra:AIHW.AIHW (Australian Institute of Health and Welfare) forthcoming. Australia’s health riskfactor update.Ainsworth AE, Haskell WL, Whitt MC, et al. 2000. Compendium of physical activities: anupdate of activity codes and MET intensities. Medicine and Science in Sports and Exercise32(9 Suppl): S498–S504.ACSM (American College of Sports Medicine) 1975. Guidelines for graded exercise testingand exercise prescription. Philadelphia: Lea & Febiger.Armstrong T, Bauman A & Davies J 2000. Physical activity patterns of Australian adults.Results of the 1999 national physical activity survey. Canberra: Australian Institute of Healthand Welfare.ASC (Australian Sports Commission) 1998. Active Australia National Physical ActivitySurvey 1997. Canberra: ASC.Bauman A, Ford I & Armstrong T 2001. Trends in population levels of reported physicalactivity in Australia 1997, 1999 and 2000. Canberra: Australian Sports Commission.Booth M, Owen N, Bauman A & Gore C 1996. Relationship between a 14-day recall measureof leisure-time physical activity and a submaximal test of physical work capacity in apopulation sample of Australian adults. Research Quarterly for Exercise and Sport 67(2):221–227.Booth M, Owen N, Bauman A & Gore C 1995. Active and inactive Australians—assessingand understanding levels of physical activity. Canberra: Department of the Environment,Sports and Territories.Brown W, Bauman A, Timperio A, Salmon J & Trost S 2002. Measurement of adult physicalactivity: reliability, comparison and validity of self-report surveys for populationsurveillance. Summary and recommendations. Unpublished report to the Department ofHealth and Ageing.Bull FC 2000. The reliability and validity of recall of moderate-intensity physical activity.Unpublished report to DHAC.Caspersen CJ, Powell KE & Christenson GM 1985. Physical activity, exercise, and physicalfitness: definitions and distinctions for health-related research. Public Health Reports100:126–31.DASET (Department of the Arts, Sport, the Environment and Territories) 1992. Pilot surveyof the fitness of Australians. Canberra: Australian Government Publishing Service.DHAC (Department of Health and Aged Care) 1999. National physical activity guidelines forAustralians. Canberra: DHAC.Gunn SM, Brooks AG, Withers RT, Gore CJ, Owen N, Booth ML & Bauman AE 2002.Determining energy expenditure during some household and garden tasks. Medicine andScience in Sports and Exercise 34(5):895–902.Mathers C, Vos T & Stevenson C 1999. The burden of disease and injury in Australia. AIHWCat. no. PHE 17. Canberra: AIHW.

49
Montoye HJ, Kemper HCG, Saris WHM & Washburn RA 1996. Measuring physical activityand energy expenditure. Champaign IL: Human Kinetics.Shaper AG & Wannamethee G 1991. Physical activity and ischaemic heart disease in middle-aged British men. British Heart Journal 66: 384–94.Stephenson J, Bauman A, Armstrong T, Smith B & Bellew B 2000. The costs of illnessattributable to physical inactivity in Australia: a preliminary study. Canberra:Commonwealth Department of Health and Aged Care and the Australian SportsCommission.USDHHS (United States Department of Health and Human Services) 1996. Physical activityand health: a report of the Surgeon General. Atlanta, GA: US Department of Health andHuman Services, Centers for Disease Control and Prevention, National Center for ChronicDisease Prevention and Health Promotion.